Article

System Thinking Approach toward Reclamation of Regional Water Management under Changing Climate Conditions

by
Ali Sheikhbabaei
1,
Aida Hosseini Baghanam
1,*,
Mahdi Zarghami
1,
Sepideh Pouri
2 and
Elmira Hassanzadeh
3
1
Department of Water Resources Engineering, Faculty of Civil Engineering, University of Tabriz, Tabriz 51666-16471, Iran
2
Department of Architecture and Urban Engineering, Faculty of Civil Engineering, Tabriz 51666-16471, Iran
3
Department of Civil, Geological, and Mining Engineering, Polytechnique Montréal, Montreal, QC H3T 1J4, Canada
*
Author to whom correspondence should be addressed.
Sustainability 2022, 14(15), 9411; https://0-doi-org.brum.beds.ac.uk/10.3390/su14159411
Submission received: 3 July 2022 / Revised: 26 July 2022 / Accepted: 27 July 2022 / Published: 1 August 2022

Abstract

:
This paper represents a streamflow prediction model with the approach of ensemble multi-GCM downscaling and system dynamics (SD) for the Aji-Chay watershed located in northwest Iran. In this study, firstly, the precipitation and temperature projection for the future was assessed according to the climate change impact using a statistical downscaling technique, i.e., Long Ashton Research Station Weather Generator (LARS-WG); secondly, a rainfall-runoff model for future horizons was developed according to artificial neural networks (ANN); finally, an SD model was developed according to plausible reclamation scenarios, i.e., cloud seeding, increasing the irrigation efficiency and reducing agricultural production, controlling policies on groundwater withdrawal as well as environmental awareness, and cultivation to reduce domestic consumption to achieve sustainable development. For downscaling purposes, the outputs of four general circulation models (GCMs) including EC-EARTH, HadGEM2, MIROC5, MPI-ESM from Coupled Model Intercomparison Project 5 (CMIP5) were applied. The results of multi-GCM downscaling indicated an ascending trend of 0.1 °C to +1.3 °C for temperature and a descending trend of 17 to 23% for precipitation by 2040 under representative concentration pathways (RCPs) of 4.5 and 8.5, respectively. Moreover, the results of the SD model revealed that none of the individual reclamation scenarios were impressive on water balance sustainable conditions; instead, the simultaneous implementation of all plausible scenarios managed to meet the requirements of socio-environment aspects as well as sustainability approaches.

1. Introduction

In order to have accurate and integrated water-resource management, detailed and precise models are vital to ensure the optimal allocation of water resources. With advances in communities as well as population growth, meeting the increasing demand for water, considering the limitation of resources, has come to the fore. In recent decades, the water crisis has become a challenging issue in development planning, which most the communities, especially in arid regions, are grappling [1]. Integrated water-resource management (IWRM), given the dynamical nature of the hydrological cycle, is a challenging aspect; nevertheless, climate change imposes additional stress on this issue. Thus, in proper water-resource management studies, both are regarded as inevitable steps to make adequate decisions. The dominant factors including hydrological and climatic factors along with principal physical, social, economic, and political aspects can be taken into consideration in water-resource modeling. To address this issue, policymakers have recommended various approaches with the aim of adoption and mitigation policies in responding to increased water stress, which is drastically on the rise [2,3]. Indeed, an optimal water-allocation system inevitably involves impact prediction to find the best water governance [4].
To assess the future hydrologic condition of a study area, the data of general circulation models (GCMs) seem to be the principal reliable choice available [5]. Considering the large-scale spatial resolution of GCMs, downscaling techniques play a noteworthy role in assessing local-scale future climatological data. Indeed, downscaling techniques are utilized from low-resolution GCMs to achieve high-resolution local data, which are broadly divided into two subcategories (i.e., dynamical and statistical techniques). Dynamical downscaling as a procedure to acquire small-scale climate data over a limited zone, nested within the coarser scale climatic data via a high-resolution regional climate model (RCM), [6]. Dynamical downscaling models require a high level of specialization and calculations that are considered as the constraints of this method, which impedes the vast application of dynamical downscaling models in developing countries. Moreover, statistical downscaling models involve statistical links between coarse-scale predictors and local climate data predictand [7]. Statistical downscaling models are categorized as follows: (i) weather generator types, e.g., Long Ashton Research Station-Weather Generator (LARS-WG), [8]; (ii) linear regression-based models, e.g., statistical downscaling model (SDSM), [9]; (iii) artificial intelligence (AI) models based on nonlinear regression, e.g., artificial neural network (ANN) [10]. Since the preliminary goal of the current research is to apply LARS-WG for climate projection, the technical review of downscaling models is focused on LARS-WG. Numerous studies have been devoted to climate projections using the LARS-WG model, due to its ability in simulating mean and severe climate parameters on a basin scale. The authors of [11] used various statistical downscaling methods (i.e., ANN, SDSM and LARS-WG) to assess the impact of climate change in northwest Iran. Their results indicated a descending trend in precipitation for future horizons. In [12], the authors applied a LARS-WG model for assessing the impact of climate change in Peninsular, Malaysia. Their study revealed that the region would experience an ascending and descending trend for temperature and precipitation predictands, respectively.
According to the aforementioned points, to have a proper IWRM, it is necessary to develop simultaneous insight into hydrological models impacted by climate change. In this regard, various studies developed rainfall-runoff models, owing to the impact of climate change on precipitation over the study area [13,14,15]. Among various rainfall-runoff models, black-box models such as ANN-based modeling has been widely used by hydrologists [16,17].
Since climate change alters the spatiotemporal distribution of water availability around the world, climate change adaptation studies found prim importance in IWRM [18]. More specifically, with an insight into an IWRM system considered, it is highly needed to assess the water adequacy in a basin and see whether or not there is any water deficit in the basin. It is then required to figure out the cause of water imbalance with a supply–demand approach. This framework should comprise a holistic vision toward the watershed, where both dynamics aspects, as well as explicit feedback of influential factors, are considered in a water balance system. In this regard, system dynamics (SD), because of its dynamical nature in assessing multi-alternative management strategies over time, has been extensively used in IWRM approaches [19]. The SD is primarily developed to model and analyze large-scale socio-economic systems to facilitate the perception of interactions between various interconnected sub-systems [19]. In [20], the authors developed an SD model to take advantage of various management scenarios in the Zayandeh-Rud river basin. The results of their study revealed that the sustainable solution for proper water-resource management was not merely based on the diversification of the trans-basin supply, having not abstracted from groundwater resources and expanding capacity for water reservations aspects, but even on the framework of specific approaches to demand management as well as controlling the population. In [21], they simulated Urmia lake’s water level using SD. Their findings manifested that climate change as well as excessive utilization of surface water resources had the highest rate of influence on a descending trend of lake levels up to 65% impact, and dam construction and rainfall plunge affected up to 25% and 10%, respectively. In [22], they compared the impact of restoration scenarios using an SD model under climate change on Urmia Lake. The results demonstrated that by increasing irrigation productivity, changing the crop pattern, and decreasing the cultivation area policies, the lake’s ecological level could be restored. In [23], the authors analyzed various water-supply scenarios for Shiraz metropolitan by utilizing SD with an emphasis on the city’s interior water recourses. They concluded that the region could respond to water demands by executing a water treatment plan instead of water transfer from outside resources. Additionally, they manifested that water deficits are highly affected by irrigation efficiency. The authors of [24] utilized an SD model for a Water–Energy–Food nexus simulation by quantifying the reclamation policies on the Urmia Lake, Iran. The sets of applied criteria encompassed irrigation productivity, interbasin transfer of water, cultivation pattern modification, and reclamation of portions of the lake by focusing on natural resources and socio-economic aspects. Given their findings, Urmia Lake’s ecological level is significantly dropped by climate change impacts. The authors of [25] applied a prey–predator approach, having benefited from SD over Urmia Lake. They claimed that the consumed water for the agriculture sector has the highest impact on descending the ecological level of the lake, and also, the implementation of only an individual scenario could not be beneficial in restoring the lake.
The current study area included the Aji-Chay watershed as the main supplier of Urmia lake’s ecological recharge. In recent decades, the water crisis has drastically threatened the region [14]. On the other hand, given the many factors that affect the status of water resources, proper determination of effective variables to represent an appropriate reflection of the variables and that can also portray the interactions with one another and the water resource is of great demand. Thus, investigating the future water condition under the impact of climate change on the region is of great importance. Hence, in this study, water-balance modeling of this vital sub-basin of Urmia Lake under the impact of climate change was assessed.
Therefore, firstly, by applying LARS-WG, precipitation and temperature projection was obtained for the future over the region. Afterward, a rainfall-runoff model using ANN was developed based on the results of the weather-generator model. Finally, an SD model was proposed as a policymaking approach to achieve optimal and precise water-resource management in the study area owing to the impact of climate change. Generally, in simulating ecosystems, human aspects and/or hydrological processes are being considered separately and climate change impacts are being ignored, or vice versa. Thus, using a holistic attitude toward all these factors, appropriate designs can be proposed to overcome this inefficiency and take suitable actions to provide water security, which is the scope of the current study.
Regarding the fact that no significant studies have been undertaken to focus on the process of integrated water-resource management overshadowed by the supply–demand aspect, a three-step IWRM approach was used in this study to investigate whether the reclamation scenarios under a changing climate coupled with a development plan can meet the response to increasing water demand for a future twenty-year horizon over the study area or not.

2. Methods and Materials

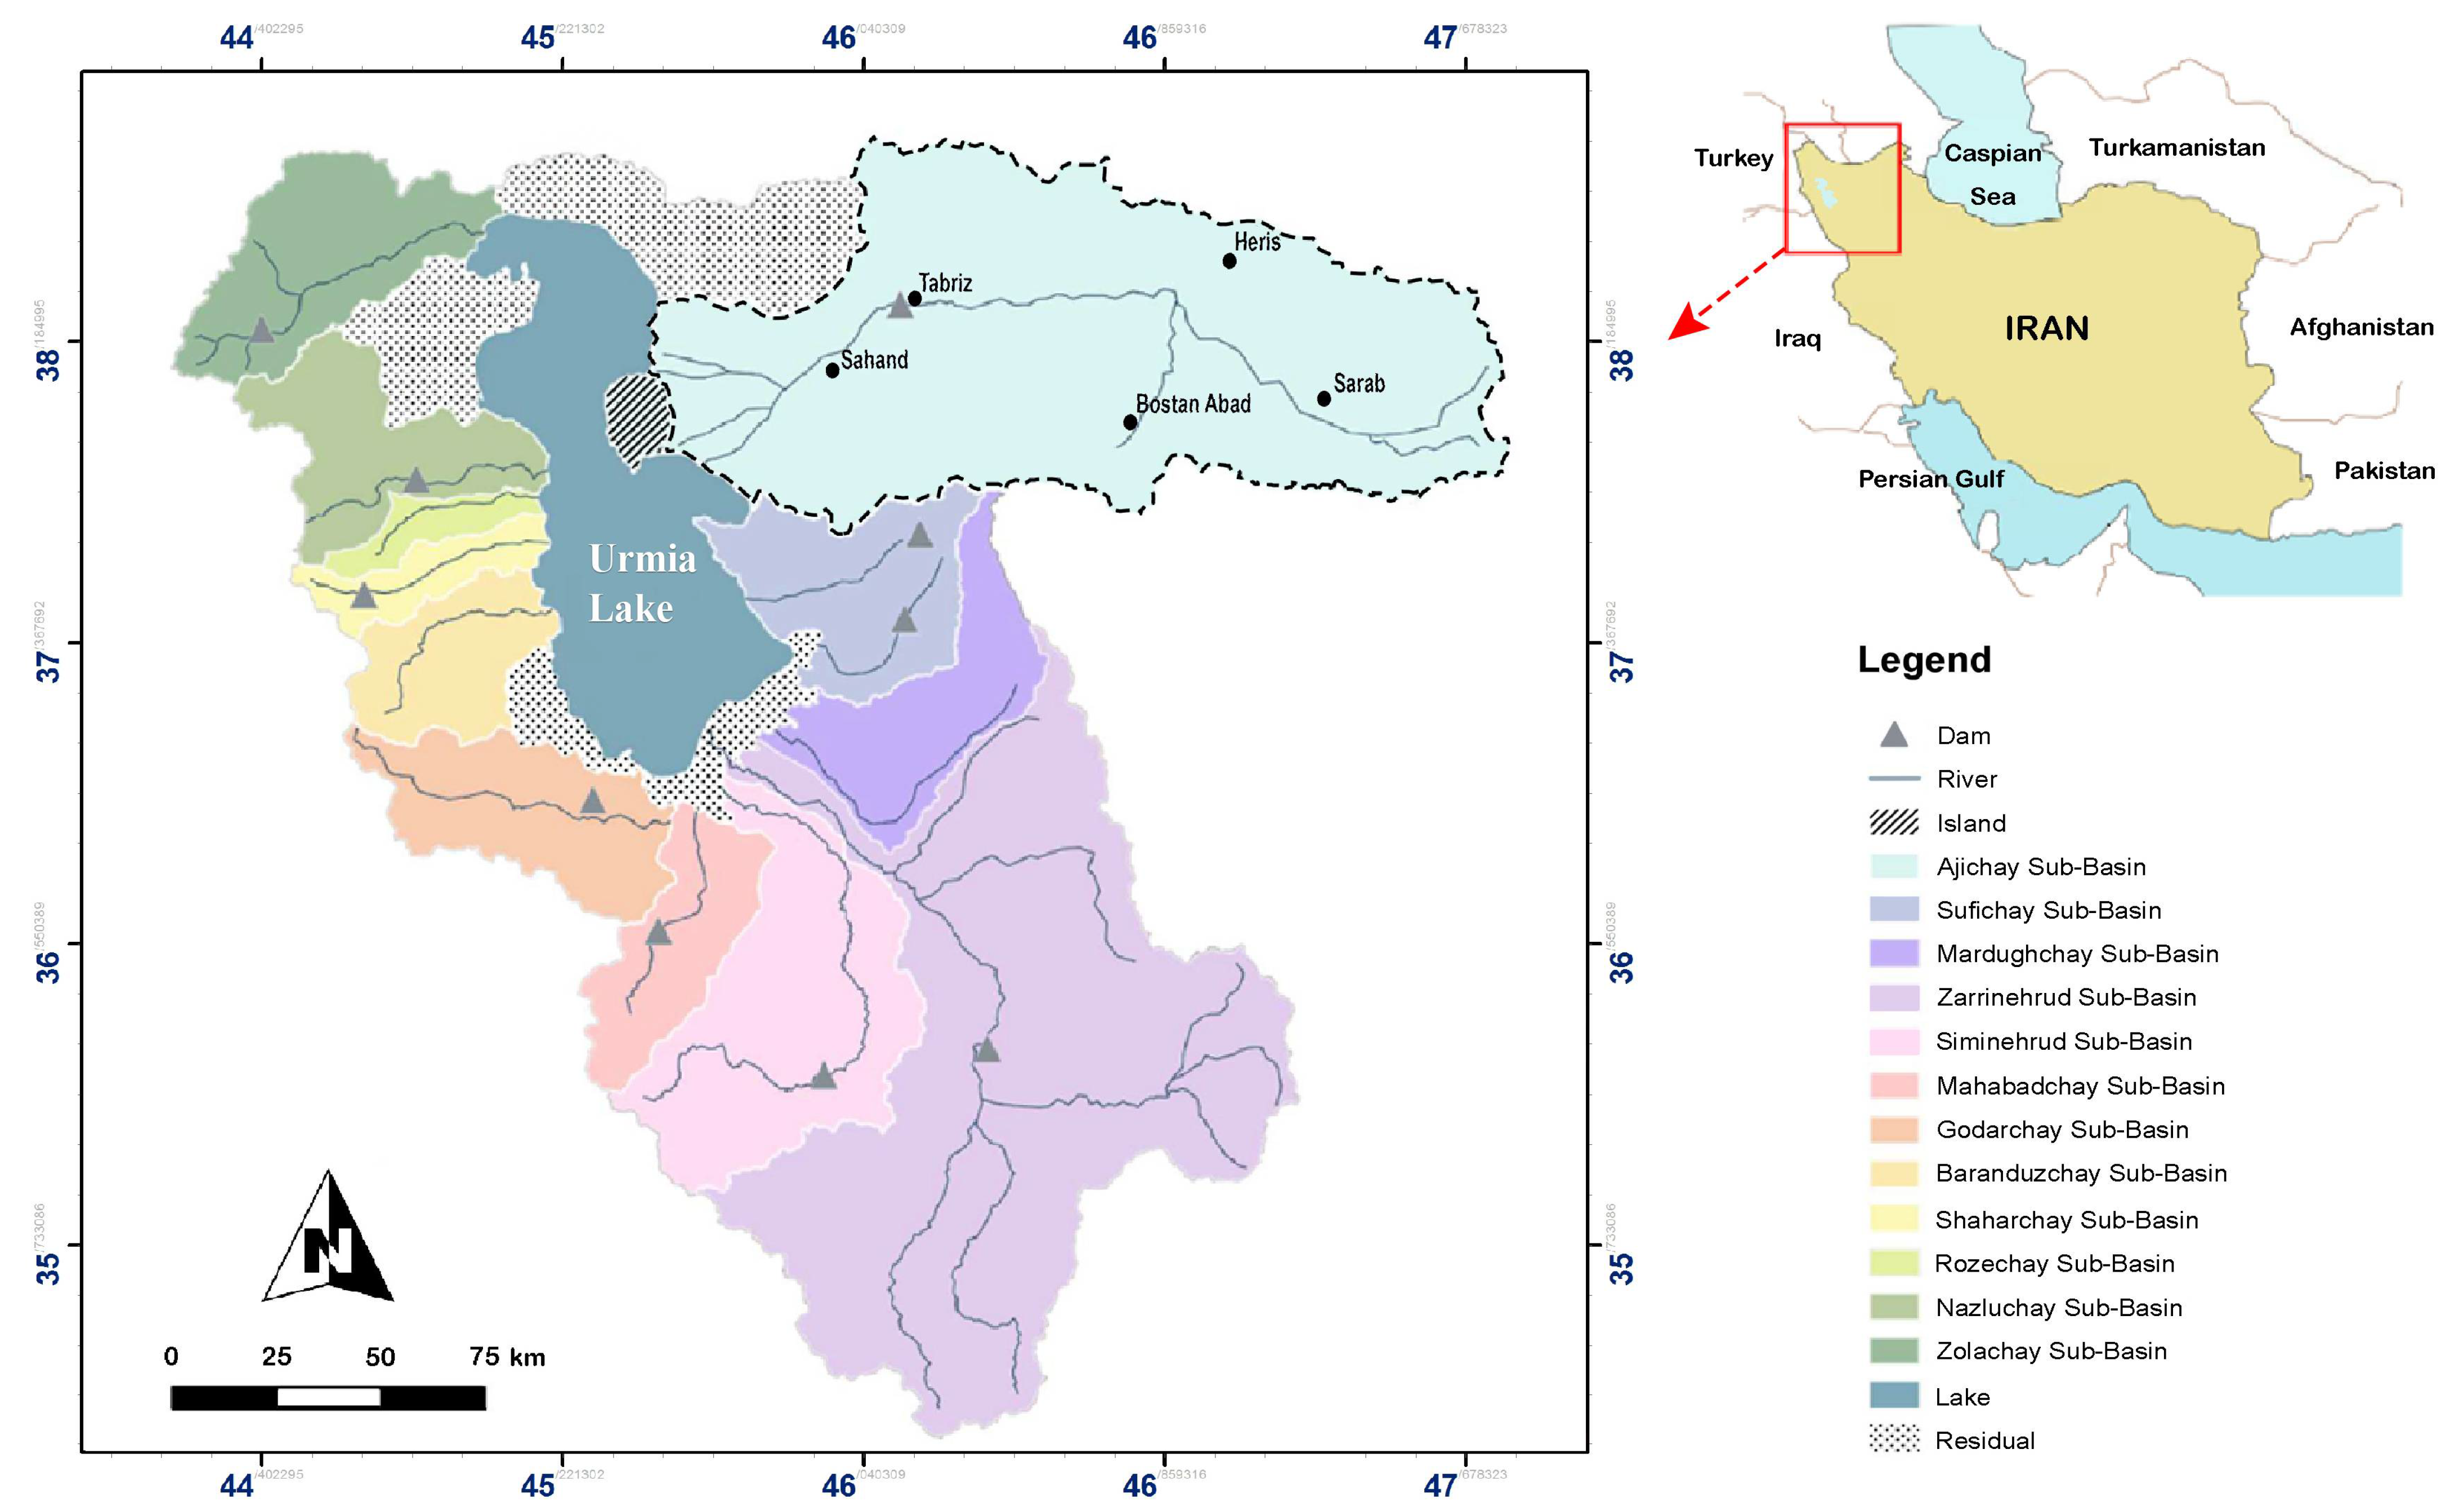
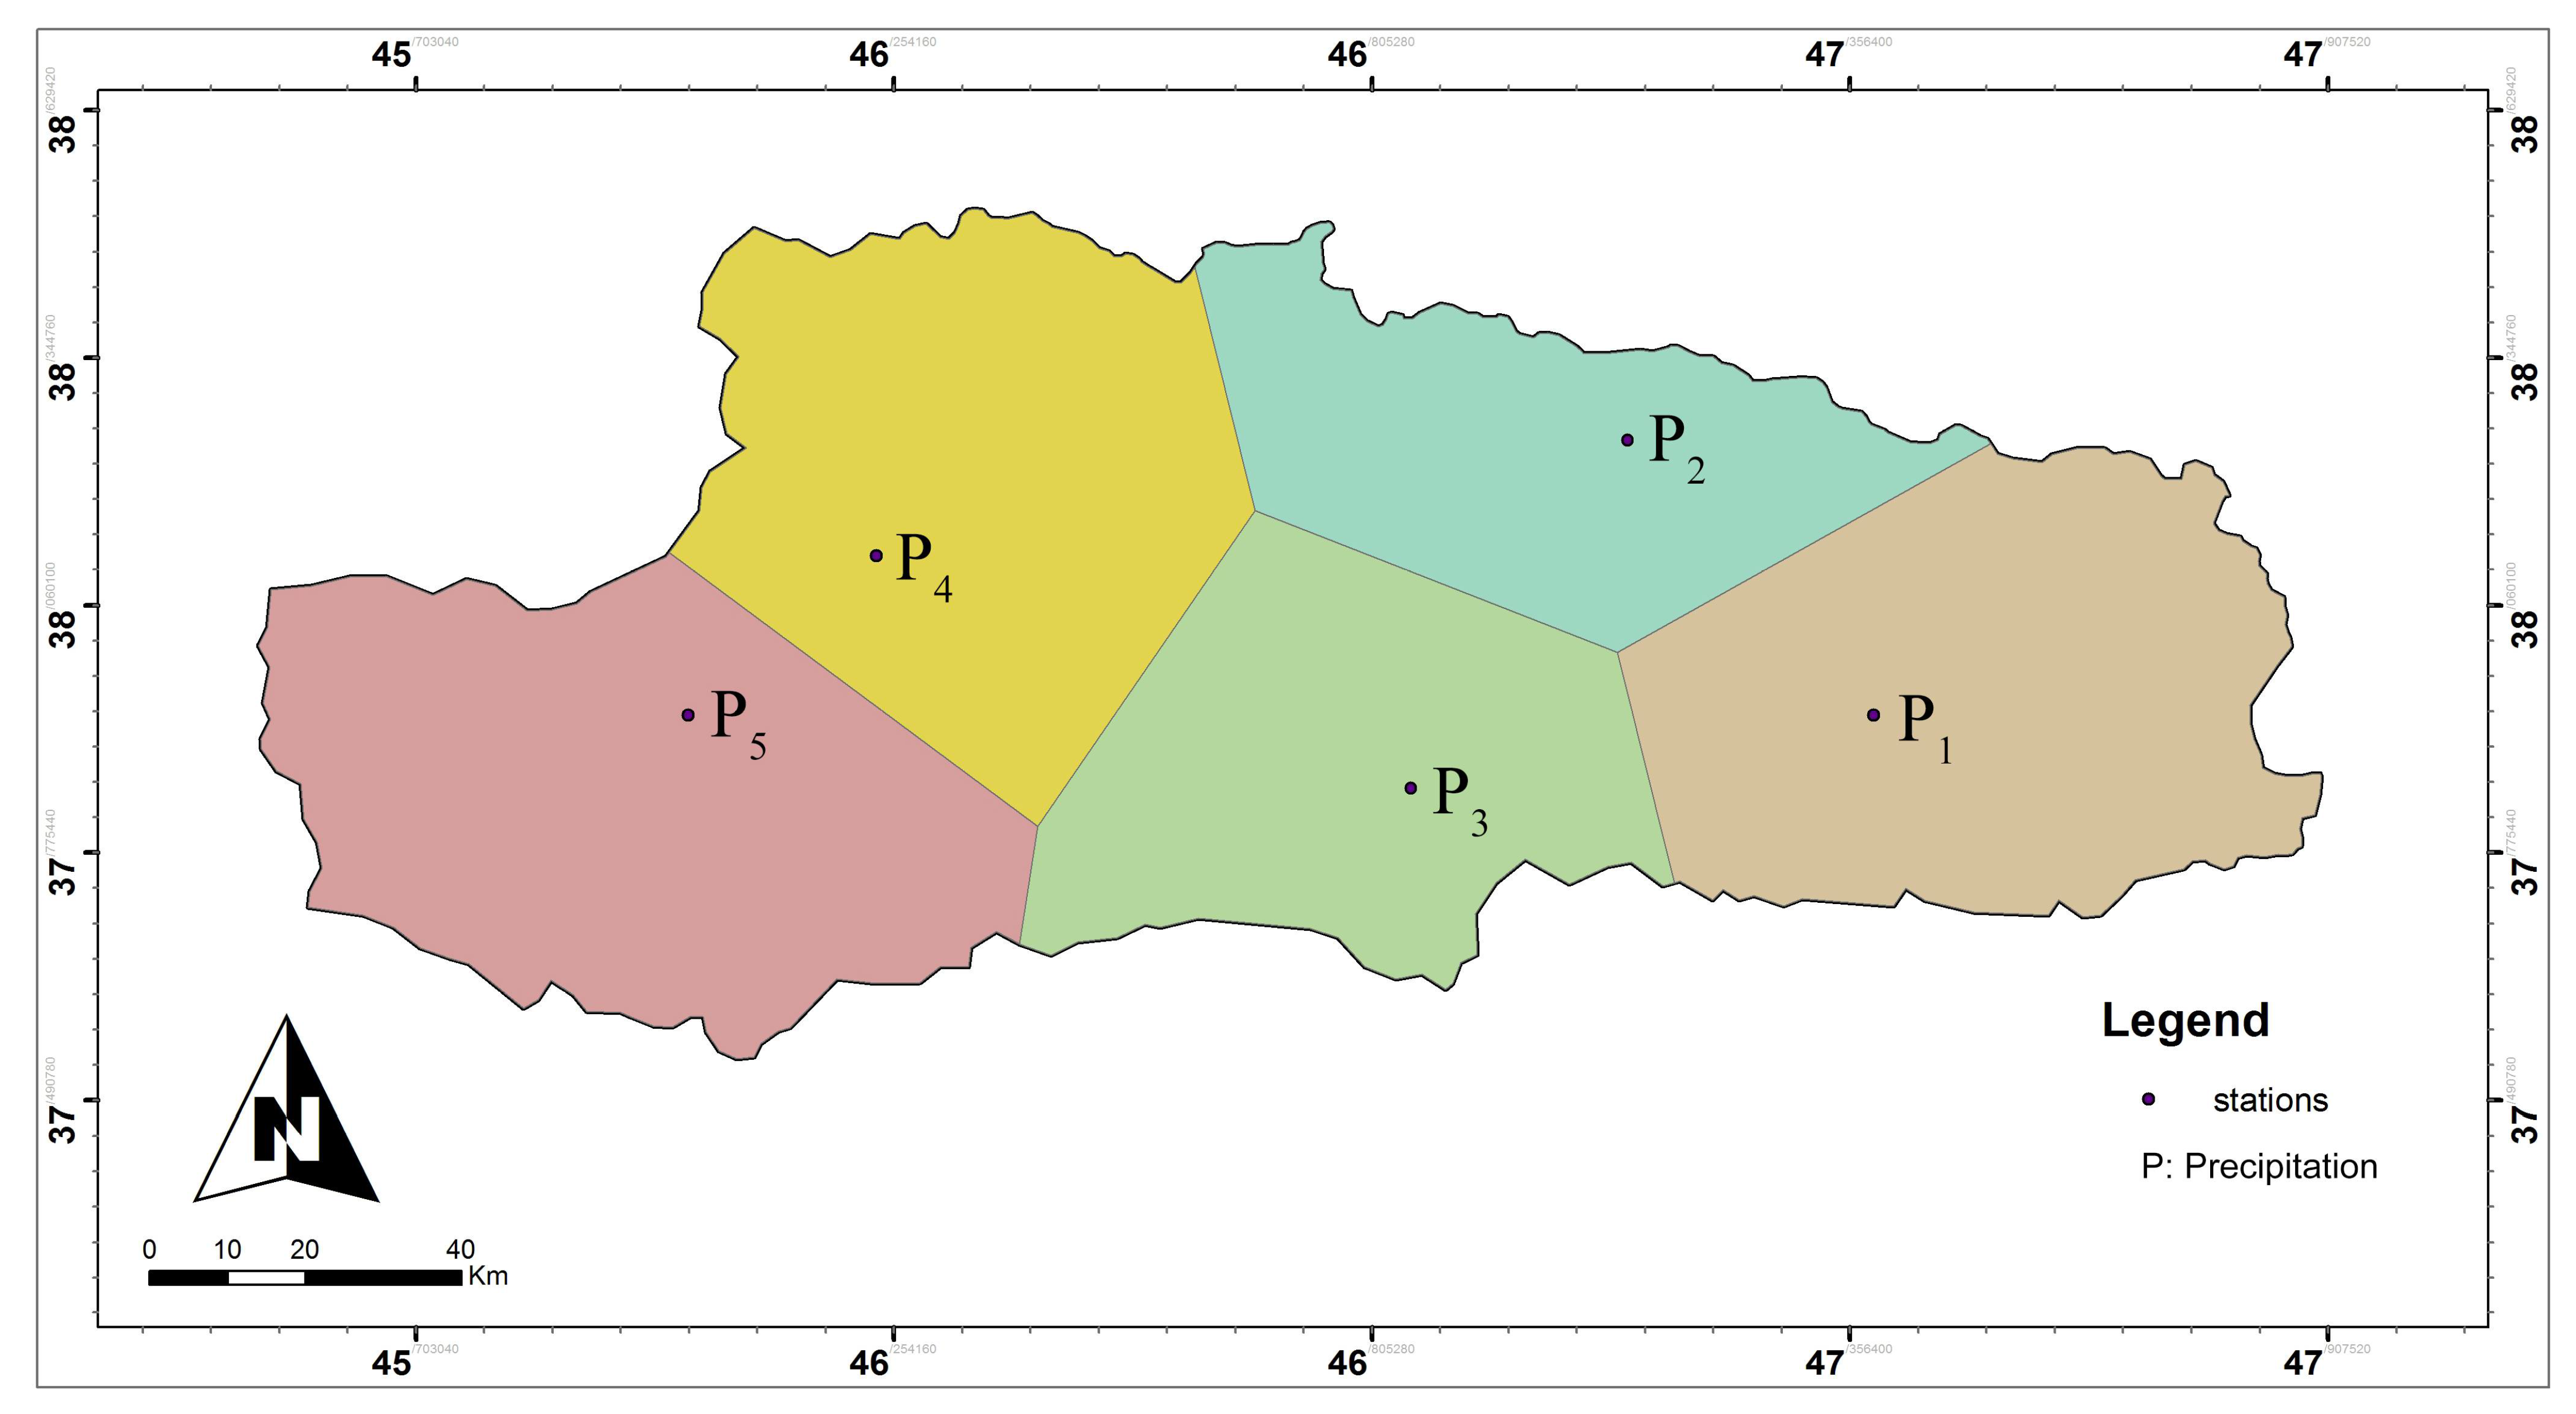
2.1. Study Area and Data

2.1.1. Study Area

The Aji-Chay watershed encompasses a mountainous region in north-western Iran. The study area is situated on latitude 37°4′ to 38°6′ N and longitude 45°5′ to 47°75′ E. The mean temperature and annual precipitation are 12.5 °C and 250 mm, respectively. The Aji-Chay River with a 0.003 slope stretches nearly 276 Km 2 to the Urmia Lake delta, containing 13,853 Km 2 of its basin. Urmia Lake catchment encompasses twelve sub-basins, which are vividly depicted in Figure 1. Tabriz metropolis, as an industrial pole at the heart of the Aji-Chay watershed, as a result of its rapid population growth, now has massive water demands. To overcome the water deficits of both domestic and industrial sectors, a water transfer plan from outside resources with a 180 million cubic meters (MCM) per year potential was implemented, which in its second phase developed into 200 (MCM) per year, by which the water demands of approximately 5 million residents has been met. The water-transfer aspect imposes additional sensitivity on proper water governance over this vital region, which follows disadvantages including water conflicts, dependency, and the incitement of social disputes, which would result in chaotic conditions among provinces. In this regard, meeting future water demands for this vital watershed should be at the forefront of water-sector policymakers’ minds. The region’s water demand is being supplied from resource contributions (e.g., outside resources, runoff, wells, and underground water withdrawal).

2.1.2. Dataset

To evaluate the impacts of climate change, four synoptic stations were picked out to represent the spatial variations of the climate (see Table 1).
Stations’ daily observed data (i.e., precipitation, minimum, and maximum temperatures, solar radiation) were revitalized from the Iran meteorological office (http://www.irimo.ir/, accessed on 1 December 2021) for the period 1961–2019, and daily GCM predictors for the same time interval based on Coupled Model Intercomparison Project 5 (i.e., CMIP5) were retrieved from the Intergovernmental Panel on Climate Change (IPCC) data distribution center for the period 1961–2040 under representative concentration pathways (RCP 4.5 and 8.5) scenarios. Each RCP reveals different emission scenario pathways, according to distinct plausible perspectives regarding probable anthropogenic behavior. RCPs 8.5 and 4.5, respectively, manifest the high and intermediate emission scenarios used in this study.
In addition, to have the future climate condition predicted, periods of 2021–2040, 2041–2060, and 2061–2080 are considered to meet the objectives of climate projection.
The predictors were retrieved from EC-EARTH, HadCM2, MIROC, MPI-ESM, and GCMs presented by research centers in Europe, UK, Japan, and Germany, respectively. The applied GCMs in accordance with their centers’ nomination and resolution have been listed in Table 2. To develop a downscaling model, an ensemble multi-GCM approach was used since prior studies approved the efficacy of applying an ensemble of climate models [6,7,8,9,10,11,12,13,14,15,16,17,18,19,20,21,22,23,24,25,26]. The periods of 1961–2005 and 2021–2040 as the baseline and simulation period were utilized, respectively. Afterward, for rainfall-runoff modeling, the runoff data of hydrometric stations were extracted from Iran’s Ministry of Energy (http://news.moe.gov.ir/, accessed on 1 December 2021). Finally, the required data for the simulation of the SD model such as water consumption rate relevant to various sectors (e.g., agriculture, industrial, domestic, livestock, and green spaces) were achieved from the Iran Water Resources Management Company as well as the national statistics portal of Iran (https://www.amar.org.ir, accessed on 1 December 2021).

2.1.3. Proposed Methodology

This study encompasses three steps. Firstly, statistical downscaling of GCM data using the LARS-WG model benefited from the ensemble multi-GCM approach for future climate projection. Afterward, an ANN framework of rainfall-runoff modeling was developed to link future climate change with surface runoff. Eventually, for the purpose of integrated water-resource management and to gain a profound understanding of the impact of human–environment factors on the water balance, an SD model was employed based on the supply–demand approach. The SD model outcomes would be helpful in taking preventative actions against water bankruptcy for future horizons. The comprehensive procedure of the proposed methodology is depicted in Figure 2. The in-depth illustration of each step is described in the following sub-categories.
  • First Step (Climate Projection)
To assess the climatic fluctuations for the future horizon, the LARS-WG statistical downscaling method was utilized. The most influential predictands in the cycle of hydrology including minimum and maximum temperatures, precipitation, and evaporation were used. Moreover, to overcome the uncertainty and weaknesses of using an individual GCM model, four GCMs (i.e., EC-EARTH, HadGEM2, MIROC5, GFDL, and MPI-ESM) provided strong outputs for the study area [10]. In this step, an ensemble multi-GCMs downscaling approach was utilized. Indeed, the ensemble multi-GCM downscaling approach was utilized to gain a deeper understanding of the data and using the hidden feature of GCM data would result in superior performance [27]. Regarding this, all the NOAA stations within the region (i.e., Tabriz, Sahand, Sarab, Bostan Abad, and Heris) have been used for this purpose (see Figure 1). The baseline and validation period was set to 1961–1990 and 1991–2005, respectively.
  • Second Step (ANN-Based Rainfall-Runoff Model)
Secondly, to simulate runoff in future climate change conditions, the downscaled predictands (i.e., precipitation and temperature) of the ensemble multi-GCM model under RCPs 4.5 and 8.5 from step one fed into the ANN to develop a rainfall-runoff model.
For this purpose, the projected predictands (i.e., temperature and precipitation) were imposed as input variables to ANN to model runoff. After calibrating the ANN model using predictands (as inputs) and local runoff (as target) data for the baseline, the calibrated models were used to project future runoff under RCPs 4.5 and 8.5 scenarios as inputs of the ANN model. In this way, two steps of runoff with pessimist and median vision to future climate change were achieved. The data were divided into 70–15–15% as the calibration, verification, and cross-validation series, respectively. The three-layer feed-forward neural network with the Levenberg–Marquardt-based backpropagation (BP) algorithm was used to develop the rainfall-runoff model.
  • Third Step (System Dynamic Model)
Finally, to have a comprehensive vision toward the impact of influential factors on the water balance system, and also identifying the dynamic changes through time coupled with the inter-connection between the variables, the SD model was developed. In order to make policies toward the future water conditions, to achieve water security reclamation scenarios, i.e., cloud seeding, increasing irrigation efficiency and reducing agricultural production, controlling policies on groundwater withdrawal as well as environmental awareness, cultivation for reducing domestic consumption, and the simultaneous implementation of scenarios were proposed.

2.2. Materials

2.2.1. LARS-WG

The LARS-WG statistical downscaling model develops a daily timescale synthetic time series of climatic parameters including minimum and maximum temperatures, precipitation, and solar radiation [28]. The standard deviations and means of daily parameter distributions are attained by fitting the Fourier series to the means and standard deviations of the historical evidence. Additionally, to consider the conditioned precipitation, finite Fourier transform of order 3 is utilized to fit wet and dry days. Moreover, to determine the status of predictands (i.e., precipitation and solar radiation), a semi-empirical distribution overshadowed by the lengths of alternate dry and wet sequences was fitted to the historical data [27].

2.2.2. Artificial Neural Networks (ANNs)

ANN is a nonlinear computational methodology composed of various inter-connected layers of processing units (i.e., neurons); data circulate across the network by transforming inputs into output. The neurons manifested the nodes, and synapses describe the linking connections. The synaptic capabilities of signal transmission are overshadowed by the strength of the interactions as regards weighting factors from previous nodes. The essence of the ANN contributed to three layers, namely input, hidden, and output. The input neurons are entered into an activation mechanism after the weighing process. The further the number of layers rise, the more complicated the networks become. Indeed, the topology of the ANN makes them distinctive, as the multi-layer perceptron (MLP) is presumably the most prevalent neural network. The MLP, by benefiting from distributed adaptive weights, creates a fortified linkage among the layers [28].
The ANN structure is presented as Equation (1):
y ^ k ˙ = f 0 [ j = 1 M N ω k j · f h ( i = 1 N N ω j i x i + ω j 0 ) + ω k 0 ]  
where i , j , and k reveal the neurons of layers (i.e., input, hidden, and output), respectively. The weight contributed to the hidden layer is demonstrated by ω j i , which links the input layer’s i th neuron to the hidden layer’s j th neuron; ω k j and f h are the bias for the j th hidden neuron and activation function related to the hidden neuron, respectively. Furthermore, the weight in the output layer is represented as ω k j , which links the input layer i th neuron to the hidden layer j th neuron; the bias for the kth output neuron indicated by ω k 0 and also, f 0 manifests the output neuron’s activation function.
Additionally, x i and y ^ k ˙ denote the i th input data and evaluated outputs, respectively. N N and M N represent the neuron numbers dependent on input and hidden layers.

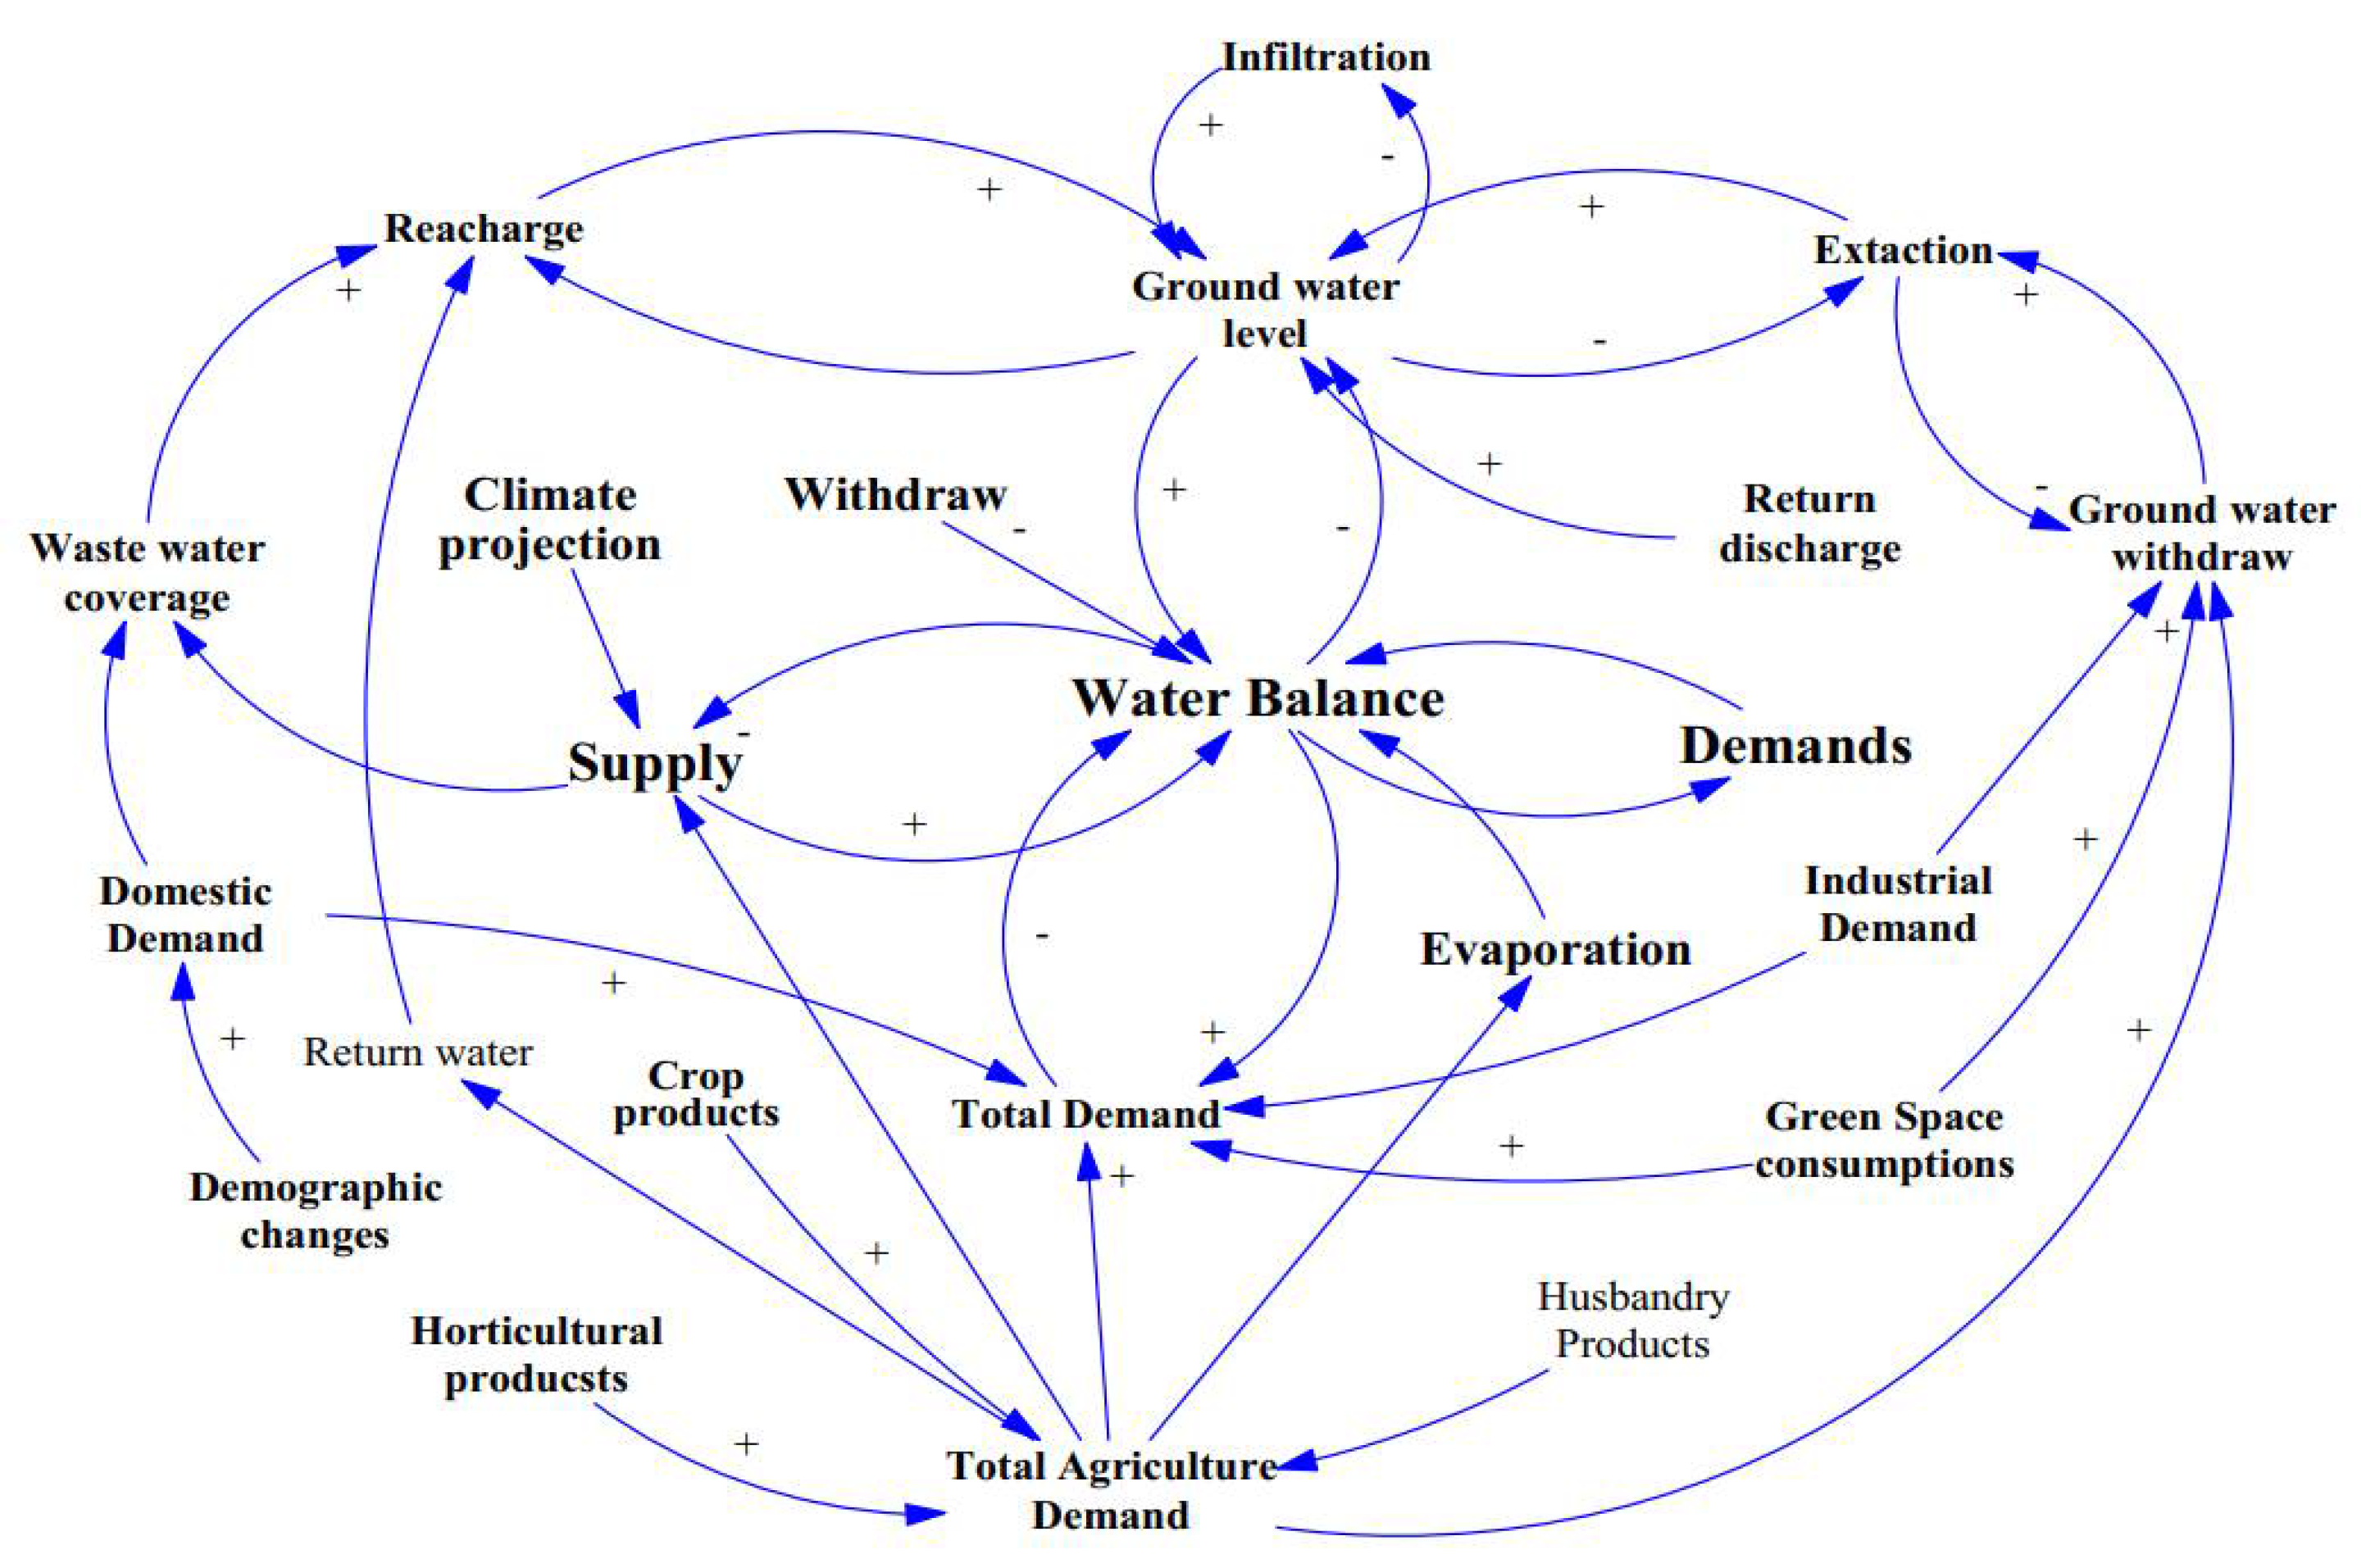
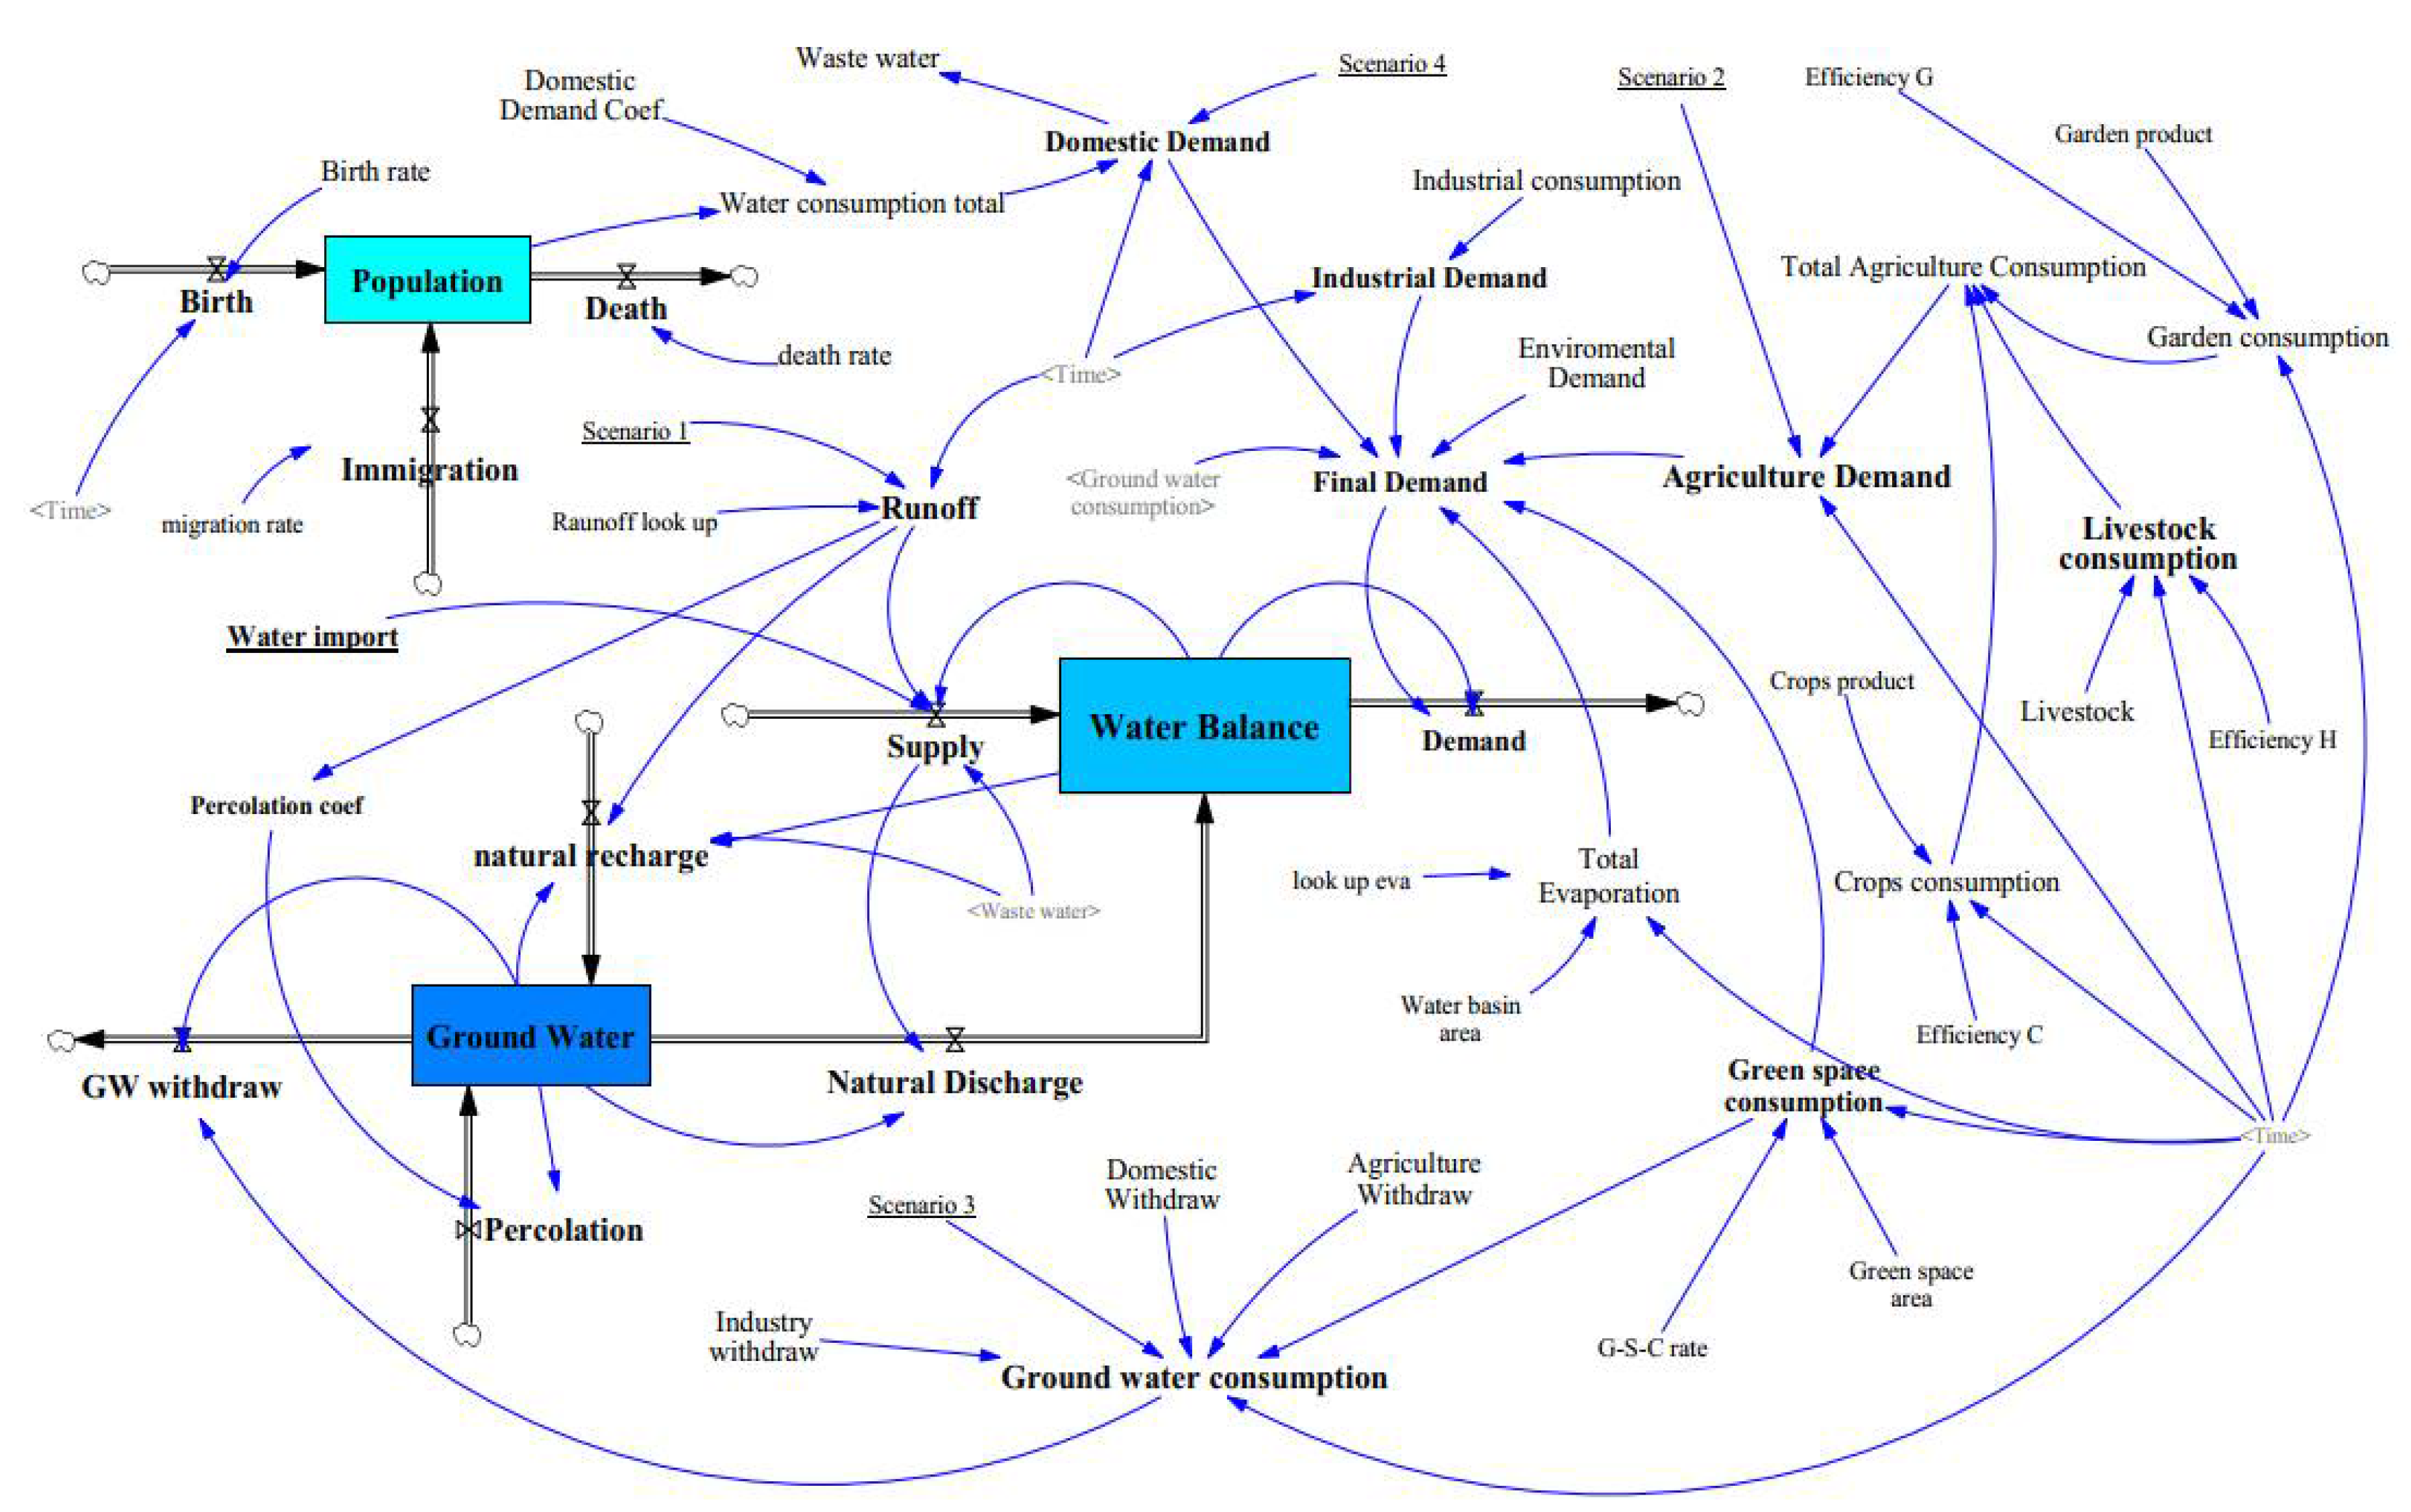
2.2.3. System Dynamics

SD simulation encompasses the following determining steps: first, a statement of the problem as well as determining the boundaries of the system were determined; second, a conceptual design and/or system causal loop diagram (CLD) were planned and created. Third, the simulation model was built by developing a supply–demand approach. Finally, the model efficiency and plausible scenarios as the policy-making step were assessed. The system’s CLD reflects the profound vision of the system outline, comprising an increasing–decreasing causal interconnection between defined factors, which would result in the formation of balancing and reinforcing feedback loops. Therefore, the supply–demand approach is developed to evaluate the inflows and outflows [29]. Indeed, SD simulation provides a profound assessment of interactions between different but interlinked subsystems which affected the system behavior through time [30,31].
The explicit expression for the content of central stock with a supply–demand approach is given by Equation (2).
S t o c k ( t ) = t 0 t n [ S u p p l y ( t ) D e m a n d ( t ) ] d t + S t o c k ( t 0 )
where Stock(t), Supply(t), Demand(t), and Stock(t₀) indicate the stock storage in time t, supply in time t, demand in time, and stock storage in time t₀, respectively.
In this regard, Aji-Chay’s available water can be analyzed at any time by Equation (3):
Available   Water   ( t ) = T W t + G W t + R t T D t E V t + A W t 0
where TWt is the imported water thereby transferring the water plan in time t; GWt is the supplied water from groundwater resources (i.e., wells, fountains, and flumes) in time t; Rt is the runoff in time t; TDt is the total water demand in time t; EVt is the evaporation amount in time t, and A W t 0 is the primary available water.

Key Variables for SD Model Development

The nexus is characterized by synergies (both positive and negative) and trade-offs between various sectors. In negative synergies, a downturn in one sector contributes to a downturn in another, whereas in positive synergies, improvements in one sector reinforce improvements in another. In trade-offs, improvements in one sector are achieved at the expense of a downturn in another [31].
The CLD of the Aji-Chay model comprises the water balance stock as well as its subsystems (i.e., population, groundwater, and demands of various sectors), which are depicted in Figure 3.
All the variables used are linked via arrows with positive and negative polarity, since positive and negative links denote parallel behavior and inverse linkage between variables, respectively. Moreover, the CLDs consist of various variables, including the water balance, surface flow, and demands related to the domestic, agriculture, industrial, green spaces, as well as population, groundwater, and withdrawal.
To scrutinize the comprehensive vision of the water-allocation system, applied water demands for sectors, e.g., agriculture and cultivated crops, were considered as millimeters per month. The water consumption for various crop products was evaluated by the mean water consumption of cultivated crops. Additionally, the irrigation efficiency in both crop and horticultural products was considered in the model. The water demand was calculated using NETWAT software, which benefited from a 10-day- and monthly-basis FAO–Penman–Monteith method. Moreover, water balance analysis of the area showed that insignificant groundwater inflow equal to 1% of available surface water enters the lake [31]. The input variables are considered in monthly intervals and have been retrieved from the regional water companies’ data-distribution center. The used variables are indicated in Table 3.
Afterward, the supply–demand approach was developed using the software Vensim, having utilized the CLDs (Figure 4). In this regard, monthly data were inserted into the model to simulate the model, and the necessary hydrological equations were defined in the Vensim context. Indeed, the SD model conducts a multi-scenario analysis, which led to the achievement of a comparative analysis of a variety of possible management practices. The interactions between stocks and flow rates are best captured through a nexus view, identifying the full interactions between the supply–demand resources over time.

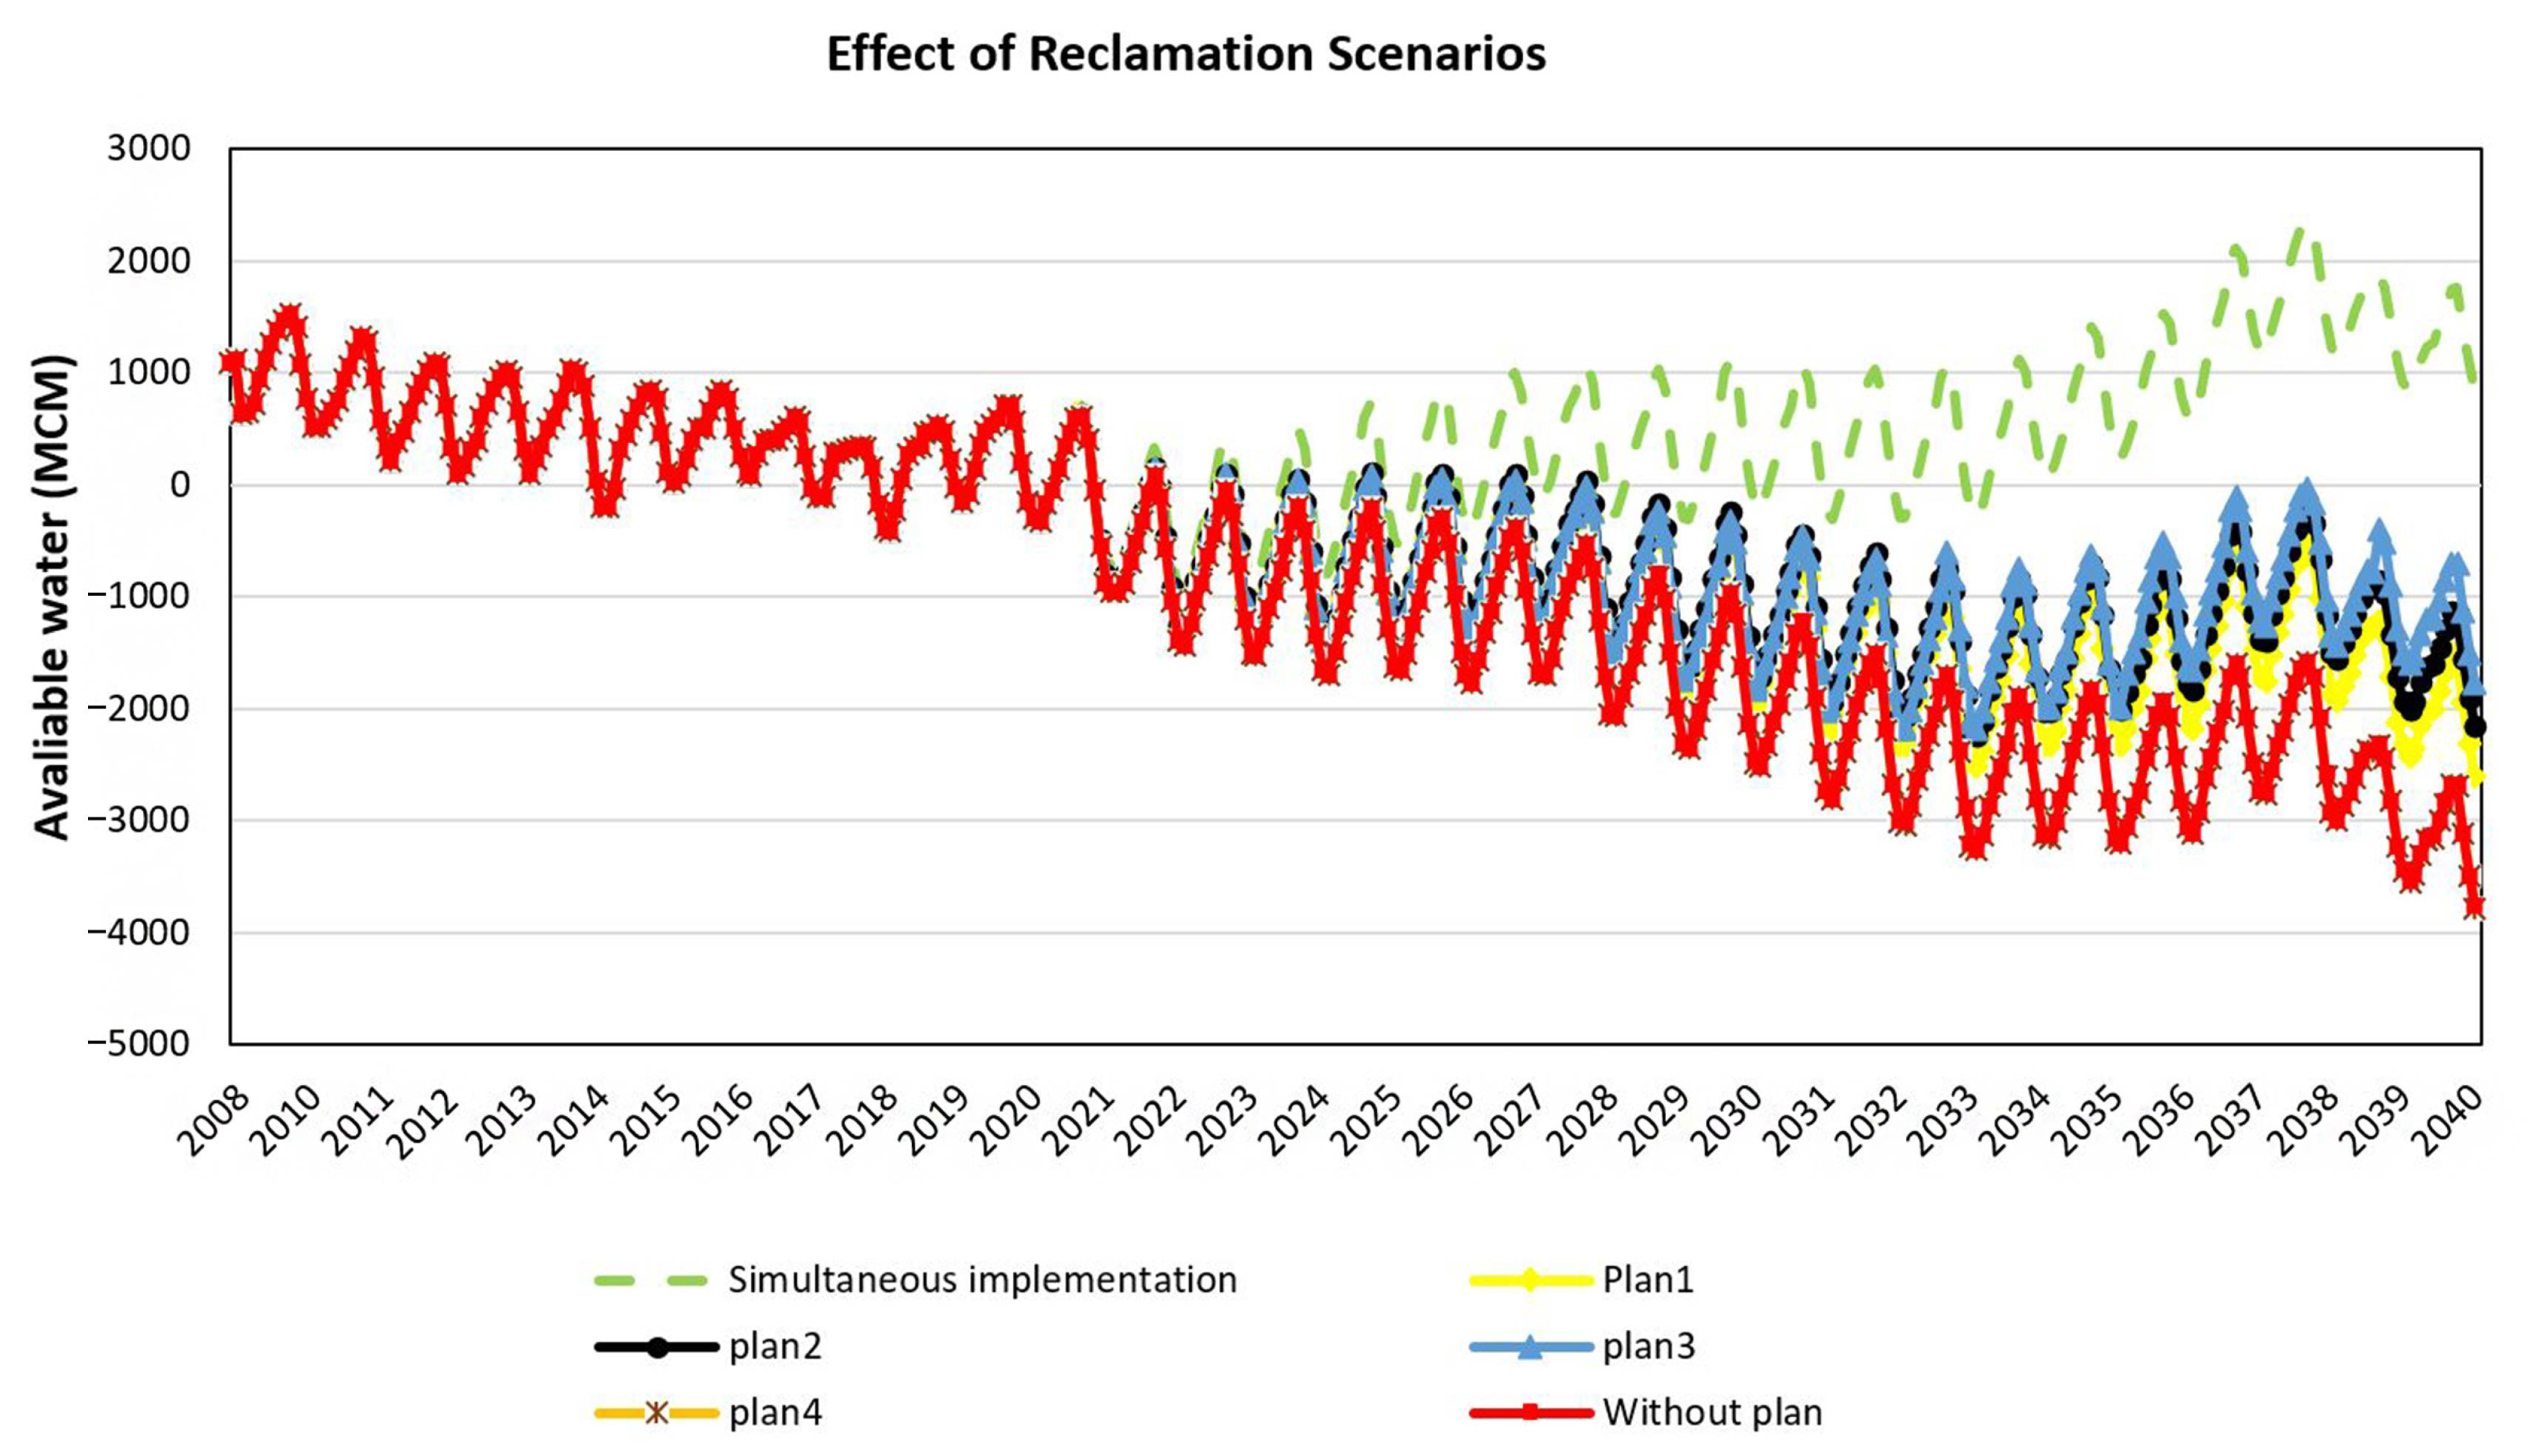
Proposed Reclamation Scenarios in the SD Model

To achieve effective policymaking, four reclamation scenarios as well as their simultaneous implementation, i.e., cloud seeding, increasing the irrigation efficiency and reducing agricultural production, controlling policies on groundwater withdrawal as well as environmental awareness, and cultivation for reducing domestic consumption as well as their ensembles, have been proposed to overcome the water deficits. Reclamation scenarios are discussed in detail below.
Plan 1. Cloud seeding
Given the inevitable impact of climate change, as manifested by the rainfall-runoff model, the region’s runoff is experiencing a descending trend throughout the entire study area. In this regard, the cloud seeding scenario was proposed as a novel approach to rainfall management in urban areas with the aim of increasing runoff and existing potential for runoff aggregation. If all of the conditions are met and well-organized in the best possible way through the cloud seeding process, rainfall will be increased by 15% at best [32]. In the present study, the scenario of a 10% increase in runoff was considered, benefitting from novel cloud seeding technology.
Plan 2. Increasing irrigation efficiency and reducing agricultural production
Given the point that the agricultural sector has the highest consumption among the various sectors, managing this sector requires being at the center of the attention of policymakers. Firstly, the irrigation efficiency can be boosted by taking advantage of mechanized or drip irrigation up to 90%. In the current situation, the irrigation efficiency within the study area is 37% and 45% for agricultural and horticultural lands of the Urmia Lake Restoration Program (ULRP), respectively. Afterward, policymaking toward reducing agricultural products can be known as a prominent solution to meet the increased water demand [33]. As the cultivated crops consume high amounts of water, a win–win solution between government officials and farmers would be a constructive step in this direction. For instance, importing the required products instead of cultivating crops with high virtual water consumption and allocating funds to support farmers to achieve a sustainable watershed can be considered in this regard in order to increase the irrigation efficiency, an ascending trend of 30% in irrigation efficiency was considered.
Plan 3. Controlling policies on groundwater withdrawal as well as environmental awareness
According to the results of the Urmia Lake restoration program, which has been conducted on Urmia Lake, groundwater resources play a significant role in this vital area [34]. Regarding this, approximately one-third of the region’s water demand is supplied from groundwater resources (Iran Water Resources Management Company), so the importance of policymaking toward controlling the groundwater resources as well as illegal withdrawals have come to the fore. This approach is strongly influenced by the term “environmental awareness”. In this regard, a 20% reduction in groundwater withdrawal was assumed in this study.
Plan 4. Cultivation for reducing domestic consumption
Due to the high per capita water consumption and the importance of the term “water literacy” as an influential factor that sets the pace for decreasing domestic consumption, this scenario has been proposed. To drastically reduce domestic consumption, a 10% drop was considered to descend the water footprint in domestic units.
Plan 5. Simultaneous implantation of scenarios
Finally, having considered the impact of the simultaneous implementation of proposed reclamation scenarios, the consensus of all the proposed scenarios was analyzed simultaneously.

2.3. Evaluation Criteria

Three evaluation criteria including the correlation coefficient (CC), determination coefficient (DC), and root mean square error (RMSE) have been utilized to probe the efficiency of the proposed methodology in downscaling and the rainfall-runoff model. The CC has been widely employed for determining the linear relation of calibrated and observed values varying from −1 to +1; the greater CC is the stronger coefficient, while zero does not imply any relationship between the two parameters (see Equation (4)).
C C = N (   O C ) (   O ) (   C ) [ N   O 2 (   O ) 2 ]   [ N   C 2 (   O ) 2 ]  
The DC criterion is utilized to specify the accuracy of the prediction.
It tests how accurately reported outcomes are dependent on the proportion of the total differences that the current model replicates and differs from −∞ to 0 (Equation (5)).
D C = 1 i = 1 T ( O C ) 2 i = 1 T ( O O ¯ ) 2
RMSE reflects the degree of relevancy between observed and simulated quantities as the sample standard deviation denoting differences between predictor and predictand. The range of RMSE varies widely from 0 to ∞, while the performance improves with the reduction in RMSE. When the RMSE values approach 0, the values are well-connected (see Equation (6)).
R M S E = i = 1 N ( O C ) 2 N  
where N specifies the number of data, O shows the observed data, C indicates the calculated values, and O ¯ determines the mean of the observed data.
Furthermore, for the purpose of analyzing the reliability of the SD model, three evaluation criteria—the boundary adequacy test, behavior sensitivity test, and extreme condition test—were utilized.
The boundary adequacy test is applied when the model contains the relevant structural relationships to meet the purpose of the model. Consequently, the boundary adequacy test inquires whether the model comprises all relevant aspects of the structure and the chosen level of aggregation is appropriate.
The behavior-sensitivity test determines whether plausible shifts in the variables can cause the failure of behavior tests previously passed in the model or not.
Moreover, by assigning extreme values to the model, the behavior of the simulated model is compared with the real system via an extreme condition test [34].

3. Results and Discussion

The current study sought to prove to investigate whether the reclamation scenarios under a changing climate as well as the development plan can meet the response to increasing water demand in the Aji-Chay watershed for a future twenty-year horizon or not. To have all the factors scrutinized, the results are presented in three steps; step one: statistical downscaling as well as climate projection; step two: the rainfall-runoff model; step three: a SD model coupled with a sustainable assessment. The findings are outlined in the following sub-categories, based on the proposed methodology.

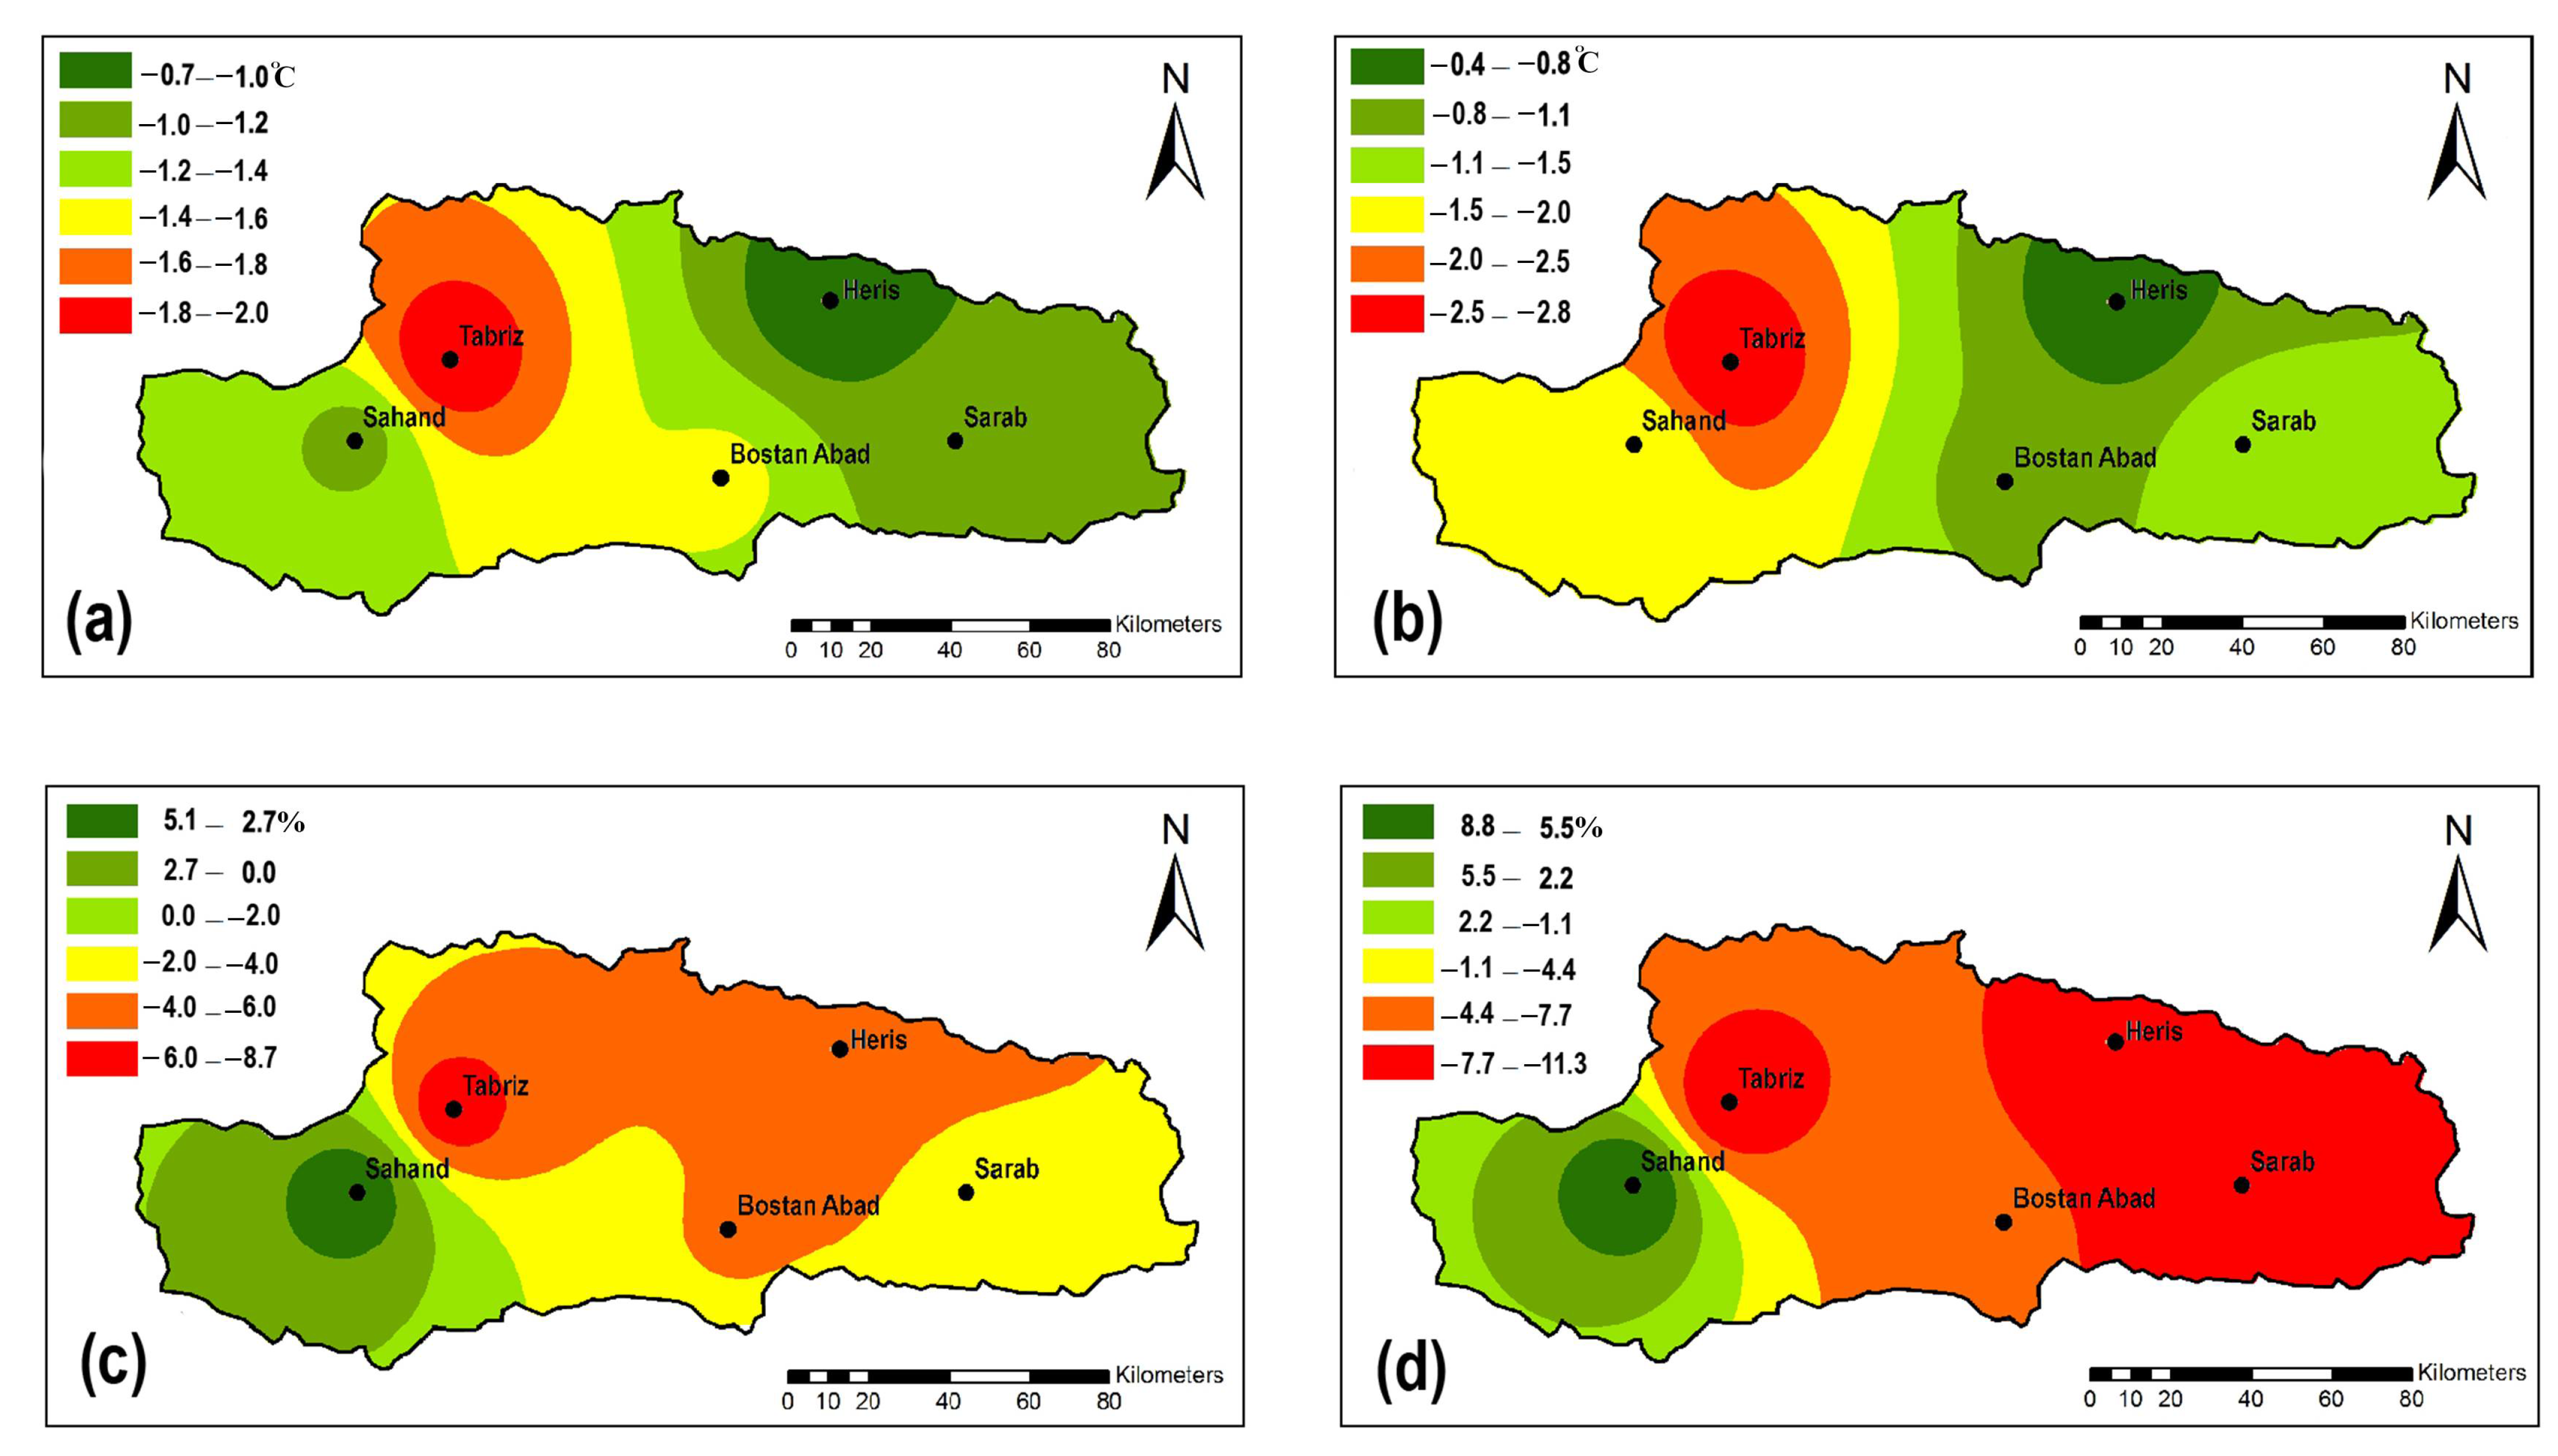
3.1. Results of Climate Projection

For climate change impact assessment, a weather generator type of statistical downscaling approach (i.e., LARS-WG) was employed. Four individual GCM models—EC-EARTH, HadCM2, MIROC, and MPI-ESM—as well as the ensemble of GCMs were utilized in LARS-WG to downscale the temperature and precipitation. The results revealed that the ensemble multi-GCM model, benefitting from the peculiarities of individual GCM models, performed effectively in comparison to individual scenarios (Table 4).
The results of the ensemble multi-GCM model to project future precipitation and temperature under RCP4.5 and 8.5 scenarios led to an ascending and descending trend for temperature and precipitation predictands, respectively. Additionally, the mean monthly precipitation outputs revealed that the precipitation predictand will experience a descending trend through all the months under RCP4.5 during 2021 up to 2040 (Figure 5). Furthermore, the mean annual precipitation variation during 1961–2080 is shown in (Figure 6). It can be concluded that the precipitation changes under the pessimistic scenario of RCP8.5 will be more severe than the predicted precipitation under RCP4.5.
The findings of this study for climate projection confirm the results of the previous study by [9] which resulted in a 29% and 21% drop in precipitation using the ANN method for the current study area considering RCP4.5 and 8.5, respectively.
Having the climate projections for predictands visualized, an inverse-distance weighting (IDW) approach was used for a better understanding of fluctuation among the stations during 2021–2040 (see Figure 7). It is clear that Tabriz city will experience the highest ascending trend for temperature. This may be attributed to the industrial function of Tabriz city, which is the imprint of the high greenhouse gas (GHG) concentrations in the city. The results showed that the precipitation predictand on average will decrease within the region. Despite the descending trend through the region, Sahand station will experience the lowest precipitation reduction; this issue may be affected by the type of weather system originating from the location of the station, which is located in the high mountainous region, and is also less subjected to urbanization conditions.

3.2. Results of Rainfall-Runoff Model

The ANN framework of rainfall-runoff models was developed to link climate change-based precipitation and temperature data to surface runoff. Since projecting future emission conditions and plausible factors affected by humans on the environment is challenging, researchers utilize a variety of scenarios based on various assumptions about possible economic, social, technological, and environmental circumstances, known as prediction scenarios (here RCPs). In the current study, RCPs 4.5 and 8.5 as the intermediate and high-emission scenarios were utilized due to data availability.
The existing observed data is divided into 70–15–15% as the training and validation and crosscheck steps, respectively. Additionally, the Levenberg–Marquardt algorithm as well as feed-forward neural network (FFNN) model were employed to train the network with different hidden neurons, which were selected via trial and error by examining 1000 epochs. The ANN model evaluation criteria showed that the maximum efficiency occurred at 480 epochs with four hidden neurons.
On the other hand, to overcome the non-uniform distribution of rain gauges, the Thiessen polygon method was utilized using Geographic information system (GIS) software (See Figure 8). If the areas related to any polygons, A1, A2, , An, and precipitation values in polygonal stations are P1, P2, , Pn, respectively. In this case, the average rainfall of the region is obtained from the following formula:
P t = A 1 P 1 + A 2 P 2 + + A n P n A 1 + A 2 + + A n
As a result, the projected rainfall under RCPs 4.5 and 8.5 for the future twenty-year horizon will yield a 17–23% decrease on average.

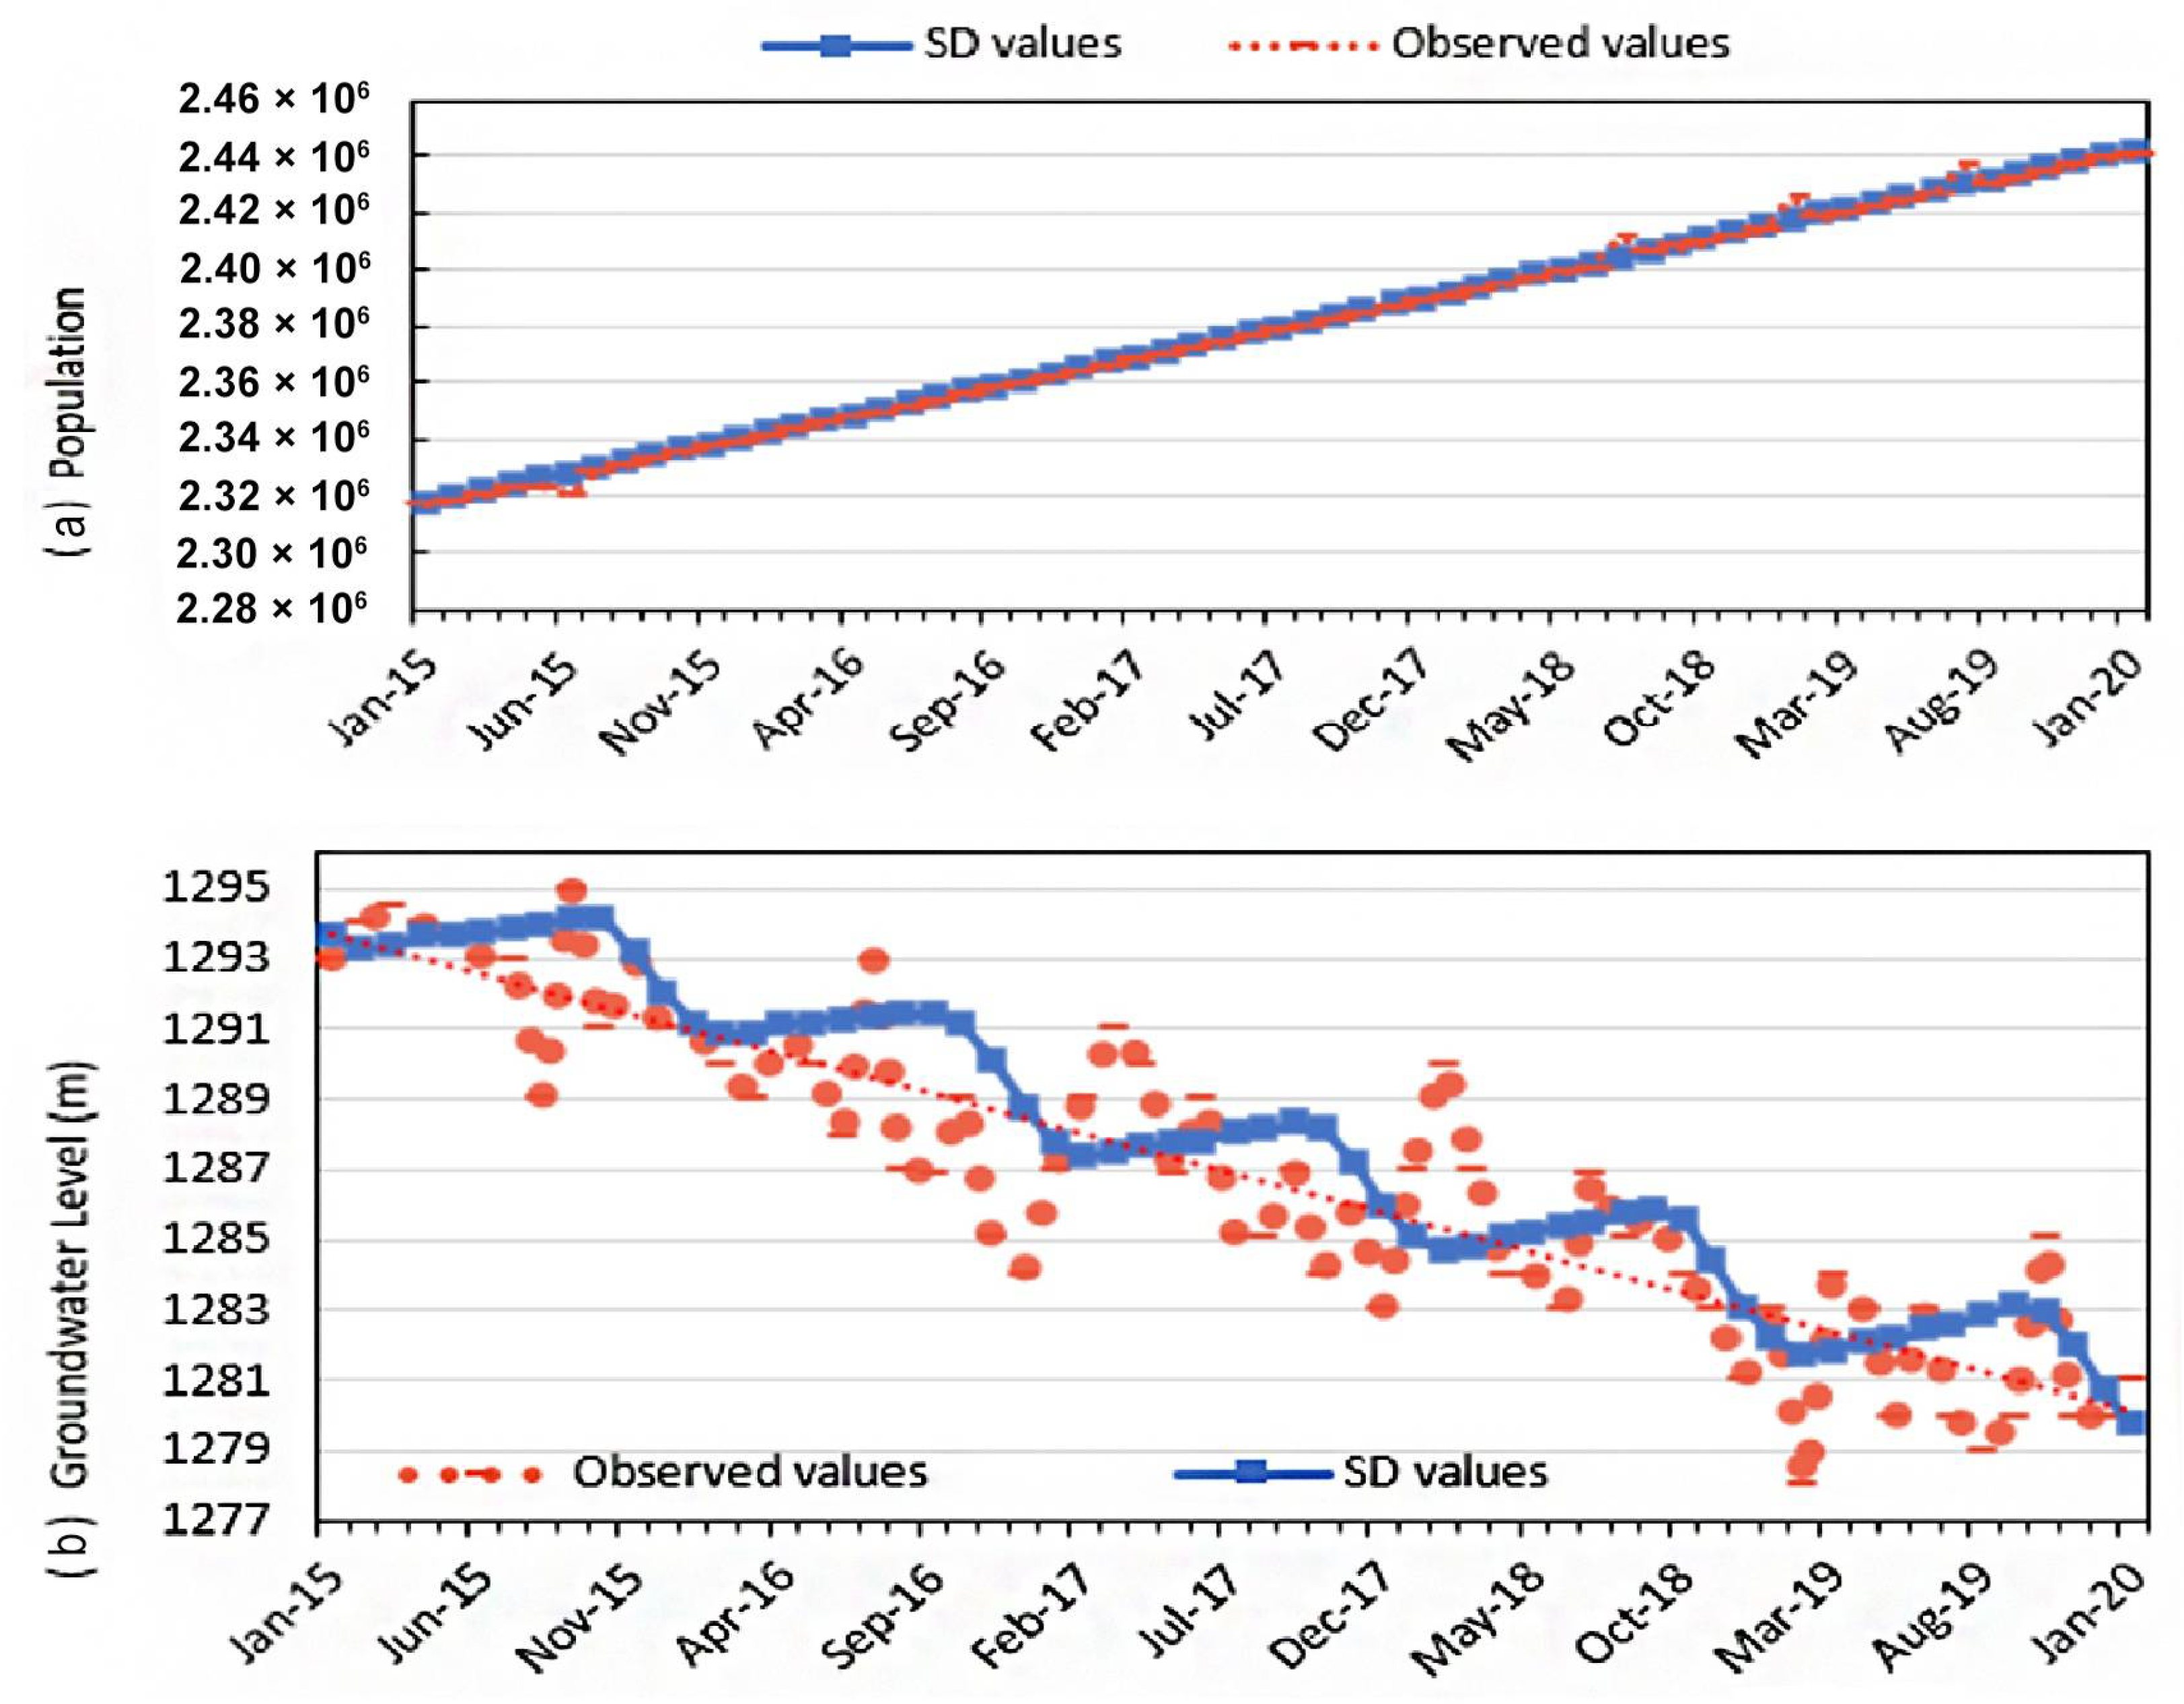
3.3. Results of System Dynamics Model

The SD model of Aji-Chay watershed has been validated and modified by using systematic analyses, behavior pattern tests, and structure-oriented behavior tests (Barlas, 1996). Throughout the model-development procedure, the SD model validation was analyzed by systematic verification, which reflected the performance of the model as well as its resemblance to the existing reality [31]. To verify an appropriate model structure, the boundary-adequacy test was performed by defining endogenous and exogenous factors within the model (Table 5). Furthermore, the capability of the SD model in the reproduction of historical evidence was analyzed. The evaluation of the correlation between simulated values and historical evidence for groundwater and population stocks from 2015 to 2020 revealed 0.81 and 0.98 correlation values for groundwater and population stocks, respectively, manifesting the authenticity and reliability of the SD model (Figure 9).
According to the SD model, the agriculture sector makes up 45% of the total water consumption, with livestock and industry sectors consuming 27% and 23%, respectively, and the domestic consumption is 4% of the total water consumption in the study area. The consumption level of all these sectors is on the rise; supply constraints are of considerable importance to the region’s sustainable development (Figure 10). As the findings revealed, the agricultural sector was the main culprit for water shortages in the Aji-Chay watershed. Hence, policymaking toward managing the water dedicated to the agricultural sector should be at the center of the attention of stakeholders. Due to the intermediate emission scenarios of RCP4.5 and more compatibility with the conditions of the catchment area in SD modeling, the results are presented based on the outputs of RCP4.5.
The effects of the plausible scenarios were once considered separately, and then simultaneous implementation was examined to figure out whether or not the combination scenarios can meet the water-balance system achieved. The results revealed that only the ensemble of all scenarios can provide the expectations, while individual scenarios demonstrated inadequacy in satisfying the requirements of the basin.
The impact of implying proposed scenarios on the water balance of the Aji-Chay watershed is shown in Figure 11. As shown, the red trace represents the water availability in the absence of reclamation interventions. It can be concluded that for optimal management overshadowed by prolonged sustainable policies, water managers should not focus merely on individual scenarios but should invest in all the proposed scenarios (Table 6).

4. Concluding Remarks

Optimal water allocation for ongoing demands is the principal priority for water managers, especially in arid/semi-arid areas. In this research, an SD technique was developed under a changing climate for predicting the behavior of a watershed with a supply–demand approach. The results of the climate projections overshadowed by an ensemble multi-GCM approach revealed an ascending trend of 0.1 °C to +1.3 °C in temperature and also 17% and 23% descending in precipitation within the region. Having considered the climate projections, an ANN-based rainfall-runoff model was generated to link the impacts of climate change on hydro-climate parameters and surface runoff. An SD approach was then developed to ascertain a comprehensive vision toward the water balance over the region. The results revealed that about 80% of total shortages were affected by the agricultural sector. Additionally, water transfer from outside resources is an inevitable tool for meeting future water demand; however, this may result in conflict. In this regard, the importance of water diplomacy in the region has been found to be of great importance. Taking the best-applied targeting strategies to mitigate the severity of shortages involves the simultaneous implementation of proposed scenarios (i.e., cloud seeding, increasing irrigation efficiency as well as reducing agricultural production, groundwater withdrawal control, and also environmental awareness, coupled with cultivation to reducing domestic consumption) where the results managed to meet the requirements of a sustainable ecological status after a period of 10 years. The reclamation process managed to meet the requirements of socio-environment aspects as well as prolonged sustainability approaches. Overall, to overcome the limitations of this study, it may be recommended to utilize various downscaling methods, especially RCMs, which are more detailed models and enjoy forms of artificial intelligence (AI) models such as LSSVM, ANFISS, and Gene Programming for the Rainfall-Runoff modeling. Moreover, considering a more exhaustive vision toward the SD model, the financial aspects can be entered into the model as a topic for future studies.

Author Contributions

Conceptualization, A.H.B. and A.S.; methodology, M.Z.; software, A.S. and S.P.; validation, A.H.B., E.H. and M.Z.; formal analysis, A.S. and S.P.; investigation, A.H.B. and A.S.; resources, A.S.; data curation, A.S. and S.P.; writing—original draft preparation, A.S; writing—review and editing, A.H.B.; visualization, S.P.; supervision, A.H.B.; project administration, M.Z. and E.H. All authors have read and agreed to the published version of the manuscript.

Funding

This research received no external funding.

Institutional Review Board Statement

Not applicable.

Informed Consent Statement

Not applicable.

Conflicts of Interest

The authors declare no conflict of interest.

References

  1. Madani, K.; AghaKouchak, A.; Mirchi, A. Iran’s socio-economic drought: Challenges of a water-bankrupt nation. Iran. Stud. 2016, 49, 997–1016. [Google Scholar] [CrossRef]
  2. Dziedzic, R.; Karney, B.W. Energy metrics for water distribution system assessment: Case study of the Toronto network. J. Water Resour. Plan. Manag. 2015, 141, 04015032. [Google Scholar] [CrossRef] [Green Version]
  3. Dziedzic, R.M.; Karney, B.W. Water user survey on expectations of service in Guelph, ON, Canada. Water Pract. Technol. 2015, 10, 767–770. [Google Scholar] [CrossRef]
  4. Nazemi, A.; Zaerpour, M.; Hassanzadeh, E. Uncertainty in Bottom-Up Vulnerability Assessments of Water Supply Systems due to Regional Streamflow Generation under Changing Conditions. J. Water Resour. Plan. Manag. 2020, 146, 04019071. [Google Scholar] [CrossRef]
  5. Baghanam, A.H.; Seifi, A.J.; Sheikhbabaei, A.; Hassanzadeh, Y.; Besharat, M.; Asadi, E. Policy-Making toward Integrated Water Resources Management of Zarrine River Basin via System Dynamics Approach under Climate Change Impact. Sustainability 2022, 14, 3376. [Google Scholar] [CrossRef]
  6. Nourani, V.; Baghanam, A.H.; Gokcekus, H. Data-driven ensemble model to statistically downscale rainfall using nonlinear predictor screening approach. J. Hydrol. 2018, 565, 538–551. [Google Scholar] [CrossRef]
  7. Lu, W.; Qin, X. Integrated framework for assessing climate change impact on extreme rainfall and the urban drainage system. Hydrol. Res. 2020, 51, 77–89. [Google Scholar] [CrossRef] [Green Version]
  8. Farboudfam, N.; Nourani, V.; Aminnejad, B. Wavelet-based multi station disaggregation of rainfall time series in mountainous regions. Hydrol. Res. 2019, 50, 545–561. [Google Scholar] [CrossRef] [Green Version]
  9. Baghanam, A.H.; Nourani, V.; Keynejad, M.A.; Taghipour, H.; Alami, M.T. Conjunction of wavelet-entropy and SOM clustering for multi-GCM statistical downscaling. Hydrol. Res. 2019, 50, 1–23. [Google Scholar] [CrossRef] [Green Version]
  10. Ebrahim, G.Y.; Jonoski, A.; Van Griensven, A.; Di Baldassarre, G. Downscaling technique uncertainty in assessing hydrological impact of climate change in the Upper Beles River Basin, Ethiopia. Hydrol. Res. 2013, 44, 377–398. [Google Scholar] [CrossRef]
  11. Zarghami, M.; Abdi, A.; Babaeian, I.; Hassanzadeh, Y.; Kanani, R. Impacts of climate change on runoffs in East Azerbaijan, Iran. Glob. Planet. Chang. 2011, 78, 137–146. [Google Scholar] [CrossRef]
  12. Hassan, Z.; Shamsudin, S.; Harun, S. Application of SDSM and LARS-WG for simulating and downscaling of rainfall and temperature. Theor. Appl. Climatol. 2014, 116, 243–257. [Google Scholar] [CrossRef]
  13. Jaiswal, R.K.; Ali, S.; Bharti, B. Comparative evaluation of conceptual and physical rainfall–runoff models. Appl. Water Sci. 2020, 10, 48. [Google Scholar] [CrossRef] [Green Version]
  14. Alamdari, N.; Sample, D.J.; Steinberg, P.; Ross, A.C.; Easton, Z.M. Assessing the effects of climate change on water quantity and quality in an urban watershed using a calibrated stormwater model. Water 2017, 9, 464. [Google Scholar] [CrossRef]
  15. Hu, H.; Yang, K.; Sharma, A.; Mehrotra, R. Assessment of water and energy scarcity, security and sustainability into the future for the Three Gorges Reservoir using an ensemble of RCMs. J. Hydrol. 2020, 586, 124893. [Google Scholar] [CrossRef]
  16. Nourani, V.; Baghanam, A.H.; Adamowski, J.; Gebremichael, M. Using self-organizing maps and wavelet transforms for space–time pre-processing of satellite precipitation and runoff data in neural network based rainfall–runoff modeling. J. Hydrol. 2013, 476, 228–243. [Google Scholar] [CrossRef]
  17. Gholami, V.; Sahour, H. Simulation of rainfall-runoff process using an artificial neural network (ANN) and field plots data. Theor. Appl. Climatol. 2022, 147, 87–98. [Google Scholar] [CrossRef]
  18. Padiyedath Gopalan, S.; Hanasaki, N.; Champathong, A.; Tebakari, T. Impact assessment of reservoir operation in the context of climate change adaptation in the Chao Phraya River basin. Hydrol. Process. 2021, 35, e14005. [Google Scholar] [CrossRef]
  19. Hassanzadeh, E.; Elshorbagy, A.; Wheater, H.; Gober, P. Managing water in complex systems: An integrated water resources model for Saskatchewan, Canada. Environ. Model. Softw. 2014, 58, 12–26. [Google Scholar] [CrossRef]
  20. Madani, K.; Mariño, M.A. System dynamics analysis for managing Iran’s Zayandeh-Rud river basin. Water Resour. Manag. 2009, 23, 2163–2187. [Google Scholar] [CrossRef]
  21. Hassanzadeh, E.; Zarghami, M.; Hassanzadeh, Y. Determining the main factors in declining the Urmia Lake level by using system dynamics modeling. Water Resour. Manag. 2012, 26, 129–145. [Google Scholar] [CrossRef]
  22. Sarindizaj, E.E.; Zarghami, M. Sustainability assessment of restoration plans under climate change by using system dynamics: Application on Urmia Lake, Iran. J. Water Clim. Chang. 2019, 10, 938–952. [Google Scholar] [CrossRef]
  23. Ahmadi, M.H.; Zarghami, M. Should water supply for megacities depend on outside resources? A Monte-Carlo system dynamics simulation for Shiraz, Iran. Sustain. Cities Soc. 2019, 44, 163–170. [Google Scholar] [CrossRef]
  24. Bakhshianlamouki, E.; Masia, S.; Karimi, P.; van der Zaag, P.; Sušnik, J. A system dynamics model to quantify the impacts of restoration measures on the water-energy-food nexus in the Urmia lake Basin, Iran. Sci. Total Environ. 2020, 708, 134874. [Google Scholar] [CrossRef] [PubMed]
  25. Barhagh, S.E.; Zarghami, M.; Ghale, Y.A.G.; Shahbazbegian, M.R. System dynamics to assess the effectiveness of restoration scenarios for the Urmia Lake: A prey-predator approach for the human-environment uncertain interactions. J. Hydrol. 2021, 593, 125891. [Google Scholar] [CrossRef]
  26. D’Oria, M.; Ferraresi, M.; Tanda, M.G. Quantifying the impacts of climate change on water resources in northern Tuscany, Italy, using high-resolution regional projections. Hydrol. Process. 2019, 33, 978–993. [Google Scholar] [CrossRef]
  27. Semenov, M.A.; Barrow, E.M. Use of a stochastic weather generator in the development of climate change scenarios. Clim. Chang. 1997, 35, 397–414. [Google Scholar] [CrossRef]
  28. Chen, H.; Guo, J.; Zhang, Z.; Xu, C.Y. Prediction of temperature and precipitation in Sudan and South Sudan by using LARS-WG in future. Theor. Appl. Climatol. 2013, 113, 363–375. [Google Scholar] [CrossRef]
  29. Haykin, S. A comprehensive foundation. In Neural Networks, 2nd ed.; Prentice Hall: Hoboken, NJ, USA, 2004; p. 41. [Google Scholar]
  30. Forrester, J.W. Urban dynamics. IMR. Ind. Manag. Rev. 1970, 11, 67. [Google Scholar]
  31. Ford, A. System dynamics models of environment, energy, and climate change. In System Dynamics: Theory and Applications; Springer: Berlin/Heidelberg, Germany, 2020; pp. 375–399. [Google Scholar]
  32. Sterman, J. System Dynamics: Systems Thinking and Modeling for a Complex World; McGraw-Hill Education: New York, NY, USA, 2002. [Google Scholar]
  33. DeFelice, T.P.; Golden, J.; Griffith, D.; Woodley, W.; Rosenfeld, D.; Breed, D.; Solak, M.; Boe, B. Extra area effects of cloud seeding—An updated assessment. Atmos. Res. 2014, 135, 193–203. [Google Scholar] [CrossRef]
  34. Urmia Lake Restoration Programs (ULRP). 2014. Available online: http://www.ulrp.ir/en/ (accessed on 11 February 2022).
Figure 1. Location of the Aji-Chay watershed.
Sustainability 14 09411 g001
Figure 2. Schematic of proposed methodology. (1) Multi-GCM ensemble downscaling under RCP 4.5 and 8.5; (2) rainfall-runoff modeling; (3) SD modeling and impact assessment of reclamation scenarios.
Sustainability 14 09411 g002
Figure 3. Causal loop diagram of the Aji-Chay model.
Sustainability 14 09411 g003
Figure 4. The developed SD model of Aji-Chay watershed.
Sustainability 14 09411 g004
Figure 5. Mean monthly precipitation projection of the Tabriz station during 2021–2040.
Sustainability 14 09411 g005
Figure 6. Mean annual precipitation variation of Tabriz during 1950–2080.
Sustainability 14 09411 g006
Figure 7. Zoning map. (a)Temperature RCP4.5; (b) temperature RCP8.5; (c) precipitation RCP4.5; (d) precipitation RCP8.5 (2021–2040).
Sustainability 14 09411 g007
Figure 8. Thiessen polygon method to assign real significance to point rainfall values in the study area.
Sustainability 14 09411 g008
Figure 9. Historical evidence validation of SD model for (a) population and (b) groundwater stocks.
Sustainability 14 09411 g009
Figure 10. The amount of water consumed in different sections.
Sustainability 14 09411 g010
Figure 11. Impact of plausible scenarios on the Aji-Chay water balance for the period of 2007–2040.
Sustainability 14 09411 g011
Table 1. The position of the synoptic stations and the observed climate data.
Station CodeStation NameLongitude
(°N)
Latitude
(°E)
Altitude
(m)
Mean Temperature (°C)Cumulative Precipitation (mm)
40706Tabriz46°17′38°08′136412.2251.8
40704Sahand47°04′38°26′139110.8288.2
40416Sarab37°93′38°47′16828.9237.3
40435Bostan Abad46°51′37°51′17508.0320.0
40571Heris47°06′38°15′19508.5315.2
Table 2. Applied GCMs characteristics.
NoCentreGlobal Climate ModelCentre AcronymCountryGrid Size
(Approximately)
1Numerical weather predictionEC-EARTHESMEurope1.1° × 1.1°
2UK Met. OfficeHadGEM2UKMOUK1.4° × 1.9°
3Met Research Institute, JapanMIROC5NIESJapan1.2° × 2.5°
4Max-Planck Met InstituteMPI-ESMMPI-MGermany1.9° × 1.9°
Table 3. Variables of the Aji-Chay SD model.
DataSource(s)Data Type
Groundwater (GW) Total supply IWRMC aModeled
Natural rechargeSurveying evidenceModeled
Recycled waterSurveying EvidenceModeled
GW withdrawalIWRMCModeled
Natural dischargeSurveying EvidenceStatistical
GW volume changeSurveying evidenceModeled
Wastewater percolation SWIWRMCStatistical
Precipitation volumeIMO bModeled
Precipitation heightIMOStatistical
Horticultural demand averageNETWATStatistical
Unmeasured surface inflow volumeSurveying evidenceModeled
EvaporationIMOModeled
Available water IWRMCStatistical
PopulationIran’s Statistical CenterStatistical
Domestic demandIWRMCModeled
Agricultural demandIWRMCModeled
Industrial demandIWRMCModeled
Horticultural demandIWRMCModeled
Crop demandIWRMCModeled
Green space demandIWRMCModeled
Environmental demandIWRMCStatistical
Total demandIWRMCModeled
Inflow to basinSurveying evidenceModeled
InflowSurveying evidenceModeled
Surface water percolationIWRMCModeled
Wastewater GW percolationIWRMCStatistical
Irrigation percolationIWRMCStatistical
Husbandry demandIran’s Ministry of AgricultureStatistical
Horticultural cultivated demandIran’s Ministry of AgricultureStatistical
Crop demand averageNETWATStatistical
Total supply SWIWRMCModeled
RunoffIWRMCModeled
a Iran Water Resources Management Company; b Iran Meteorological Organization.
Table 4. Results of the precipitation-downscaling model via LARS_WG based on individual and multi-GCM models.
Downscaling ModelGCM ModelsEvaluation Criteria
CCDCRMSE (mm)
LARS-WGPEC-EARTH0.910.764.60
PHADGEM20.610.228.99
PMIROC50.910.824.07
PMPI-ESM0.890.437.65
PEnsembles of GCMs0.910.854.08
P: precipitation.
Table 5. The Aji-Chay SD model’s endogenous and exogenous variables.
EndogenousExogenous
PopulationNatural rechargeCrop cultivated tonnage
Agricultural demandGroundwater withdrawHorticultural cultivated tonnage
Industrial demandNatural dischargeCrop demand average
Domestic demandGroundwater levelHorticultural demand average
Crop demandClimate projectionsIndustrial factories Number
Husbandry demandEvaporationDemographic changes
Horticultural demandWastewater coverageWater Balance
Green spaces demandWithdrawSupply–Demand relation
Total demandInflow
Infiltration
Table 6. Impact of implying plausible scenarios.
PlanDescriptionImpact Percentage of Each Scenario (%)
Plan 1Cloud seeding9
Plan 2Increasing irrigation efficiency and reducing agricultural production17
Plan 3Groundwater withdraws control policies and coupled with environmental awareness13
Plan 4Cultivation for reducing domestic consumption1
Plan 5Simultaneous implementation27
Publisher’s Note: MDPI stays neutral with regard to jurisdictional claims in published maps and institutional affiliations.

