Article

Policy-Making toward Integrated Water Resources Management of Zarrine River Basin via System Dynamics Approach under Climate Change Impact

by
Aida Hosseini Baghanam
1,*,
Arshia Jedary Seifi
1,
Ali Sheikhbabaei
1,
Yousef Hassanzadeh
1,
Mohsen Besharat
2 and
Esmaeil Asadi
3
1
Department of Water Resources Engineering, Faculty of Civil Engineering, University of Tabriz, Tabriz 51666-16471, Iran
2
School of Engineering, Arts, Science and Technology, University of Suffolk at Suffolk New College, Ipswich IP4 1QJ, UK
3
Water Resources Engineering, Faculty of Agriculture, University of Tabriz, Tabriz 51666-16471, Iran
*
Author to whom correspondence should be addressed.
Sustainability 2022, 14(6), 3376; https://0-doi-org.brum.beds.ac.uk/10.3390/su14063376
Submission received: 2 December 2021 / Revised: 12 February 2022 / Accepted: 8 March 2022 / Published: 13 March 2022

Abstract

:
In terms of having a comprehensive vision toward supplying the water requirements, a multi-criteria decision-making approach was employed on the Zarrine River Basin (ZRB) in the northwest of Iran. First, the climate change impacts were analyzed with the Long Ashton Research Station Weather Generator (LARS-WG) downscaling approach by using General Circulation Models (GCMs) including the European Consortium Earth System Model (EC-EARTH), Hadley Centre Global Environment Model version 2 (HADGEM2), Model for Interdisciplinary Research on Climate, version 5 (MIROC5), and Max Planck Institute Earth System Model (MPI-ESM), from Coupled Model Intercomparison Project 5 (CMIP5) under Representative Concentration Pathway (RCP4.5, RCP8.5) scenarios for 2021–2080. Afterward, the downscaled variables were utilized as inputs to the Artificial Neural Network (ANN) model to predict future runoff under the climate change impact. Finally, the system dynamics (SD) model was employed to simulate various scenarios for assessing water balance utilizing the Vensim software. The results of downscaling models suggested that the temperature of the basin will increase by 0.47 and 0.91 °C under RCPs4.5 and 8.5 by 2040, respectively. Additionally, the precipitation will decrease by 3.5 percent under RCP4.5 and 14 percent under RCP8.5, respectively. Moreover, simulation results revealed that the water demand in various sectors will be enormously increased. The contribution of the climate change impact on the future run-off was a seven percent decrease, on average, over the basin. The SD model, according to presented plausible scenarios including decreasing agriculture product and shifting irrigation efficiency, cloud-seeding, population control, and household consumption reduction, reducing meat and animal-husbandry production, and groundwater consumption control, resulted in a water balance equilibrium over five years. However, the performance of individual scenarios was not effective; instead, a combination of several scenarios led to effective performance in managing reduced runoff under climate change.

1. Introduction

Integrated water resource management (IWRM) constitutes one of the most substantial and inevitable challenges in urban planning. Beyond its problematic nature, finding a beneficial equilibrium between human and anthropogenic impacts on the environment has always been the target of sustainable environmental management [1]. One of the irreparable damages of human beings to nature is global warming and consequently the climate change. The most prominent concern of IWRM under climate change impact is achieving the sustainable development goals on watersheds and basins.
To assess the impacts of climate change on water resources, general circulation models (GCMs) are widely used [2]. Since GCM data could not be utilized for the impact studies of climate change directly, downscaling techniques were developed to convert the coarse resolution data of the GCMs into local scale-specific resolutions. Downscaling tools could be classified into two statistical and dynamical methods. The Long Ashton Research Station Weather Generator (LARS-WG) tool is a weather generator which is capable of simulating temperature and precipitation parameters in climate change conditions and the assessment of climate change impact [3,4]. Another advantage of LARS-WG is that 15 GCMs’ outputs with various scenarios have been incorporated into the model to properly deal with the uncertainties of GCMs. Numerous studies have focused on climate variable downscaling via LARS-WG.
In this regard, in [5] they used LARS-WG with a HadCM3 GCM model under RCP2.6, RCP4.5, and RCP8.5 scenarios. The result indicated an increase of 0.77 °C for the average temperature and a decrease of 11 mm for the precipitation, respectively. In [6] they utilized the LARS-WG to simulate climate change conditions for the 2020. The results indicated a decrease in annual precipitation and a tendency towards a warmer climate over the basin of Zolachay in the Urmia Lake basin at northwestern Iran. In [7] they anticipated future climate change conditions in three arid locations of India by contrasting the baseline value with the downscaled output of LARS-WG based on seven GCMs. According to the results, ensemble means of rainfall prediction under seven GCMs showed a 9 to 17 percent increase over the basin. In [8] they utilized LARS-WG tools to analyze precipitation and temperature patterns in the historic future period over the Xiangjiang River Basin, China. The results showed that the annual precipitation pattern in the basin increased and will probably continue to increase in the future under four GCMs. In [9] they developed the LARS-WG downscaling model to evaluate precipitation and temperature predictands under the Representative Concentration Pathway (RCP8.5) scenario over the northwest of Iran. Results of the study showed that the temperature will increase by 0.1–1.3 °C and, also, precipitation will experience a decreasing trend by ten up to thirty percent by 2040.
Projection of precipitation and temperature for the future can be useful in assessing hydrologic process in a basin. In this regard, streamflow estimation can be developed using various hydrological models having benefited from downscaled hydro-climatic variables such as precipitation and temperature. Therefore, expanding a hydrological model for further water planning, management, and simulating future runoff based on climate change conditions is necessary. Hydrological models, regardless of structural diversity, are generally divided into three broad categories (i.e., black box or system theoretical models, conceptual models, and physically based white box models) [10]. Artificial neural network (ANN)-based hydrological models under the category of the black box can achieve optimal results in the situation where the target system is poorly defined and input data are incomplete [11]. The ANN is a precise predictive technique that is capable of detecting intricate nonlinear relationships. ANN has widely been utilized in order to model the nonlinear correlation between rainfall of the runoff process [4,12]. In this study, for assessing the impact of climate change in the near future, predictands, i.e., precipitation and temperature, as the climatic data of the downscaling models were fed into the ANN-based rainfall-runoff model. Various studies have shown that ANN-based hydrological models behave better than traditional hydrological models (conceptual, physically-based, or statistical models) in runoff prediction while access to physically based data of watersheds is limited [10,13].
In [4] they applied the ANN model to simulate the effects of climate change on the runoff over the East-Azerbaijan province of Iran. The results showed dramatic reductions in the flows. In [12] they developed a Rainfall-runoff model by ANN, which represented fairly proper ability to predict runoff for a semi-arid basin area. In [14] they focused on data mining techniques based on ANN and their application in runoff forecasting. The results demonstrated that the ANN models were able to provide a good representation of the hydrological forecast.
Due to the dynamic complexity of influential factors in water resource planning and management, considering the influential factors is of great importance. In this regard, SD has been used as a decision support tool to aid policymakers achieve sustainable plans, which can cope with climate change impacts appropriately. So, after evaluating climate change conditions for the future and simulating future runoff using an ANN-based rainfall-runoff model and considering sustainable planning, the SD tools were been utilized to address reliable IWRM.
SD can provide a comprehensive understanding of integrated sub-systems, which are the reason for the dynamic behavior of the whole system, and permit conducting multiple scenarios, which results in independent comparisons of numerous management strategies over time [15]. In [16] they utilized the SD Model to consider the specific factors which led to the declining trend of the Urmia Lake level. Based on their investigation, the main reason for inflow fluctuation over the Urmia lake was derived from climate change and overuse of water resources by 65%. In [17] they utilized the SD model in order to determine the water demand effects on the downstream flow. According to their result, adopting an efficient rule of water consumption to decrease the negative impacts of water distribution on Urmia Lake should be a top priority. In [6] they used an SD approach to determine the declining level of the Zola reservoir by simulating ANN rainfall-runoff models using the downscaled data based on (LARS-WG) downscaling tools. Results indicated that under the climate change condition, noticeable changes in the reliability of the Zola Reservoir operation were observed. In [18] they assessed the climate change approach and also SD to determine the sustainability of various scenarios over the Urmia Lake. According to the results, in order to restore the Urmia Lake level, stakeholders should implement several mitigation programs on water consumption altogether.
The Zarrine River basin (ZRB), as the main supplier of ecological discharge of Urmia Lake and also as the supplier of urban water of vicinal cities, is of great importance regarding the Urmia Lake Restoration Program (ULRP), which researchers benefited from in their studies [19,20]. Indeed, considering comprehensive research on the ZRB basin not only affects the water balance of ZRB, but also can influence on Urmia Lake’s reclamation [21].
The main procedure of this research relies on three steps. The first step is developing a downscaling model (i.e., LARS-WG) to obtain future climatic conditions of ZRB. The second step represents ANN-based rainfall-runoff modeling to determine ZRB runoff in the future. The third step demonstrates the SD approach to develop robust and flexible solutions for water resource management of the ZRB basin, where the comprehensive vision in sustainable developments under climate change impact and different policies is important. The main novelty of this study contributed to assess climate change impact on the water consumption of the ZRB basin, which provides an overview on sustainable development and discerns the water crisis over the basin.

2. Materials and Methods

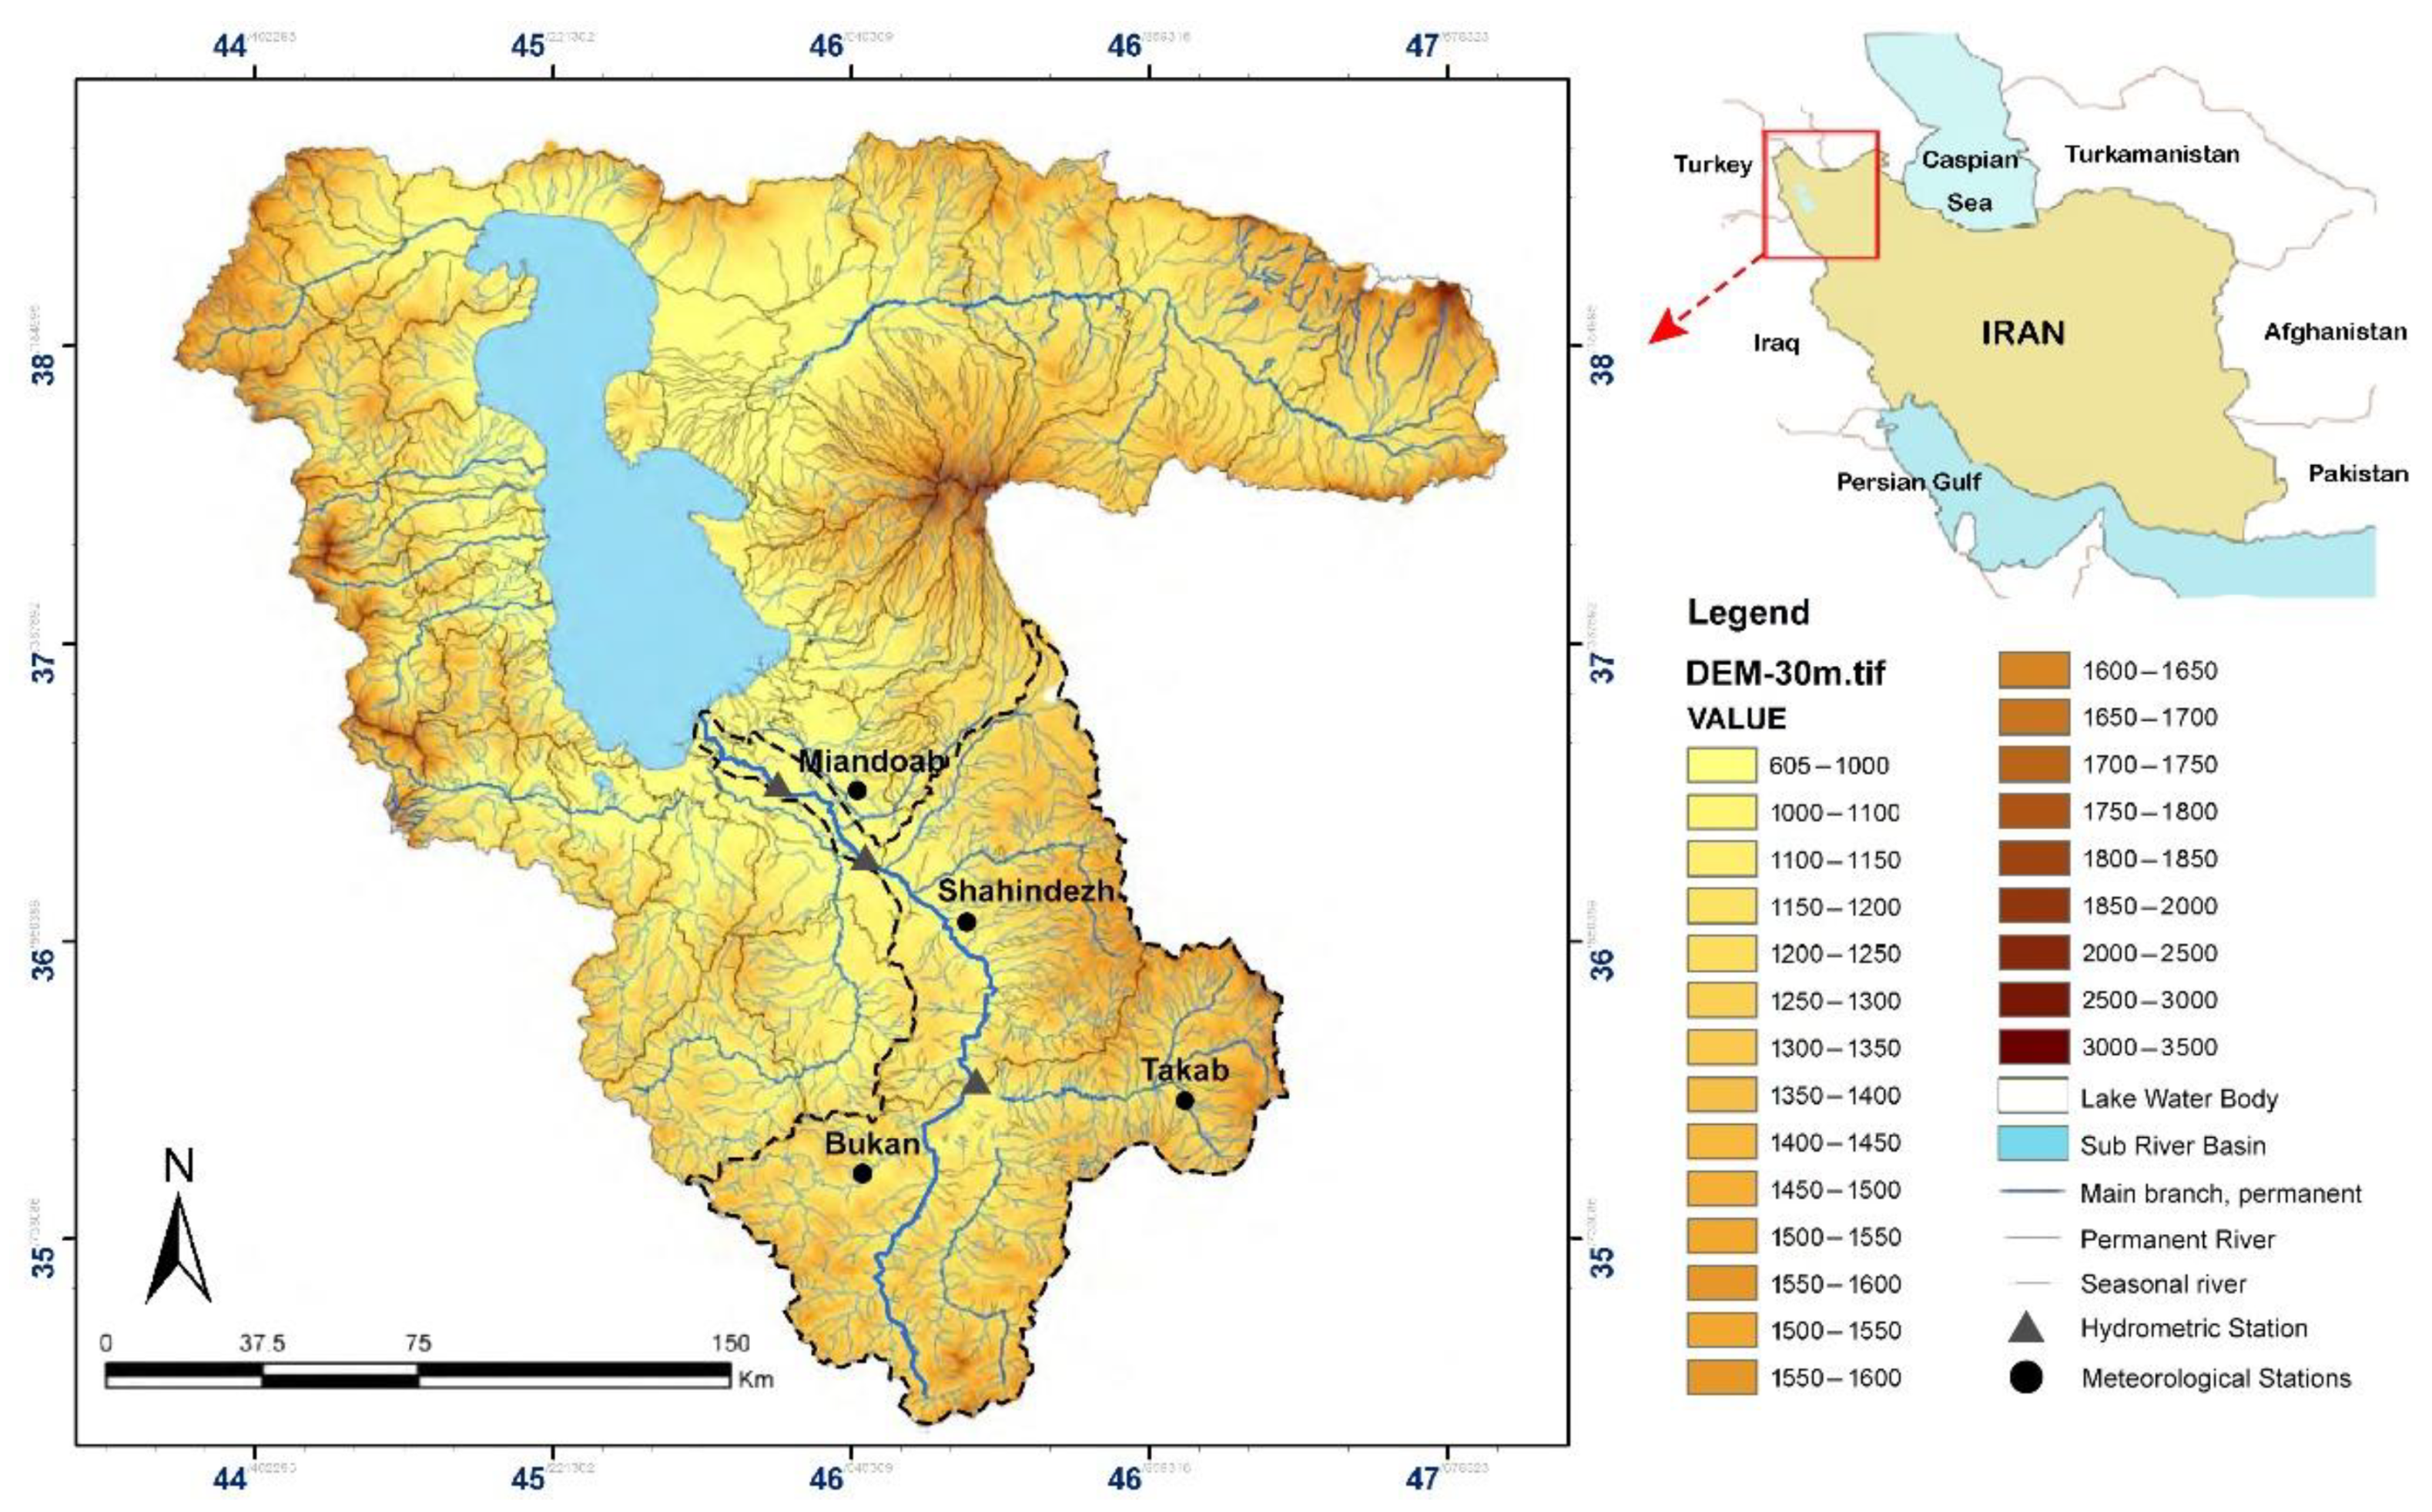
2.1. Study Area and Data

The Zarrine River Basin (ZRB) is one of the most substantial basins and an important inflow source of Urmia Lake, the largest saline lake in Iran. The ZRB, with a total area of 12,025 km2, is located in the southern part of the lake basin, between 45°46′ E to 47°23′ E longitude and 35°41′ N to 37°44′ N latitude and includes parts of Kurdistan’s provinces, with the four cities Miandoab, Shahindezh, Takab, and Bukan (see Figure 1). Generally, the study area encompasses a mountainous region and the annual precipitation and mean temperature are 250 mm and 15 °C, respectively. Overall, the weather is mild and fine in spring, dry and semi-hot in summer, humid and rainy during fall, and cold with snowfall in winter. Through the last decades, drying of the Urmia Lake has become the main environmental challenge with which the region is grappling. In this way, ZRB plays a critical role in the reclamation of this vital basin. Additionally, more than one-third of the area of the basin is cultivated, which includes crop and horticultural cultivated lands, and most of the water use is devoted to these horticultural cultivated lands. The irrigation efficiency for crop and horticultural cultivated lands is about 0.37 and 0.45, respectively, in the ZRB basin [20].
In terms of developing the downscaling model, large-scale historical climate data were considered by utilizing GCM models including European Consortium Earth System Model (EC-EARTH), Hadley Centre Global Environment Model version 2 (HADGEM2), Model for Interdisciplinary Research on Climate, version 5 (MIROC5), and Max Planck Institute Earth System Model (MPI-ESM), from Coupled Model Intercomparison Project 5 (CMIP5) under RCP4.5 and RCP8.5 scenarios (see Table 1). The baseline period of the study was 1975–2005, where 70 percent of the data (i.e., 1975–1995) was used to calibrate the downscaling model and 30 percent of the data (i.e., 1996–2005) was applied for validation purposes; moreover, the projection period was set to 2021–2040.
Four synoptic stations including the Takab, Bukan, Miandab, and Shahindezh stations were selected to provide observed precipitation and temperature data (see Table 2 and Figure 1).

2.2. Methods

The methodology comprised three steps to gain a sustainable water security system. The first step included downscaling by the LARS-WG approach under RCP scenarios, and the second step contributed to simulating future runoff via ANN model. In the last step, an SD approach was developed to provide a comprehensive view of the basin water resources planning according to the stakeholder’s demand and the accessible surface water, which are impacted by climate change. All the processes are illustrated in Figure 2.

2.2.1. LARS-WG Downscaling

To predict temperature and precipitation patterns of the study area in the future, the downscaling technique was considered by using GCM models including EC-EARTH, HADGEM2, MIROC5, and MPI-ESM under the RCP4.5 and RCP8.5 scenarios during 2021–2040 (See Table 1). The LARS-WG is a stochastic weather generator that produces synthetic, daily time series of climate variables. Regarding this, daily data are directly needed as input to the LARS-WG model [22]. The LARS-WG tools utilize a semi-empirical distribution to develop the approximate distribution of minimum and maximum temperatures, precipitation, and solar radiation.
ν i = min { ν : P ( ν o b s v ) ρ i }         i = 0 ,   1 ,   2 , , n
where p 0 reflects the probability resulting from observed data { ν o b s }. Two values including ρ 0 and ρ n . were set for each climatic vector as ρ 0   = 0 and ρ n   = 1 with corresponding values of v 0   = min { ν o b s } and v n   = max { ν o b s }. In order to properly estimate the extreme values of a climate parameter, some ρ i were set close to 0 for extremely low values of the index and close to 1 for extremely high values; the residual ρ i values were evenly distributed on a probability scale [23].
The LARS-WG method uses minimum and maximum temperature and precipitation, as well as radiation and/or sunshine, as predictors to generate local scale weather data (i.e., temperature and precipitation), which were considered as predictands in this study.

2.2.2. Artificial Neural Network

In terms of predicting the runoff for the ZRB basin in the future, the ANN-based method was used. The ANN is defined as a data-processing system with a parallel distributing feature inspired by the biological neural system of the human brain [24]. ANN is capable of simulating nonlinear and time-varying features of the variables at different scales and accepts multiple inputs that contain various characteristics [25].
Seventy percent of the input and target data were considered for training; the remaining thirty percent were utilized for verification. A two-layer feed-forward neural network (FFNN) was utilized, which is based on a linear combination of the input variables transformed by a nonlinear activation function. The Levenberg-Marquardt algorithm was applied for training the network. The FFNN model operates as in Equation (2).
y ^ = f 0 [ j = 1 m w k j f h f h ( i = 1 m n w j i x i + w j 0 ) + w k 0 ]  
where w j i represent the weight within the hidden layer connecting the i th neuron in the input layer and j th neuron in the hidden layer, w j 0 shows the bias for the jth hidden neuron, f h   is the activation function of the hidden neuron, w k j   is the weight within the output layer connecting the j th neuron in the hidden layer and the k th neuron in the output layer, w k 0   is the bias for the kth output neuron, and f 0 is the activation function for the output neuron. The main goal of the training algorithm was to minimize the sum of the square errors of the network is represented in Equations (3) and (4).
e k = y k y ^ k
E = 1 2 k = 1 n ( e k ) 2  
where e k represents the error of network for pattern, k , n are the number of patterns selected for training,   y k is the target value of the p th pattern, and y k   is the output value of the network for the p th pattern.
After the training process, the simulation step was complemented to predict future runoff according to projected precipitation and temperature data acquired from the LARS-WG downscaling method. Then, the obtained runoff time series for the future was fed into the SD model to assess water balance in the future.

2.3. System Dynamic

Dynamic modeling is applied as a proper technique to develop a mental model that is derived from systematic thoughts. The SD tool is a successful method that can operate as the joined approach for producing an equilibrium between simplification and realism. The tools which are considered as a branch of systematic thought can be utilized in complicated systems modeling and applying uncertain issues in system management [26]. The main variables in the SD relevant to stocks and flows can function as auxiliaries or constants. Stocks that are state variables can be variable by fluctuating their inflows or outflows. Flow variables are defined as a rate to change the stock variables. Reports between levels and flows are associated with auxiliary variables. The stock value which contains an inlet and outlet at any specific time (t) is considered as Equation (5).
S t o c k ( t ) = t 0 t n [   I n f l o w ( t ) O u t f l o w ( t ) d t + S t o c k ( t 0 ) ]
where Stock(t) represents stock at time t; Inflow(t) shows inflow at time t; Outflow(t) expresses outflow at time t, and Stock(t0) is stock at a time (t0).
The main purpose of the SD approach in this study was to alleviate the stress on the water resource system over the basin and implement various policies to reach sustainable goals under climate change impacts.
The ZRB model consists of three major factors: 1. Water balance, 2. Population, and 3. Groundwater level. The water balance factor is the main factor in the model defined as the accumulation of supply and demand factors. The essential parameters associated with these sub-categories including supply and demand are runoff and total demand respectively. The runoff parameter, which was obtained from an ANN-based rainfall-runoff model for the future, plays a key role in providing net supply for water balance. Owing to the result of ULRP (2014), agriculture is prime and substantial water is consumed over the basin [20]. When it comes to the agriculture sector, all the product (i.e., horticulture, crops, animal-husbandry) were considered as (Tons) and the consumptions were considered as (MCM). Water demand for consumption variables was calculated by utilizing NETWAT software, which utilized the FAO–Penman-Monteith method. After the agriculture sector, considering the drying of the Urmia Lake, environmental demand is the prime output of the model, whereas according to ULRP (2014)’s investigation, the Zarrine river provides forty percent of Urmia Lake’s income [20].

2.3.1. The Key Variables of the SD Model

The causal loop diagram (CLDs) is a causal diagram that helps in visualizing how different variables in a system are causally interrelated. The diagram consists of a set of words and arrows and a narrative which describes the causally closed situation the CLD describes. The CLD of the water resources system includes the water balance and its sub-systems such as population, groundwater volume, water demands, and climate change impact, which are represented in Figure 3, where the elements of the system are linked by arrows with negative and positive polarities. A positive link shows the parallel behavior of variables. In terms of having an increase in the cause variable, the variable that is affected also increases, while a decrease in the cause variable represents a decrease in the affected one. A negative link implies an inverse linkage between variables [27].
The next step encompasses the variables involved in the model. Parameters include two different types of endogenous and exogenous data. Indeed, endogenous variables included the variables that exist within the boundary of a system while exogenous variables exist outside the system. From the technical point of view, an endogenous variable is a kind of variable that affects (arrows in) and is affected (arrows out) by the system. On the other hand, an exogenous variable is affected by the other variable. In the simulation model, all the required data of Table 3 were set to a monthly time scale and, also, the prerequisite hydrological data such as runoff in future were imposed onto the Vensim environment based on the outputs of the ANN rainfall-runoff model. All the essential information about the variables and their resources and units are listed in Table 3.
In terms of characterizing the system processes, by utilizing CLDs, the stock-flow diagrams in the Vensim software environment were developed for the study basin (see Figure 4). All the variables and related sources and units are listed in Table 3.

2.3.2. Proposed Scenarios for System Dynamic Model

One of the catastrophic events in the history of Iran’s water resources management during the current century is the drying of Urmia Lake due to mismanagement. ZRB, as the most significant water resource of the Urmia Lake basin, is the most substantial supplier of the basin for stakeholders in the agriculture, environment, and drinking water sectors. Therefore, adaptation policies to reduce water consumption and save as much as possible in this basin are one of the main targets of suppliers. Among the different scenarios that can be related to the factors affecting the basin water resources situation, five impartial and significant restoration plans were considered from various plans of ULRP (2014) to increase the trend of water balance over the basin [20]. The influential plans are represented as follows:
  • Plan 1. Impact of decreasing agriculture product and shifting irrigation efficiency
Agriculture is a water-related sector and because of its high-water demand feature, managing and allocating water in this basin is essential. Albeit, from the farmers’ point of view irrigation, could result in economic concern. Therefore, implementing an efficient policy for achieving sustainable agriculture is an inevitable step for assessing environmental sustainability in the basin [28]. Increasing the efficiency of irrigation and decreasing the agricultural product simultaneously is considered as a first restoration plan. In this way, a ten percent reduction policy for decreasing agriculture products and shifting irrigation efficiency was considered.
  • Plan 2. Impact of Cloud-Seeding
By applying a cloud-seeding approach, precipitation patterns over an area could be increased for making a significant contribution toward water concerns. Consequently, runoff inflow will be increased to the ZRB basin. Despite the uncertainty of the cloud-seeding method due to the climatic pattern of the basin and type of clouds, up to a seven percent increment of annual precipitation is assumed for the basin according to [29].
  • Plan 3. Population control and household consumption reduction
Due to the disparity of domestic consumption per capita in Iran with global average values (average per capita consumption in European countries is about 200 L per person) and the urgent need for environmental awareness to reduce domestic consumption, the ten percent reduction policy was considered in order to mitigate the water use in domestic consumption.
  • Plan 4. Reducing meat and animal-husbandry production
Water saving is important in the livestock sector owing to the importance of virtual water and water footprint. Numerous liters of water are needed to produce each kilogram of meat. Therefore, due to the current water crisis and water utilization of the basin, it seems reasonable to increase public awareness in reducing meat consumption. In this way, a consequent thirty percent reduction in water consumption of the animal-husbandry sector would be beneficial.
  • Plan 5. Groundwater consumption control
The fifth plan involves a reduction of groundwater withdrawal by up to twenty percent on fertile lands and the elimination of drilling illegal wells and unauthorized use, which would result in increasing groundwater levels over the basin.
In this study, the admissibility of above-mentioned plans under climate change impact considering the runoff quantity of Zarrineh River in the future was assessed.

2.4. Evaluation Criteria

Due to examining the efficiency of the proposed downscaling techniques as well as the ANN rainfall-runoff model, through the training and validation steps, two criteria containing root mean square error (RMSE) and Determination Coefficient (DC) were utilized.
RMSE demonstrated the degree of coincidence between observed and simulated values, which is the sample standard deviation of the differences among observed and calculated values. The range of RMSE ranges from 0 up to ∞, whereas with a reduction in RMSE, the efficiency improves. If the RMSE values tend to be 0, the performance of the model is well evaluated.
R M S E = i = 1 N ( R i Z i ) 2 N  
where N is the total number of observations and Ri and Zi are observed and calculated values, respectively.
Moreover, DC is being used to determine the precision of forecasts. It measures how well-observed results based on their proportion of total variation are replicated by the proposed model and it ranges from −∞ to 1 (Equation (2)). The closer DC is to one, the higher the accuracy of the model.
D C = 1 i = 1 T ( O i C i ) 2 i = 1 T ( O i O ¯ ) 2
Moreover, three evaluation criteria were considered for assessing the reliability of the SD model, including the boundary adequacy test, behavior sensitivity test, and extreme condition test.
The Boundary Adequacy Test is applied if the model contains the relevant structural relationships that are necessary and sufficient to satisfy the model’s purpose. Consequently, the boundary adequacy test inquires whether the chosen level of aggregation is appropriate and if the model includes all relevant aspects of the structure [30].
The behavior sensitivity test examines whether or not plausible shifts in model parameters can cause a model to fail behavior tests previously passed. To the extent that such alternative parameter values are not found, confidence in the model is enhanced [30].
In the extreme condition test, the modeler assigns extreme values to selected model parameters and compares the generated model behavior to the observed or expected behavior of the real system under the same extreme conditions [30].

3. Results and Discussion

3.1. Downscaling and Projecting Predictands

The performance of the LARS-WG in downscaling of precipitation and temperatures according to the EC-EARTH, HADGEM2, MIROC5, and MPI-ESM models as the average of the stations are reported in Table 4. The results manifested the high performance of temperature in comparison with precipitation, which is in line with other studies such as [31,32,33]. The fact beyond this result can relate to the deterministic entity of temperature time series and the stochastic property of the precipitation phenomenon, which occurs randomly. According to the results at Table 4. The HadGEM2 model showed the highest performance for downscaling temperature, while theMIROC5 model demonstrated weak performance in downscaling it. Unlike temperature, the downscaling results for precipitation showed no significant fluctuation pattern among various GCMs.
After developing the downscaling model, precipitation and temperature variables for the 2021–2040 period under RCP4.5 and RCP8.5 scenarios were implemented (see Figure 5). According to the results, by 2040, the temperature increasing trend will be 0.47 °C and 0.91 °C under RCPs 4.5 and 8.5, respectively. Therefore, under the pessimistic scenario of RCP8.5, the mean temperature change will be more severe than the anticipated temperature under the intermediate scenario of RCP4.5. Moreover, it is noted that the model outcomes are consistent with the results of the (Sarindizaj and Zarghami, 2018) study, which indicated an increasing trend for temperature under A1B, A2, and B1 scenarios over the Urmia Lake for the period of 2011–2030 [18].
The result of precipitation projection for future is depicted in Figure 5, where 3.5% and 14% decreases for precipitation under RCP4.5 and RCP8.5 were observed by 2040. Overall, considering the average of both scenarios, the precipitation time-series will have a decreasing trend.
Figure 6 illustrates the monthly fluctuation of precipitation in 2040, where the annual precipitation will be reduced between May and September, mainly in the summer when the basin requires more water. As a result, the shortfall in precipitation during summer will increase water stress, which can lead to the reduction of water in runoff and consequently water access in various sectors over the basin. Therefore, in order to assess the ZRB’s water accessibility in the future, the results of the projection for the future under the average of RCP4.5 and 8.5 scenarios were selected to handle the climate change over the basin, which is more plausible.

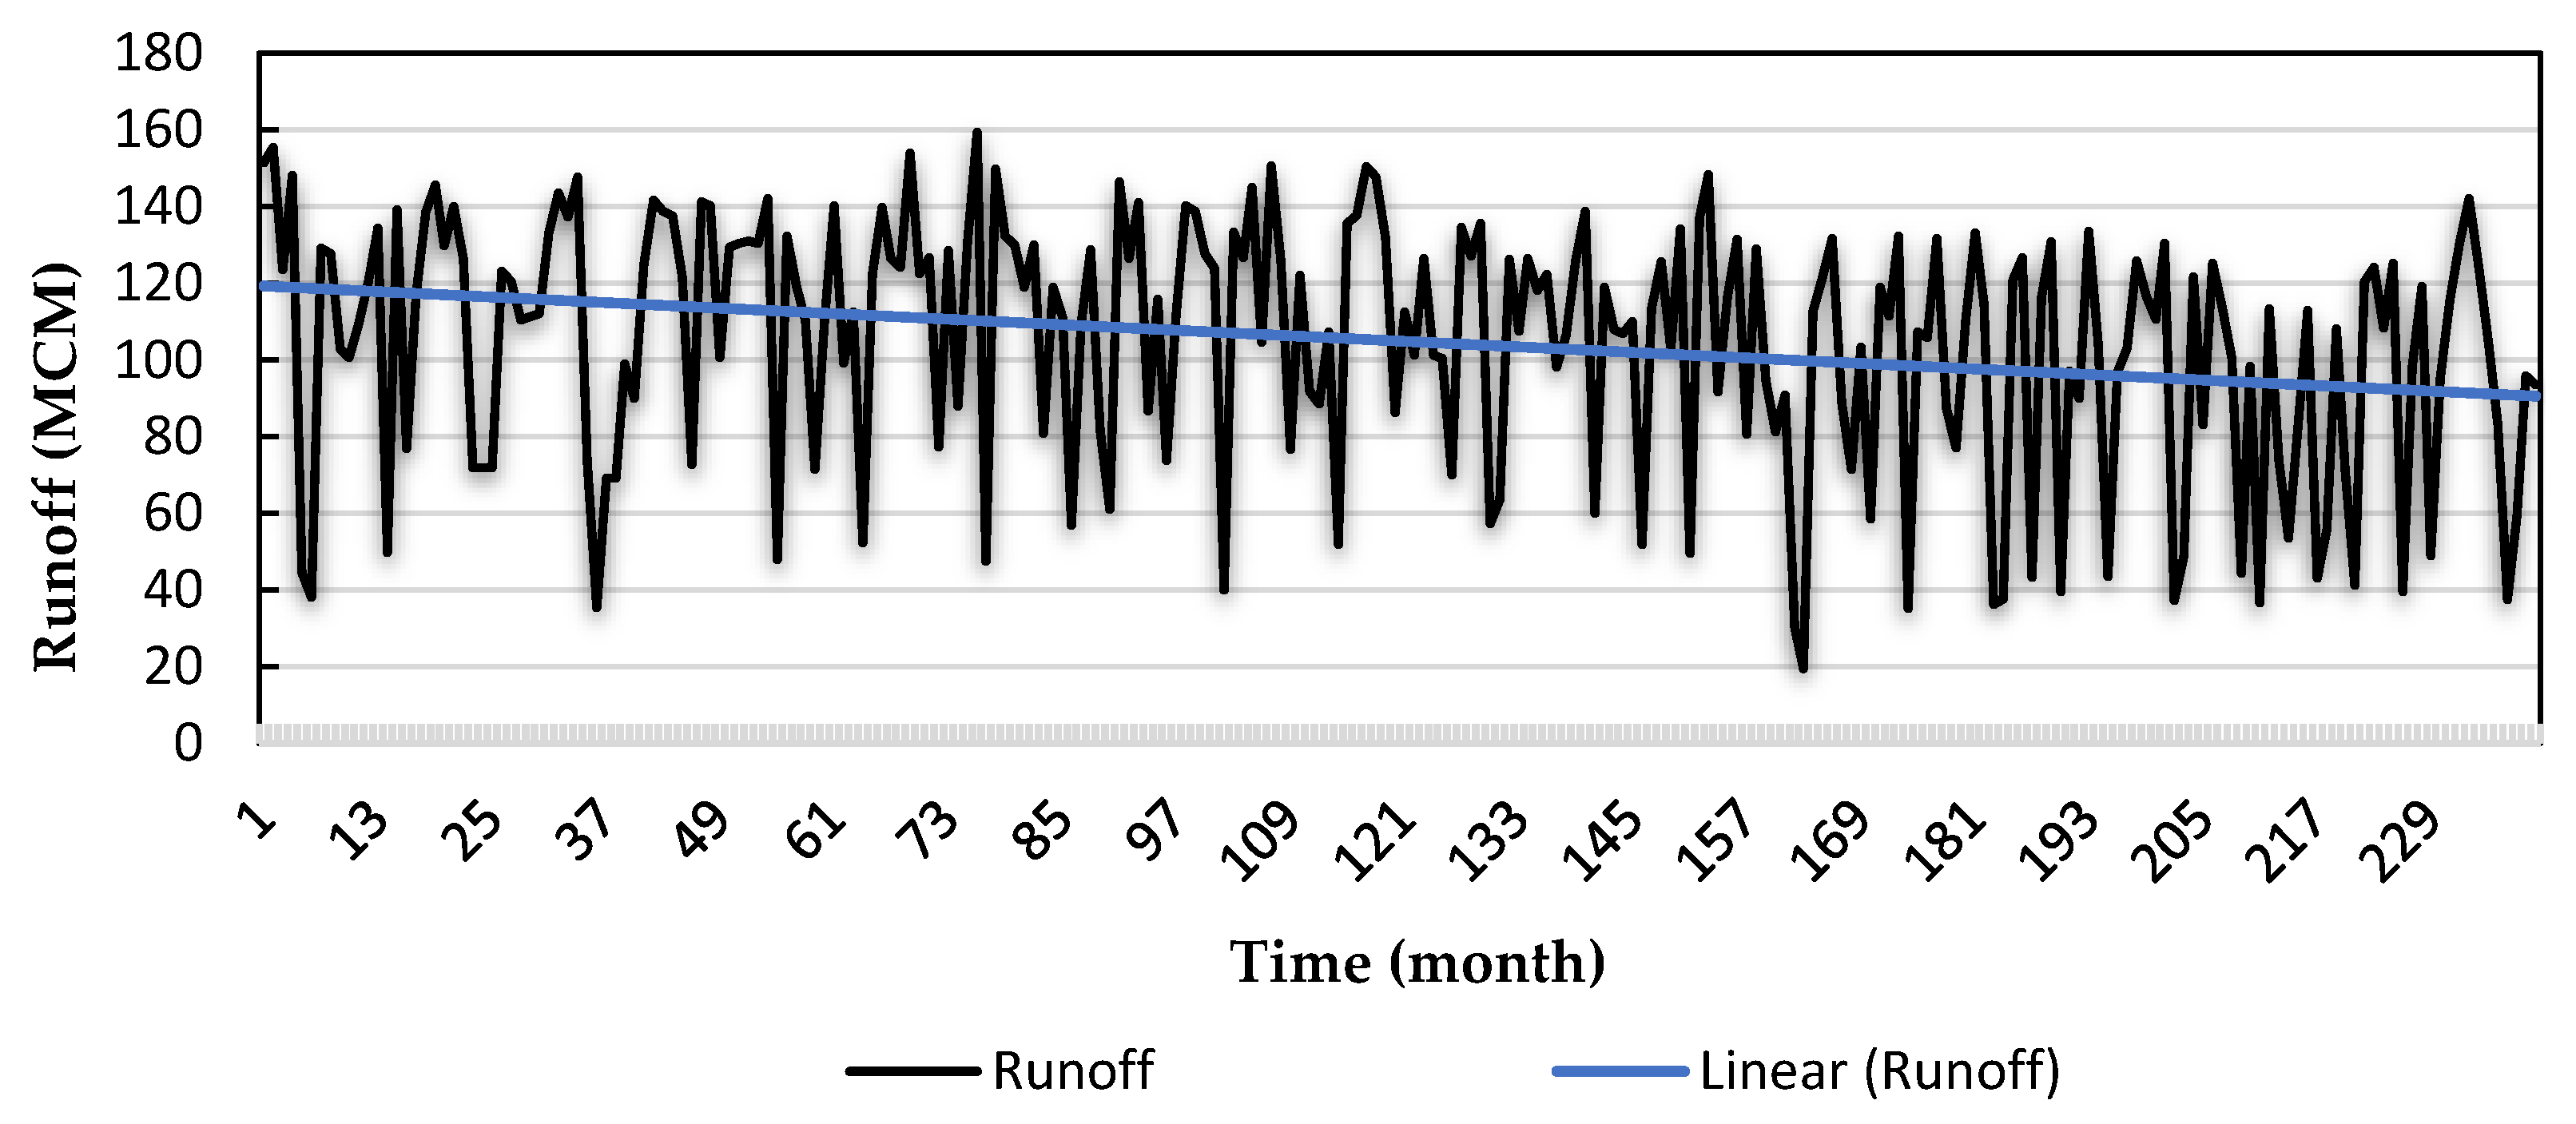
3.2. Rainfall-Runoff Model

The link between climate change impact on precipitation and temperature and surface runoff was developed by the ANN framework. In this way, the average values of precipitation and temperature over the stations were obtained from the LARS-WG model under the RCP4.5 and 8.5 scenarios and fed into the ANN model as inputs to simulate the future runoff of the Zarrine River.
The first seventy percent of the data was used for the training of model and the remaining thirty percent was used for validation. The two-layer feed-forward neural network with a backpropagation algorithm and the Levenberg–Marquardt scheme were used to model ZRB runoff. Different hidden neurons based on trial-and-error method, up to 500 epochs, were examined. The tabulated results in Table 5 showed that the efficient rainfall-runoff model performance was 0.69 and 0.51 in term of DC for training and validation steps. Figure 7 illustrates a simulated runoff timeseries which, similar to future precipitation patterns, has a decreasing trend.
According to the decreasing trend of runoff in ZRB impacted by climate change at the basin, it is necessary to have optimal water resources management among the stakeholders of ZRB. To this end, the SD model using Vensim software was developed according to water consumption reduction scenarios (restoration plans) proposed by [20] stated in the material and methods section.

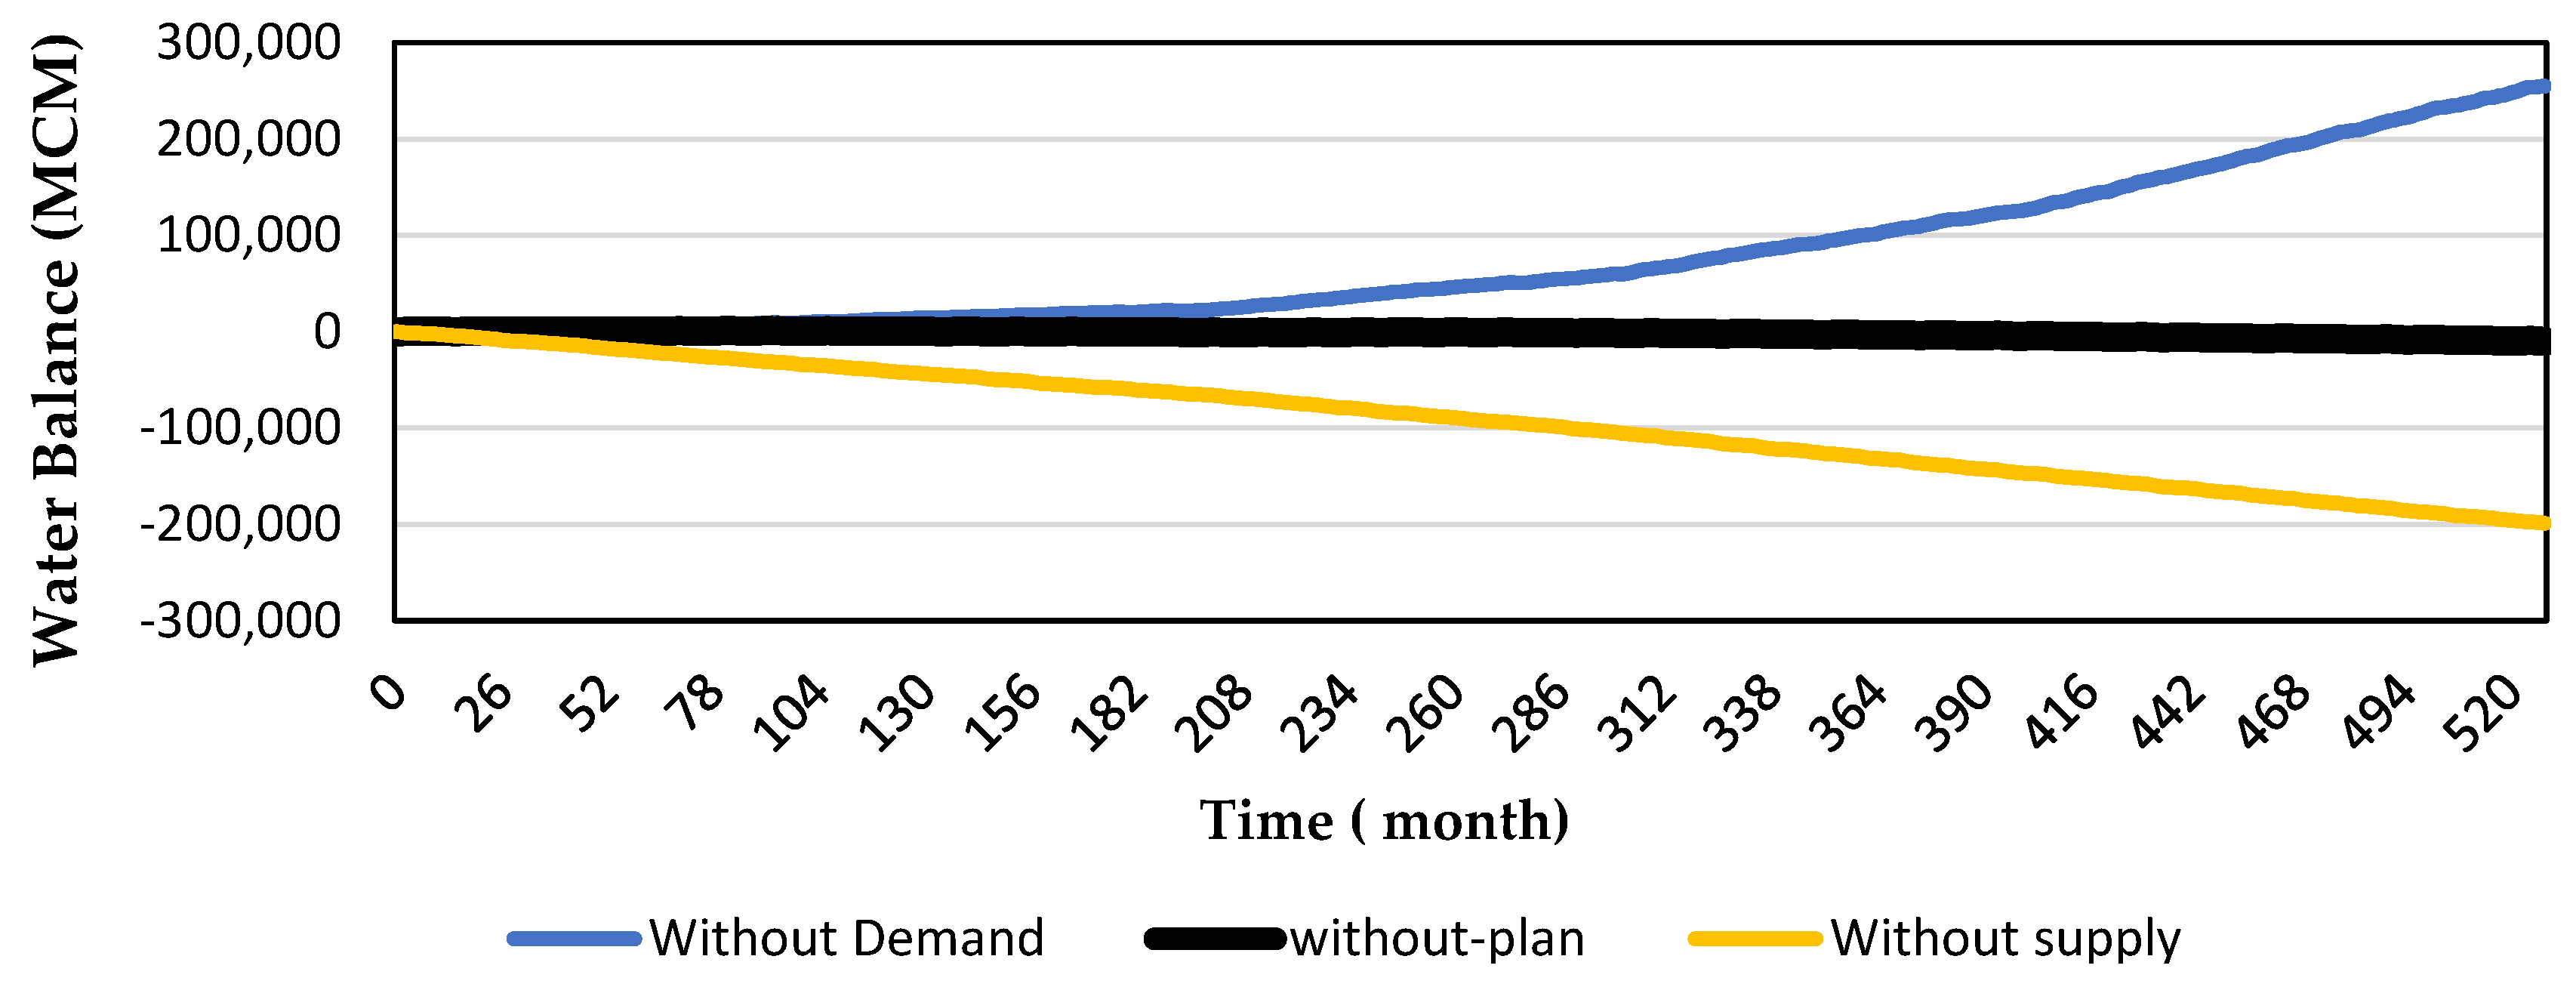
3.3. System Dynamic Model under Different Scenarios

To evaluate the performance of the Vensim model, the boundary adequacy test, extreme condition test, and behavior reproduction test were considered.
In the boundary adequacy test, by evaluating and representing the endogenous and exogenous variable of the model as given in Table 3, the accuracy of the model structure was verified.
Assessing extreme condition tests resulted in increasing the SD model structure reliability over a wide range of circumstances. In the extreme condition test, demand at the SD model was assumed as equal to zero and infinity. Hence, the inputs of the model in the absence of demand would decline and rise progressively, as shown in Figure 8.
In the behavior sensitivity test, simulated models’ behavior was compared with historical data. The simulated vs observed values for the ground-water level of the basin are illustrated in Figure 9. The value of RMSE and DC were obtained as 0.36 and 0.91, which suggests the acceptability of the results. Furthermore, after approving the model’s verification, the impact of restoration plans comes to the fore.
Due to the substantial importance of the ZRB in Urmia Lake basin and the importance of the dry land of the lake, policies to reduce water consumption and save as much as possible in this basin are one of the main suppliers’ targets. As mentioned in methods among different scenarios affecting the basin, five impartial restoration plans were considered to increase the trend of water balance over the basin.
The results of influential plans demonstrated that the agriculture section is the chief driver of the water shortages in this basin; so, due to its high-water demand feature, considering efficient policies that can reduce water consumption in this sector would result in massive water saving. These policies are improving the irrigation system, implementing influential policies in some cultivated land, and reducing some agricultural products, which led to a thirty percent decrease in water consumption based on SD outputs. It is noted that educating farmers on how to decrease water consumption as well as making them aware of catastrophic consequences of water shortage in the future would encourage farmers to adapt and consider restorations plans.
Hence, according to Figure 10, Plan 1. (i.e., Impact of decreasing agriculture product and shifting irrigation efficiency) is the most effective plan to reduce water consumption in the basin. The remaining plans, including Plan 2. Impact of Cloud-Seeding, Plan 3. Population control and household consumption reduction, Plan 4. Reducing meat and animal-husbandry production, and Plan 5. Groundwater consumption control, are not be as influential as Plan 1. However, according to Figure 10, the ensemble of plans showed the most effective performance, while individual plans could not meet the requirements of the basin.

3.3.1. Ensembled Plan

Due to the inefficiency of applying individual scenarios in achieving sustainable development goals, the simultaneous performance of plans was considered in modeling, which was named as the ensemble model of plans. According to Figure 10, the ensemble approach, as the novelty of the current study, is considered to reach a development goal for the future over the basin by taking advantage of the cumulative effect and synergy of different scenarios. It is vividly clear that none of the selective models including mitigation in the agriculture section, cloud seeding, domestic consumption control, reducing meat consumption, and groundwater withdrawing would be beneficial for restoring the ZRB water level. These outcomes confirm the results of the study by [21], which showed increasing the irrigation efficiency and reducing the agriculture area were the most influential plans; however neither of the policies resulted in the restoration of the Urmia Lake level. Hence, considering all the mentioned plans, water level could remain in equilibrium after a 6-year period according to SD results, as shown in Figure 10, and to maintain equilibrium between local supply and demand and to preserve it, a cooperative spirit is vital among all the related authorities. In this regard, only ensemble of plans could be effective whereas multiple management practices incorporate instead of concentrating on just one plan.

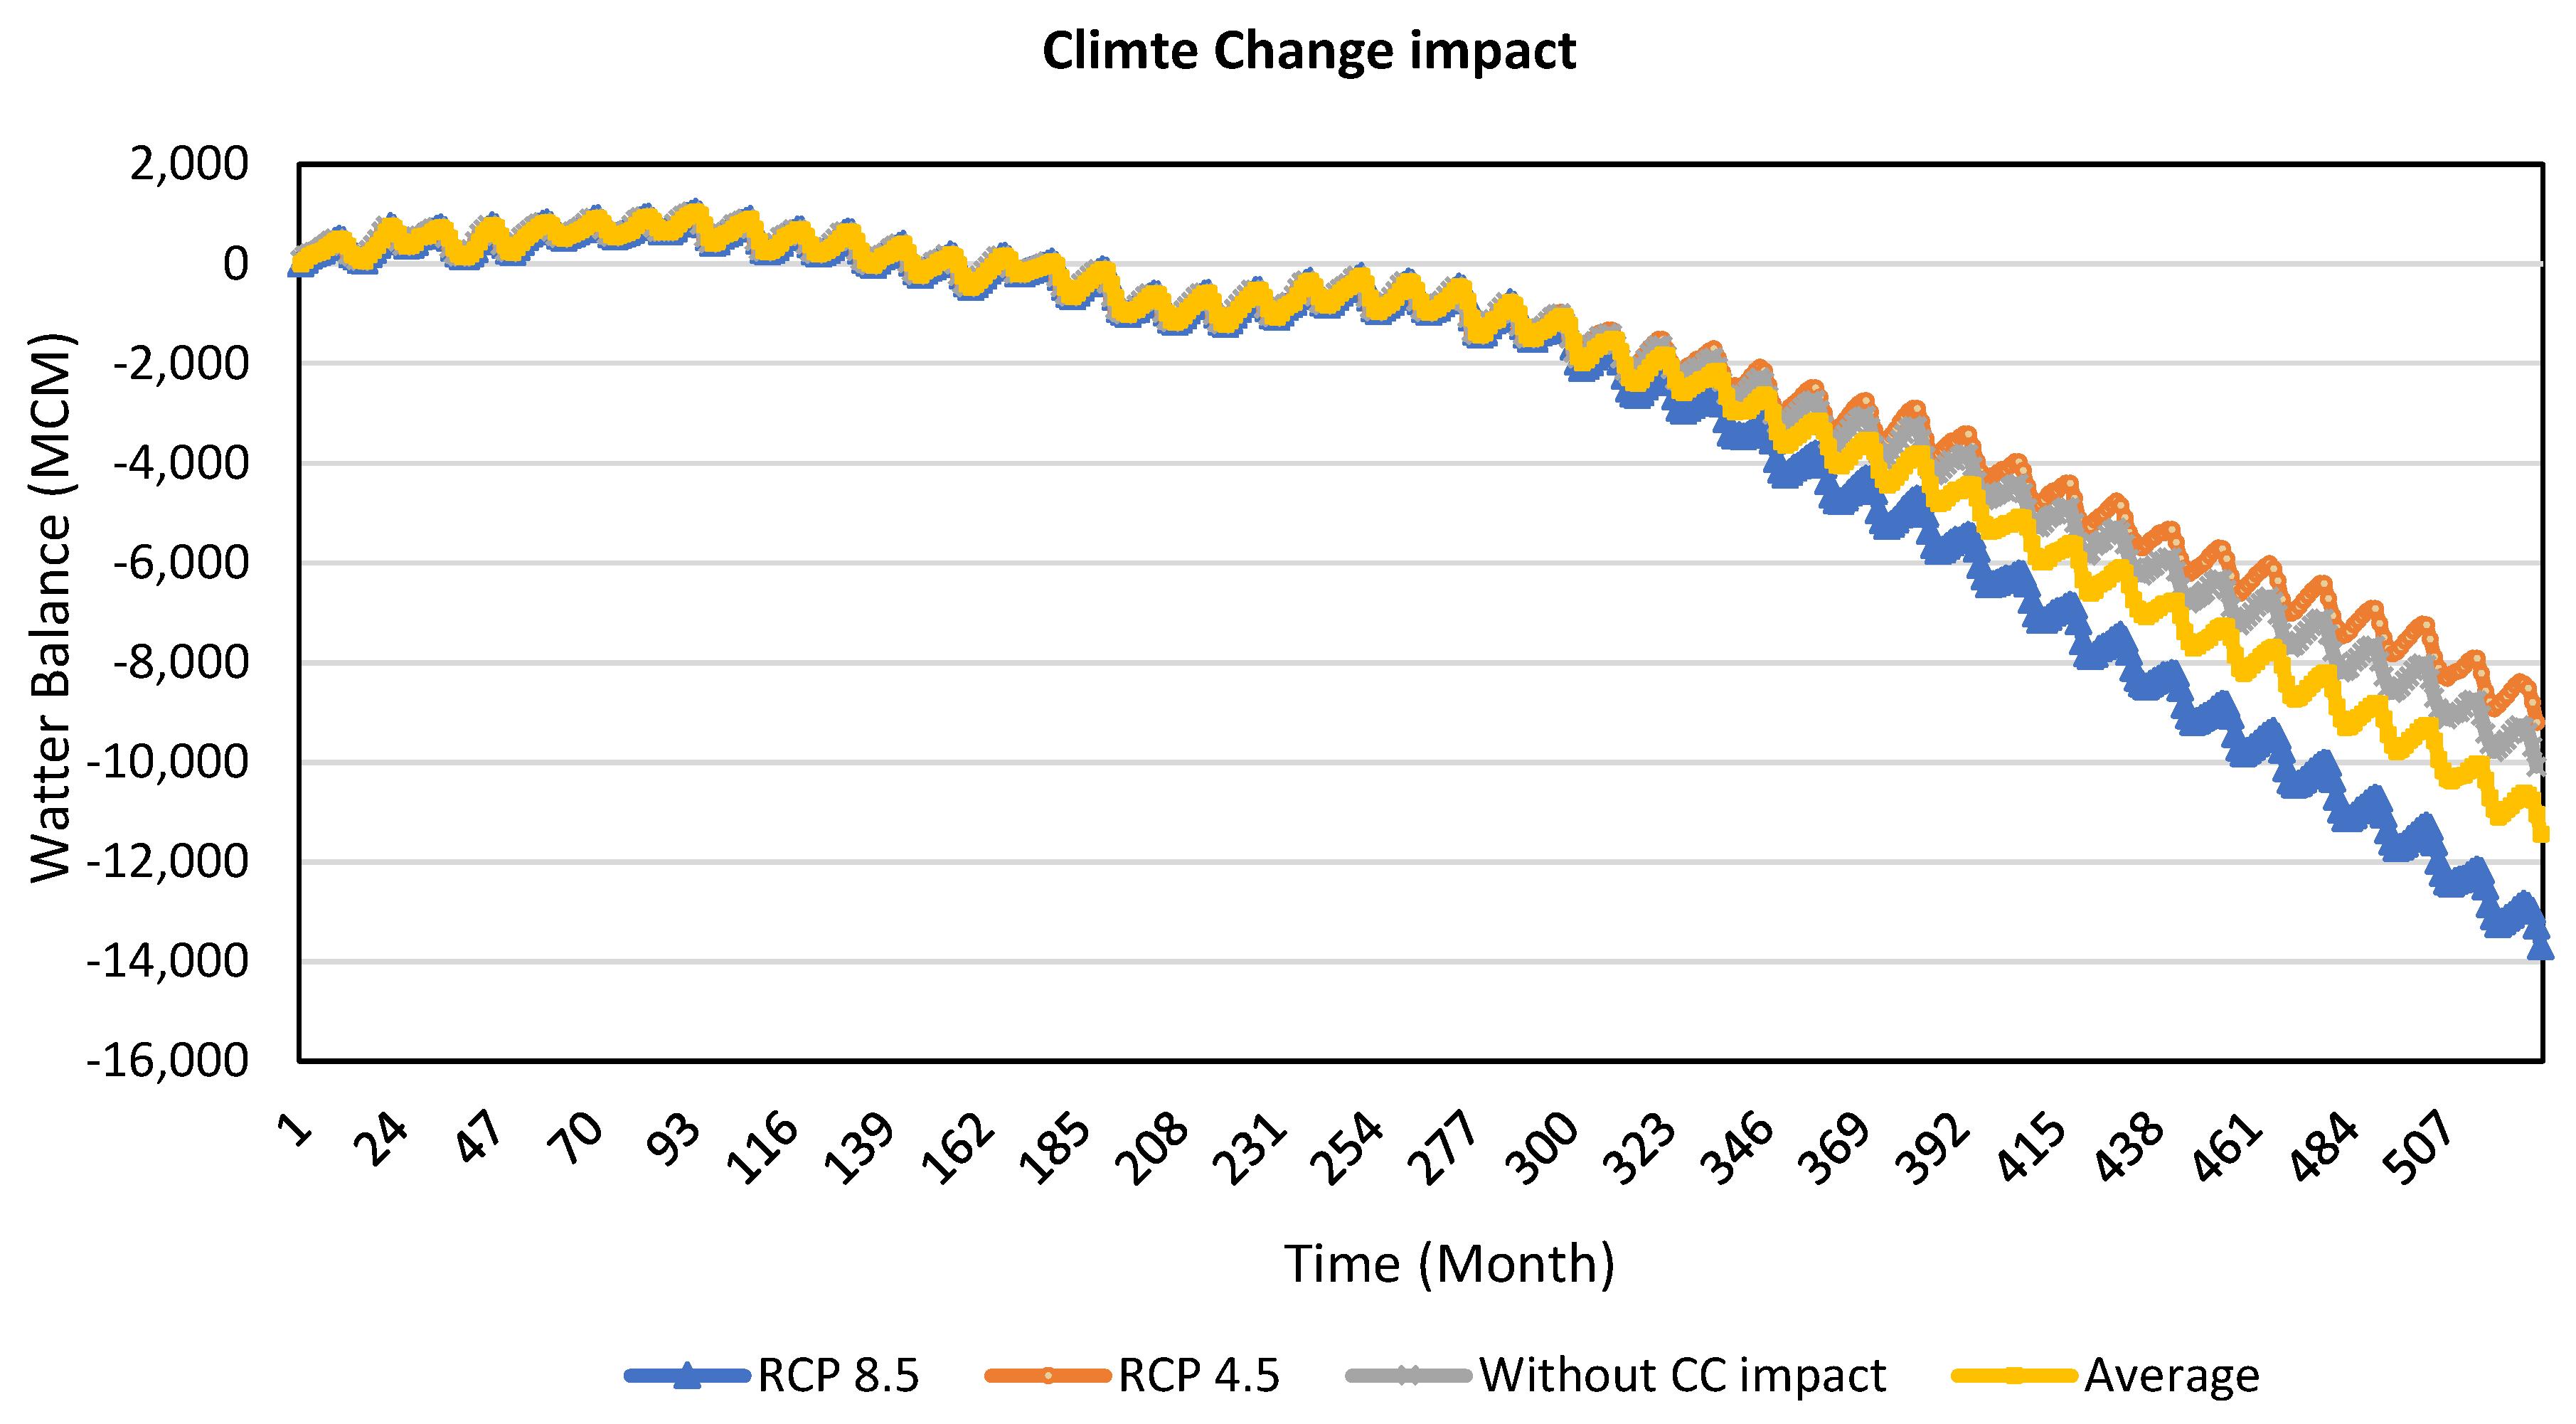
3.3.2. Contribution of the Climate Change Impact on the ZRB Runoff

In terms of investigating the impact of climate change on the ZRB runoff, the “Impact of Climate Change” parameter was added to the system dynamic model (shown in Figure 11). As mentioned, in order to calculate the ZRB runoff, the outputs of the LARS-WG were utilized in the ANN-based rainfall-runoff model, and the results were used as an input for the SD model as a future simulated runoff. Hence, the water balance in basin was simulated at the SD model considering climate change impact and the constant conditions of the baseline. Results of the SD model in Figure 11 demonstrate that under the pessimistic scenario of RCP8.5, a drastic decrease was observed in the water balance of the basin; however, based on the intermediate scenario of RCP4.5, the situation was near to of baseline conditions without considering the climate change impact. Based on the resource management capacity of water resources, the occurrence of pessimistic scenarios seems to be more probable; however, to avoid the pessimistic view, the average of two scenarios is considered as a negative effect of climate change in the basin, which is equal to a 7% reduction in water supply of ZRB.

4. Conclusions

This study relied on water resource management to have a visual vision toward supplying water requirements of the ZRB, and was based on multi-criteria decision-making under climate change impact. According to the importance of ZRB in the basin, which is the main water supplier of the Urmia Lake and is one of the chief parts of the agriculture sector of North-West Iran, it is of great importance to have focused on this basin due to the increasing water demand of the basin on the one hand and more limited water resources due to the impact of climate change on the other hand.
For evaluating the future climate change pattern of the study area, the LARS-WG downscaling model using EC-EARTH, HADGEM2, MIROC5, and MPI-ESM GCM models was developed under RCP4.5 and 8.5 scenarios for 2021–2040. According to the average results of RCP4.5 and 8.5 scenarios, it was determined that the temperature of the basin will increase by 0.7 °C and the precipitation will decrease by 9%. The decreasing trend of precipitation in the future of the basin can influence the hydrologic cycle, which subsequently impact river flows, leading to water stress in the basin. Hence, an ANN-based rainfall-runoff model was developed to model the future Runoff of the Zarrine River. Therefore, the results of this part of the study would be beneficial for managers in order to take sustainable actions in securing and preserving the water supply. Because of the dynamic complexity of water resource management and implementing influential factors, the SD was developed to simplify a comprehensive understanding of integrated sub-systems. The ZRB’s SD model produces an integrated simulation of the intricate part of the basin according to the impact of various restoration plans, including Plan 1. Impact of decreasing agriculture product and shifting irrigation efficiency, Plan 2. Impact of Cloud-Seeding, Plan 3. Population control and household consumption reduction, Plan 4. Reducing meat and animal-husbandry production, and Plan 5. Groundwater consumption control, where the ensemble of plans could meet the requirements of basin supply. So, the results of study, based on various scenarios, can help managers and stakeholders to have a wide vision toward not only the ZRB but also for the Urmia Lake drying out crisis. Optimum allocation of water resources and planning to improve the present situation to meet the requirements of the future is an inevitable step to reach sustainable development goals. Additionally, the climate change impact, which is the main novelty of this study, was evaluated over the ZRB runoff. The contribution of the climate change impact on the future runoff was reported as a 7% decrease, applying the average of climate scenarios over the basin. Although the climate change impact over ZRB runoff in comparison to agriculture sector demand was negligible, by paying attention not only to the agriculture sector, which is the most essential sector, but also to other sectors simultaneously, sustainable development goals can be achieved.
It seems that in order to fulfill the requirements of water resources to get through the crisis, a widely accepted consciousness is required to act properly. Precise and reliable water resource planning is the foremost management issue to ensure an optimal water allocation system for the future.

Author Contributions

Conceptualization, A.H.B. and Y.H.; methodology, A.H.B.; software, A.J.S.; validation, E.A., A.J.S. and M.B.; formal analysis, A.J.S.; investigation, A.J.S.; resources, E.A.; data curation, A.J.S. writing—original draft preparation, A.J.S.; writing—review and editing, A.H.B., A.S.; visualization, A.J.S., A.S.; supervision, Y.H.; project administration, A.H.B.; funding acquisition, M.B. All authors have read and agreed to the published version of the manuscript.

Funding

This research received no external funding.

Acknowledgments

We are deeply grateful to West Azerbaijan Meteorological Organization for providing reliable and insightful data. We also appreciate the IPCC Data Distribution Center as we benefited greatly from their detailed and authentic data.

Conflicts of Interest

The authors declare no conflict of interest.

References

  1. Falkenmark, M. Water Management & Ecosystems: Living with Change; (Issue TEC Background Papers, 9); Global Water Partnership: Stockholm, Sweden, 2003; Available online: http://hdl.handle.net/10535/4993 (accessed on 12 February 2022).
  2. Teng, J.; Potter, N.J.; Chiew FH, S.; Zhang, L.; Wang, B.; Vaze, J.; Evans, J.P. How does bias correction of regional climate model precipitation affect modelled runoff? Hydrol. Earth Syst. Sci. 2015, 19, 711–728. [Google Scholar] [CrossRef] [Green Version]
  3. Gohari, A.; Eslamian, S.; Abedi-Koupaei, J.; Bavani, A.M.; Wang, D.; Madani, K. Climate change impacts on crop production in Iran’s Zayandeh-Rud River Basin. Sci. Total Environ. 2013, 442, 405–419. [Google Scholar] [CrossRef] [PubMed]
  4. Zarghami, M.; Abdi, A.; Babaeian, I.; Hassanzadeh, Y.; Kanani, R. Impacts of climate change on runoffs in East Azerbaijan, Iran. Glob. Planet. Chang. 2011, 78, 137–146. [Google Scholar] [CrossRef]
  5. Zarghami, M.; Fotookian, M.R.; Safari, N.; Aslanzadeh, A. Reservoir operation using system dynamics under climate change impacts: A case study of Yamchi reservoir, Iran. Arab. J. Geosci. 2016, 9, 678. [Google Scholar] [CrossRef]
  6. Rahmani, M.A.; Zarghami, M. The use of statistical weather generator, hybrid data driven & system dynamics models for water resources management under climate change. J. Environ. Inform. 2015, 25, 23–35. [Google Scholar] [CrossRef] [Green Version]
  7. Sarkar, J.; Chicholikar, J.R.; Rathore, L.S. Predicting future changes in temperature & precipitation in arid climate of Kutch, Gujarat: Analyses based on LARS-WG model. Curr. Sci. 2015, 109, 2084–2093. [Google Scholar]
  8. Ma, C.; Pan, S.; Wang, G.; Liao, Y.; Xu, Y.-P. Changes in precipitation & temperature in Xiangjiang River Basin, China. Theor. Appl. Climatol. 2016, 123, 859–871. [Google Scholar]
  9. Baghanam, A.H.; Eslahi, M.; Sheikhbabaei, A.; Seifi, A.J. Assessing the impact of climate change over the northwest of Iran: An overview of statistical downscaling methods. Theor. Appl. Climatol. 2020, 141, 1135–1150. [Google Scholar] [CrossRef]
  10. Nourani, V.; Baghanam, A.H.; Rahimi, A.Y.; Nejad, F.H. Evaluation of wavelet-based de-noising approach in hydrological models linked to artificial neural networks. In Computational Intelligence Techniques in Earth & Environmental Sciences; Springer: Dordrecht, The Netherlands, 2014; pp. 209–241. [Google Scholar]
  11. Poff, N. A hydrogeography of unregulated streams in the United States & an examination of scale-dependence in some hydrological descriptors. Freshw. Biol. 1996, 36, 71–79. [Google Scholar]
  12. Kumar, P.S.; Praveen, T.V.; Prasad, M.A. Artificial neural network model for rainfall-runoff-A case study. Int. J. Hybrid Inf. Technol. 2016, 9, 263–272. [Google Scholar] [CrossRef]
  13. Samimi, M.; Jahan, N.T.; Mirchi, A. Assessment of climate change impacts on surface water hydrologic processes in New Mexico-Texas-Mexico border region. In World Environmental & Water Resources Congress 2018: Groundwater, Sustainability, & Hydro-Climate/Climate Change; American Society of Civil Engineers: Reston, VA, USA, 2018; pp. 273–279. [Google Scholar]
  14. Mishra, S.; Gupta, P.; Pandey, S.K.; Shukla, J.P. An efficient approach of artificial neural network in runoff forecasting. Int. J. Comput. Appl. 2014, 92, 9–15. [Google Scholar] [CrossRef]
  15. Wang, B.; Cai, Y.; Yin, X.A.; Tan, Q.; Hao, Y. An integrated approach of system dynamics, orthogonal experimental design & inexact optimization for supporting water resources management under uncertainty. Water Resour. Manag. 2017, 31, 1665–1694. [Google Scholar]
  16. Hassanzadeh, E.; Zarghami, M.; Hassanzadeh, Y. Determining the main factors in declining the Urmia Lake level by using system dynamics modeling. Water Resour. Manag. 2012, 26, 129–145. [Google Scholar] [CrossRef]
  17. Ghashghaie, M.; Marofi, S.; Marofi, H. Using system dynamics method to determine the effect of water demand priorities on downstream flow. Water Resour. Manag. 2014, 28, 5055–5072. [Google Scholar] [CrossRef]
  18. Sarindizaj, E.E.; Zarghami, M. Sustainability assessment of restoration plans under climate change by using system dynamics: Application on Urmia Lake, Iran. J. Water Clim. Chang. 2019, 10, 938–952. [Google Scholar] [CrossRef]
  19. Fathian, F.; Dehghan, Z.; Eslamian, S. Analysis of water level changes in Lake Urmia based on data characteristics & non-parametric test. Int. J. Hydrol. Sci. Technol. 2014, 4, 18–38. [Google Scholar]
  20. ULRP. Urmia Lake Restoration Programs. 2014. Available online: http://www.ulrp.ir/en/ (accessed on 11 February 2022).
  21. Zarghami, M.; AmirRahmani, M. A system dynamics approach to simulate the restoration plans for Urmia Lake, Iran. In Optimization & Dynamics with Their Applications: Essays in Honor of Ferenc Szidarovszky; Springer: Singapore, 2017; pp. 309–326. [Google Scholar] [CrossRef]
  22. Semenov, M.A.; Barrow, E.M. Use of a stochastic weather generator in the development of climate change scenarios. Clim. Chang. 1997, 35, 397–414. [Google Scholar] [CrossRef]
  23. Semenov, M.A.; Stratonovitch, P. Use of multi-model ensembles from global climate models for assessment of climate change impacts. Clim. Res. 2010, 41, 1–14. [Google Scholar] [CrossRef] [Green Version]
  24. Haykin, S. Neural Networks: A Comprehensive Foundation; Prentice Hall PTR: Hoboken, NJ, USA, 1994. [Google Scholar]
  25. Okkan, U.; Kirdemir, U. Downscaling of monthly precipitation using CMIP5 climate models operated under RCPs. Meteorol. Appl. 2016, 23, 514–528. [Google Scholar] [CrossRef] [Green Version]
  26. Forrester, J.W. World Dynamics, Wright; Wright-Allen-Press: Cambridge, MA, USA, 1971. [Google Scholar]
  27. Halbe, J.; Pahl-Wostl, C.; Sendzimir, J.; Adamowski, J. Towards adaptive & integrated management paradigms to meet the challenges of water governance. Water Sci. Technol. 2013, 67, 2651–2660. [Google Scholar]
  28. Warren, C.R.; Burton, R.; Buchanan, O.; Birnie, R.V. Limited adoption of short rotation coppice: The role of farmers’ socio-cultural identity in influencing practice. J. Rural. Stud. 2016, 45, 175–183. [Google Scholar] [CrossRef] [Green Version]
  29. DeFelice, T.P.; Golden, J.; Griffith, D.; Woodley, W.; Rosenfeld, D.; Breed, D.; Solak, M.; Boe, B. Extra area effects of cloud seeding—An updated assessment. Atmos. Res. 2014, 135, 193–203. [Google Scholar] [CrossRef]
  30. Senge, P.M.; Forrester, J.W. Tests for building confidence in system dynamics models. Syst. Dyn. TIMS Stud. Manag. Sci. 1980, 14, 209–228. [Google Scholar]
  31. Chen, H.; Guo, J.; Zhang, Z.; Xu, C.Y. Prediction of temperature & precipitation in Sudan & South Sudan by using LARS-WG in future. Theor. Appl. Climatol. 2013, 113, 363–375. [Google Scholar] [CrossRef]
  32. Hassan, Z.; Shamsudin, S.; Harun, S. Application of SDSM & LARS-WG for simulating & downscaling of rainfall and temperature. Theor. Appl. Climatol. 2014, 116, 243–257. [Google Scholar]
  33. Nourani, V.; Razzaghzadeh, Z.; Baghanam, A.H.; Molajou, A. ANN-based statistical downscaling of climatic parameters using decision tree predictor screening method. Theor. Appl. Climatol. 2019, 137, 1729–1746. [Google Scholar] [CrossRef]
Figure 1. Location of the study area.
Sustainability 14 03376 g001
Figure 2. Schematic of methodology. (First step) downscaling under RCP4.5 and RCP 8.5; (Second step) ANN-based rainfall-runoff modeling; (Third step) SD modeling and policy-making.
Sustainability 14 03376 g002
Figure 3. Causal loop diagram for ZRB.
Sustainability 14 03376 g003
Figure 4. Stock and flow diagram for the ZRB SD model.
Sustainability 14 03376 g004
Figure 5. Annual precipitation and temperature pattern under two scenarios, RCP4.5 and RCP8.5, with respect to the validation period of the baseline.
Sustainability 14 03376 g005
Figure 6. Monthly precipitation projection of various GCMs under RCPs 4.5 and 8.5 for the future.
Sustainability 14 03376 g006
Figure 7. Runoff pattern according to the ANN-based simulation model.
Sustainability 14 03376 g007
Figure 8. Water balance fluctuation by implementing condition test.
Sustainability 14 03376 g008
Figure 9. Simulated and observed groundwater level.
Sustainability 14 03376 g009
Figure 10. Impact of restoration plans (i.e., Plan 1. Impact of decreasing agriculture product and shifting irrigation efficiency, Plan 2. Impact of Cloud-Seeding, Plan 3. Population control and household consumption reduction, Plan 4. Reducing meat and animal-husbandry production, Plan 5. Groundwater consumption control) on the ZRB water level in the period of 2021–2040.
Sustainability 14 03376 g010
Figure 11. Impact of climate change on ZRB water level in the period of 2021–2040.
Sustainability 14 03376 g011
Table 1. Climate stations and GCM grid point information.
NoGlobal Climate ModelCentreCentre AcronymCountryGrid Size
(Approximately)
1EC-EARTHNumerical weather predictionESMEurope1.1° × 1.1°
2HadGEM2UK Met. OfficeUKMOUK1.4° × 1.9°
3MIROC5Met Research Institute, JapanNIESJapan1.2° × 2.5°
4MPI-ESMMax-Planck Met InstituteMPI-MGermany1.9° × 1.9°
Table 2. The location and the characteristics of observed climate data of four synoptic stations.
Station CodeStation NameLongitude
(°N)
Latitude
(°E)
Altitude
(m)
Mean Temperature
(°C)
Cumulative Precipitation
(mm)
40728Takab36°24′47°06′181710.27300.1
99332Bukan36°32′45°14′138611.58362.8
99292Miandab36°58′46°09′137111.1279.9
99314Shahindezh36°37′46°31′139010.9421
Table 3. Variables of the ZRB SD model.
DataSource (s)UnitsData Source TypeType of Variables
Groundwater consumptionIran Ministry of EnergyMCM/monthModeledEndogenous
Natural rechargeSurvey dataMCM/monthModeledEndogenous
Returned waterSurvey dataMCM/monthModeledEndogenous
Groundwater extractionIran Ministry of EnergyMCM/monthModeledEndogenous
Natural dischargeSurvey dataMCM/monthStatisticalEndogenous
Groundwater volume changeSurvey dataMCM/monthModeledEndogenous
Wastewater coverageIran Ministry of EnergyMCM/monthStatisticalEndogenous
Total EvaporationIran Ministry of EnergyMCM/monthStatisticalEndogenous
DemandSurvey data-LARS-WGMCM/monthStatistical/ModEndogenous
Water BalanceSurvey dataMCM/monthStatistical/ModExogenous
PopulationStatistical Center of IranDimensionlessStatisticalEndogenous
Domestic demandIran Ministry of EnergyMCM/monthModeledEndogenous
Industrial demandIran Ministry of EnergyMCM/monthModeledEndogenous
Horticultural demandSurvey dataMCM/monthModeledEndogenous
Crop demandSurvey dataMCM/monthModeledEndogenous
Agricultural demandSurvey dataMCM/monthModeledEndogenous
Total demandSurvey dataMCM/monthModeledEndogenous
WithdrawIran Ministry of EnergyMCM/monthModeledEndogenous
Environment DemandIran Ministry of AgricultureMCM/monthStatisticalEndogenous
SupplySurvey dataMCM/monthModeledExogenous
Surface water percolationIran Ministry of EnergyMCM/monthModeledEndogenous
Wastewater percolationIran Ministry of EnergyMCM/monthStatisticalEndogenous
Irrigation efficiencyIran Ministry of agricultureMCM/monthStatisticalEndogenous
RunoffSurvey data-ANNMCM/monthModeledExogenous
PlansSurvey dataDimensionlessStatisticalExogenous
Crop demand averageNETWAT softwareMillimeter/MonStatisticalExogenous
Horticultural demand averageNETWAT softwareMillimeter/MonStatisticalExogenous
Table 4. Results of the downscaling model via LARS_WG according to the EC-EARTH, HADGEM2, MIROC5, and MPI-ESM models.
Climate ModelsEvaluation Criteria
TemperaturePrecipitation
RMSE (°C)DCRMSE (mm)DC
HADGEM20.200.91360.63
EC-EARTH0.450.81370.61
MIROC50.600.76400.59
MPI-ESM0.350.85370.62
Table 5. Performance results of ANN-based Rainfall-Runoff modeling.
ModelEvaluation Criteria
RMSE (MCM)DC
ANNtrainverifytrainverify
8130.410.23
490.690.51
5110.630.49
Publisher’s Note: MDPI stays neutral with regard to jurisdictional claims in published maps and institutional affiliations.

