
Spatio-Temporal Characteristics of the Indo-Pacific Warm Pool and the Corresponding Rain Pool


1
Key Laboratory of Digital Earth Science, Aerospace Information Research Institute, Chinese Academy of Sciences, Beijing 100094, China
2
University of Chinese Academy of Sciences, Beijing 100049, China
3
Piesat Information Technology Co., Ltd., Beijing 100195, China
*
Author to whom correspondence should be addressed.
Sustainability 2022, 14(17), 10841; https://0-doi-org.brum.beds.ac.uk/10.3390/su141710841
Submission received: 25 June 2022
/
Revised: 17 August 2022
/
Accepted: 25 August 2022
/
Published: 31 August 2022
(This article belongs to the Special Issue Impact of Indo-Pacific Climate Variability)
Abstract
:The greatest warm body in the world exists in the tropical oceans, which stimulates deep convection, resulting in abundant water vapor and precipitation in the tropical atmosphere. Using multiple SST datasets and related precipitation and atmospheric parameter data, this study examines multi-scale variabilities of the Indo-Pacific warm pool (IPWP) as well as the associated rain pool (IPRP). The results show that the IPWP and IPRP are spatially analogous and have significant increasing trends of intensity and coverage. Seasonal variations of the IPWP and IPRP are the strongest and almost coincident with each other. Our results also confirm previous findings that the most important interannual variations of the IPWP and IPRP are associated with various types of ENSO. The composite analysis reveals that the IPWP’s SST structure is linked to the ENSO-induced trade wind anomaly and that SST structural changes cause changes in the position and intensity of the ascending branch of the Walker circulation, which in turn drives changes in the position and intensity of the IPRP.
1. Introduction
The ocean, particularly the tropical ocean, is a key component of the global climate and ocean-atmosphere system [1]. It has characteristics such as slow evolution and huge heat capacity, allowing it to store a large amount of heat and have persistent impacts on the environment. The essential basis for the interaction between ocean and atmosphere is sea surface temperature (SST). When the SST rises beyond a certain threshold, structured deep convective systems transfer heat and moisture from the ocean to the atmosphere, serving as a significant source of heat and water vapor for large-scale atmospheric circulations [2,3,4]. In the tropical ocean-atmosphere system, where there is high SST, there is usually more precipitation because of the moist deep convective systems that quickly grow over it [5]. Meanwhile, precipitation that falls into the ocean serves to stabilize the oceanic mixed layer, which may also modify the SST distribution owing to the lensing effect [6]. On the other hand, sea surface winds, whose energy is acquired primarily from the latent heat released by convective activities, may also directly affect the ocean. In ensemble simulations of future scenarios of global SST and precipitation, variations in tropical precipitation are positively correlated with SST and suggests a SST-wind-evaporation-SST feedback pattern [7].
The Indo-Pacific warm pool (IPWP), which contains the world’s greatest warm water mass, is the most influential of the tropical oceans. The most widely accepted definition of the IPWP is the area in the tropical Indian Ocean and western Pacific Ocean with SST above 28 °C, which covers nearly one-eighth of the entire area of the world [8,9,10]. Deep convection has a great deal of spatial coherence within the warm pool. The intertropical convergence zone (ITCZ), the world’s most prominent region of deep convection, is also located in the tropical Pacific. It is also referred to as a “fire box”; as it is the world’s foremost heat engine, there is enormous latent heat released by the intense precipitation caused by the convective activity in it [11]. The warm pool is the wettest oceanic zone on the planet, with the most water vapor and largest annual cumulative precipitation. Based on the deep convective features of the tropical Indian and Pacific Oceans, the Indo-Pacific rain pool (IPRP) is defined by a robust precipitation rate, typically over 6 mm/day. According to several previous studies, the IPWP has demonstrated a variety of seasonal variation characteristics [8,12,13], interannual variations [14,15], and connections to ENSO events [16,17,18,19,20], the Pacific Ocean’s most significant interannual variability. Strong wind jet variations caused by seasonal oceanic pressure differences cause simultaneous and corresponding variations in SST, while upper atmospheric impacts motivated by variations in SST induce variations in precipitation, demonstrating the well-established local sea–air interactions [21]. It has also been proven that the El Niño (La Niña) occurrences have significant impacts on the interannual variations of the warm pool and rain pool in a variety of aspects, such as size and intensity [14,20,22], centroid and boundary oscillations [15,16,23,24], marginal seas such as the South China Sea [12,17] and the Arabian Sea [25], and cold-point tropopause temperature and height [26], etc.
Yet, the covariations of the warm pool and its corresponding wet atmospheric characteristics are understudied. Influence not only from local major climate modes but also warm pools has also been shown to be potentially associated with variations in distant regions [27,28]. In addition, tropical convection and surface winds are tremendously variable on seasonal [2,11] and interannual time scales [29]. Because of their interdependence, the concurrent variation patterns of the IPWP and IPRP as well as their interaction with ENSO are worth highlighting. As the global “heat engine” and “steam engine”, the rapid warming and expansion of the Indo-Pacific warm pool will have a profound impact on the whole climate system. Therefore, it is of great practical importance to study air-sea interaction in the Indo-Pacific warm pool, which could greatly impact the global water cycle and global climate change, especially for the regional development and response to climate change.
To better understand how the seasonal and interannual changes of the IPWP, IPRP, and the influencing factors lead to these changes, this study explores the characteristics of the IPWP and IPRP using the ensemble empirical mode decomposition (EEMD) method, the singular value decomposition (SVD) method, and the composite analysis method. Additionally, the correlation between the oceanic process and the atmospheric factors is being investigated.
2. Materials and Methods
2.1. Materials
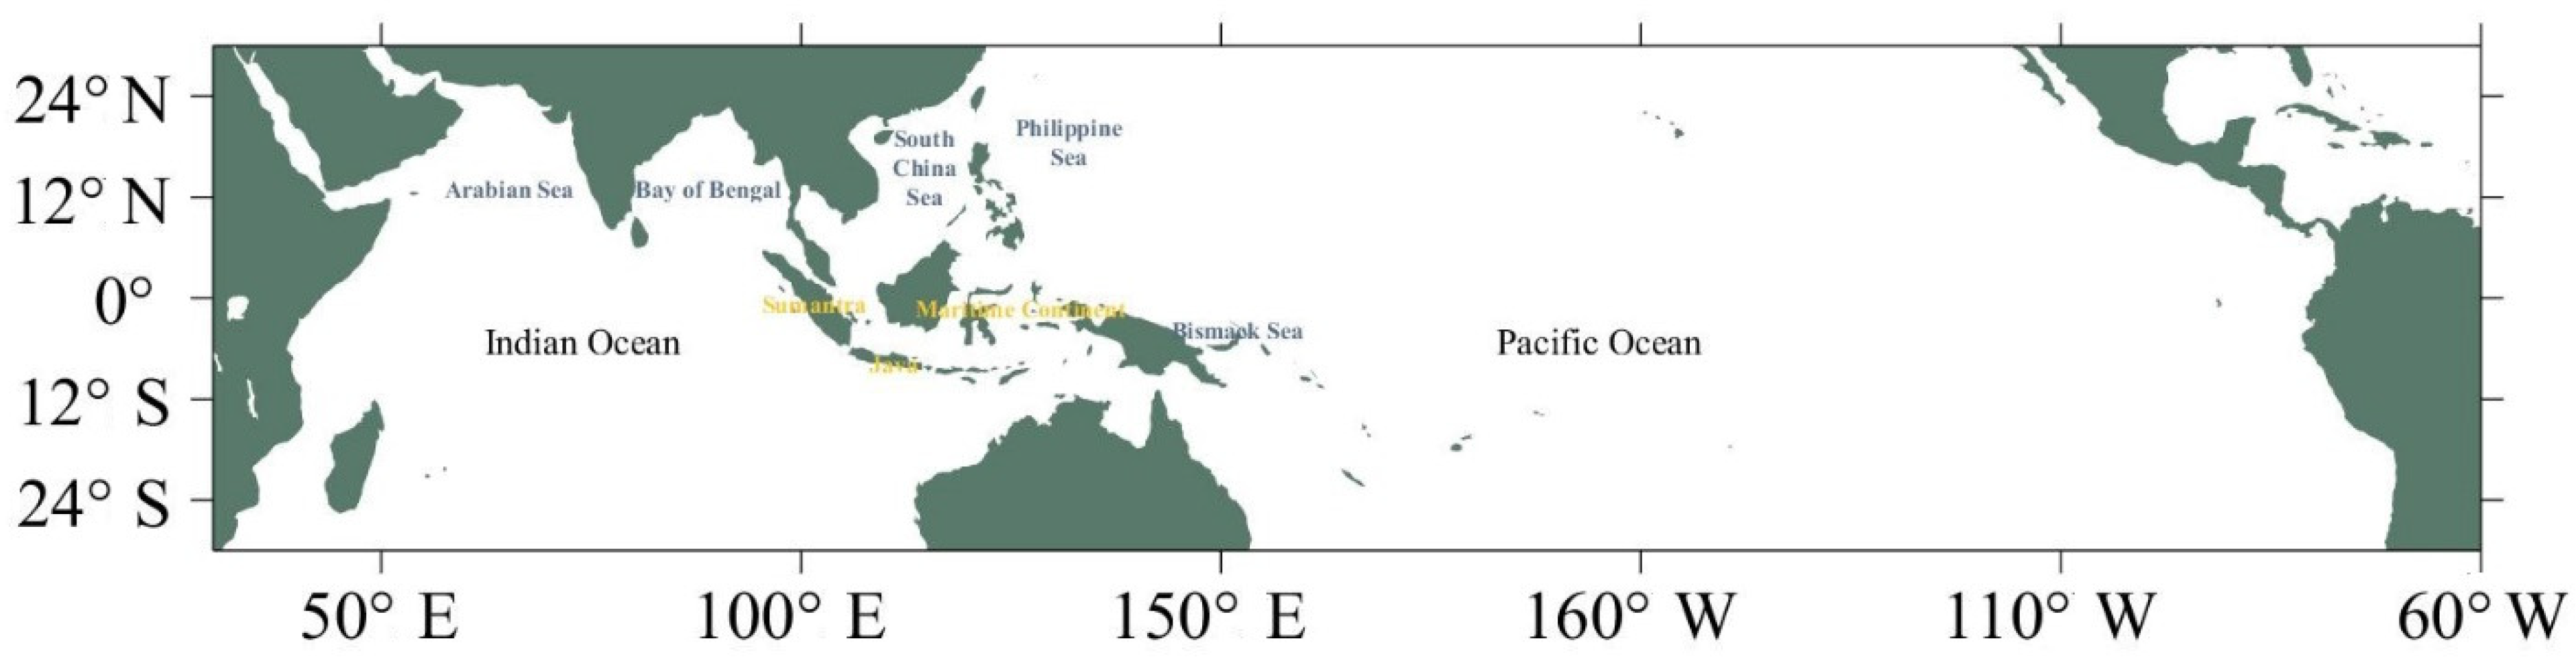
In this study, the research region (Figure 1) is the entire tropical Pacific and Indian Ocean (25° N–25° S, 30° E–60° W). To analyze the variability of SST over the IPWP region, 4 monthly SST datasets were utilized.
HadISST is produced and distributed by the Met Office Hadley Centre, which is reconstructed using a two—stage reduced—space optimal interpolation procedure, followed by superposition of quality-improved gridded observations onto the reconstructions to restore local detail [30]. HadISST is a unique combination of monthly globally complete fields of SST on a 1-degree latitude–longitude grid from 1870 to date.
The Extended Reconstructed Sea Surface Temperature (ERSST) dataset is a global monthly analysis of SST data derived from the International Comprehensive Ocean-Atmosphere Dataset (ICOADS) [31]. ERSST is a 2° × 2° horizontally gridded dataset that spans from 1854 to the present.
COBESST is produced and distributed by the Japan Meteorological Agency (JMA), involves a resolution of 1° latitude and 1° longitude, and covers the period from 1891 to the present [32].
The gridded daily 0.25° Optimum Interpolation Sea Surface Temperature data (OISST; version 2) is provided by the NOAA/OAR/ESRL PSL, Boulder, CO, USA, and merges ocean skin temperatures from satellite and in situ platforms (ships and buoys) on a regular global grid [25]. The daily OISST is generated by applying a bias adjustment to satellite data and in situ data before using the optimum interpolation (OI) statistical method to fill in the gaps [33].
The Global Precipitation Climatology Project (GPCP) Monthly Analysis Product (version 2.3) is provided by National Center for Atmospheric Research, Boulder, CO, USA. It consists monthly satellite gauge and associated precipitation error estimates and covers the period January 1979 to the present. The general approach is to combine the precipitation information available from each of several satellite and in situ sources into a final merged product, taking advantage of the strengths of each data type. Data are provided on a 2.5-degree grid [34].
To explore the associated wind features, we utilized surface wind, horizontal wind of multi-pressure levels, vertical velocity, and relative humidity from NCEP-DOE Reanalysis 2, which is provided by the NOAA/OAR/ESRL PSL, Boulder, CO, USA. The NCEP-DOE Reanalysis 2 datasets, which are currently available from 1979 to the present, synthesize huge amounts of historical observations into global estimates, utilizing a state-of-the-art analysis/forecast system to perform data assimilation [35].
2.2. Methods
The majority of real timeseries do not strictly follow the assumptions made by timeseries analysis, which often states that the data must be linear, periodic, or stationary. The ensemble empirical mode decomposition (EEMD) method created by Huang et al. [36] and Wu and Huang [37] is used in this study, which can deal with nonlinear, non-periodic, and non-stationary data, to overcome the challenges of searching for a low-amplitude signal contained in noisy data.
The singular value decomposition (SVD) method is used to identify pairs of coupled spatial patterns in SSTA and precipitation anomalies, with each pair explaining a fraction of the covariance between the two fields. SVD decomposes the covariance matrices of two fields into singular values and orthogonal vectors, whose spatial patterns are called loading maps. The expansion coefficients of each field are the matrix product of that field and its loading map. The covariance between the expansion coefficients of the dominant modes of two fields is the largest; hence, SVD is also known as maximum covariance analysis. The squared covariance fraction (SCF), which is the proportion of squared covariance explained by the unfolding coefficients, is calculated using the singular values. The Pearson correlation coefficient between the expansion coefficients of one field and the original grid values of the other field is calculated to obtain the spatial pattern of heterogeneity correlation between the two fields, which shows the spatial characteristics of their correlation.
Two widely used ENSO climate indices were chosen to derive correlations with different types of ENSO. The canonical ENSO index is defined as the sea surface temperature anomaly (SSTA) averaged in the Niño-3 (90°–150° W, 5° S–5° N) area [30], and the ENSO Modoki index (EMI) is defined as EMI = [SSTA]C − 0.5 × [SSTA]E − 0.5 × [SSTA]W, where C, E, and W represent the regions of (165° E–140° W, 10° S–10° N), (110° W–70° W, 15° S–5° N), and (125° E–145° E, 10° S–20° N), respectively.
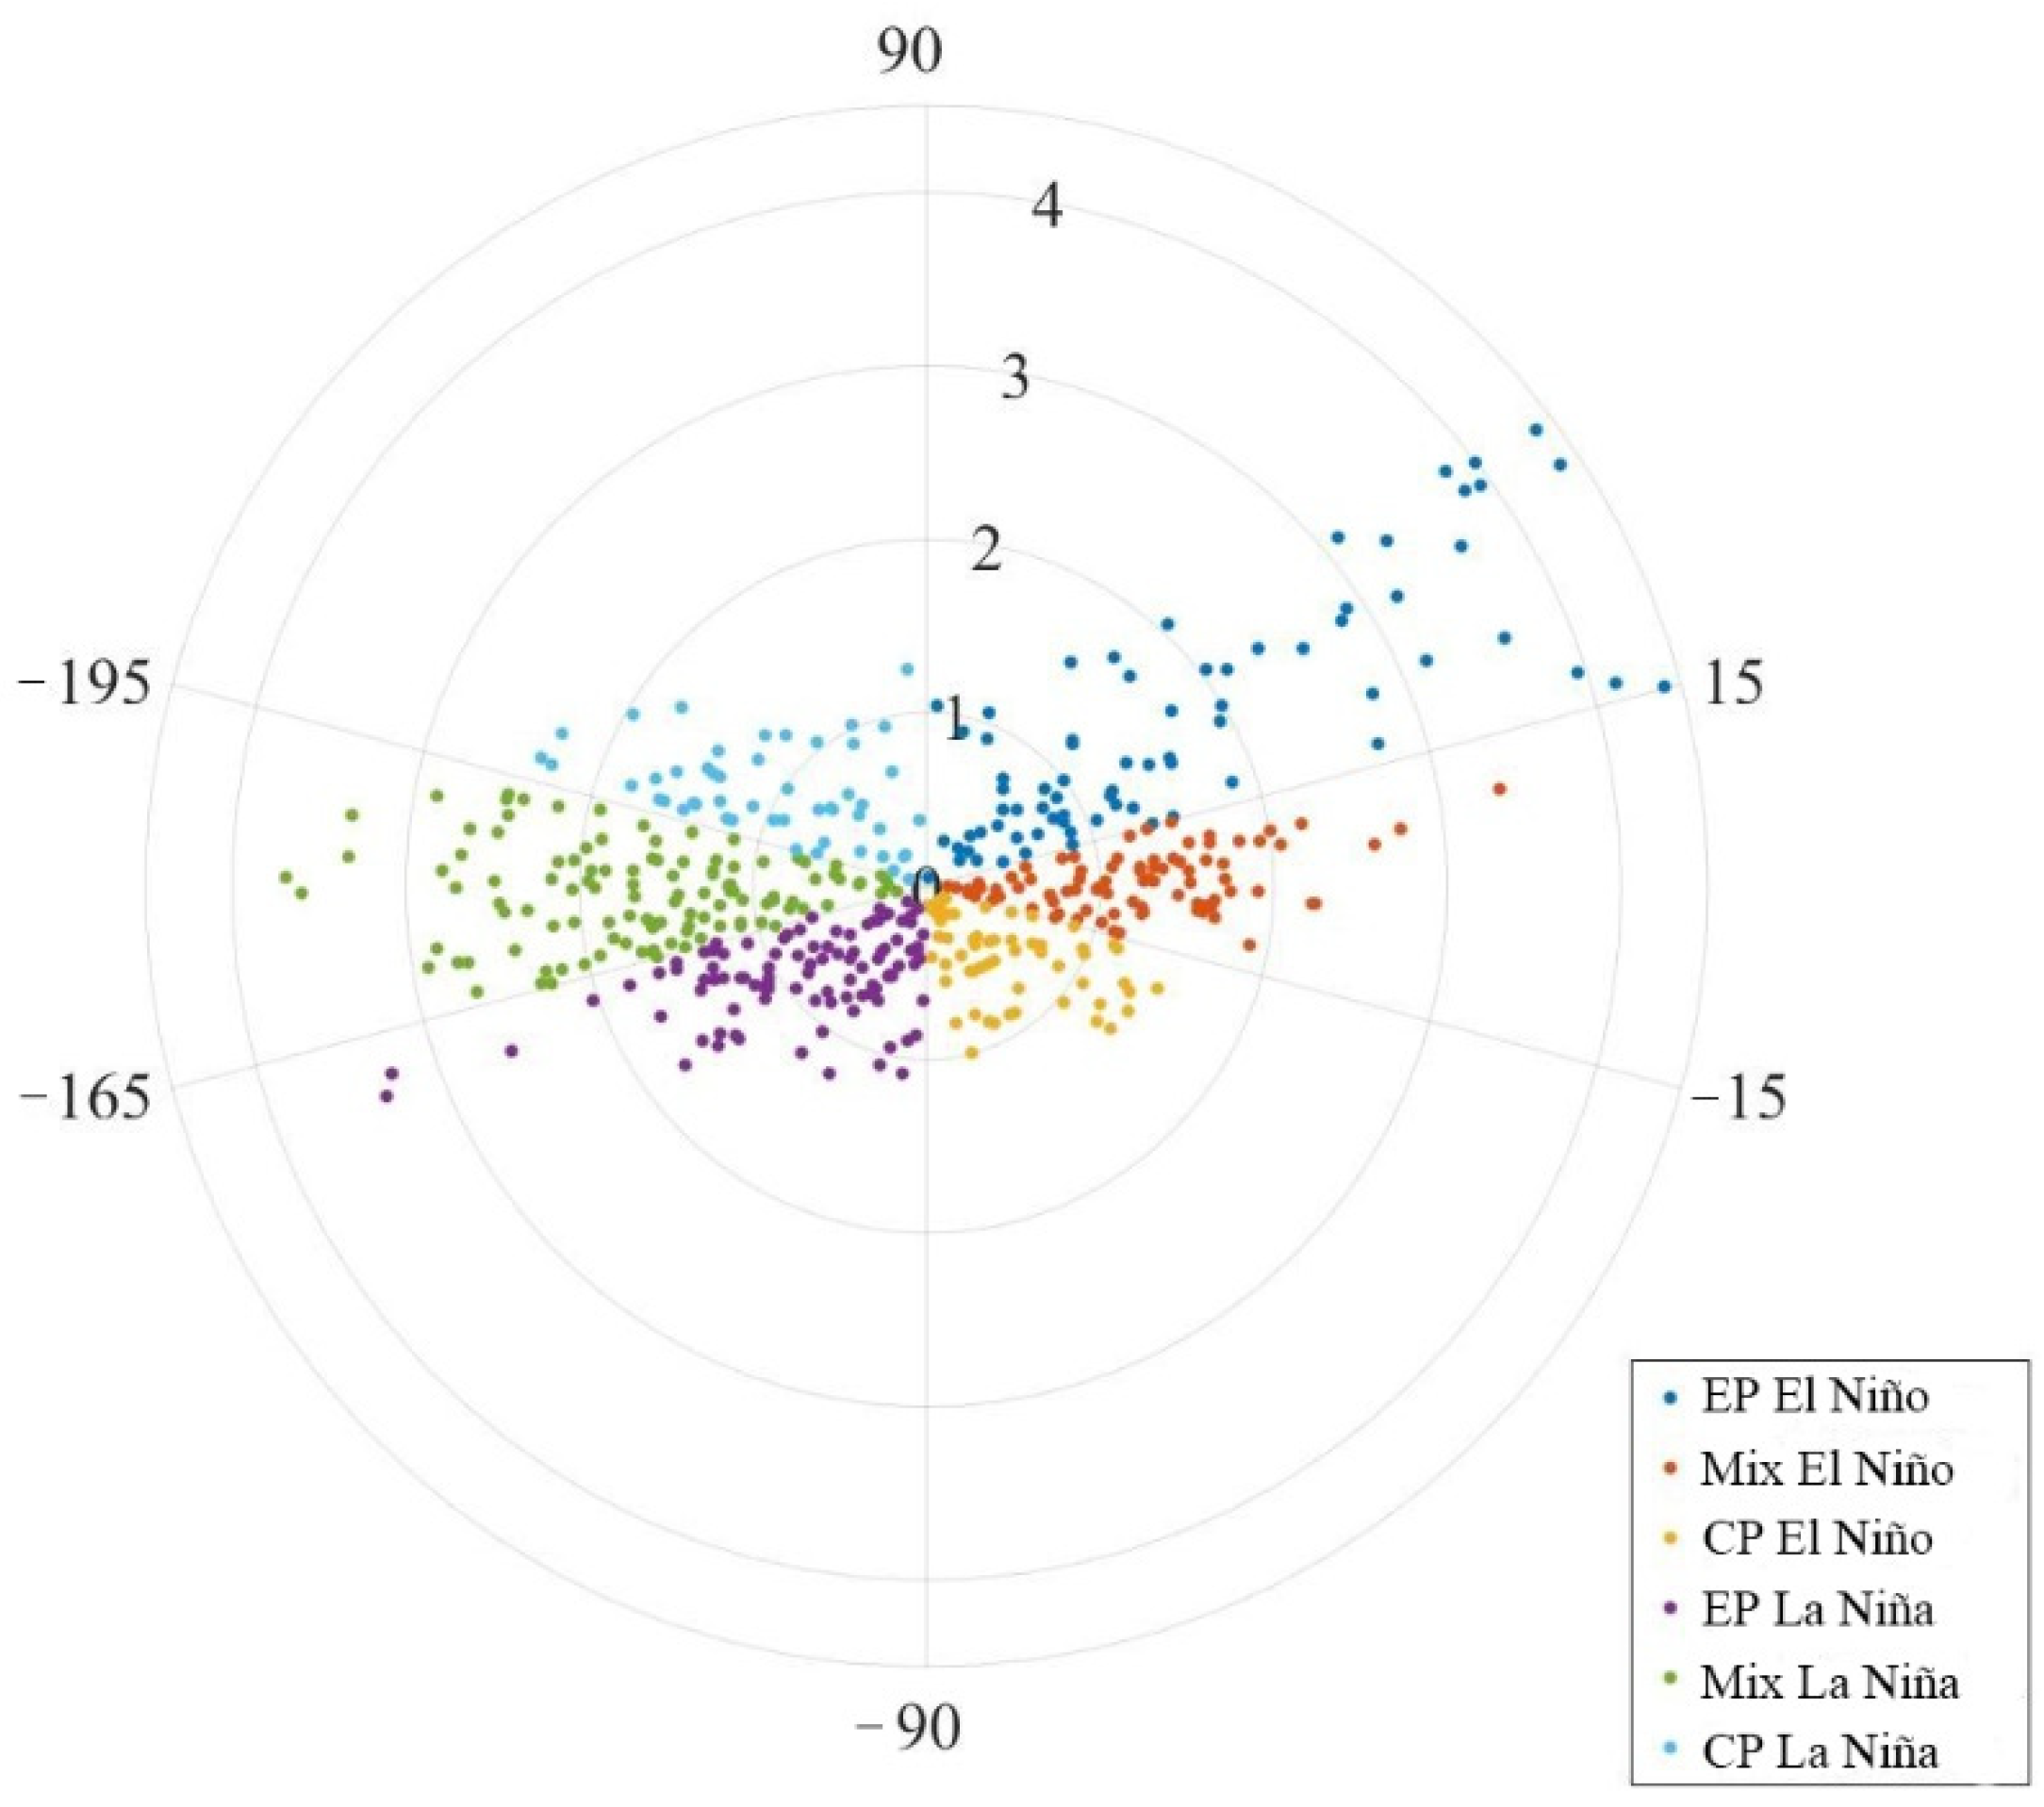
The unified complex ENSO index (UCEI) was used to classify the periods of occurrence of different types of ENSO events in 1982–2021. Most studies indicate that there are two basic forms of the El Nino South Oscillation (ENSO): the eastern Pacific (EP) type (also known as the “canonical ENSO”) and the central Pacific (CP) type (or ENSO Modoki type). However, the majority of the indices that have been proposed so far can only describe one specific type of ENSO. On the other hand, Zhang et al. [38] created the UCEI index, which can simultaneously distinguish among various types of ENSO. The UCEI is calculated as follows:
where
Niño-4 (N4), which is the SSTA-averaged Niño-4 region (160° E–150° W, 5° S–5° N), and Niño-3 (N3) are widely used to capture the anomalies in the central Pacific and eastern Pacific, respectively. The modulus (r) and quadrants () represent the ENSO strength and the ENSO types, respectively. Apart from the EP and CP types, the UCEI could further distinguish the MIX type of ENSO. Months in which r is less than 0.5 are determined as normal months and not selected. The UCEI-based classification of ENSO events for the period 1982–2021 is shown in the Figure 2.
To characterize non-linear behavior associated with the asymmetry between the positive and negative phases of a particular event, a non-linear composite approach is proposed [39]. Before the composite analysis, the linear trends and seasonal cycles of all the variables are removed.
The anomaly significance of the positive (negative) phrase versus the normal phrase is tested by 2-tailed Student’s t-test [40] given m general years and n special years, where and are the mean values of a variable for these years. Assuming that their overall means do not differ significantly,
where
t is subjected to a t-distribution with n + m − 2 degrees of freedom.
3. Results
3.1. Spatial Distribution of the IPWP and IPRP and Multiscale Characteristics of Their Area and Intensity Timeseries
3.1.1. Spatial Distribution of the IPWP and IPRP
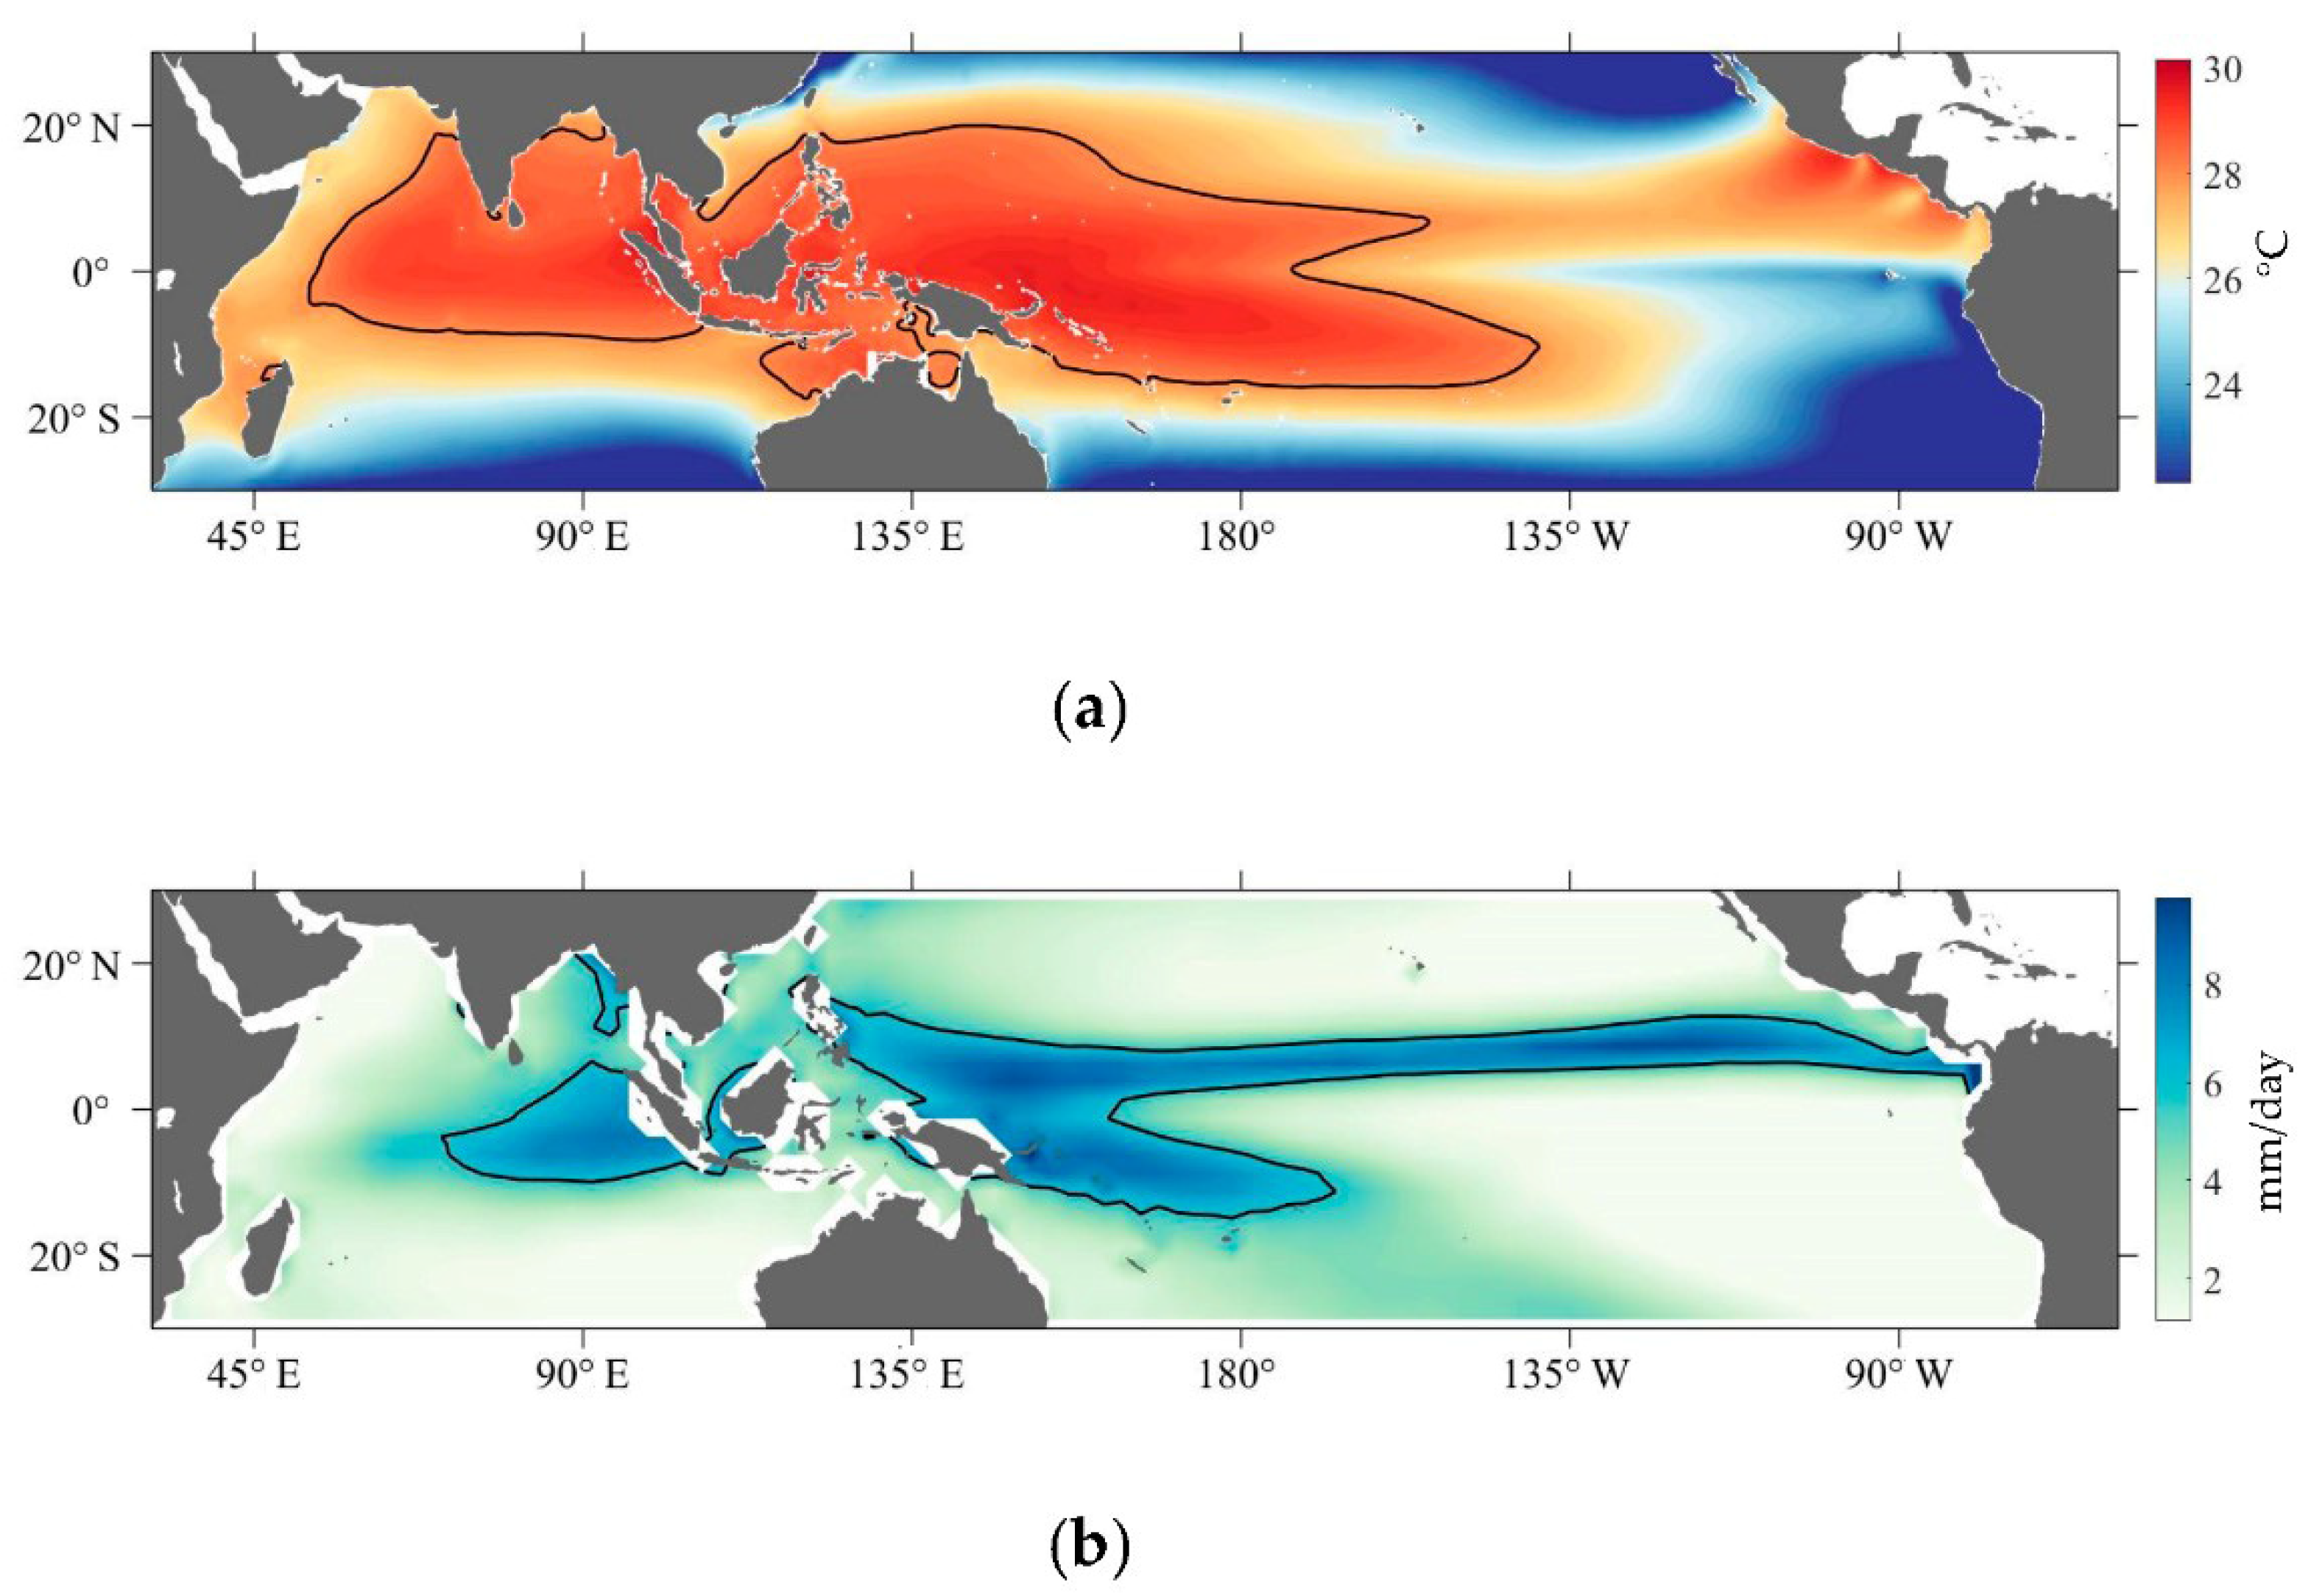
For the period 1982–2021, the climatological spatial distributions of SST and precipitation in the research region are illustrated in Figure 3. The IPWP’s coverage approximately parallels that of the IPRP, with the IPWP’s coverage being rather broader. The high-value regions of both the IPWP and IPRP exist around the Solomon Islands in the equatorial western Pacific and in the vicinity of Sumatra Island in the equatorial eastern Indian Ocean. The climatological IPWP (Figure 3a) in the Indian Ocean stretches from the equatorial region to the entire Bay of Bengal and a portion of the Arabian Sea; i.e., the Indian Ocean Warm Pool (IOWP) primarily exists in the Northern Hemisphere. In the tropical Pacific Ocean, the IPWP’s distribution is more extensive, ranging from the western to the central Pacific Ocean, and it has a noticeable double tongue structure on the north and south sides of the equator, respectively. The western Pacific rain pool (WPRP) features a two-tongue structure as well (Figure 3b), with the north tongue positioned in the equatorial trough, also known as the quasi-permanent intertropical convergence zone (ITCZ) of the tropical Pacific Ocean. The Indian Ocean rain pool (IORP) has a more limited range than the IOWP and can only be observed in the equatorial eastern Indian Ocean.
3.1.2. Long-Term Trends and Multiscale Decomposition Features of the Area and Intensity Timeseries of the IPWP and IPRP
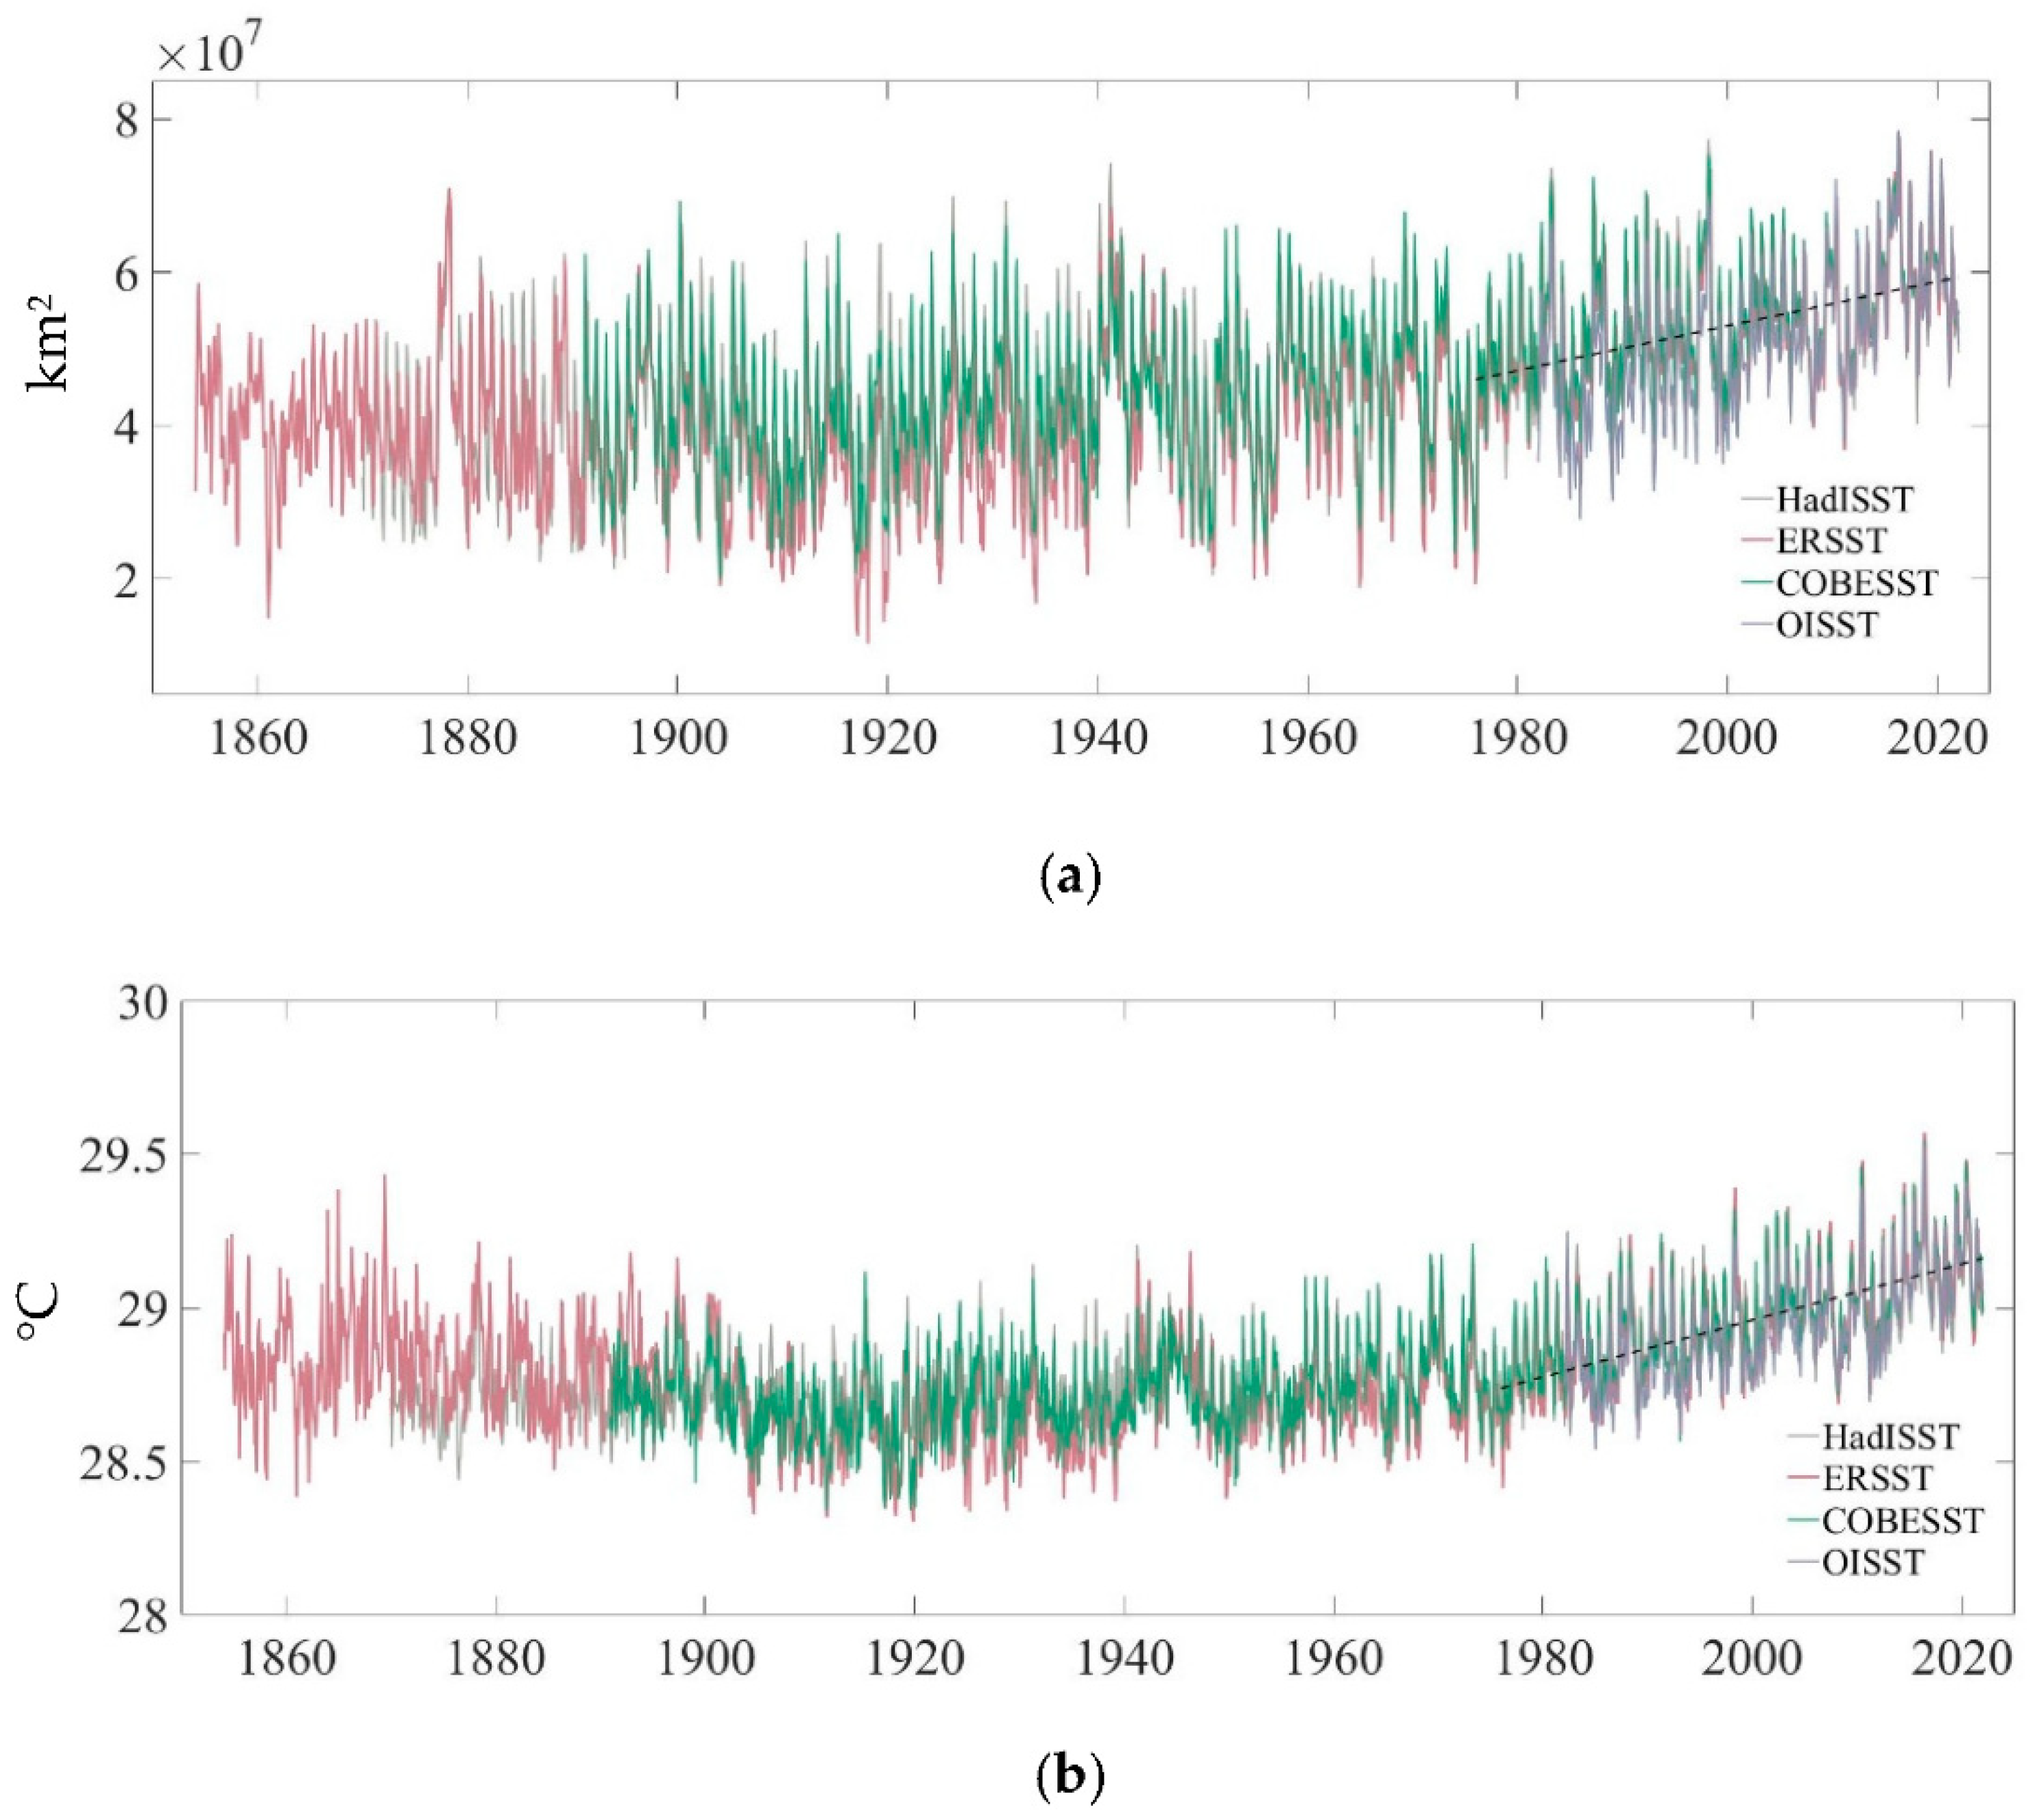
The area and mean SST of the IPWP are computed using four SST datasets. The correlation coefficients between any two of the four timeseries, which are obtained by every dataset, are all over 0.8, and all the datasets exhibit comparable trend and fluctuation characteristics (Figure 4). Before the 1980s, the IPWP exhibits no discernible trend in either area or intensity, but after that time, the IPWP’s area and intensity considerably increase, which is consistent with Roxy’s findings [41].
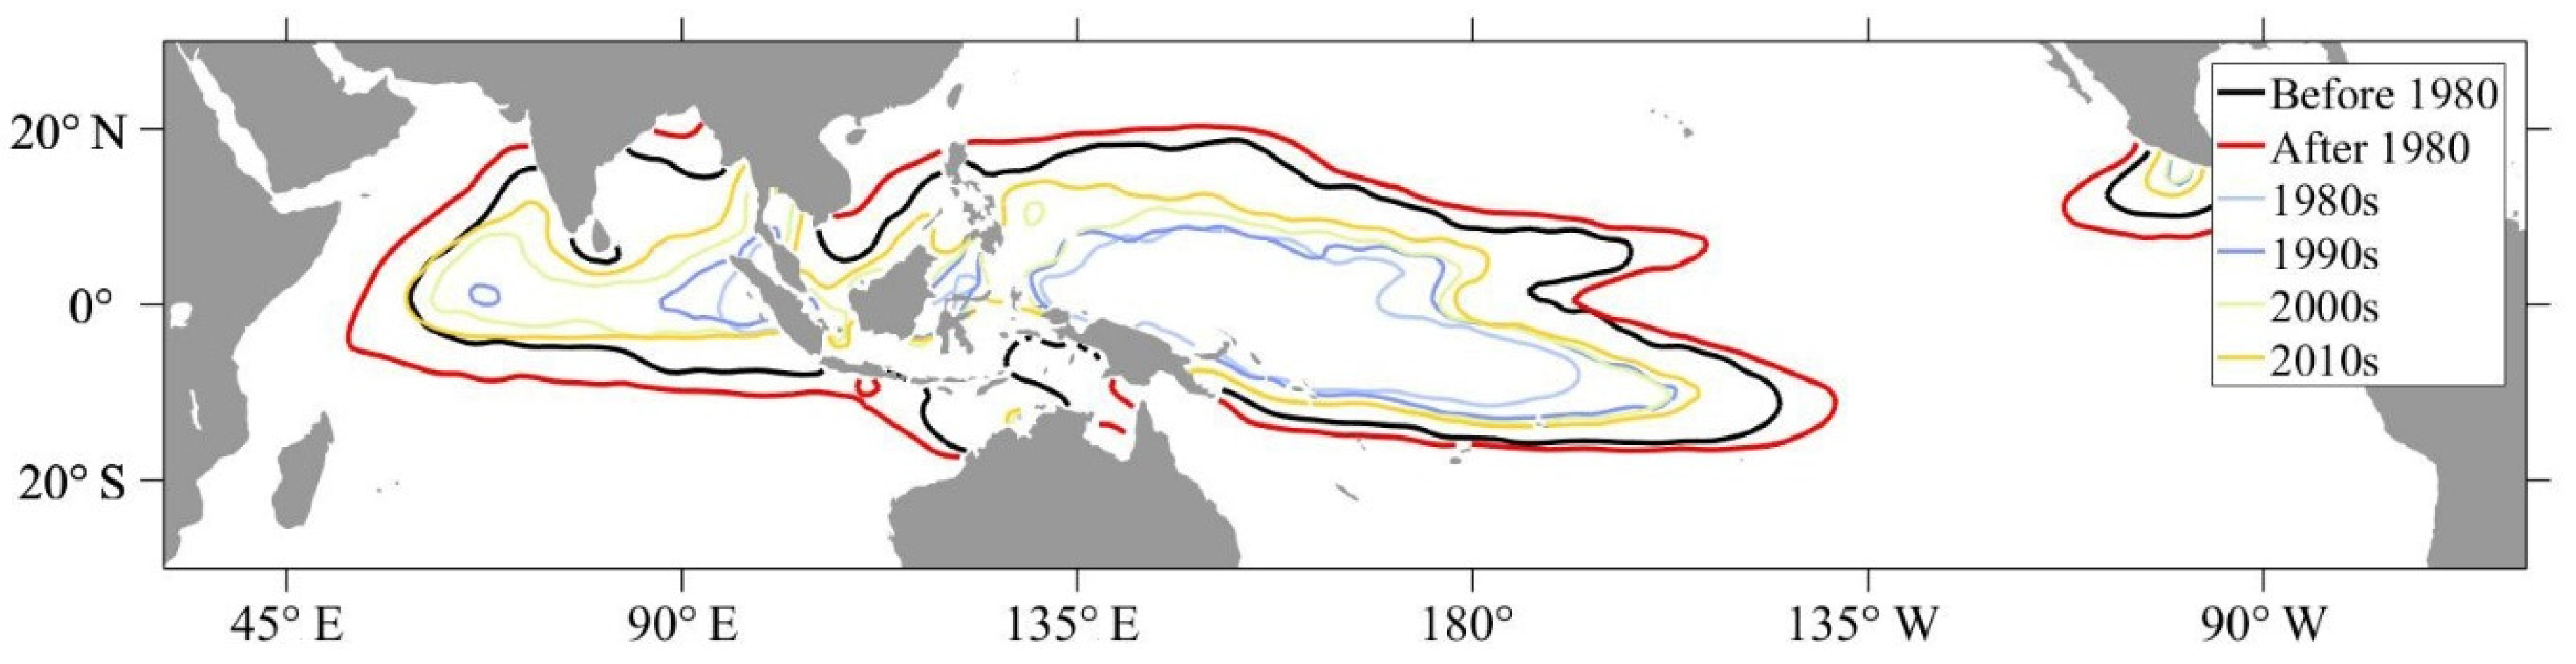
Based on the Mann–Kendall test, the IPWP’s area and mean SST exhibit significant increasing trends from 1982 to 2021. The Sen’s slope of the area of the IPWP is 4.3 × 10⁵ km2 per year, and that of the mean SST is 0.0105 °C per year. Before the 1980s, the mean area of the IPWP was 4.03 × 10⁷ km2, and after that, the mean area becomes 5.03 × 10⁷ km2. Additionally, comparison in Figure 5 reveals that the mean status of the IPWP significantly extended during the 1980s compared to earlier, especially in the Indian Ocean. The expansion of the warm pool’s heat storage and heat core, however, is more noticeable than the expansion of the IPWP in the 40 years since the 1980s. The IPWP has increased in size, as shown in Figure 5, but what is more noticeable is the tendency of a considerable expansion every decade in the extent above 29 °C, particularly in the region of the equatorial Indian Ocean, where the SST over 29 °C has expanded to the west to a significant extent.
The IPRP associated with the IPWP also shows significant trends of expansion and enhancement during these 40 years, and although it passed the Mann–Kendall trend test, the expansion rate was only 8.96 × 10⁵ km2 per year, which is not a distinct state of expansion compared to the IPRP average area of 2.59 × 10⁷ km2.
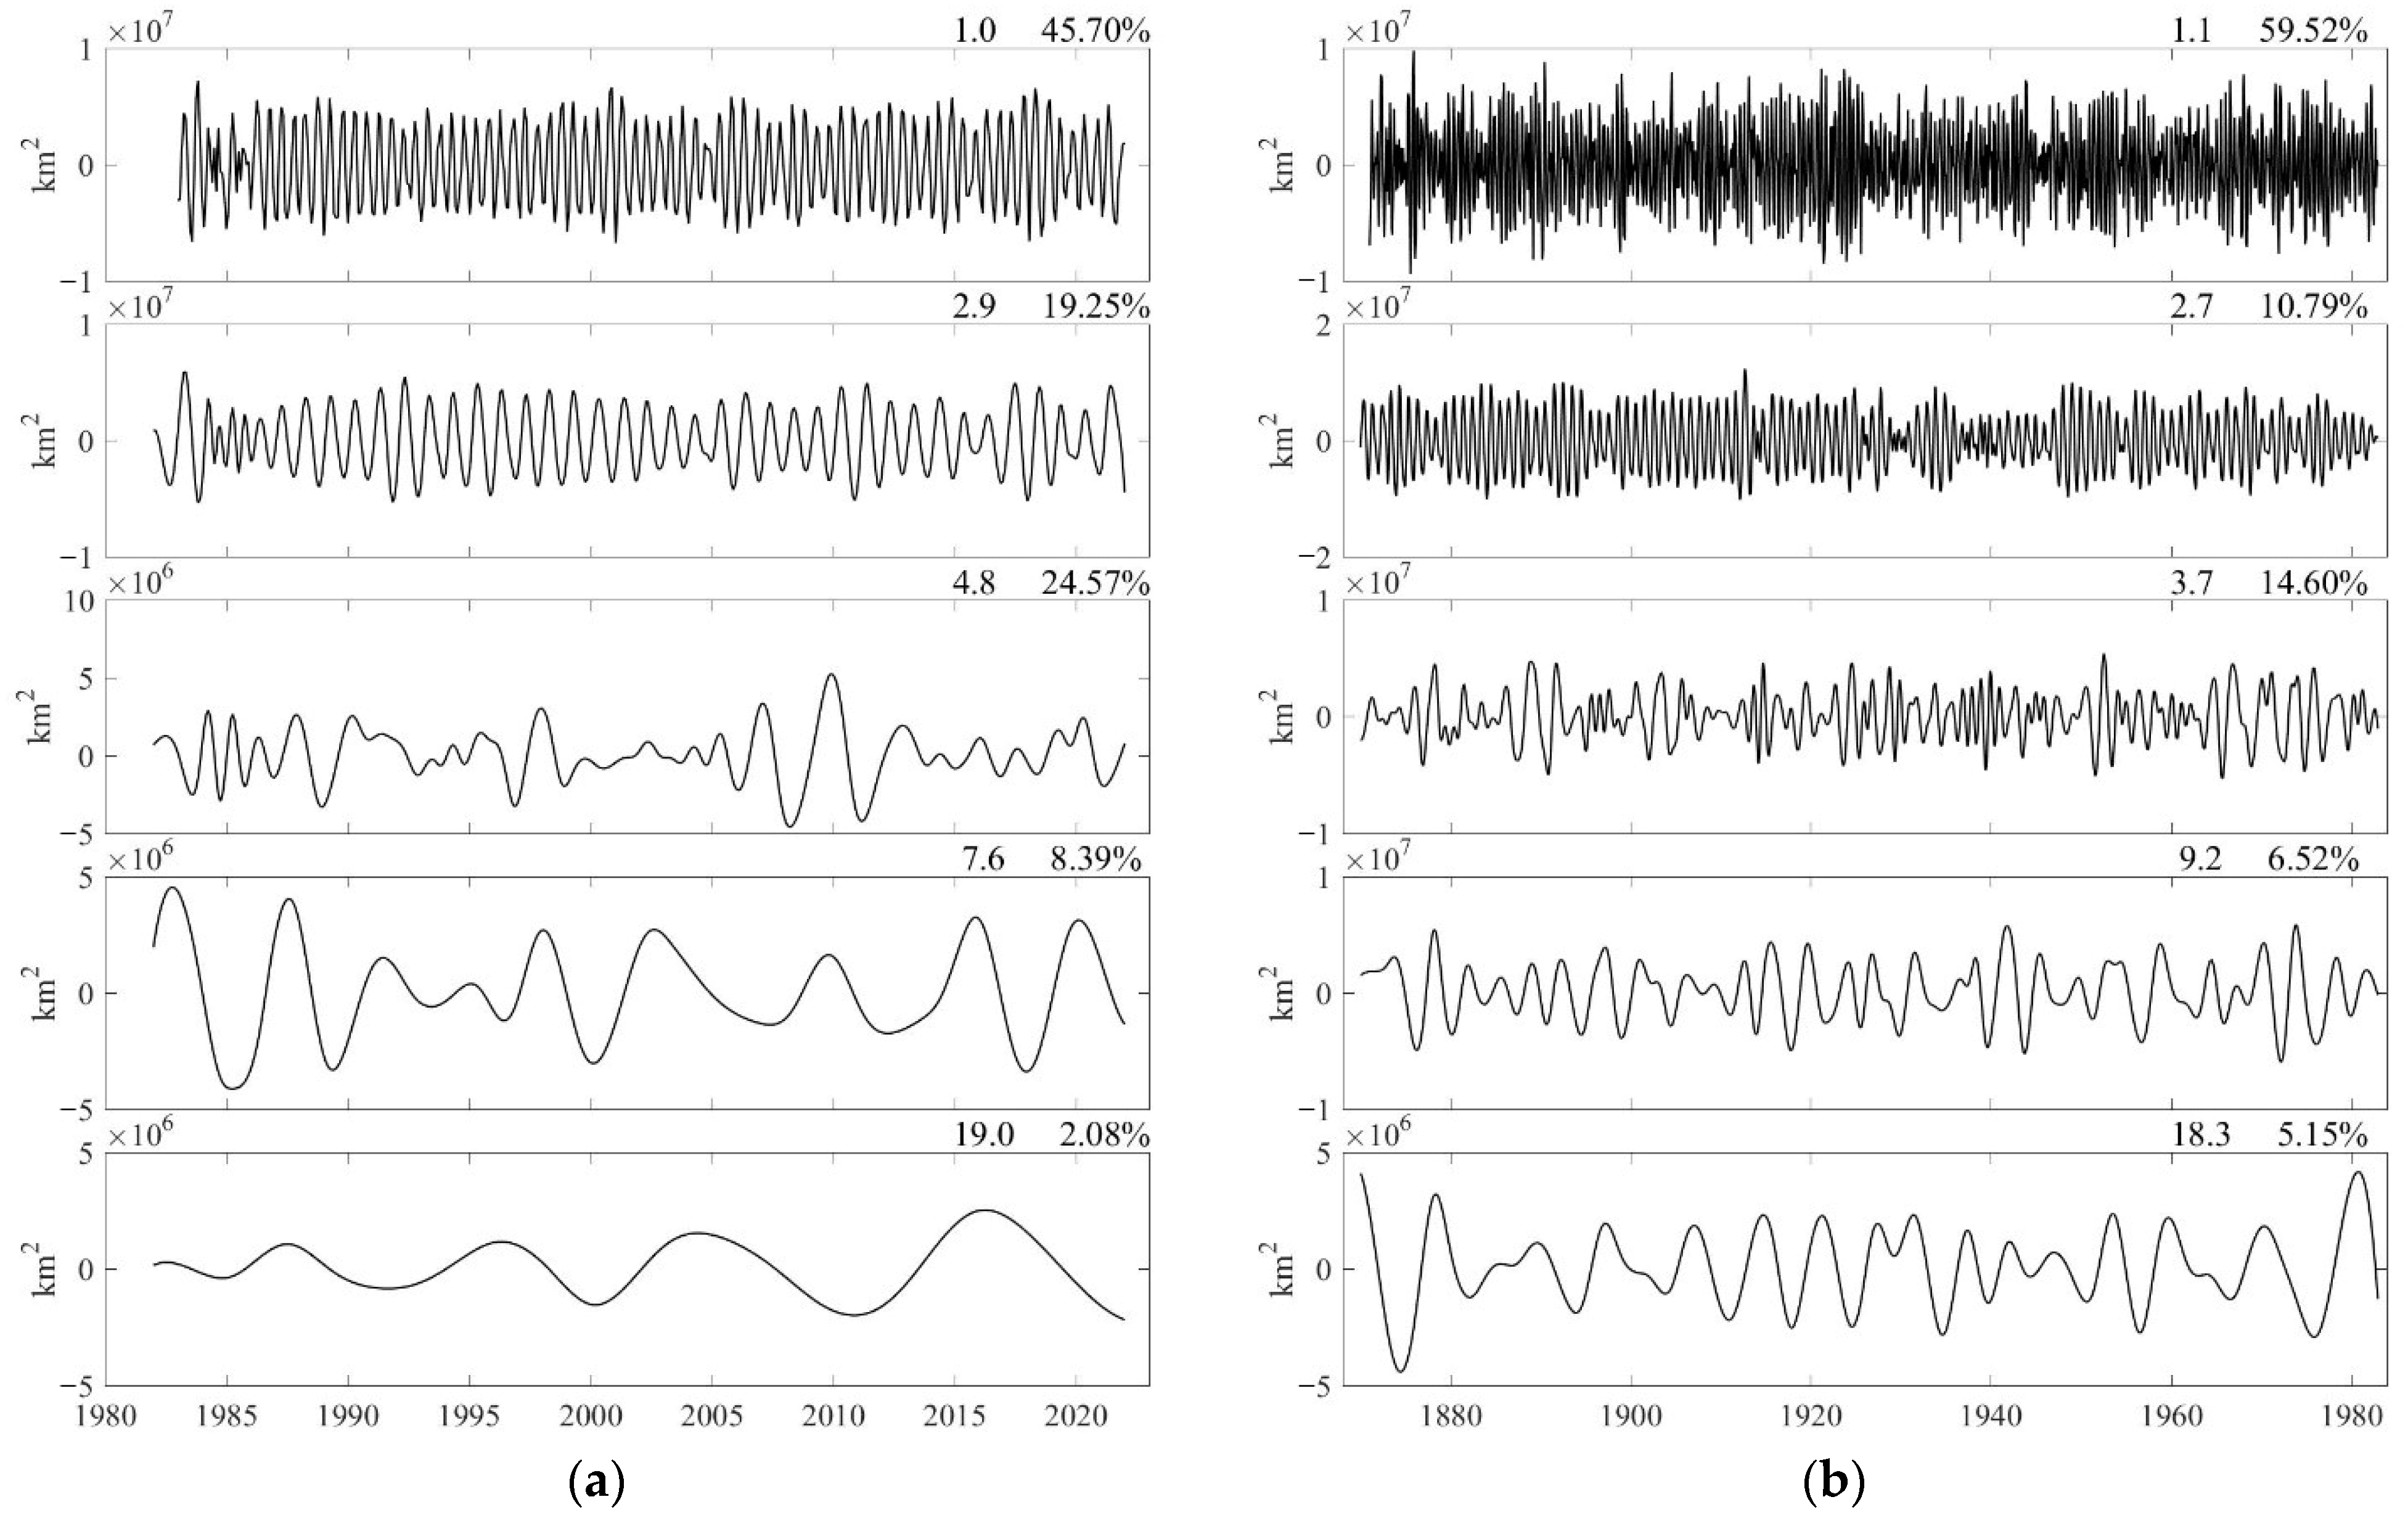
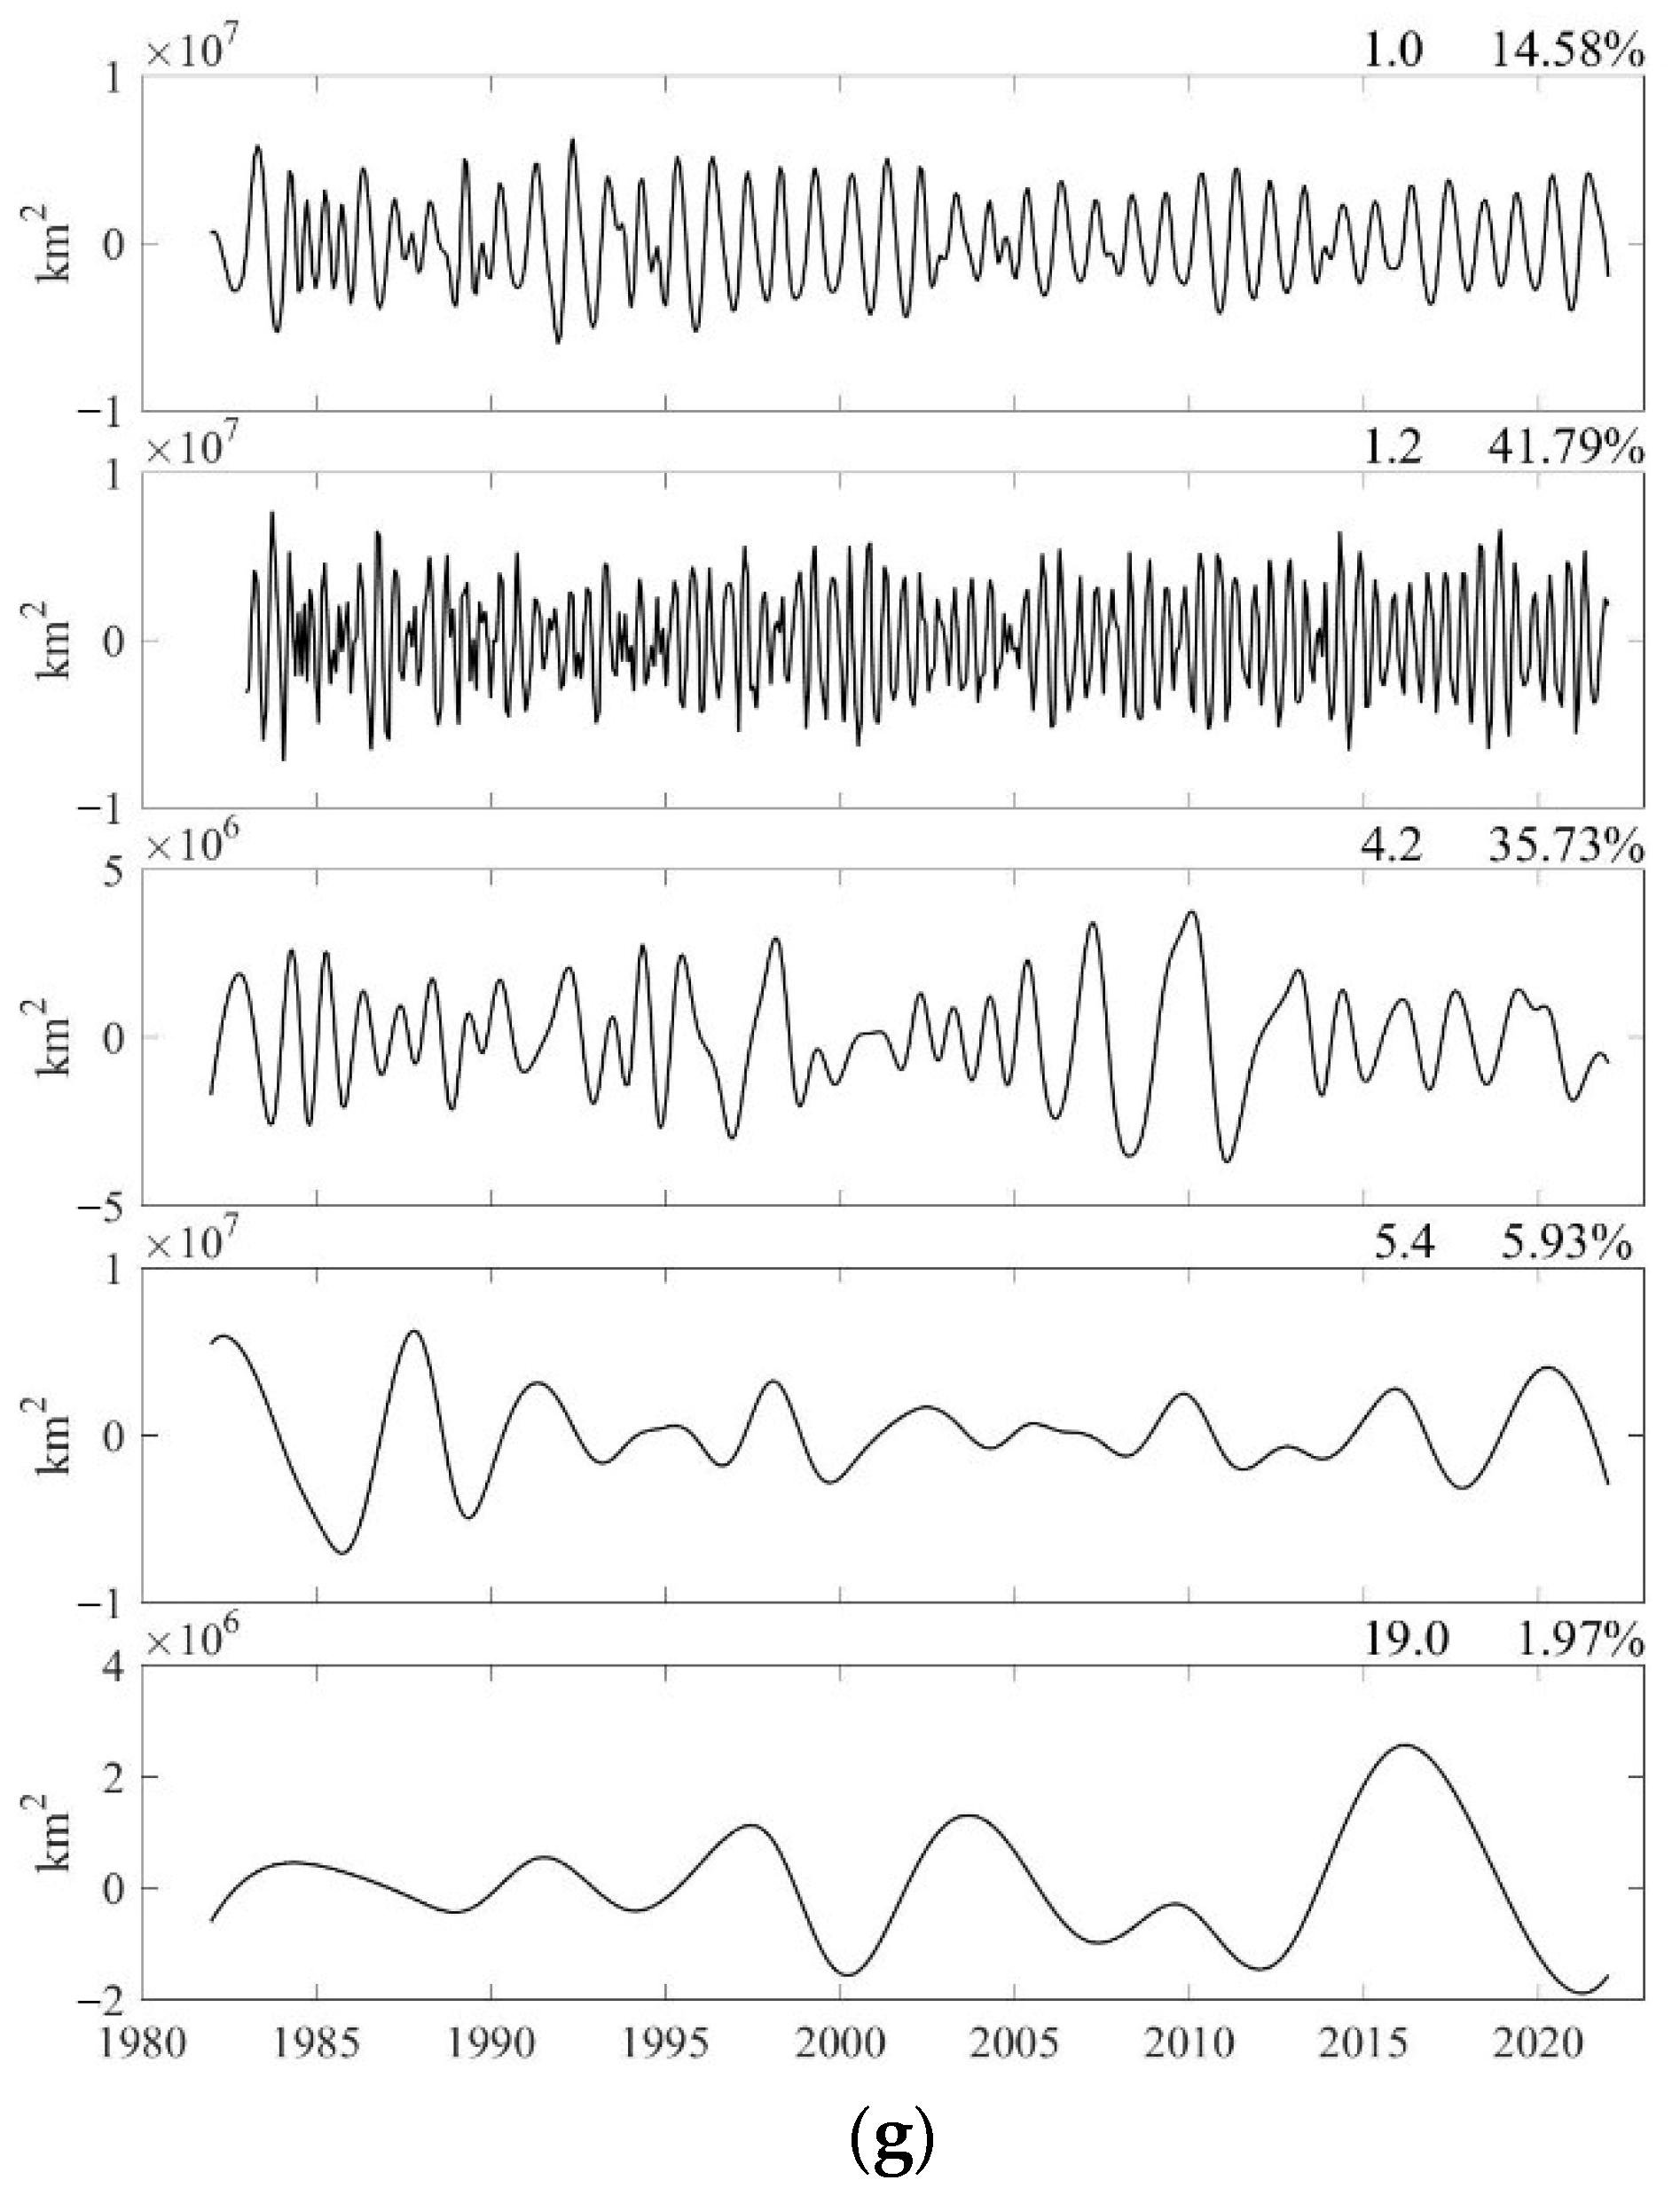
In the four IPWP area timeseries, the variation signals of various periods were decomposed using the EEMD approach, and the significant decomposition signal results were typically consistent during 1982–2021 (Figure 6). The 1-year phase signal accounts for the majority of the variance (over 35%) that can be explained. As a result, the seasonal cycle should be the most prominent pattern of variation in IPWP. The interannual variation signal, which accounts for 10–20% of the explained variance and has a period of approximately 3–5 years, is the most prominent variation signal in addition to the seasonal variation signal. With 3–6% of the explained variance being accounted for by the decadal fluctuation signal, it is also a relatively substantial variation.
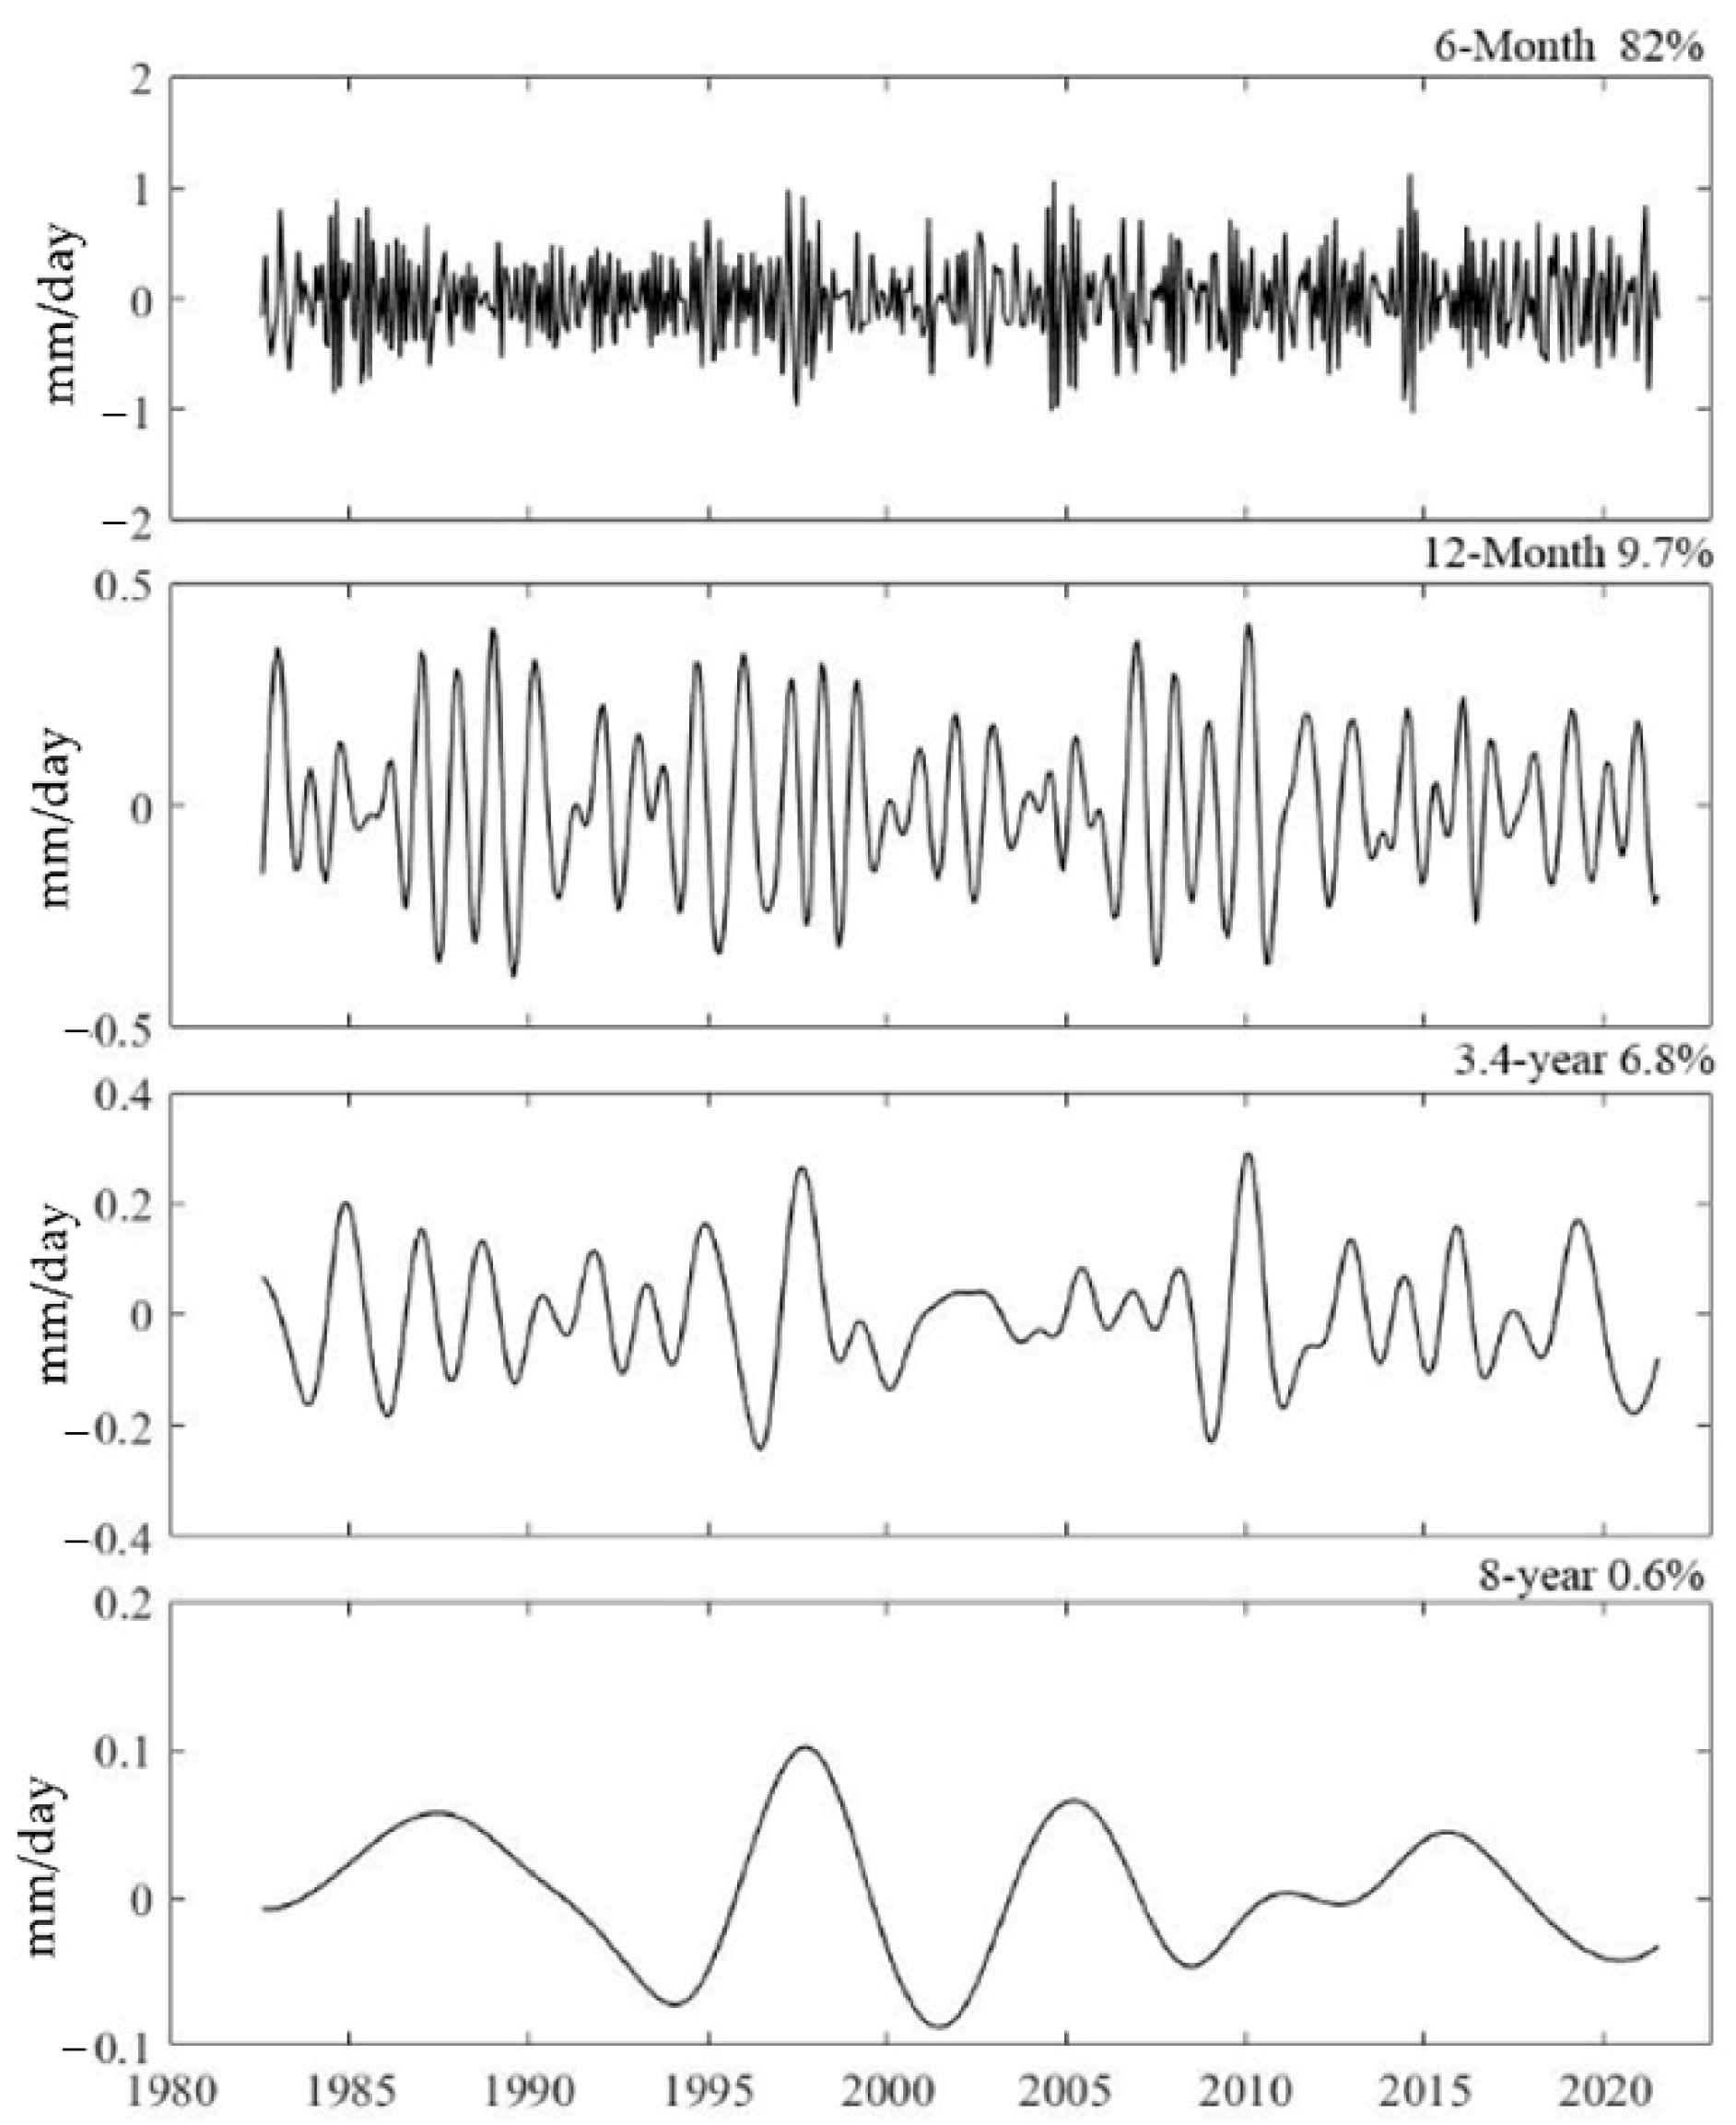
The outcomes of decomposing the IPRP intensity series using the EEMD approach demonstrate that the intensity variation pattern of the IPRP is similarly primarily centered on seasonal variation (explained variance of 82%) that is even stronger than the seasonal variation of the IPWP (Figure 7). The interannual signal (3.4-year), which accounts for 6.8% of the explained variance, and the interdecadal signal, which accounts for 0.6 percent of the explained variance, are the next two dominant components.
3.2. Seasonal and Interannual Variability Characteristics of the IPWP and IPRP
3.2.1. Seasonal Variability Characteristics of the IPWP and IPRP
Figure 2 and Figure 4 of Yin’s study [42] go into good detail about the seasonal pattern of the IPWP. In general, fluctuations in area and intensity caused by the meridional shift of subsolar point are the most pronounced seasonal pattern of the IPWP variations. The seasonal variation of IPWP differs greatly in the Indian Ocean and Pacific Ocean. First of all, the intra-annual cycle of seasons in the IOWP is especially distinctive due to the Indian Ocean’s unique northern continental barrier and extremely potent Indian monsoon influences. The WPWP, on the other hand, primarily exhibits semi-annual fluctuation due to its magnitude. Precisely, when the sun is directly positioned at the equator, the average heat intensity of the western Pacific Ocean is higher over a smaller area, and when the daylight time is longer, the average intensity weakens, and the area increases.
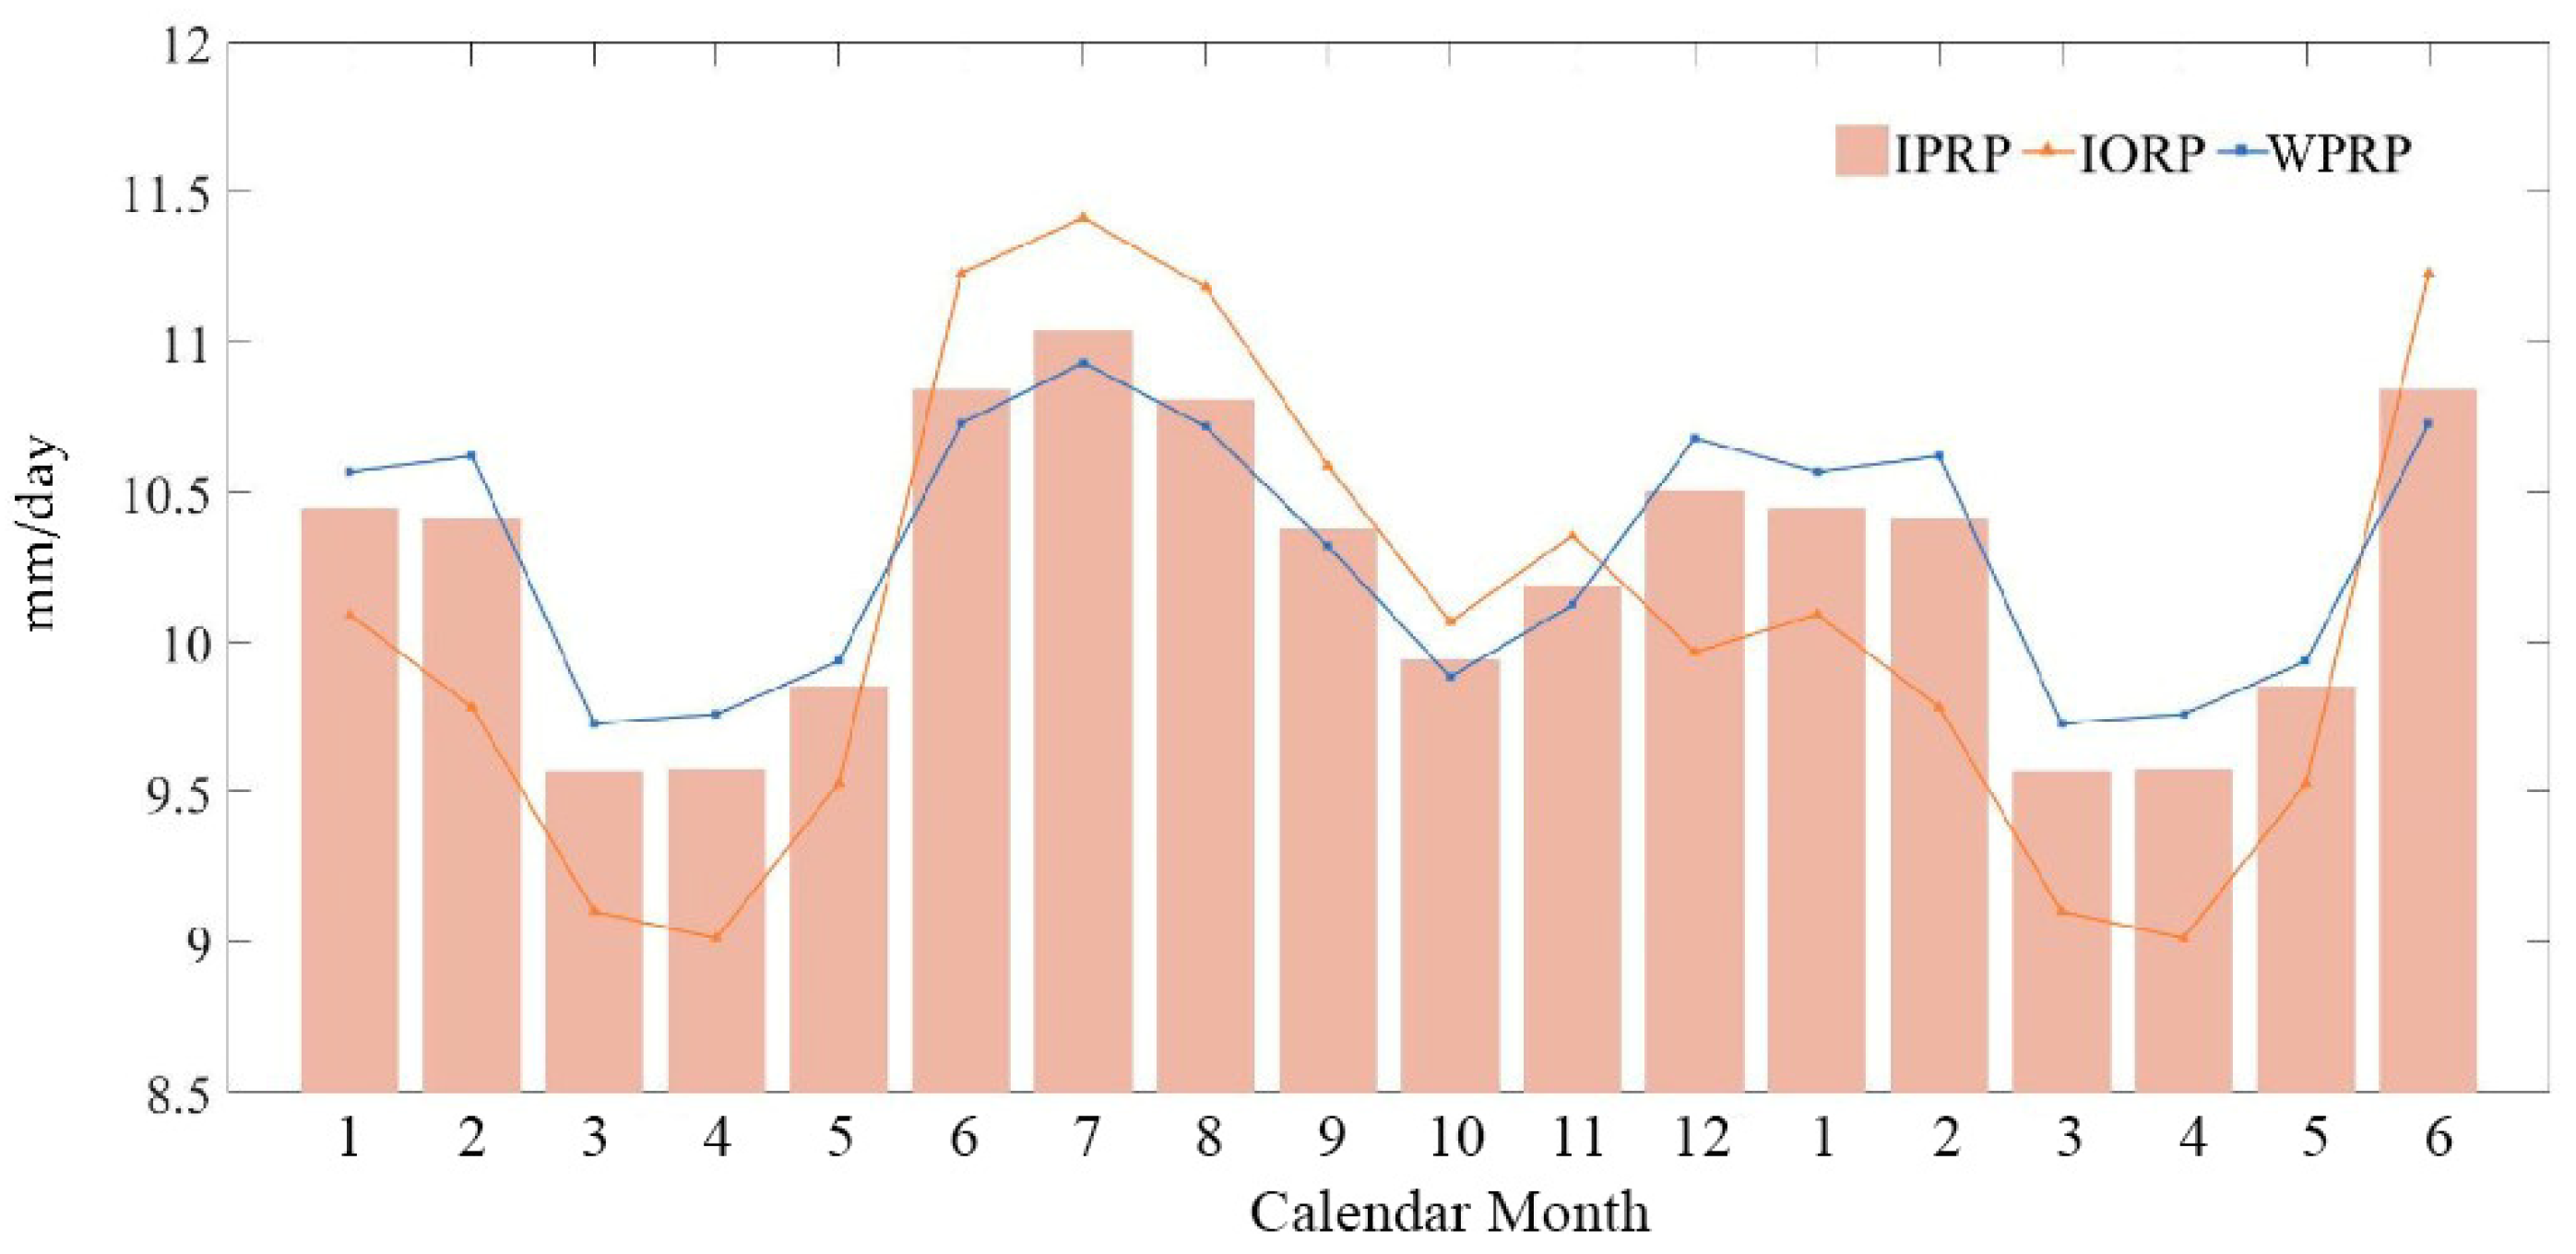
Contrary to the IPWP, however, the IPRP’s strongest variation signals are 6-month cycle signals with two wet and two dry seasons per year (Figure 7 and Figure 8). During boreal summer, the WPRP area and intensity reach their maximum (Figure 9b), which should be influenced by the East Asian monsoon as the WPRP develops and expands to the northwest. Weak peaks of the WPRP area and intensity exist in boreal winter as well, which is associated with the eastward expansion of the southern tongue of the WPWP induced by the enhanced heating. Accompanied by the expansion of the southern tongue of the WPWP, the deep convective region becomes larger, and the WPRP expands eastward as a result (Figure 9d). The seasonal variation of IORP is similar to that of WPRP in that it also peaks in boreal summer and winter, but under the influence of summer monsoon, the IORP is confined to the Bay of Bengal with a minimal area although it appears to be exceedingly intense of the mean intensity (Figure 9b). However, in the boreal winter, under the influence of northeasterly winter monsoon, the IORP expands to the west, and the area increases (Figure 9d).
3.2.2. Interannual Variability Characteristics of the IPWP and IPRP
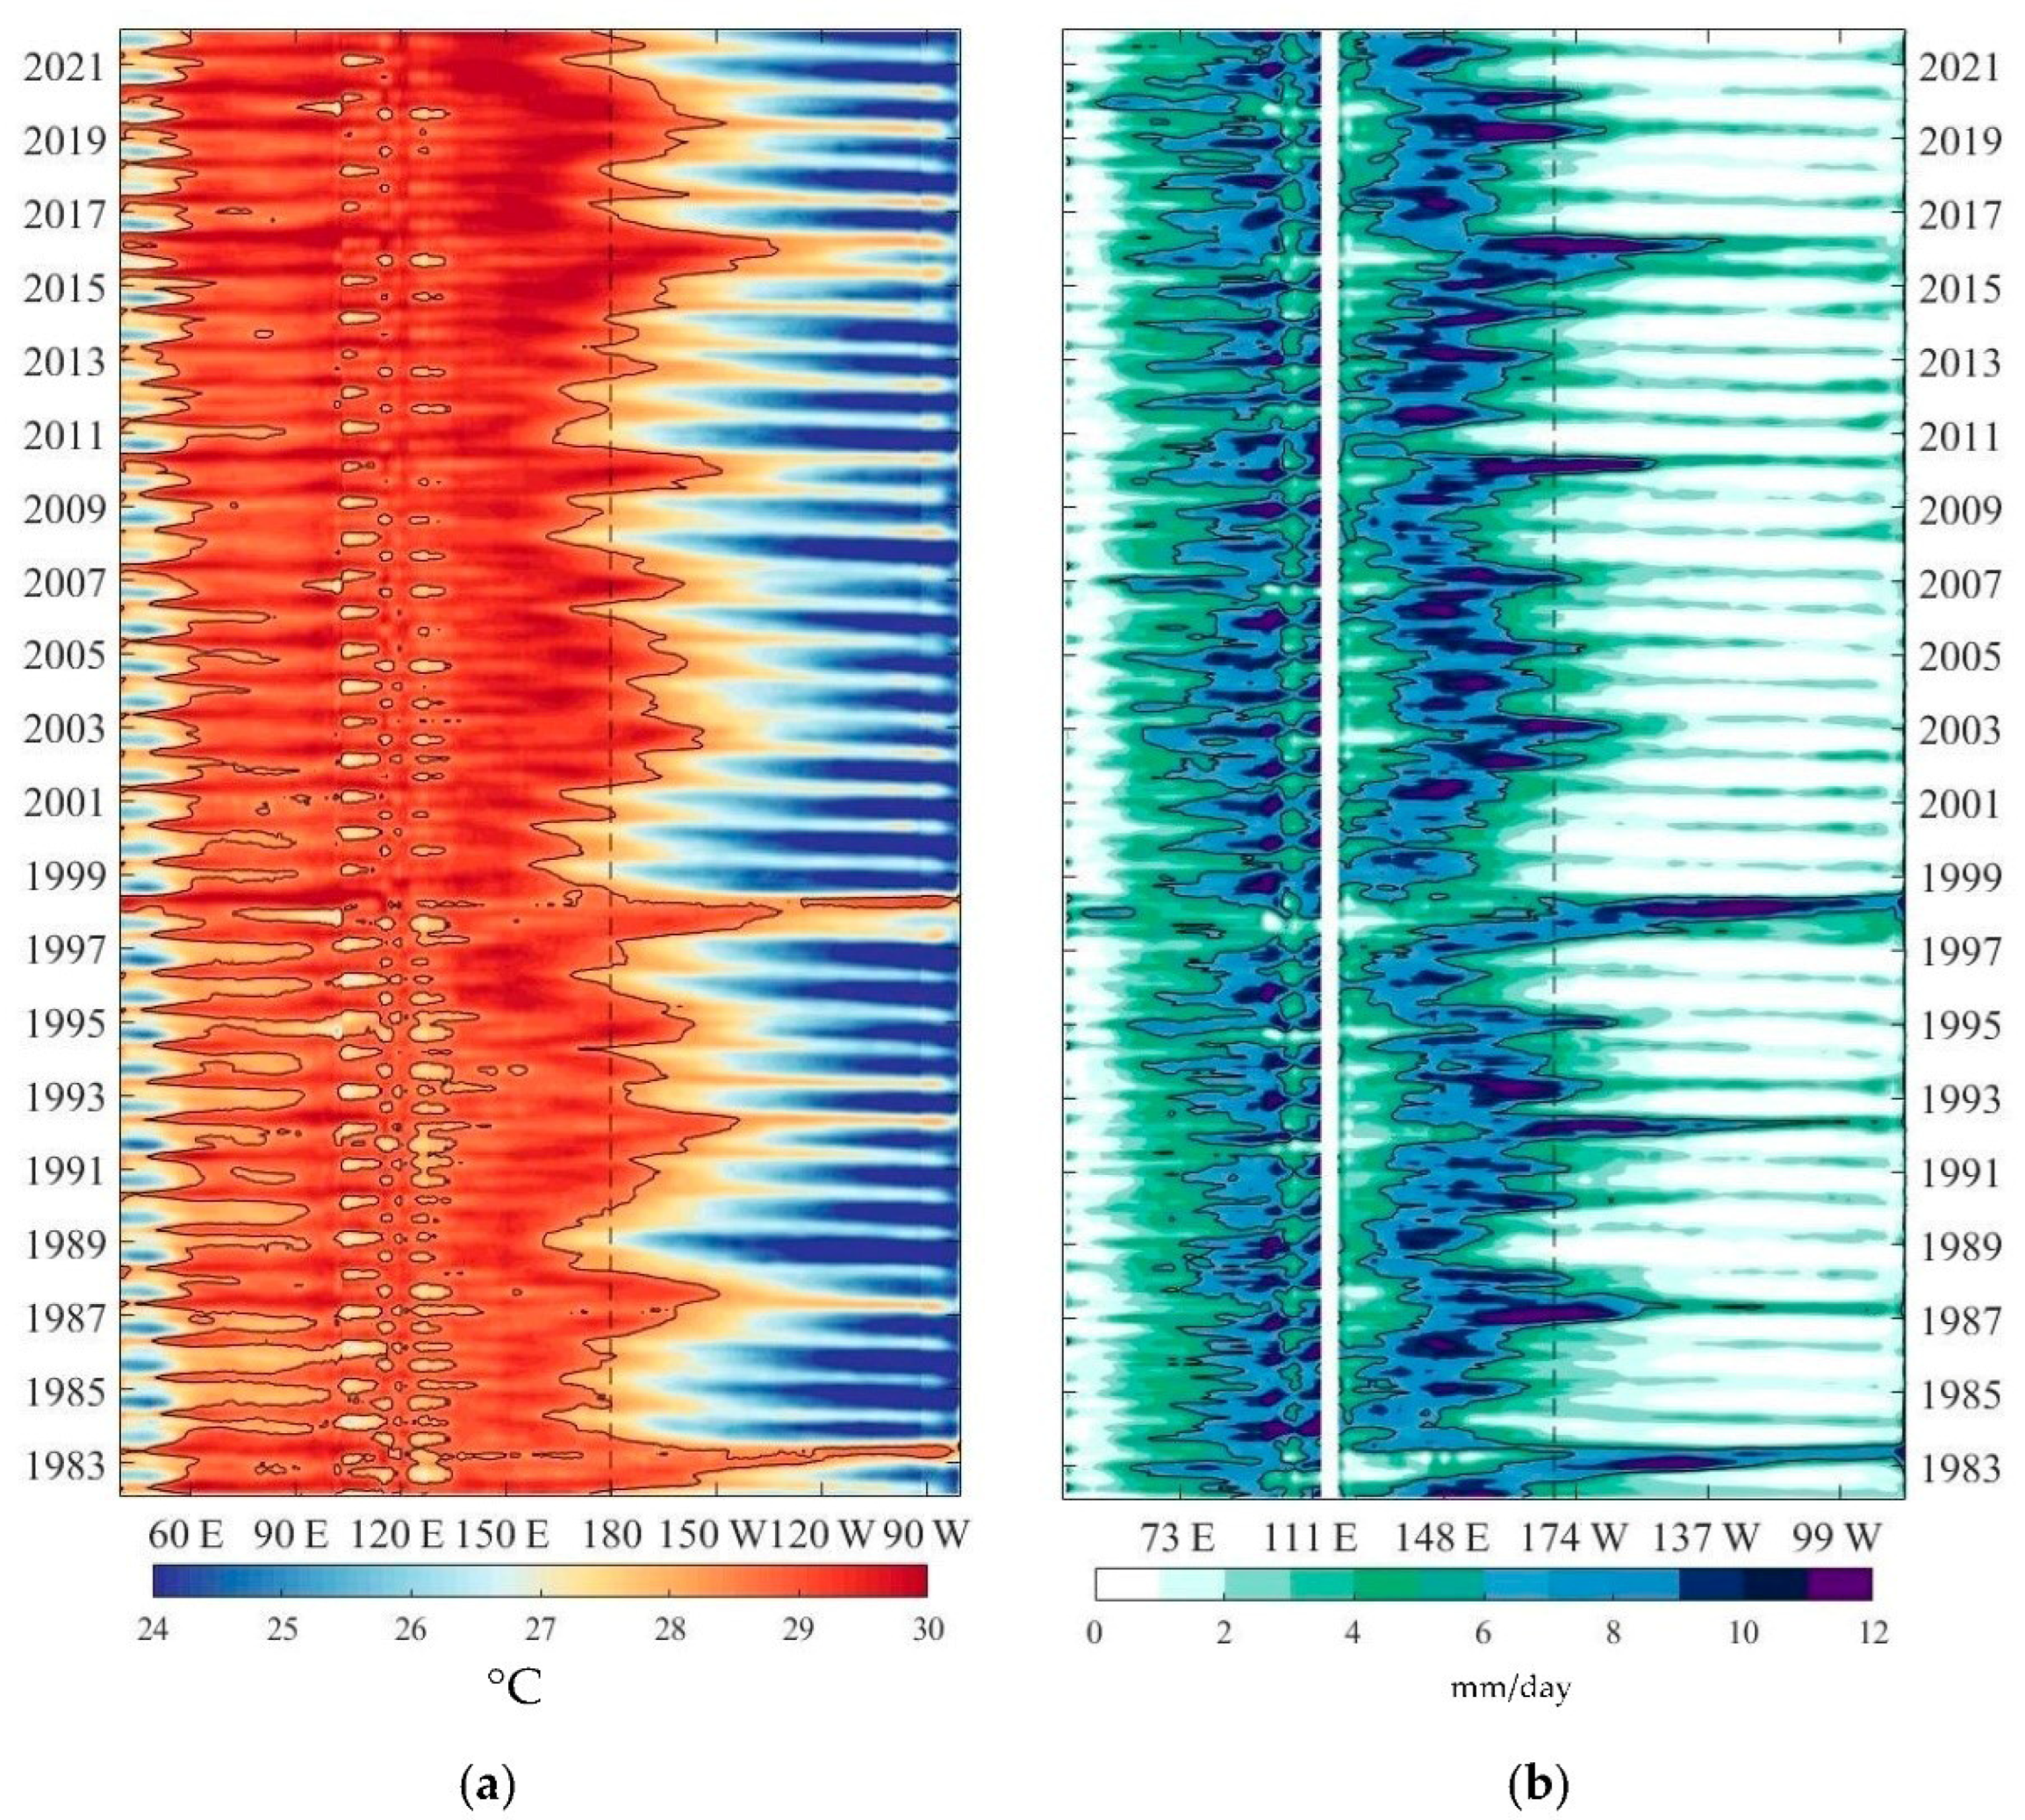
According to previous studies [20,21,22], the warm pool’s zonal migration is indicative of interannual fluctuation patterns. Therefore, the meridional averages of the core regions (5° N–5° S) of the IPWP and IPRP are generated as Hovmöller diagrams and presented in Figure 10 to illustrate the long-term trends and zonal fluctuation patterns. Consistent with the previous findings, the expansion of the IOWP is especially significant, indicating major warming of the equatorial Indian Ocean during the research period. In addition to the long-term expansion trends of the IPWP, seasonal variations can also be seen in their timeseries of area and mean intensity as well as in the Hovmöller plots (Figure 10).
Moreover, it can be seen from Figure 8 that the dateline may be regarded as a variation regime shift line when it comes to the Pacific Ocean. Seasonal oscillations exist west of the dateline, whereas interannual fluctuations occur east of the dateline. Warm and wet features propagating eastward over the dateline to the eastern Pacific are the most noticeable interannual variability for the IPWP and IPRP in the Pacific Ocean. The zonal migrations of the WPWP and WPRP are all well-coordinated with the progression of ENSO. Trans-Pacific propagations of the WPWP and WPRP are particularly noticeable in 1997–1998 and 2015–2016, which coincide with the strong El Niño episodes throughout the research period. Warm water and the precipitation core all migrate across the Pacific during El Niño events. Furthermore, warm water cools during the transition (Figure 10a), yet precipitation develops as the migration progresses (Figure 10b).
3.3. Interannual Covariability of the IPWP and IPRP
3.3.1. The Spatial Distribution and Correlation of Interannual Covariation of the Indo-Pacific Warm Pool and Indo-Pacific Rain Pool
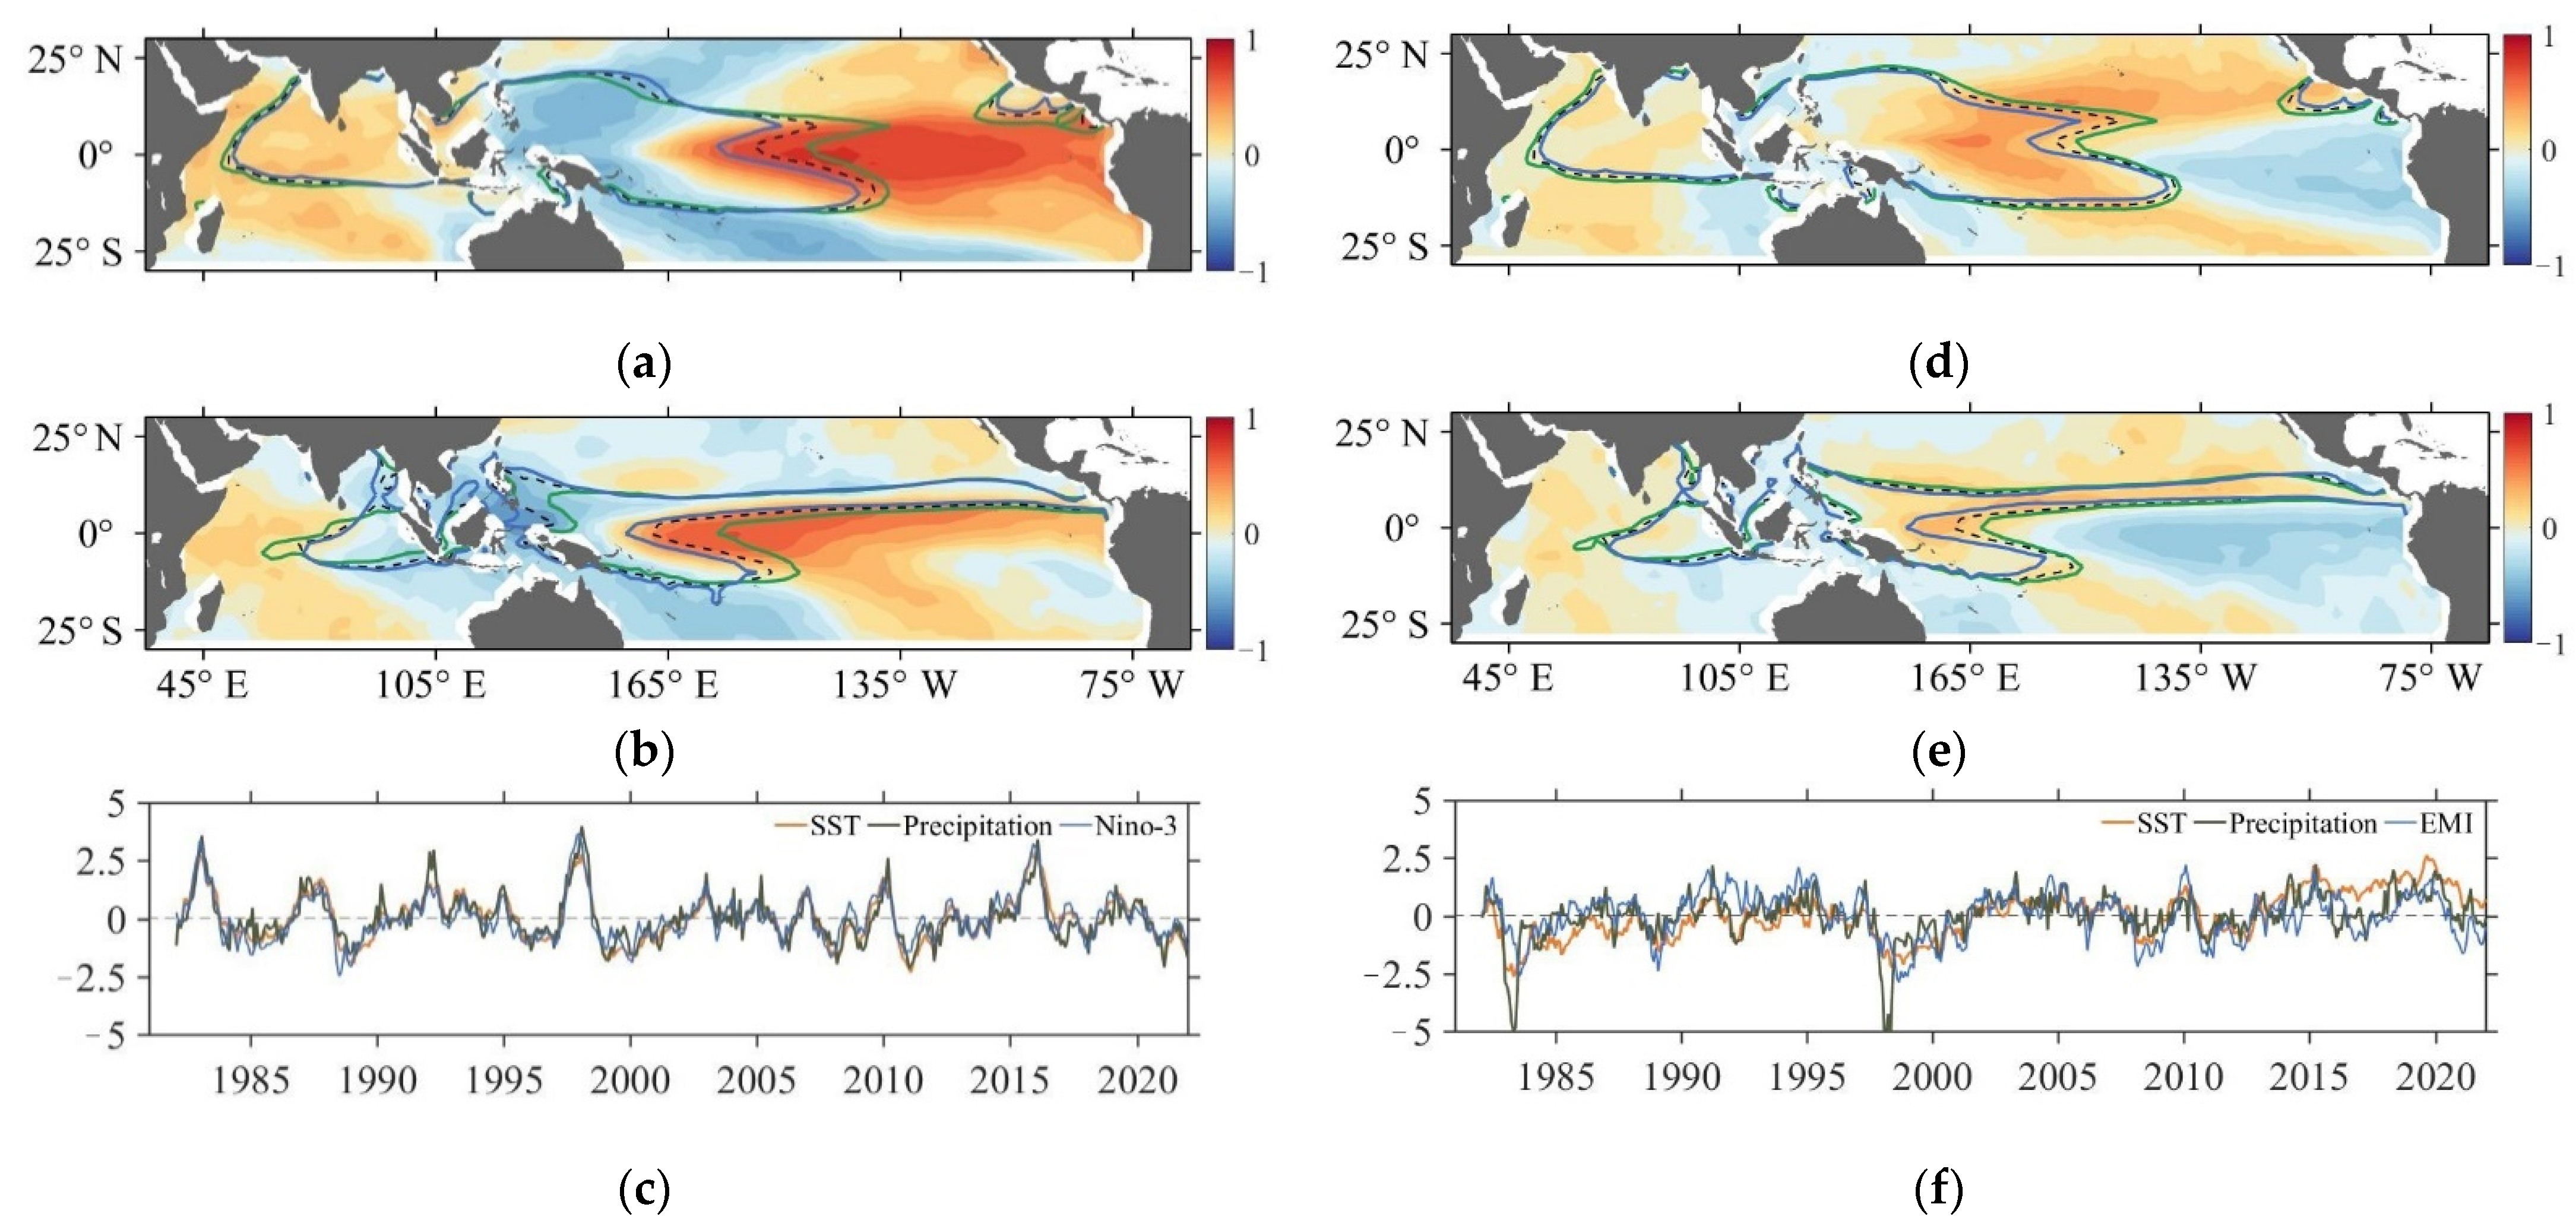
In order to investigate the covariation relationship between IPWP and IPRP and related processes, the temporal cross-covariance matrix between the two fields (monthly anomalies, mean annual cycles removed) was constructed, and the SVD method was then performed on the matrix. Figure 11 shows the first two SVD modes of the IPWP and IPRP covariation, their spatial patterns, and respective expansion coefficients for the period 1982–2021. The first principal mode (SVD-1) is a synchronous interannual variation of SST and precipitation with a correlation coefficient of 0.88 (Figure 11c), whose spatial characteristics are similar to the spatial distribution of canonical ENSO, and the correlation coefficients of the timeseries with Niño-3 are 0.90 and 0.82 (left panels in Figure 11), respectively. In addition, the timeseries of the IPWP area is significantly correlated with Niño-3 (R = 0.51) after removing its seasonal cycles and linear trend. There exists a tripolar pattern of SST, with the tropical Indian Ocean and the eastern tropical Pacific Ocean having singularly positive values, while the western tropical Pacific Ocean has negative values. The ranges of the IPWP and IPRP composited from the positive and negative phases of the first principal component timeseries (PC-1) of SST and precipitation (Figure 11a,b) suggest that when in the canonical ENSO positive (negative) phase, due to the “cold tongue” of the eastern tropical Pacific Ocean being significantly warmer (colder), the IPWP tends to expand (shrink) zonally, but this is only evident in the northern part of the WPWP. Meanwhile, the spatial distribution of precipitation for SVD-1 is also a tripolar pattern with a weaker magnitude. It indicates that when in the canonical El Niño (La Niña) phase, the surroundings of the maritime continent become dryer (wetter), and the WPRP shifts eastward (westward) in the equatorial western Pacific Ocean.
The second principal mode (SVD-2) is also a synchronous interannual variation with the correlation coefficient of 0.66, which is an ENSO Modoki-like spatial distribution (Figure 11d–f), and the correlation coefficients of the timeseries of SST and precipitation with EMI are 0.59 and 0.53, respectively. The SVD-2 is weaker than the SVD-1, and the ranges of the IPWP and IPRP composited from the positive and negative phases of the second principal component timeseries (PC-2) of SST and precipitation (Figure 11f) indicate that the IPWP and IPRP vary less between the positive phase and negative phase of ENSO Modoki than of canonical ENSO.
3.3.2. Composite Analysis of the Indo-Pacific Warm Pool and Indo-Pacific Rain Pool during Various Types of ENSO Events
The SVD analysis reveals that ENSO, with the most significant variation in canonical ENSO, is the most significant associated climate pattern of co-variation of SST and precipitation within the IPWP. It is not a good option to separate the time period into different types of ENSO event processes based on one criterion within the same time period; nevertheless the ENSO indices indicating distinct types always indicate one type individually. Here, we adopt the unified complex ENSO index (UCEI) to delineate and compose an analysis of the relevant physical variables for the IPWP and IPRP for the period 1982–2021 in terms of their variation patterns and regimes in the opposing phases of the various types of ENSO. Here, the unified complex ENSO index (UCEI) is employed to define and compose the analyses of the relevant physical variables of the IPWP and IPRP for the period 1982–2021 in terms of their patterns of fluctuation during the opposing phases of the various forms of ENSO.
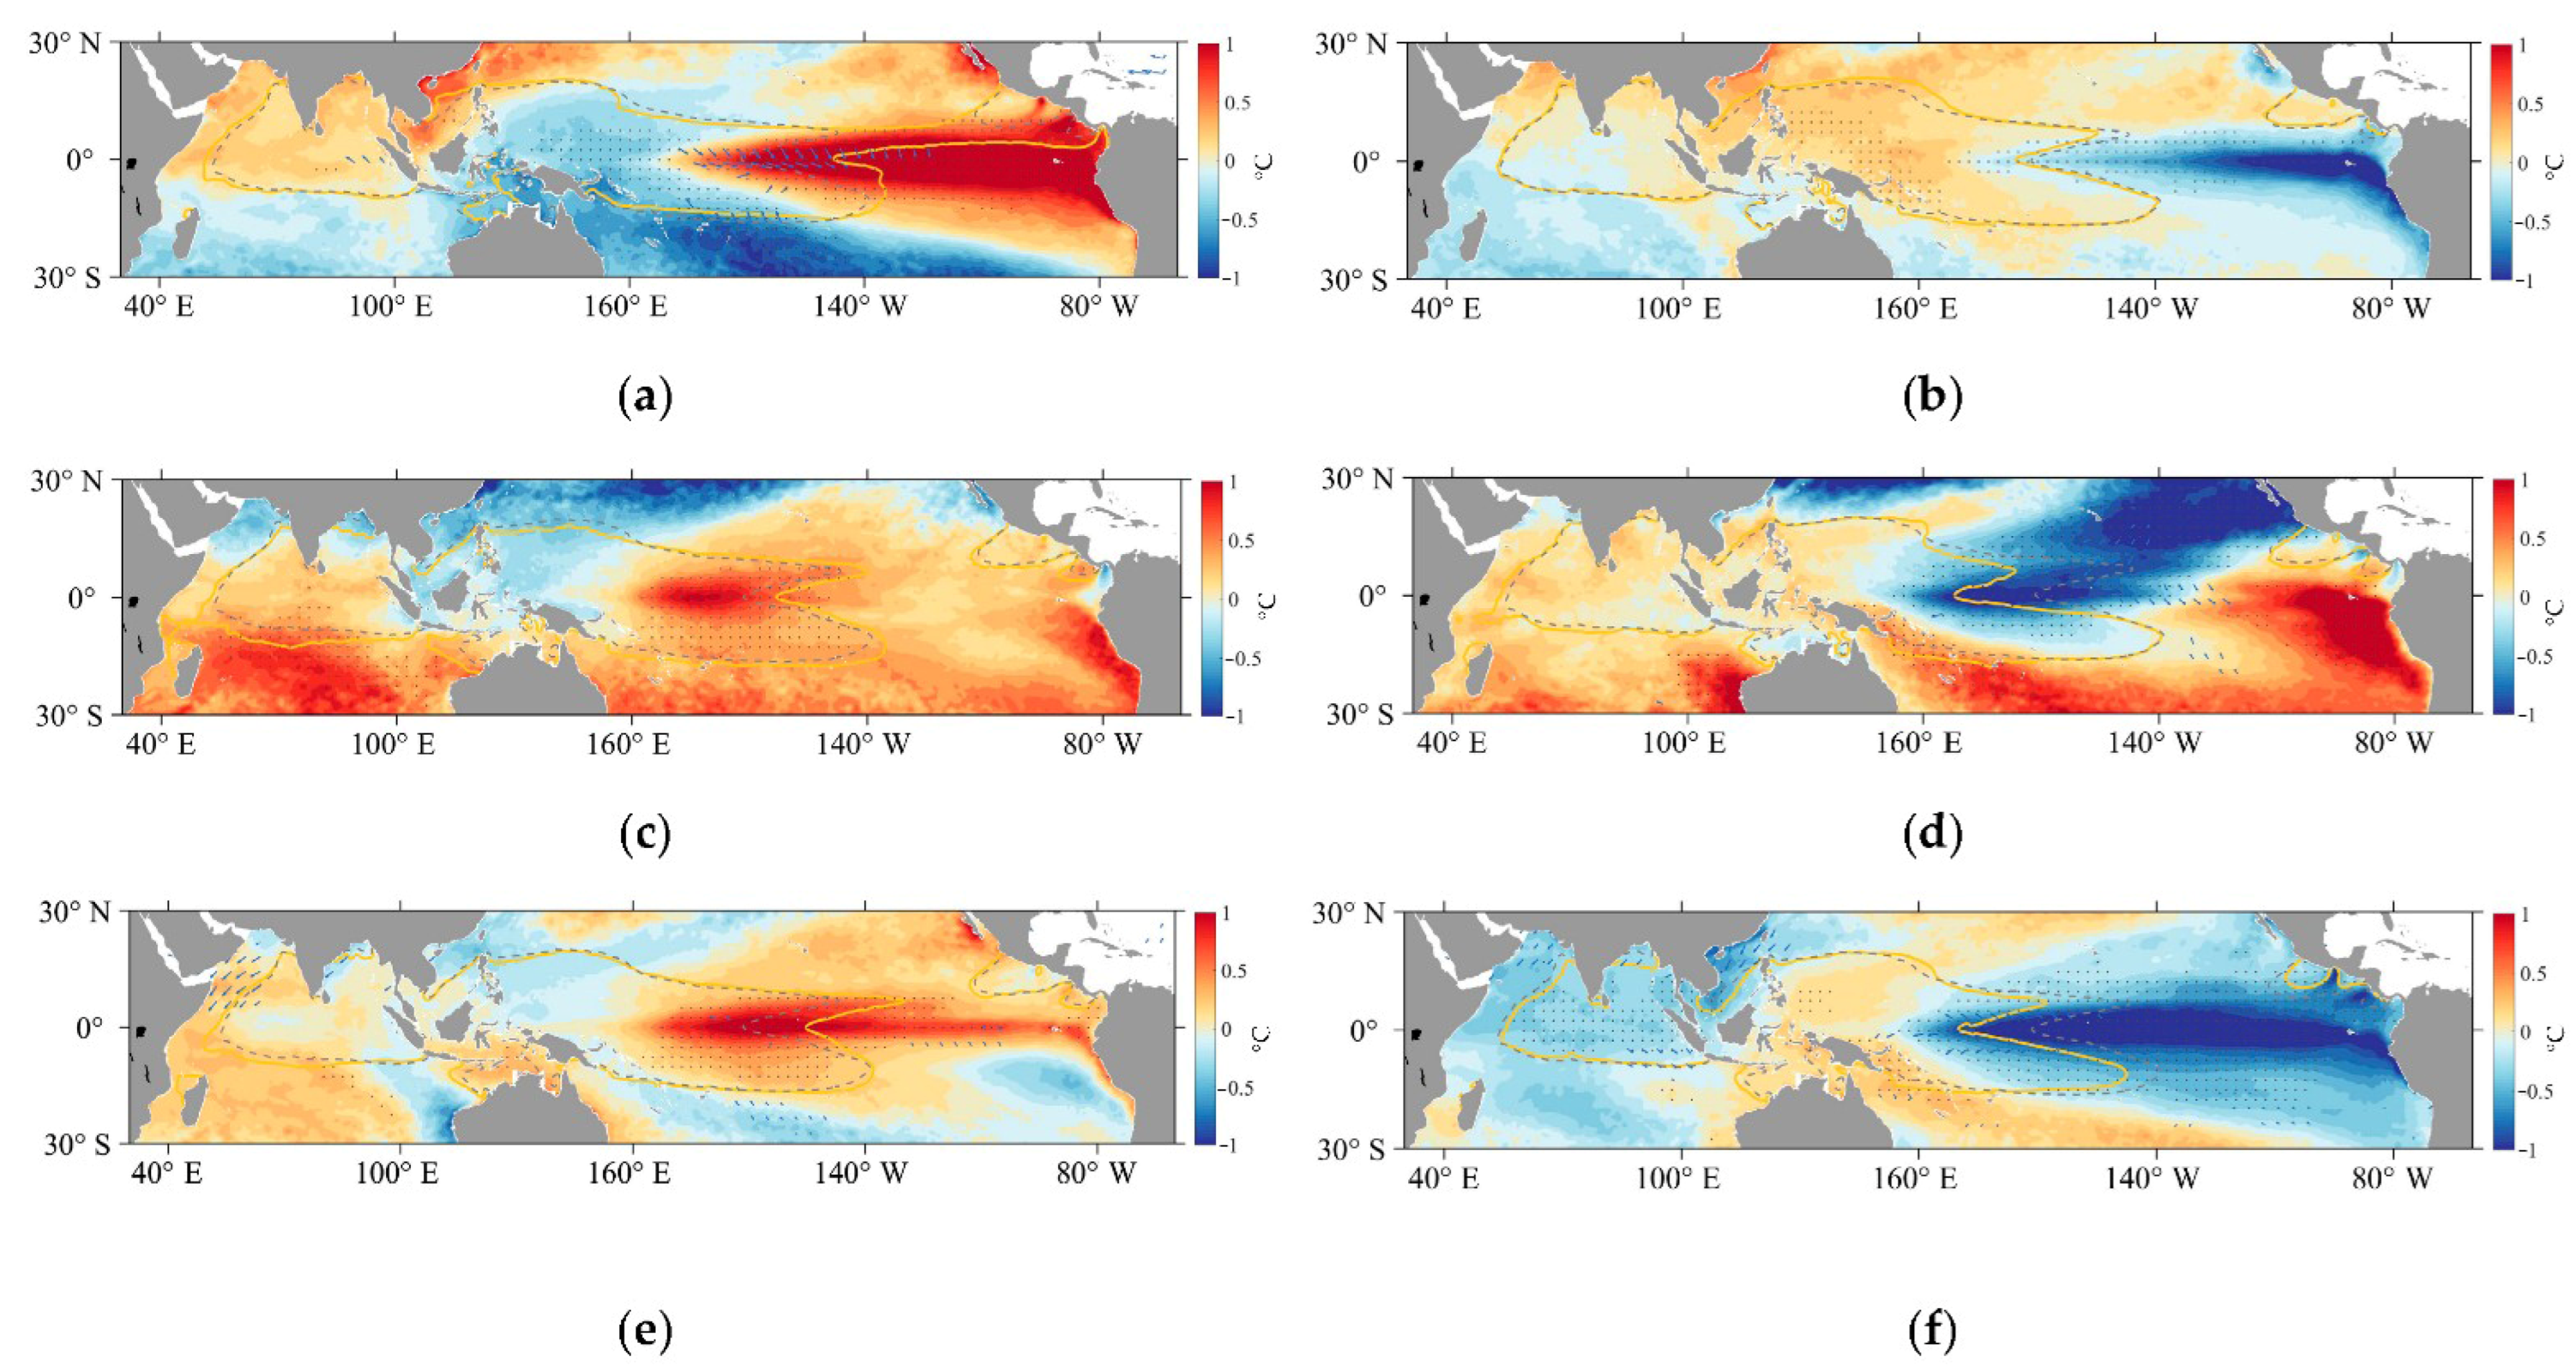
The composites of SSTA, and surface wind anomalies in both phases of different types of ENSO are shown in Figure 12. During canonical El Niño events, the western part of the WPWP shows significant negative SSTA, and the eastern part shows significant positive SSTA under the influence of the dramatic warming of the “cold tongue” of the equatorial eastern Pacific, while the IOWP shows only a moderate but insignificant warming trend. In the eastern part of the equatorial WPWP, there are significant westerly anomalies (northwesterly anomalies north of the equator), and the WPWP spreads to its easternmost point, with the double-tongue structure nearly vanishing, and intersects with the WHWP (Figure 12a).
Compared to the mean r value (1.92) of canonical El Niño, the intensity of canonical La Niña is much lower (r = 1.03). The spatial distribution of SSTA of the IPWP during canonical La Niña is opposite to that of El Niño with lower intensity (Figure 12b), with significant warming in the western part of the WPWP and significant cooling in the eastern equatorial part of the WPWP, but the coverage of IPWP does not change substantially from the extent in the normal status.
The SSTA distribution during El Niño Modoki has a significantly high-SSTA center in the eastern equatorial part of the WPWP but has little effect on the eastern structure and boundary. The southern equatorial part of the IOWP also consists of significantly high-SSTA distribution, and the southern boundary of IOWP shifts to some extent southward (Figure 12c). However, the SSTA distribution pattern during La Niña Modoki is not completely opposite to that of El Niño Modoki, and the intensity of La Niña Modoki (r = 1.69) is higher than that of El Niño Modoki (r = 1.30). During La Niña Modoki, which are the most frequent events (131 months in total during 1982–2021), SST of the “northern tongue” of the WPWP is significantly decreased, and there are significant northeasterly anomalies in the northeast tropical Pacific, which makes the “northern tongue” of the WPWP retract much further westward than the normal status (Figure 12d).
The SSTA distribution during mixed El Niño is similar to that of El Niño Modoki in that the eastern part of the WPWP has significant positive anomalies, and the “northern tongue” of the WPWP expands significantly eastward (Figure 12e). The SSTA distribution during mixed La Niña shows significant negative anomalies in both the entire IOWP and the eastern part of the WPWP, but only the eastern extent of the WPWP shows an eastward expansion (Figure 12f).
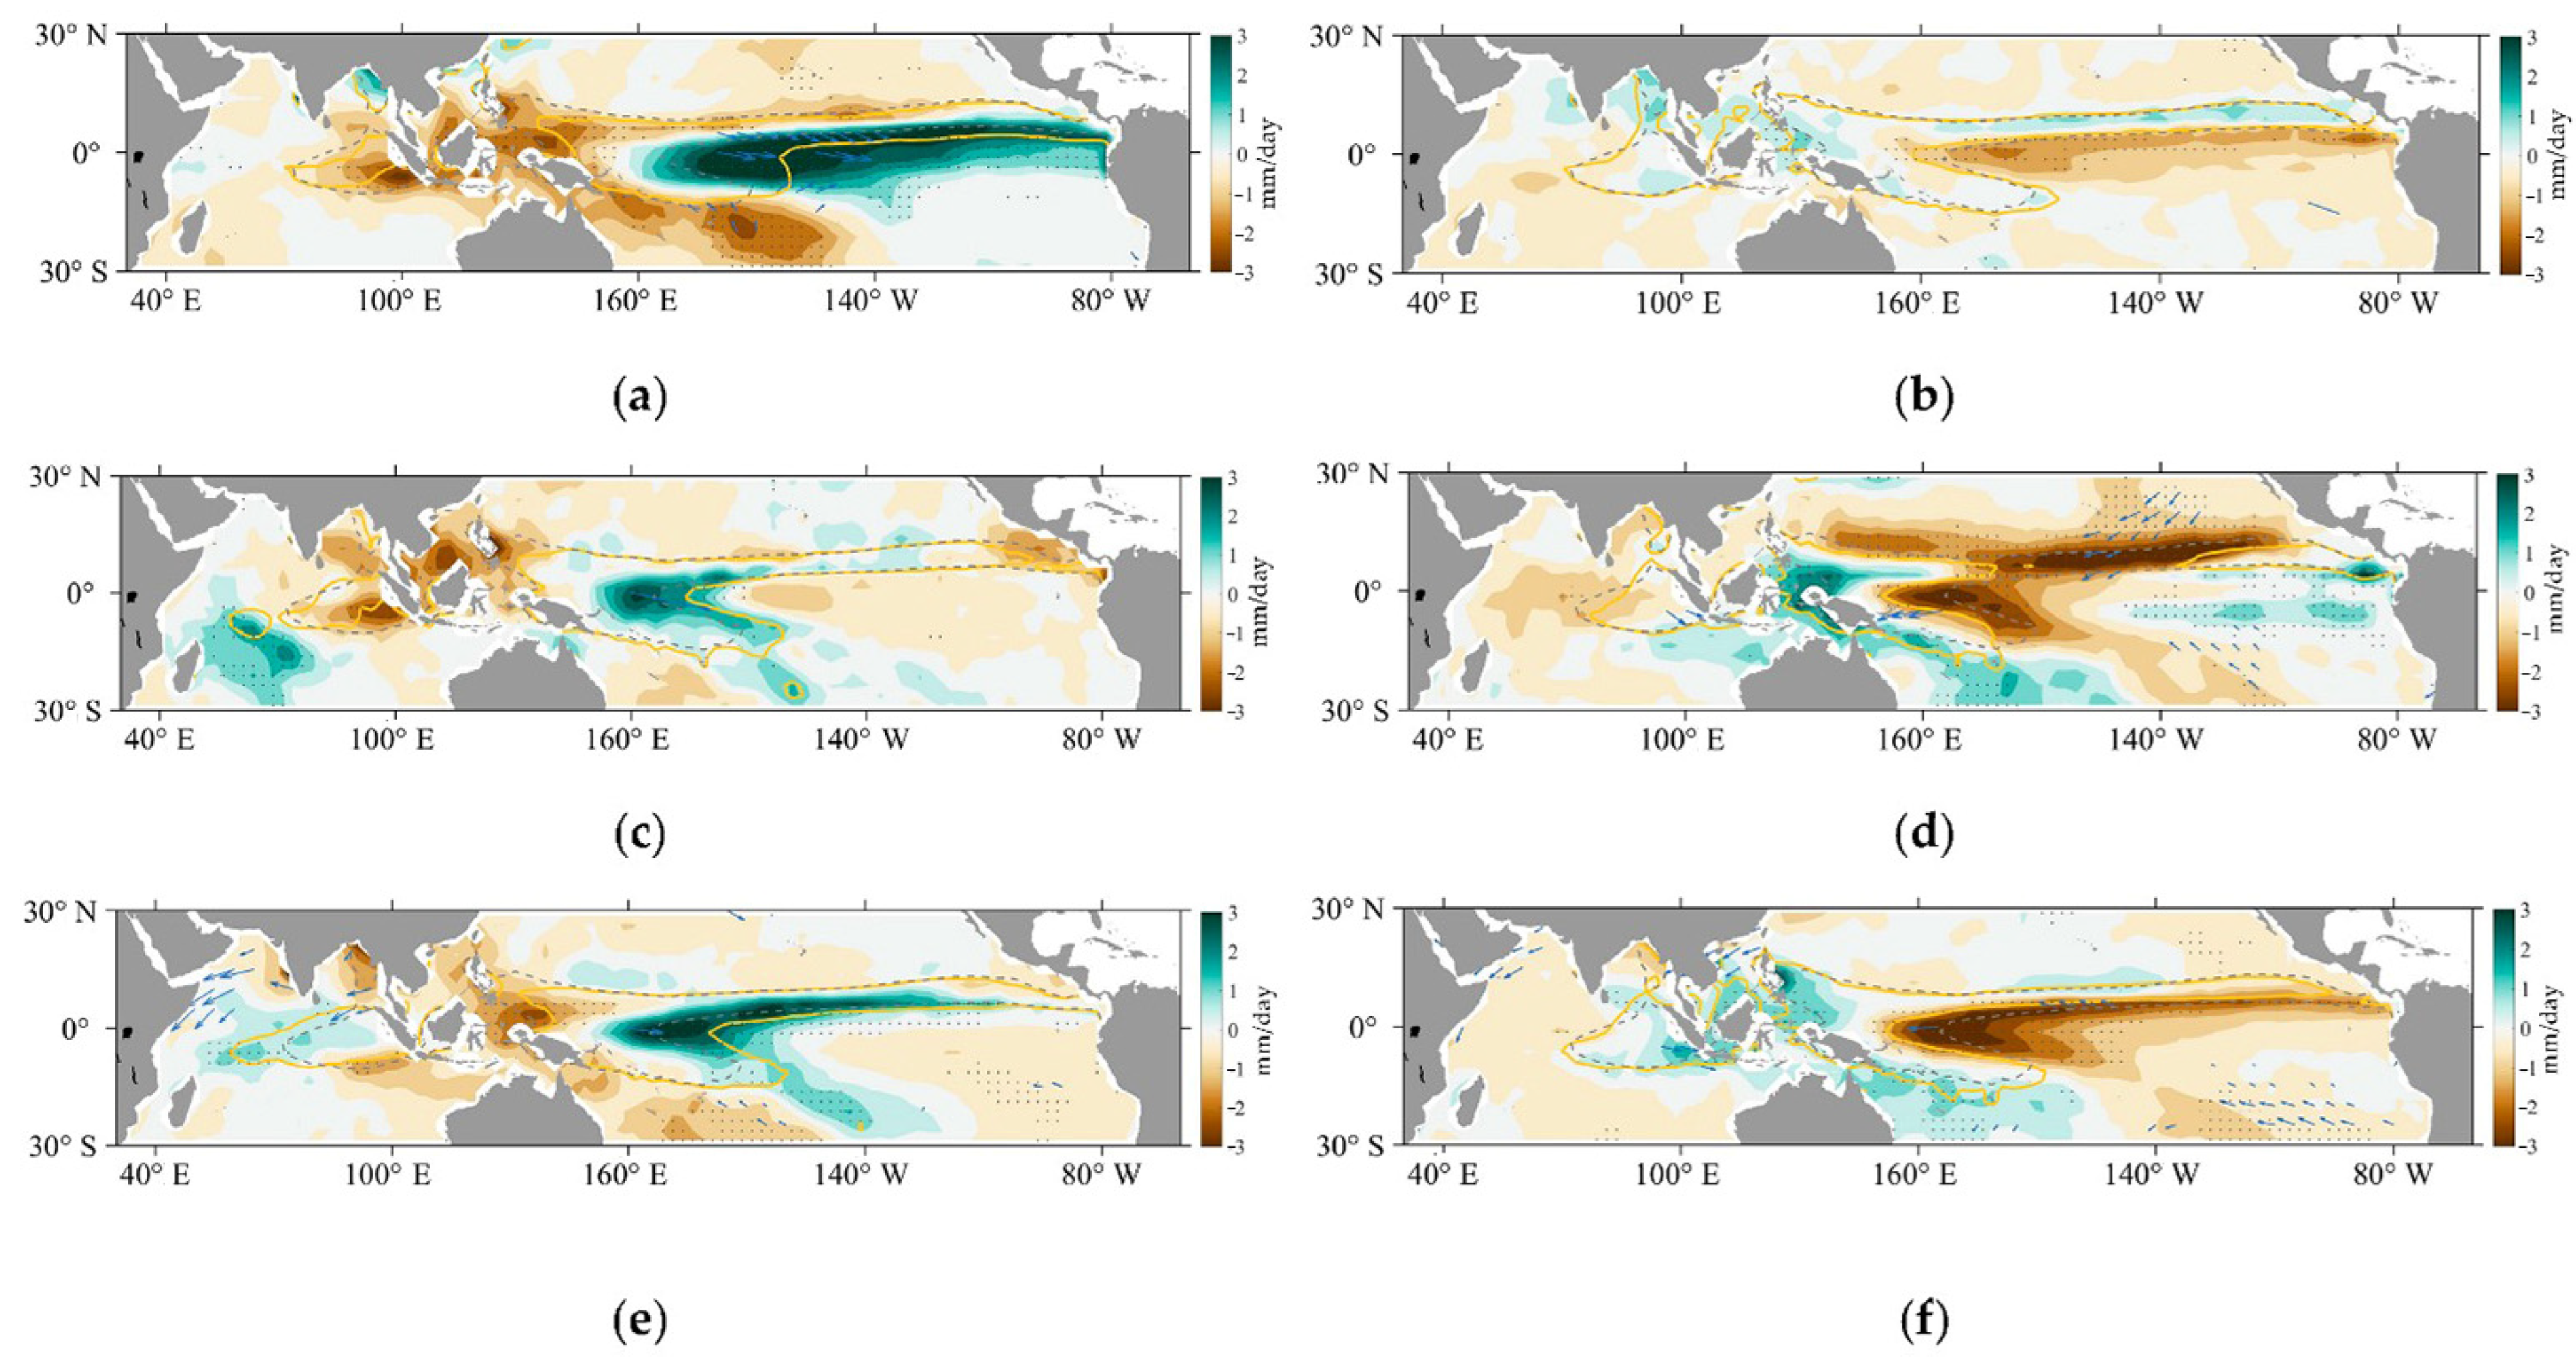
On the other hand, the variation patterns of the IPRP in the opposite phases of each type of ENSO are significantly coupled with those of the IPWP, but the variations are comparatively drastic, especially the precipitation variations in the middle of the IPRP (i.e., over the maritime continent, MC). Similarly, the period with the strongest precipitation variability is the canonical El Niño, where the same westerly anomalies exist in the lower troposphere to the eastern equatorial WPRP, and the center of positive precipitation anomalies also appears at the same location, thus expanding the eastern part of the WPRP to the east. However, the IPRP vanishes over MC under the domination of significant negative anomalies, especially the presence of negative anomaly center near Sumatra-Java Island, where the IORP contracts. The pattern of IPRP variation during canonical La Niña is similar to that of IPWP, with lower intensity of variation and only moderate retraction in the eastern equatorial region.
The center of the positive precipitation anomaly during El Niño Modoki is distributed in the western part of the IORP and the western part of the WPRP, and the center of the negative anomaly is over the MC. The extent of the IPRP thus expands in the eastern and western equatorial regions to some extent and generates contraction over the MC. During La Niña Modoki, there is a negative precipitation center in the northern equatorial part of the eastern Pacific Ocean, which is combined with low tropospheric northeasterly wind anomalies. The ITCZ split in the middle, and the “northern tongue” of the WPRP retracts significantly to the west. This pattern is consistent with that of the IPWP during La Niña Modoki.
The variation during mixed El Niño is similar to that of the IPWP and likewise to that during El Niño Modoki, with significant positive anomalous regions of precipitation in the eastern and western parts of the equatorial IPRP, where the IPRP extends eastward and westward, respectively, and a negative anomalous region over the MC, where the IPRP fades away. On the contrary, the variations in the IPRP during mixed La Niña are only present in the eastern equatorial region of the WPRP (retraction) and over the MC (abundance).
3.3.3. Coupled Process of the IPWP and IPRP during Various Types of ENSO
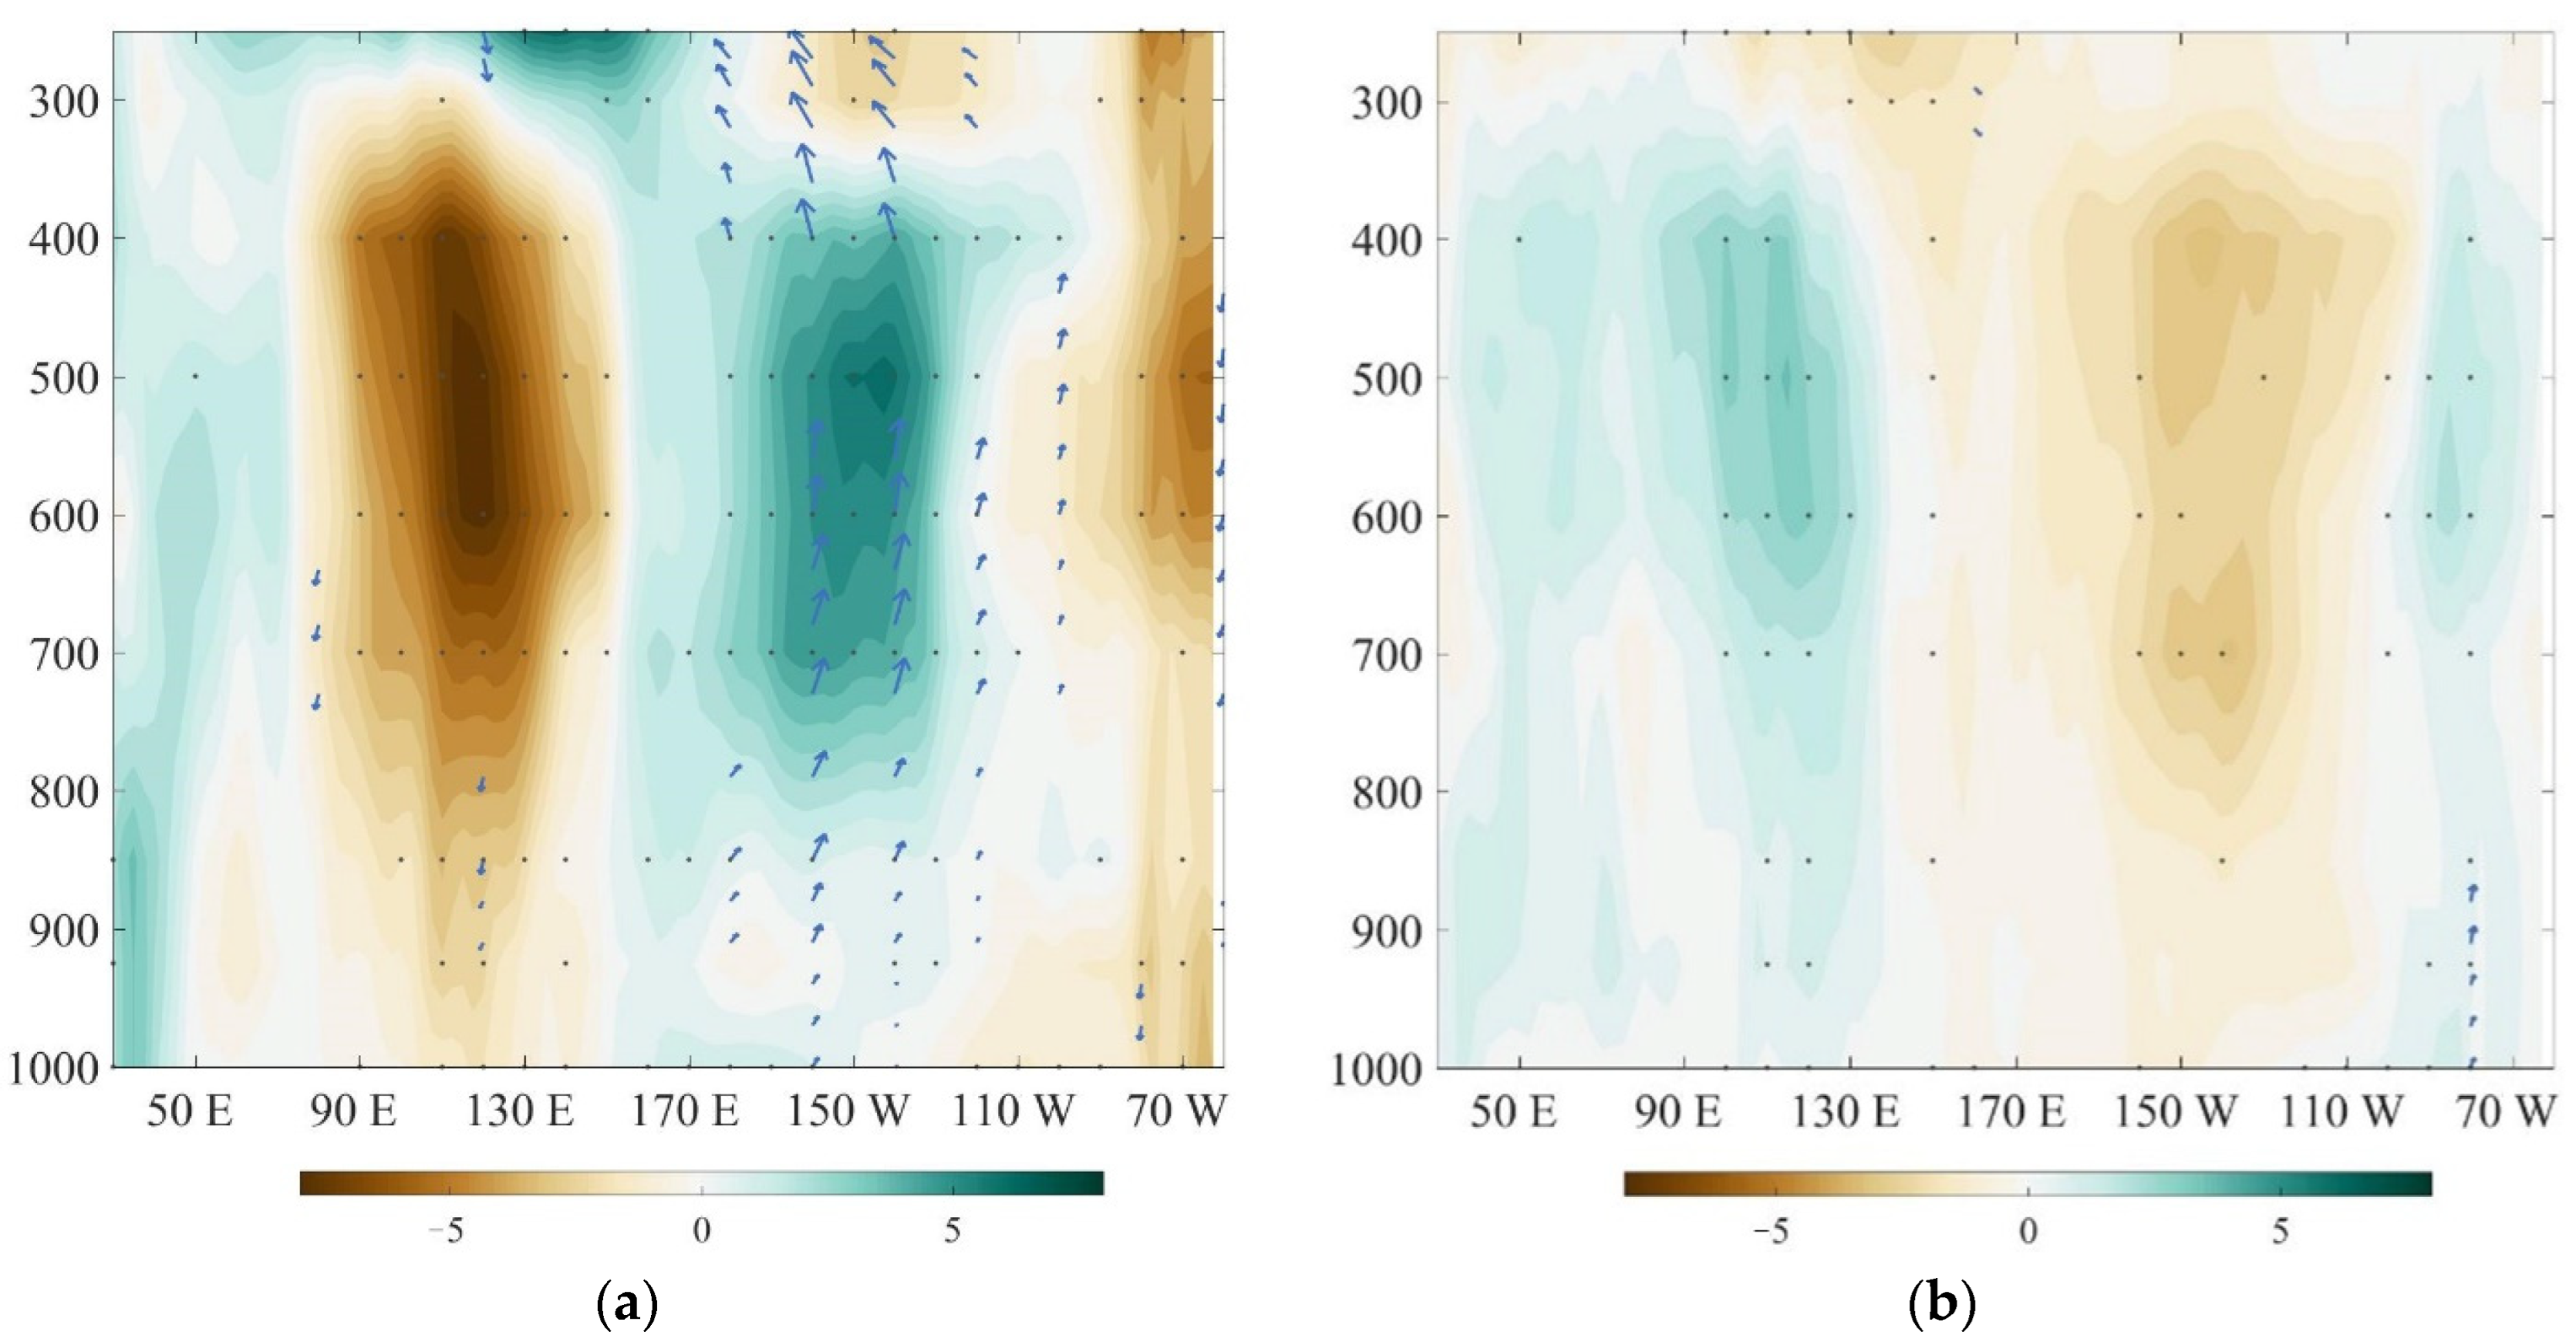
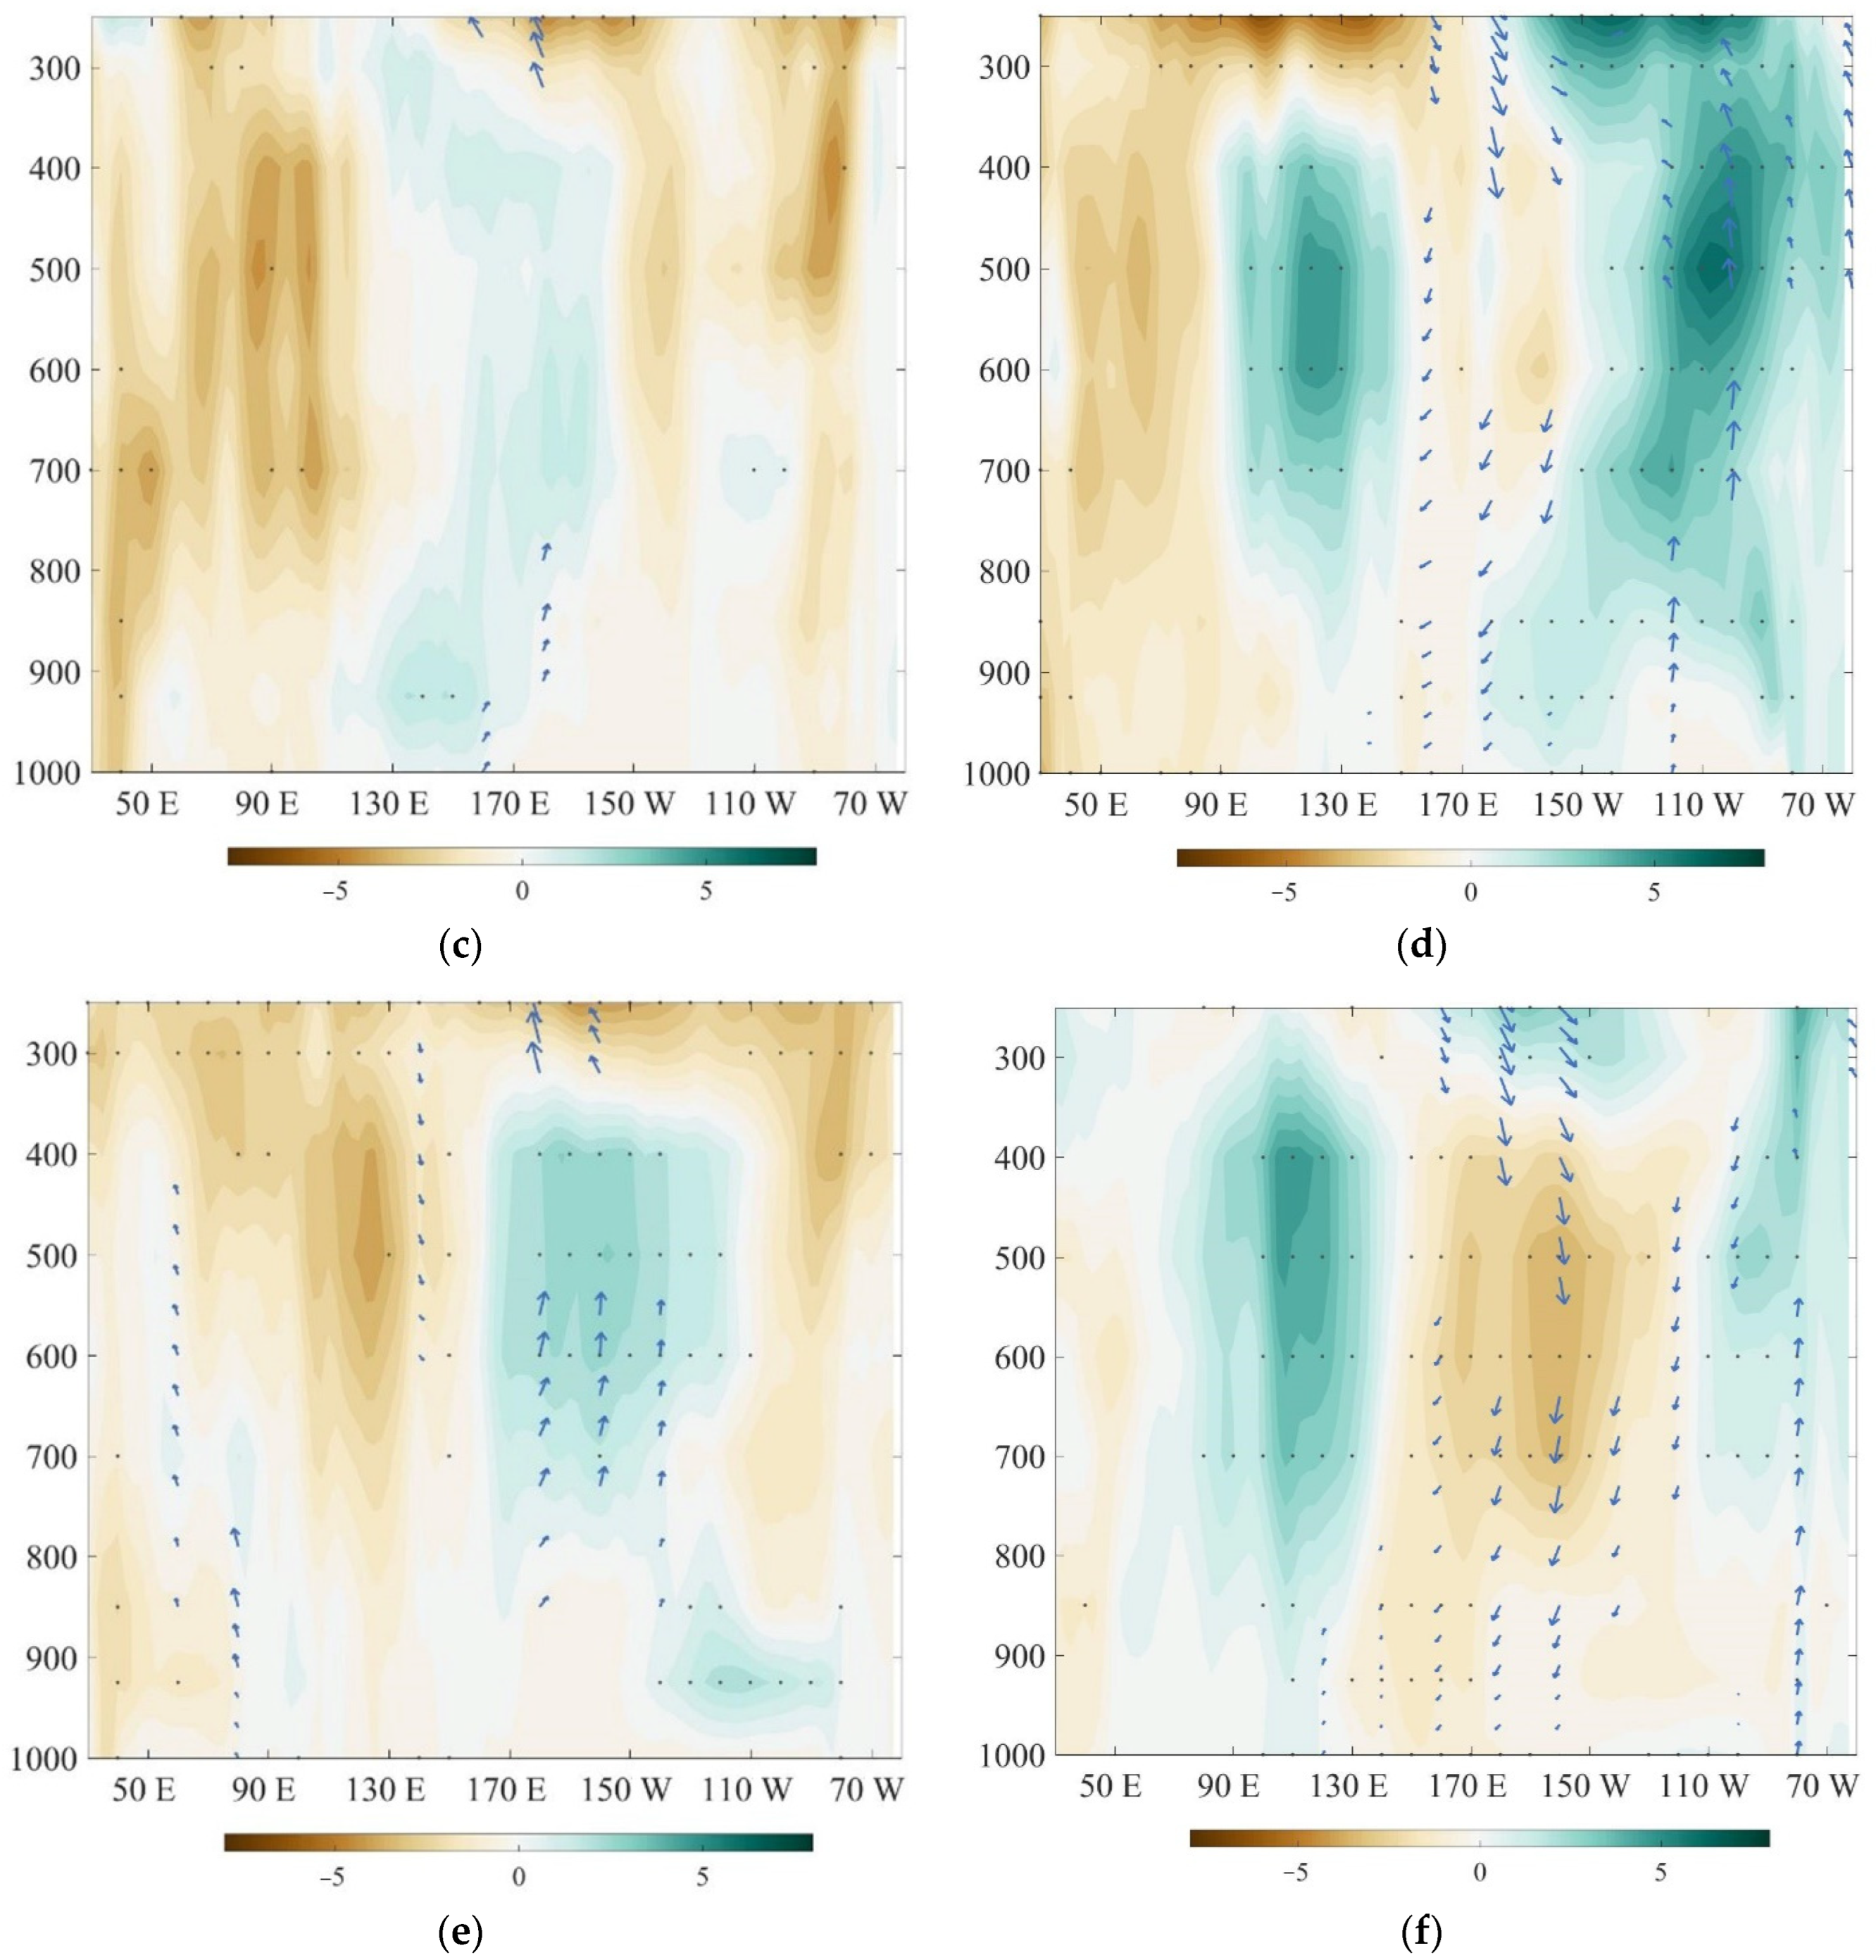
From the results of SVD and composite analysis, it is noted that there are coupled variation patterns of the IPWP and IPRP in both phases of different types of ENSO, and the key regions of variation of SST and precipitation are located near the equator. In this context, the 10° N–10° S meridional-averaged pressure-by-pressure layer relative humidity anomalies with superimposed zonal wind anomalies and vertical velocity anomalies under both phases of different types of ENSO are utilized to analyze the coevolution process between the IPWP and IPRP.
The SSTA and precipitation anomaly features of the two opposite phases of canonical ENSO exhibit symmetrical characteristics (Figure 12a,b and Figure 13a,b), and the same symmetrical characteristics appear in the sea-air coupling (Figure 14). There is a significant positive anomalous center of relative humidity in the troposphere around 150° W during canonical El Niño and a significant negative anomalous center in the troposphere around 120° E. The positive anomaly center is accompanied by significant anomalous upward vertical velocity. Therefore, it can be concluded that during the canonical El Niño, it is mainly due to the anomalous warming SST in the eastern part of the IPWP, which increases the strength of the ascending branch of the Walker circulation and carries substantial moisture into the troposphere, thus developing the IPRP. In contrast, the relative humidity shows an opposite pattern of variation during the canonical La Niña but with lower intensity and without significant accompanying walker circulation variations. The mixed ENSO is similar to the canonical ENSO in that it also has symmetrically opposite features in the positive and negative phases (Figure 12e,f and Figure 13e,f). In each phase of the mixed ENSO, there are positive or negative anomalies in the rising branches near 150° W, leading to the development or decay of IPRP at this location.
However, ENSO Modoki is evidently asymmetric, and the spatial characteristics of SSTA and precipitation anomalies of El Niño Modoki and its wind anomalies (Figure 12c and Figure 13c) indicate that El Niño Modoki probably develops as a result of local SST evolution, which is consistent with the conclusion of Kao and Yu [43]. In contrast, La Niña Modoki is clearly accompanied by northeasterly anomalies in the tropical northeast Pacific (Figure 12d and Figure 13d), so the mechanism of the generation of this corresponding opposite phase probably does not coincide with El Niño Modoki. During El Niño Modoki, there is significant ascending branch anomalies only around 160° E, with positive anomalous relative humidity centers in the lower troposphere, which corresponds to the restrictive variations of the IPRP during this period. There are significant ascending branch anomalies around 110° W during La Niña Modoki, and a positive anomalous center of relative humidity exists in the troposphere, whereas there are significant descending branch anomalies near 170° E, which should be the cause of the ITCZ splitting. The “tropospheric bridge” effect caused by variations in the Hadley circulation during ENSO in the western hemisphere warm pool of Wang is quite similar to the process we examined, with the exception that the Walker circulation is the major “tropospheric bridge” in the IPWP [44].
4. Discussion
This research examines the patterns of multi-scale variability in the world’s largest warm water body, the Indo-Pacific warm pool, as well as the maximum precipitation rate regions in the tropical Indian and Pacific Oceans. The Indo-Pacific warm pool is defined as the enclosed area in the tropical Indian and Pacific Ocean with SST exceeding 28 °C, and the Indo-Pacific rain pool is defined as the region enclosed by the 6 mm/day isoline of the precipitation rate, according to previous studies.
For this study, four datasets of SST, one precipitation data, and associated reanalysis data of atmospheric parameters were utilized. Firstly, the spatial distributions of the IPWP and IPRP are strongly correlated in space, and both have a significant increasing trend of intensity and area after the 1980s. Second, based on the EEMD decomposition, seasonal cycle components dominate the IPWP as well as the IPRP. The seasonal variations of the IPWP are mainly influenced by solar radiation, while the IPRP follows the seasonal evolution of the IPWP and is obviously influenced by monsoons as well. In terms of interannual variation, the 3-to-6-year interannual variation components are also significant, and the zonal shifts of both the IPWP and IPRP can clearly be seen in the Hovmöller plots (Figure 8) to reflect the interannual variation patterns, which are correlated with ENSO.
Based on the SVD analyses, the dominant interannual covariation modes are correlated in time and space, which confirms that in the high-SST zone, the ocean–atmosphere interaction is extremely strong and effective. The dominant interannual variation patterns are shown to be highly correlated with Niño-3 and EMI, which indicate that the most important interannual variations of the IPWP and IPRP are associated with canonical ENSO and ENSO Modoki. Further, the period 1982–2021 is classified into time intervals of opposite events of canonical ENSO, ENSO Modoki, and mixed ENSO based on a unified complex ENSO index. In general, the regions where the IPWP and IPRP varies during El Niño or La Niña are concentrated in the eastern equatorial WPWP and WPRP and in the vicinity of the maritime continent. In particular, the strong intensity of the canonical El Niño itself makes the most significant variations of the IPWP and IPRP in the canonical El Niño events. The positive SSTAs in the equatorial eastern Pacific strengthen the deep convection between the sea and air, thus strengthening the ascending branch of the Walker circulation in the region and carrying a substantial volume of water vapor into the troposphere. In addition, the intensity of La Niña Modoki is also relatively high, and the regions of variation are different from the other two types of La Niña. The anomalously low SST mainly exists in the northern part of the eastern equatorial Pacific Ocean, triggering the northeasterly anomalies and causing the “northern tongue” of the WPWP to contract significantly to the west and the “northern tongue” of the WPRP, i.e., the near-permanent ITCZ, to split in the middle.
In general, there has been a significant expansion and warming of the IPWP in recent 40 years, indicating that global warming has significantly affected this “Earth heat reservoir”. The IPWP and IPRP exhibit the major seasonal variations, followed by the ENSO-related interannual variations. The coupled variability of the IPWP and IPRP is distinct but spatially different in the Indian Ocean and Western Pacific subsections. It is very remarkable that the coupled sea-air variability in the Indian Ocean part is not obvious in the interannual variations, and the most important interannual variability features of the IPWP are all governed by the most important climate factor in the Pacific Ocean basin, i.e., ENSO. In the composite analysis, the Indian Ocean section also does not reflect significant inter-phase variability features that are apparent. This is probably due to the significant seasonal variability in the Indian Ocean warm pool due to local topographic influences, while the interannual variability is not significant. The extremely strong coupling and variation patterns of the IPWP and IPRP are important for understanding the global climate, and in the future, efforts should be aimed at investigating the patterns and mechanisms of this system in coupled climate models.
Author Contributions
Conceptualization, Q.D.; data curation, M.B.; investigation, Z.Y.; methodology, Z.Y.; supervision, Q.D.; writing—original draft, Z.Y.; writing—review and editing, K.X. and M.B. All authors have read and agreed to the published version of the manuscript.
Funding
This research was funded by the National Natural Science Foundation of China (No. 41876210) and the National Key Research and Development Program of China (2017YFA0603003).
Institutional Review Board Statement
Not applicable.
Data Availability Statement
Not applicable.
Acknowledgments
The SST data and the reanalysis data are from the NOAA/OAR/ESRL PSL (www.psl.noaa.gov, accessed on 25 February 2022). We are grateful to NOAA for access to the data.
Conflicts of Interest
The authors declare no conflict of interest.
References
- Wu, Z.; Jiang, C.; Conde, M.; Chen, J.; Deng, B. The long-term spatiotemporal variability of sea surface temperature in the northwest Pacific and China offshore. Ocean Sci. 2020, 16, 83–97. [Google Scholar] [CrossRef]
- Gadgil, S.; Joseph, P.V.; Joshi, N.V. Ocean-atmosphere coupling over monsoon regions. Nature 1984, 312, 141–143. [Google Scholar] [CrossRef]
- Zhou, G.; Yang, S.; Zheng, D. Multi-scale variation of the meridional movement of the western Pacific warm pool and its associated large-scale climate features. Theor. Appl. Climatol. 2017, 129, 859–872. [Google Scholar] [CrossRef]
- Wu, Z.; Jiang, C.; Deng, B.; Chen, J.; Liu, X. Sensitivity of WRF simulated typhoon track and intensity over the South China Sea to horizontal and vertical resolutions. Acta Oceanol. Sin. 2019, 38, 74–83. [Google Scholar] [CrossRef]
- Graham, N.E.; Barnett, T.P. Sea Surface Temperature, Surface Wind Divergence, and Convection over Tropical Oceans. Science 1987, 238, 657–659. [Google Scholar] [CrossRef]
- Zhang, C.; Chen, G. The atmospheric wet pool: Definition and comparison with the oceanic warm pool. Chin. J. Oceanol. Limnol. 2008, 26, 440–449. [Google Scholar] [CrossRef]
- Xie, S.-P.; Deser, C.; Vecchi, G.A.; Ma, J.; Teng, H.; Wittenberg, A.T. Global Warming Pattern Formation: Sea Surface Temperature and Rainfall. J. Clim. 2010, 23, 966–986. [Google Scholar] [CrossRef]
- Fasullo, J.; Webster, P.J. Warm Pool SST Variability in Relation to the Surface Energy Balance. J. Clim. 1999, 12, 1292–1305. [Google Scholar] [CrossRef]
- Cravatte, S.; Delcroix, T.; Zhang, D.; McPhaden, M.; Leloup, J. Observed freshening and warming of the western Pacific Warm Pool. Clim. Dyn. 2009, 33, 565–589. [Google Scholar] [CrossRef]
- Jia, F.; Hu, D.; Hu, S.; Feng, J. Niño4 as a Key Region for the Interannual Variability of the Western Pacific Warm Pool. J. Geophys. Res. Oceans 2017, 122, 9299–9314. [Google Scholar] [CrossRef] [Green Version]
- Chen, G.; Fang, C.; Zhang, C.; Chen, Y. Observing the coupling effect between warm pool and “rain pool” in the Pacific Ocean. Remote Sens. Environ. 2004, 91, 153–159. [Google Scholar] [CrossRef]
- Vinayachandran, P.N.; Shetye, S.R. The warm pool in the Indian Ocean. Proc. Indian Acad. Sci. Earth Planet Sci. 1991, 100, 165–175. [Google Scholar] [CrossRef]
- Liu, Q.; Jiang, X.; Xie, S.-P.; Liu, W.T. A gap in the Indo-Pacific warm pool over the South China Sea in boreal winter: Seasonal development and interannual variability. J. Geophys. Res. Ocean 2004, 109, C07012. [Google Scholar] [CrossRef]
- Yan, X.-H.; Ho, C.-R.; Zheng, Q.; Klemas, V. Temperature and Size Variabilities of the Western Pacific Warm Pool. Science 1992, 258, 1643–1645. [Google Scholar] [CrossRef]
- Ho, C.-R.; Yan, X.-H.; Zheng, Q. Satellite Observations of Upper-Layer Variabilities in the Western Pacific Warm Pool. Bull. Am. Meteorol. Soc. 1995, 76, 669–679. [Google Scholar] [CrossRef]
- Picaut, J.; Ioualalen, M.; Menkes, C.; Delcroix, T.; McPhaden, M.J. Mechanism of the Zonal Displacements of the Pacific Warm Pool: Implications for ENSO. Science 1996, 274, 1486–1489. [Google Scholar] [CrossRef]
- Bosc, C.; Delcroix, T.; Maes, C. Barrier layer variability in the western Pacific warm pool from 2000 to 2007. J. Geophys. Res. Ocean 2009, 114, C06023. [Google Scholar] [CrossRef]
- Lin, C.-Y.; Ho, C.-R.; Zheng, Q.; Huang, S.-J.; Kuo, N.-J. Variability of sea surface temperature and warm pool area in the South China Sea and its relationship to the western Pacific warm pool. J. Oceanogr. 2011, 67, 719–724. [Google Scholar] [CrossRef]
- Cai, W.; Santoso, A.; Wang, G.; Weller, E.; Wu, L.; Ashok, K.; Masumoto, Y.; Yamagata, T. Increased frequency of extreme Indian Ocean Dipole events due to greenhouse warming. Nature 2014, 510, 254–258. [Google Scholar] [CrossRef]
- Weller, E.; Min, S.-K.; Cai, W.; Zwiers, F.W.; Kim, Y.-H.; Lee, D. Human-caused Indo-Pacific warm pool expansion. Sci. Adv. 2021, 374, 6563. [Google Scholar] [CrossRef] [Green Version]
- Xie, S.-P.; Xu, H.; Kessler, W.S.; Nonaka, M. Air-Sea Interaction over the Eastern Pacific Warm Pool: Gap Winds, Thermocline Dome, and Atmospheric Convection. J. Clim. 2005, 18, 5–20. [Google Scholar] [CrossRef]
- Kim, S.T.; Yu, J.-Y.; Lu, M.-M. The distinct behaviors of Pacific and Indian Ocean warm pool properties on seasonal and interannual time scales. J. Geophys. Res. Atmos. 2012, 117, D05128. [Google Scholar] [CrossRef]
- Shijian, H.; Dunxin, H. Heat center of the western Pacific warm pool. Chin. J. Oceanol. Limnol. 2012, 30, 169–176. [Google Scholar] [CrossRef]
- Hu, S.; Hu, D.; Guan, C.; Xing, N.; Li, J.; Feng, J. Variability of the western Pacific warm pool structure associated with El Niño. Clim. Dyn. 2017, 49, 2431–2449. [Google Scholar] [CrossRef]
- Neema, C.P.; Hareeshkumar, P.V.; Babu, C.A. Characteristics of Arabian Sea mini warm pool and Indian summer monsoon. Clim. Dyn. 2012, 38, 2073–2087. [Google Scholar] [CrossRef]
- Xie, F.; Li, J.; Tian, W.; Li, Y.; Feng, J. Indo-Pacific Warm Pool Area Expansion, Modoki Activity and Tropical Cold-Point Tropopause Temperature Variations. Sci. Rep. 2014, 4, 4552. [Google Scholar] [CrossRef]
- Liu, Y.; Sun, C.; Kucharski, F.; Li, J.; Wang, C.; Ding, R. The North Pacific Blob acts to increase the predictability of the Atlantic warm pool. Environ. Res. Lett. 2021, 16, 064034. [Google Scholar] [CrossRef]
- Sun, C.; Kucharski, F.; Li, J.; Jin, F.-F.; Kang, I.-S.; Ding, R. Western tropical Pacific multidecadal variability forced by the Atlantic multidecadal oscillation. Nat. Commun. 2017, 8, 15998. [Google Scholar] [CrossRef]
- Zhou, X.; Chen, Q.; Xie, F.; Li, J.; Li, M.; Ding, R.; Li, Y.; Xia, X.; Cheng, Z. Nonlinear response of Northern Hemisphere stratospheric polar vortex to the Indo-Pacific warm pool (IPWP) Niño. Sci. Rep. 2019, 9, 13719. [Google Scholar] [CrossRef]
- Rayner, N.A.; Parker, D.E.; Horton, E.B.; Folland, C.K.; Alexander, L.V.; Rowell, D.P.; Kent, E.C.; Kaplan, A. Global analyses of sea surface temperature, sea ice, and night marine air temperature since the late nineteenth century. J. Geophys. Res. 2003, 108, 4407. [Google Scholar] [CrossRef]
- Huang, B.; Thorne, P.W.; Banzon, V.F.; Boyer, T.; Chepurin, G.; Lawrimore, J.H.; Menne, M.J.; Smith, T.M.; Vose, R.S.; Zhang, H.-M. NOAA Extended Reconstructed Sea Surface Temperature (ERSST), Version 5; NOAA National Centers for Environmental Information: Washington, DC, USA, 2017. [CrossRef]
- Ishii, M.; Shouji, A.; Sugimoto, S.; Matsumoto, T. Objective analyses of sea-surface temperature and marine meteorological variables for the 20th century using ICOADS and the Kobe Collection. Int. J. Climatol. 2005, 25, 865–879. [Google Scholar] [CrossRef]
- Shaltout, M. Recent sea surface temperature trends and future scenarios for the Red Sea. Oceanologia 2019, 61, 484–504. [Google Scholar] [CrossRef]
- Adler, R.; Wang, J.-J.; Sapiano, M.; Huffman, G.; Chiu, L.; Xie, P.-P.; Ferraro, R.; Schneider, U.; Becker, A.; Bolvin, D.; et al. Global Precipitation Climatology Project (GPCP) Climate Data Record (CDR), Version 2.3 (Monthly); UCAR: Boulder, CO, USA, 2020. [Google Scholar] [CrossRef]
- Kanamitsu, M.; Ebisuzaki, W.; Woollen, J.; Yang, S.-K.; Hnilo, J.J.; Fiorino, M.; Potter, G.L. NCEP-DOE AMIP-II Reanalysis (R-2). Bull. Am. Meteorol. Soc. 2002, 83, 1631–1643. [Google Scholar] [CrossRef]
- Huang, N.E.; Shen, Z.; Long, S.R.; Wu, M.C.; Shih, H.H.; Zheng, Q.; Yen, N.-C.; Tung, C.C.; Liu, H.H. The empirical mode decomposition and the Hilbert spectrum for nonlinear and non-stationary time series analysis. Proc. R. Soc. Lond. Ser. A Math. Phys. Eng. Sci. 1998, 454, 903–995. [Google Scholar] [CrossRef]
- Wu, Z.; Huang, N.E. Ensemble Empirical Mode Decomposition: A Noise-Assisted Data Analysis Method. Adv. Adapt. Data Anal. 2009, 01, 1–41. [Google Scholar] [CrossRef]
- Zhang, Z.Y.; Ren, B.H.; Zheng, J.Q. A unified complex index to characterize two types of ENSO simultaneously. Sci. Rep. 2019, 9, 8373. [Google Scholar] [CrossRef]
- Hoerling, M.P.; Kumar, A.; Zhong, M. El Niño, La Niña, and the Nonlinearity of Their Teleconnections. J. Clim. 1997, 10, 1769–1786. [Google Scholar] [CrossRef]
- Jiayou, H. Qixiang Tongji Fenxi Yu Yubao Fangfa, 4th ed.; China Meteorological Press: Beijing, China, 2013; pp. 20–21. [Google Scholar]
- Roxy, M.K.; Dasgupta, P.; McPhaden, M.J.; Suematsu, T.; Zhang, C.; Kim, D. Twofold expansion of the Indo-Pacific warm pool warps the MJO life cycle. Nature 2019, 575, 647–651. [Google Scholar] [CrossRef]
- Yin, Z.; Dong, Q.; Kong, F.; Cao, D.; Long, S. Seasonal and Interannual Variability of the Indo-Pacific Warm Pool and its Associated Climate Factors Based on Remote Sensing. Remote Sens. 2020, 12, 1062. [Google Scholar] [CrossRef]
- Kao, H.-Y.; Yu, J.-Y. Contrasting Eastern-Pacific and Central-Pacific Types of ENSO. J. Clim. 2009, 22, 615–632. [Google Scholar] [CrossRef]
- Wang, C.; Enfield, D.B. A Further Study of the Tropical Western Hemisphere Warm Pool. J. Clim. 2003, 16, 1476–1493. [Google Scholar] [CrossRef] [Green Version]
Figure 1.
Map of the study region.

Figure 2.
Polar plot of UCEI for 1982–2021. The value along the polar axis indicates the intensity of the ENSO event; the angle indicates the type of ENSO event.
Figure 2.
Polar plot of UCEI for 1982–2021. The value along the polar axis indicates the intensity of the ENSO event; the angle indicates the type of ENSO event.

Figure 3.
(a) Spatial distribution of climatological sea surface temperature (SST) for 1982–2021. The superimposed black line is the 28 °C isothermal, indicating the warm pool range; (b) spatial distribution of climatological precipitation for 1982–2021. The superimposed black line is the 6 mm/day isoline, indicating the rain pool range.

Figure 4.
(a) Area timeseries of the IPWP computed by HadISST, ERSST, COBESST, and OISST, respectively; (b) mean SST timeseries of the IPWP computed by HadISST, ERSST, COBESST, and OISST, respectively. The superimposed dotted line is the linear trend line.
Figure 4.
(a) Area timeseries of the IPWP computed by HadISST, ERSST, COBESST, and OISST, respectively; (b) mean SST timeseries of the IPWP computed by HadISST, ERSST, COBESST, and OISST, respectively. The superimposed dotted line is the linear trend line.

Figure 5.
Climatological IPWP range and core range for 1870–2021 of various eras, computed by HadISST; the black line and red line is 28 °C isothermal, indicating the warm pool range before and after 1980; the colored lines indicate the 29 °C isothermal of the decadal mean SST of the 1980s, 1990s, 2000s, and 2010s.

Figure 6.
EEMD decompositions of the IPWP area timeseries computed by (a) HadISST for 1982–2021, (b) HadISST for 1870–1981, (c) ERSST for 1982–2021, (d) ERSST for 1854–1981, (e) COBESST for 1982–2021, (f) COBESST for 1891–1981, and (g) OISST for 1982–2021.
Figure 6.
EEMD decompositions of the IPWP area timeseries computed by (a) HadISST for 1982–2021, (b) HadISST for 1870–1981, (c) ERSST for 1982–2021, (d) ERSST for 1854–1981, (e) COBESST for 1982–2021, (f) COBESST for 1891–1981, and (g) OISST for 1982–2021.


Figure 7.
EEMD decompositions of the mean precipitation timeseries of the IPRP.

Figure 8.
Seasonal cycle of the IPRP and respective subdivisions mean intensity.

Figure 9.
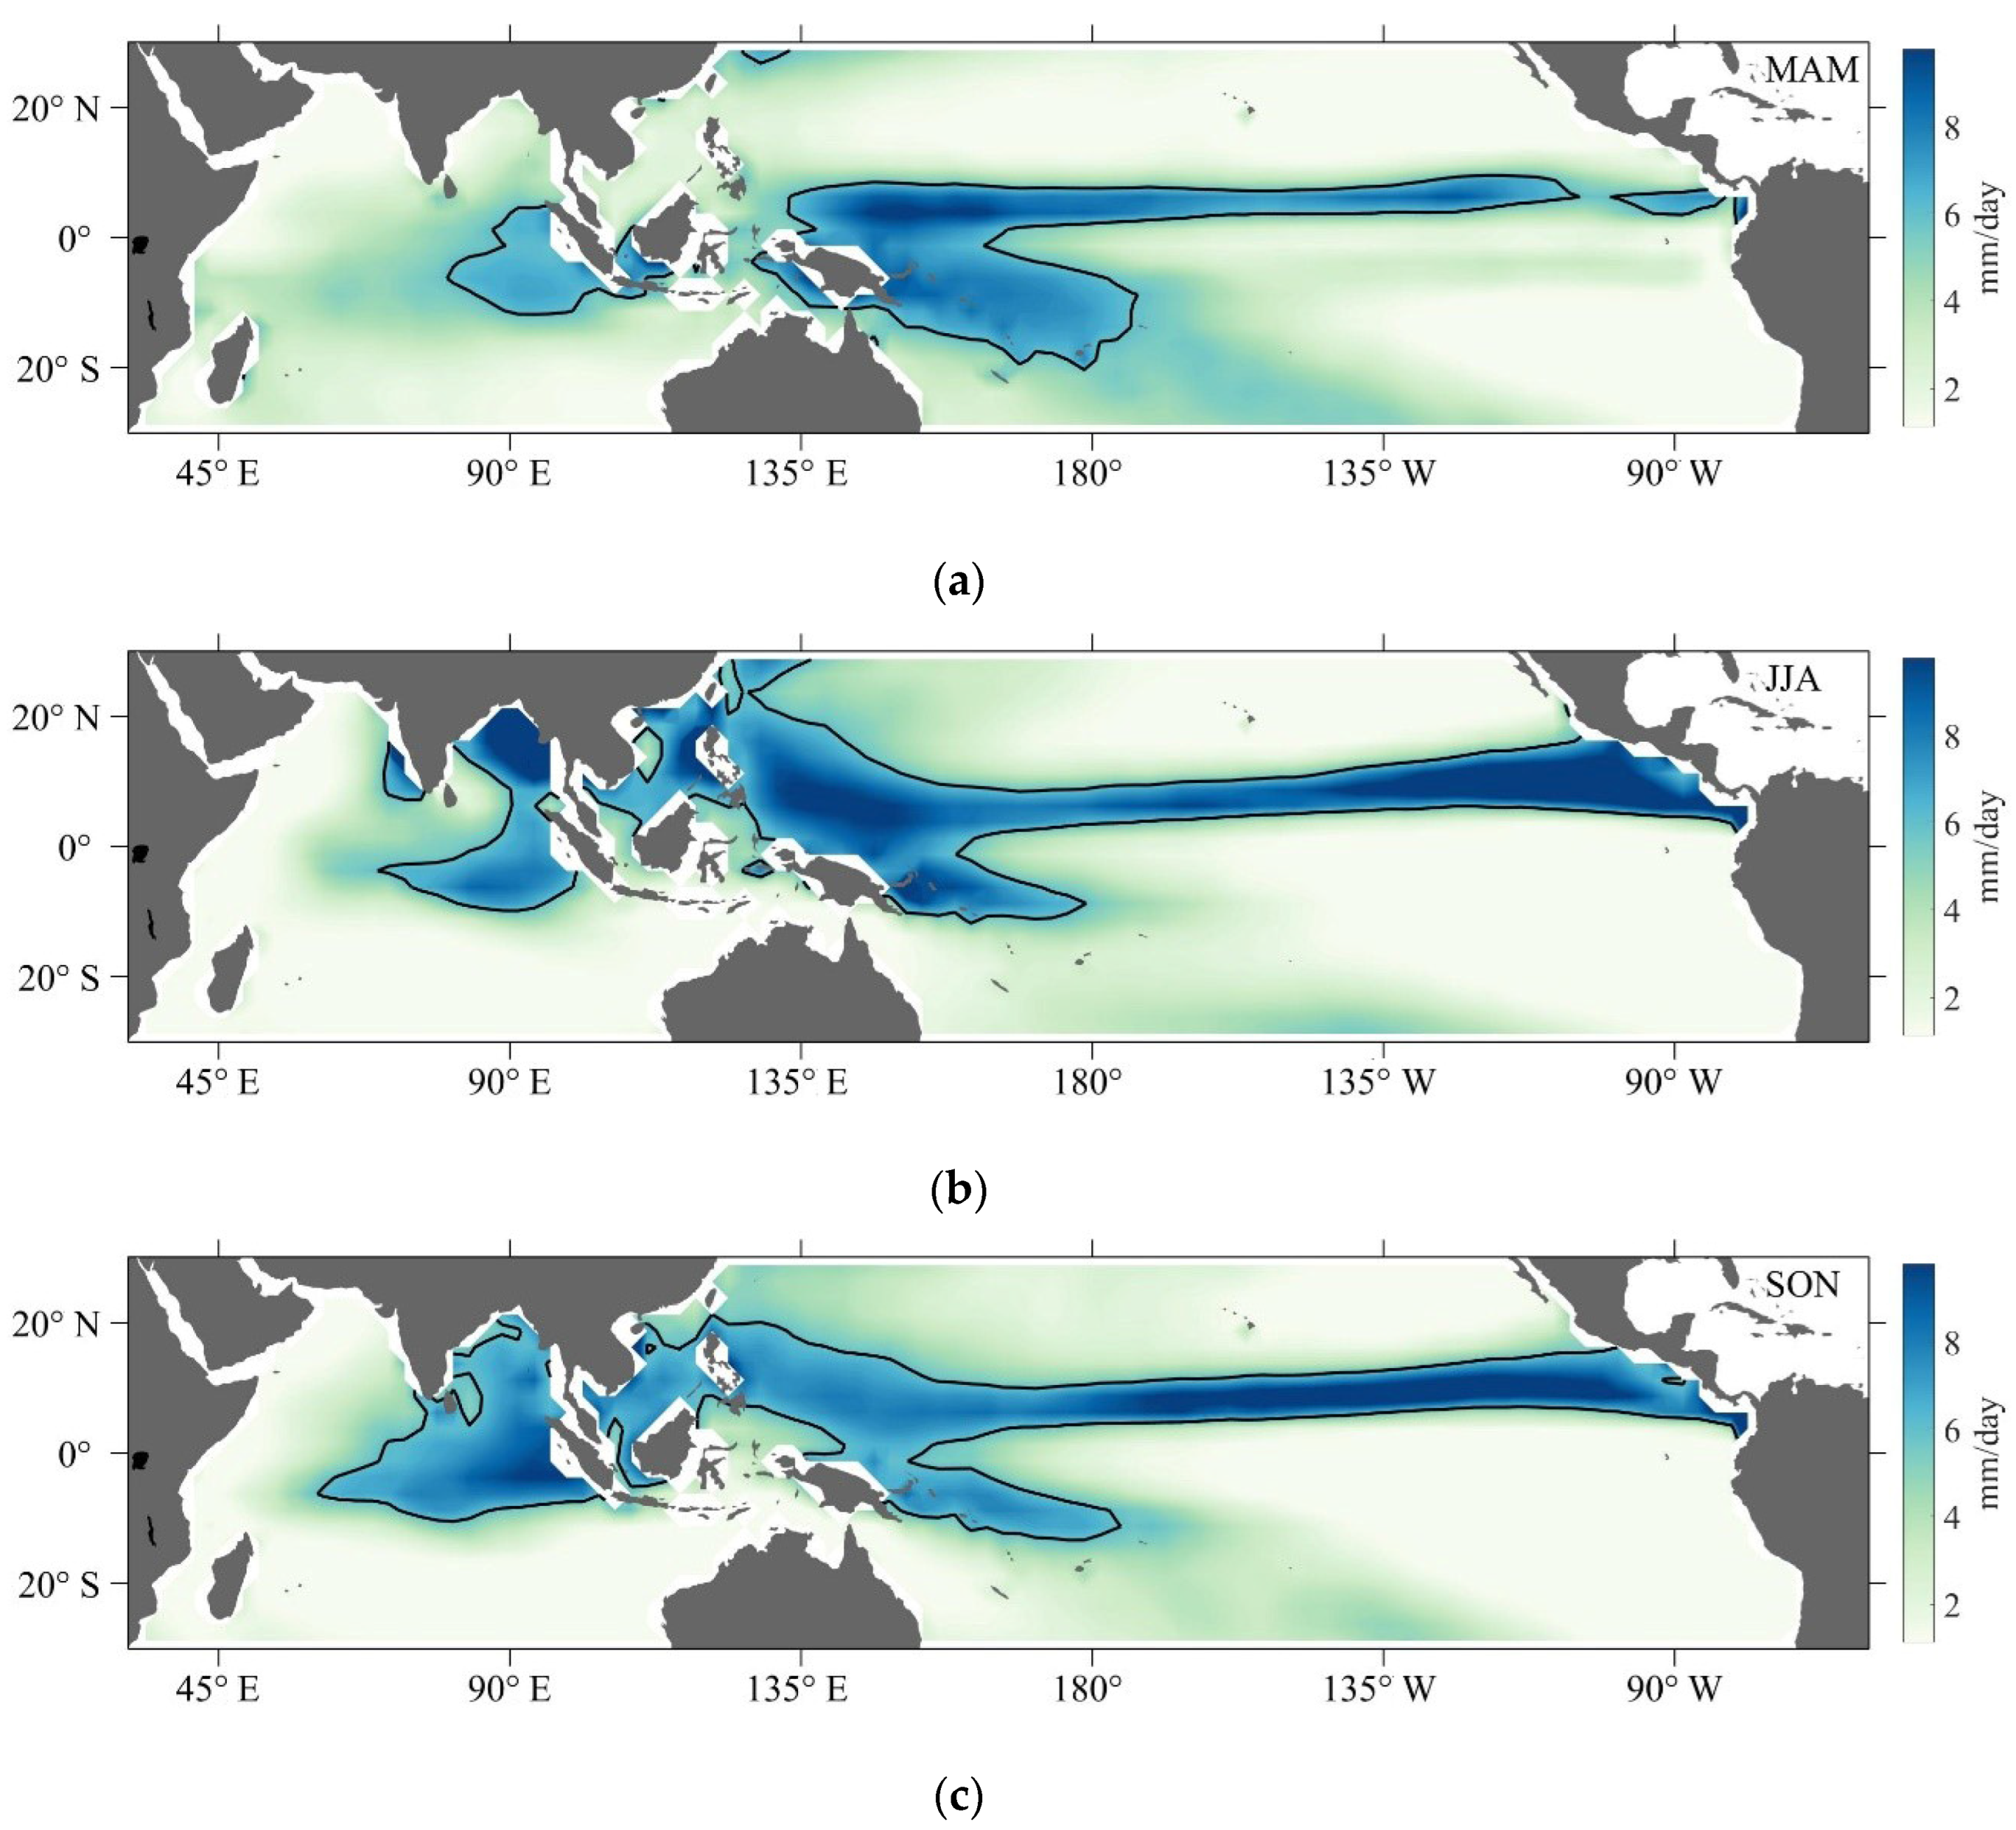
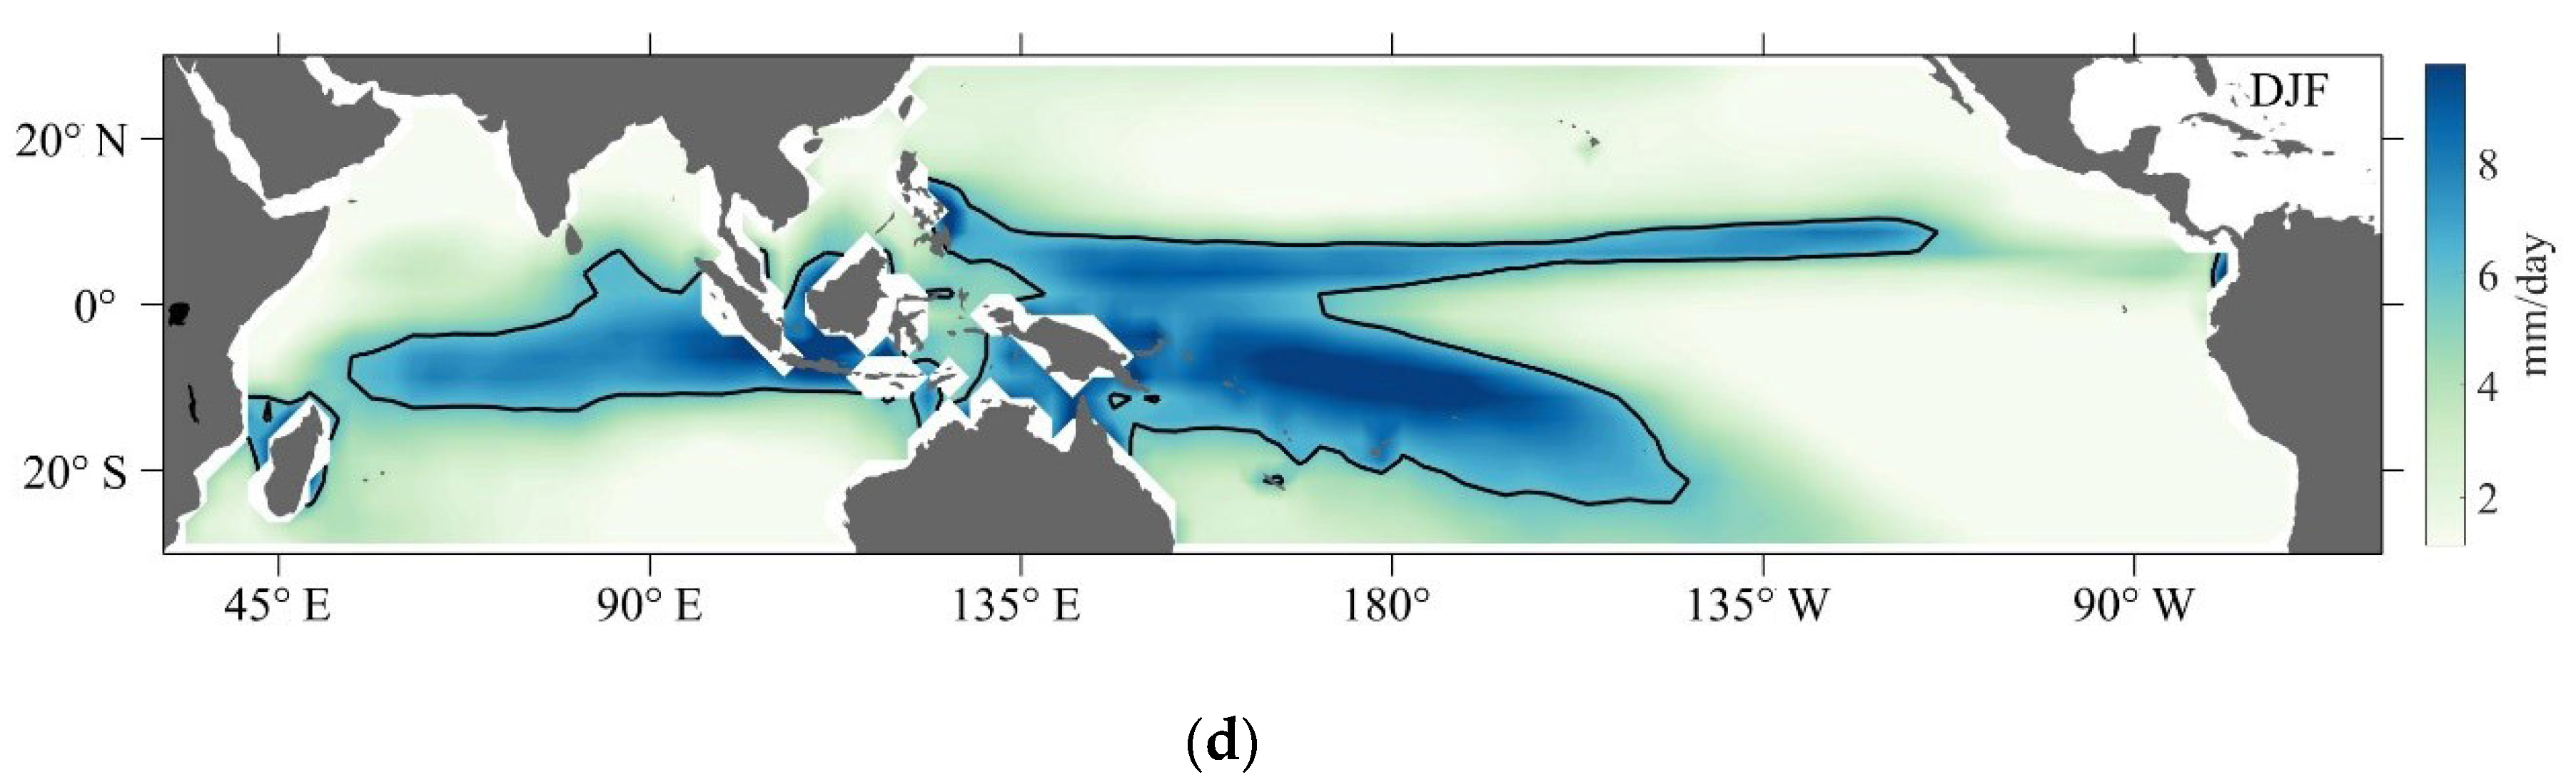
Spatial distribution of climatological precipitation for 1982–2021 of (a) boreal spring, (b) boreal summer, (c) boreal autumn, and (d) boreal winter. The superimposed black line is the 6 mm/day isoline, indicating the rain pool range.
Figure 9.
Spatial distribution of climatological precipitation for 1982–2021 of (a) boreal spring, (b) boreal summer, (c) boreal autumn, and (d) boreal winter. The superimposed black line is the 6 mm/day isoline, indicating the rain pool range.


Figure 10.
(a) Hovmöller diagrams of average 5° N–5° S SST in 1982–2021 (the black line is the 28 °C isothermal); (b) Hovmöller diagrams of average 5° N–5° S precipitation in 1982–2021 (the black line is the 6 mm/day isoline).
Figure 10.
(a) Hovmöller diagrams of average 5° N–5° S SST in 1982–2021 (the black line is the 28 °C isothermal); (b) Hovmöller diagrams of average 5° N–5° S precipitation in 1982–2021 (the black line is the 6 mm/day isoline).

Figure 11.
Spatial distribution of the first- (a) and second- (d) mode heterogeneous correlation coefficients of SST to precipitation based on SVD method; spatial distribution of the first- (b) and second- (e) mode heterogeneous correlation coefficients of precipitation to SST based on SVD method; timeseries of precipitation and SST of the first- (c) and second- (f) mode based on SVD method with superimposed climate indices, respectively. The superimposed green line indicates the range of the warm pool or rain pool during the positive phase, the blue line indicates the range of negative phase, and the dotted line indicates the range of normal phase.

Figure 12.
Spatial distribution of composite SSTA with anomalous surface winds for (a) canonical El Niño events, (b) canonical La Niña events, (c) El Niño Modoki events, (d) La Niña Modoki events, (e) mixed El Niño events, and (f) mixed La Niña events. The superimposed yellow line is the 28 °C isothermal of the current status, and the dotted line is the 28 °C isothermal of the normal status, indicating the warm pool range; the dots indicate that the differences of SSTA between the current status and the normal status passed 99% confidence level from a two-tailed Student’s t-test.

Figure 13.
Spatial distribution of composite precipitation anomalies with anomalous 850 hPa wind anomalies for (a) canonical El Niño events, (b) canonical La Niña events, (c) El Niño Modoki events, (d) La Niña Modoki events, (e) mixed El Niño events, and (f) mixed La Niña events. The superimposed yellow line is the 6 mm/day isoline of the current status, and the dotted line is the 6 mm/day isoline of the normal status, indicating the rain pool range; the dots indicate that the differences of precipitation anomalies between the current status and the normal status passed 99% confidence level from a two-tailed Student’s t-test.

Figure 14.
Spatial distribution of composite relative humidity anomalies on each pressure layer with zonal wind and vertical velocity anomalies for (a) canonical El Niño events, (b) canonical La Niña events, (c) El Niño Modoki events, (d) La Niña Modoki events, (e) mixed El Niño events, and (f) mixed La Niña events. The superimposed dots indicate that the differences of humidity anomalies between the current status and the normal status passed 99% confidence level from a two-tailed Student’s t-test.


Publisher’s Note: MDPI stays neutral with regard to jurisdictional claims in published maps and institutional affiliations. |
© 2022 by the authors. Licensee MDPI, Basel, Switzerland. This article is an open access article distributed under the terms and conditions of the Creative Commons Attribution (CC BY) license (https://creativecommons.org/licenses/by/4.0/).
Share and Cite
MDPI and ACS Style
Yin, Z.; Dong, Q.; Xiang, K.; Bian, M. Spatio-Temporal Characteristics of the Indo-Pacific Warm Pool and the Corresponding Rain Pool. Sustainability 2022, 14, 10841. https://0-doi-org.brum.beds.ac.uk/10.3390/su141710841
AMA Style
Yin Z, Dong Q, Xiang K, Bian M. Spatio-Temporal Characteristics of the Indo-Pacific Warm Pool and the Corresponding Rain Pool. Sustainability. 2022; 14(17):10841. https://0-doi-org.brum.beds.ac.uk/10.3390/su141710841
Chicago/Turabian StyleYin, Zi, Qing Dong, Kunsheng Xiang, and Min Bian. 2022. "Spatio-Temporal Characteristics of the Indo-Pacific Warm Pool and the Corresponding Rain Pool" Sustainability 14, no. 17: 10841. https://0-doi-org.brum.beds.ac.uk/10.3390/su141710841
Note that from the first issue of 2016, this journal uses article numbers instead of page numbers. See further details here.