

Exploring the Impact of Air Transport on Economic Growth: New Evidence from Australia

School of Business, University of Southern Queensland, Toowoomba, QLD 4350, Australia
*
Author to whom correspondence should be addressed.
Sustainability 2022, 14(18), 11351; https://0-doi-org.brum.beds.ac.uk/10.3390/su141811351
Submission received: 5 August 2022
/
Revised: 5 September 2022
/
Accepted: 6 September 2022
/
Published: 9 September 2022
(This article belongs to the Special Issue Relationship between Tourism Growth and Economic Development)
Abstract
:The COVID-19 pandemic has impacted all sectors of the tourism industry, particularly air transportation. However, air transport remains an important contributor to economic growth globally. Thus, this study examines whether air transport (a proxy for tourism) stimulates economic growth to validate the air-transportation-led growth hypothesis (ALGH) in the Australian context. To conduct the study, we analyse the asymmetric long-run and short-run impacts of the air passengers carried (a proxy for tourism) on the gross domestic product (GDP) in Australia. We use the nonlinear autoregressive distributed lag (NARDL) modelling approach on data for Australia from 1971 to 2019. We also examined the effects of selected control variables (i.e., energy consumption, financial development, socialisation, and urbanisation) on economic growth. In both the short and long run, we observed statistically significant asymmetric impacts of air transport on economic growth. The positive shocks in air transport propel the long-term growth of Australia’s economy. Additionally, according to the findings, negative shocks of air transport have a stronger detrimental impact on economic development than positive shocks.
1. Introduction
It is widely acknowledged that the tourism industry has a crucial influence on the economy [1]. Undoubtedly, the industry adds to foreign exchange reserves and thus helps in the country’s balance of payments. Therefore, many nations promote their tourism industry to strengthen their economy. Tourism plays a significant role in economic growth by creating jobs, generating revenue, and thus boosting the nation’s GDP. According to the WTTC, in 2019, travel and tourism contributed USD 9,170 billion to the economy globally, accounting for 10.4% of the world’s total GDP [2]. Likewise, 334 million jobs were created around the world by tourism in 2019, and one in four net new jobs worldwide were from tourism over the five years (2014–2019) [2]. Before the COVID-19 pandemic, the tourism industry contributed significantly to the growth and development of the global economy.
However, the COVID-19 pandemic affected all sectors of the tourism industry, particularly air transportation. Air transportation is one of the noteworthy contributors to economic growth, creating jobs and boosting GDP [3]. Therefore, once the effect of the COVID-19 pandemic recedes and air transportation returns to pre-pandemic operation levels, it is expected that economic development will be accelerated, and therefore, the tourism industry will begin to recover and contribute to overcoming the financial crisis associated with the pandemic [4].
Among several facets of tourism, research most frequently uses the tourism-led growth hypothesis (TLGH) to validate the nexus utilising the variables such as arrivals [5,6], receipts [7,8], and expenditures [9]. This theory is presented in the literature to explain how tourism boosts economic development [10]. Air transport, however, is less frequently utilised in studies to analyse the economic impact of tourism and support the TLGH, which states that a boost in tourism activities leads to increased economic growth [11]. In order to investigate how air transport affects the economy, this study substitutes the TLGH with the air-transportation-led growth hypothesis (ALGH). The introduction of new transportation services has effects that have been extensively researched and investigated in many nations [12]. Efficient air transport contributes to economic growth because it is one of the most common modes of travel for tourists. The civil aviation sector, therefore, makes a vital contribution to the global economy. According to the International Air Transport Association (IATA), in 2018, 2.89 million jobs were created worldwide by the airline industry, with USD 125 billion in tax revenue collected from this industry [13].
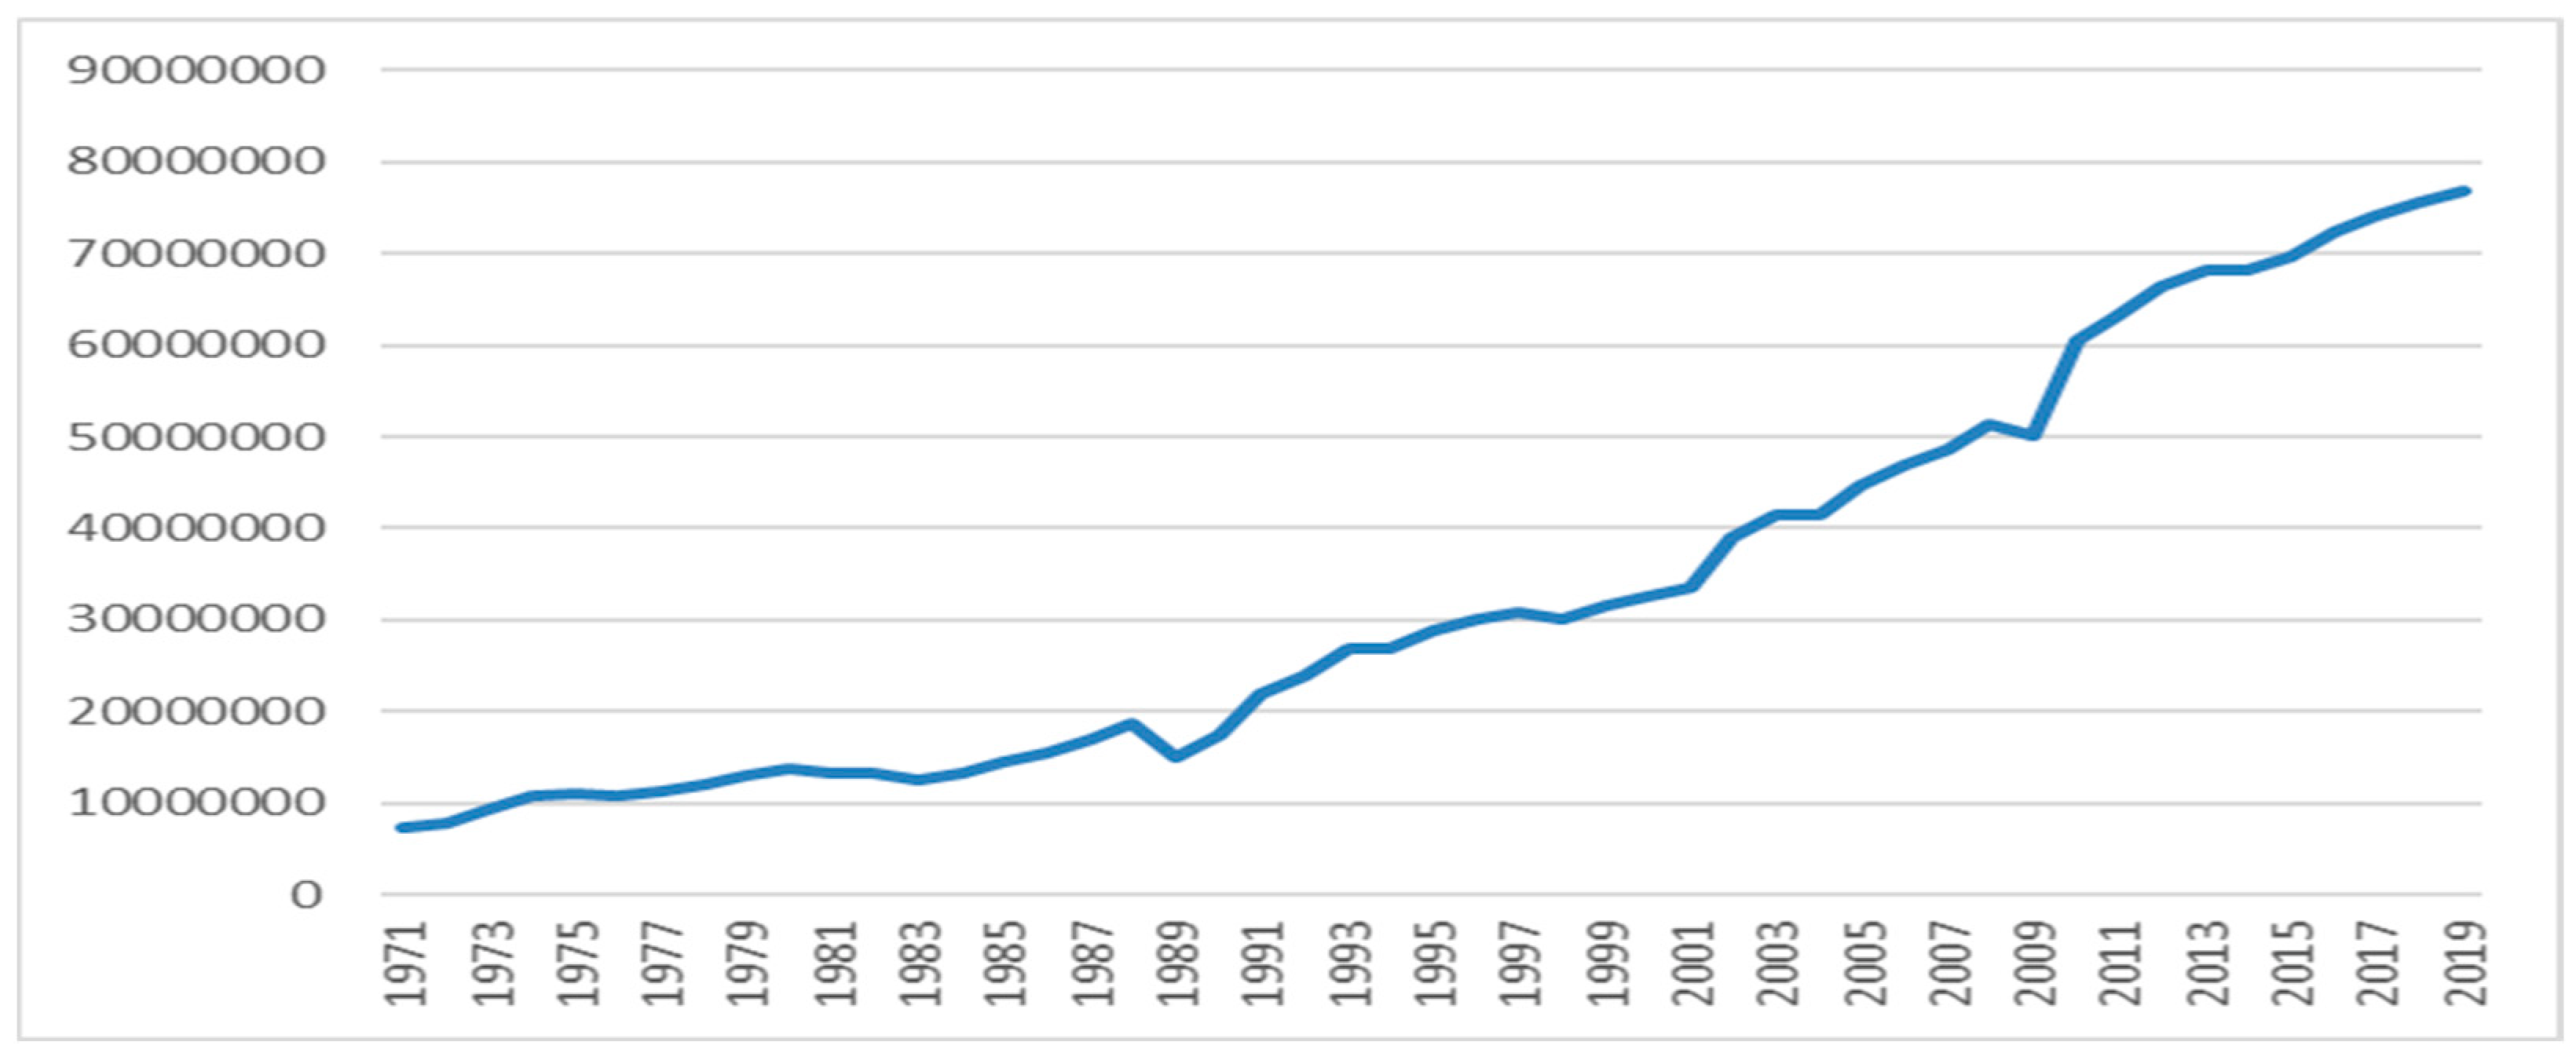
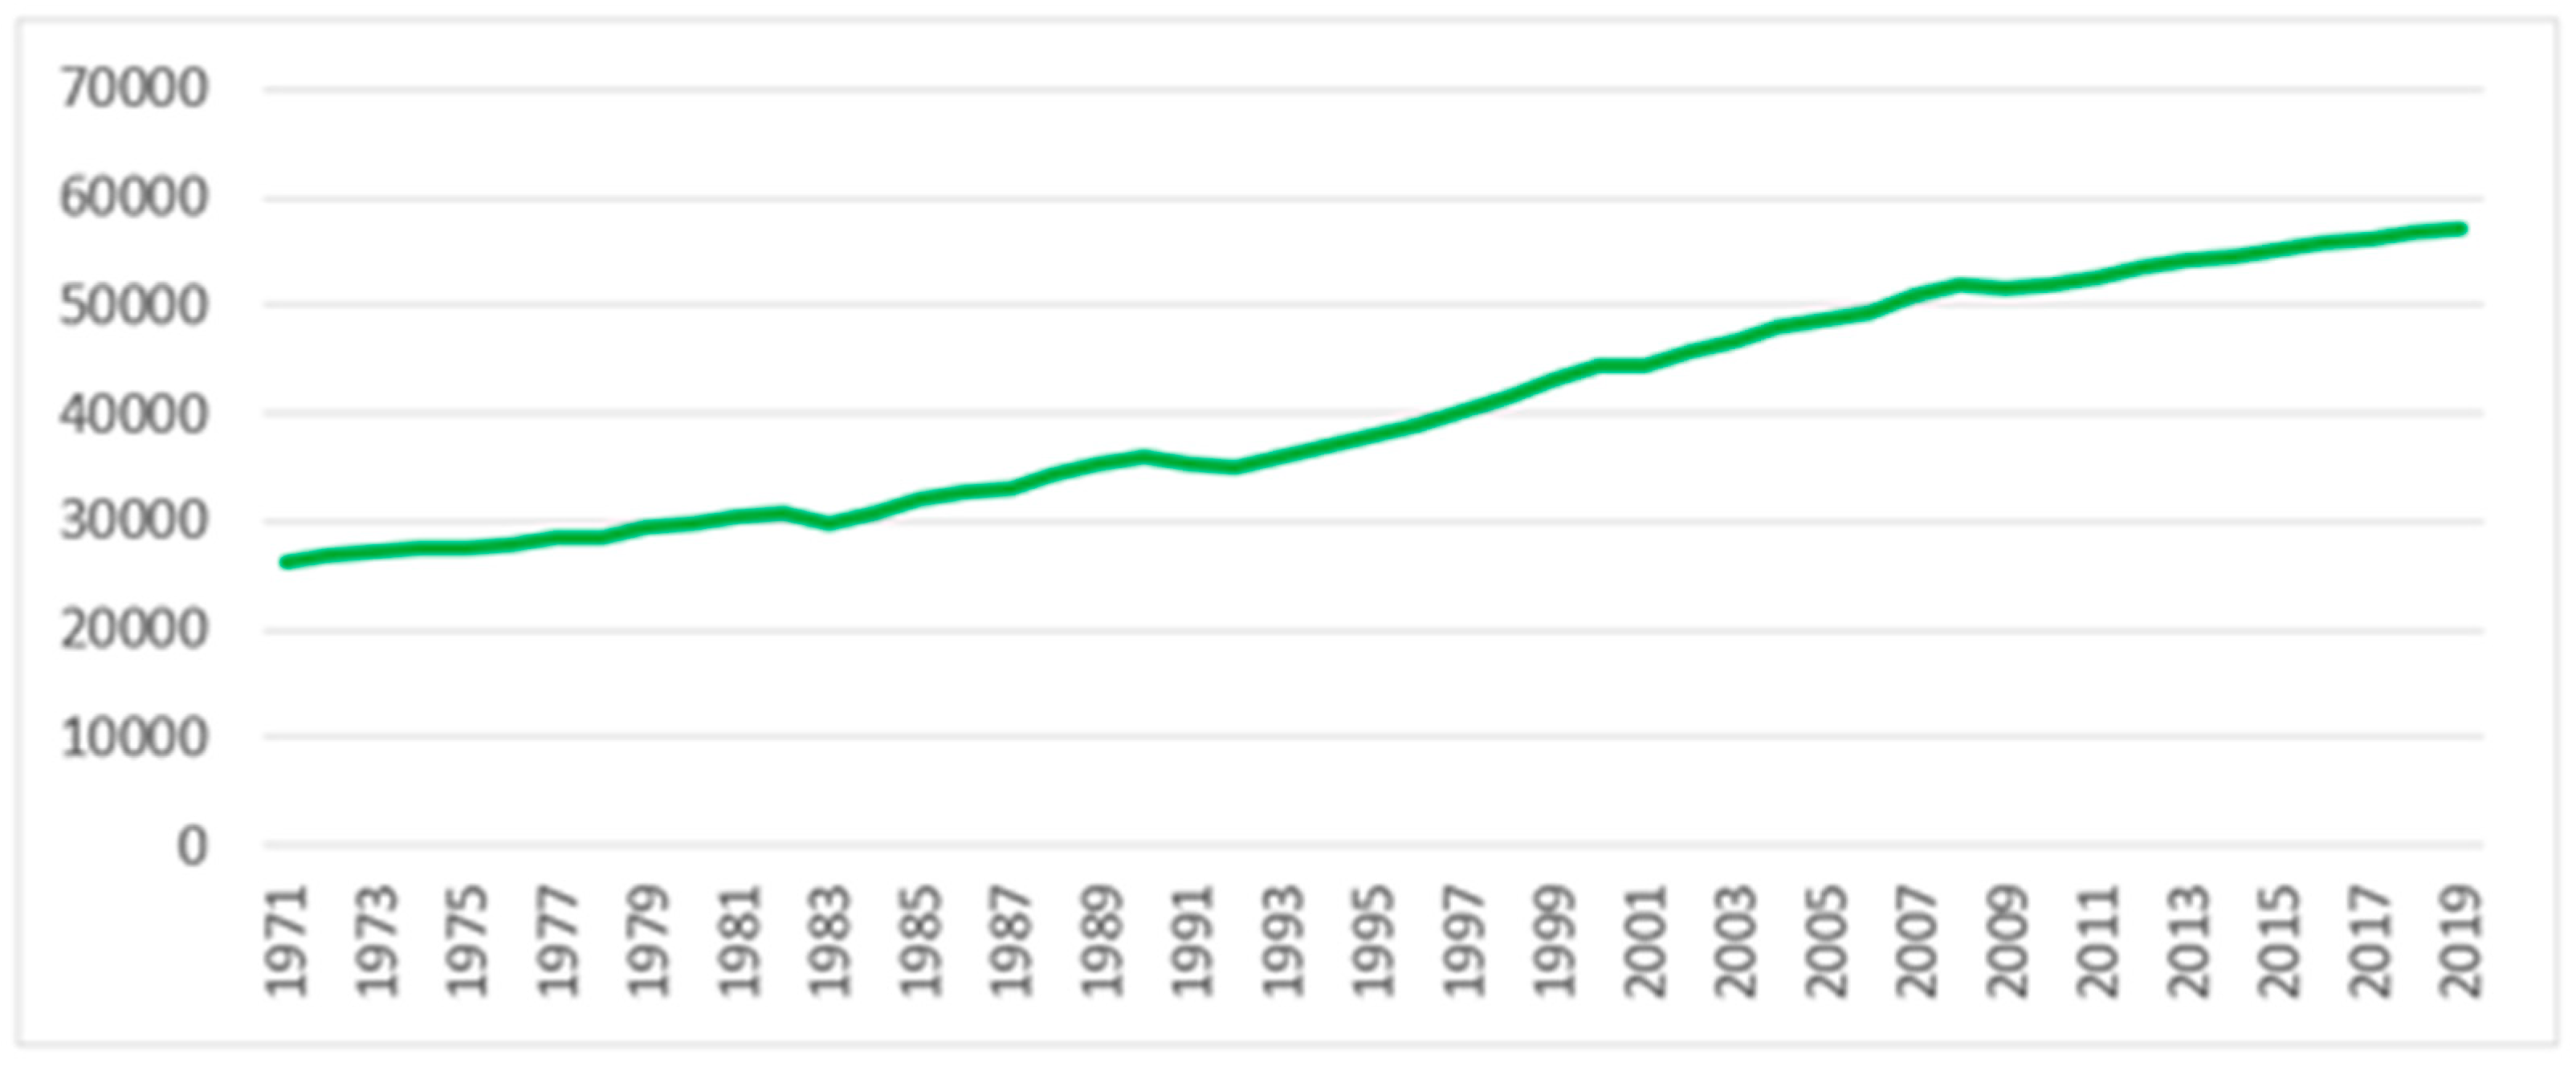
In 2017, in Australia, 176,000 jobs were created by the air transport sector, contributing USD 69 billion in gross value added to GDP. Australia ranked forty-third in the world as a tourist destination, receiving approximately nine million tourists in 2019 [2]. The revenue from tourism in Australia was USD 47.95 billion [14]. Figure 1 and Figure 2 show the trends in air transportation and economic growth, respectively, in Australia. Both figures reveal an increasing trend over time, and the IATA forecasts that the air transport market in Australia will grow by 63%, with an additional 51.9 million passengers by 2037 [13].
Before the present economic crisis created by the global pandemic, the air transport sector was experiencing considerable growth, which is likely to continue when the economy recovers from the COVID-19 pandemic. To enable the sector’s appropriate growth after the pandemic, precise planning is crucial. Thus, examination of the contribution of air transportation to the economy is essential to regain the momentum lost during the COVID-19 pandemic financial crisis and assists governments and aviation companies in rebuilding monetary and fiscal policies accordingly. This study’s main goal is to investigate the connection between Australian economic development and air travel. The study is motivated by the fact that the aviation industry of Australia requires evidence relating to the ALGH and up-to-date and competent empirical evidence that can help this industry to recovery in Australia after the COVID-19 pandemic. This study’s outcome will contribute to minimise the gap in the air transport and economic growth relationship in Australia and policy recommendations relating to the ALGH. The study analyses the ALGH using the NARDL approach. The main finding is that, throughout the research period, air transport had a very significant impact on economic growth in Australia. Policymakers should consider the evidence presented here when developing and implementing air transport (tourism) and sustainable economic development policies.
There are three significant ways in which this study adds to the body of literature. First, the study consolidates more tourism-related data and explores a wider range of tourist factors that are proxied by air transport. Second, this study demonstrates the asymmetric effects of air transportation and passengers in connection with economic development in Australia. Third, the study uses the variable financial development in the model, which has rarely been incorporated in prior research.
The remainder of this paper is organised into five sections. A summary of earlier research on tourism and economic growth and air transport and economic growth is provided in Section 2. Along with the materials and methods, Section 3 includes descriptions of the data. The empirical findings are presented in Section 4. The results are discussed in Section 5. The conclusions and the consequences of our results for policy are presented in Section 6.
2. Literature Review
The link between tourism and economic growth is often examined using two distinct methodologies in the literature on tourism economics, i.e., TLGH and the growth-led-tourism hypothesis (GLTH). Given that the main objective of this study is to test the TLGH using air transportation, we divide the literature into two sections: the TLGH and the ALGH.
2.1. Tourism-Led Growth Hypothesis (TLGH)
The tourism-led growth hypothesis was initially proposed by Balaguer et al. [16] to investigate the tourism and economic growth nexus The findings revealed that tourism boosts economic growth. This hypothesis states that tourism has a positive and significant effect on the economy. Since this study, several different researchers have contributed to extending this theory in various settings.
For instance, Corrie et al. [17] looked into how tourism affected Australia’s economic development. The study discovered that there is a bi-causal link between GDP and tourism in Australia using Granger causality tests. In research conducted by Ghartey [18] to investigate the relationships between tourism and economic growth in Jamaica from 1963 to 2008. The results from the ARDL long-run and short-run approach confirmed that an increase in tourist arrivals increases economic growth.
To expand our understanding of the relationship between tourism and economic growth, it is useful to examine the connection in other countries. For example, the TLGH was further tested in European Union countries by Balsalobre-Lorente et al. [1]. Using different econometric techniques, the study sought to evaluate the TLGH’s validity. The findings ascertain that a 1% increase in tourist arrivals boosts the economic growth by 0.62%. Thus, these results also confirmed the TLGH for European Union countries.
Wu et al. [19] performed research on the connection between tourism and economic growth between 1995 and 2016 with a focus on 11 Asian areas. Using the multivariate wavelet approach, the validity of the TLGH was confirmed in Cambodia, China, Macau, Malaysia, and Thailand. Global evidence for the validity of the TLGH was found by Tang et al. [10], who employed a panel dataset of 167 countries from 1995 to 2013 to test this hypothesis. The results from the panel generalised method of moments approach revealed that improving tourism receipts by 10% increases economic growth by 0.3%. Therefore, it is abundantly obvious that tourism contributes positively and significantly to economic growth around the globe.
Similarly, Perles-Ribes et al. [20] employed the TLGH in Spain, considering the 2008 economic crisis and using data from 1957 to 2014. The variables tourist arrivals (i.e., the number of visitors) and tourism receipts were employed by the authors as a proxy for tourism. The findings of the cointegration and Granger causality techniques showed that the TLGH was valid when the authors utilised the number of visitors, gross value added, and GDP but not when the variable tourist receipts (i.e., revenue). Ertugrul et al. [21] used the TLGH in a study conducted in the context of Turkey, which showed a strong indication that tourism made a strong contribution to economic growth. The study’s main objective was to examine the empirical nexus between tourism and economic growth by using the bounds test approach and Granger causality. The study used quarterly data from 1998 Q1 to 2011 Q3. The long-run estimation from the ARDL revealed that a 1% rise in tourism leads to an increase of 0.237% in GDP. This shows strong indication tourism makes a strong contribution to increasing economic growth.
Recently, empirical findings of Wong et al. [22] demonstrated that, in eastern China, there is a positive association between the increase in foreign tourism and economic growth. Additionally, Matzana et al. [23], in a recent study, revealed tourism activity as an engine of growth, confirming TLGH in European countries.
However, several studies do not support the TLGH. For example, using an autoregressive distributed lag (ARDL) approach and the Granger causality test, Kyophilavong et al. [24] examined the TLGH and found it was not supported. Likewise, Aslan [25] investigated the relationship between tourist growth and economic development in Mediterranean nations from 1995 to 2010, and the findings using the panel Granger causality tests did not support TLGH in Malta or Egypt.
2.2. Air Transportation Led Growth Hypothesis (ALGH)
Air transportation is an essential means of allowing international tourists to travel to their desired destinations. The economic effect of air transportation is an area of interest to developed and developing countries. As stated, most researchers used the variables such as international tourist arrivals and/or tourism receipts (revenue) as a proxy for tourism; however, very little research has been conducted using air transportation as a proxy for tourism, and therefore, little is known about the direct effect that the air transportation industry has on the economy.
According to Brida et al. [26], there exists a cointegration relationship between aircraft movements and GDP, implying a long-run association between these two parameters. Similar to this, Chi et al. [27] investigated the dynamic link between American economic development and demand for air travel. The findings show that when there is economic expansion, both air passenger and freight services tend to rise over time. However, only air passenger services are responsive to economic expansion in the near term. Additionally, they revealed that the 9/11 terrorist attacks and the SARS epidemic negatively impacted the demand for air travel in the short- and long-term, respectively. Using random effects panel data to examine the impact of air travel on commerce, Brugnoli et al. [28] suggested that air travel had a favourable impact on global trade. Their findings suggest that the growth of the economy is significantly influenced by air transport.
Abate [29] empirically examined the financial effects of air travel while taking into ticket prices and service levels as indicated by departure frequency. While accounting for other factors, the empirical models assessed how airfares and departure frequency react to openness measures in air services agreements. According to the findings, routes that underwent some degree of liberalisation had a 40% rise in departure frequency compared to routes that were subject to restrictive bilateral air services agreements. In order to examine the association between trade ties and air passenger traffic across nations in the Asia-Pacific area from 1980 to 2010, Van De Vijver et al. [30] employed a heterogeneous Granger analysis. In the context of developed countries (such as Australia and New Zealand), the study found no significant association between trade and air passenger travel connections; however, it did find a significant association between air passenger connections and trade connections between Australia and Thailand.
Employment opportunities also lead to economic growth [31]. Thus, the role of air transport in employment opportunities and growth was examined by Njoya et al. [32] in South Africa. The study explored the impact of air transport on economic growth, focusing on its capacity to create employment opportunities. The results demonstrated that air transport significantly affects output, income, and employment.
Similarly, Balsalobre-Lorente et al. [33] analysed the asymmetric impact of air transport on economic growth in a recent study. The authors validated the TLGH using air transportation as a proxy for tourism. The empirical results from NARDL revealed that air transport, the urbanisation process, and social globalisation impact economic growth positively and significantly. The asymmetric NARDL long-run results revealed that a 1% increase in positive air transportation increases economic growth by 1.31% and that negative air transportation increases GDP by 1.44%. Likewise, Brugnoli et al. [28] conducted tests on air transportation and trade flow in Italy from 2004 to 2014 using random effects panel data. The findings showed that civil aviation had a positive impact on world trade.
From 1981 to 2017, Adedoyin et al. [34] examined the impacts of air transport, energy, information, and communications technology (ICT) and foreign direct investment on economic development in the United States. This was during the Industry 4.0 period. The casual and long-term relationship between air transport and economic growth was examined in the study. The investigation was carried out using canonical cointegrating regression, fully modified least squares, and dynamic ordinary least squares. The ALGH was validated in the context of their investigation by the econometric techniques, which showed that air travel boosts economic growth. Despite air transportation being an essential indicator of economic activity, it is not always clear that air transport leads to economic expansion; it can also function in the opposite direction. Between the years 1995 and 2006, Yao et al. [35] investigated the key factors of air transport in China’s regions. Their empirical results suggest that land transportation is adversely correlated with economic growth due to a heightened production function, while air transportation is positively correlated with economic growth with population. Additionally, research by Tolcha et al. [36] found a connection between the desire for air travel and the advancement of the economy in Sub-Saharan African nations. In determining whether air travel spurs or retards economic growth, the findings showed that in South Africa, Nigeria, and Kenya, long-term causality runs from economic growth to air travel demand; in Ethiopia, however, causality runs in the opposite direction, with higher air travel demand spurring economic development; and in Senegal and Angola, the relationship was found to be too tenuous to suggest any causal directions.
It is clear that air transport plays a significant role in a nation’s economic development. In a recent study, Law et al. [37] found the existence of a causal relationship between the expansion of air transport and economic growth. However, due to COVID-19, the air transport industry (international) has gradually decreased, but the tertiary sector has increased.
The literature presented here reveals mixed outcomes. To the best of the authors’ knowledge, there is one study conducted to analyse the effect of air transportation on Australia’s economy. In this study, Baker et al. [38] used panel data spanning 25 years from 88 regional airports in Australia. The cointegration and Granger causality tests suggested that air transportation increases Australia’s economic growth. However, the study by Baker et al. [38] was conducted in the context of regional aviation/airports using aggregate taxable income as a proxy for economic growth. As a further impediment, this study lacked the overall Australian aviation context using national GDP as an economic indicator because the effect was evaluated using aggregate taxable income. Thus, further in-depth study in the Australian context is required. To fill this research gap, this study uses the control variables such as primary energy consumption, financial development, socialization, and urbanisation in the Australian environment and offers analysis of the impact of air transport on Australia’s economic growth.
The main goal of this study was to determine the answer to the question: Do the relationship between air transport and economic growth symmetric or asymmetric controlling other variables? The following proposed hypothesis will be put to the test in the empirical study, taking into account the relationship between the dependent and explanatory variables:
H1:
There is a positive and significant relationship between air transport and economic growth.
3. Materials and Methods
3.1. Data and Variables
This study explored the relationship between air transport (proxied for tourism) and economic growth (proxied by GDP) with a nonlinear model to determine long-run and short-run relationships to validate the ALGH in the context of Australia. For the analysis, the study used time-series data from Australia covering almost the past five decades: from 1971 to 2019. In addition, to avoid omitted variable bias, we employed additional explanatory variables such as energy consumption (EC), financial development (FD), social globalisation (SG), and urbanisation growth (UG) as control variables. The GDP, air transport (AT), FD, and UG data were acquired from the World Bank [15], SG from the KOF Globalisation Index [39], and EC from BP Statistical Review [40]. The data variable descriptions and data sources are shown in Table 1. The rationale for choosing the explanatory variables is briefly explained below.
GDP is a key statistic for determining a country’s economic development, and it indicates whether the economy is growing or contracting. We utilise the yearly GDP per capita (constant USD 2010) as the dependent variable. In past literature, GDP per capita has often been used to measure the economic growth of a nation [33,34]. We employed annual data on passengers transported by air transport as an independent variable to examine the impact of air travel on economic development [33,34]. In the past several decades, there has been substantial research on the connection between energy usage and economic expansion [34,41,42,43]. Energy is considered an important input for growth [44,45]. Thus, to avoid omitted variable bias, we also used primary energy consumption per capita as a control variable. We also added the financial development percentage of GDP as a fundamental element of economic growth due to its potential significance as a driver of economic development [46,47]. Additionally, studies have shown that social globalisation has significant and favourable implications for economic growth [33,48]. Social globalisation includes interpersonal, informational, and cultural globalisation, which reflects the spread of information, ideas, and people [49] that can facilitate economic growth. Further, human beings play a very important role in boosting economic growth, and the many benefits of urbanisation, including work possibilities, health facilities, infrastructure services, and greater revenue, have been widely recognised [33,50]. Thus, urbanisation is crucial for economic development, as well.
3.2. Methodology
This study used the nonlinear autoregressive distribution method to explore the nexus between the variables. Following Balsalobre-Lorente et al. [33] and Shin et al. [51], a functional equation of the model is formulated as:
GDP=f (AT, EC, FD, SG, UG)
We extend the equation into the natural logarithm form except urban population growth specified by the following equation:
Further, following Majeed et al. [52], we examine only the variable of interest positive and negative shock to the dependent variable. In other words, in this step, we generate the positive and negative variation of air transport as we want to examine the asymmetric impact of AT on GDP with other variables as control variables. These positive and negative changes in the partial sum can be stated as follows:
Positive:
Negative:
3.3. Unit Root Test
This study used a unit root test to analyse the first stage of time-series analysis of the stationarity of the variables. Because of economic instability, a structural change occurs in the time-series analysis. Perron [53] demonstrated that it is essential to examine the structural break because ignoring the structural break can lead to producing biased empirical results. Thus, we use the ADF test with a structural break [54] to obtain the order to integrate the desired variables. In addition, the AO and IO proposed by Clemente et al. [54] are used to check the sudden (AO) and gradual changes (IO) in the time-series analysis.
3.4. BDS Test
The Brock–Dechert–Scheinkman–LeBaron test (BDS) test is statistically highly effective in providing information about the linearity and nonlinearity of the model [55]. The BDS test follows the null hypothesis, which states that data are independent and identically distributed (iid) or nonlinear dependencies [56]. Thus, if the data are nonlinear, we apply NARDL to investigate the relationship between the variables [57].
The following equation examines the BDS test:
where an asymptotic normal distribution with zero is the mean; is a variance; and is the number of consecutive points which is used in the set or embedding dimension.
3.5. NARDL Model
The conventional ARDL model is unable to offer linearity and systematic adjustments among the variables that the model expects. Thus, the NARDL model is used to investigate how changes in shocks or both positive and negative changes in the independent variables affect the time-series dependent variables [58]. Because of its exact and precise results when the variables are at a level I(0), the first difference I(1), or a combination of both I(0) and I(1), NARDL is a widely used method. In addition to this, the short-run and long-run effects of independent variables on the dependent variable are distinguished [59].
According to the critical bounds proposed by Pesaran et al. [60], a long-term association between the variables exists if the estimated F-statistics are greater than the upper bound’s critical value at a 5% level of significance.
Combining equations 3 and 4 and following the econometric approach of Shin et al. [51], Villanthenkodath et al. [61], and Ahmad et al. [62], we framework NARDL long-run and short-run estimates as follows:
NARDL examines the linear relationship between the variables where = long-run coefficients; = short-run coefficients; denotes difference operator; and is the white noise term.
4. Results
Table 2 presents the descriptive statistics for the chosen variables. The findings of the Jarque-Bera test indicate that the distributions of lnGDP, lnAT, lnEC, lnFD, lnSG, and UG are normal. The minimum and highest values of lnGDP are 10.176 and 10.954, respectively, with 10.575 serving as its mean value. Similar to this, the mean of the logarithm value for AT is 17.088, with a minimum and maximum of 15.807 and 18.157, respectively.
4.1. Unit Root Test
In contrast to the alternative hypothesis, which states that the series is produced by a stationary process, ADF unit root tests, which were utilised in this work, are predicated on the null hypothesis that the variables have a unit root. The outcomes of the ADF test with a structural break with AO and IO are shown in Table 3. The outcomes show a combination of I(0) and I(1) in the variables, but they are all stationary at the first difference.
4.2. BDS Test
The BDS test results are given in Table 4. The estimated results show that all the values are significant at a 1% critical level. The results indicate the acceptance of the alternative hypothesis and that the variables are nonlinear.
4.3. Bounds Test
After the BDS test, we used the bounds test for nonlinear cointegration to explore the nexus between the dependent and independent variables. The estimated F-statistics were substantially over the upper critical bound, as shown in Table 5. The findings showed that the factors had a long-run association. The results revealed that there exists a long-run relationship among the variables.
4.4. Results of NARDL Test
The NARDL model was used to determine the long-run and short-run asymmetric relationships among the desired variables after the long-run relationship between the variables had been verified using the NARDL bounds testing method. The nonlinear (NARDL) estimate outcomes for Australia from 1971 to 2019 are displayed in Table 6 and Table 7.
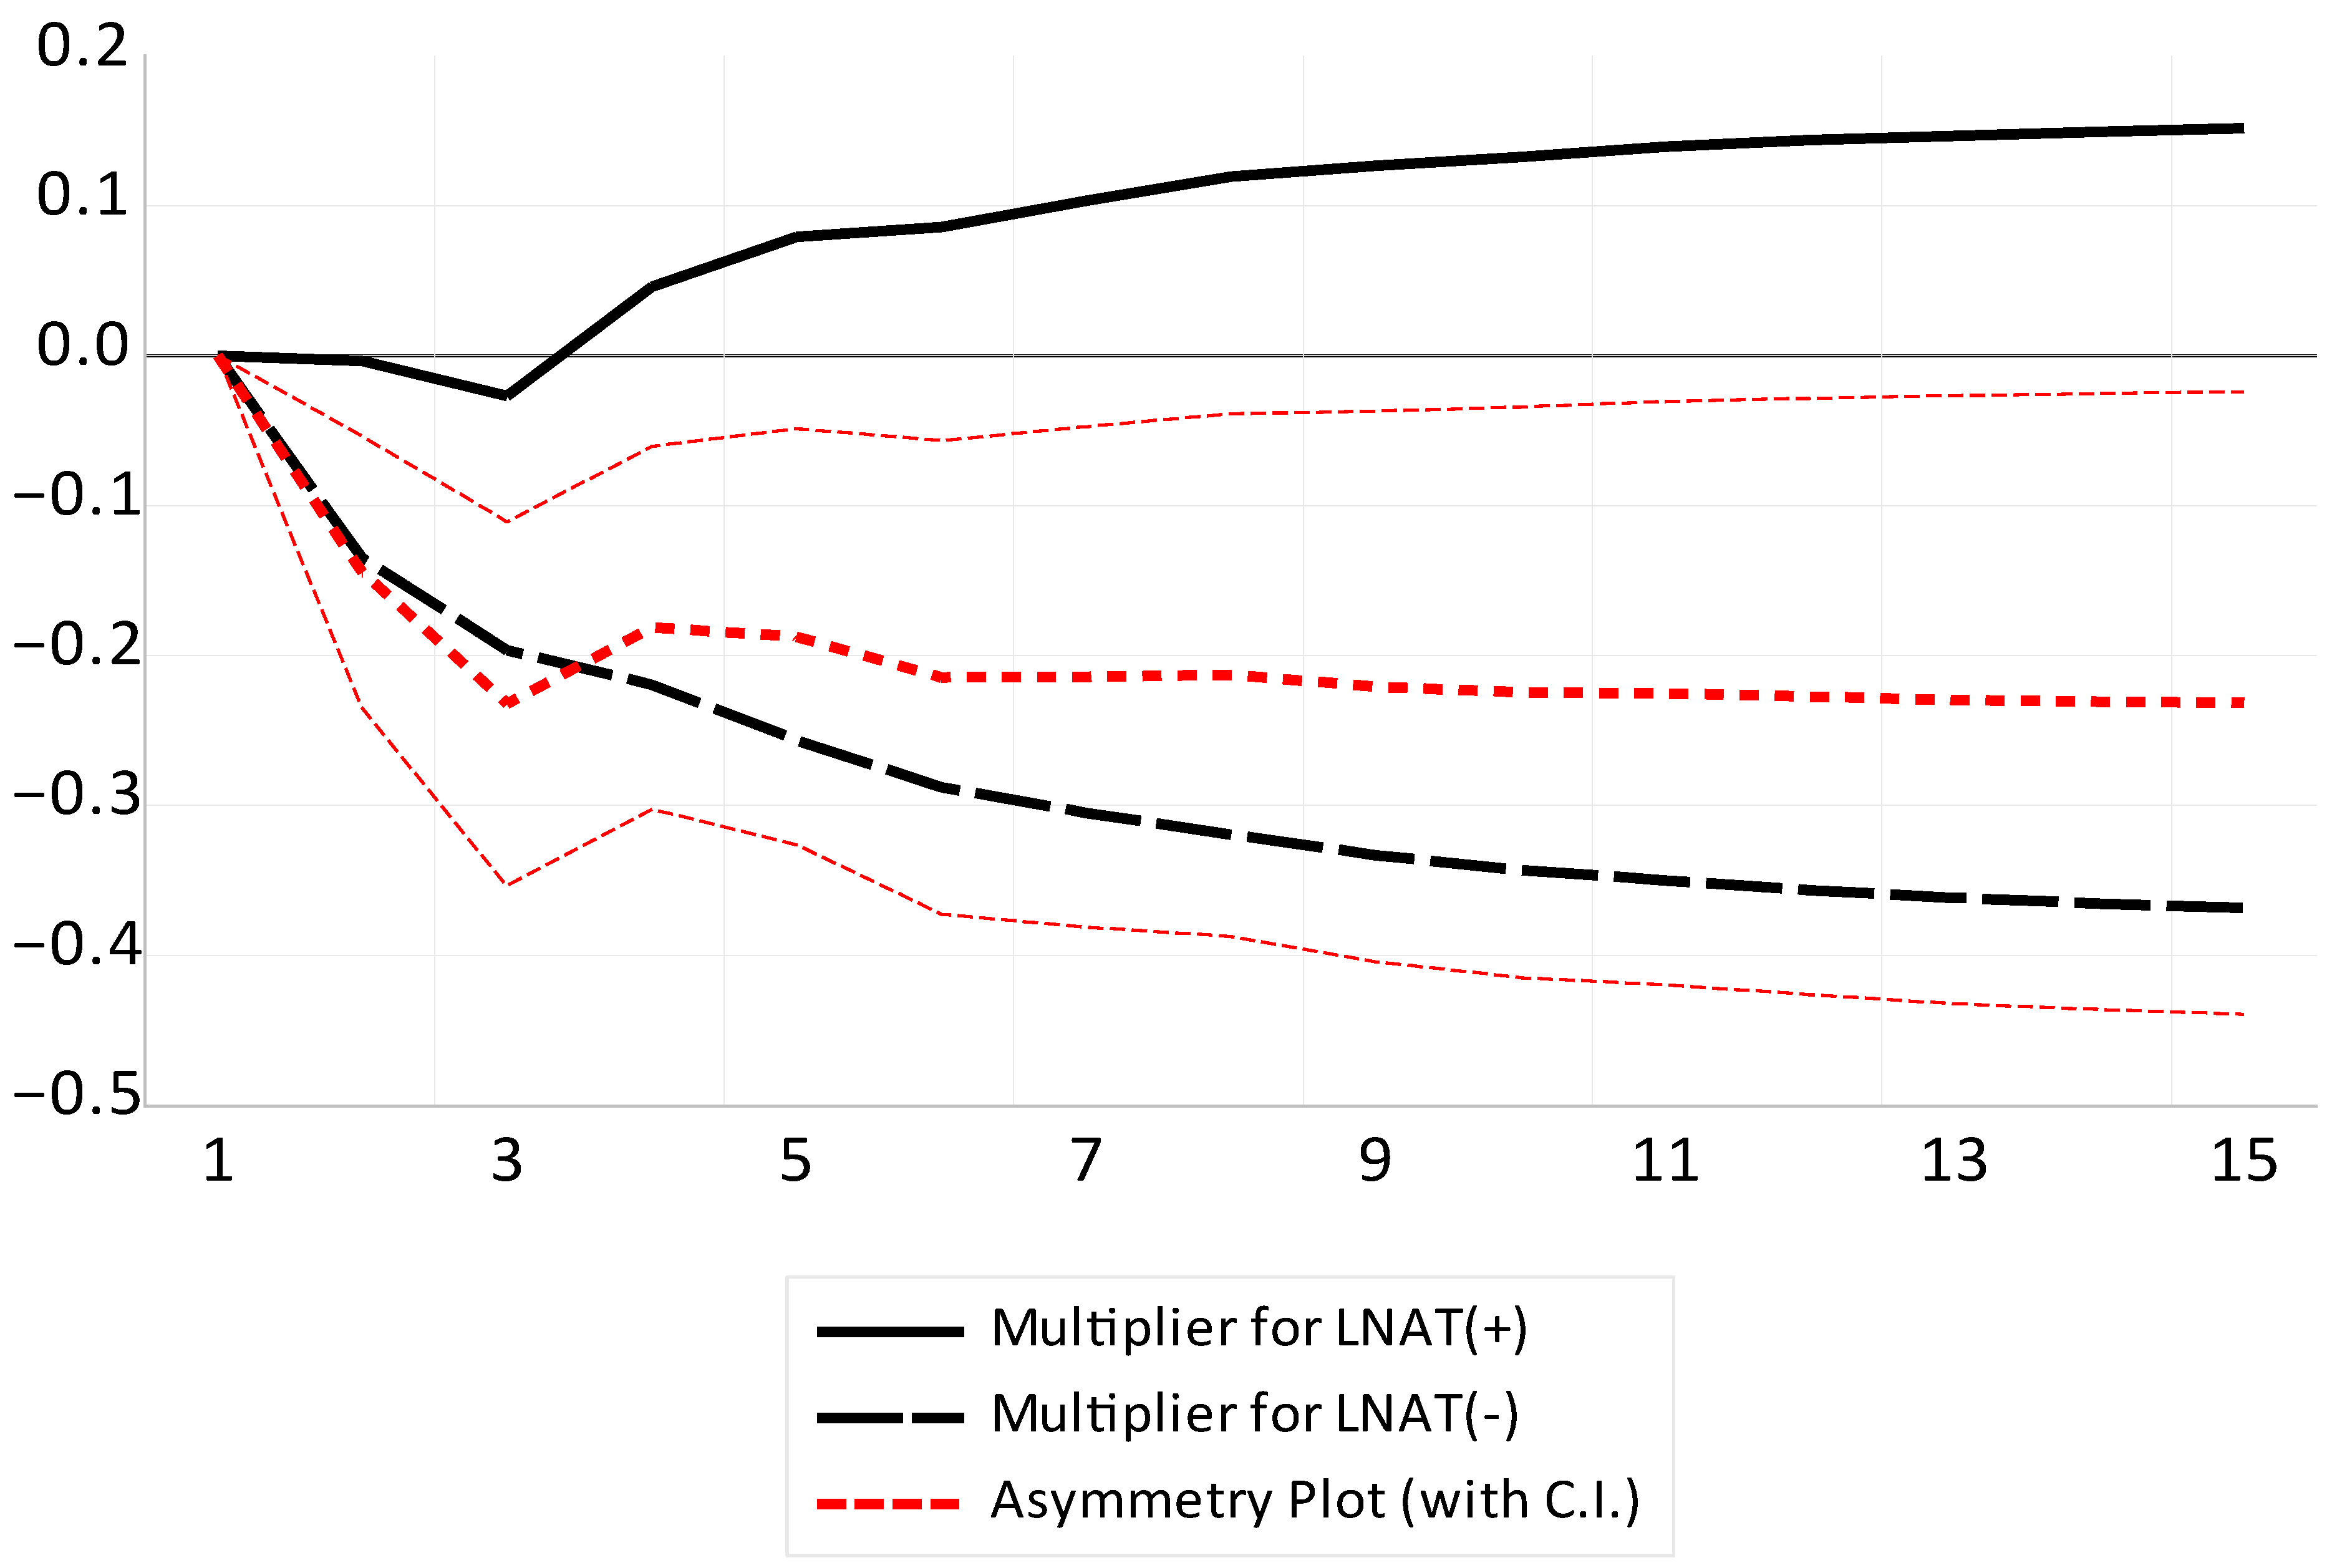
In both the short and long run, we observed statistically significant asymmetric impacts of air transport on economic growth. According to the asymmetric long-run results presented in Table 6, a 1% increase in AT boosts economic growth by 0.158% (lnAT+ 0.158), whereas a 1% drop in AT decreases GDP by 0.382% (lnAT− 0.382). The positive shocks in AT propel the long-term growth of Australia’s economy. Additionally, according to the findings, negative shocks of AT have a stronger detrimental impact on economic development than positive shocks.
In terms of the relationship between energy consumption and economic growth, we identified a positive correlation, showing that a 1% rise in energy consumption results in a 0.675% increase in economic growth in Australia. In addition, financial development and urbanisation have a positive but insignificant effect on GDP. Interestingly, we found that socialisation had a positive effect on economic growth, with a 1% surge in socialisation soaring economic growth in Australia by 0.586%.
In Table 7, the short-run dynamics are displayed. The results of short-run estimation shows that although the parameters’ magnitudes and levels of significance altered, the relationship’s long-run and short-run directions remained the same. The variables adapt to the equilibrium at an adjustment speed of −0.36 per year, which is revealed by the fact that the error correction term is negative and statistically significant at the 1% critical level. In the short run, the positive shocks of AT have a significant positive impact on GDP, implying that a 1% rise in AT surges GDP by 0.057%. Thus, the short-run results also confirm the ALGH in the context of Australia by demonstrating that the positive shock of the lagged value of air transportation has a positive and statistically significant influence on economic growth. To validate the NARDL model, we tested for autocorrelation (Durbin–Watson), serial correlation (Breusch–Godfrey LM), heteroskedasticity (Breusch–Pagan–Godfrey test and Harvey test), the model functional form (Ramsey Regression Equation Specification Error Test), and the normality test (Jarque–Bera). Table 8 confirms that the model does not have the problem of autocorrelation, serial correlation, and heteroskedasticity, and it is normally distributed.
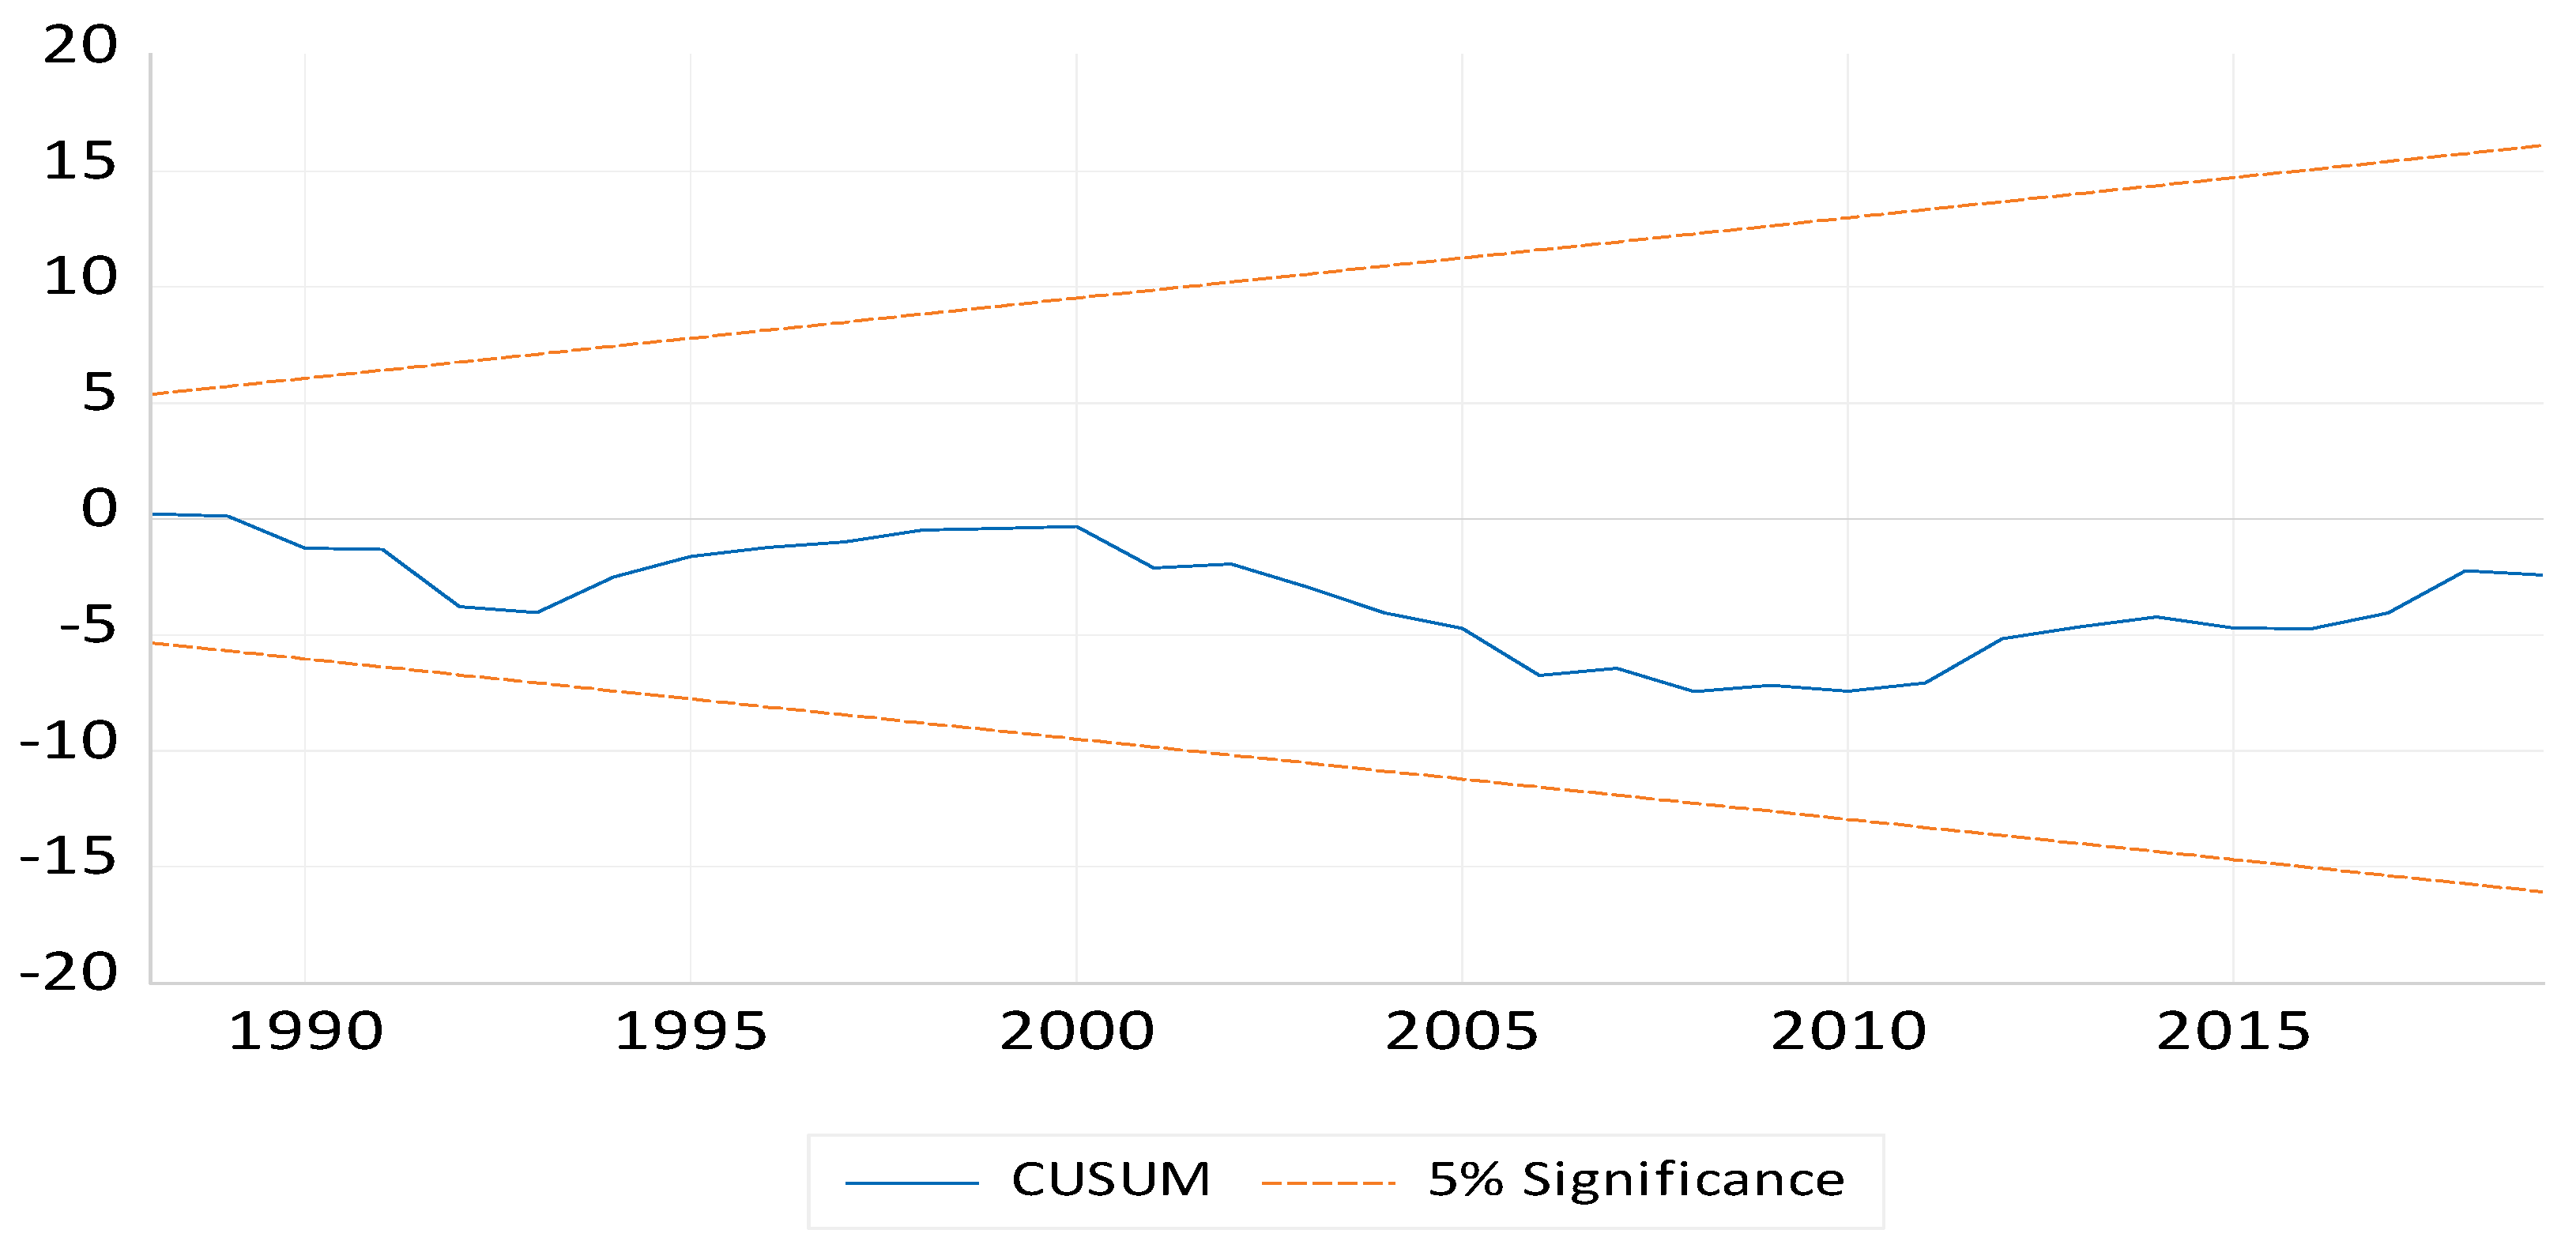
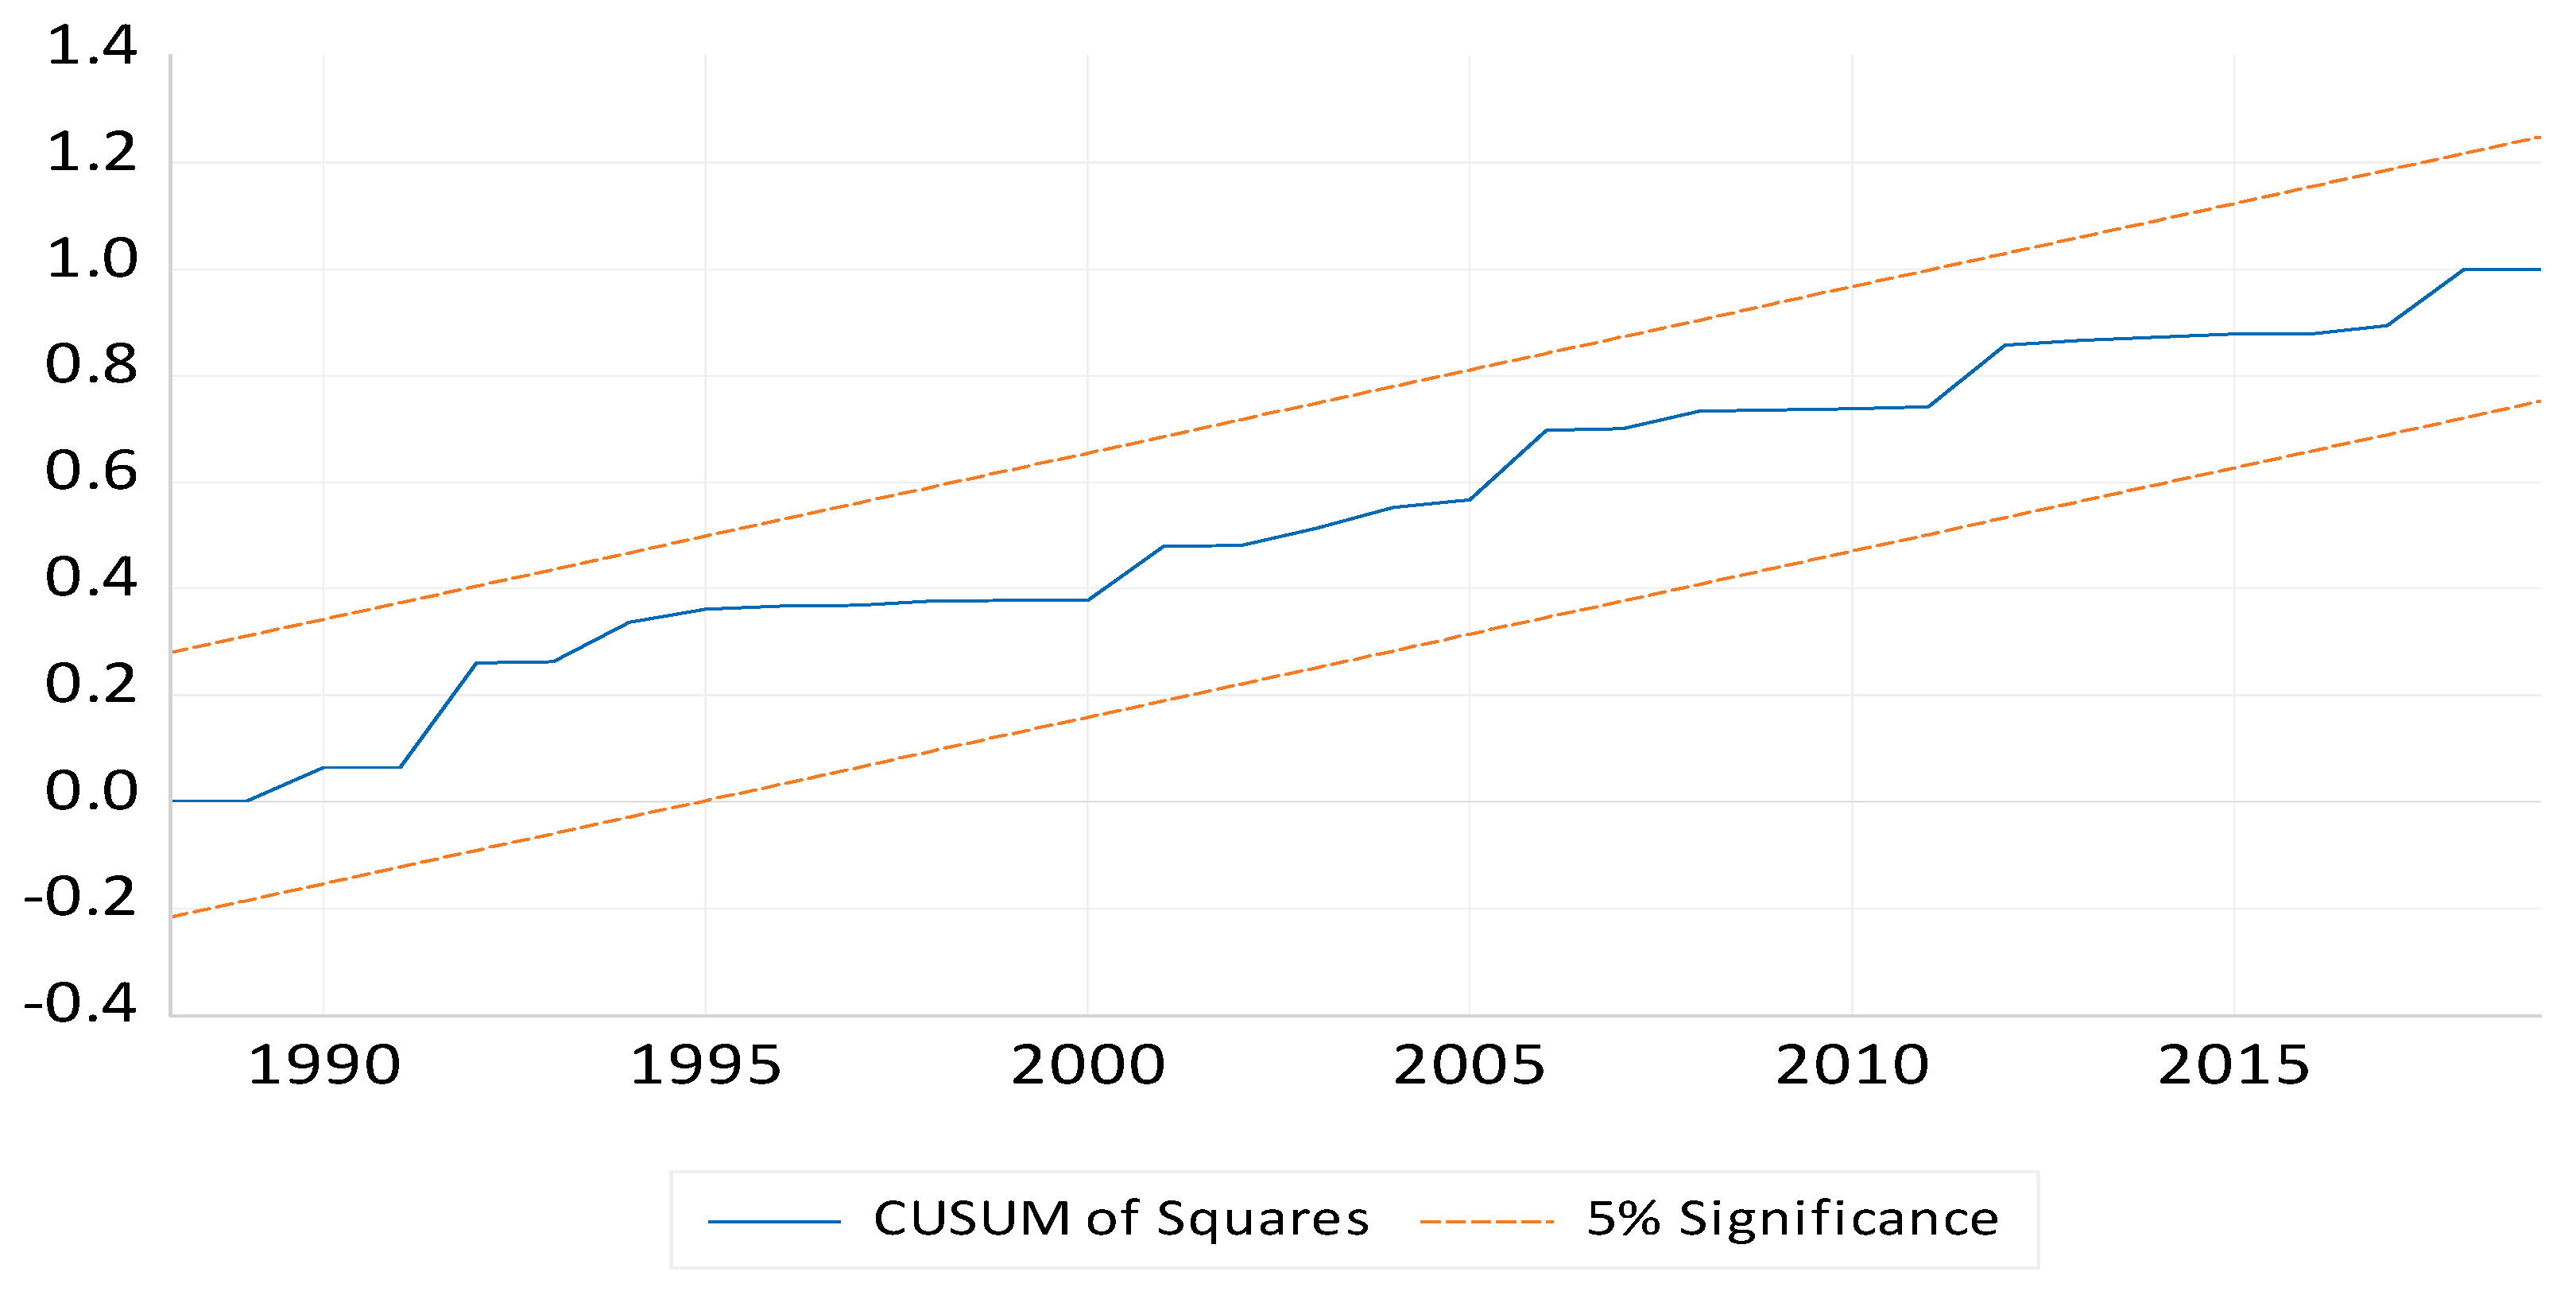
Further, we tested the model for parameter and variance stability by the CUSUM and CUSUMQ plots. Figure 3 and Figure 4 confirm the stability of the model and are within the range of the 5% level of significance.
Figure 5 shows the asymmetric NARDL dynamic multiplier effects, which highlight the impact of both positive and negative air transportation shocks on economic development. The solid black line in Figure 5 shows the positive impact of AT on GDP, whereas the dotted black line shows the negative effect of air travel on economic growth. This NARDL multiplier effects figure demonstrates the large asymmetries between the positive and negative shocks to AT and GDP.
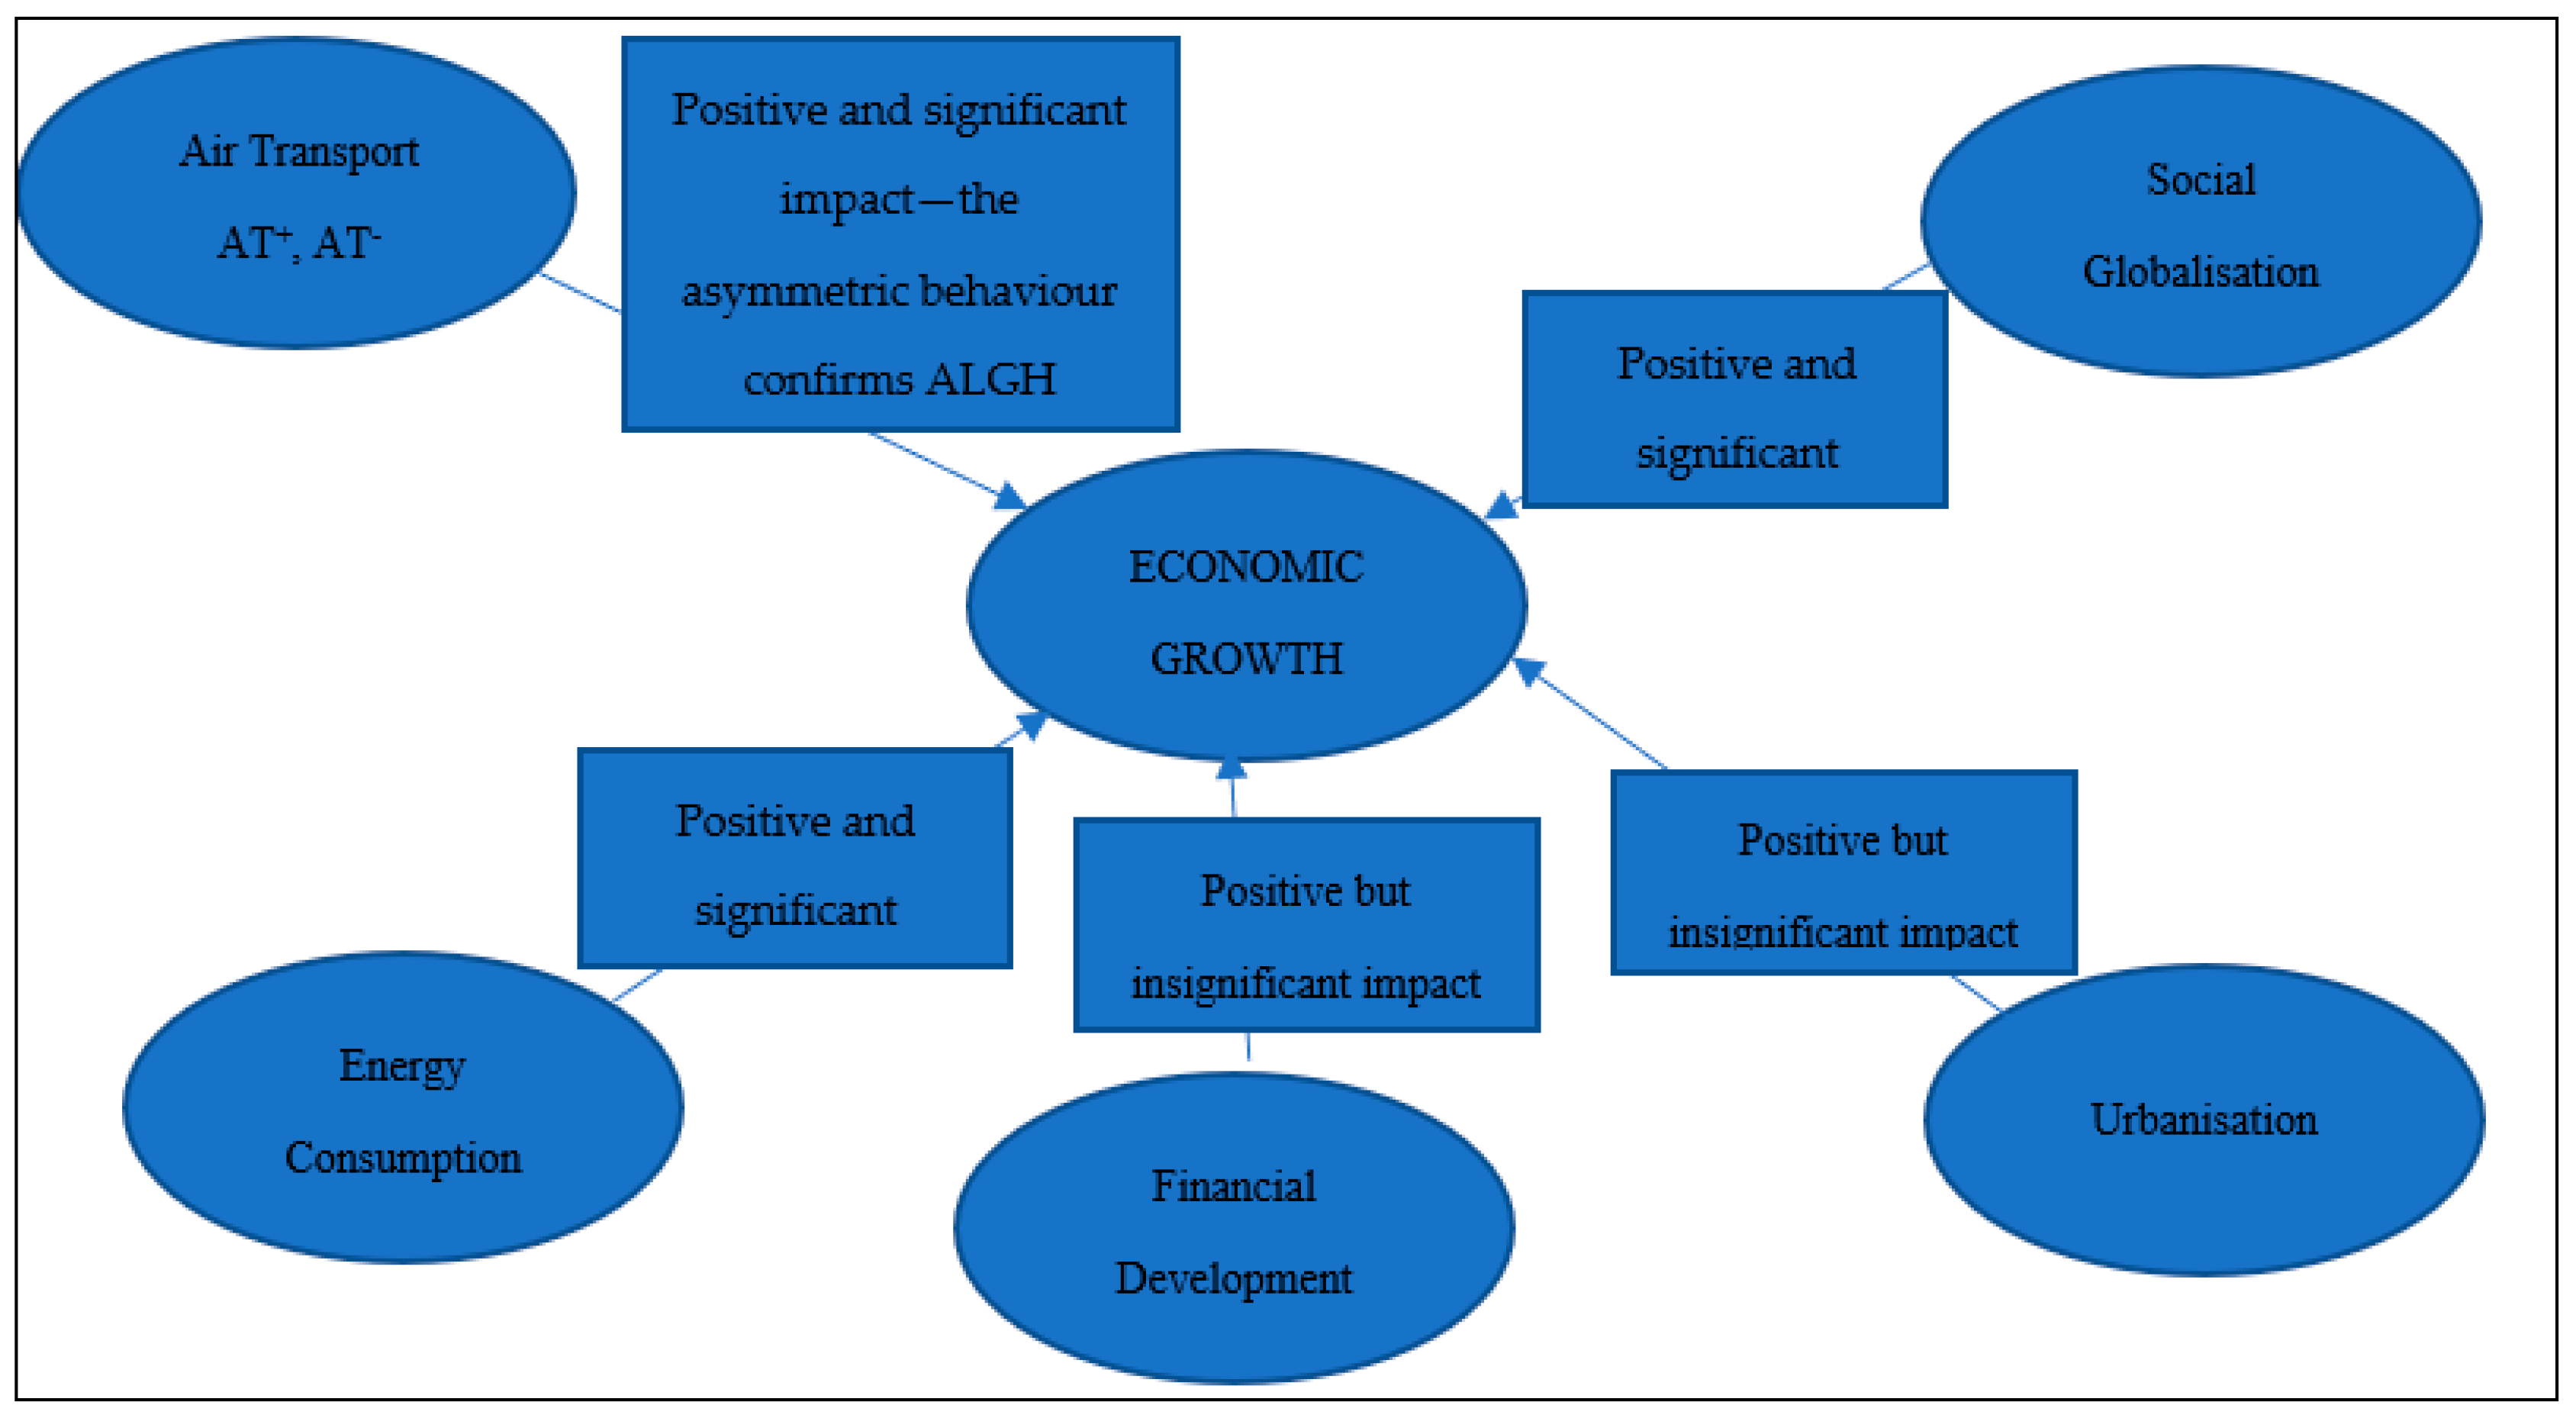
Figure 6 provides an overview of the positive and significant effect of the asymmetric behaviour of air transport on economic growth, confirming the ALGH in the Australian context.
5. Discussion
The effect of tourism arrivals, tourism receipts (revenue), and expenditure on economic growth has been extensively analysed through the TLGH in the tourism literature. However, only a few studies have explored the impact of air transport on economic growth. Air transport plays a significant role in a nation’s economic development. The aviation industry carries passengers and cargo from local and international destinations, generating revenue and creating employment opportunities. Conversely, economic growth shoots up demand for air transport in both the passenger and freight sectors [63]. However, recently, COVID-19 has significantly disrupted air transport and tourism.
To reach its goal of examining how air transport affects economic growth, this research used a variety of econometric methodologies. The ADF test was utilised in the study to check the series’ stationarity. The variables are stationary at the first difference, per the findings of the ADF unit root test with AOs and IOs. The BDS test results revealed that the series is nonlinear, examining the long-run relationship using NARDL. The Bounds test revealed a long-run relationship between the variables. To validate ALGH, we utilised the asymmetries or nonlinear method to find significant results. The long-run NARDL results revealed that any positive shock in air transport causes higher economic growth in the long run. In both the long run and short run, statistically significant asymmetric impacts of air transport on economic growth are observed. According to the asymmetric long-run results, a 1% increase in AT boosts economic growth by 0.158% (lnAT+ 0.158), whereas a 1% drop in AT decreases GDP by 0.382% (lnAT− 0.382). The positive shocks in AT propel the long-term growth of Australia’s economy. Additionally, according to the findings, negative shocks of AT have a stronger detrimental impact on economic development than positive shocks. These results are consistent with Chi et al. [27] and Balsalobre-Lorente et al. [33]. Thus, increased air transport generates more money for the government in the form of taxes and levies, which may be utilised to upgrade and build new aviation infrastructure. According to the growth hypothesis, energy consumption is a critical determinant of growth, either wholly or partly [64]. As a result, a reduction in demand for energy consumption can cause a decline in economic growth. Thus, economic growth cannot be achieved without the consumption of energy [64]. Our findings reveal that, in the long run, energy consumption affects economic growth positively and significantly. This result is in line with the empirical evidence found by Selvanathan et al. [65], Rahman [66], and Rahman et al. [67]. Thus, the air transportation sector using renewable energy as its primary source of energy would help to decrease environmental degradation. In addition, civil aviation must adopt environmentally clean or green technologies in their operations [68] to ensure better environmental outcomes in the future.
Further, socialisation, financial development, and urbanisation growth are also contributors to economic growth. As a multidimensional concept, globalisation is primarily concerned with three aspects of human activity: economic, social, and political. Social globalisation includes interpersonal, informational, and cultural globalisation [39]. To gain from the overall process of market integration and globalisation, any country must take advantage of its international connections, economic, trade, technology transfers, or information flows, that is, socialisation, in its economic growth process. As a result, socialisation supports economic growth in the context of globalisation. This study’s findings are consistent with those of Balsalobre-Lorente et al. [33] in that social globalisation has a positive and significant impact on economic growth.
Likewise, researchers on empirical growth are increasingly favouring the view that financial development is a key driver of growth [46]. They also show that investment is a crucial pathway via which financial advancement fuels economic growth. Our findings revealed that while financial development does increase economic growth, the effect is not significant. This result contradicts Adu et al. [46], who claim they found a statistical and significant effect in Ghana to support the positive effect of financial development on growth. Similarly, urbanisation, measured by the population residing in the urban area, is an essential variable in the analysis of economic growth. A structural change in which resources are transferred from agricultural to industrial activities, and people relocate from rural to urban regions has been connected to the growth of urbanization [69]. Our findings from the NARDL long-run estimations showed that while urbanisation does have positive coefficients, it does not significantly affect economic growth. According to Castells-Quintana et al. [69], nations with high population expansion may see rapid urbanisation and declining productivity (i.e., urbanisation without growth).
6. Conclusions
This study explored the relationship between air transport and economic growth, considering energy consumption, financial development, socialisation, and urbanisation as control variables over the period 1971–2019 in Australia. The results from cointegration analysis revealed that there exists a long-run relationship among the variables. The results from NARDL long-run estimates revealed that the positive shocks in the AT increase GDP, whereas the negative shocks decrease GDP. The size of the long-run positive and negative changes in air transport also confirmed the long-run asymmetric association between AT and GDP in Australia. This outcome reveals that the more travellers are carried by air transport, the more that economic growth will increase. Thus, to conclude, air transportation is a crucial determinant of growth, and the ALGH is validated through the number of air passengers carried in the context of Australia.
The results from this study support notable policy recommendations. Prior to the COVID-19 pandemic, the air transportation sector was one of the most substantial growth areas. Appropriate planning will help to ensure the robust redevelopment of Australia’s aviation industry. The findings of this study indicate that air transport can strengthen the national economy over the long run by improving its degree of networks, which will allow business to be conducted globally. Moreover, air transport infrastructure should be promoted through the level of investment.
For a nation to continue its growth and financial advancement, an efficient, safe, and cost-effective air transport business must be developed. Governments, policymakers, civil authorities, airline companies, and travel and tourist agencies should have assertive and essential policy plans. This will ensure that the importance of the tourism industry will be more broadly recognised, particularly in nations such as Australia. Moreover, dependable partners have some cushion time to develop appropriate spatial framework strategies to promote the anticipated development in air transport after the pandemic. Thus, policymakers should use the findings of this study to implement an effective policy that would promote international trade and tourism to drive economic growth through growing the air transportation industry.
One of the limitations of this study is that it used the number of passengers carried to measure the airline transportation industry. However, future research could measure this using alternative variables such as the amount of freight (million tonnes per kilometre) and registered carrier departures worldwide. In addition, monthly or quarterly data could be considered to conduct research on the relationship between air transport and economic growth throughout different periods.
Author Contributions
Conceptualization, A.K., M.M.R., R.K., and E.V.; methodology, A.K., M.M.R., and E.V.; software, A.K. and E.V.; validation, A.K., M.M.R., R.K., and E.V.; writing—original draft preparation, A.K.; writing—review and editing, A.K., M.M.R., R.K., and E.V. All authors have read and agreed to the published version of the manuscript.
Funding
This research received no external funding.
Institutional Review Board Statement
Not applicable.
Informed Consent Statement
Not applicable.
Data Availability Statement
The data presented in this study are openly available in [World Bank World Development Indicator] at [https://datacatalog.worldbank.org/dataset/world-development-indicators] (accessed on 4 September 2021, reference number [15]; [BP Statistical Review Statistical Review of World Energy] at [https://www.bp.com/en/global/corporate/energy-economics/statistical-review-of-world-energy.html] (accessed on 6 October 2021), reference number [40]; Publication from [Gygli, S.; Haelg, F.; Potrafke, N.; Sturm, J.-E] at [https://0-link-springer-com.brum.beds.ac.uk/article/10.1007/s11558-019-09344-2] (accessed on 4 August 2022), reference number [39].
Conflicts of Interest
The authors declare no conflict of interest.
References
- Balsalobre-Lorente, D.; Leitão, N.C. The role of tourism, trade, renewable energy use and carbon dioxide emissions on economic growth: Evidence of tourism-led growth hypothesis in EU-28. Environ. Sci. Pollut. Res. 2020, 27, 45883–45896. [Google Scholar] [CrossRef] [PubMed]
- WTTC Economic Impact Reports. Available online: https://wttc.org/Research/Economic-Impact (accessed on 31 January 2022).
- Gudmundsson, S.V.; Cattaneo, M.; Redondi, R. Forecasting temporal world recovery in air transport markets in the presence of large economic shocks: The case of COVID-19. J. Air Transp. Manag. 2021, 91, 102007. [Google Scholar] [CrossRef]
- Jiménez-Guerrero, J.F.; Piedra-Muñoz, L.; Galdeano-Gómez, E.; Pérez-Mesa, J.C. The global economic crisis and international tourism: A Sub-Continental analysis. Tour. Plan. Dev. 2021, 18, 1–24. [Google Scholar] [CrossRef]
- Nepal, R.; al Irsyad, M.I.; Nepal, S.K. Tourist Arrivals, Energy Consumption and Pollutant Emissions in a Developing Economy–Implications for Sustainable Tourism. Tour. Manag. 2019, 72, 145–154. [Google Scholar] [CrossRef]
- Solarin, S.A. Tourist Arrivals and Macroeconomic Determinants of CO2 Emissions in Malaysia. Anatolia 2014, 25, 228–241. [Google Scholar] [CrossRef]
- Oh, C.-O. The contribution of tourism development to economic growth in the Korean economy. Tour. Manag. 2005, 26, 39–44. [Google Scholar] [CrossRef]
- Tugcu, C.T. Tourism and economic growth nexus revisited: A panel causality analysis for the case of the Mediterranean Region. Tour. Manag. 2014, 42, 207–212. [Google Scholar] [CrossRef]
- Goncalves, O. Efficiency and productivity of French ski resorts. Tour. Manag. 2013, 36, 650–657. [Google Scholar] [CrossRef]
- Tang, C.F.; Tan, E.C. Tourism-led growth hypothesis: A new global evidence. Cornell Hosp. Q. 2018, 59, 304–311. [Google Scholar] [CrossRef]
- Dogru, T.; Bulut, U. Is Tourism an Engine for Economic Recovery? Theory and Empirical Evidence. Tour. Manag. 2018, 67, 425–434. [Google Scholar] [CrossRef]
- Cascetta, E.; Cartenì, A.; Henke, I.; Pagliara, F. Economic growth, transport accessibility and regional equity impacts of high-speed railways in Italy: Ten years ex post evaluation and future perspectives. Transp. Res. Part A Policy Pract. 2020, 139, 412–428. [Google Scholar] [CrossRef] [PubMed]
- IATA Economic Performamce of the Airline Industry. Available online: https://www.iata.org/contentassets/f88f0ceb28b64b7e9b46de44b917b98f/iata-economic-performance-of-the-industry-end-year-2018-report.pdf (accessed on 6 September 2021).
- WorldData Tourism in Australia. Available online: https://www.worlddata.info/australia/australia/tourism.php (accessed on 6 September 2021).
- World Bank World Development Indicator. Available online: https://datacatalog.worldbank.org/dataset/world-development-indicators (accessed on 4 September 2021).
- Balaguer, J.; Cantavella-Jorda, M. Tourism as a long-run economic growth factor: The Spanish case. Appl. Econ. 2002, 34, 877–884. [Google Scholar] [CrossRef]
- Corrie, K.; Stoeckl, N.; Chaiechi, T. Tourism and economic growth in Australia: An empirical investigation of causal links. Tour. Econ. 2013, 19, 1317–1344. [Google Scholar] [CrossRef]
- Ghartey, E.E. Effects of tourism, economic growth, real exchange rate, structural changes and hurricanes in Jamaica. Tour. Econ. 2013, 19, 919–942. [Google Scholar] [CrossRef]
- Wu, T.-P.; Wu, H.-C.; Wu, Y.-Y.; Liu, Y.-T.; Wu, S.-T. Causality between tourism and economic growth. J. China Tour. Res. 2020, 18, 1–18. [Google Scholar] [CrossRef]
- Perles-Ribes, J.F.; Ramón-Rodríguez, A.B.; Rubia, A.; Moreno-Izquierdo, L. Is the tourism-led growth hypothesis valid after the global economic and financial crisis? The case of Spain 1957–2014. Tour. Manag. 2017, 61, 96–109. [Google Scholar] [CrossRef]
- Ertugrul, H.M.; Mangir, F. The tourism-led growth hypothesis: Empirical evidence from Turkey. Curr. Issues Tour. 2015, 18, 633–646. [Google Scholar] [CrossRef]
- Wong, D.W.H.; Zhao, S.X.B.; Lee, H.F. Air transport, economic growth, and regional inequality across three Chinese macro-regions. Geogr. Res. 2022, 60, 446–462. [Google Scholar] [CrossRef]
- Matzana, V.; Oikonomou, A.; Polemis, M. Tourism Activity as an Engine of Growth: Lessons Learned from the European Union. J. Risk Financ. Manag. 2022, 15, 177. [Google Scholar] [CrossRef]
- Kyophilavong, P.; Gallup, J.L.; Charoenrat, T.; Nozaki, K. Testing tourism-led growth hypothesis in Laos? Tour. Rev. 2018, 73, 242–251. [Google Scholar] [CrossRef]
- Aslan, A. Tourism development and economic growth in the Mediterranean countries: Evidence from panel Granger causality tests. Curr. Issues Tour. 2014, 17, 363–372. [Google Scholar] [CrossRef]
- Brida, J.G.; Bukstein, D.; Zapata-Aguirre, S. Dynamic relationship between air transport and economic growth in Italy: A time series analysis. Int. J. Aviat. Manag. 2016, 3, 52–67. [Google Scholar]
- Chi, J.; Baek, J. Dynamic relationship between air transport demand and economic growth in the United States: A new look. Transp. Policy 2013, 29, 257–260. [Google Scholar] [CrossRef]
- Brugnoli, A.; Dal Bianco, A.; Martini, G.; Scotti, D. The impact of air transportation on trade flows: A natural experiment on causality applied to Italy. Transp. Res. Part A Policy Pract. 2018, 112, 95–107. [Google Scholar] [CrossRef]
- Abate, M. Economic effects of air transport market liberalization in Africa. Transp. Res. Part A Policy Pract. 2016, 92, 326–337. [Google Scholar] [CrossRef]
- Van De Vijver, E.; Derudder, B.; Witlox, F. Exploring causality in trade and air passenger travel relationships: The case of Asia-Pacific, 1980–2010. J. Transp. Geogr. 2014, 34, 142–150. [Google Scholar] [CrossRef]
- Khanal, A.; Rahman, M.M.; Khanam, R.; Velayutham, E. The role of tourism in service sector employment: Do market capital, financial development and trade also play a role? PLoS ONE 2022, 17, e0270772. [Google Scholar] [CrossRef]
- Njoya, E.T.; Nikitas, A. The role of air transport in employment creation and inclusive growth in the Global South: The case of South Africa. J. Transp. Geogr. 2020, 85, 102738. [Google Scholar] [CrossRef]
- Balsalobre-Lorente, D.; Driha, O.M.; Bekun, F.V.; Adedoyin, F.F. The asymmetric impact of air transport on economic growth in Spain: Fresh evidence from the tourism-led growth hypothesis. Curr. Issues Tour. 2021, 24, 503–519. [Google Scholar] [CrossRef]
- Adedoyin, F.F.; Bekun, F.V.; Driha, O.M.; Balsalobre-Lorente, D. The effects of air transportation, energy, ICT and FDI on economic growth in the industry 4.0 era: Evidence from the United States. Technol. Forecast. Soc. Chang. 2020, 160, 120297. [Google Scholar] [CrossRef]
- Yao, S.; Yang, X. Air transport and regional economic growth in China. Asia-Pac. J. Account. Econ. 2012, 19, 318–329. [Google Scholar] [CrossRef]
- Tolcha, T.D.; Bråthen, S.; Holmgren, J. Air transport demand and economic development in sub-Saharan Africa: Direction of causality. J. Transp. Geogr. 2020, 86, 102771. [Google Scholar] [CrossRef]
- Law, C.C.; Zhang, Y.; Gow, J.; Vu, X.-B. Dynamic relationship between air transport, economic growth and inbound tourism in Cambodia, Laos, Myanmar and Vietnam. J. Air Transp. Manag. 2022, 98, 102161. [Google Scholar] [CrossRef]
- Baker, D.; Merkert, R.; Kamruzzaman, M. Regional Aviation and Economic Growth: Cointegration and Causality Analysis in Australia. J. Transp. Geogr. 2015, 43, 140–150. [Google Scholar] [CrossRef]
- Gygli, S.; Haelg, F.; Potrafke, N.; Sturm, J.-E. The KOF globalisation index–revisited. Rev. Int. Organ. 2019, 14, 543–574. [Google Scholar] [CrossRef]
- BP Statistical Review Statistical Review of World Energy. Available online: https://www.bp.com/en/global/corporate/energy-economics/statistical-review-of-world-energy.html (accessed on 6 October 2021).
- Chontanawat, J.; Hunt, L.C.; Pierse, R. Does Energy Consumption Cause Economic Growth? Evidence from a Systematic Study of over 100 Countries. J. Policy Modeling 2008, 30, 209–220. [Google Scholar] [CrossRef]
- Fatai, K.; Oxley, L.; Scrimgeour, F.G. Modelling the Causal Relationship between Energy Consumption and GDP In New Zealand, Australia, India, Indonesia, the Philippines and Thailand. Math. Comput. Simul. 2004, 64, 431–445. [Google Scholar] [CrossRef]
- Gozgor, G.; Lau, C.K.M.; Lu, Z. Energy Consumption and Economic Growth: New Evidence from the OECD Countries. Energy 2018, 153, 27–34. [Google Scholar] [CrossRef]
- Rahman, M.M.; Velayutham, E. Renewable and non-renewable energy consumption-economic growth nexus: New evidence from South Asia. Renew. Energy 2020, 147, 399–408. [Google Scholar] [CrossRef]
- Saidi, K.; Rahman, M.M.; Amamri, M. The causal nexus between economic growth and energy consumption: New evidence from global panel of 53 countries. Sustain. Cities Soc. 2017, 33, 45–56. [Google Scholar] [CrossRef]
- Adu, G.; Marbuah, G.; Mensah, J.T. Financial development and economic growth in Ghana: Does the measure of financial development matter? Rev. Dev. Financ. 2013, 3, 192–203. [Google Scholar] [CrossRef] [Green Version]
- Raheem, I.D.; Tiwari, A.K.; Balsalobre-Lorente, D. The role of ICT and financial development in CO2 emissions and economic growth. Environ. Sci. Pollut. Res. Int. 2020, 27, 1912–1922. [Google Scholar] [CrossRef] [PubMed]
- Hammudeh, S.; Sohag, K.; Husain, S.; Husain, H.; Said, J. Nonlinear relationship between economic growth and nuances of globalisation with income stratification: Roles of financial development and governance. Econ. Syst. 2020, 44, 100761. [Google Scholar] [CrossRef]
- Leal, P.H.; Marques, A.C. The environmental impacts of globalisation and corruption: Evidence from a set of African countries. Environ. Sci. Policy 2021, 115, 116–124. [Google Scholar] [CrossRef]
- Zhou, J.; Zhang, X.; Shen, L. Urbanization bubble: Four quadrants measurement model. Cities 2015, 46, 8–15. [Google Scholar] [CrossRef]
- Shin, Y.; Yu, B.; Greenwood-Nimmo, M. Modelling asymmetric cointegration and dynamic multipliers in a nonlinear ARDL framework. In Festschrift in Honor of Peter Schmidt; Springer: Berlin/Heidelberg, Germany, 2014; pp. 281–314. [Google Scholar]
- Majeed, M.T.; Samreen, I.; Tauqir, A.; Mazhar, M. The asymmetric relationship between financial development and CO2 emissions: The case of Pakistan. SN Appl. Sci. 2020, 2, 827. [Google Scholar] [CrossRef]
- Perron, P. The great crash, the oil price shock, and the unit root hypothesis. Econom. J. Econom. Soc. 1989, 57, 1361–1401. [Google Scholar] [CrossRef]
- Clemente, J.; Montañés, A.; Reyes, M. Testing for a unit root in variables with a double change in the mean. Econ. Lett. 1998, 59, 175–182. [Google Scholar] [CrossRef]
- Broock, W.A.; Scheinkman, J.A.; Dechert, W.D.; LeBaron, B. A test for independence based on the correlation dimension. Econom. Rev. 1996, 15, 197–235. [Google Scholar] [CrossRef]
- Galadima, M.D.; Aminu, A.W. Nonlinear unit root and nonlinear causality in natural gas-economic growth nexus: Evidence from Nigeria. Energy 2020, 190, 116415. [Google Scholar] [CrossRef]
- Ahmad, F.; Draz, M.U.; Ozturk, I.; Su, L.; Rauf, A. Looking for asymmetries and nonlinearities: The nexus between renewable energy and environmental degradation in the Northwestern provinces of China. J. Clean. Prod. 2020, 266, 121714. [Google Scholar] [CrossRef]
- Neog, Y.; Yadava, A.K. Nexus among CO2 emissions, remittances, and financial development: A NARDL approach for India. Environ. Sci. Pollut. Res. 2020, 27, 44470–44481. [Google Scholar] [CrossRef] [PubMed]
- Majeed, M.T.; Tauqir, A.; Mazhar, M.; Samreen, I. Asymmetric effects of energy consumption and economic growth on ecological footprint: New evidence from Pakistan. Environ. Sci. Pollut. Res. 2021, 28, 32945–32961. [Google Scholar] [CrossRef] [PubMed]
- Pesaran, M.H.; Shin, Y.; Smith, R.J. Bounds testing approaches to the analysis of level relationships. J. Appl. Econom. 2001, 16, 289–326. [Google Scholar] [CrossRef]
- Villanthenkodath, M.A.; Mahalik, M.K. Does economic growth respond to electricity consumption asymmetrically in Bangladesh? The implication for environmental sustainability. Energy 2021, 233, 121142. [Google Scholar] [CrossRef]
- Ahmad, M.; Khan, Z.; Ur Rahman, Z.; Khan, S. Does financial development asymmetrically affect CO2 emissions in China? An application of the nonlinear autoregressive distributed lag (NARDL) model. Carbon Manag. 2018, 9, 631–644. [Google Scholar] [CrossRef]
- Zhang, F.; Graham, D.J. Air transport and economic growth: A review of the impact mechanism and causal relationships. Transp. Rev. 2020, 40, 506–528. [Google Scholar] [CrossRef]
- Belke, A.; Dobnik, F.; Dreger, C. Energy consumption and economic growth: New insights into the cointegration relationship. Energy Econ. 2011, 33, 782–789. [Google Scholar] [CrossRef]
- Selvanathan, E.A.; Jayasinghe, M.; Selvanathan, S. Dynamic Modelling of Inter-Relationship Between Tourism, Energy Consumption, CO2 Emissions and Economic Growth in South Asia. Int. J. Tour. Res. 2020, 23, 597–610. [Google Scholar] [CrossRef]
- Rahman, M.M. The dynamic nexus of energy consumption, international trade and economic growth in BRICS and ASEAN countries: A panel causality test. Energy 2021, 229, 120679. [Google Scholar] [CrossRef]
- Rahman, M.M.; Alam, K. Exploring the driving factors of economic growth in the world’s largest economies. Heliyon 2021, 7, e07109. [Google Scholar] [CrossRef] [PubMed]
- Dogan, E.; Aslan, A. Exploring the Relationship Among CO2 Emissions, Real GDP, Energy Consumption and Tourism in the EU and Candidate Countries: Evidence from Panel Models Robust to Heterogeneity and Cross-Sectional Dependence. Renew. Sustain. Energy Rev. 2017, 77, 239–245. [Google Scholar] [CrossRef]
- Castells-Quintana, D.; Wenban-Smith, H. Population dynamics, urbanisation without growth, and the rise of megacities. J. Dev. Stud. 2020, 56, 1663–1682. [Google Scholar] [CrossRef]
Figure 1.
Air transportation trend in Australia from 1971 to 2019 (Data source: World Bank [15]).
Figure 1.
Air transportation trend in Australia from 1971 to 2019 (Data source: World Bank [15]).

Figure 2.
GDP trend in Australia from 1971 to 2019 (Data source: World Bank [15]).
Figure 2.
GDP trend in Australia from 1971 to 2019 (Data source: World Bank [15]).

Figure 3.
CUSUM test.

Figure 4.
CUSUMQ test.

Figure 5.
NARDL multiplier effects.

Figure 6.
Based on NARDL econometric estimation, the empirical scheme confirming ALGH.


Table 1.
Data sources and variable descriptions.
| Variable | Description | Definition | Source |
|---|---|---|---|
| Gross domestic product (GDP) | GDP per capita (constant USD 2010) | GDP per capita is the GDP divided by the mid-year population. | World Bank [15] |
| Air transport (AT) | Air transport, passengers carried | Air passengers carried include both domestic and international aircraft passengers of air carriers registered in the country. | World Bank [15] |
| Energy consumption (EC) | Primary energy consumption per capita | Primary energy comprises commercially traded fuels, including modern renewables, used to generate electricity. | BP Statistical Review [40] |
| Financial development (FD) | Domestic credit to the private sector (% of GDP) | Domestic credit to the private sector refers to financial resources provided to the private sector by financial corporations. | World Bank [15] |
| Social globalisation (SG) | Social integration index | Social globalisation refers to interpersonal, informational, and cultural globalisation. | Gygli et al. [39] |
| Urbanisation growth (UG) | Urban population growth (annual %) | Urban population refers to people living in urban areas. | [15] |
Table 2.
Descriptive analysis.
| lnGDP | lnAT | lnEC | lnFD | lnSG | UG | |
|---|---|---|---|---|---|---|
| Mean | 10.575 | 17.088 | 5.416 | 4.145 | 4.329 | 1.494 |
| Median | 10.548 | 17.177 | 5.451 | 4.248 | 4.314 | 1.445 |
| Maximum | 10.954 | 18.157 | 5.566 | 4.959 | 4.480 | 3.572 |
| Minimum | 10.176 | 15.807 | 5.105 | 3.163 | 4.200 | 0.769 |
| Std Dev. | 0.257 | 0.711 | 0.118 | 0.625 | 0.105 | 0.487 |
| Skewness | 0.012 | −0.022 | −0.781 | −0.240 | 0.184 | 1.808 |
| Kurtosis | 1.548 | 1.698 | 2.807 | 1.519 | 1.426 | 8.541 |
| Jarque–Bera | 4.305 | 3.463 | 5.058 | 4.951 | 5.339 | 89.385 |
| Probability | 0.116 | 0.177 | 0.080 | 0.084 | 0.069 | 0.000 |
| Sum | 518.173 | 837.323 | 265.366 | 203.082 | 212.139 | 73.209 |
| Sum Sq. Dev. | 3.181 | 24.292 | 0.664 | 18.773 | 0.531 | 11.365 |
| Observations | 49 | 49 | 49 | 49 | 49 | 49 |
Table 3.
Results of the ADF test with structural break: AO and IO.
| At Level | ||||||
|---|---|---|---|---|---|---|
| Variables | ADF Test Statistic (IO) | p-Values | Breaking Point | ADF Test Statistic (AO) | p-Values | Structural Break |
| lnGDP | −2.933 | 0.721 | 1993 | −2.346 | 0.938 | 1982 |
| lnAT | −3.157 | 0.593 | 1989 | −1.862 | 0.989 | 1991 |
| lnEC | −4.305 * | 0.074 | 1993 | −4.008 | 0.154 | 1993 |
| lnFD | −4.798 ** | 0.018 | 1984 | −2.594 | 0.871 | 1981 |
| lnSG | −3.025 | 0.672 | 1992 | −1.877 | 0.988 | 1989 |
| UG | −7.358 *** | 0.000 | 2007 | −6.733 *** | 0.000 | 2009 |
| At First Difference | ||||||
| lnGDP | −6.982 *** | 0.000 | 1983 | −6.415 *** | 0.000 | 2009 |
| lnAT | −7.501 *** | 0.000 | 1991 | −7.667 *** | 0.000 | 1991 |
| lnEC | −5.789 *** | 0.000 | 1979 | −5.997 *** | 0.000 | 1974 |
| lnFD | −6.404 *** | 0.000 | 1989 | −6.527 *** | 0.000 | 1989 |
| lnSG | −6.107 *** | 0.000 | 1984 | −6.261 *** | 0.000 | 2007 |
| UG | −10.242 *** | 0.000 | 1993 | −10.325 *** | 0.000 | 1974 |
Note: *** 1% level of significance; ** 5% level of significance; * 10% level of significance.
Table 4.
Results of BDS test.
| Variable | m = 2 | m = 3 | m = 4 | m = 5 | m = 6 |
|---|---|---|---|---|---|
| lnGDP | 0.193 *** | 0.323 *** | 0.412 *** | 0.473 *** | 0.519 *** |
| lnAT | 0.194 *** | 0.323 *** | 0.412 *** | 0.473 *** | 0.517 *** |
| lnEC | 0.182 *** | 0.319 *** | 0.418 *** | 0.483 *** | 0.524 *** |
| lnFD | 0.199 *** | 0.336 *** | 0.429 *** | 0.493 *** | 0.537 *** |
| lnSG | 0.193 *** | 0.323 *** | 0.410 *** | 0.469 *** | 0.508 *** |
| UG | 0.085 *** | 0.141 *** | 0.171 *** | 0.180 *** | 0.171 *** |
Note: *** 1% level of significance.
Table 5.
Results of the bounds test for the nonlinear cointegration.
| Series | F-Statistics | LCB I(0) | UCB I(1) | Conclusion |
|---|---|---|---|---|
| lnGDP = f (lnAT, lnEC, lnFD, lnSG, UG) | 11.94296 *** | 2.88 | 3.99 | Cointegrated |
Note: *** 1% level of significance.
Table 6.
Results of long-run estimation.
| Long-Run Estimation | ||
|---|---|---|
| Variable | Coefficient | t-Statistic |
| lnAT+ | 0.158 | 3.096 * |
| lnAT− | 0.382 | 2.935 *** |
| lnEC | 0.675 | 3.861 * |
| lnFD | 0.080 | 0.945 |
| lnSG | 0.586 | 1.789 *** |
| UG | 0.015 | 1.056 |
| C | 3.930 | 3.187 * |
Note: *** 1% level of significance; * 10% level of significance.
Table 7.
Results of short-run estimation.
| Short-Run Estimation | ||
|---|---|---|
| Variable | Coefficient | t-Statistic |
| C | 1.413 | 2.530 ** |
| lnGDP (−1) | −0.340 | −5.557 * |
| lnAT+ (−1) | 0.057 | 2.775 ** |
| lnAT− | 0.138 | 3.144 * |
| lnEC | 0.243 | 4.787 |
| lnFD (−1) | 0.029 | 0.937 |
| lnSG | 0.211 | 1.613 |
| UG | 0.006 | 0.999 |
| D(lnGDP (−1)) | −0.174 | −1.554 |
| D(lnGDP_PC (−2)) | −0.234 | −1.930 *** |
| D(lnAT_POS) | −0.004 | −0.107 |
| D(lnAT_POS (−1)) | −0.084 | −2.780 |
| D(lnFD) | 0.094 | 2.590 |
| D(lnFD (−1)) | 0.124 | 3.567 |
| ECM (−1) | −0.360 | −10.790 * |
Note: *** 1% level of significance; ** 5% level of significance; * 10% level of significance.
Table 8.
Diagnostic tests.
| Variable | Coefficient |
| R2 | 0.741 |
| Durbin–Watson test | 2.053 |
| Jarque–Bera test | 5.676 (0.059) |
| Breusch–Godfrey LM test | 0.302 (0.824) |
| Breusch–Pagan–Godfrey test | 1.876 (0.073) |
| Harvey test | 1.079 (0.409) |
| Ramsey test | 0.319 (0.576) |
| Wald test | 5.981 (0.001) |
Publisher’s Note: MDPI stays neutral with regard to jurisdictional claims in published maps and institutional affiliations. |
© 2022 by the authors. Licensee MDPI, Basel, Switzerland. This article is an open access article distributed under the terms and conditions of the Creative Commons Attribution (CC BY) license (https://creativecommons.org/licenses/by/4.0/).
Share and Cite
MDPI and ACS Style
Khanal, A.; Rahman, M.M.; Khanam, R.; Velayutham, E. Exploring the Impact of Air Transport on Economic Growth: New Evidence from Australia. Sustainability 2022, 14, 11351. https://0-doi-org.brum.beds.ac.uk/10.3390/su141811351
AMA Style
Khanal A, Rahman MM, Khanam R, Velayutham E. Exploring the Impact of Air Transport on Economic Growth: New Evidence from Australia. Sustainability. 2022; 14(18):11351. https://0-doi-org.brum.beds.ac.uk/10.3390/su141811351
Chicago/Turabian StyleKhanal, Avishek, Mohammad Mafizur Rahman, Rasheda Khanam, and Eswaran Velayutham. 2022. "Exploring the Impact of Air Transport on Economic Growth: New Evidence from Australia" Sustainability 14, no. 18: 11351. https://0-doi-org.brum.beds.ac.uk/10.3390/su141811351
Note that from the first issue of 2016, this journal uses article numbers instead of page numbers. See further details here.