

The Tripartite Evolutionary Game of Green Agro-Product Supply in an Agricultural Industrialization Consortium

School of Business Administration, Shandong University of Finance and Economics, Jinan 250014, China
Sustainability 2022, 14(18), 11582; https://0-doi-org.brum.beds.ac.uk/10.3390/su141811582
Submission received: 26 July 2022
/
Revised: 26 August 2022
/
Accepted: 7 September 2022
/
Published: 15 September 2022
(This article belongs to the Special Issue Green and Sustainable Supply Chains)
Abstract
:In recent years, China has actively promoted the green transformation and low-carbon development of agriculture. New-type agricultural business entities such as family farms, specialized cooperatives and agro-processing enterprises have become important vehicles of agricultural green transformation due to their comparative advantages in multiple aspects. Within the agricultural industrialization consortium, the motivation of new-type agricultural business entities to synergistically implement the agricultural green transformation strategy is affected by bounded rationality as well as multiple economic and social factors. Clarifying the mechanism of the above factors would be of benefit to promoting agricultural green transformation in developing countries. In this article, a tripartite evolutionary game model about the production and sale of green agro-products is constructed, and the influences of various factors on the evolutionary game process are analyzed, based on new institutional economics and new economic sociology. According to the simulation results, it is found that the proportional quality contributions of the agents, the intensification of consumers’ preference for green agro-products and the increase of social embedding cost are conducive to the system converging to the favorable evolutionary equilibrium at a faster rate. However, the increases of marginal costs, market risks and spillover effects would prevent the system from converging to the favorable evolutionary equilibrium. Accordingly, corresponding suggestions are put forward to support the effective supply of green agricultural products in the agricultural industrialization consortium.
1. Introduction
For achieving rural revitalization and ensuring food security, the Chinese government is actively promoting the green and low-carbon development of agriculture [1,2]. However, numerous small farmers in rural China adopt the traditional methods to produce and sell agro-products, which makes it difficult to realize the agricultural green transformation. In recent years, the emerging new-type agricultural business entities (abbreviated as NABEs) including family farms, specialized cooperatives and agro-processing enterprises have provided solutions to the above dilemma. The empirical evidences suggest that the NABEs have significant comparative advantages in large-scale production, commercial operation and technological innovation, which might drive them to collectively adopt environment-friendly and resource-saving production and operation modes. In order to adapt to the technical standards of agricultural green transformation in the industrial chain, NABEs usually form agricultural industrialization consortiums to share revenues and risks through multi-agent coordination.
In recent years, existing studies have explored the influencing factors of green agro-product supply from the perspective of consumer demands, industrial organizations and environmental regulations. Firstly, food safety attitudes, quality grading systems and corporate social responsibilities would improve consumers’ willingness to purchase green agro-products and improve the profitability of NABEs [3,4,5]. Secondly, the internal and external integration of the supply chain is the critical factor to improve green agro-product quality, and non-economic power significantly and positively affects NABEs’ supply chain integration [6,7,8]. Thirdly, with the expanded use of agricultural green technologies, such as precision sowing and deep fertilization, regulatory factors including crop insurances, financial subsidies and tax rebates would intensify NABEs’ capabilities to supply green agro-products [9,10,11,12]. However, most of the existing studies aim to discuss the static equilibrium of green agro-product supply based on the assumption of complete information and complete rationality, which might not be consistent with the actual situation of agricultural green transformation.
Due to the severe information asymmetries in the production, processing, storage, distribution and sale of agro-products, consumers’ effective demand and preference for green agro-products are not robust, causing green agro-products to have properties of public goods and face high market risks. This might not only lead to the lack of economic and social incentives for agricultural industrialization consortiums to maintain the green and low-carbon development, but also induce the NABEs to commit opportunistic behaviors that might violate the relevant regulations of agricultural green transformation. In fact, the NABEs’ strategic choices have high uncertainty owing to the bounded rationality. Various stakeholders need to learn from and adapt to each other constantly, and finally choose better production and operation strategies, causing the system to gradually reach an evolutionary stable state. Consequently, whether the NABEs could collectively abide by the formal and informal regulations of agricultural green transformation depends on the revenues and costs of adhering to green and low-carbon development, which is the crucial factor to determine the evolutionary equilibrium of NABEs.
In this article, a tripartite evolutionary game model about NABEs’ production and sale of green agro-products is constructed based on the assumption of incomplete information and bounded rationality, in order to explore the conditions of dynamic equilibrium of green agro-product supply. At the same time, the influences of industrial integration, consumption preferences, market risks, spillover effects and social embeddedness on the processes and results of the tripartite evolutionary game are discussed from the perspectives of new institutional economics and new economic sociology.
This article contributes to the existing literature by relating the tripartite evolutionary game as well as the simulation approach to the agricultural industrialization consortium which is the crucial vehicle of agricultural green transformation. Additionally, it also contributes to the literature regarding revealing the influence and mechanism of several economic and social factors on NABEs’ motivation to produce and sell green agro-products synergistically. The findings of this article could assist policymakers in designing policies to facilitate the high-quality development of agricultural industrialization consortiums. Moreover, because of the worldwide popularization of NABEs, the findings could promote the agricultural green transformation in developing countries.
2. Theoretical Framework
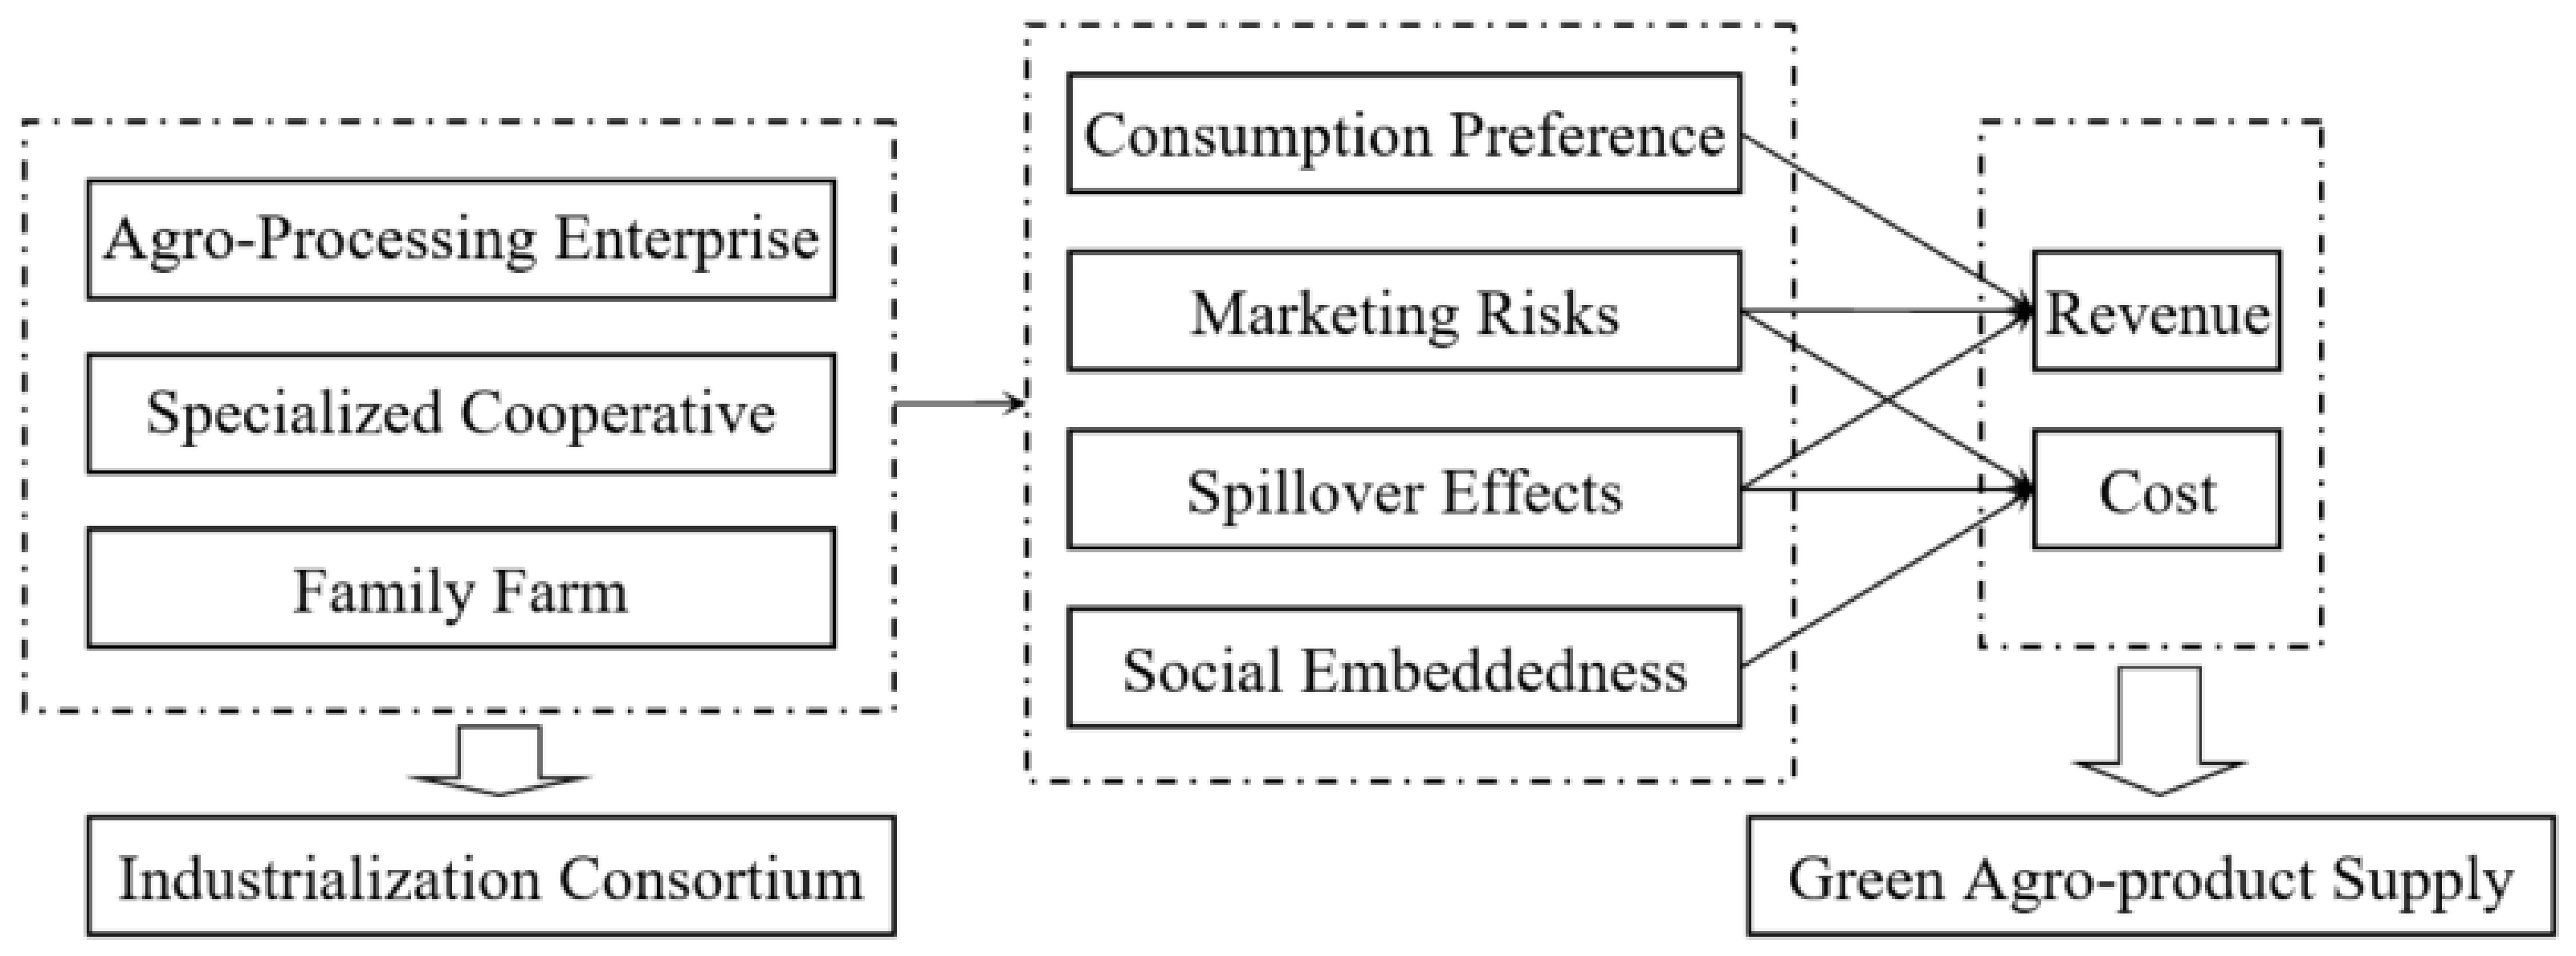
The agricultural green transformation requires more high-quality human, financial, physical and technology resources, resulting in the costs of producing and selling green agro-products being significantly higher than those of ordinary agro-products [13,14]. In terms of current technical conditions, the production and sale of green agro-products would be accompanied by increasing marginal costs. In order to solve this practical dilemma, the NABEs including family farms, specialized cooperatives and agro-processing enterprises usually form agricultural industrialization consortiums to share revenues and risks, reducing the information asymmetry and the transaction costs through coordination in the industrial chain, and enhancing the economies of scale as well as the incentives for the agricultural green transformation. As the source of the agricultural industrial chain and the core agent of agro-product production, family farms need to give full play to the institutional advantage of domestic management, the empirical advantage of specialized production and the identity advantage of the homogeneity with smallholders, in order to improve land productivity continuously and reduce the production cost of agricultural green transformation [15,16,17]. The specialized cooperatives need to stabilize the cooperative relationship between family farms and agro-processing enterprises by providing socialized productive services, and connect industrial and commercial capital with agricultural industrialization consortiums effectively [18,19,20]. The agro-processing enterprises need to exert their capital advantages, technological advantages and marketing advantages, and extend the industrial chain, value chain and supply chain of green agro-products based on the application and promotion of advanced agricultural technologies, in order to enhance the economic and social benefits of agricultural green transformation [21,22,23]. The existing research and empirical evidences indicate that NABEs’ revenue and cost of supplying green agro-products might be influenced by several economic and social factors, such as consumption preferences, market risks, spillover effects and social embeddedness (Figure 1).
2.1. Consumption Preference
With the development of society and economy, consumers’ demands and preferences for green agro-products have been intensified, driving the improvement of the production and sale efficiency of green agro-products, which constitutes the initial motivation of agricultural green transformation [24,25,26]. Specifically, the stronger the demand and preference of consumers for green agro-products, the higher the profit margin of green agro-products, and the stronger the motivation of NABEs to collectively abide by the regulation of agricultural green transformation through coordination in the industrial chain. The reason is that consumers’ trust in the corporate brand, regional brand and public brand of green agro-products could reduce the transaction costs, promote the target customers’ repeated and cross purchases, and form good word-of-mouth reputation [27,28,29]. The enhancement of consumption preferences could reduce the production and sale costs of green agro-products and improve profitability of the NABEs engaged in green and low-carbon development of agriculture [30,31,32]. Therefore, the growing demand and preference of consumers for green agro-products could effectively intensify the motivation of family farms, specialized cooperatives and agro-processing enterprises to comply with regulations of agricultural green transformation and to apply green agricultural technologies. According to the above analysis, the research hypothesis is proposed that the stronger the consumer’s preference for green agro-products, the higher the probability for NABEs to produce and sell green agro-products synergistically.
2.2. Market Risks
According to the perceptibility of product quality, goods could be divided into three categories, including search goods, experience goods and credence goods [33,34]. Search goods refer to the products whose quality attributes could be clearly understood by consumers before purchase and consumption. Experience goods refer to the products whose quality attributes could be clearly understood by consumers after purchase and consumption. Credence goods refer to the products whose quality attributes are too difficult for consumers to clearly understand even after purchase and consumption. According to the above classification criteria, agro-products could be regarded as typical credence goods, which might lead consumers to question the quality authenticity and the pricing rationality in the process of purchasing green agro-products [35,36,37]. Therefore, compared with ordinary agro-products, there are higher market risks for the production and sale of green agro-products in the case of severe information asymmetry [38,39]. Due to the progressive transfer of market risks along the industrial chain, the willingness of NABEs to apply and promote green agricultural technology would be restricted [40,41]. Therefore, the following research hypothesis is proposed, that the higher the market risks of green agro-products, the lower the probability for NABEs to produce and sell green agro-products synergistically.
2.3. Spillover Effects
In the process of implementing the strategy of green and low-carbon development, the agricultural industrialization consortium would form significant external economy, which means that even if some NABEs violate regulations of agricultural green transformation, they could also free-ride on the market premium of green agro-products to a certain extent [42,43,44]. However, the free-riding premium is unstable owing to the regulatory mechanisms. This spillover effect often comes from two aspects, including the reputation of regional brands and the popularization of agricultural technologies. On the one hand, the agro-processing enterprises with strong marketing advantages often have high brand reputation, and they might raise green agro-products’ prices of specialized cooperatives and family farms to a certain degree with the brand assets formed by long-term accumulation [45,46,47]. On the other hand, in the process of applying modern agro-production and operation technologies, the agro-processing enterprises and the specialized cooperatives might promote the production efficiency of family farms to a certain extent and drive the significant improvement of the green agro-product quality through technical training and productive services [48,49]. However, it is worth noting that the above spillover effects are unidirectional rather than interactive [50]. The leading agro-processing enterprises might have certain spillover effects on specialized cooperatives and family farms. Additionally, the agricultural specialized cooperatives might have certain spillover effects on family farms. However, it is difficult for family farms to have obvious spillover effects on the other two categories of NABEs. Consequently, the research hypothesis is proposed that the greater the spillover effects in agricultural green transformation, the lower the probability for NABEs to produce and sell green agro-products.
2.4. Social Embeddedness
The production and operation of NABEs are deeply embedded in the rural institutional environment [51]. On the one hand, the violation of the formal and informal institutions would weaken the legitimacy of NABEs, and make the rational flow and efficient allocation of the factors face numerous difficulties. On the other hand, if NABEs deviate from the formal and informal regulations, they are likely to be isolated and resisted by rural residents and organizations, resulting in a huge rise in the transaction costs [52,53]. The empirical evidence shows that, when the minority of NABEs in the industrialization consortium implement non-green strategies but the majority of NABEs implement green strategies, the minority would face the confrontational collective actions from the others. Therefore, it would cause extremely high transaction costs that ignore the consensus and regulation of agricultural green transformation in a certain region, which causes the illegal NABEs to lose their original competitive advantages and economic profits [54,55,56]. Accordingly, the research hypothesis is proposed that the higher the cost of social embeddedness in the agricultural green transformation, the higher the probability for NABEs to produce and sell green agro-products.
3. The Tripartite Evolutionary Game Model
3.1. The Payoff Matrix
It is assumed that the agents of the tripartite evolutionary game in the agricultural industrialization consortium include family farms, specialized cooperatives and agro-processing enterprises, and the strategies they could choose include implementing the green transformation strategy () and not implementing the green transformation strategy (). It is also assumed that the proportions that these three categories of agents choose strategy are , and , respectively.
In order to simplify the analysis, the relative payoffs of the three categories of agents when implementing strategy are assumed to be 0. represents the measurable quality of a certain kind of green agro-products. represents the weights of the contribution of the three categories of agents to the overall quality of the green agro-products, and is greater than or equal to 0 and less than or equal to 1 (i = 1, 2, 3). represents the marginal costs of green agro-products, and the total cost of green agro-products is defined as a quadratic form , because with the improvement of the agro-product quality, the marginal cost of green agro-products would increase significantly.
represents the intensity of consumers’ preference for green agro-products, and with the enhancement of the preference intensity, the revenues of NABEs from the production and sale of green agro-products would increase. When all agents implement strategy , the green agro-products produced and sold have complete quality attributes, and the agents’ relative payoffs adopting strategy are . When some agents implement the non-green transformation strategy , the green agro-products cannot have complete quality attributes, and the other agents’ relative payoffs adopting strategy are .
represents the coefficient of market risks of green agro-products, and is greater than or equal to 0 and less than or equal to 1. The lower the market risks of green agro-products, the greater the agents’ expected revenue adopting green transformation strategies, and vice versa. Since there are upstream and downstream cooperations in the industrial chain, the market risks of green agro-products are usually undertaken by the agents of the downstream industrial chain that would complete the final sale of the green agro-products. Specifically, when the agro-processing enterprises implement the green transformation strategy, they would undertake the total market risks. When the agro-processing enterprises do not implement the green transformation strategy but the specialized cooperatives do, the specialized cooperatives undertake the total market risks. When agro-processing enterprises and specialized cooperatives do not implement the green transformation strategy but family farms do, the family farms would undertake the total market risks.
represents the spillover coefficient and is greater than or equal to 0 and less than or equal to 1. When an agent implements the non-green transformation strategy but the others implement the green transformation strategy, it would obtain unstable spillover income with a certain probability. It is worth noting that the spillover effects from green transformation are unidirectional, which means that the agents upstream of the industrial chain could gain benefits from spillovers of the agents downstream of the industrial chain, but the converse is not true.
represents the coefficient of costs caused by violating the consensus of agricultural green transformation. The higher the overall quality of green agro-products, the greater the costs violating the consensus of agricultural green transformation would be. As mentioned above, when the minority of agents implement non-green strategies but the majority of agents implement green strategies, the minority would face the confrontational collective actions from the others, resulting in a substantial increase in production and transaction costs. Therefore, could be regarded as the price of violating the consensus of agricultural green transformation. According to the above analysis, the payoffs for NABEs to produce and sell green agro products in different contexts could be formulated as follows (Table 1).
3.2. The Replicator Dynamic Equations
According to the payoff matrix, the expected payoff of family farms (A) implementing the green transformation strategy () and the non-green transformation strategy () could be calculated and denoted as and , respectively. Additionally, the average expected payoff of family farm (A) could then be calculated and denoted as .
By the same method, the expected payoff of specialized cooperatives (B) implementing the green transformation strategy () and the non-green transformation strategy () could also be calculated and denoted as and . Additionally, the average expected payoff of specialized cooperatives (B) could be calculated and denoted as .
Similarly, the expected payoff of agro-processing enterprises (C) implementing the green transformation strategy () and the non-green transformation strategy () could also be calculated and denoted as and , respectively. Additionally, the average expected payoff of agro-processing enterprises (C) could be calculated and denoted as .
Thus, the replicator dynamic equations of family farms (A), specialized cooperatives (B) and agro-processing enterprises (C) implementing green transition strategy () could be formulated as follows.
3.3. The Stability Analysis
In order to facilitate the subsequent analysis, the above replicator dynamic equations are further simplified as follows. In Table 2, the coefficients in simplified replicator dynamic equations are defined.
According to the method proposed by Friedman (1991), the evolutionarily stable strategy (ESS) of the differential equation system could be obtained from the local stability analysis of the Jacobian matrix. Additionally, based on the research of Ritzberger and Weibull (1995), in the case of tripartite evolutionary games, it is only necessary to discuss the local stability of the pure strategic equilibrium points, including (0,0,0), (1,0,0), (0,1,0), (0,0,1), (1,1,0), (1,0,1), (0,1,1), and (1,1,1).
According to the Lyapunov method, the stability of differential system could be judged by the positivity and negativity of the eigenvalues of equilibrium points. When all eigenvalues in the Jacobian matrix are less than 0, the equilibrium point is an evolutionary stable point. When any eigenvalue in the Jacobian matrix is greater than 0, the equilibrium point is not an evolutionary stable point (Table 3).
When = < 0, = < 0, = < 0, (0,0,0) is the possible stable equilibrium point of the evolutionary game. This means that the income of the agents engaged alone in the production and sale of green agro-products is lower than the cost. This leads the agents to gradually abandon the strategy of agricultural green transformation and the evolutionary system evolves into an unfavorable equilibrium state.
When = > 0, = > 0, = > 0, (1,1,1) is the possible stable equilibrium point of the evolutionary game. This means that the income of the agents engaged in the production and sale of green agro-products and the value of the resulting social capital are significantly higher than the cost, causing the system to evolve into a favorable equilibrium state.
If the above conditions are met at the same time, then (0,0,0) and (1,1,1) are the evolutionary stability points, and the final result of the evolutionary game depends on the initial state.
4. Simulation Results
In the agricultural industrialization consortium, the family farms, specialized cooperatives and agro-processing enterprises are required to apply environment-friendly and resource-saving production and operation technologies, to meet the demands of the green transformation. In recent years, relevant research show that about 21.2% of exemplary family farms, 32.3% of exemplary specialized cooperatives and 46.7% of exemplary agro-processing enterprises have obtained the certification of pollution-free, organic or geographical indications [57,58,59]. Thus, it is assumed that the initial proportions of the family farms (A), specialized cooperatives (B) and agro-processing enterprises (C) implementing green transformation strategies are 20%, 30% and 40%, respectively. The investigation from the Chinese national social science fund project, “Research on the Industrial Chain Coordination Mechanism of New-type Agricultural Business Entities under the Goal of High-Quality Development” (19BGl150) shows that agro-processing enterprises contribute more than 50% to the quality improvement of green agro-products, and the quality contribution of cooperatives is slightly higher than that of family farms. Thus, it is assumed that the family farms (A), specialized cooperatives (B) and agro-processing enterprises (C) contribute 20%, 30% and 50% to the total quality of green agro-products, respectively. For simplicity and generality, according to the investigations and analyses in “The Report on the Development of Chinese New-type Agricultural Business Entities” and “The Report on Chinese Agricultural Green Development” issued in 2021, the initial values of the parameters are set as follows, which is in line with the current production and sale situation of green agro-products in China (Table 4).
4.1. The Influence of Agro-Product Quality
When the proportions of family farms, specialized cooperatives and agro-processing enterprises implementing agricultural green transformation strategies are 20%, 30% and 40%, the tripartite evolutionary system would converge on the favorable evolutionary equilibrium point (1,1,1) after 100 iterations under the initial settings of parameters. In this process, the proportion of family farms implementing the green transformation strategy would continue to rise, and the proportions of specialized cooperatives and agro-processing enterprises implementing green transformation strategies would decline first and then rise. This means that in the agricultural industrialization consortium, although family farms bear less market risks, they obtain higher spillover benefits, leading to the strongest willingness towards agricultural green transformation.
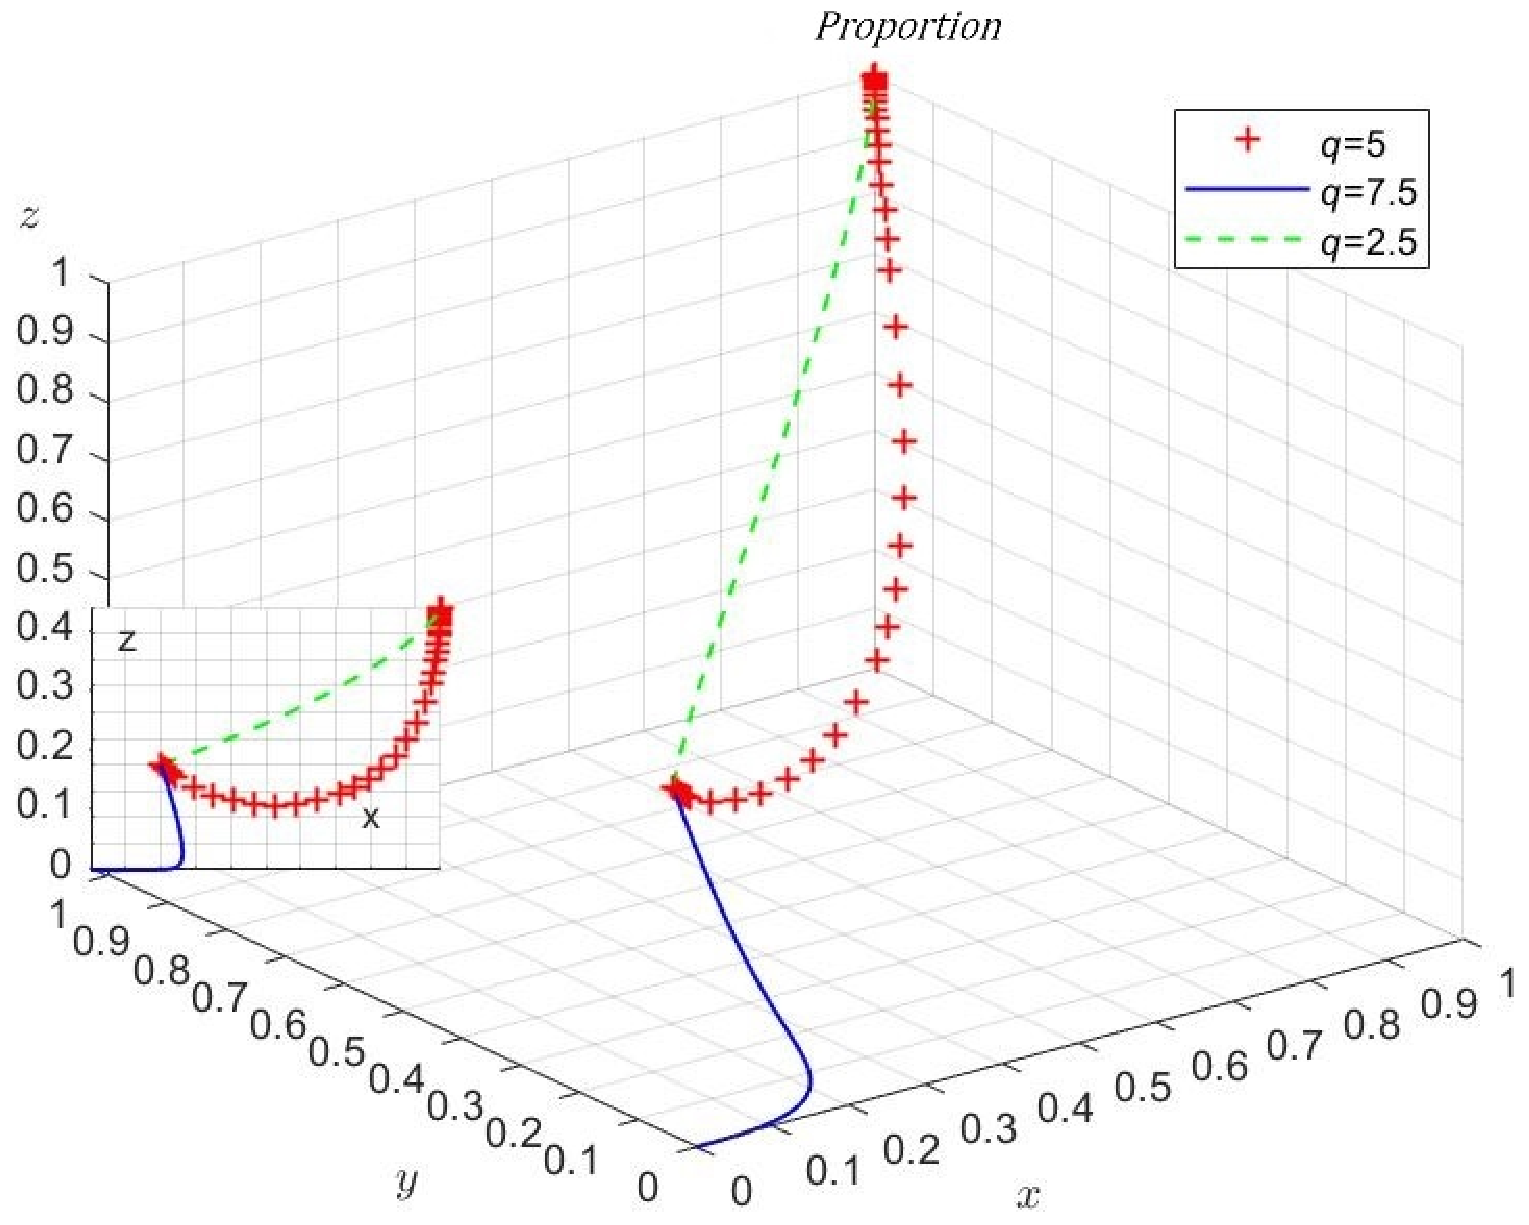
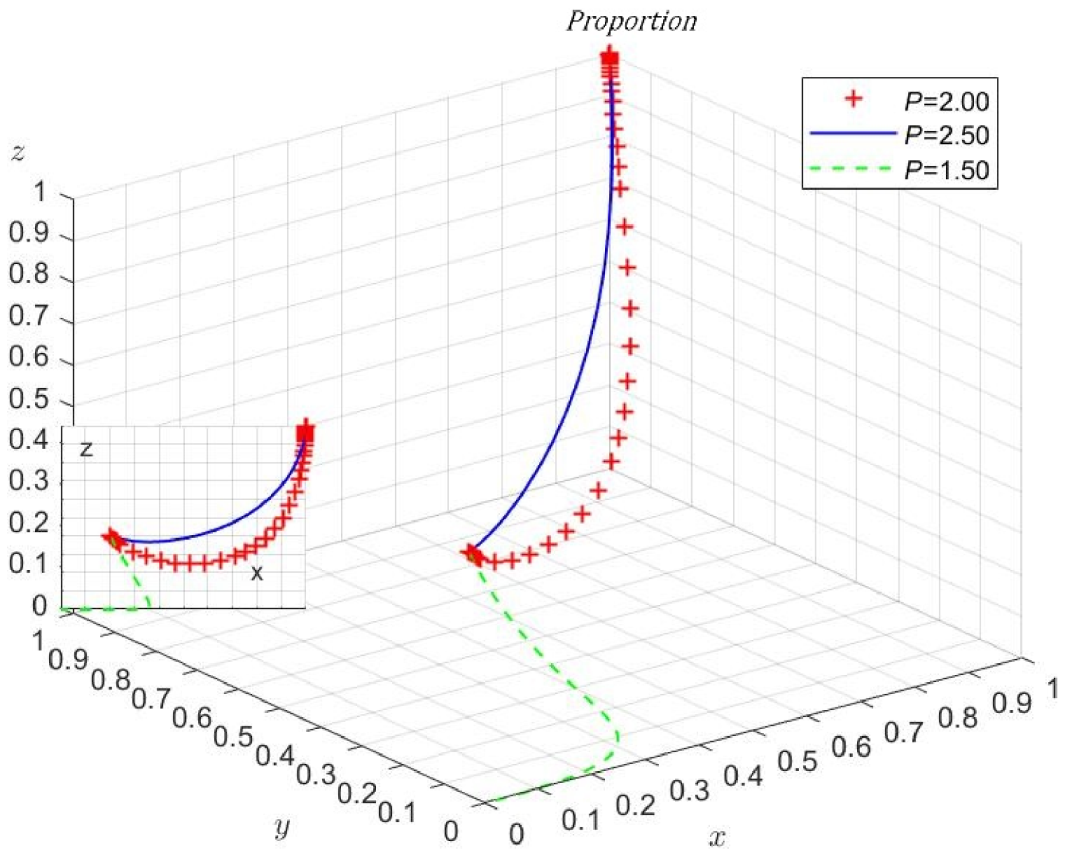
In order to observe the influence of the measurable quality of green agro-products on the process of the evolutionary game, is adjusted from 5 to 7.5 and then adjusted from 5 to 2.5, respectively. As shown in Figure 2, the simulation results indicate that the system would converge on the unfavorable evolutionary equilibrium point 0,0,0) when is adjusted from 5 to 7.5, and converge on the favorable evolutionary equilibrium point (1,1,1) significantly faster when is adjusted from 5 to 2.5.
This means that the improvement of the quality of green agro-products would lead to higher production costs and selling expenses, which might lead to the insufficient profit of agricultural green transformation under the existing technical conditions and environmental constraints. Therefore, it is necessary to actively promote the innovation and application of green agricultural technologies, and determine a reasonable quality range before taking substantive measures for agricultural green transformation.
Figure 2.
The influence of agro-product quality on the evolutionary game process.

4.2. The Influence of Contribution Weights
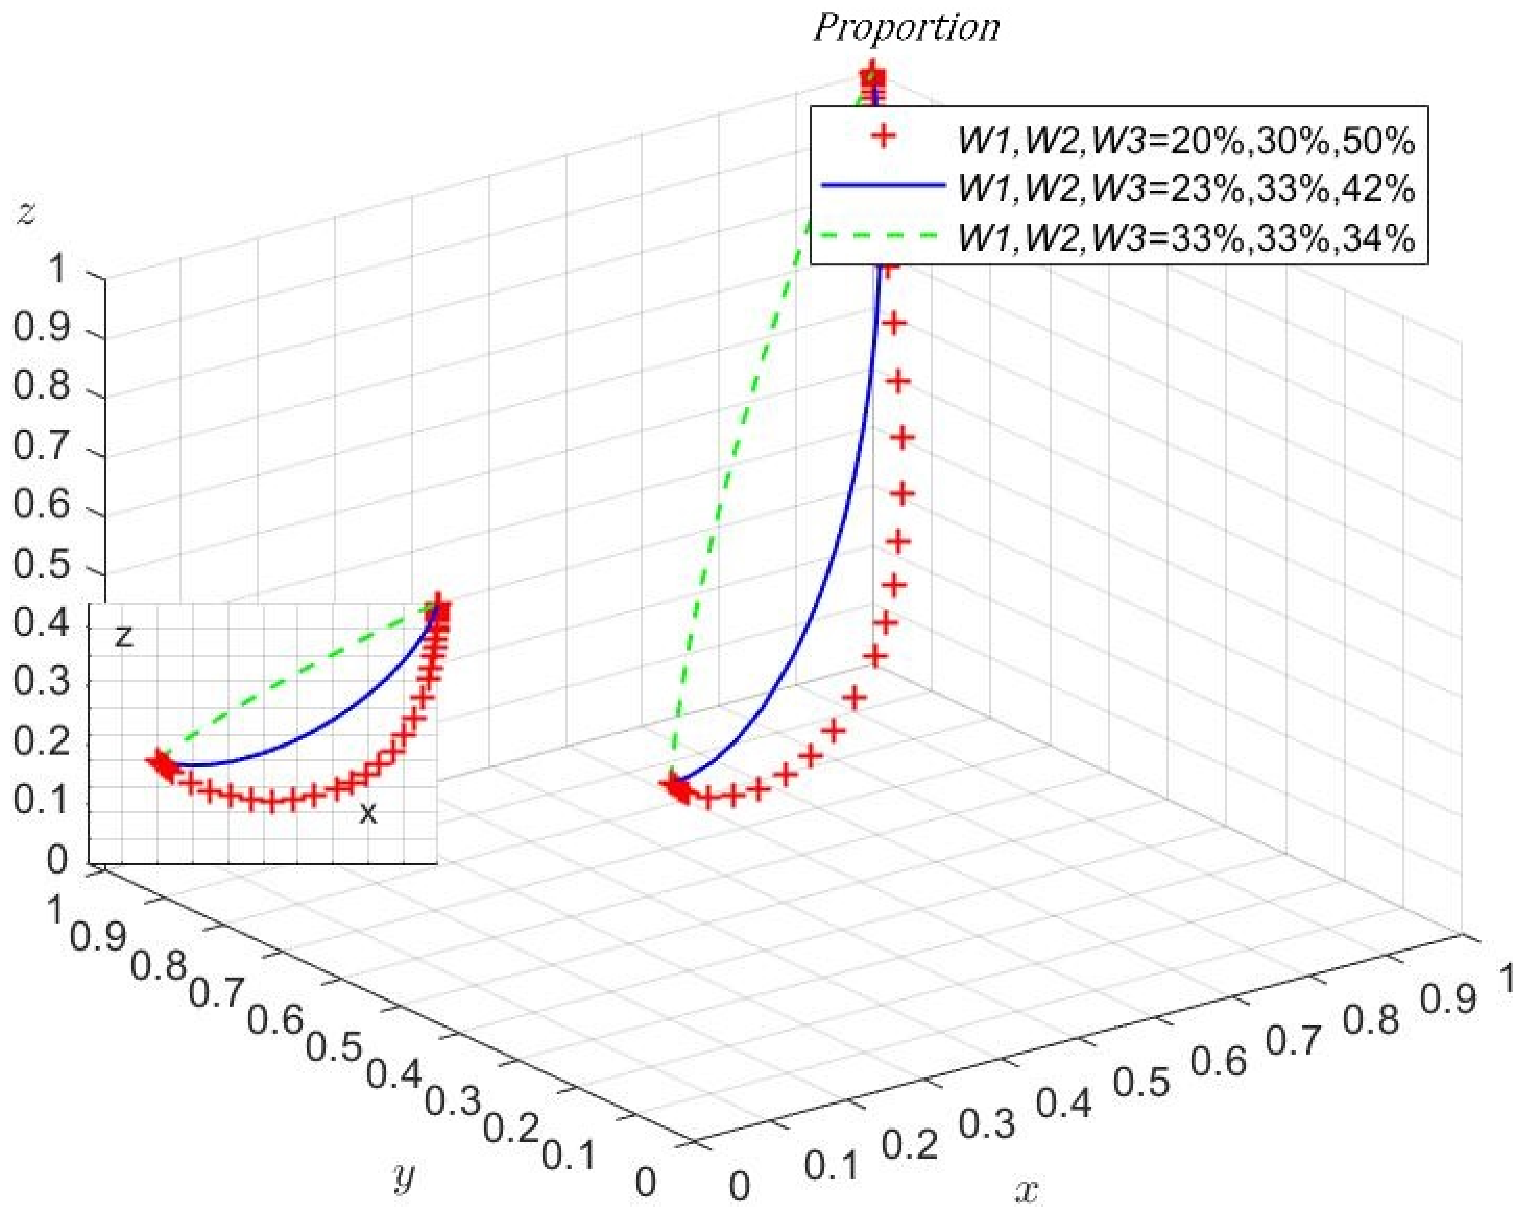
In the agricultural industrialization consortium, the agents need to realize revenue and risk sharing through coordination in the industrial chain, in order to promote the agricultural green transformation. Under the initial settings of the parameters, the contribution weights of family farms, specialized cooperatives and agro-processing enterprises to the quality of green agro-products are = 20%, = 30% and = 50%. This means that agro-processing enterprises undertake more tasks in the quality optimization of green agro-products, followed by cooperatives and family farms.
In fact, the degree that the agents collectively participate in the production and sale of green agro-products might have a profound influence on the process of the evolutionary game. In order to verify the above inference, the initial contribution weights are adjusted to = 25%, = 33% and = 42%, then adjusted to = 33%, = 33% and = 34%. It is obvious that the weight distribution of the third scheme is more equitable, followed by the second scheme and the initial scheme. As shown in Figure 3, the simulation results indicate that the system would converge faster on the favorable evolutionary equilibrium point (1,1,1) in the second parameter setting scheme in which = 25%, = 33% and = 42%, compared with the initial parameter setting scheme. Additionally, the system would converge faster to (1,1,1) in the third parameter setting scheme in which = 33%, = 33% and = 34%, than in the second parameter setting scheme.
As mentioned above, agricultural green transformation requires multi-agent cooperation. When the responsibilities for agricultural green transformation are excessively concentrated on a certain type of NABE, their motivation to supply green agro-products would decline due to reference dependence and fair perception. However, when all types of NABEs actively participate in agricultural green transformation, the capability of the agricultural industrialization consortium to supply green agricultural products would be significantly enhanced, because of the greatly reduced transaction costs. Therefore, a more equitable distribution of the quality contribution of green agro-products is conducive to the favorable evolution of the system.
Figure 3.
The influence of contribution weights on the evolutionary game process.

4.3. The Influence of Marginal Costs
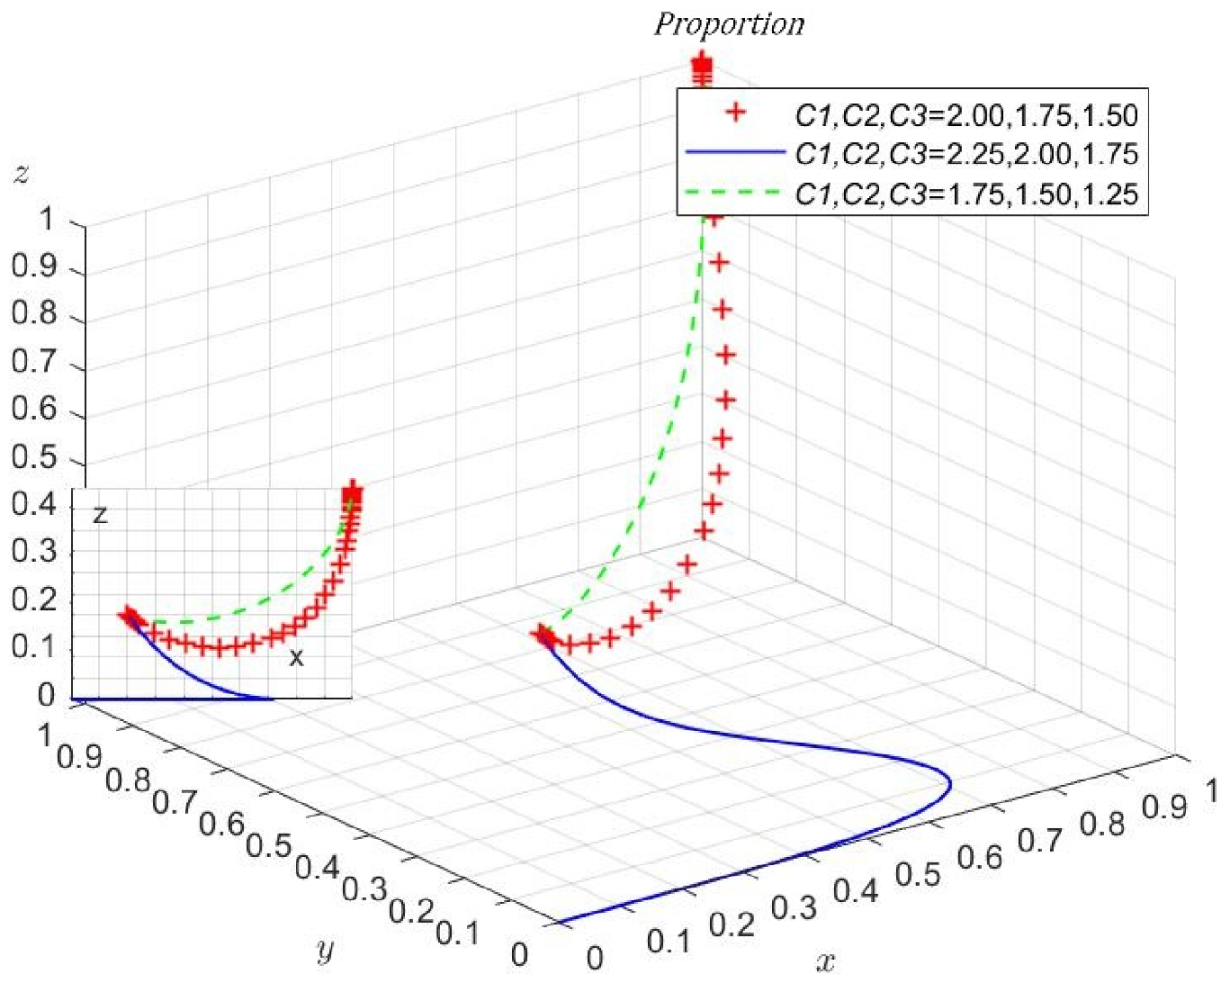
The empirical evidence from the production and sale of green agro-product indicates that the dynamic of marginal costs determine the optimal quality of green agro-products supplied. With the application of mechanized, digital and intelligent agricultural technologies, the marginal costs of green agro-products have been gradually declining, improving the return on investment in production and sale, which is conducive to the advantageous development of the system. However, when the promotion of modern agricultural technology is hindered, the marginal cost of green agro-products might rise significantly, which would adversely affect the evolution process of the system.
Under the initial conditions, the marginal costs , and are equal to 2.00, 1.75 and 1.50, respectively, which means that the agro-processing enterprises have the most advanced technologies in producing and selling green agro-products, followed by specialized cooperatives and family farms. In order to verify the influence of the marginal costs of green agro-products on the process of the tripartite evolutionary game, the marginal costs are adjusted to = 2.25, = 2.00 and = 1.75, then adjusted to = 1.75, = 1.50 and = 1.25. As shown in Figure 4, the simulation results indicate that the system could not converge on the favorable equilibrium point (1,1,1) when = 2.25, = 2.00 and = 1.75; and the system would converge on (1,1,1) significantly faster when = 1.75, = 1.50 and = 1.25.
The above results show that the dynamic evolution equilibrium of the system is very sensitive to the marginal cost of green agro-products, and even a very small change in the marginal cost might cause the reversal of the system evolutionary direction. When the marginal costs rise, the return on investment in producing and selling green agro-products decreases, the motivation of the agents to participate in the agricultural green transformation is weakened and the system would converge on the favorable equilibrium point at a slower rate, or could not converge on it. When the marginal costs fall, the return on investment in producing and selling green agro-products increases, the agents have higher payoffs from the agricultural green transformation and the system probably converges on the favorable equilibrium point at a faster rate. Consequently, how to reduce the marginal cost of production and sale of green agro-products would become the most important issue for the agricultural industrialization consortium. On the one hand, while the consumer demand remains unchanged, the agricultural industrialization consortium needs to expand the production scale of green agro-products and to obtain the economies of scale through specialization and division of labor. On the other hand, the agricultural industrialization consortium needs to apply mechanical, digital and intelligent agricultural technologies and reduce the production and sale costs of green agro-products.
Figure 4.
The influence of marginal costs on the evolutionary game process.

4.4. The Influence of Consumption Preferences
The enhancement of consumption preference could increase the market premiums of green agro-products and raise the payoffs of the three categories of agents in the production and sale of green agro-products. In order to observe the influence of consumption preferences of green agro-products on the process of the evolutionary game, is adjusted from 2.00 to 2.50 and then adjusted from 2.00 to 1.50, respectively. The simulation results of the evolutionary game indicate that the system would converge on the favorable evolutionary equilibrium point (1,1,1) when equals 2.50, and the system could not converge on the (1,1,1) when equals 1.50.
Consumers’ preferences for green agro-products are often positively related to the price they are willing to pay. As a result, the enhancement of consumption preferences would improve the revenue and motivation of agents to participate in the agricultural green transformation. As mentioned above, green agro-products have the attributes of credence products. Thus, the enhancement of consumption preferences is conducive to generate consumer trust, reduce transaction costs and relieve the uncertainties of green agro-products in marketing. Guiding and encouraging consumers to understand the quality information of green agro-products and gradually cultivating consumers’ consumption customs of green agro-products might become effective measures to enhance consumption preferences (Figure 5).
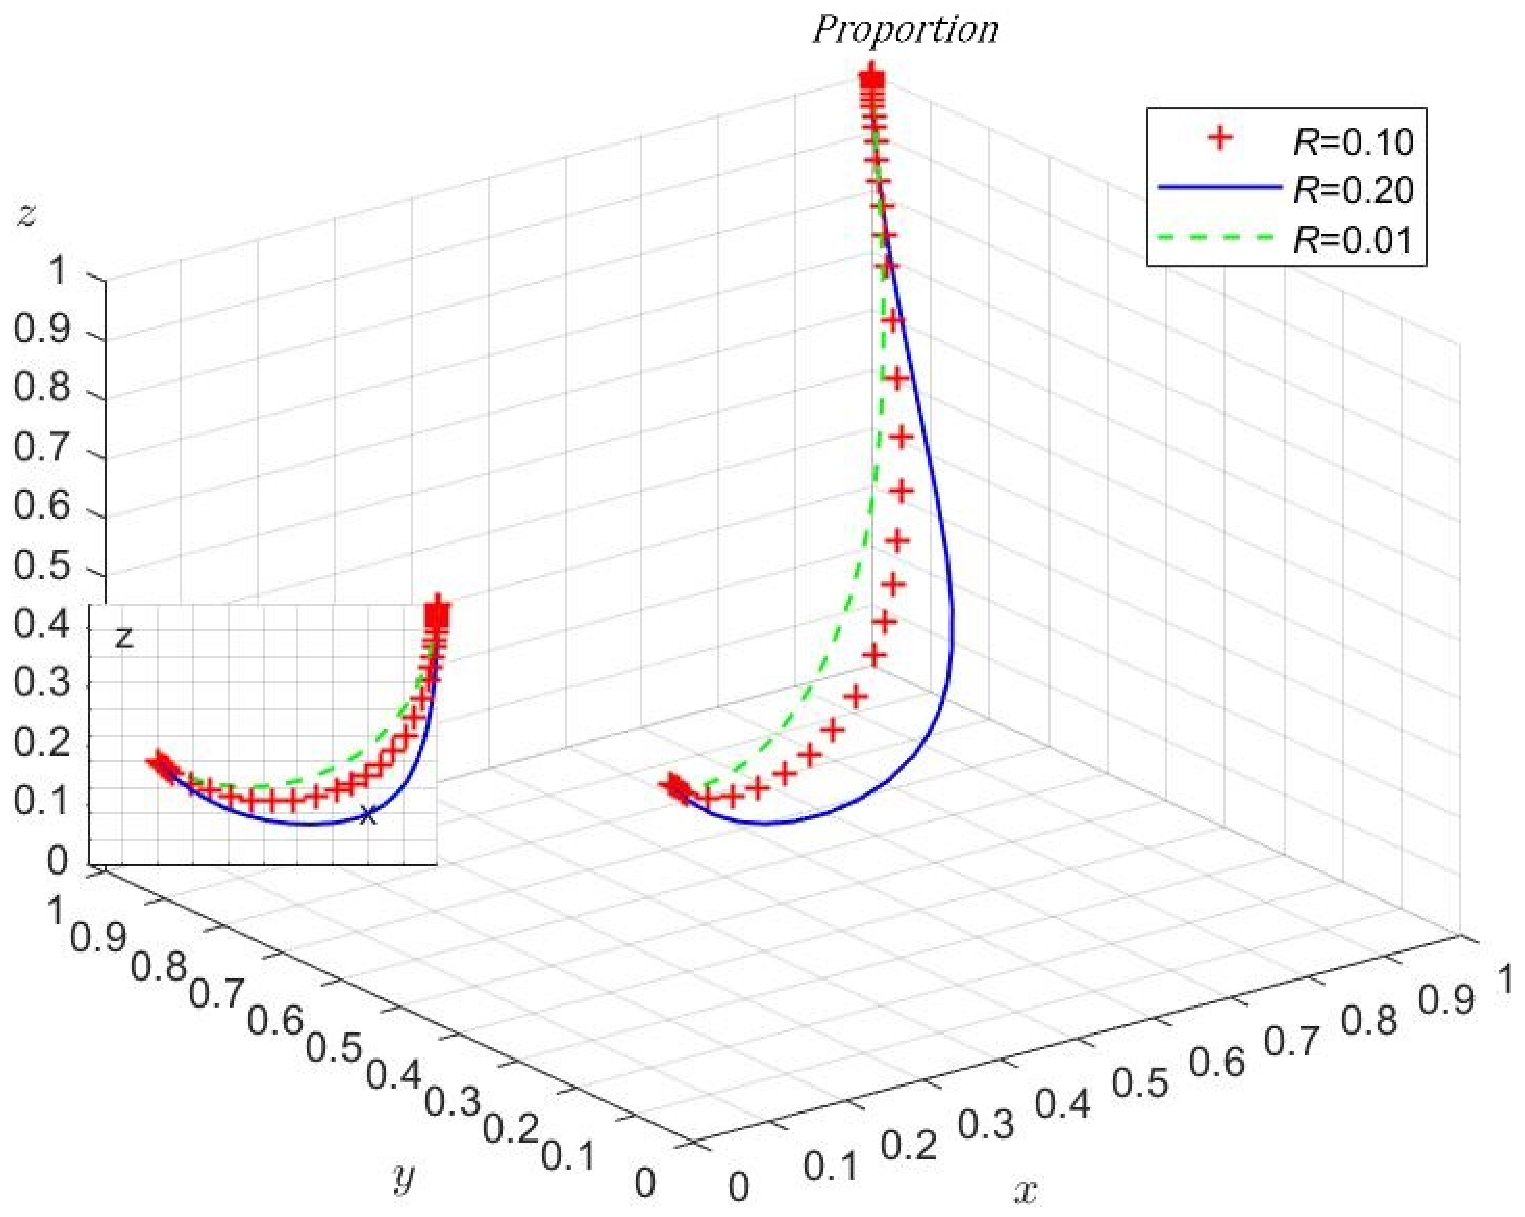
4.5. The Influence of Market Risks
As mentioned above, the agro-products have the properties of credence goods, resulting in the difficulties for consumers to accurately judge the true quality of green agro-products. Due to the information asymmetry, consumers’ trust in green agro-products is difficult to form, causing transaction uncertainties, as well as the high market risks for the production and sale of green agro-products. In order to observe the influence of market risks on the process of the evolutionary game, the marketing risk coefficient is adjusted from 0.10 to 0.20 and then adjusted from 0.10 to 0.01, respectively. The simulation results of the evolutionary game indicate that the system would converge at a slower rate on the favorable evolutionary equilibrium point (1,1,1) when equals 0.20 and converge at a faster rate on the favorable evolutionary equilibrium point (1,1,1) when equals 0.01.
This means that the reduction of the market risks to produce and sell green agro-products might increase the expected revenue of the agents participating in agricultural green transformation and enhance their economic incentives to supply green agro-products. According to prospect theory, individuals like to pursue risk owing to the reflection effects when they lose, and they like to avoid risk owing to the certainty effects when they gain. Due to the large scale, some NABEs believe that the risk of production and operation is far beyond their own capacity, leading to their risk aversion characteristics being more obvious than ordinary farmers. Therefore, it is equally important for NABEs to reduce the unreasonable risk perception and to reduce the actual market risks of green agro-products. Consequently, to improve the traceability system would reduce NABEs’ perception of market risks and stabilize the expected revenue from the production and sale of green agro-products, facilitating the advantageous development of the system (Figure 6).
4.6. The Influence of Spillover Effects
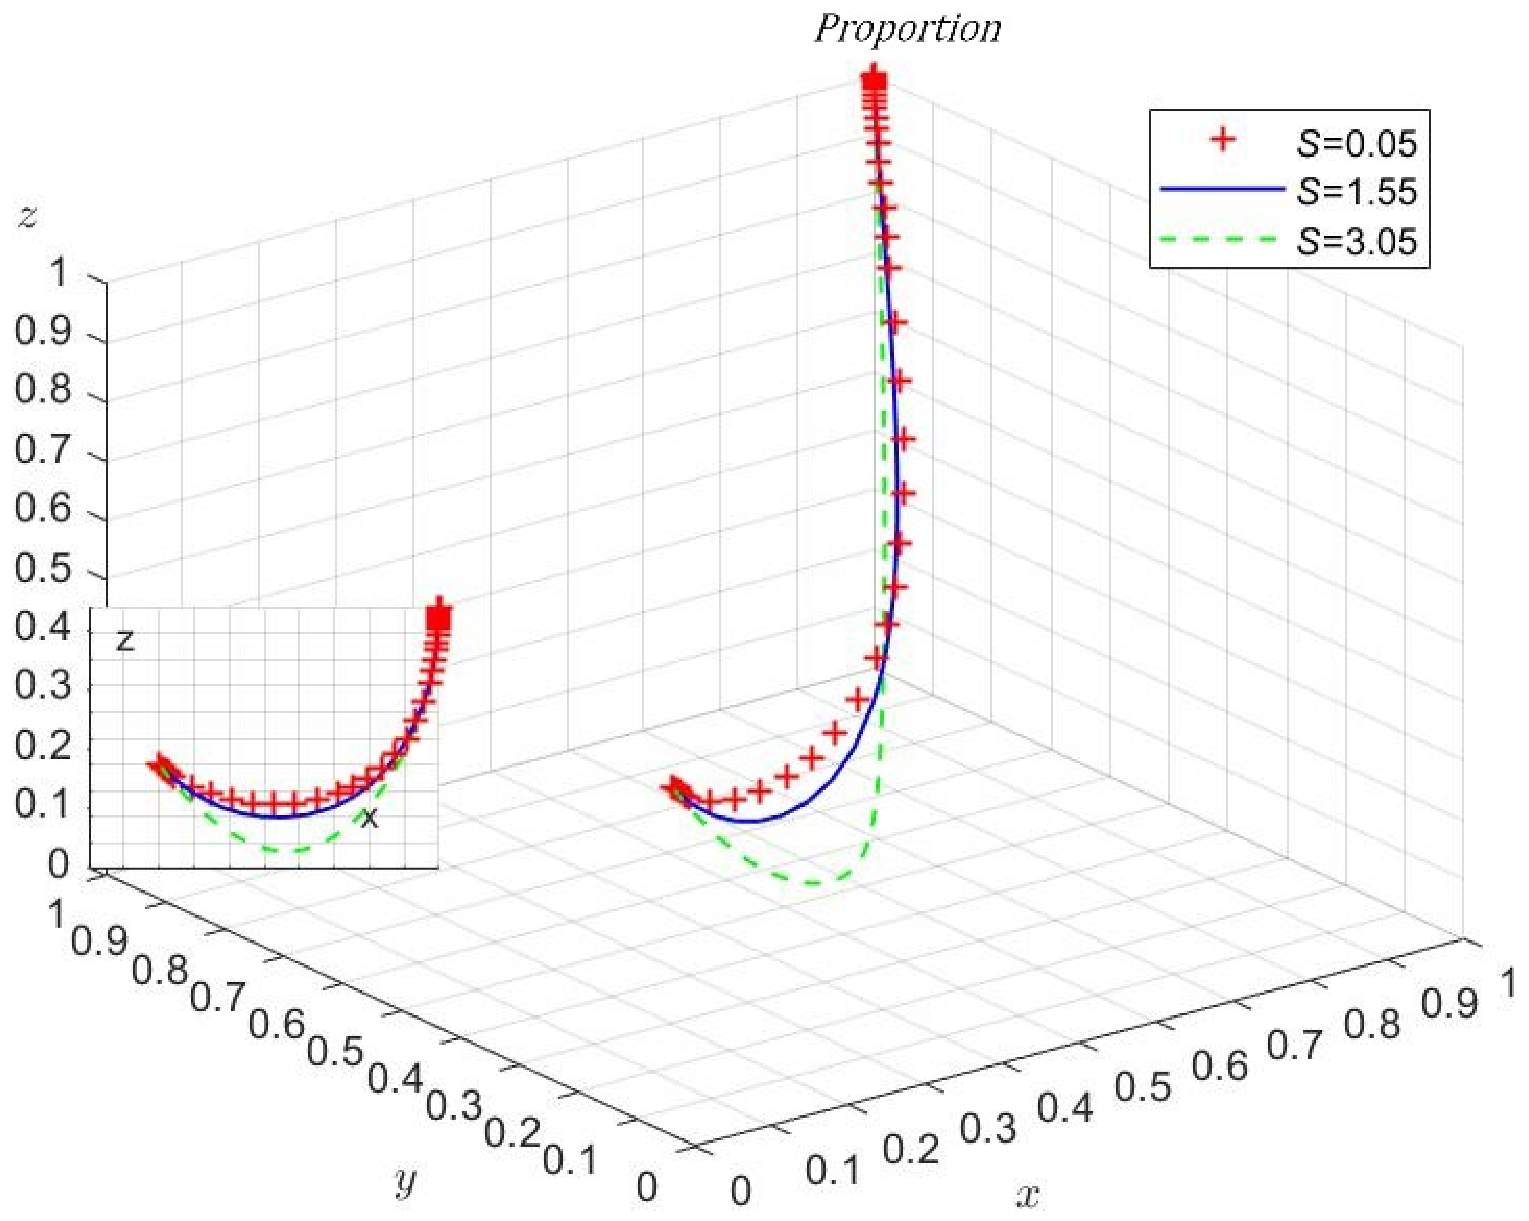
Since there is significant external economy in the production and sale of green agro-products, the agents implementing the non-green transformation strategy could still obtain unstable market premiums to a certain extent through free-riding, which might weaken the agents’ motivation to produce and sell green agro-products. In order to observe the influence of spillover effects on the process of the evolutionary game, the spillover coefficient is adjusted from 0.05 to 1.55 and then adjusted from 0.05 to 3.05, respectively. The simulation results of the evolutionary game indicate that the system would converge at a slower rate on the favorable evolutionary equilibrium point (1,1,1) when equals 1.55 and converge on the unfavorable evolutionary equilibrium point (0,0,0) when equals 3.05.
In fact, the impact of the market spillover is relatively small, compared with other factors, in the current market environment. However, when there are more and more agents free-riding on the quality investment of green agro-products, instead of actually implementing the agricultural green transformation strategies, the economic and social incentives for the agents to comply with the green and low-carbon regulation would still gradually decline. Therefore, standardizing the internal governance of the agricultural industrialization consortium, strengthening the interest connection between NBEs and improving the quality traceability and supervision mechanism might become effective measures to reduce spillover effects (Figure 7).
4.7. The Influence of Social Embeddedness
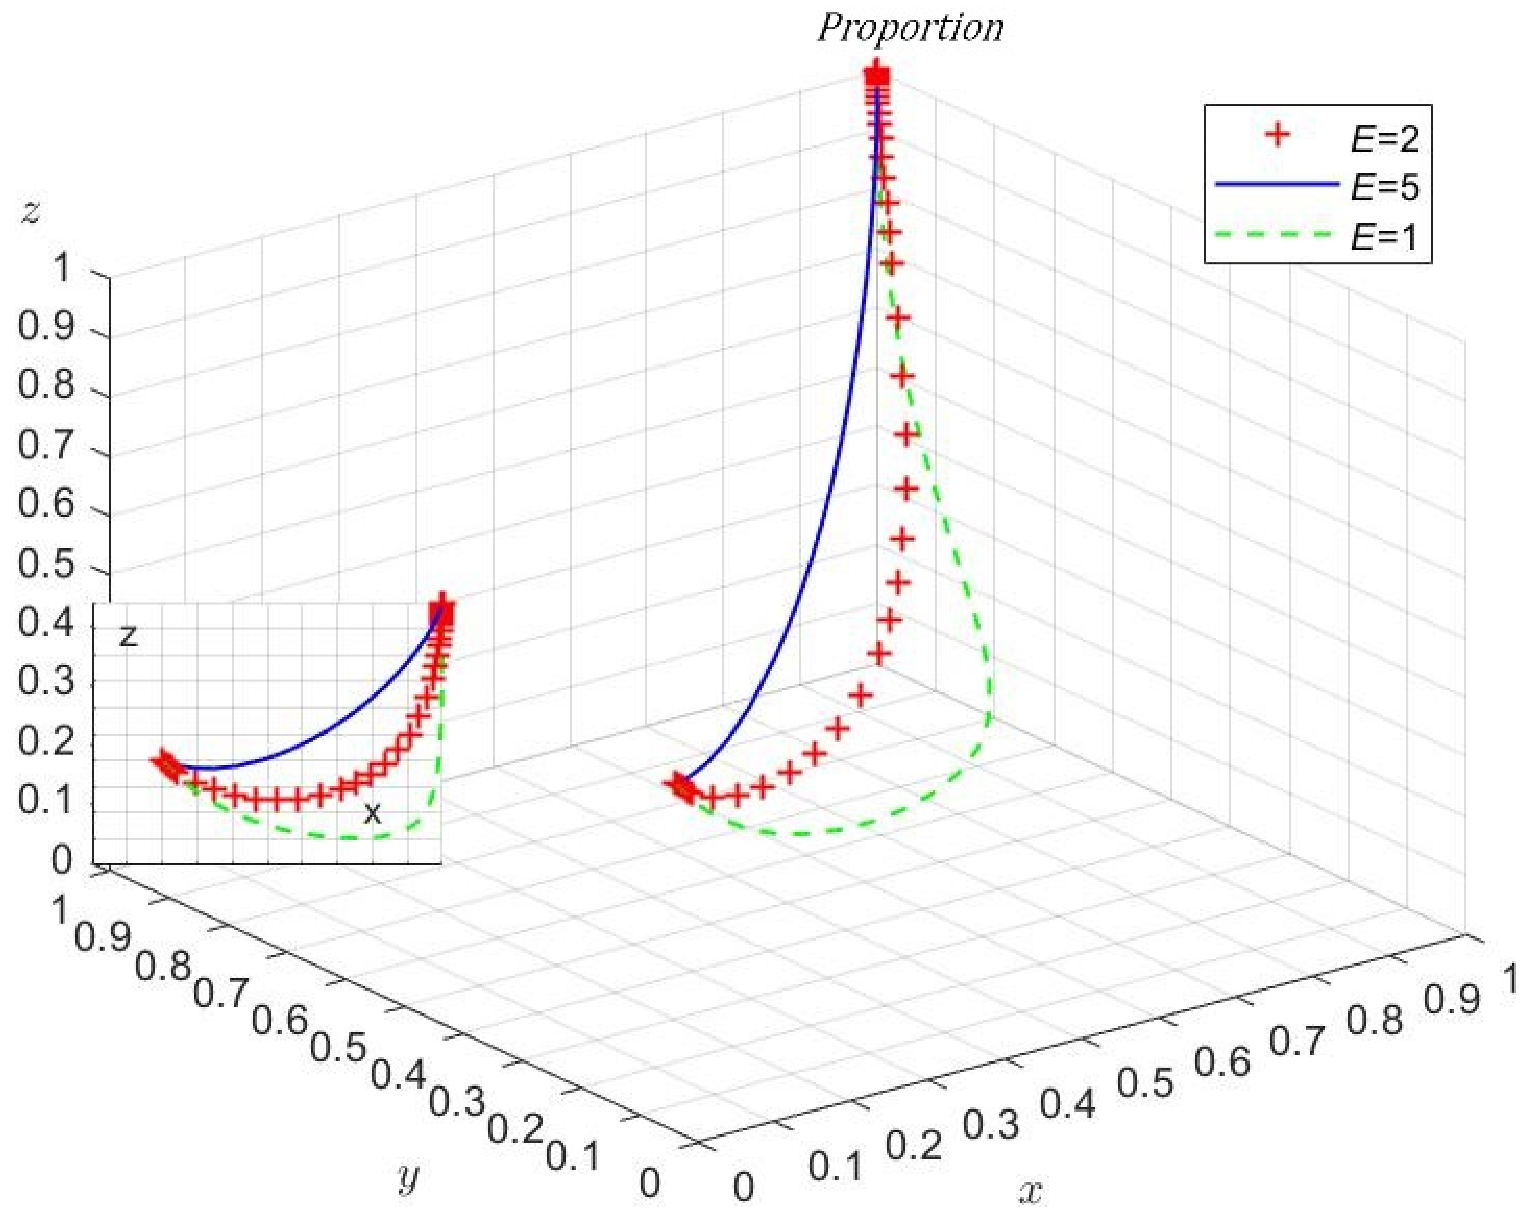
The production and sale of green agro-products are inevitably embedded in various formal and informal social regulations. When most agents follow the relevant regulations of green agro-products, green and low-carbon development might become the consensus of all agents. In this case, if some agents violate the relevant regulations of green agro-products, they would bear huge social embedding costs. In order to observe the influence of social embeddedness on the process of the evolutionary game, the coefficient of social embedding costs is adjusted from 2.00 to 5.00 and then adjusted from 2.00 to 1.00, respectively. The simulation results indicate that the system would converge at a faster rate on the favorable evolutionary equilibrium point (1,1,1) when equals 5.00 and converge at a slower rate to (1,1,1) when equals 1.00.
This means that in the case of high social embedded cost coefficient, if an agent violates the quality regulation of green agro-products, it would be collectively isolated and resisted by other agents, resulting in high transaction costs, eventually leading to performance decline. The agricultural green transformation is not only manifested in the innovation of agronomic process and material equipment, but also in the transformation of people’s concepts on the relationship between human and nature as well as the relationship between agriculture and environment, and the latter is more important. Therefore, strengthening policy subsidies and quality supervision, and cultivating the awareness of low-carbon development of all agents are conducive to the self-organizing development of the system (Figure 8).
5. Conclusions
In order to effectively promote the agricultural green transformation, new-type agricultural business entities usually form agricultural industrialization consortiums, engaged in the production and sale of green agro-products. However, the empirical evidence shows that new-type agricultural business entities present typical characteristics of bounded rationality, and affect the supply of green agro-products through multi-agent evolutionary games. Compared with previous studies, the mechanism of agricultural industrialization consortiums supplying green agro-products is explored for the first time in this paper, based on the hypothesis of bounded rationality and the approach of a tripartite evolutionary game. In addition, the influences of multiple economic and social factors including quality levels, quality contributions, marginal costs, consumption preferences, market risks and social embeddedness on the process and results of the evolutionary game are discussed.
According to the stability analysis and simulation results of the evolutionary game, the following conclusions are drawn. (1) Due to the increasing marginal costs, the improvement of quality level would result in the significant increase in the production and sale costs of green agro-products, which might lead to the system being unable to achieve the favorable evolutionary equilibrium state. It is necessary to actively promote the innovation and application of green agricultural technologies, and determine a reasonable quality range before taking substantive measures for agricultural green transformation. (2) Due to reference dependence and fairness perception, when all types of NABEs actively participate in agricultural green transformation, the capability of the agricultural industrialization consortium to supply green agricultural products would be significantly enhanced. Therefore, the proportional quality contributions of the three categories of agents would facilitate the system achieving the favorable evolutionary equilibrium state at a faster rate. (3) At the same time, the dynamic evolution equilibrium of the system is very sensitive to the marginal cost of green agro-products, and even a very small change in the marginal cost might cause the reversal of the system evolutionary direction. Thus, the decrease of marginal costs would significantly increase the income of the agents engaged in the production and sale of green agro-products, which is conducive to the system converging on the favorable equilibrium point at a faster rate. (4) The enhancement of consumption preferences would increase the market premiums of green agro-products and make the system converge on the favorable equilibrium point at a faster rate. Consequently, the agricultural industrialization consortium should guide consumers to understand the quality information of green agro-products and gradually cultivating consumers’ consumption customs of green agro-products through interactive Internet marketing. (5) The market risks caused by information asymmetry would reduce the expected return of the agents and make the system converge on the favorable equilibrium point at a slower rate. It is necessary for the agricultural industrialization consortiums to improve the traceability system of green agro-products and stabilize the expected revenue from agricultural green transformation. (6) The unidirectional spillover effects caused by external economy would enhance the motivation of agents to free-ride on the quality investment in the industrial chain, which is not conducive to the advantageous evolution of the system. However, compared with other factors, the impact of the market spillover is relatively small in the current market environment. (7) The increase of social embedding cost would increase the economic and social cost of the agents violating the regulation of green agro-products, which is conducive to the advantageous evolution of the system. Therefore, it is important for policy makers to strengthen quality subsidies and quality supervision and to cultivate the awareness of low-carbon development of all agents.
For the sake of generality and universality, the author does not use a specific agro-product as the material for simulation analysis, which might restrict the ability of this article to explain specific cases to a certain extent. In future research, the range of main parameters could be estimated by an econometric method through a market survey of a certain type of green agro-product. The estimated parameters are the substituted into the tripartite evolutionary game model to predict the evolution of green agricultural products.
Funding
This research was funded by the Chinese national social science fund project “The In-novation and Realization Path of Agricultural Industrial Organization Mode under the Back-ground of Internet” grant number [20BGL176]. The APC was funded by [20BGL176].
Institutional Review Board Statement
Not applicable.
Informed Consent Statement
Not applicable.
Data Availability Statement
The data are not publicly available due to the confidentiality of research projects in which the author participates.
Acknowledgments
The author sincerely appreciates the reviewers for their suggestions on the revision of the article.
Conflicts of Interest
The author declares no conflict of interest. The funders had a role in the design of the study and the collection of data.
References
- Shen, Z.; Balezentis, T.; Chen, X.; Valdmanis, V. Green Growth and Structural Change in Chinese Agricultural Sector during 1997-2014. China Econ. Rev. 2018, 51, 83–96. [Google Scholar] [CrossRef]
- Wang, X.; Shen, J.; Zhang, W. Emergy Evaluation of Agricultural Sustainability of Northwest China before and after the Grain-for-Green Policy. Energy Policy 2014, 67, 508–516. [Google Scholar] [CrossRef]
- Liu, J.; Yang, W.; Cong, L. The role of value co-creation in linking green purchase behavior and corporate social responsibility—An empirical analysis of the agri-food sector in China. J. Clean. Prod. 2022, 360, 157180320. [Google Scholar] [CrossRef]
- Nie, W.; Li, T.; Zhu, L. Market demand and government regulation for quality grading system of agricultural products in China. J. Retail. Consum. Serv. 2020, 56, 144658182. [Google Scholar] [CrossRef]
- Wong Ming, W.; Shian-Yang, T. Consumers’ Psychographics and Green Consumption Intention: Community Supported Agriculture Business Model in China. Int. J. Bus. Soc. 2019, 20, 229–246. [Google Scholar]
- Fu, S.; Zhan, Y.; Ouyang, J.; Ding, Y.; Tan, K.H.; Fu, L. Power, supply chain integration and quality performance of agricultural products: Evidence from contract farming in China. Prod. Plan. Control 2021, 32, 1119–1135. [Google Scholar] [CrossRef]
- Zhao, X.; Wang, P.; Pal, R. The Effects of Agro-food Supply Chain Integration on Product Quality and Financial Performance: Evidence from Chinese Agro-food Processing Business. Int. J. Prod. Econ. 2021, 231, 107832. [Google Scholar] [CrossRef]
- Zhou, W.; Metawea, M.S. Quality safety of agricultural products in supply chain-computer simulation based on multi-agent system. J. Intell. Fuzzy Syst. 2021, 3, 149390765. [Google Scholar] [CrossRef]
- Cui, X.; Cai, T.; Deng, W.; Zheng, R.; Jiang, Y.; Bao, H. Indicators for Evaluating High-Quality Agricultural Development: Empirical Study from Yangtze River Economic Belt, China. Soc. Indic. Res. 2022, 1–27, 158481571. [Google Scholar] [CrossRef]
- Fang, L.; Hu, R.; Mao, H.; Chen, S. How crop insurance influences agricultural green total factor productivity: Evidence from Chinese farmers. J. Clean. Prod. 2021, 321, 152768102. [Google Scholar] [CrossRef]
- Liang, Y.; Dang, J.; Chen, S. The effect of export tax rebates on product quality: Evidence from China’s agricultural product processing industry. China Agric. Econ. Rev. 2022, 14, 315–330. [Google Scholar] [CrossRef]
- Zhang, X.; Tang, X. Green Production Behavior of Participants in Agricultural Industrialization Consortium: From the Perspective of Government Incentive. J. Agro-For. Econ. Manag. 2021, 2, 187–198. [Google Scholar]
- Nin-Pratt, A.; McBride, L. Agricultural Intensification in Ghana: Evaluating the Optimist’s Case for a Green Revolution. Food Policy 2014, 48, 153–167. [Google Scholar] [CrossRef]
- Larson, D.W. Instability in Indian Agriculture—A Challenge to the Green Revolution Technology. Food Policy 2004, 29, 257–273. [Google Scholar] [CrossRef]
- Chen, Z.; Zhang, Y.; Zhou, L. Has financial access improved agricultural technical efficiency?—Evidence from two family farm demonstration zones in China. China Agric. Econ. Rev. 2022, 14, 142–164. [Google Scholar] [CrossRef]
- Gong, T.; Battese, G.E.; Villano, R.A. Family Farms Plus Cooperatives in China: Technical Efficiency in Crop Production. J. Asian Econ. 2019, 64, 1. [Google Scholar] [CrossRef]
- Huang, Y. Can Capitalist Farms Defeat Family Farms? The Dynamics of Capitalist Accumulation in Shrimp Aquaculture in South China. J. Agrar. Chang. 2015, 15, 392–412. [Google Scholar] [CrossRef]
- Zhang, Q.F.; Zeng, H. Producing industrial pigs in southwestern China: The rise of contract farming as a coevolutionary process. J. Agrar. Chang. 2022, 22, 97–117. [Google Scholar] [CrossRef]
- Ma, W.; Abdulai, A. IPM adoption, cooperative membership and farm economic performance: Insight from apple farmers in China. China Agric. Econ. Rev. 2019, 11, 218–236. [Google Scholar] [CrossRef]
- Ji, C.; Jin, S.; Wang, H.; Ye, C. Estimating Effects of Cooperative Membership on Farmers’ Safe Production Behaviors: Evidence from Pig Sector in China. Food Policy 2019, 83, 231–245. [Google Scholar] [CrossRef]
- Bu, D.; Liao, Y. Land property rights and rural enterprise growth: Evidence from land titling reform in China. J. Dev. Econ. 2022, 157, 102853. [Google Scholar] [CrossRef]
- Jin, S.; Jia, X.; James, H.S. Risk Attitudes within Farmer Cooperative Organizations: Evidence from China’s Fresh Apple Industry. Ann. Public Coop. Econ. 2021, 92, 173–205. [Google Scholar] [CrossRef]
- Huang, J.; Wu, Y.; Yang, Z.; Rozelle, S.; Fabiosa, J.; Dong, F. Farmer Participation, Processing, and the Rise of Dairy Production in Greater Beijing, P.R. China. Can. J. Agric. Econ. 2010, 58, 321–342. [Google Scholar] [CrossRef]
- Li, F.; Zhang, K.; Yang, P.; Jiao, J.; Yin, Y.; Zhang, Y.; Yin, C. Information exposure incentivizes consumers to pay a premium for emerging pro-environmental food: Evidence from China. J. Clean. Prod. 2022, 363, 132412. [Google Scholar] [CrossRef]
- Nie, W.; Abler, D.; Li, T. Grading Attribute Selection of China’s Grading System for Agricultural Products: What Attributes Benefit Consumers More? J. Behav. Exp. Econ. 2021, 93, 101707. [Google Scholar] [CrossRef]
- Wang, E.; Gao, Z.; Heng, Y.; Shi, L. Chinese Consumers’ Preferences for Food Quality Test/Measurement Indicators and Cues of Milk Powder: A Case of Zhengzhou, China. Food Policy 2019, 89, 101791. [Google Scholar] [CrossRef]
- Dong, X.; Jiang, B.; Zeng, H.; Kassoh, F.S. Impact of trust and knowledge in the food chain on motivation-behavior gap in green consumption. J. Retail. Consum. Serv. 2022, 66, 102955. [Google Scholar] [CrossRef]
- Wang, Y.; Wang, J.; Han, D.; Lv, S.; Chen, M.; Yin, S. The interaction relationships among agricultural certification labels or brands: Evidence from Chinese consumer preference for fresh produce. Int. Food Agribus. Manag. Rev. 2022, 25, 211–227. [Google Scholar] [CrossRef]
- Yin, S.; Hu, W.; Chen, Y.; Han, F.; Wang, Y.; Chen, M. Chinese Consumer Preferences for Fresh Produce: Interaction between Food Safety Labels and Brands. Agribusiness 2019, 35, 53–68. [Google Scholar] [CrossRef]
- McCarthy, B.L.; Liu, H.B.; Chen, T. Trends in Organic and Green Food Consumption in China: Opportunities and Challenges for Regional Australian Exporters. J. Econ. Soc. Policy 2015, 17, 1–24. [Google Scholar]
- Wu, L.; Wang, H.; Zhu, D.; Hu, W.; Wang, S. Chinese Consumers’ Willingness to Pay for Pork Traceability Information--The Case of Wuxi. Agric. Econ 2016, 47, 71–79. [Google Scholar] [CrossRef]
- Wu, L.; Wang, S.; Zhu, D.; Hu, W.; Wang, H. Chinese Consumers’ Preferences and Willingness to Pay for Traceable Food Quality and Safety Attributes: The Case of Pork. China Econ. Rev. 2015, 35, 121–136. [Google Scholar] [CrossRef]
- Nelson, P. Information and consumer behavior. J. Pol. Econ. 1970, 78, 311–329. [Google Scholar] [CrossRef]
- Darby, M.R.; Karni, E. Free competition and the optimal amount of fraud. J. Law Econ. 1973, 16, 67–88. [Google Scholar] [CrossRef]
- Zhao, J.; Gerasimova, K.; Peng, Y.; Sheng, J. Information Asymmetry, Third Party Certification and the Integration of Organic Food Value Chain in China. China Agric. Econ. Rev. 2020, 12, 20–38. [Google Scholar] [CrossRef]
- Otero, G.; Gürcan, E.C.; Pechlaner, G.; Liberman, G. Food security, obesity, and inequality: Measuring the risk of exposure to the neoliberal diet. J. Agrar. Chang. 2018, 18, 536–554. [Google Scholar] [CrossRef]
- Zhang, M.; Jin, Y.; Qiao, H.; Zheng, F. Product Quality Asymmetry and Food Safety: Investigating the ’One Farm Household, Two Production Systems’ of Fruit and Vegetable Farmers in China. China Econ. Rev. 2017, 45, 232–243. [Google Scholar] [CrossRef]
- Zhang, Y.; Huang, Z.H. Identifying Risks Inherent in Farmer Cooperatives in China. China Agric. Econ. Rev. 2014, 6, 335–354. [Google Scholar] [CrossRef]
- Wang, H.H.; Zhang, Y.; Wu, L. Is Contract Farming a Risk Management Instrument for Chinese Farmers? Evidence from a Survey of Vegetable Farmers in Shandong. China Agric. Econ. Rev. 2011, 3, 489–504. [Google Scholar] [CrossRef]
- Mao, H.; Zhou, L.; Ifft, J.; Ying, R. Risk preferences, production contracts and technology adoption by broiler farmers in China. China Econ. Rev. 2019, 54, 147–159. [Google Scholar] [CrossRef]
- Gong, Y.; Baylis, K.; Kozak, R.; Bull, G. Farmers’ Risk Preferences and Pesticide Use Decisions: Evidence from Field Experiments in China. Agric. Econ. 2016, 47, 411–421. [Google Scholar] [CrossRef]
- Bonroy, O.; Garapin, A.; Hamilton, S.F.; Souza Monteiro, D.M. Free-Riding on Product Quality in Cooperatives: Lessons from an Experiment. Am. J. Agric. Econ. 2019, 101, 89–108. [Google Scholar] [CrossRef]
- Fournier, A.J. Direct-Selling Farming and Urban Externalities: What Impact on Product Quality and Market Size? Reg. Sci. Urban Econ. 2018, 70, 97–111. [Google Scholar] [CrossRef]
- Pennerstorfer, D.; Weiss, C.R. Product Quality in the Agri-food Chain: Do Cooperatives Offer High-Quality Wine? Eur. Rev. Agric. Econ. 2013, 40, 143–162. [Google Scholar] [CrossRef]
- Liu, H.; Su, X.; Wang, X. Complexity Analysis for Price Competition of Agricultural Products with Regional Brands. Discret. Dyn. Nat. Soc. 2021, 2021, 5460796. [Google Scholar] [CrossRef]
- Planas, J. The Emergence of Winemaking Cooperatives in Catalonia. Bus. Hist. 2016, 58, 264–282. [Google Scholar] [CrossRef]
- Castriota, S.; Delmastro, M. The Economics of Collective Reputation: Evidence from the Wine Industry. Am. J. Agric. Econ. 2015, 97, 469–489. [Google Scholar] [CrossRef]
- Sauer, J.; Zilberman, D. Sequential technology implementation, network externalities, and risk: The case of automatic milking systems. Agric. Econ. 2012, 43, 233–252. [Google Scholar] [CrossRef]
- Wainaina, P.; Tongruksawattana, S.; Qaim, M. Tradeoffs and Complementarities in the Adoption of Improved Seeds, Fertilizer, and Natural Resource Management Technologies in Kenya. Agric. Econ. 2016, 47, 351–362. [Google Scholar] [CrossRef]
- Su, X.; Hu, Y.; Liu, H. The Complexity of Investment Spillover from New-Type Agricultural Business Entities to Small-Scale Farmers. Int. J. Bifurc. Chaos 2021, 31, 2150155. [Google Scholar] [CrossRef]
- Chen, X. Essays on Social Networks: Relative Concerns, Social Interactions, and Unintended Consequences.” PhD Dissertation, Cornell University. Outstanding Doctoral Dissertation Honorable Mention. Am. J. Agric. Econ. 2014, 96, 607–608. [Google Scholar] [CrossRef]
- Cai, Q.; Zhu, Y.; Chen, Q. Can Social Networks Increase Households’ Contribution to Public-Good Provision in Rural China? The Case of Small Hydraulic Facilities Construction. China Agric. Econ. Rev. 2016, 8, 148–169. [Google Scholar] [CrossRef]
- Ma, X.; Wang, J.; Zhao, L.; Han, J. The Effects of Social Capital on Farmers’ Wellbeing in China’s Undeveloped Poverty-Stricken Areas. China Agric. Econ. Rev. 2020, 12, 108–121. [Google Scholar] [CrossRef]
- Miao, S.; Heijman, W.; Zhu, X.; Lu, Q. Social Capital Influences Farmer Participation in Collective Irrigation Management in Shaanxi Province, China. China Agric. Econ. Rev. 2015, 7, 448–466. [Google Scholar] [CrossRef]
- Wang, A.; He, K.; Zhang, J. The Influence of Clan Social Capital on Collective Biogas Investment. China Agric. Econ. Rev. 2022, 14, 349–366. [Google Scholar] [CrossRef]
- Xiong, F.; You, J.L. The Impact Paths of Social Capital and the Effects of Microfinance: Evidence from Rural Households in China? China Agric. Econ. Rev. 2019, 11, 704–718. [Google Scholar] [CrossRef]
- Wu, J.; Han, D.; Ruan, R. Agriculture Informatization and Quality of Agricultural Products: Analysis on the Behavior of Quality Certification of Agricultural Products Based on Family Farms. J. Nanjing Agric. Univ. 2022, 22, 172–184. [Google Scholar]
- Center for China Farmer Cooperatives of Zhejiang University. Chinese Farmer Cooperative Development Report; Zhejiang University Press: Hangzhou, China, 2020; pp. 5–6. [Google Scholar]
- Zhang, L.; Cao, M.; Zhang, Z.; Xu, X. Study on the Social Responsibility Fulfillment of Leading Enterprises in Agricultural Industrialization. Jiangsu Agric. Sci. 2018, 46, 263–268. [Google Scholar]
Figure 1.
Mechanism of green agro-product supply in agricultural industrialization consortiums.

Figure 5.
The influence of consumption preferences on the evolutionary game process.

Figure 6.
The influence of market risks on the evolutionary game process.

Figure 7.
The influence of spillover effects on the evolutionary game process.

Figure 8.
The influence of social embeddedness on the evolutionary game process.


Table 1.
The payoff matrix of the tripartite evolutionary game.
| Strategies | Family Farms | Specialized Cooperatives | Agro-Processing Enterprises | |
|---|---|---|---|---|
| 1 | S2,S2,S2 | 0 | 0 | 0 |
| 2 | S1,S2,S2 | 0 | 0 | |
| 3 | S2,S1,S2 | 0 | ||
| 4 | S2,S2,S1 | |||
| 5 | S1,S1,S2 | |||
| 6 | S1,S2,S1 | |||
| 7 | S2,S1,S1 | |||
| 8 | S1,S1,S1 |
Table 2.
The coefficients in simplified replicator dynamic equations.
Table 3.
The eigenvalues of the Jacobian matrix.
| Equilibrium Points | |||
|---|---|---|---|
| (0,0,0) | A1 | B1 | C1 |
| 1,0,0) | −A1 | B1+B2 | C1+C2 |
| 0,1,0) | A1+A2 | −B1 | C1+C3 |
| 0,0,1) | A1+A3 | B1+B3 | −C1 |
| 1,1,0) | −A1−A2 | −B1−B2 | C1+C2+C3+C4 |
| 1,0,1) | −A1−A3 | B1+B2+B3+B4 | −C1−C2 |
| 0,1,1) | A1+A2+A3+A4 | −B1−B3 | −C1−C3 |
| 1,1,1) | −[A1+A2+A3+A4] | −[B1+B2+B3+B4] | −[C1+C2+C3+C4] |
Table 4.
The settings of the parameters’ initial value.
| Parameter | Meaning | Initial Value |
|---|---|---|
| the measurable quality degree of green agro-products | 5.00 | |
| the contribution weight of agent A to the quality of green agro-products | 0.20 | |
| the contribution weight of agent B to the quality of green agro-products | 0.30 | |
| the contribution weight of agent C to the quality of green agro-products | 0.50 | |
| the marginal cost of agent A producing and selling green agro-products | 2.00 | |
| the marginal cost of agent B producing and selling green agro-products | 1.75 | |
| the marginal cost of agent C producing and selling green agro-products | 1.50 | |
| the consumption preference coefficient of green agro-products | 2.00 | |
| the market risk coefficient of green agro-products | 0.10 | |
| the spillover coefficient of green agro-products | 0.05 | |
| the illegal social cost coefficient of green agro-products | 2.00 |
Publisher’s Note: MDPI stays neutral with regard to jurisdictional claims in published maps and institutional affiliations. |
© 2022 by the author. Licensee MDPI, Basel, Switzerland. This article is an open access article distributed under the terms and conditions of the Creative Commons Attribution (CC BY) license (https://creativecommons.org/licenses/by/4.0/).
Share and Cite
MDPI and ACS Style
Liu, H. The Tripartite Evolutionary Game of Green Agro-Product Supply in an Agricultural Industrialization Consortium. Sustainability 2022, 14, 11582. https://0-doi-org.brum.beds.ac.uk/10.3390/su141811582
AMA Style
Liu H. The Tripartite Evolutionary Game of Green Agro-Product Supply in an Agricultural Industrialization Consortium. Sustainability. 2022; 14(18):11582. https://0-doi-org.brum.beds.ac.uk/10.3390/su141811582
Chicago/Turabian StyleLiu, Haolong. 2022. "The Tripartite Evolutionary Game of Green Agro-Product Supply in an Agricultural Industrialization Consortium" Sustainability 14, no. 18: 11582. https://0-doi-org.brum.beds.ac.uk/10.3390/su141811582
Note that from the first issue of 2016, this journal uses article numbers instead of page numbers. See further details here.