
Selection Strategy and Coordination of Green Product R&D in Sustainable Competitive Supply Chain


School of Information, Xi’an University of Finance and Economics, Xi’an 710100, China
*
Author to whom correspondence should be addressed.
Sustainability 2022, 14(14), 8884; https://0-doi-org.brum.beds.ac.uk/10.3390/su14148884
Submission received: 19 June 2022
/
Revised: 12 July 2022
/
Accepted: 18 July 2022
/
Published: 20 July 2022
(This article belongs to the Special Issue Green and Sustainable Supply Chains)
Abstract
:Green product R&D is a necessary measure for enterprises to achieve sustainable development. This paper studies the optimal selection strategy of green product R&D and the impact of price competition and green R&D cost on prices, green levels, and enterprise profits in the sustainable competitive supply chain. We establish manufacturer-led game models and compare the equilibrium results of green R&D strategies. The study found that three types of green product R&D strategies exist in competitive supply chains: neither conduct green product R&D (NN), only one supply chain conducts green product R&D (YN), and both conduct green product R&D (YY). Price competition intensity and green R&D cost have a negative impact on prices, green levels, and enterprise profits. Wholesale prices, retail prices, green levels, and enterprise profits are highest in YY strategy, but they are lowest in NN strategy. When one supply chain does not conduct green product R&D, the other supply chain will choose green product R&D only if the green R&D cost meets certain condition. When one supply chain conducts green product R&D, the optimal choice for the other supply chain is always to conduct green product R&D. For the optimal selection strategies, applying two-part pricing contracts achieve supply chain coordination. Our research results provide a reference for the strategic choice of green product R&D in competitive supply chains.
1. Introduction
With the rapid development of the global economy, the problems of climate change, air pollution, and energy consumption become more serious. Environmental protection and sustainable development have received extensive attention from governments and society [1,2]. On the one hand, governments have issued a series of policies and regulations, for example, related measures are widely used in Japan to raise the social responsibility awareness of manufacturers [3]. The Recovery and Reinvestment Act 2009 of US provides a tax credit in hybrid electric vehicle. Chinese government has also provided 55 thousand CNY per unit electric vehicle since 2015 [4]. The European Union has imposed carbon emission limits, and British Columbia, Canada has imposed a carbon tax [5,6]. On the other hand, consumers have begun to realize the importance of environmental protection and have an increasing demand for energy-saving and friendly green products. Studies have shown that more than half of Americans are more willing to pay more for green products because they believe that it is important to purchase green products for environmental protection [7].
On the influence of government regulations and customer demands, enterprises gradually strengthen the management of the green supply chain and actively participate in the green product R&D, which can not only expand market shares but also gain greater competitive advantage. For example, in the apparel industry, companies such as H&M, Marks & Spencer, and Levis have adopted technological innovations to minimize carbon emission in its production process [8]. In the auto industry, Tesla and Lexus are committed to developing green and low-carbon new energy electric vehicles to attract many consumers with environmental protection awareness. In the retail sector, Tesco and Walmart have also implemented the latest sustainability initiatives such as the Carbon Label and the Sustainable Product Index.
However, enterprises face various challenges in implementing green product R&D, such as large capital investments, scarcity of technical resources, and uncertain demand, which increase the difficulty of implementing green product R&D for enterprises and make some of them unwilling to actively participate in green product R&D. Supply chain coordination plays a positive role in promoting the green supply chain performance to balance the costs and benefits of each enterprise. Supply chain contract mechanism is the main method to realize the supply chain coordination. Designing contracts and setting corresponding parameters are helpful to realize risk-sharing among supply chain members. These contract include contracts of two-part pricing, repurchase, revenue-sharing, cost-sharing, and quantity discount.
With the intensification of market competition, the competition between supply chains has gradually replaced the competition between enterprises. Studies have shown that green product R&D can improve the competitive advantage of enterprises, such as more efficient green raw materials, higher employees’ motivation, and entry of new market segments [9,10,11,12].
Given the above, we propose the following questions: (1) In competitive supply chains, is green product R&D always the best choice for supply chains? If not, what are the conditions? (2) How does green product R&D decision in one supply chain affect the other competing supply chain? (3) How do the price competition and the green R&D cost affect product prices, green levels, and enterprise profits? (4) Can the two-part pricing contracts coordinate the competitive supply chain?
Our research is related to the literature about supply chain competition, green R&D strategies, and supply chain coordination. Our paper closely related to Deng et al. [13], Zhu et al. [14], Zhang et al. [15], Du et al. [16], Li et al. [17], Ma et al. [18], Agi et al. [19], Dong et al. [20], Li et al. [21], and Yang et al. [22]. Deng et al. [13] and Zhu et al. [14] investigated the impact of supply chain competition on product sustainability, enterprise profits and green levels. But their work did not involve the influence of green product R&D strategies of one supply chain on strategy choices of the other supply chain with competitive relationship and the supply chain coordination. Zhang et al. [15] and Du et al. [16] discussed manufacturers’ choices for green products from the perspectives of consumers’ environmental awareness and market demand, respectively. Agi et al. [19] and Dong et al. [20] studied manufacturers’ choices for green products and ordinary products from the perspective of power structure. The main difference is that we study the optimal strategy choices of supply chain from the perspective of chain-to-chain competition. Li et al. [17] analyzed the impact of chain-to-chain competition on the centralized and decentralized decision-making of supply chains. We mainly analyze the impact of competition intensity and green cost coefficient on price, green level, and enterprise profits in case of chain-chain competition. Li et al. [21] explored the pricing strategy of supply chain, and achieved supply chain coordination by two-part pricing contracts. Yang et al. [22] analyzed the green R&D cooperation of supply chains, and applied revenue-sharing contracts to coordinate supply chain. The problems they studied are pricing and green R&D cooperative strategies, while our research problem is the selection strategy of green product R&D in the competitive supply chain by buiding game models, and then apply two-part pricing contracts to coordinate supply chain. The reason we choose two-part pricing contracts for coordination is that two-part pricing is a pricing method that divides the price into two parts: fixed fee and wholesale price. The fixed fee is independent of the quantity consumed, and the wholesale price is directly related to the quantity consumed. The two-part pricing method has the nature of maximizing economic welfare on the condition of balance of payments.
In order to answer the above research questions and fill these research gaps, we consider chain-to-chain competition and establish manufacturer-led Stackelberg game models to study three types of green product R&D strategies: neither conduct green product R&D (NN), only one supply chain conducts green product R&D (YN), and both conduct green product R&D (YY), analyze the impact of competition intensity and green cost coefficient on prices, green levels and enterprise profits, and explore the optimal selection strategies of the other supply chain when the green R&D strategy of one supply chain is given. Finally, two-part pricing contracts are used to coordinate the optimal selection strategies.
In summary, the main contributions of this paper are as follows:
- In the case of chain-chain competition, this paper studies the optimal selection strategies of green product R&D of the other supply chain when the strategies of one supply chain enterprise is given. This is rarely studied by relevant scholars.
- On the basis of studying the optimal selection strategy of green product R&D in competitive supply chain, this paper uses two-part pricing contracts to coordinate the results of the optimal selection strategy, which is also different from most literatures.
- This paper compares the equilibrium results of three green R&D strategies in competitive supply chains, analyzes the impact of competition intensity and green R&D costs on prices, green levels and enterprise profits, and draws more conclusions and management implications.
The remainder of this article is organized as follows. Section 2 presents the literature review. Section 3 presents the model assumptions and notations. Section 4 analyzes equilibrium results under three green product R&D strategies. Section 5 coordinates two-part pricing contracts. Section 6 provides a numerical simulation of the conclusion. Finally, Section 7 summarizes the findings and proposes future research directions.
2. Literature Review
This paper is closely related to three streams of literatures:supply chain competition, strategic choice of sustainable supply chain and supply chain coordination. This section reviews literature relevant to each stream and highlights the differences between the existing research and our work.
2.1. Supply Chain Competition
In the market environment, supply chain competition is prevalent. Deng et al. [13] explored the impact of supply chain competition on product sustainability and profits, and showed that competition among sustainable products play an important role in determining firm decisions. Guo et al. [23] studied a fashion supply chain consisting of one manufacturer and two competing retailers, and found that the optimal green level was negatively related to the intensity of competition and consumer return rates. Zhu et al. [14] studied green products R&D in the competitive supply chain, and found that the double marginal effect will reduce the green level of products, price competition has a positive impact on the green level of products. Jamali et al. [24] considered the competition and price strategies between green and non-green supply chains, where manufacturers adopted online and offline channels for the product. Wu [25] studied the R&D competition and cooperation between a common supplier and two competing manufacturers, and analyzed the effects of spillover rate, R&D efficiency, and competition level on equilibrium solutions. Zhu et al. [26] investigated the green R&D and government subsidies of the new energy vehicle supply chain with downstream competition, and found that R&D subsidies increase supply chain firm profits and consumer surplus in a non-competitive situation. Li et al. [27] discussed the impact of decision order, price and quality competition on the game equilibrium and member profits in supply chain. Wang et al. [28] analyzed the impact of competion on supply chain’s reward and punishment mechanism. Wang et al. [29] investigated the effects of three power structures on firm profits and optimal strategies in supply chain that included a single manufacturer and two competing retailers. Meanwhile, Yu et al. [30] considered government intervention and consumer green preferences, developed a game model of competition between non-green and green supply chains. The study showed that the government’s tax system impacted the optimal decisions of the supply chain. Zheng et al. [31] studied the optimal equilibrium solutions of a competitive supply chain consisting of two manufacturers and two retailers, and analyzed the effects of competition intensity and product recovery rate on the optimal price, profits, and decision choices. Guan et al. [32] considered the demand information sharing in competitive supply chains when manufacturers provide services, and the supply chain profits in four information-sharing situations are compared and analyzed.
According to the aforementioned studies, supply chain competition has an impact on decision variables such as prices, profits etc. Unlike these studies, however, this paper focuses on the effects of green product R&D strategy of one supply chain on the choice of the other supply chain with price competition.
2.2. Strategic Choice of Sustainable Supply Chain
Enterprises need to obtain resources from the ecological environment and produce products to meet the needs of consumers. Therefore, enterprises should pay attention to environmental protection to achieve sustainable development. In a related study, Zhang et al. [15] established a manufacturer-led Stacklberg model to explore whether manufacturers produce green products and how to distribute green products. The study found that higher consumer awareness of environmental protection would prompt manufacturers to produce green products, but higher environmental awareness of consumers did not guarantee higher profits for manufacturers. Du et al. [16] constructed the Stackelberg model to study the green product selection of two competing manufacturers, and showed that when faced with non-green competitors, non-green manufacturers would turn green if their market potential is much lower than that of competitors, and when faced with green competitors, non-green manufacturers would not turn green if demand potential of green product is small. Li et al. [17] investigated the equilibrium structure of a sustainable supply chain with chain-to-chain competition and discovered that vertical integration is optimal only when the degree of competition is low. Hafezalkotob et al. [33] developed a game model to investigate the impact of government tariffs on green decisions when there is price competition between green and non-green supply chains. Li et al. [34] developed a game model to analyze sales channels for green products. According to the study, when green manufacturing costs exceed a certain threshold, manufacturers will not choose direct sales; when consumer loyalty to retail channels and green manufacturing costs meet a certain threshold, manufacturers will use dual channels. Barman et al. [35] investigated the impact of government intervention on the green level under centralized and decentralized decision making, and found that the supply chain has higher green levels and profits under centralized decision-making. Wang et al. [36] investigated a green supply chain model with price and carbon emission competition and discovered that carbon emission competition can reduce costs and emissions, which is beneficial to environmental protection. Chen et al. [37] investigated the impact of green R&D collaboration on firm performance and the environment, and discovered that the improvement of corporate performance is primarily determined by the company’s green contribution level. Hong et al. [38] studied the pricing strategy of green products under competition and information asymmetry. The results show that the price should be determined according to the quality of green products and the environmental awareness. Ma et al. [18] studied pricing strategy of green products between two competing manufacturers and one retailer under linear demand, and the results showed that manufacturers can make more profit under the Stackelberg model than under the Bertrand model, while retailers make more profit under the Bertrand model than under the Stackelberg model. Agi et al. [19] analyzed the pricing and decision-making strategies of green products and common products, and found that manufacturers-led supply chains were more likely to choose green product strategies than retailer-led supply chains. Dong et al. [20] studied the strategic investment of green product R&D, and found that when the manufacturer was the dominant enterprise, supply chain firms could not only gain more revenue, but also save more environmental taxes.
The aforementioned studies investigate the strategies of government intervention, competition intensity, channel structure, and R&D collaboration in green supply chains. We differ from them in that this paper mainly studies the impact and selection of green product R&D strategies in chain-chain competition.
2.3. Supply Chain Coordination
The coordination mechanism can improve the profit of supply chain, and achieve a win-win result. In supply chain coordination, Ranjan et al. [39] studied the pricing decision and coordination mechanism of a dual-channel supply chain in which manufacturers sell green products online and non-green products offline, and found that the green level of products is higher in the collaborative mode, and the revenue-sharing contract realized the channel coordination. Wang et al. [40] applied different contracts to coordinate the supply chain, and found that revenue-sharing contracts can achieve coordination, and wholesale price contracts could reduce innovation investment. Meanwhile, Li et al. [21] investigated the pricing strategy and coordination mechanism of a supply chain comprised of a single manufacturer and two competing retailers, and found that the supply chain coordination can be achieved by using two-part pricing contracts. Moreover, Zhang et al. [41] studied the dynamic pricing and green strategies of the dual-channel supply chain, compared members’ pricing under centralized and decentralized decisions, and proposed a cost-sharing contract to coordinate the supply chain. Yang et al. [22] explored the green R&D cooperation and coordination of supply chains and discovered that the revenue-sharing contract could coordinate the cooperation model. Zhang et al. [42] considered government intervention and customer’s green preference and applied two-part pricing contracts to achieve green supply chain coordination, and found that government intervention could improve supply chain performance and achieve sustainable development. Xu et al. [43] studied the emission reduction decision and coordination of the supply chain under the constraints of cap and trade. The results showed that both wholesale price and cost-sharing contract can coordinate the supply chain, and the two-part pricing contracts can achieve Pareto improvement within a certain range. Basiri et al. [44] studied the coordination of green channels in two-tier supply chains, compared decentralized, centralized and collaborative scenarios, and found that collaboration can improve supply chain profits. Heydari et al. [45] considered the pricing and channel coordination and proposed a combined coordination contract for green cost-sharing and revenue-sharing, and discovered that the contract could achieve channel coordination. Gao et al. [46] explored the competition and coordination of dual-channel green supply chains, and found that two-part pricing contracts can obtain more profits. Hong et al. [47] studied the coordination of green supply chains considering the environmental responsibility of stakeholders, and found that when manufacturers and retailers share green costs, manufacturing became more profitable, and retailer profits were worse in cost-sharing contracts.
Although the aforementioned studies coordinate the supply chain through revenue-sharing, cost-sharing, wholesale price, and two-part pricing contracts, their research questions are different. Unlike our paper, these studies do not consider strategic options for green product R&D, nor do they coordinate the optimal green R&D strategies in competitive supply chains by two-part pricing contracts.
3. Model Assumptions and Notations
Consider two sustainable supply chains with price competition. Each supply chain consists of a manufacturer and a retailer, and the dominant enterprise is the manufacturer. The manufacturer sells the product to the retailer at a wholesale price . The retailer sells the product to the customer at a retail price . With increasing environmental protection awareness and consumers’ preference for green products, some manufacturers will choose green product R&D. The model parameters and notations used in this paper are concluded in Table 1.
This paper makes the following assumptions:
Assumption 1.
Considering that the retailer is profitable, assuming , for the convenience of calculation, it is assumed that the manufacturer’s production cost is zero.
Assumption 2.
Assumption 3.
When the manufacturer of the supply chain chooses green product R&D, the demand for the product will also increase as the green levelincreases, so the market demand function is:
Assumption 4.
Because the marginal cost of green R&D will increase with the increase of the green level of product, we assume that the green R&D cost of product is
Manufacturers have two options in every supply chain: (1) do not conduct green R&D on products, denoted as N. (2) Conduct green product R&D, denoted as Y. Thus, three situations exist for competitive supply chains: (1) neither supply chain conducts green product R&D (NN); (2) only one supply chain conducts green product R&D (YN); and (3) both supply chains conduct green product R&D (YY). The game model is developed to investigate the green R&D strategy selection of two competitive supply chains in three situations.
4. Equilibrium Results under Three Green Product R&D Strategies
4.1. Neither Supply Chain Conducts Green Product R&D (NN)
When neither supply chain conducts green product R&D, the benefits of manufacturer i and retailer i are:
The manufacturer i is the dominant enterprise, so the manufacturer i determines the wholesale price firstly, followed by the retailer i who determines the retail price. According to the reverse induction method, we can see that is concave in by . Solving the first-order condition for , we can obtain the optimal retail price , substitute into , we can see that is concave in by . Solving the first-order condition for , we can obtain the optimal wholesale price . Solving and simultaneously, we can easily obtain the optimal solutions and . Substituting and into and , we can easily obtain , and .
Theorem 1.
When both supply chains do not conduct green product R&D, we can draw the following conclusions:
- (1)
- and decrease with the increase of product price sensitivity coefficient and price competition intensity γ.
- (2)
- When , and decrease with the increase of product price sensitivity coefficient and price competition intensity , and .
The proof of theorem 1 is enclosed in the Appendix A.
Theorem 1 shows that (1) when neither supply chain conducts green product R&D, the more similar products on the market, the smaller the difference between the products, and the more intense the market competition. As price competition becomes more intense, wholesale prices and retail prices will fall, resulting in lower profits for manufacturers and retailers. (2) The manufacturer i’s profit is equal to twice the retailer i’s profit, indicating that the manufacturer ihas a dominant advantage and has more profitable than the retailer i.
4.2. Only One Supply Chain Conducts Green Product R&D (YN)
Suppose the manufacturer 1 conducts green product R&D, and the manufacturer 2 does not conduct green product R&D. The profits of manufacturer 1 and retailer 1 are:
The profits of manufacturer 2 and retailer 2 are:
Since the manufacturer 1 is the dominant enterprise, manufacturer 1 firstly determines the product’s wholesale price and green level, and then the retailer 1 determines the product’s retail price. According to the reverse induction method, we can see that is concave in by . Solving the first-order condition for , we can obtain the optimal retail price , substitute into , the Hessian matrix about and is negative definite. Solving the first-order condition for and 0 for , we can obtain the optimal wholesale price and the optimal green level . Solving and simultaneously, we can easily obtain the optimal solutions: .
For the supply chain 2, the manufacturer 2 firstly decides the wholesale price of product, and then the retailer 2 decides the product’s retail price. According to the reverse induction method, we can see that is concave in by . Solving the first-order condition for , we can obtain the optimal retail price . We can see that is concave in by . Solving the first-order condition for , we can obtain the optimal wholesale price . Solving and simultaneously, we can easily obtain the optimal solutions: , , ,
, , .
Theorem 2.
When only one supply chain conducts green product R&D, we can draw the following conclusions:
- (1)
- decrease with the increase of price competition intensity and green R&D cost coefficient . , , and decrease with the increase of green R&D cost coefficient .
- (2)
- , , . when , when , .
The proof of theorem 2 is enclosed in the Appendix A.
Theorem 2 states that (1) only when one supply chain conducts green product R&D, the wholesale price, the retail price, and the green level of products will decrease as the intensity of price competition increases. When the cost coefficient of green R&D rises, manufacturers require more capital investment, andretail price fall due to price competition between supply chains, which reduces the profits ofmanufacturers and retailers. (2) Because the supply chain 1 conducts green product R&D, the profits of manufacturer 1 and retailer 1 are higher than those of manufacturer 2 and retailer 2, indicating that selecting green product R&D increases supply chain enterprises’ profits. The manufacturer has a dominant advantage and earns more profits than the retailer.
4.3. Both Supply Chains Conduct Green Product R&D (YY)
When both supply chains conduct green product R&D, the profits of the manufacturer i and retailer i are:
Since the manufacturer i is the dominant enterprise, the manufacturer i firstly determines the product’s wholesale price, and then the retailer i determines the product’s retail price. According to the reverse induction method, we can see that is concave in . Solving the first-order condition for , we can obtain the optimal retail price , substitute into , the Hessian matrix about and is negative definite. Solving the first-order condition for and for , we can obtain the optimal wholesale price and the optimal green level . Solving and simultaneously, we can easily obtain the optimal solutions:, , . Then , , .
Theorem 3.
When both supply chains conduct green product R&D, we can draw the following conclusions:
- (1)
- anddecrease with the increase of price competition intensity and green R&D cost coefficient . , decrease with the increase of price competition intensity and green R&D cost coefficient .
- (2)
- when , .
The proof of theorem 3 is enclosed in the Appendix A.
Theorem 3 states that (1) when both supply chains conduct green product R&D, wholesale prices, retail prices, green level, and benefits of manufacturers and retailers decrease as price competition intensity and green R&D cost coefficient increase. (2) Because the manufacturer i has dominant advantage and obtains greater benefit than the retailer i.
4.4. Choice of Green Product R&D Strategy
In this subsection, we compare the equilibrium results of the above game model, and analyze the optimal selection strategy of supply chain 1 for green product R&D in the two cases of supply chain 2 does not conduct green product R&D and supply chain 2 conduct green product R&D.
- (1)
- Supply chain 2 does not conduct green product R&D.
When the supply chain 2 does not conduct green product R&D, the optimal green R&D strategy of supply chain 1 is determined by comparing profits in two cases. We can obtain the following Theorem 4.
Theorem 4.
. So supply Chain 1 will choose green product R&D.
The proof of theorem 4 is enclosed in the Appendix A.
- (2)
- Supply chain 2 conducts green product R&D
When supply chain 2 conducts green product R&D, the following Theorem 5 can be obtained.
Theorem 5.
, . So supply chain 1 will choose to conduct green product R&D.
The proof of theorem 5 is enclosed in the Appendix A.
From Theorem 4 and Theorem 5, we can find that when supply chain 2 does not conduct green product R&D, the optimal choice of supply chain 1 is to conduct green product R&D if . when supply chain 2 conducts green product R&D, the optimal choice of supply chain 1 is conduct green product R&D.
Theorem 6.
, , ., if .
The proof of theorem 6 is enclosed in the Appendix A.
Theorem 6 states that when both supply chains conduct green product R&D, wholesale prices, retail prices, green levels, and profits of manufacturers and retailers are highest, while when neither supply chain conducts green product R&D, wholesale prices, retail prices, and profits of manufacturers and retailers are lowest.
5. Coordination of Two-Part Pricing Contracts
The above results show that when supply chain 2 conducts green product R&D, supply chain 1′s optimal choice is to conduct green product R&D. when supply chain 2 does not conduct green product R&D, supply chain 1 chooses to conduct green product R&D only if . In this section, we propose two-part pricing contracts to coordinate the optimal selection strategies: YN (green R&D, non-green R&D) and YY (green R&D, green R&D).
5.1. Centralized Scenario
For YN strategy, the total profit of supply chain 1 is:
The total profit of supply chain 2 is:
Since the Hessian matrix about and is negative definite. Solving the first-order condition for and for , we can obtain the optimal retail price and the optimal green level We can see that is concave in by , Solving the first-order condition for , we can obtain the optimal retail price . Solving and simultaneously, we can easily obtain the optimal solutions: , , . Then , .
Compared with decentralized scenario, if , , which means that the optimal result of decentralized scenario has not reached supply chain coordination.
For YY strategy, the total profit of supply chain is:
The Hessian matrix about and is negative definite. Thus, solving the first-order condition for and for , we can obtain the optimal retail price and the optimal green level Solving and simultaneously, we can easily obtain the optimal solutions: , , .
Compared with decentralized scenario, if , which means that the optimal result of decentralized scenario has not reached supply chain coordination.
5.2. Decentralized Scenario Coordination
To maximize the profit of the centralized scenario and realize profit distribution among participants, the manufacturers propose a two-part pricing contract(, ), where is the wholesale price of product i and F is the fixed fee. The wholesale price is related to the quantity of the product, while the fixed fee F is not related to the quantity of the product. the fixed fee can compensate the fixed cost of production or sale of the enterprise. The fixed fee can be positive, negative or zero. When the fixed fee is zero, the two-part pricing contract is simplified into a wholesale price contract. In this paper, the manufacturer pays the retailer a fixed fee F, and then sells a product to the retailer at wholesale price. In the two-part pricing contract, the manufacturers can realize the distribution of supply chain benefits by adjusting the fixed fee F, and achieve supply chain coordination.
For YN strategy, the profits of manufacturer 1 and retailer 1 are:
The profits for manufacturer 2 and retailer 2 are:
The wholesale price and the green level are determined firstly by manufacturer 1, and then the retail price is determined by retailer 1. Similarly, the wholesale price is determined by the manufacturer 2, and the retail price is determined by the retailer 2. According to the reverse induction method, retailer 1 needs to set the product price as the optimal price of centralized scenario, and manufacturer 1 needs to set the product green level as the optimal green level of centralized scenario. Retailer 2 needs to set the product price as the optimal price of centralized scenario.
Since, substitute , intoand , we can obtain , . Then , , . According to , , we can obtain . According to, .
For YY strategy, in the two-part pricing contract, the profits of manufacturer i and retailer i are:
The manufacturer i decides the wholesale price and the green level first, and then retailer i determines the retail price . According to the reverse induction method, retailer i needs to set the product price as the optimal price of centralized scenario, and manufacturer i needs to set the green level as the optimal green level of centralized scenario.
Since , substitute , into ,we can obtain . Then , . According to , ,.
6. Numerical Simulation
According to the industry practice and range of each variable, we assume that the model parameters satisfy: , , and use the numerical analysis method to simulate and analyze the conclusion. The results are shown in the following figures.
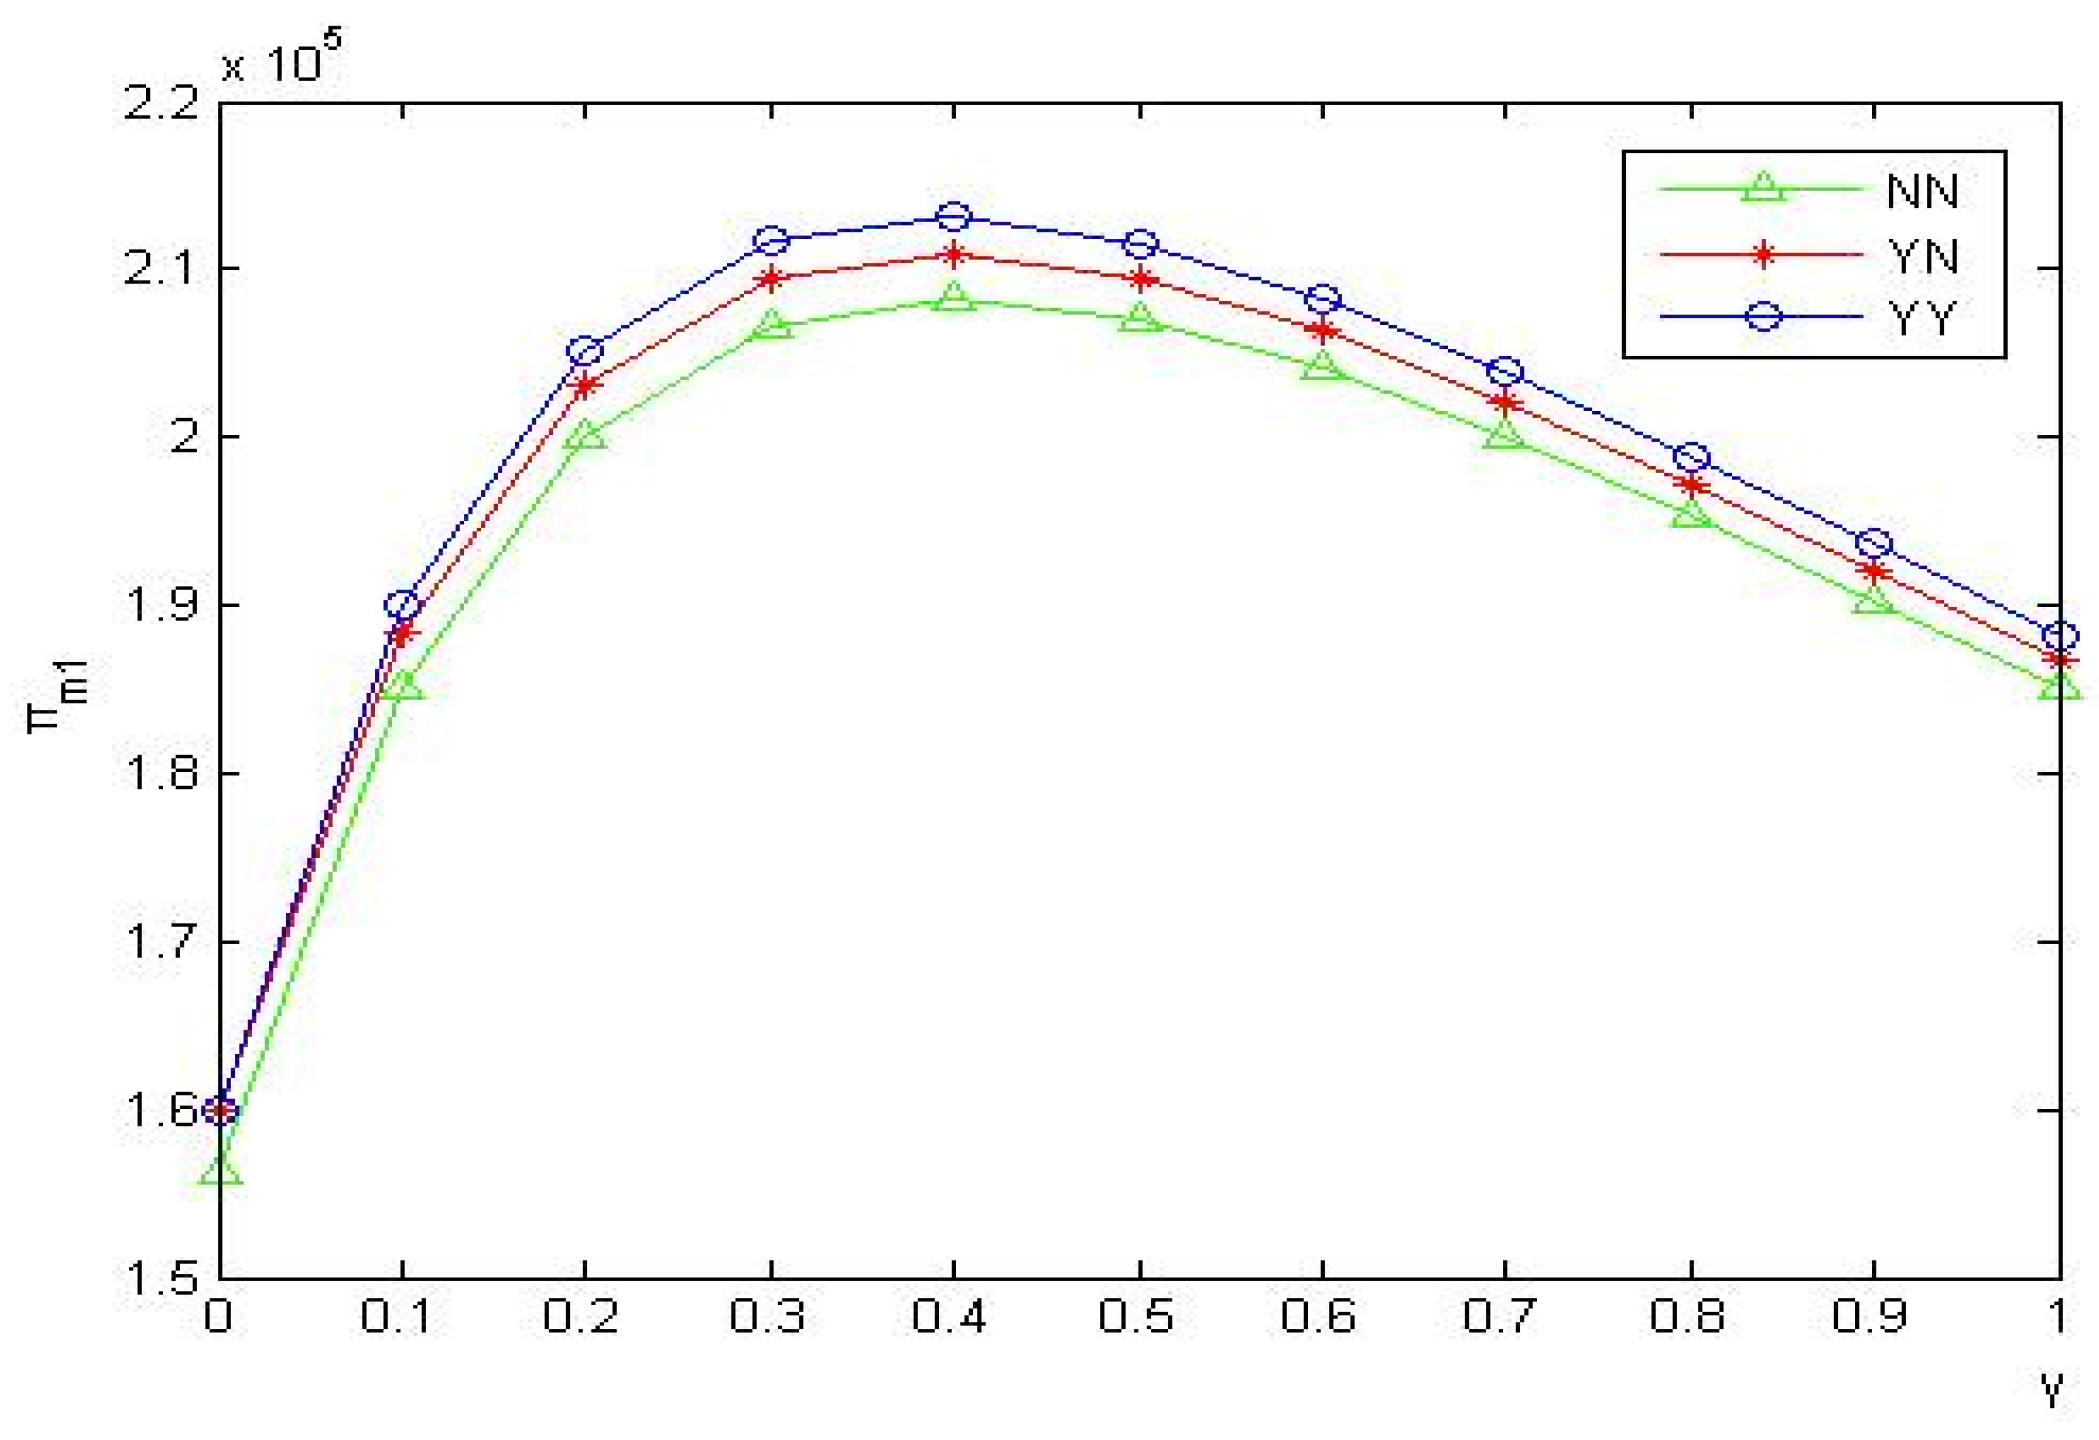
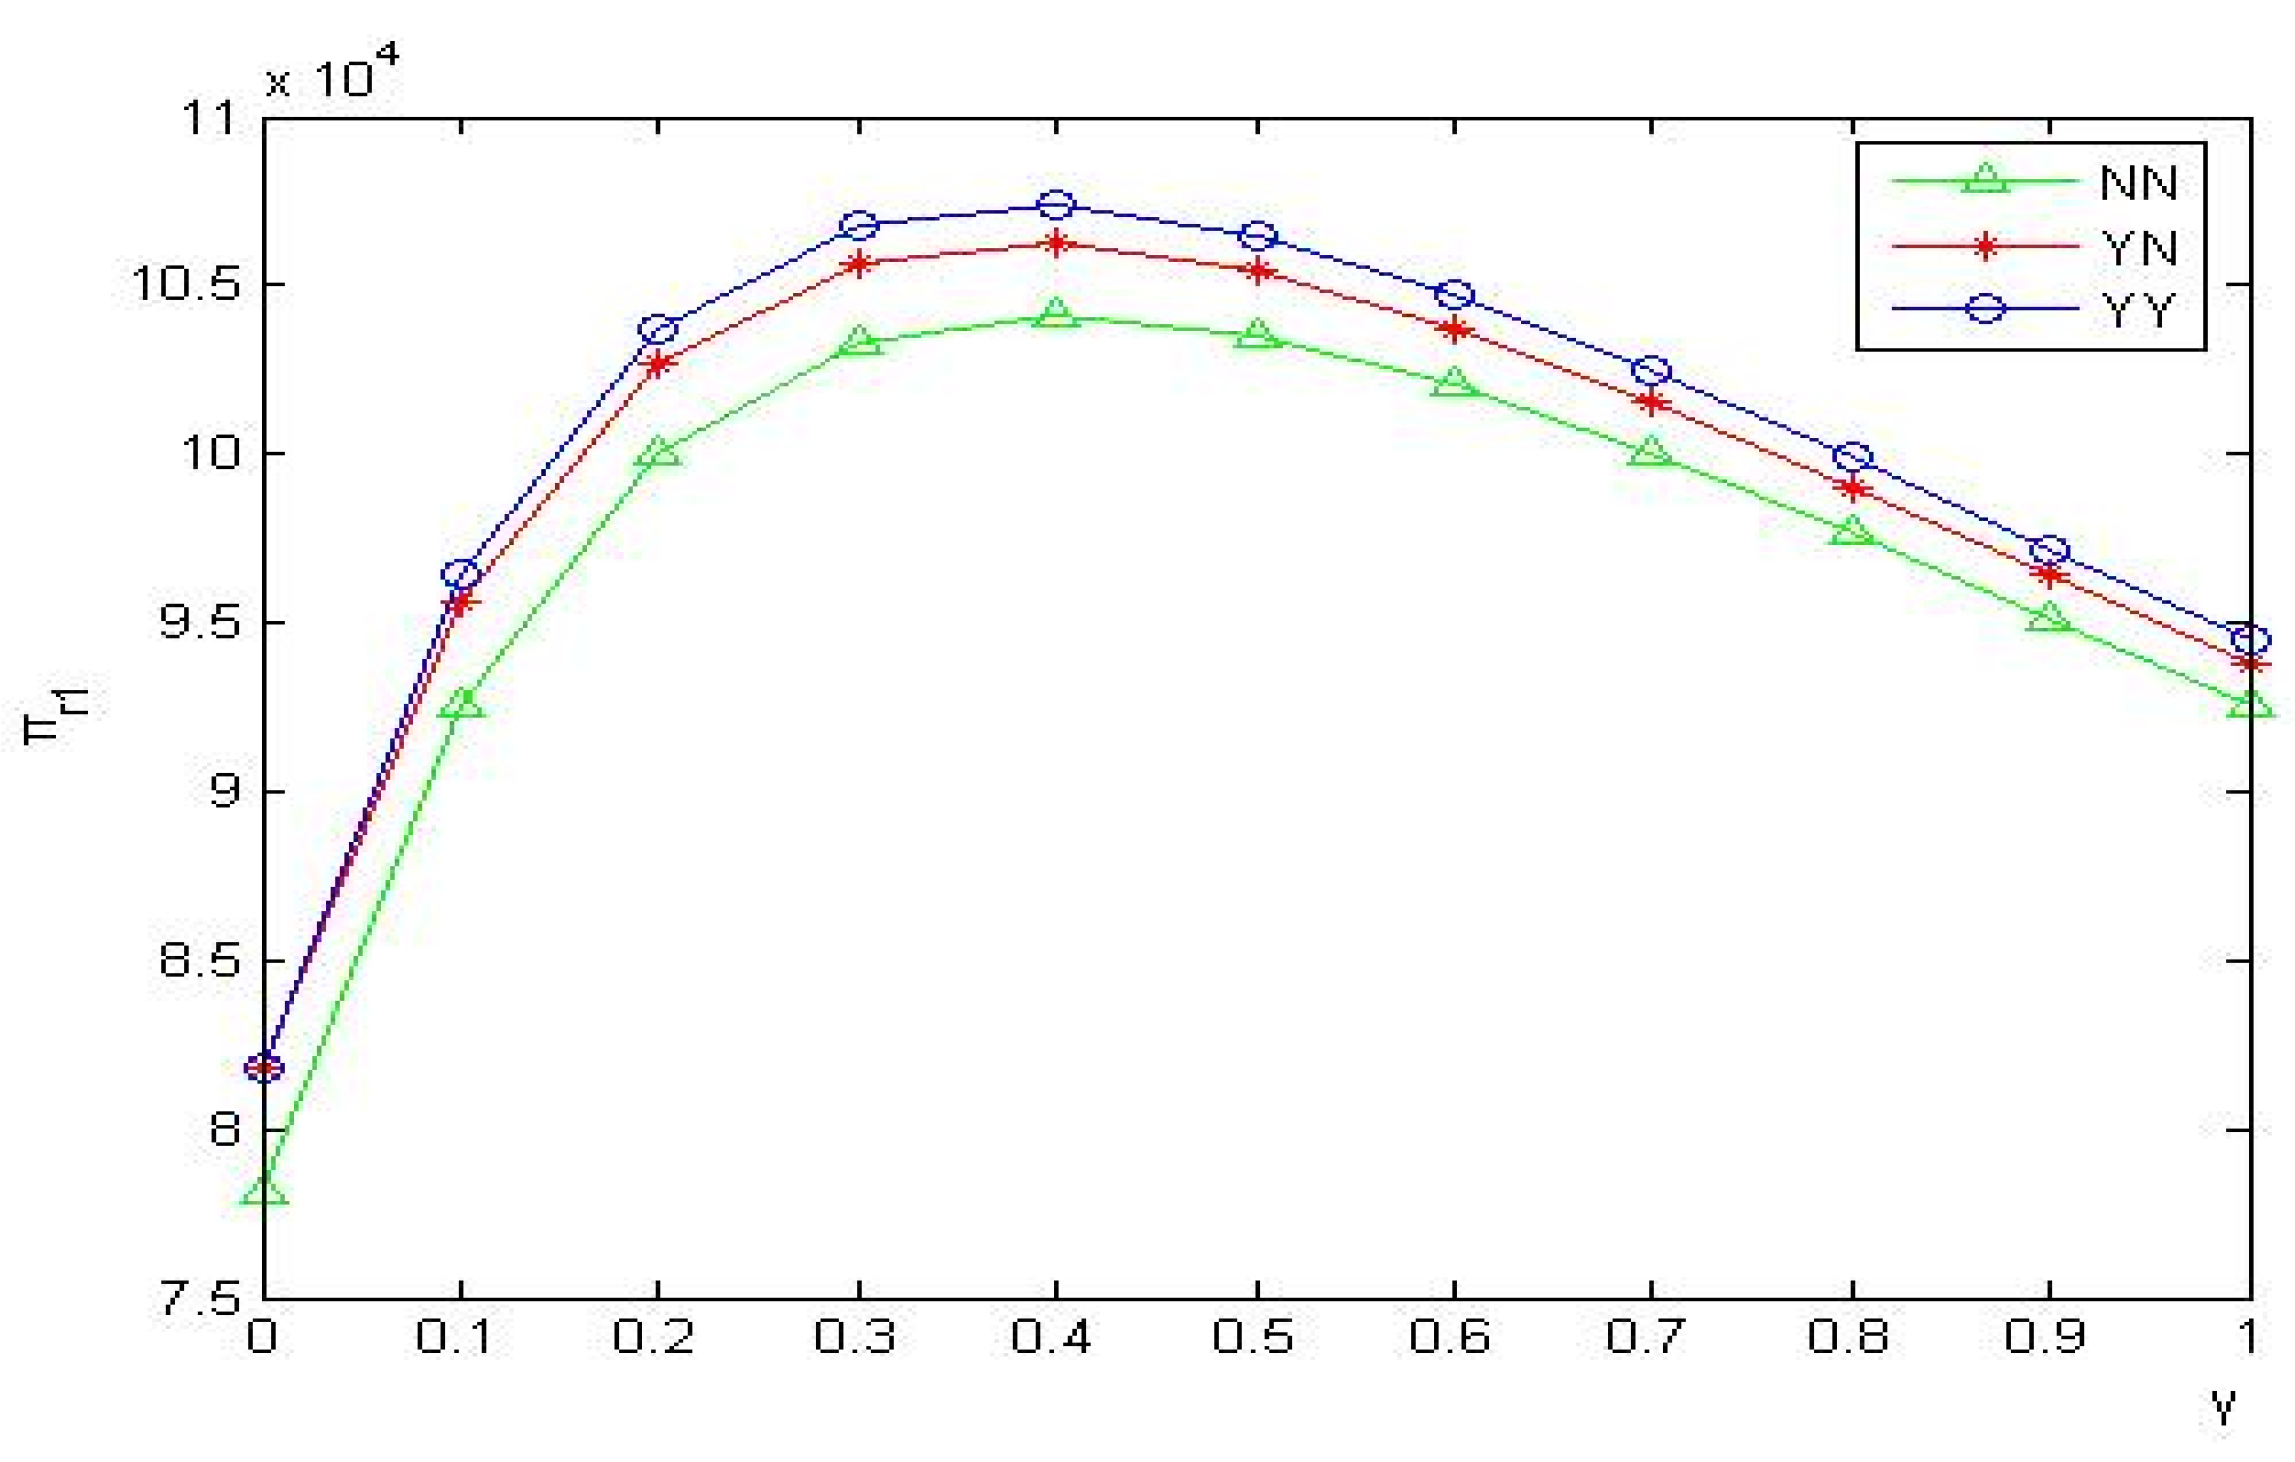
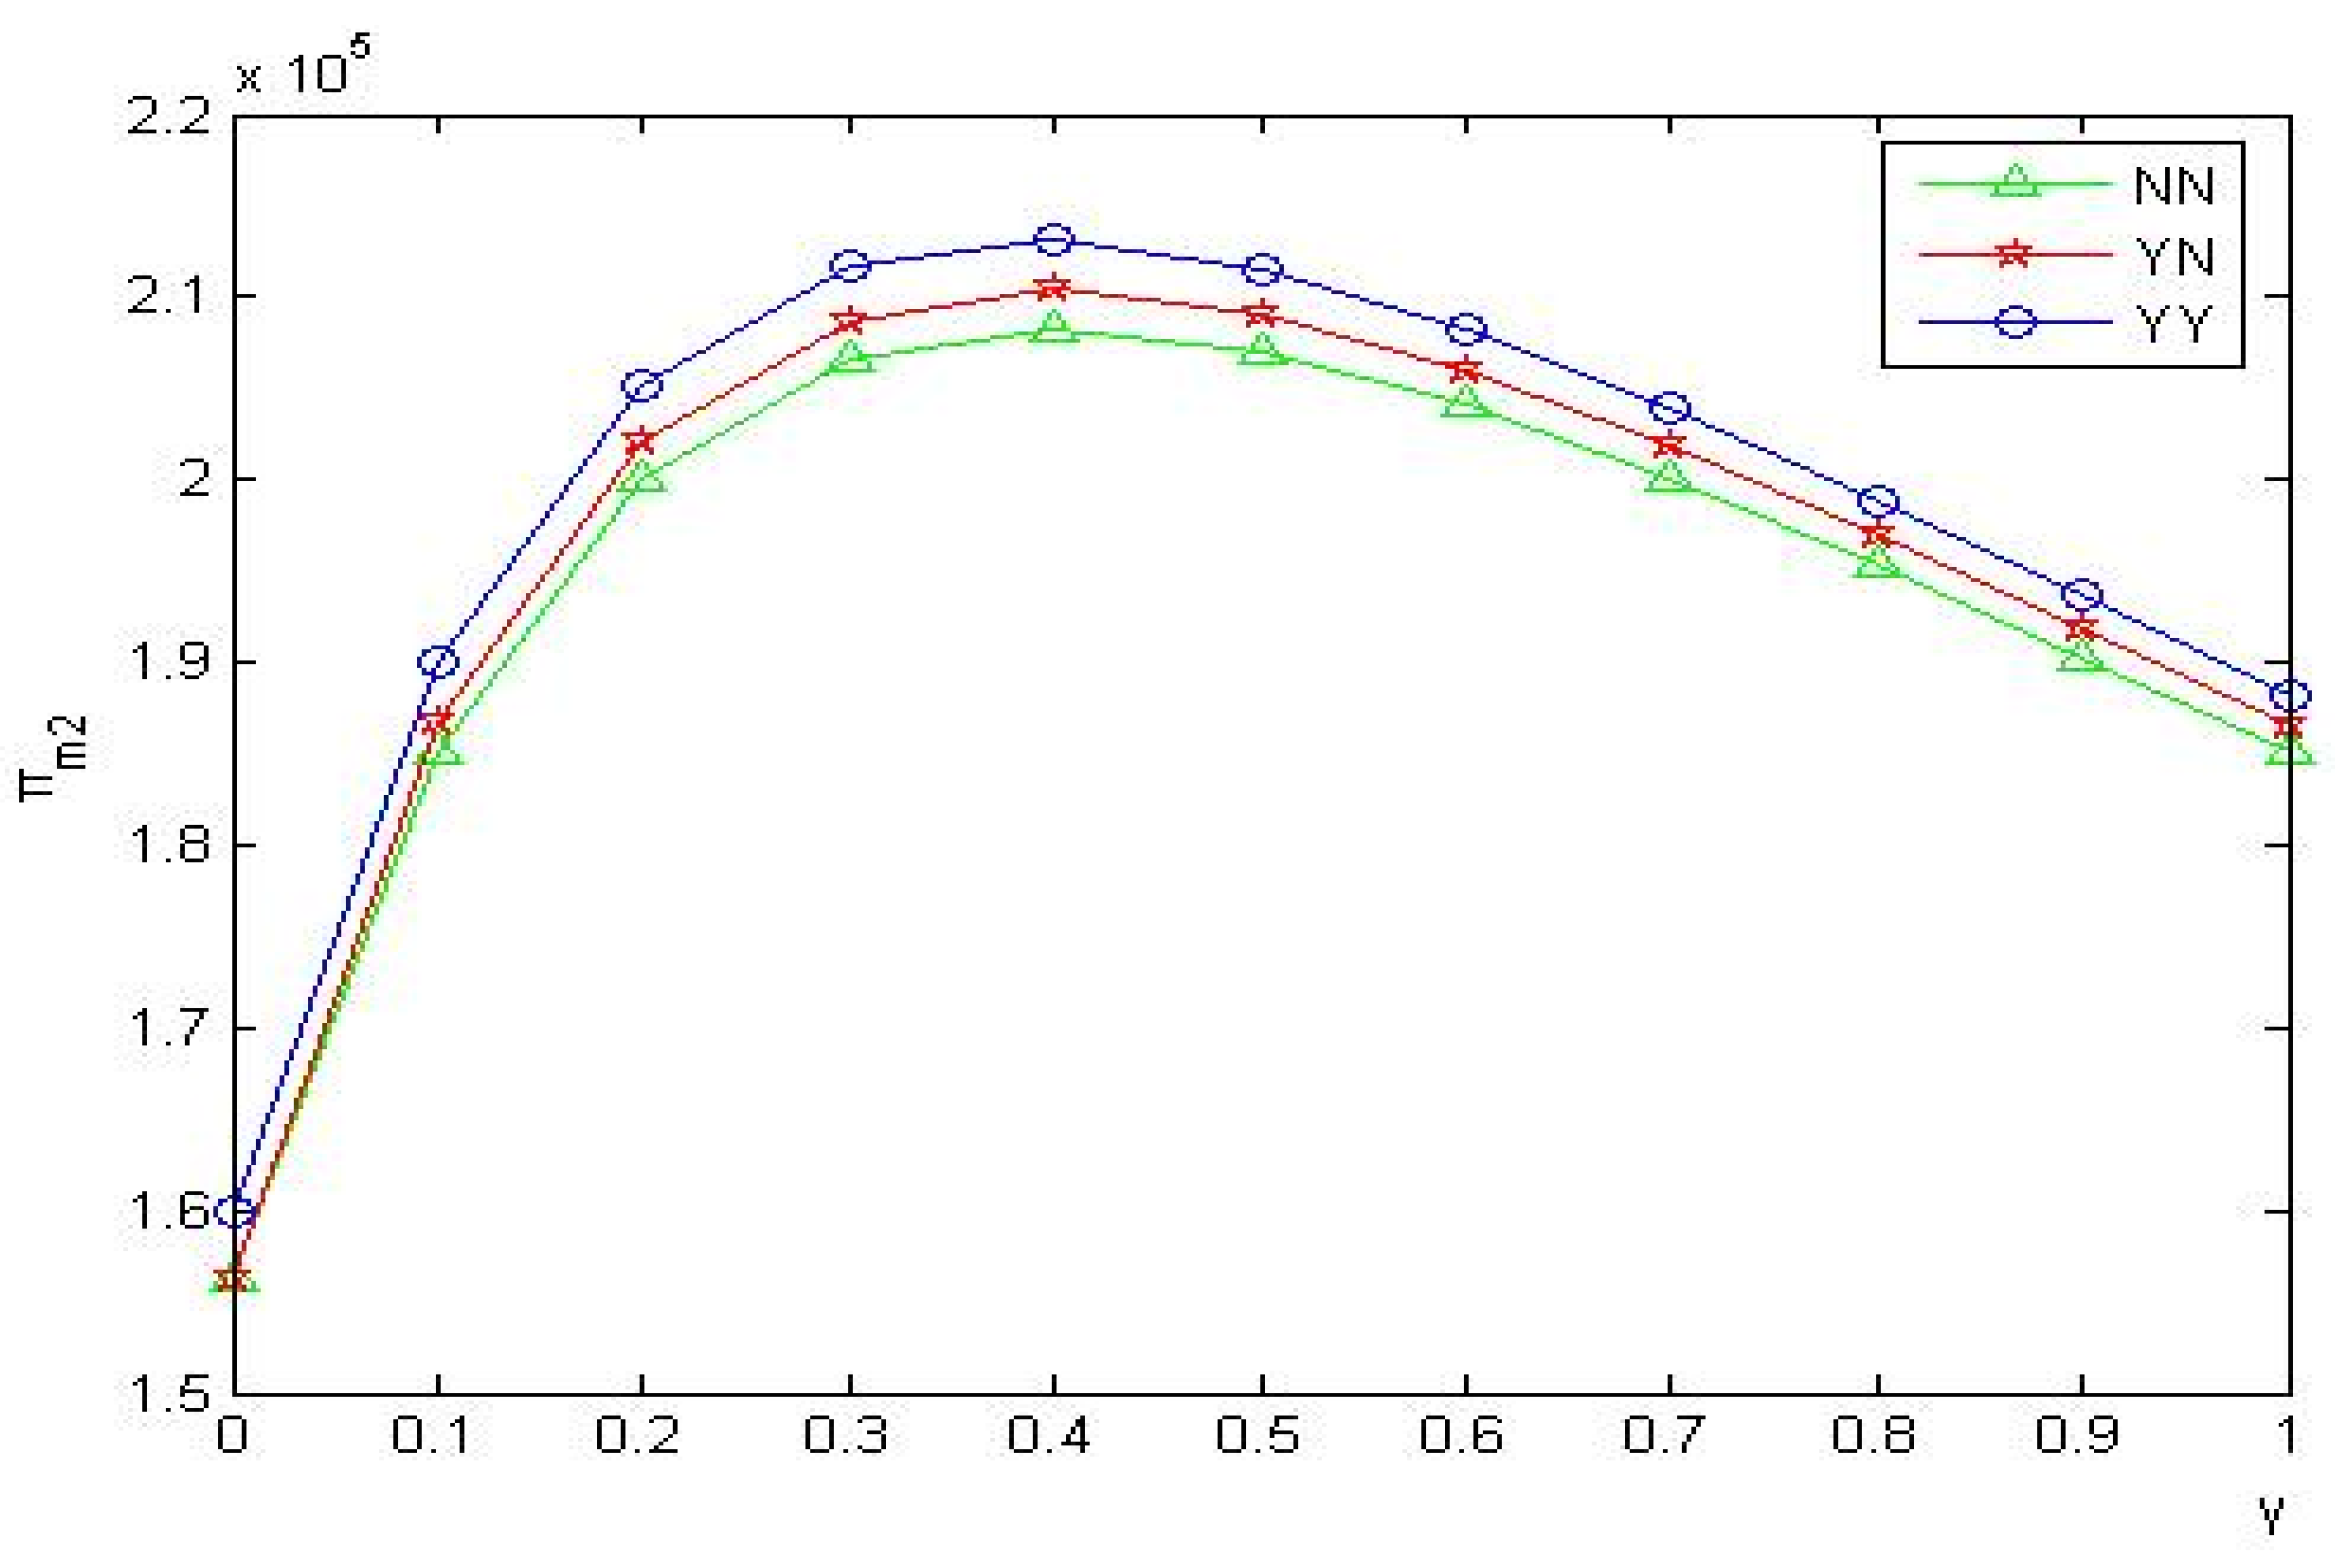
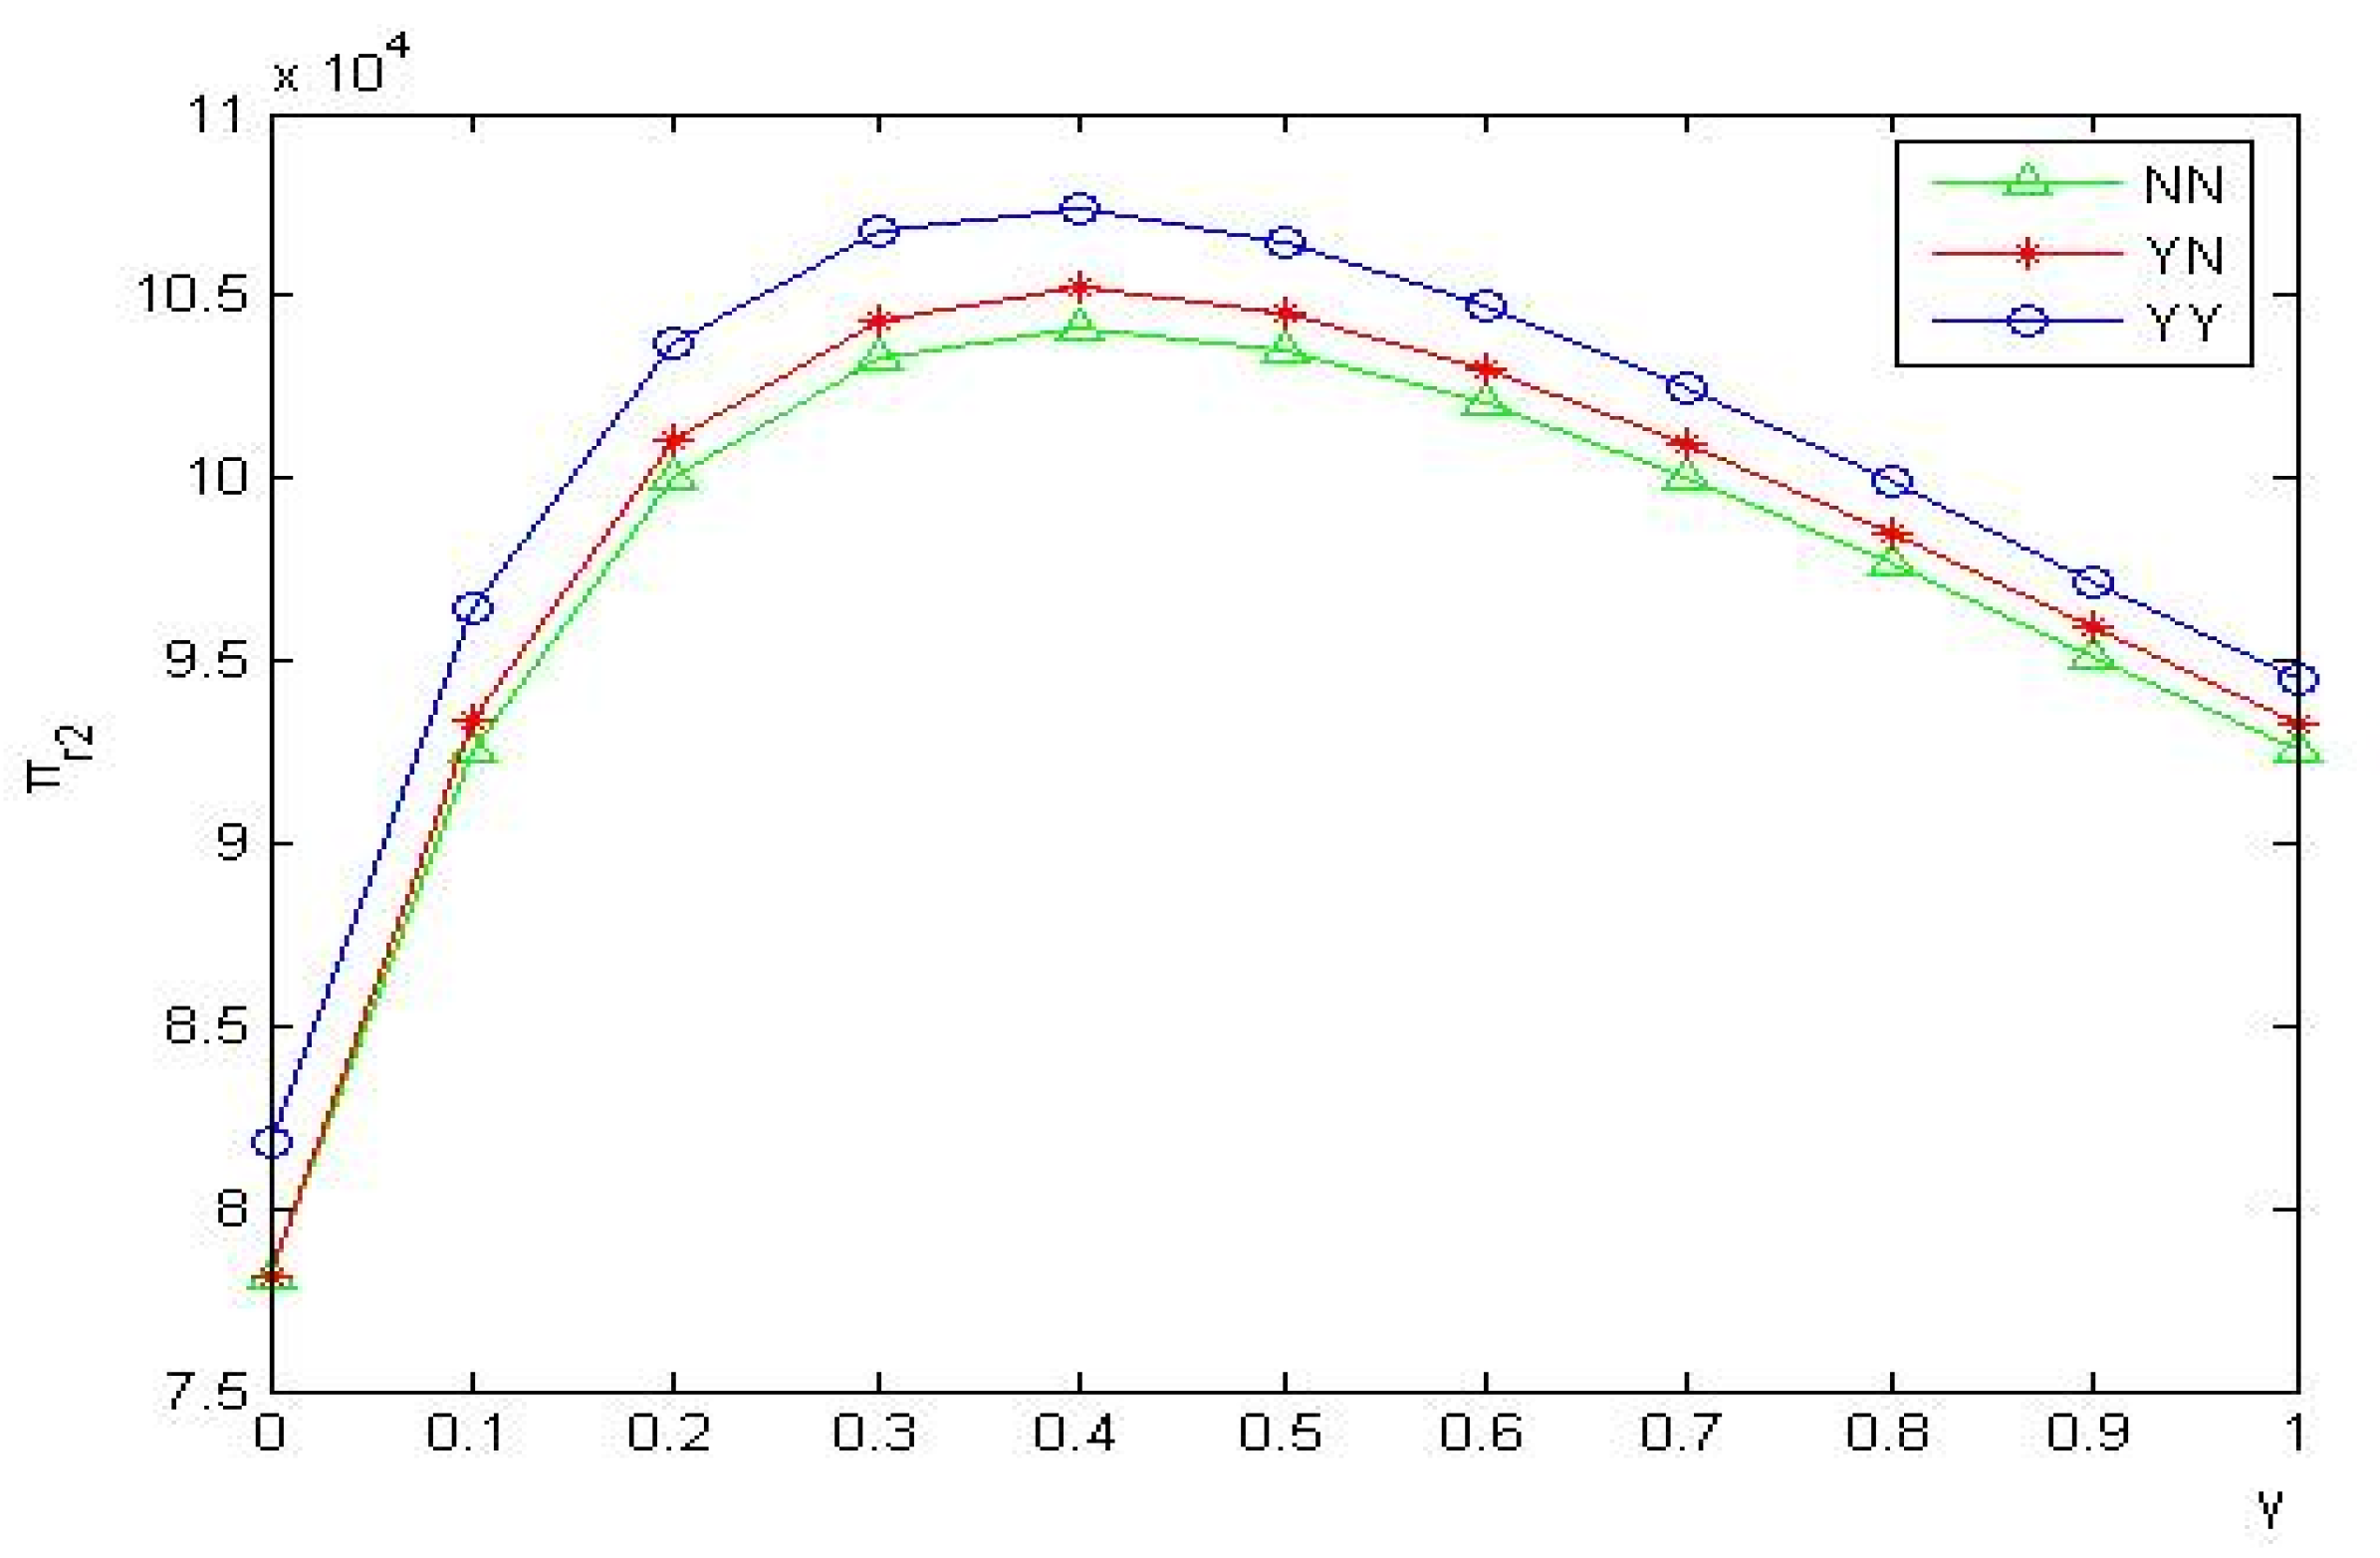
As shown in Figure 1, Figure 2, Figure 3 and Figure 4, in three types of green product R&D strategies, when both competing supply chains carry out green product R&D, manufacturers and retailers have the highest benefits. When neither supply chain conducts green product R&D, manufacturers and retailers have the lowest benefits. As the intensity of competition increases, the profits of manufacturers and retailers increase and then decrease.
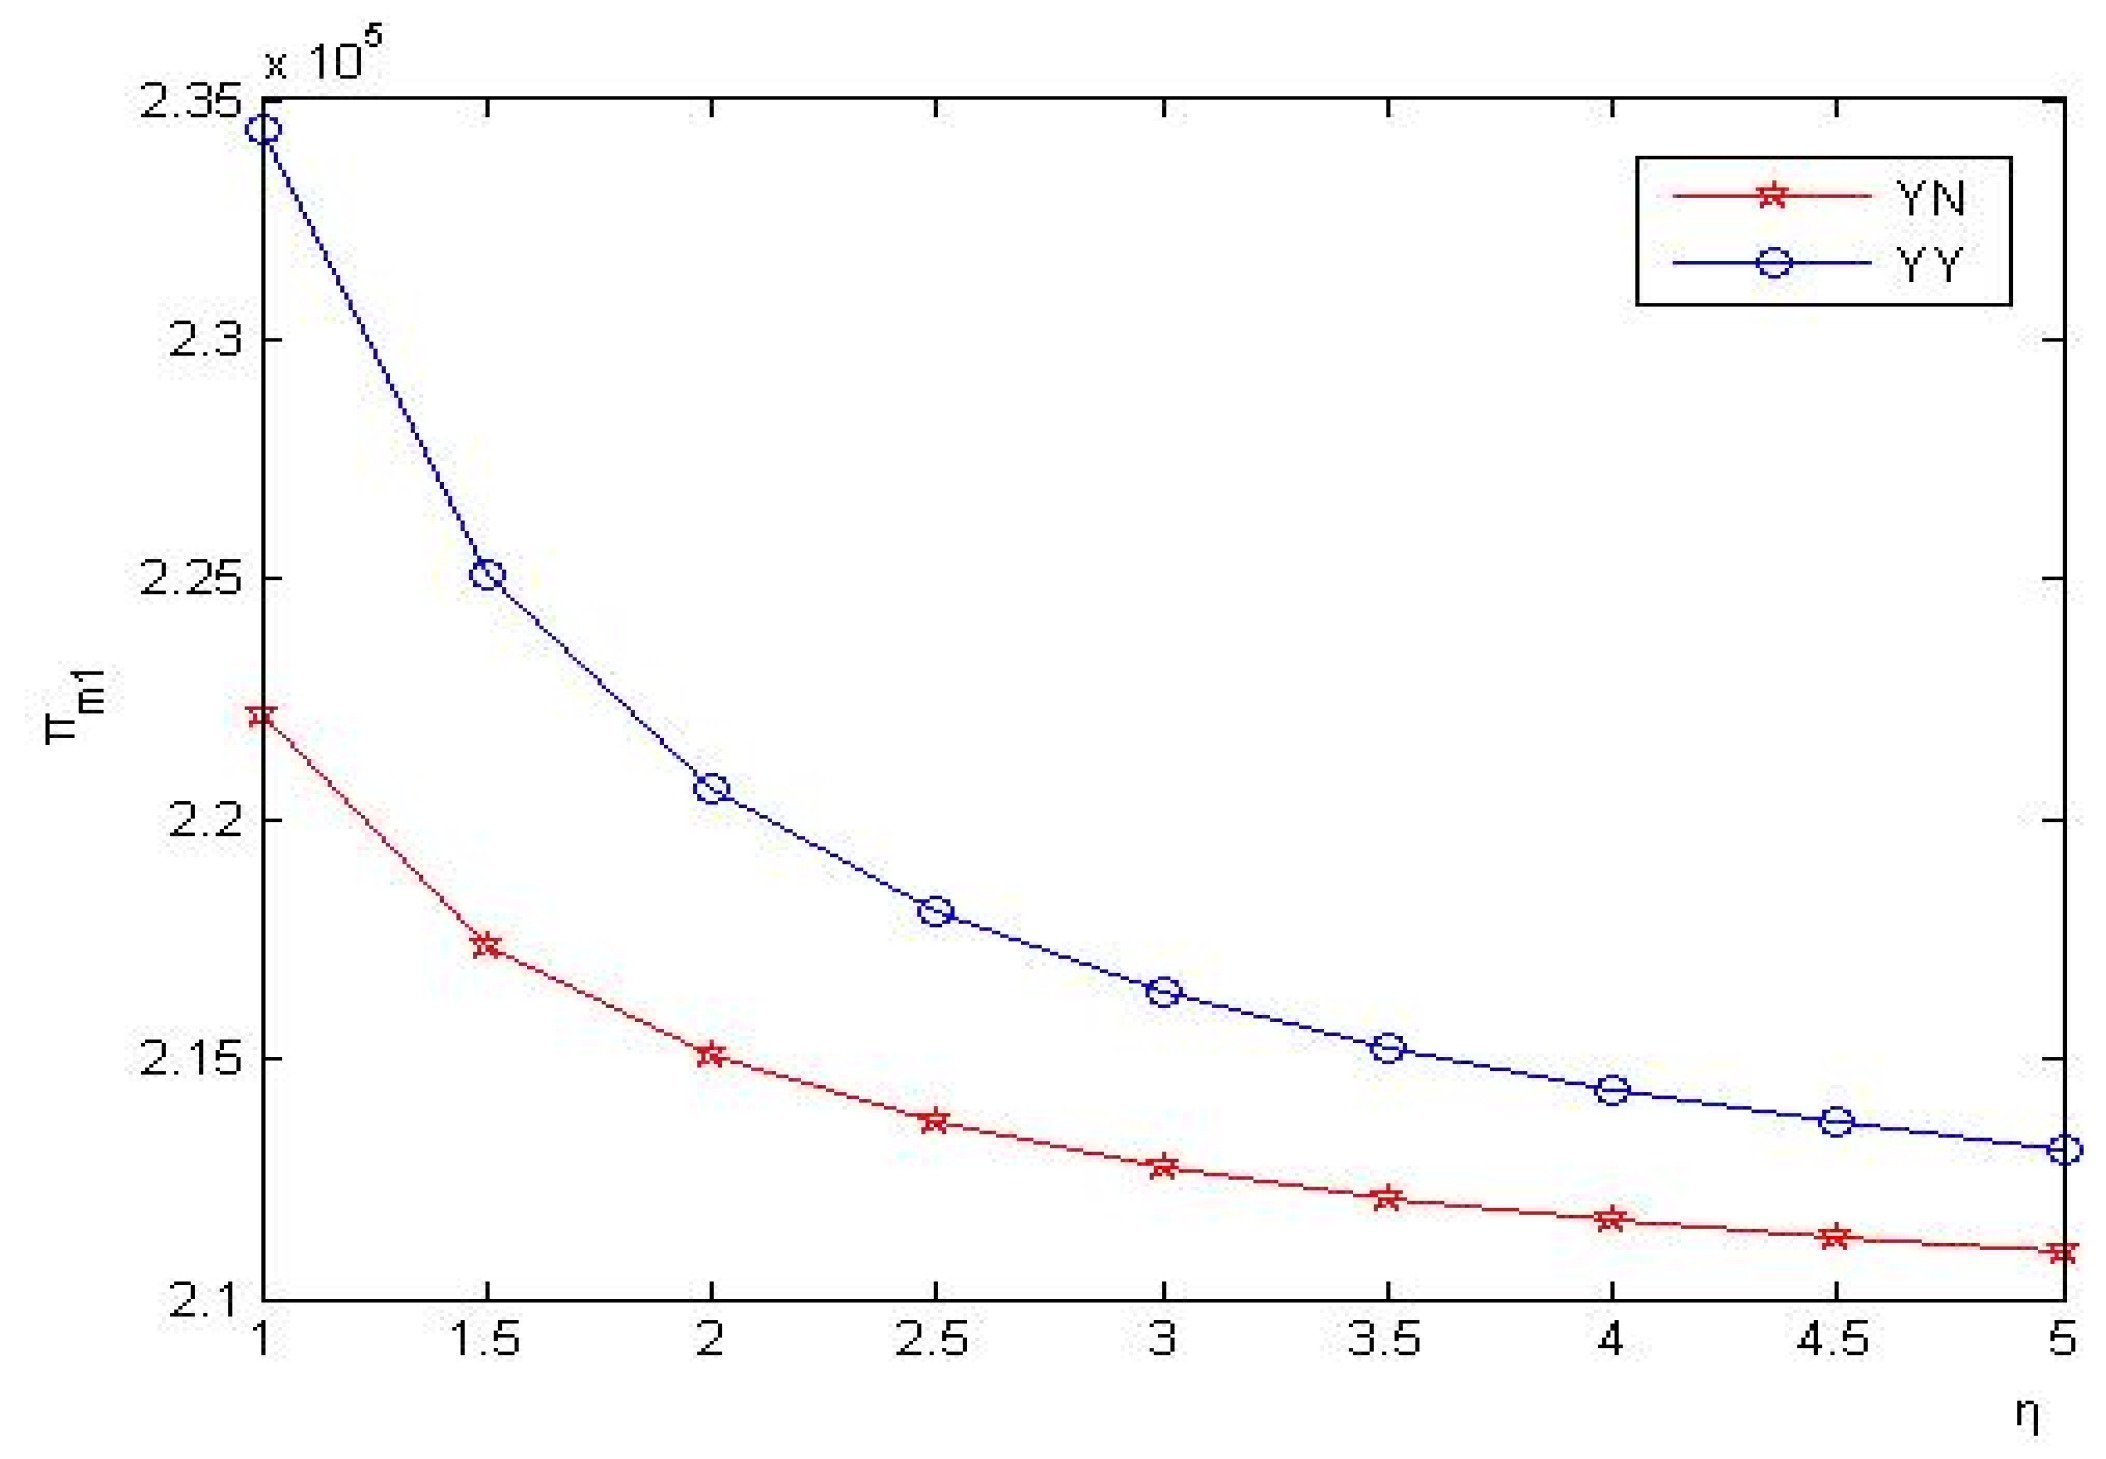
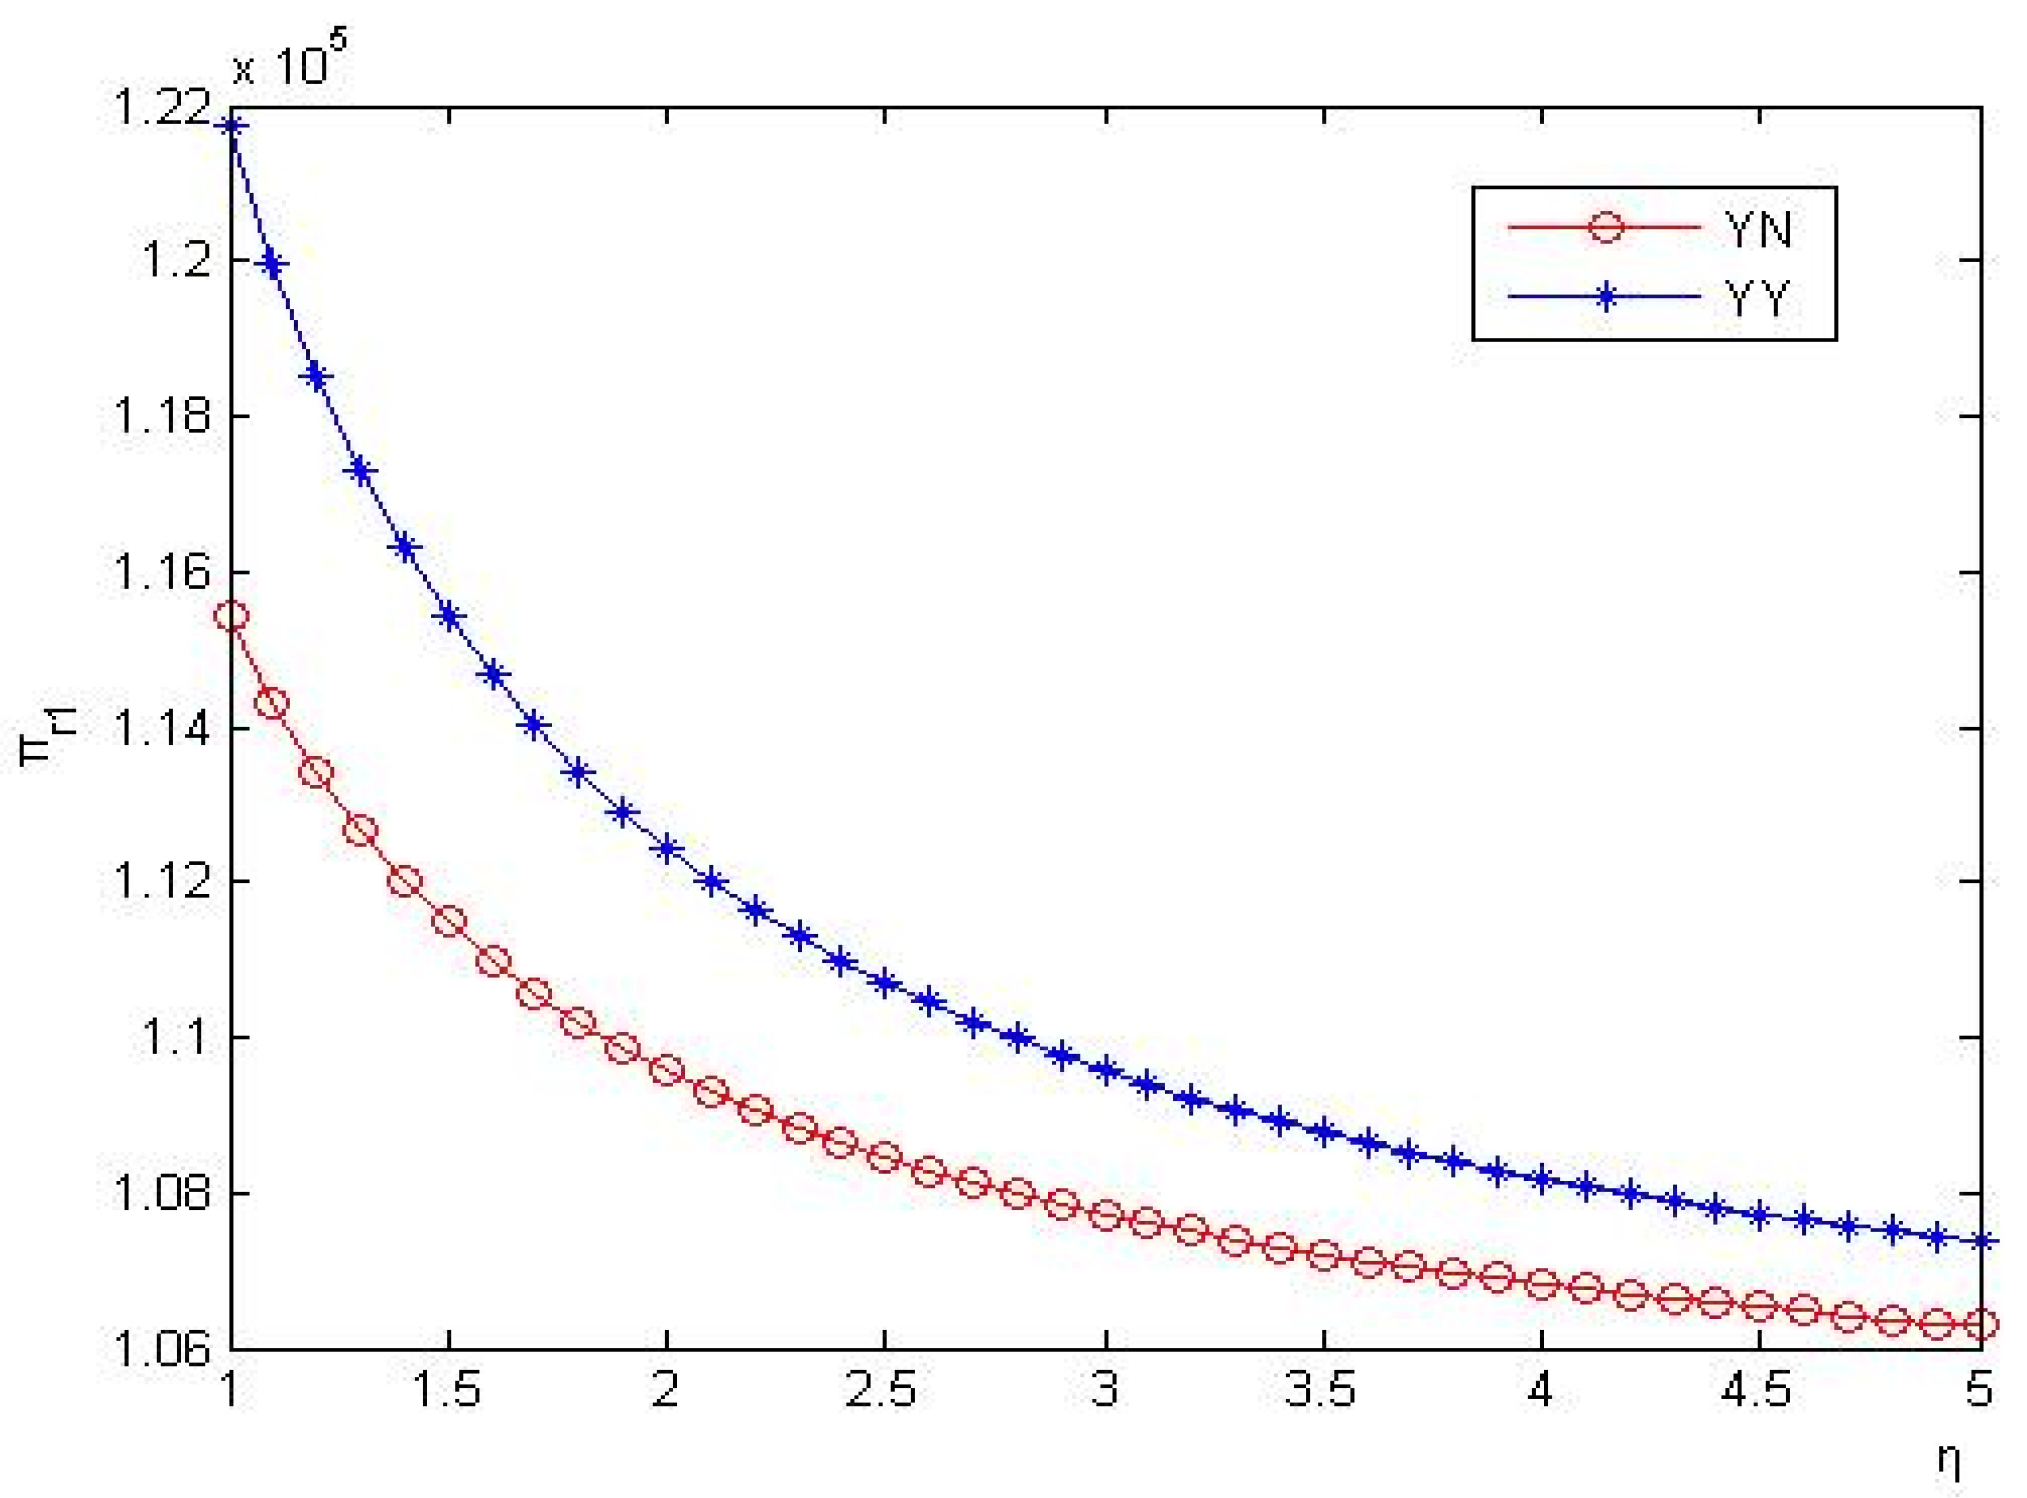
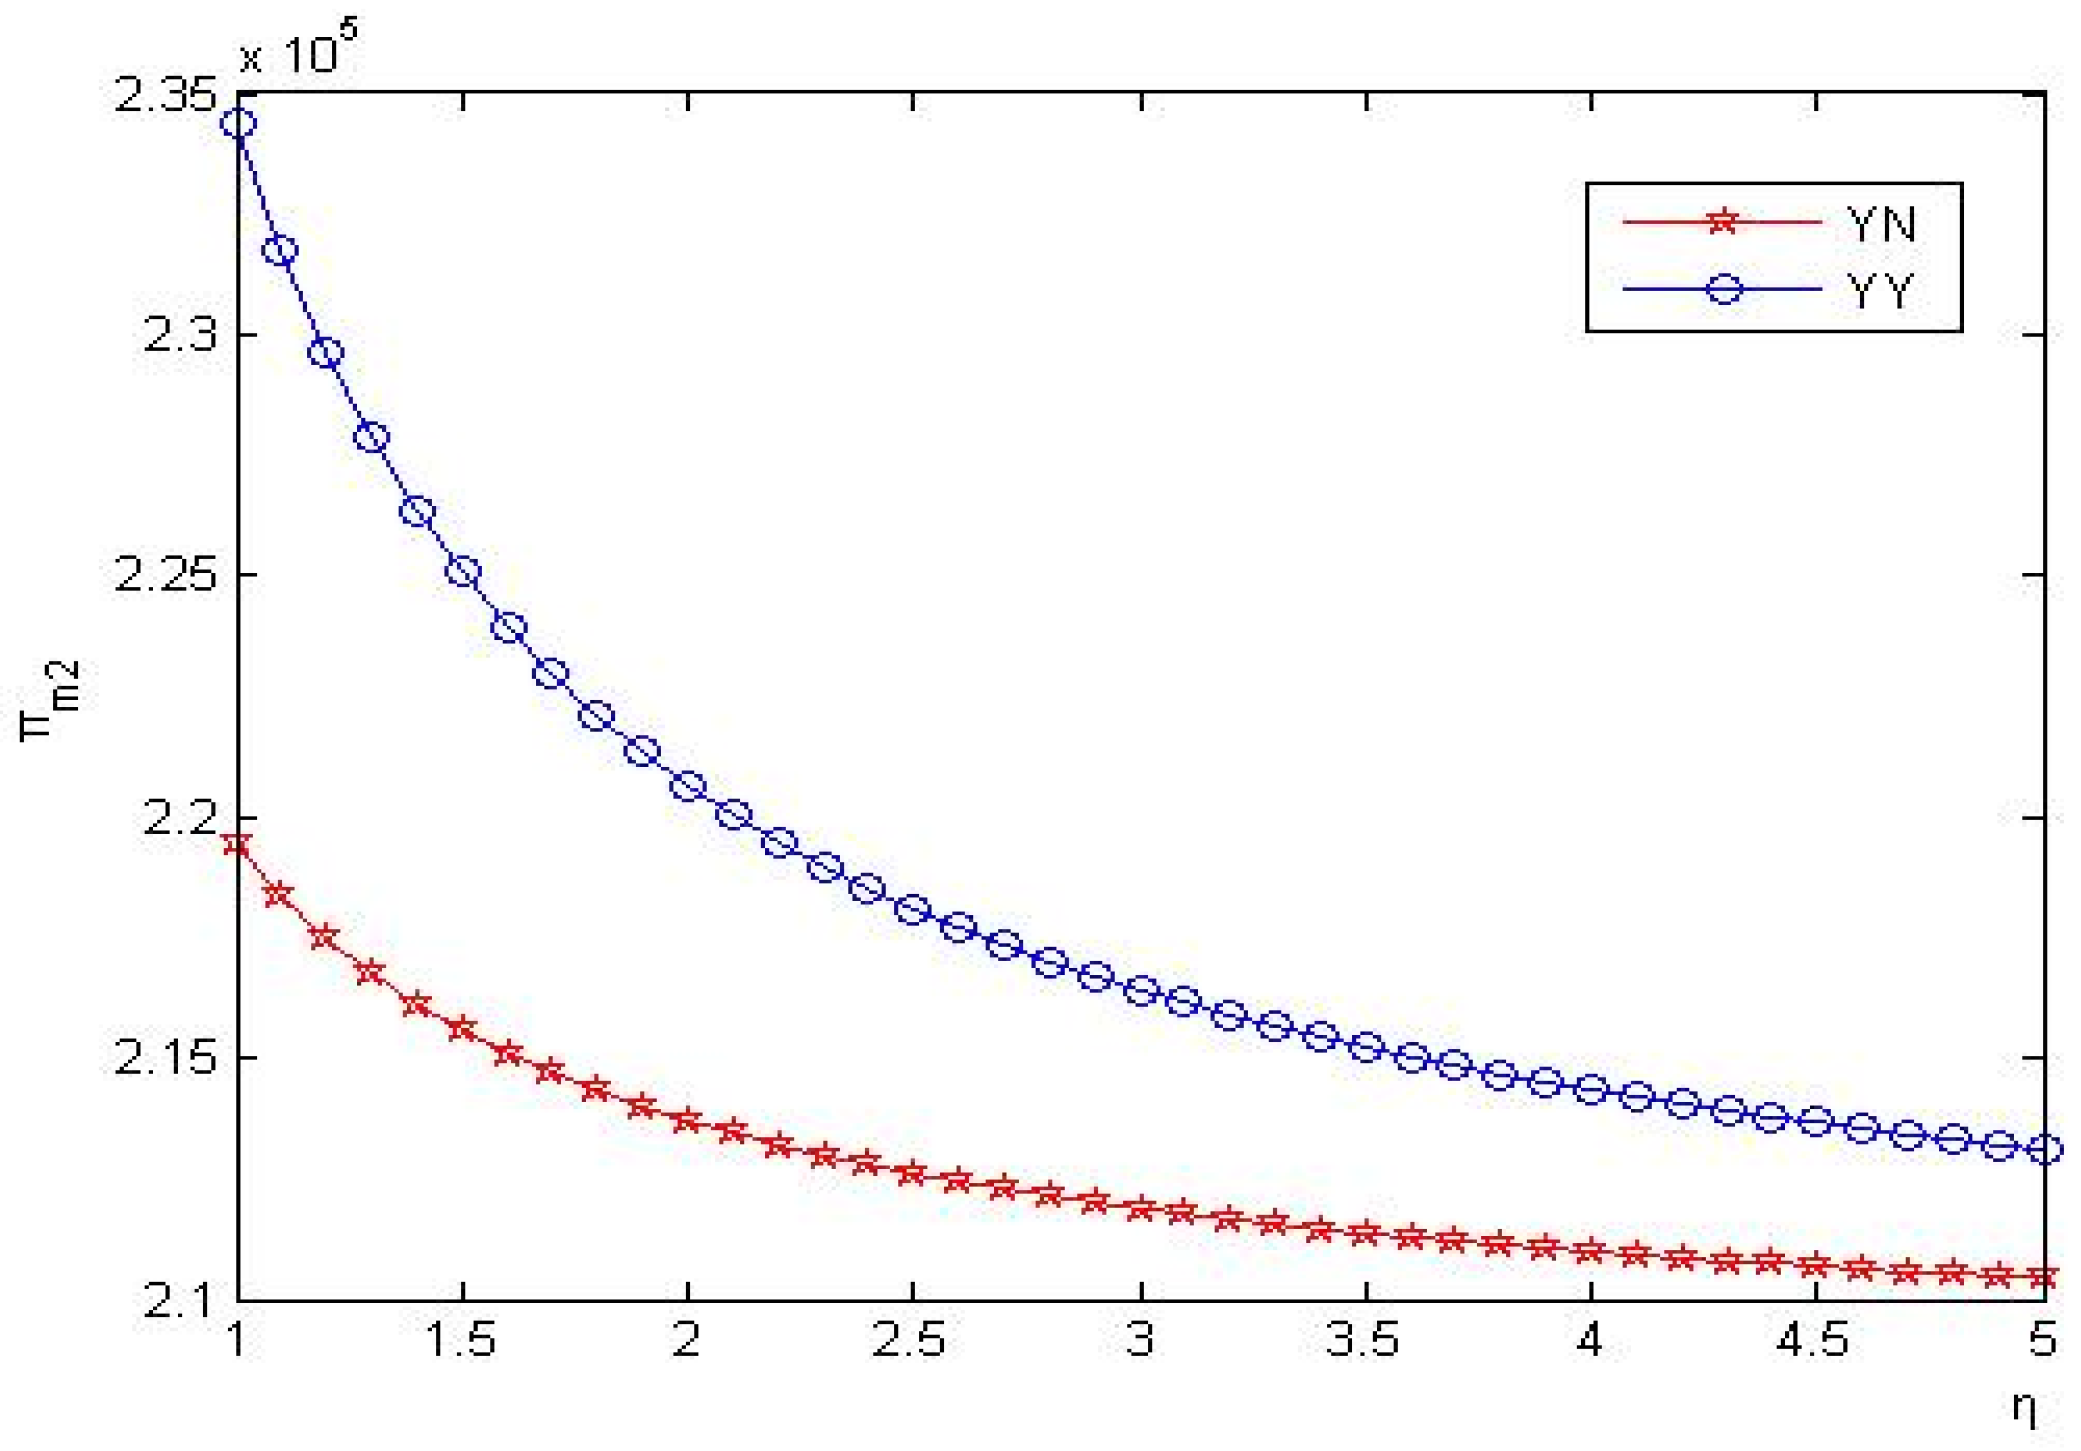
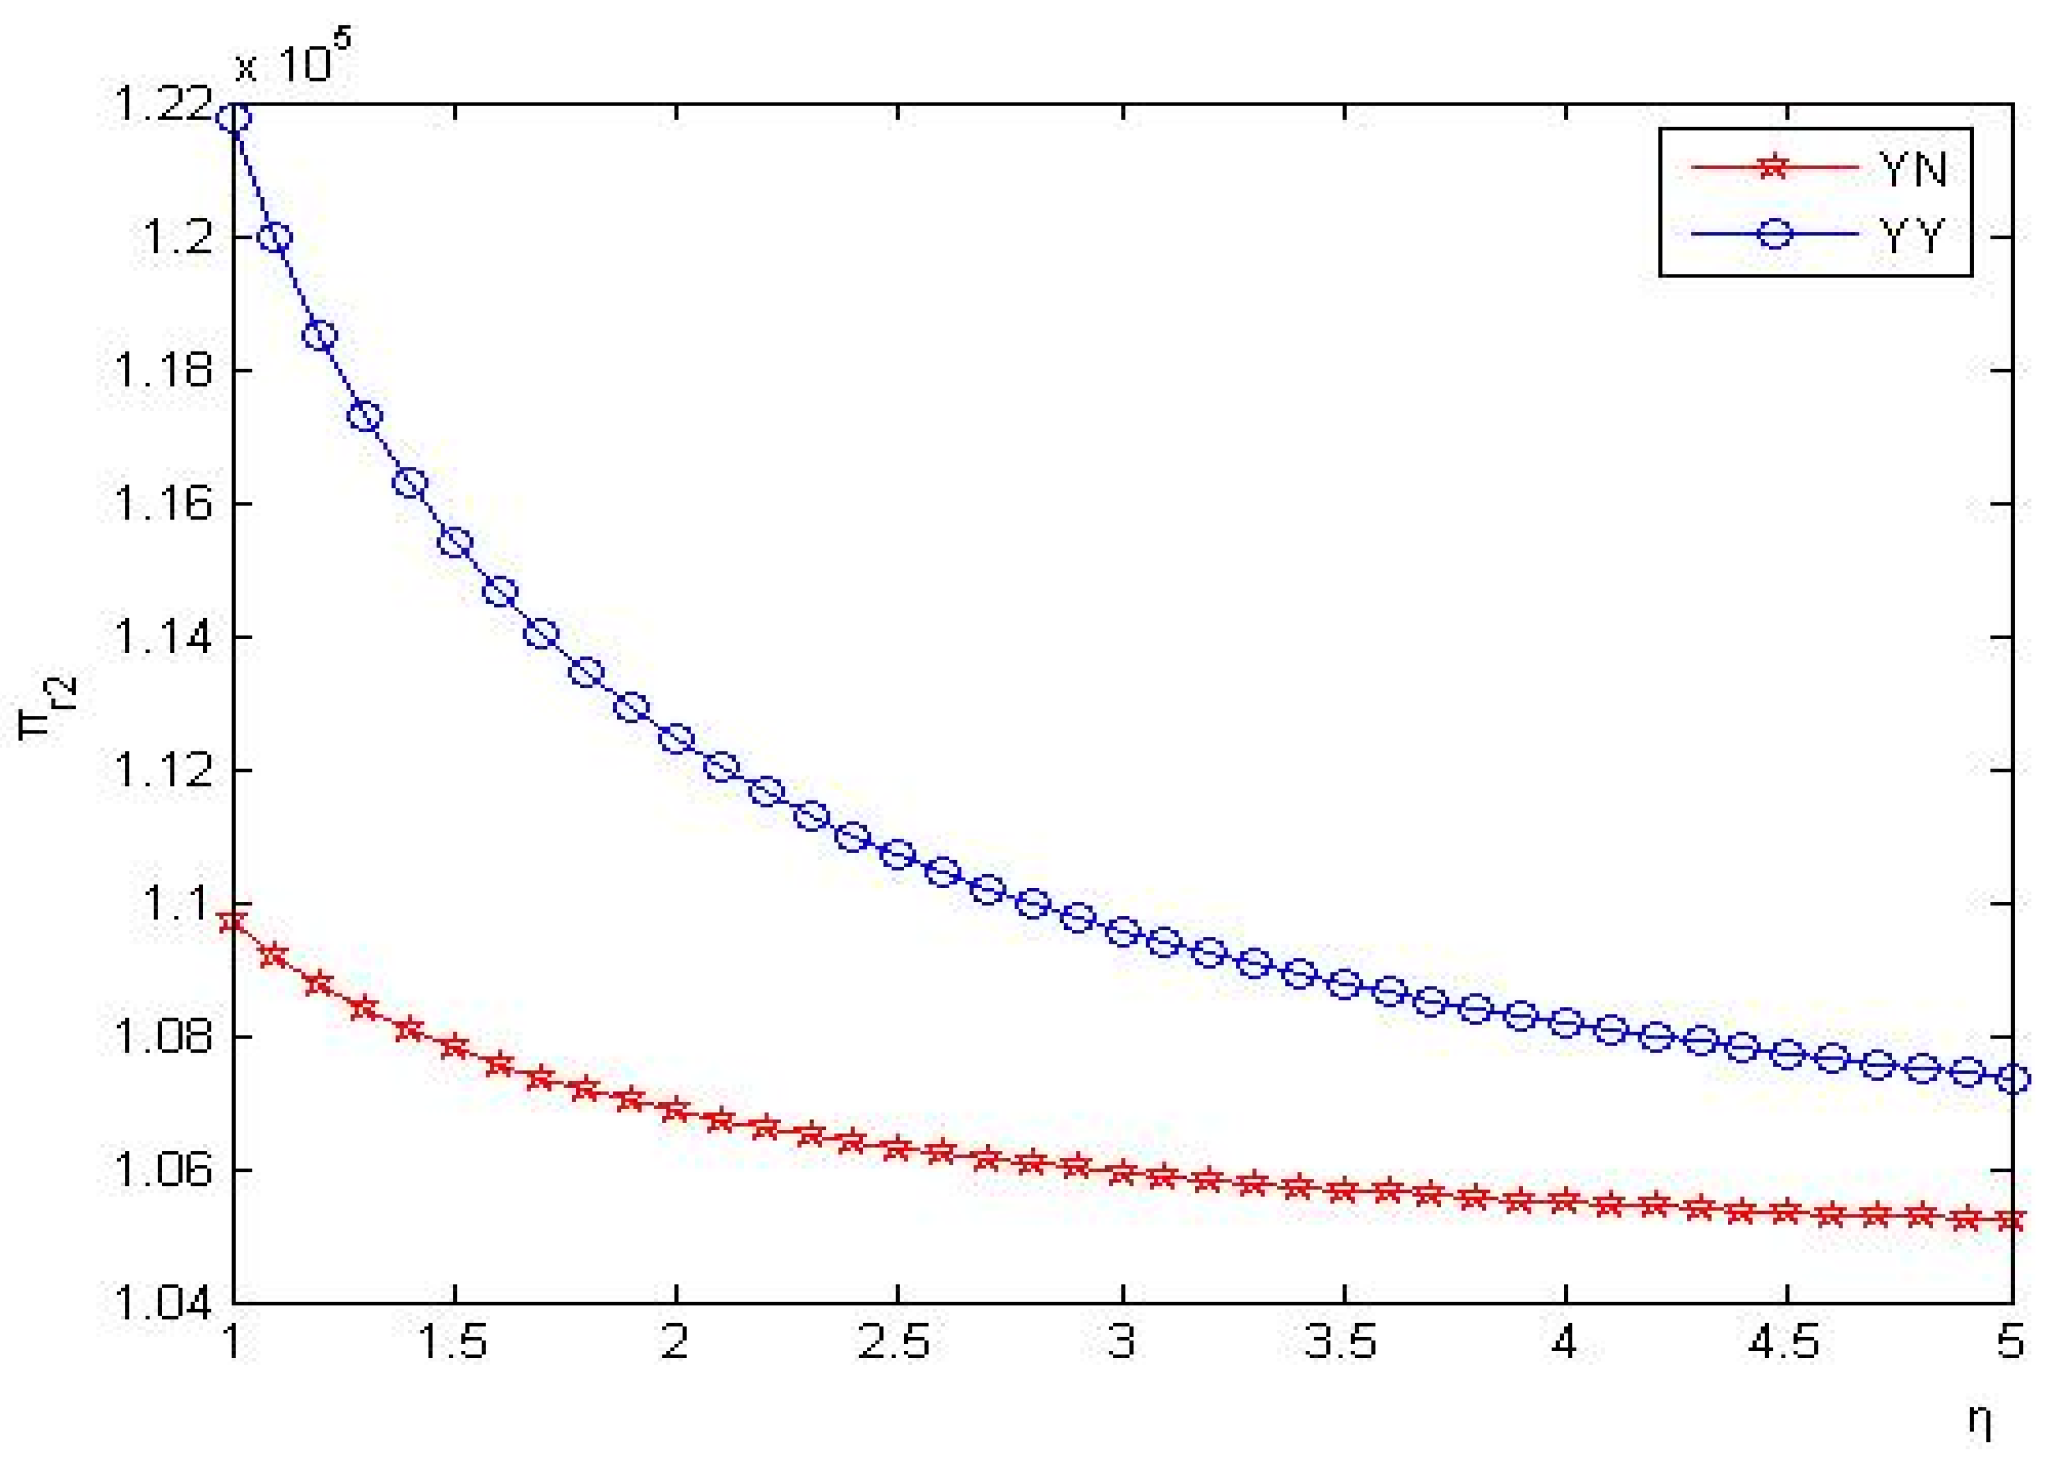
Figure 5, Figure 6, Figure 7 and Figure 8 show that as the green product R&D cost coefficient rises, manufacturers, retailers’ profits fall in the competitive supply chain.The profits of manufacturers and retailers in YY strategy are always higher than those in YN strategy.
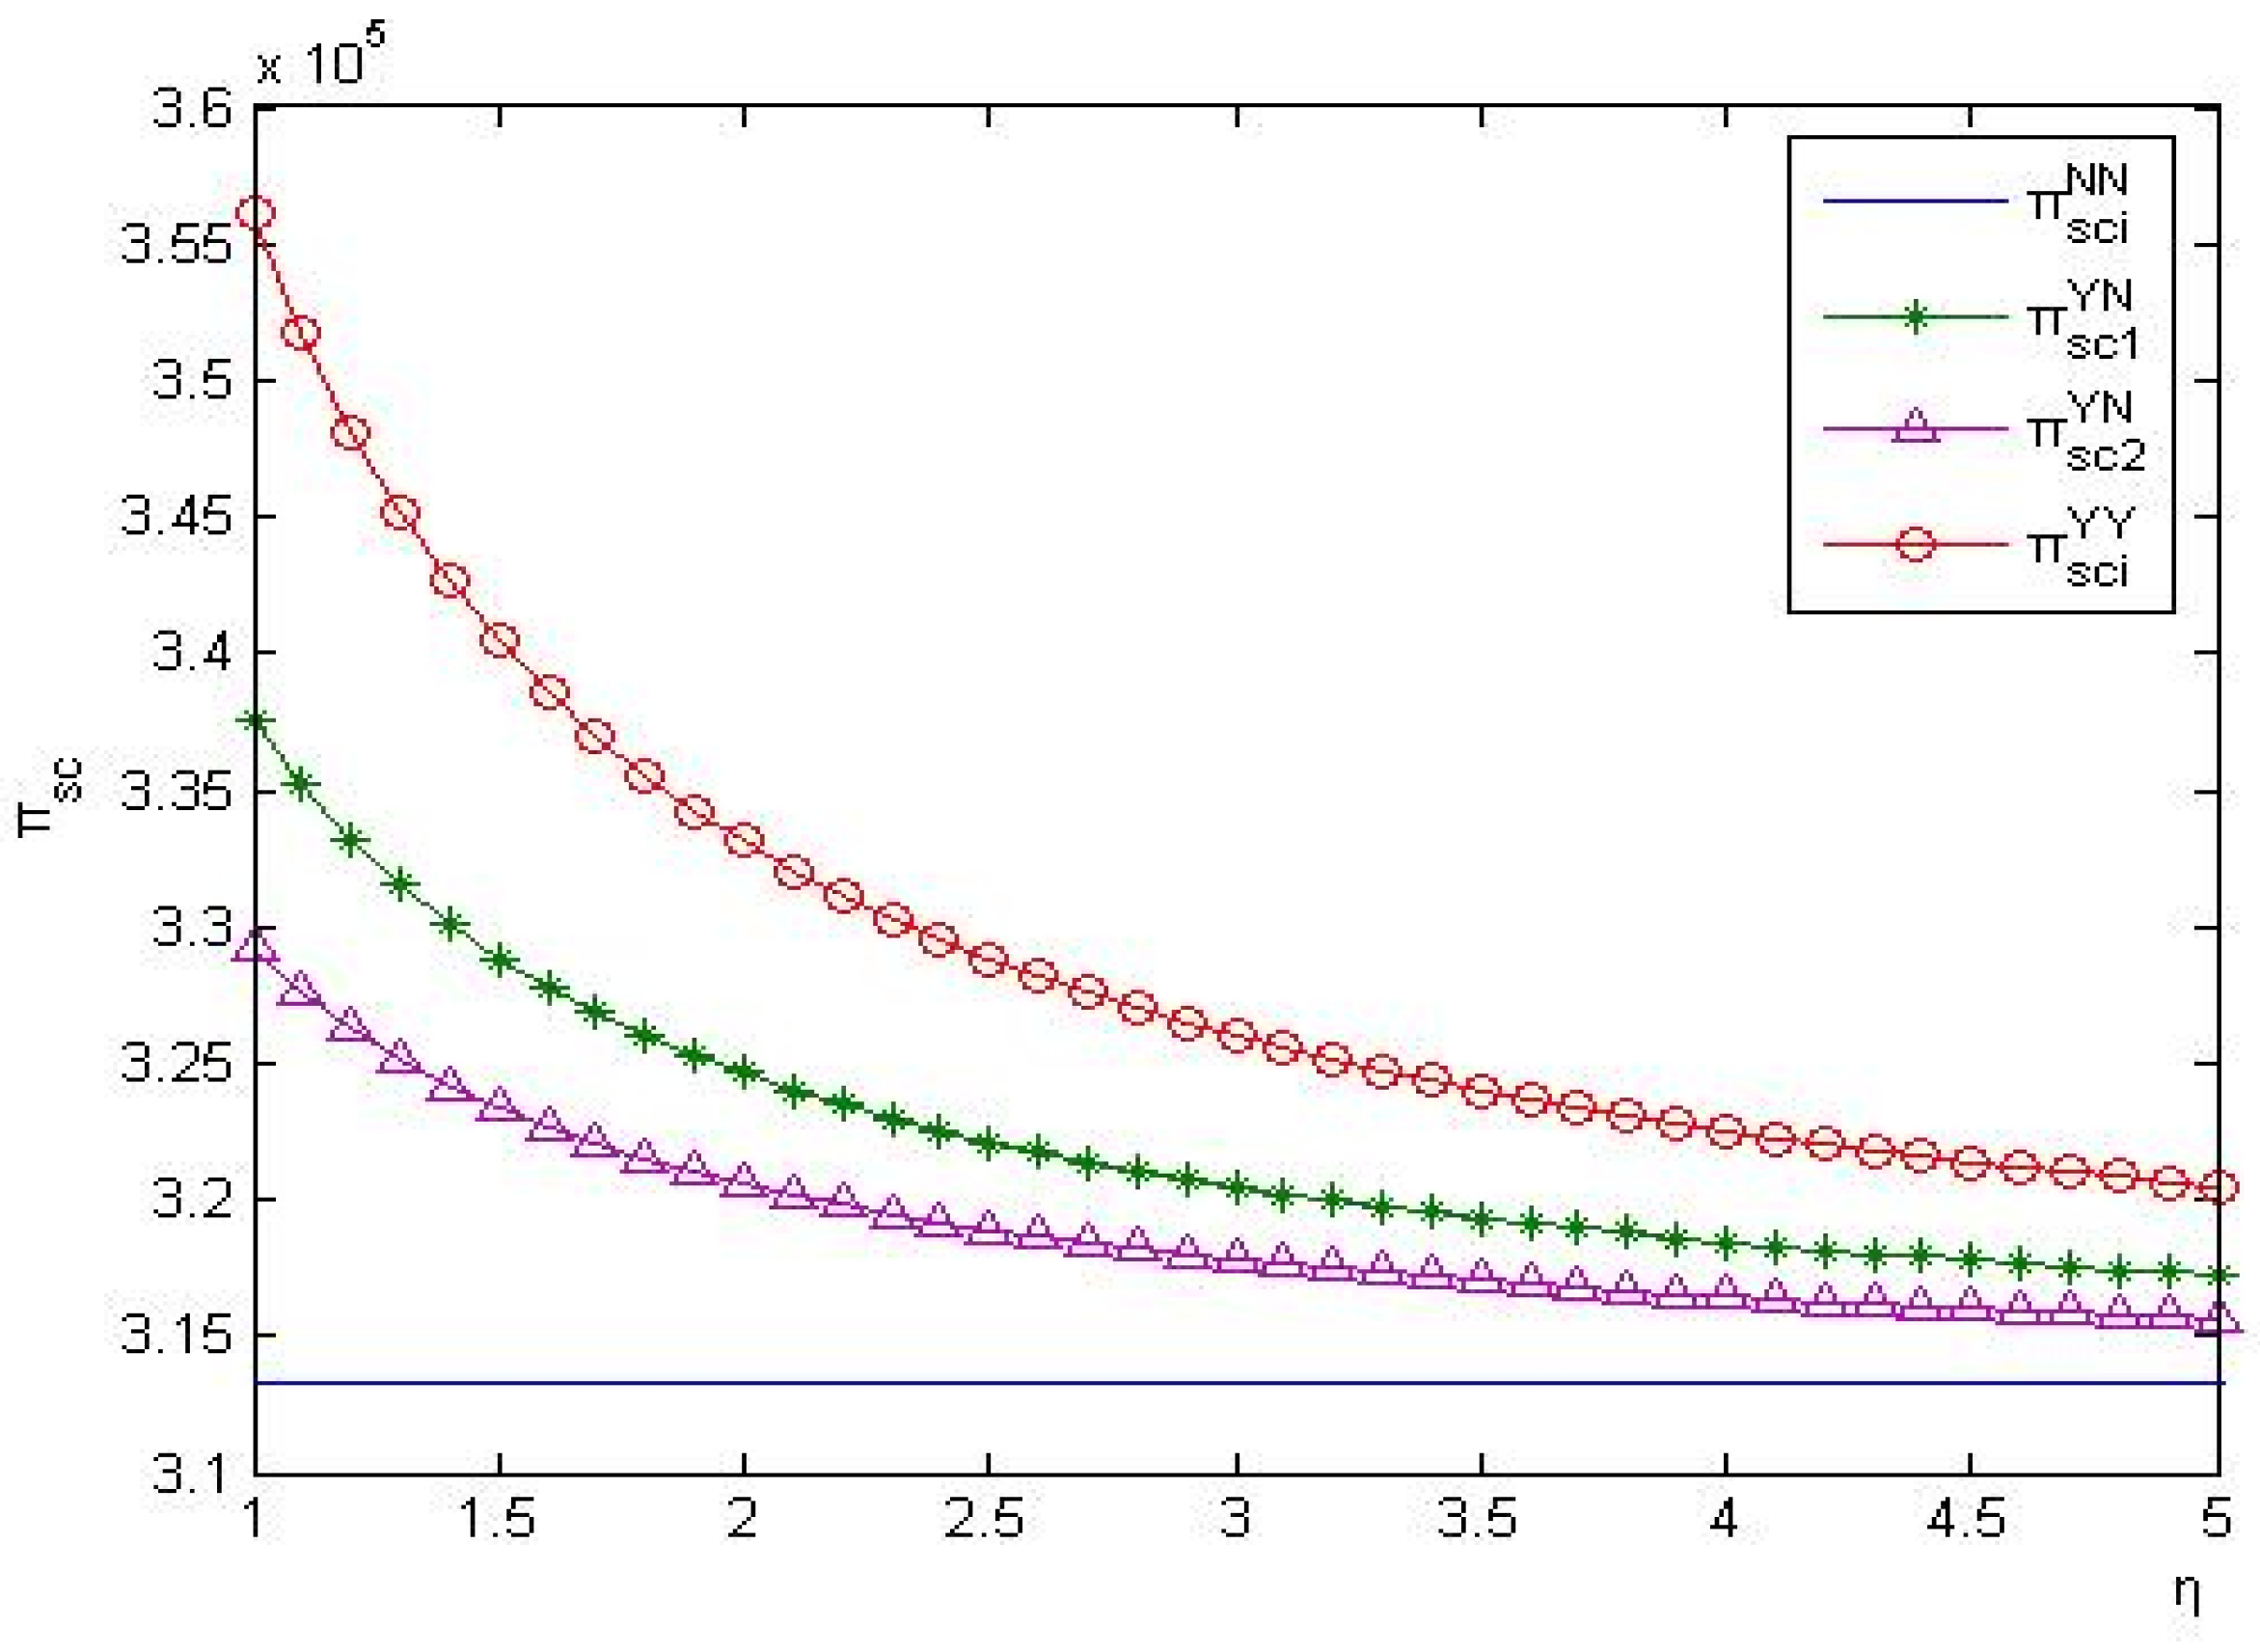
From Figure 9, in YY and YN strategies, the benefits of the supply chain decrease with the increase of the green cost coefficient. The benefit of supply chain in YY strategy is the highest, and the benefit of supply chain in NN strategy is the lowest. In YN strategy, the profit of supply chain 1 is higher than that of supply chain 2.
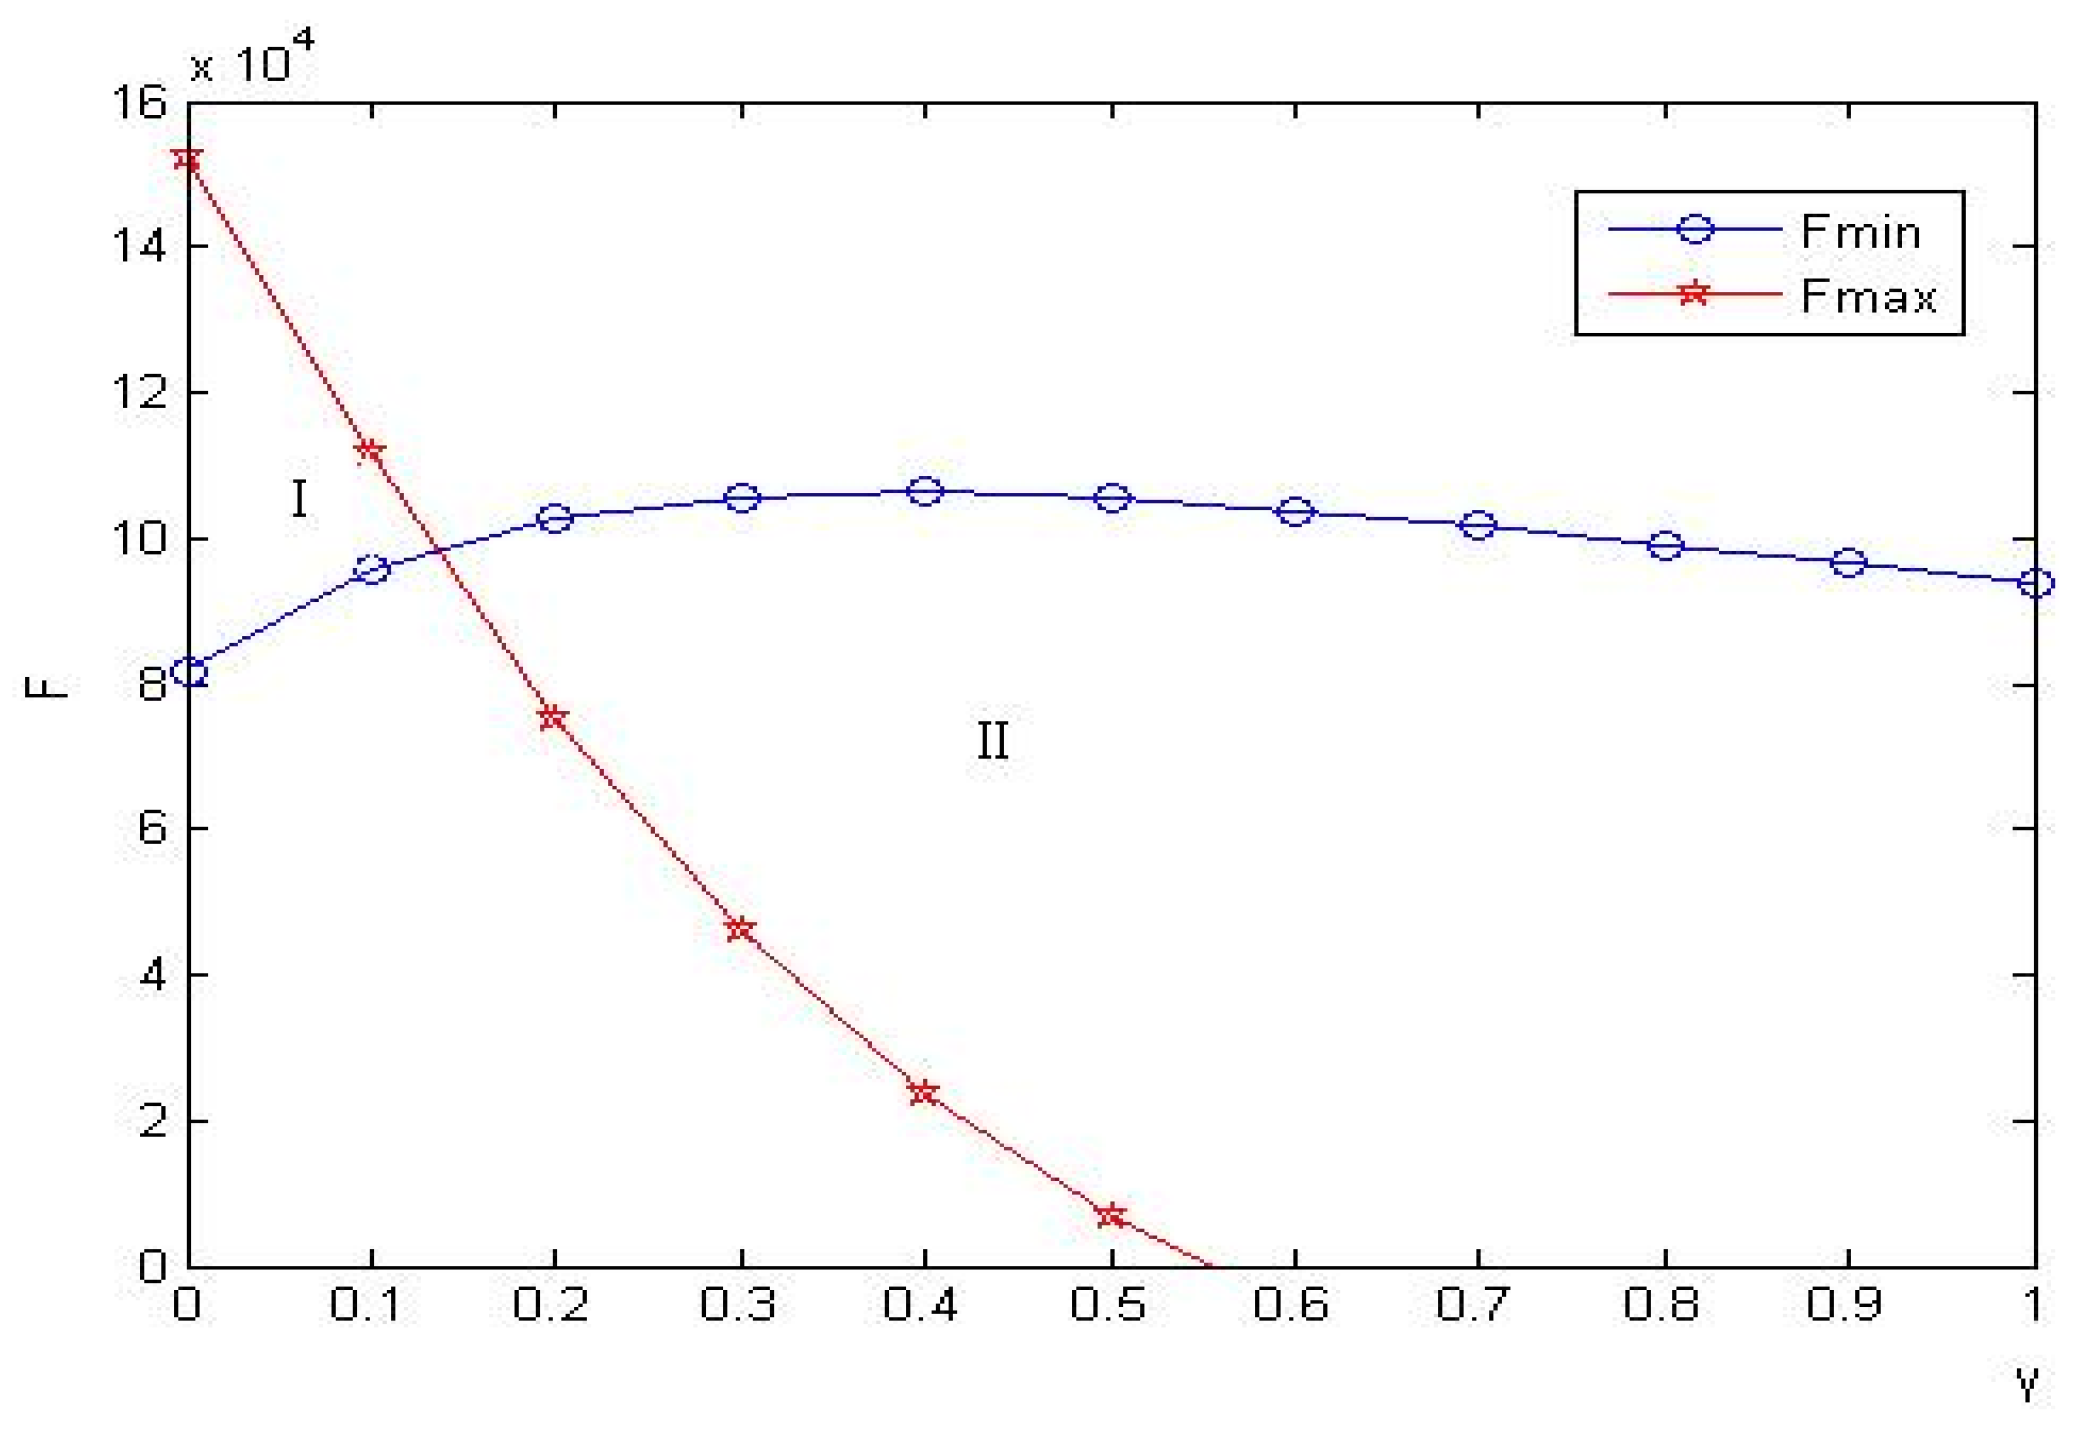
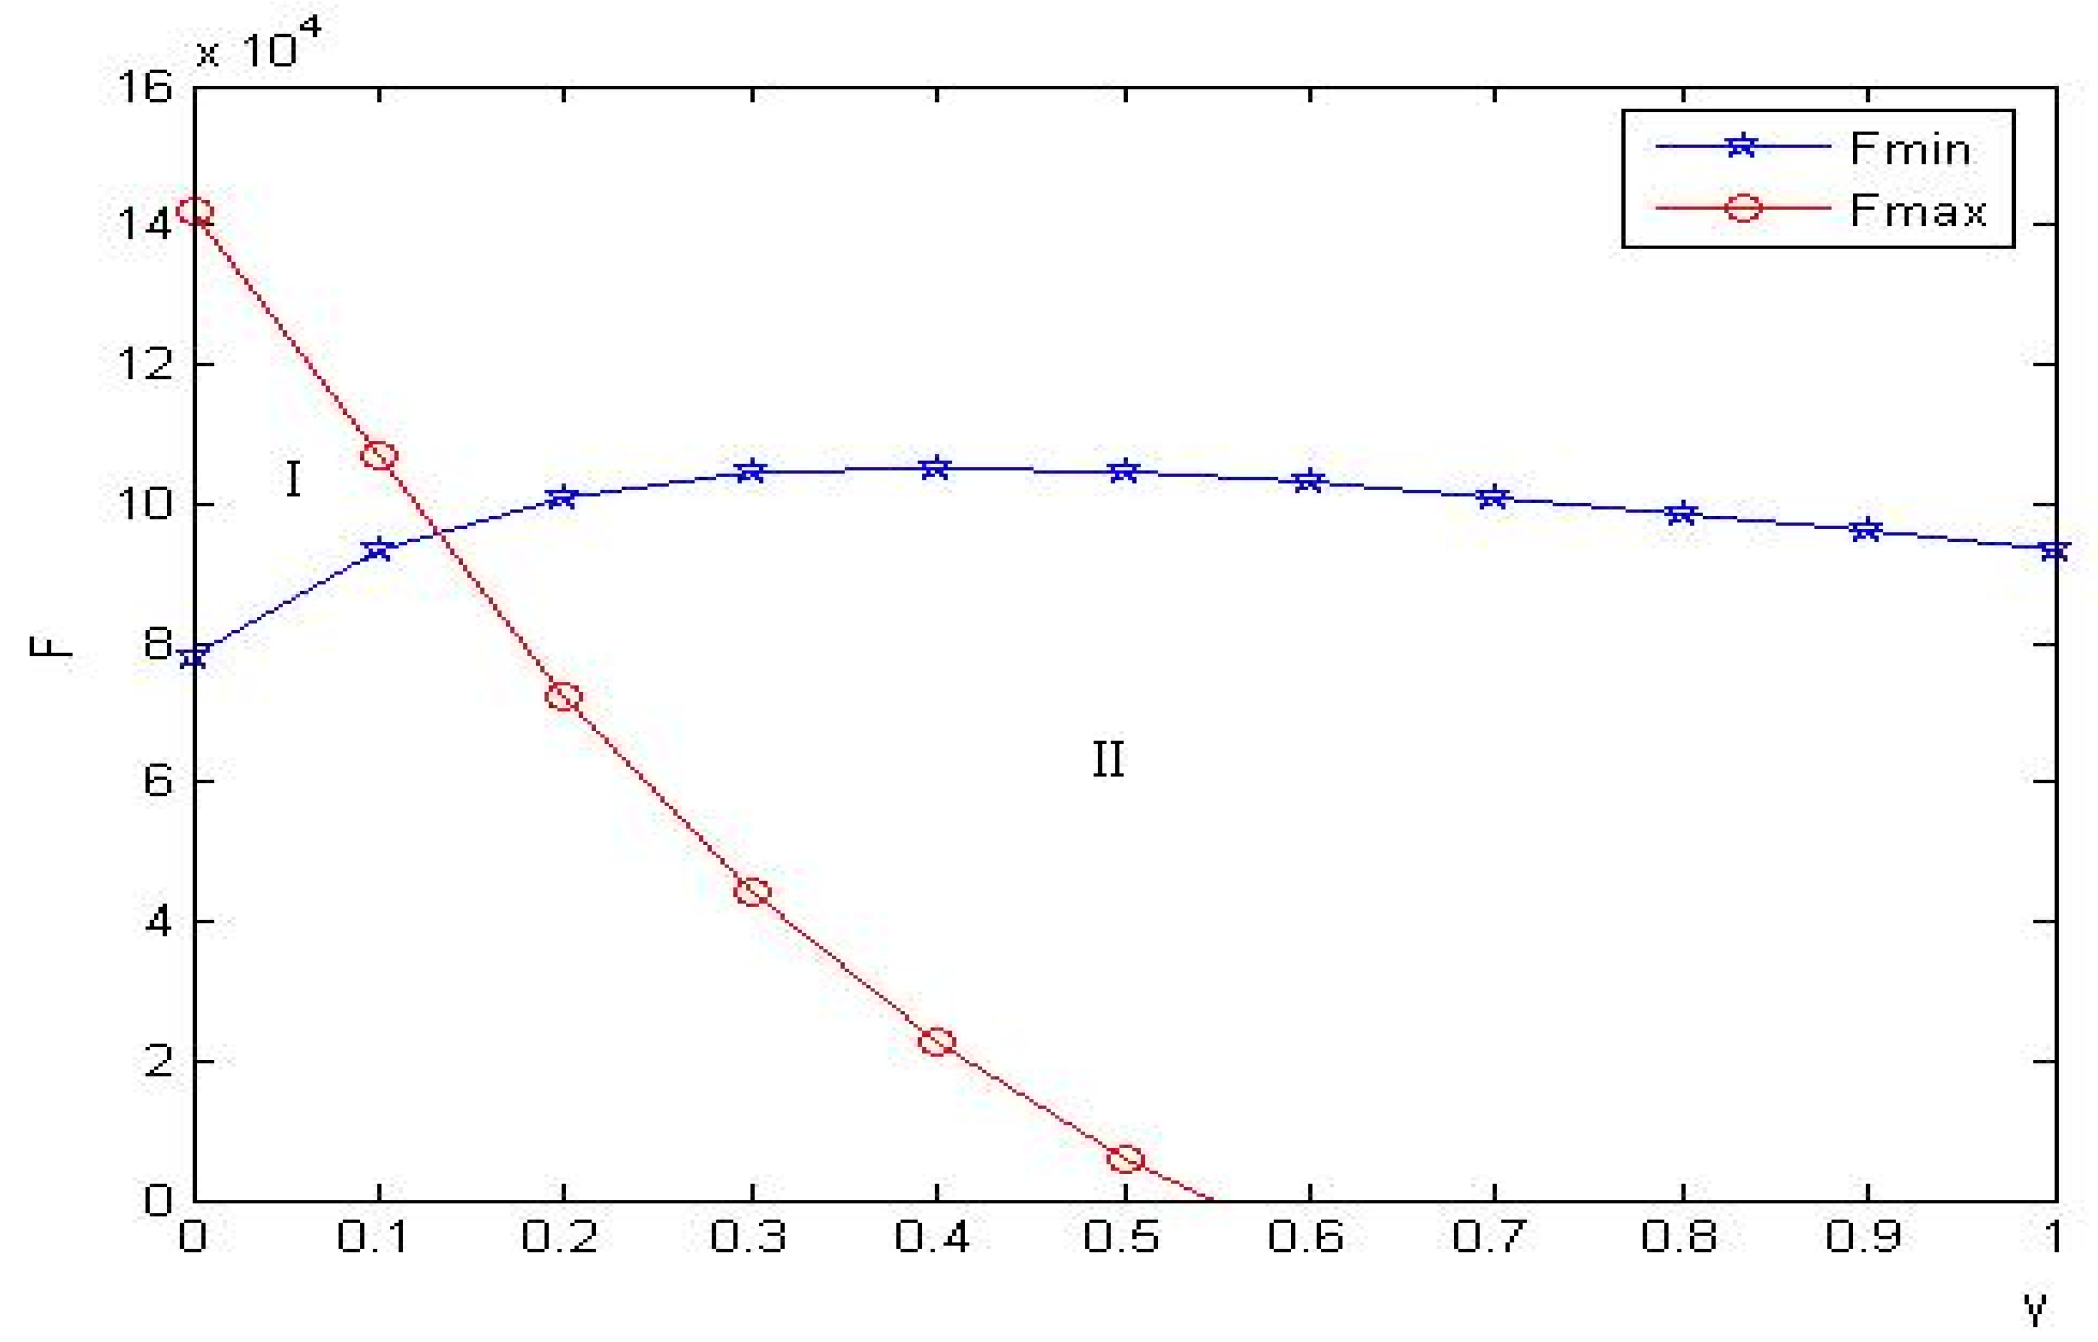
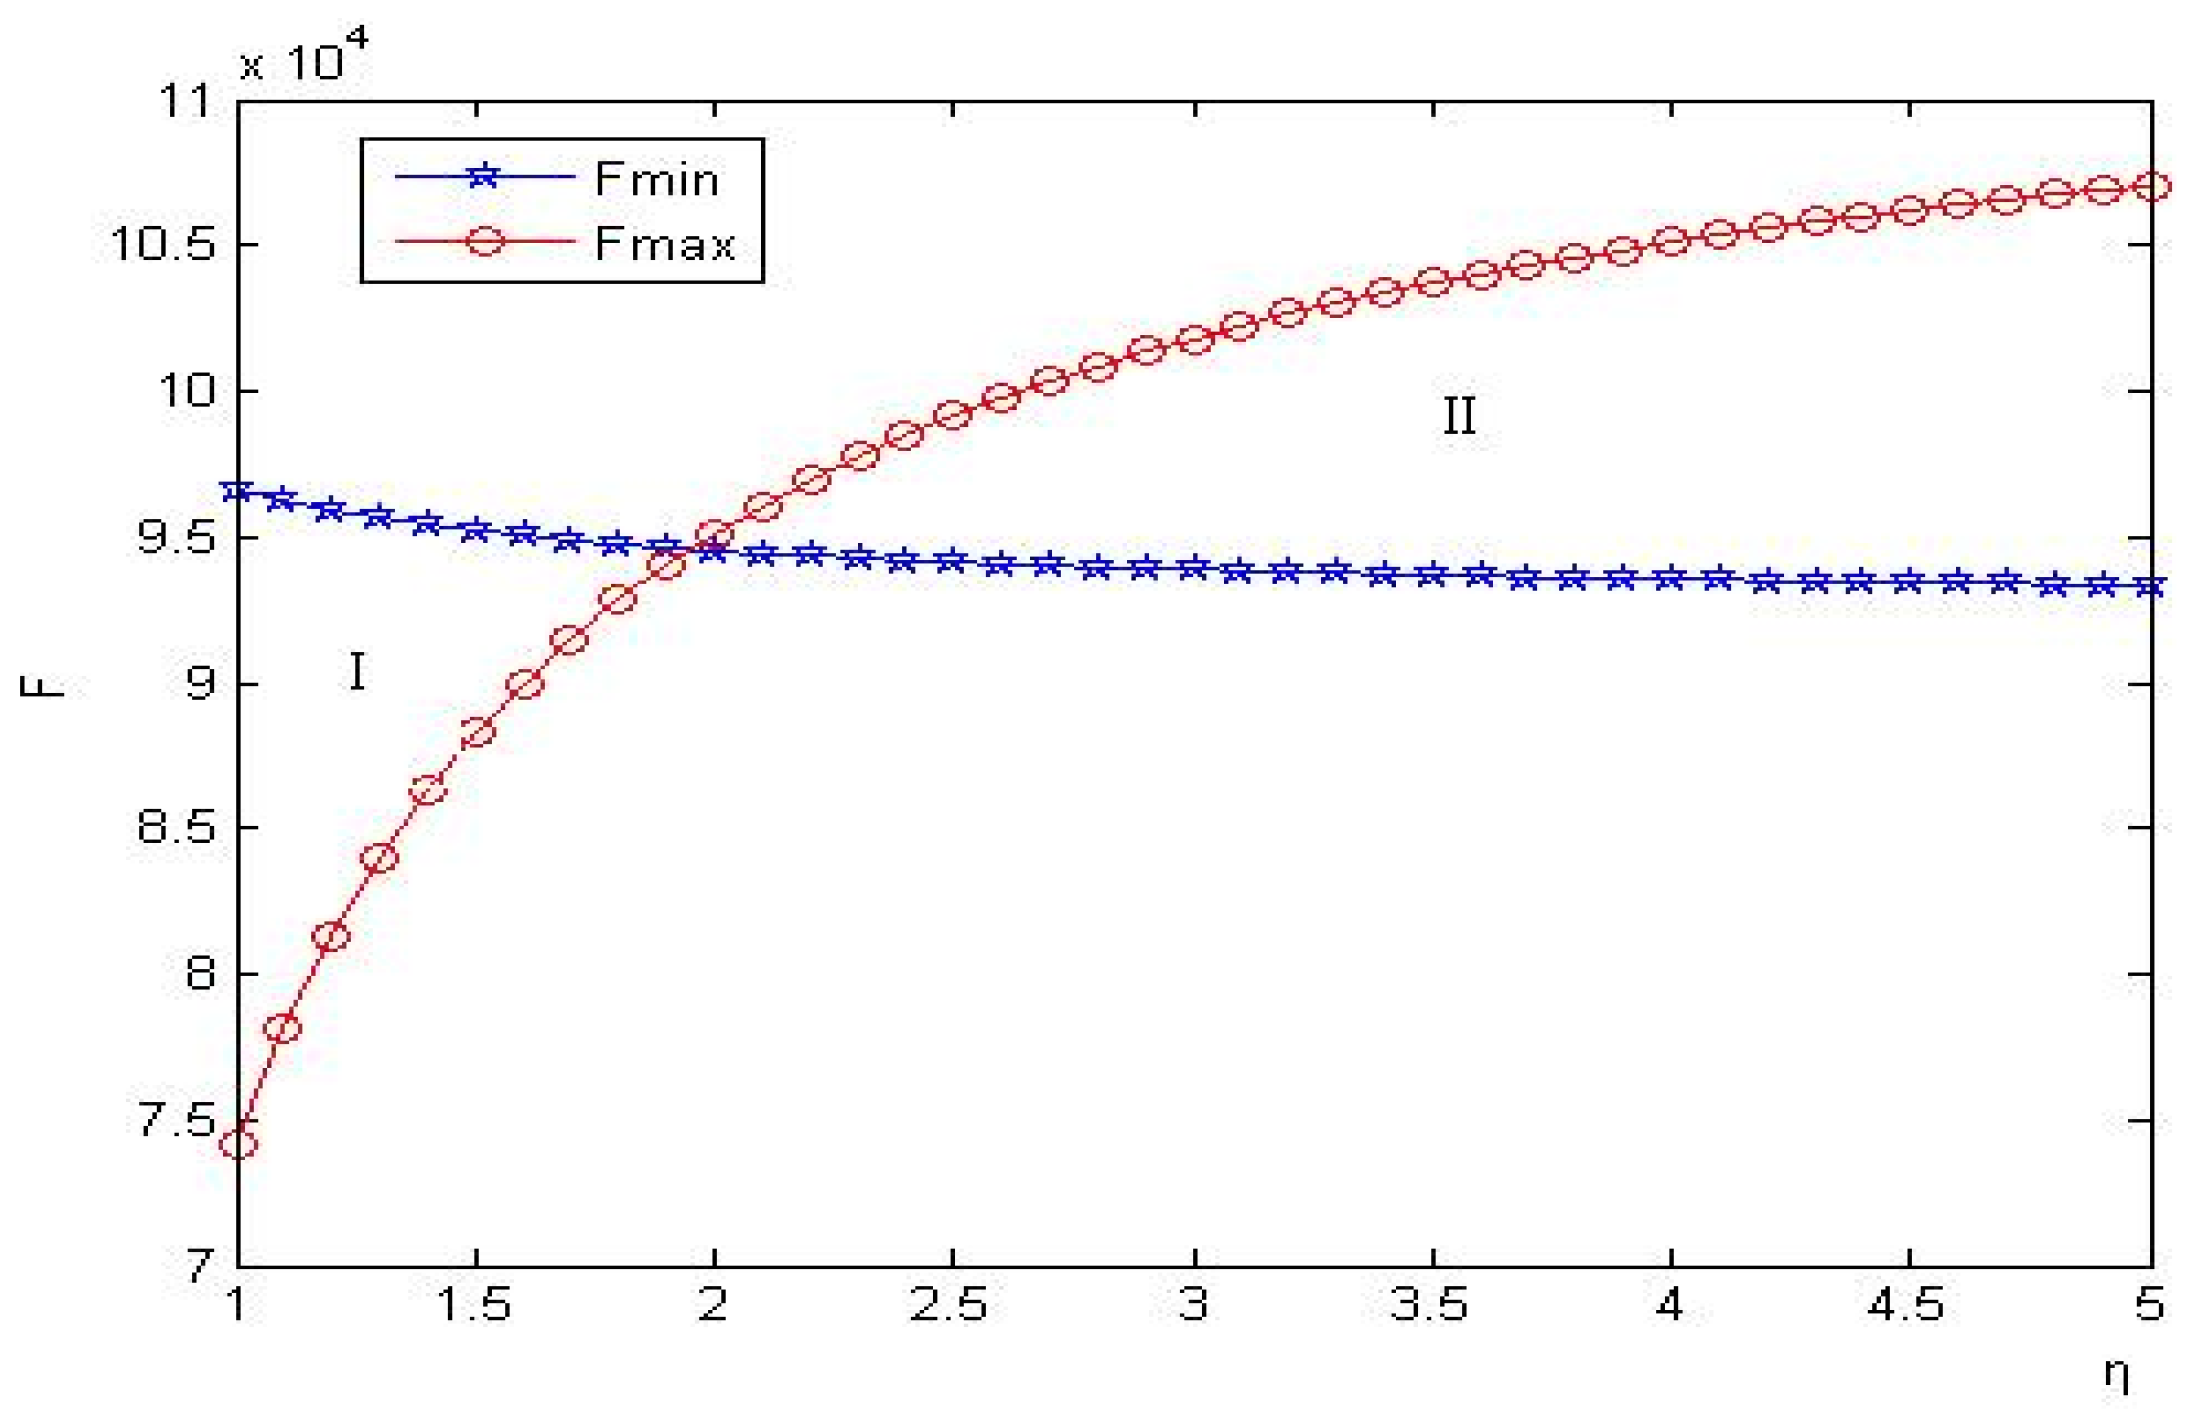
Figure 10 and Figure 11 show that in YN strategy, supply chain 1 and supply chain 2 can achieve two-part pricing contract coordination in area I, but cannot achieve two-part pricing contract coordination in area II. It shows that the two-part pricing contracts can achieve supply chain coordination when the competition intensity is weak.
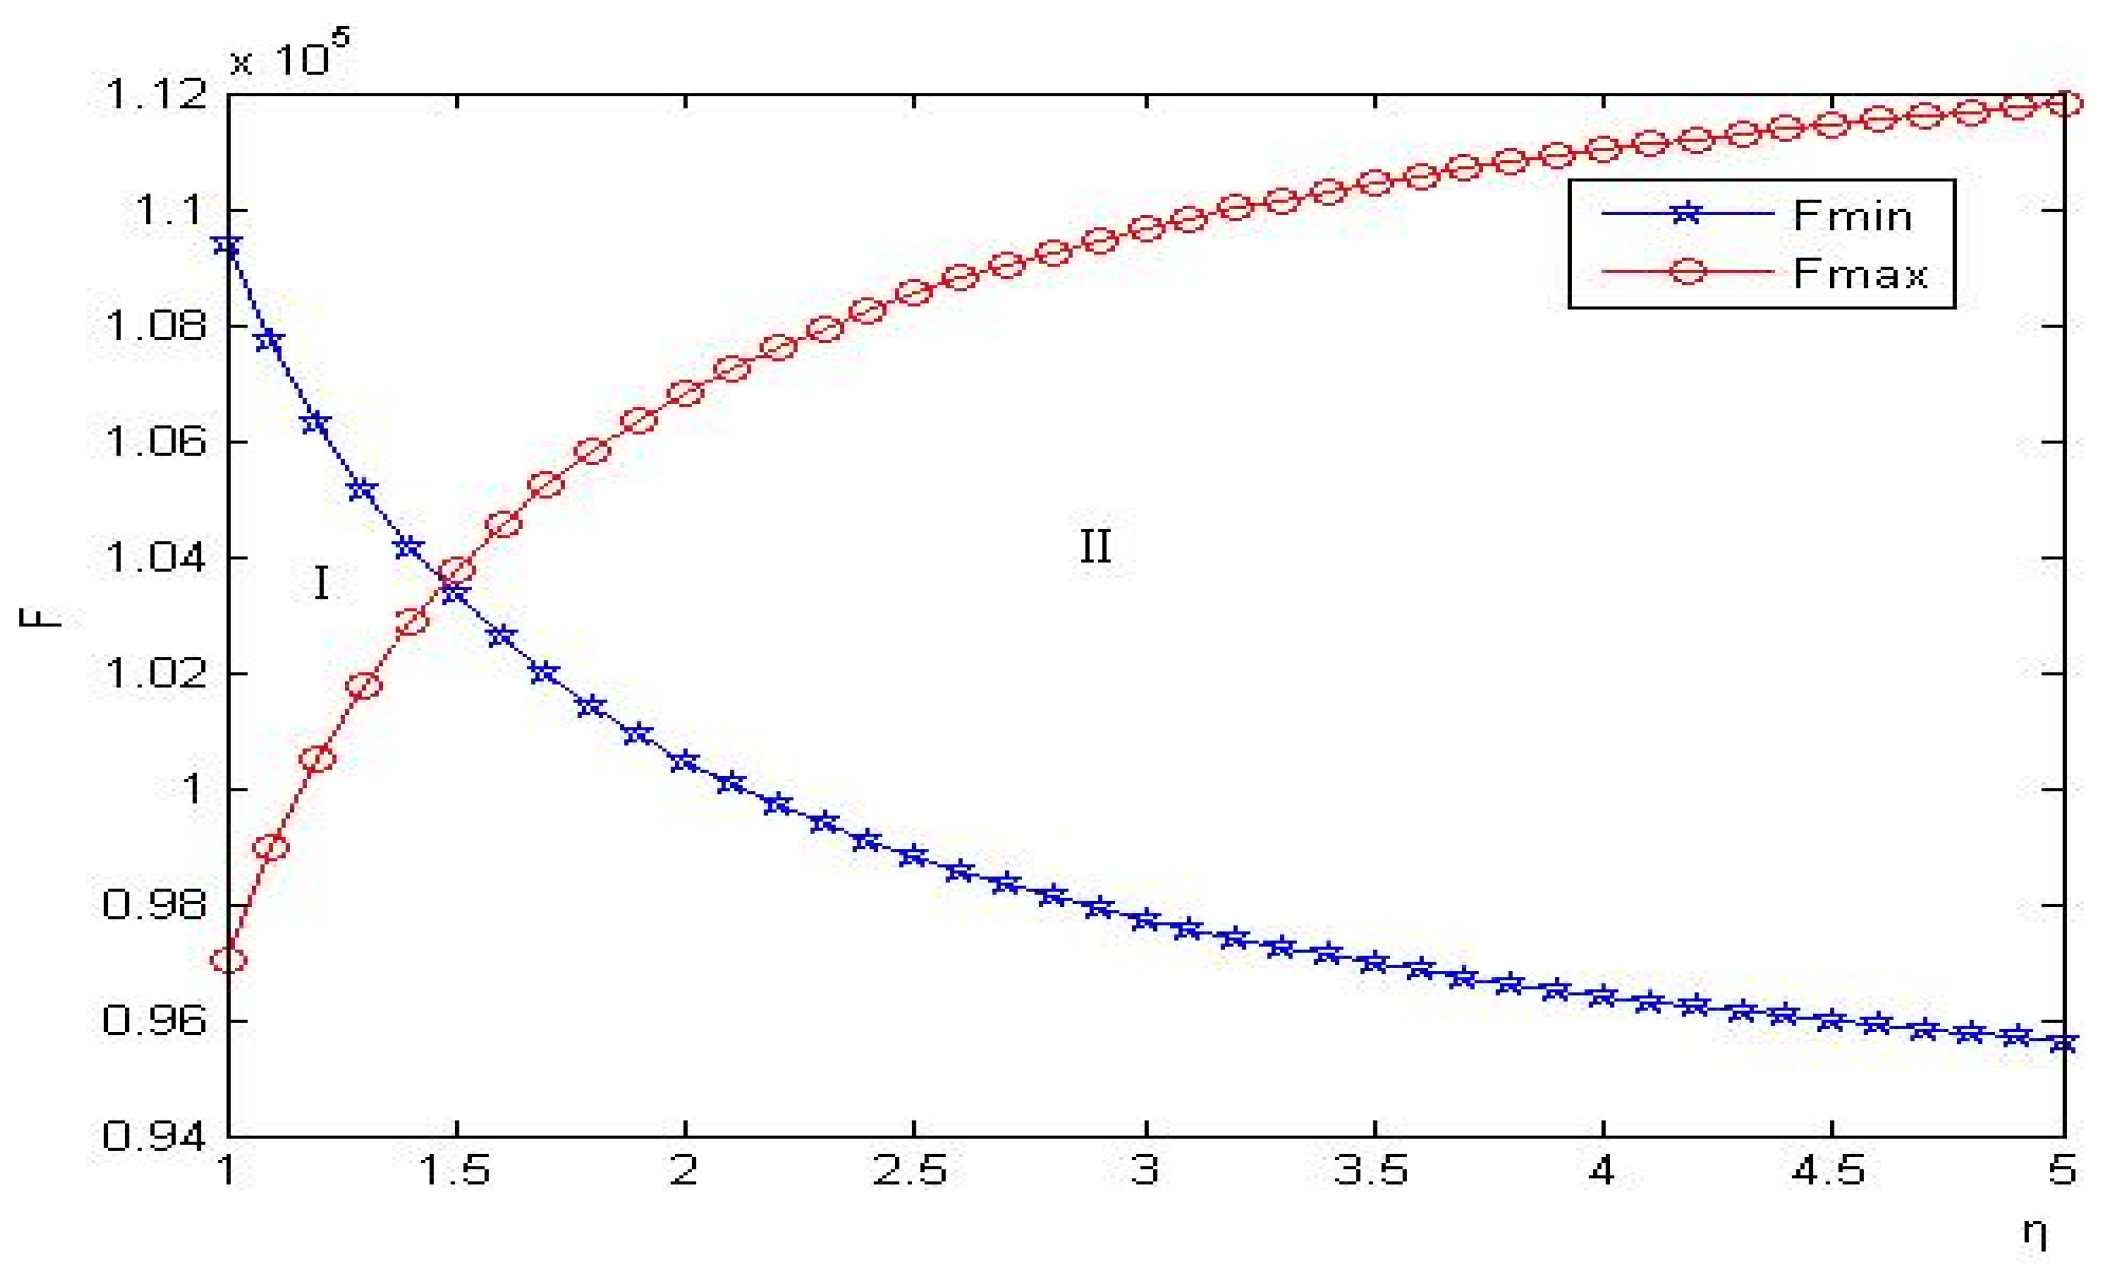
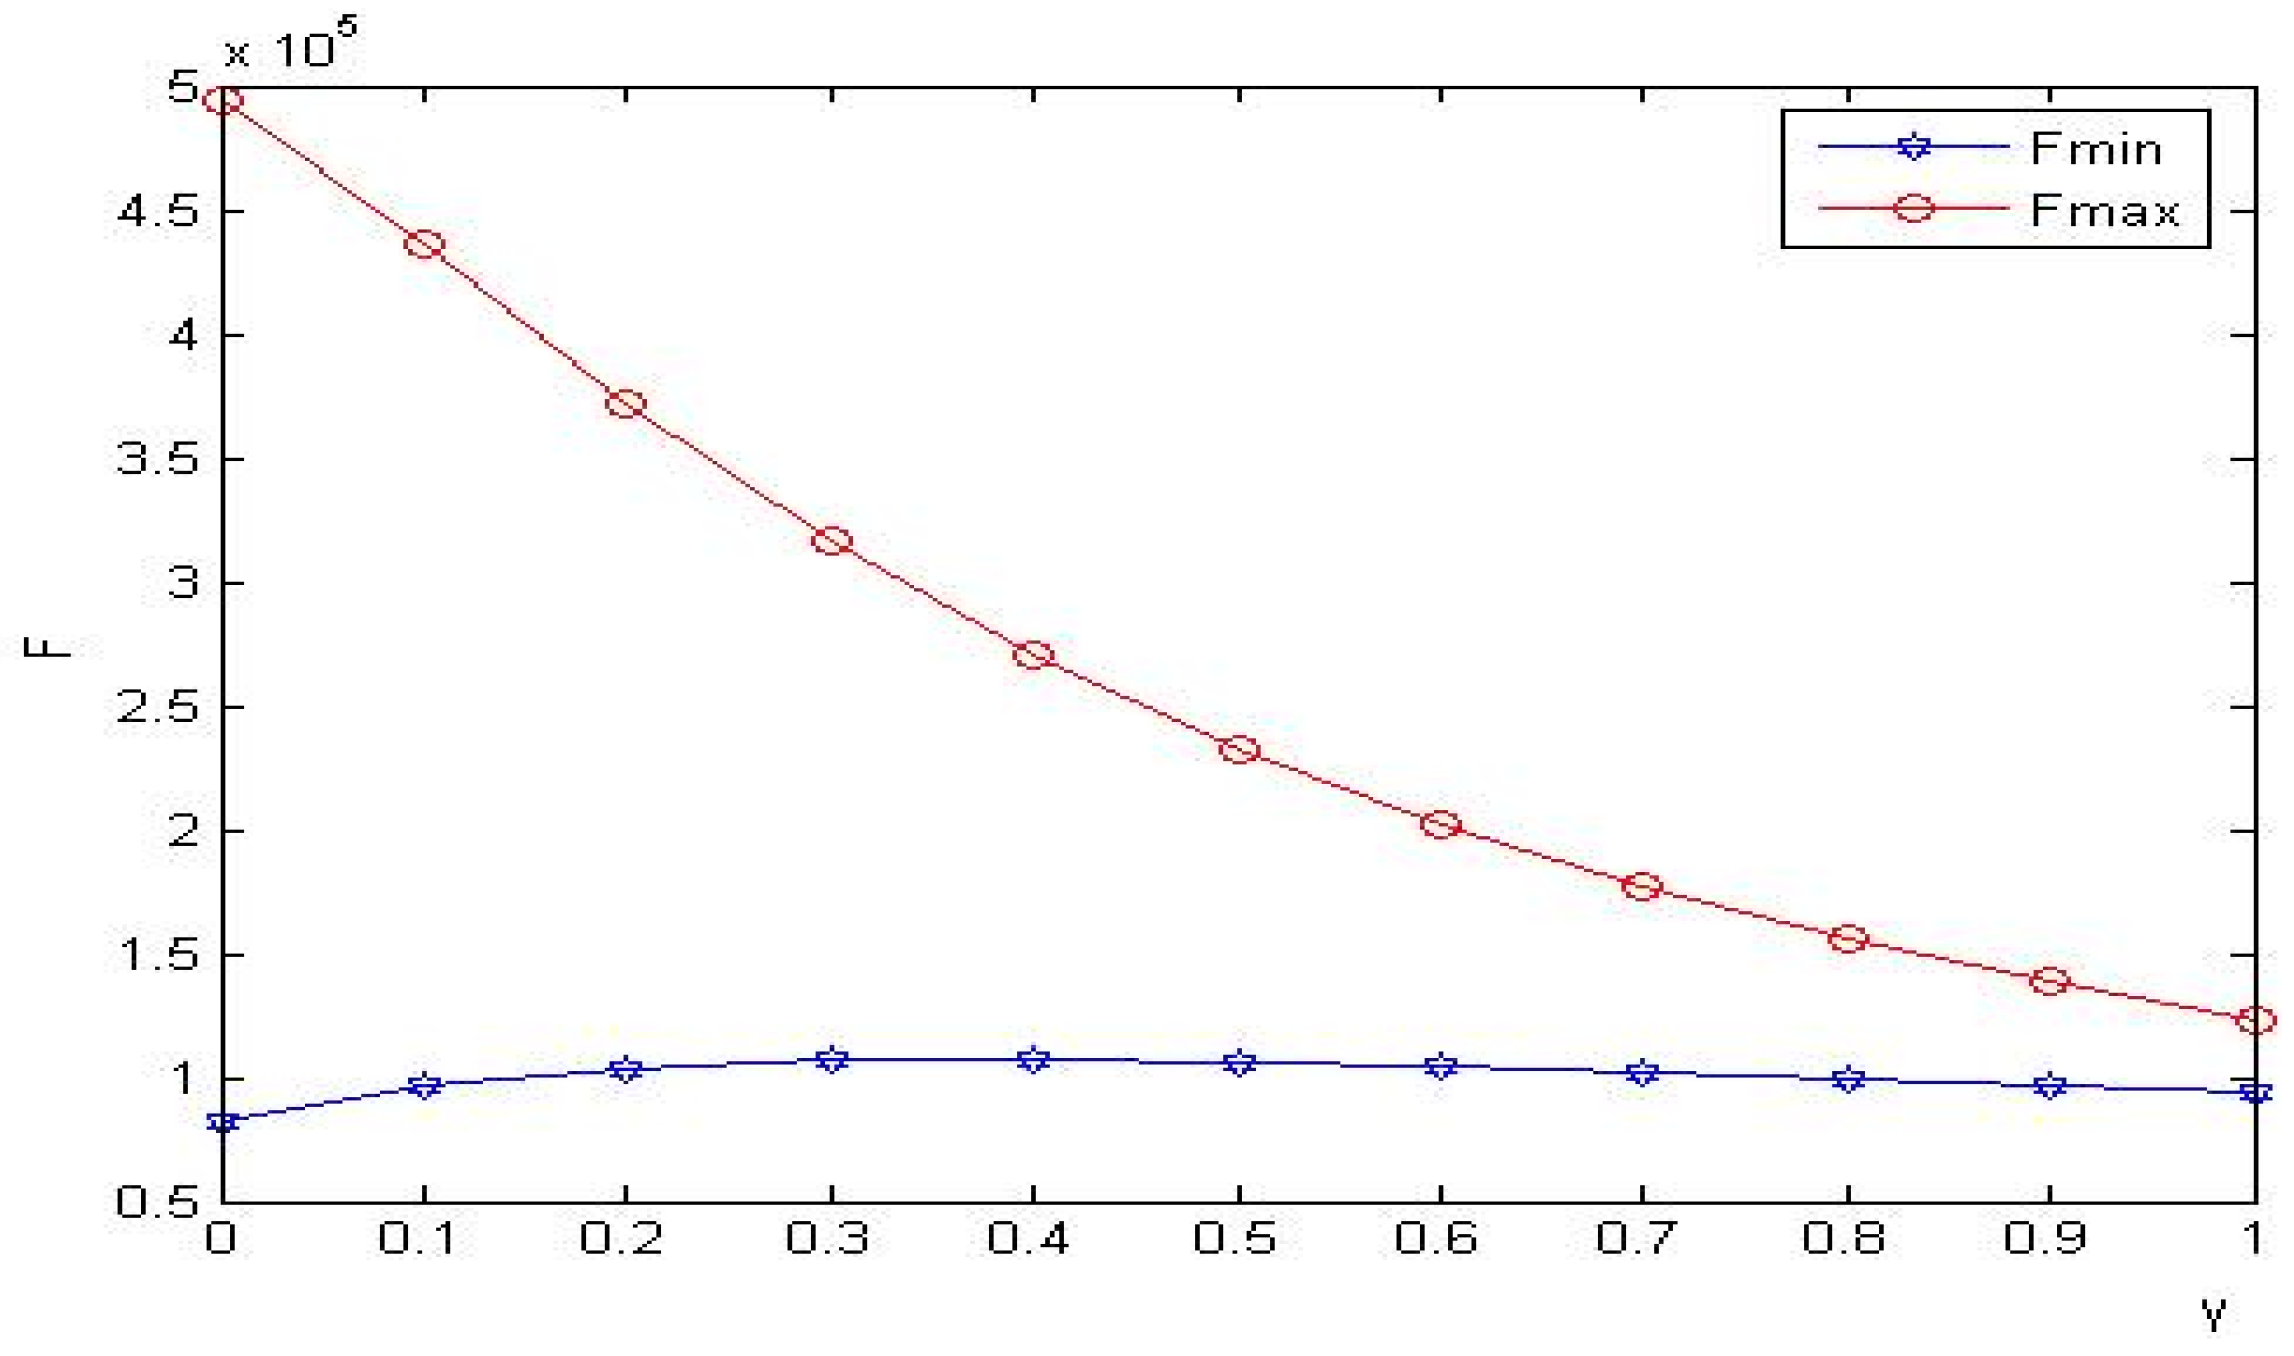
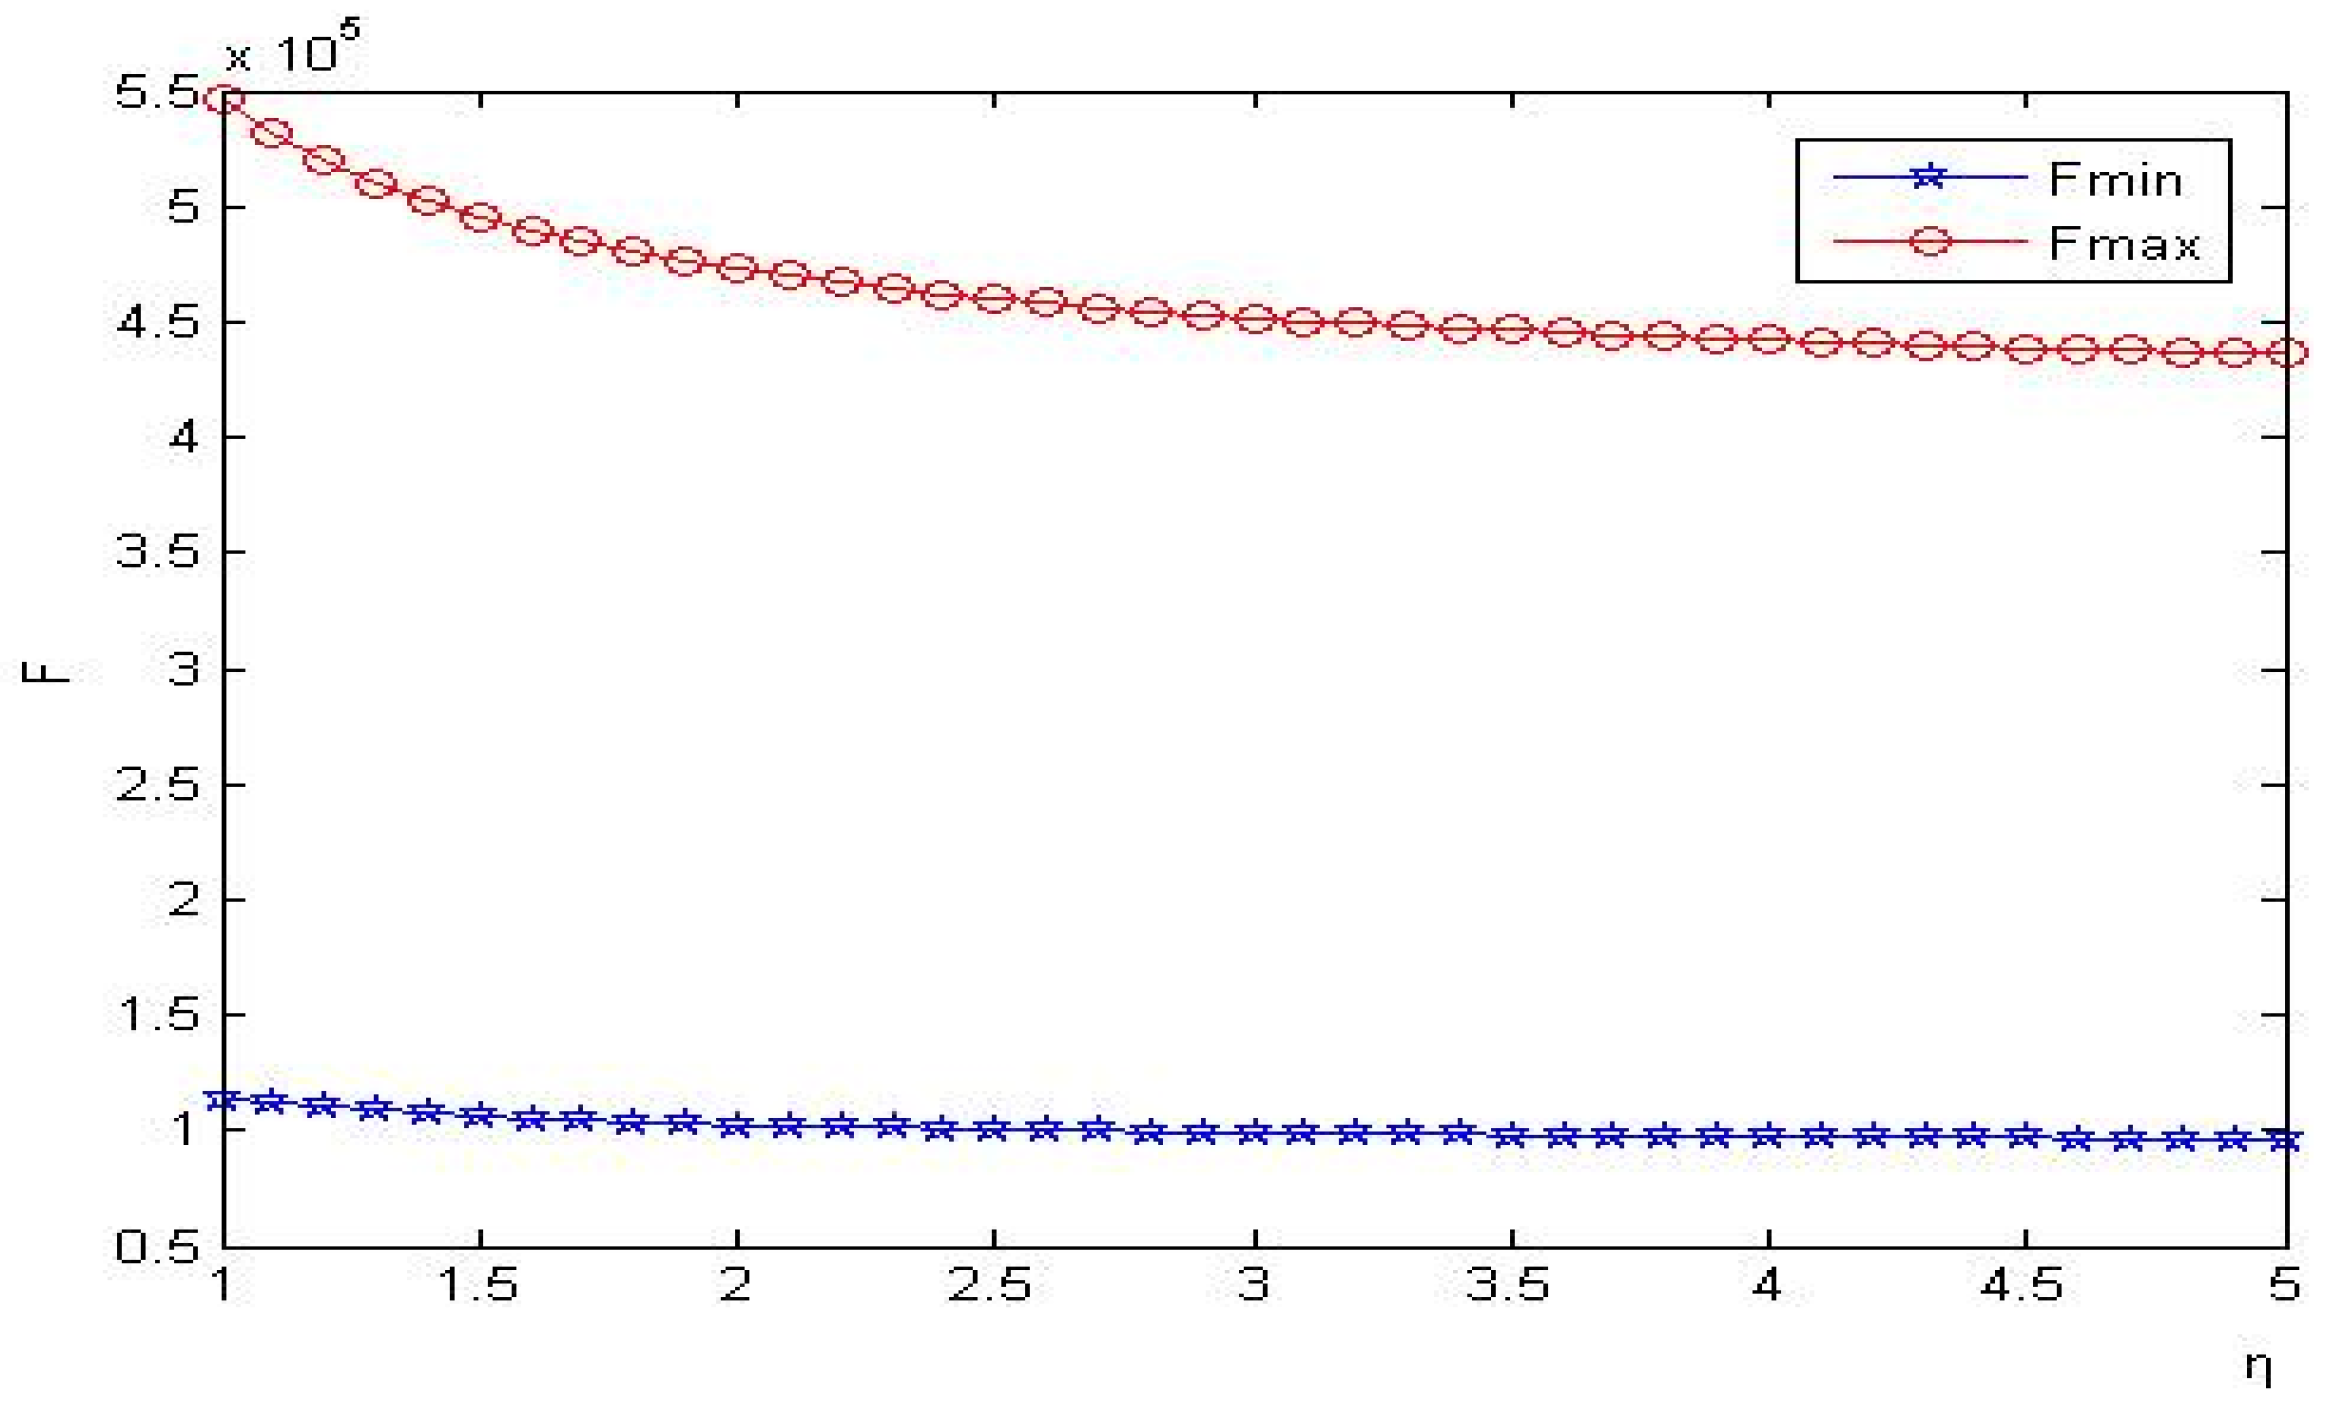
Figure 12 and Figure 13 depict that in YN strategy, supply chain 1 and supply chain 2 cannot achieve two-part pricing contract coordination in area I, but can achieve in area II. It demonstrates that when the green R&D cost coefficient is high, two-part pricing contracts can achieve supply chain coordination.
7. Conclusions
7.1. Theoretical Results
This paper investigates the optimal selection strategy of green product R&D and the impact of price competition and green R&D costs on prices, green levels, and enterprise profits in competitive supply chains, and coordinate the optimal selection strategy by two-part pricing contracts. The main theoretical results are as follows:
- The green R&D cost coefficient and price competition intensity have a negative impact on the wholesale price, the retail price, and the green level in three types of green product R&D strategies. When both competing supply chains conduct green product R&D, the wholesale price, the retail price and the green level are the highest; when neither competing supply chain conducts green product R&D, the wholesale price and the retail price are the lowest.
- In competitive supply chain, the green R&D cost coefficient has a negative impact on manufacturers’ and retailers’ profits, and green product R&D can increase supply chain enterprises’ profits within certain conditions. The manufacturer, as the dominant enterprise, has higher profit than the retailer as follower.
- If supply chain 2 does not conduct green product R&D, when , the optimal choice for supply chain 1 is to conduct green product R&D. When supply chain 2 conducts green product R&D, the optimal choice for supply chain 1 is to conduct green product R&D.
- In the case where only one supply chain conducts green product R&D, only when the competition intensity is weak or the green R&D cost coefficient is high, two-part pricing contracts can be used to achieve supply chain coordination. Then the fixed cost of supply chain 1 satisfies:, and the fixed cost of supply chain 2 satisfies:.
- In the case where both competing supply chain conduct green product R&D. Regardless of competition intensity and green R&D cost, two-part pricing contracts can achieve supply chain coordination. Then the fixed cost of supply chain i satisfies: .
7.2. Managerial Implications
Given the above theoretical results, there are the following important management implications to guide enterprises and governments to make more reasonable decisions in the operation management of sustainable supply chains.
- In the context of chain-to-chain competition, the intensity of competition and the cost of green product R&D will affect product prices, green levels, and enterprise profits. In order to obtain greater benefits, on the one hand, enterprises should expand the differentiation with similar products through green product R&D and technological innovation to improve product competitiveness. On the other hand, enterprises should increase investment in technology and personnel, improve the level and efficiency of green product R&D, and reduce the cost of green product R&D.
- Enterprises should consider the selection strategies of competitors in the market to choose green product R&D strategies. Green product R&D is not always the optimal strategy. It can be seen from the research results that it is optimal to choose green product R&D only when the green R&D cost meets certain conditions when competitors do not conduct green product R&D.
- Green product R&D is significant to the sustainable development of the environment. Supply chain enterprises will hesitate the increasing market demand for green products and the huge green R&D costs. In order to reduce the cost and risk of green product R&D of enterprises, the government should adopt subsidy strategies of green products, and green R&D cost shoud share among supply chain enterprises.
- In YN strategy, the two-part pricing contract can achieve supply chain coordination only when the competition intensity is low or the green R&D cost is high. Therefore, in the actual operation process, according to the degree of competition intensity and green R&D cost, managers can explore other contracts such as revenue sharing contracts, cost sharing contracts to achieve supply chain coordination.
7.3. Future Research
Our research provides some strategic references for sustainable competitive supply chain to select green product R&D, but there are some limitations due to some assumptions, and these limitations leave room for future research. For example, we assume that demand is linear and price competition is considered. In reality, the demand function is very complex; it may be nonlinear and be affected by both price competition and green level competition. We will extend the demand function to other forms. The two-part pricing contract to coordinate the supply chain must meet certain conditions in our model. In the future, we will consider the cost-sharing contract and the revenue-sharing contract to coordinate the supply chain. In addition, the impact of government subsidies and power structure on the choice of green product R&D strategies, which is also our future research direction.
Author Contributions
Q.F. is in charge of conceptualization, methodology, formal analysis, and writing-review & editing; T.L. is in charge of data curation, software, and writing-review & editing. All authors have read and agreed to the published version of the manuscript.
Funding
This paper was partly funded by: (i) Philosophy and Social Science Major Theoretical and Practical Issues Research Project of Shaanxi Province, grant number:2022ND0177; (ii) Support Program Funded Project of Xi’an University of Finance and Economics, grant number: 17FCJH04.
Institutional Review Board Statement
Not applicable.
Informed Consent Statement
Not applicable.
Data Availability Statement
Not applicable.
Conflicts of Interest
The authors declare no conflict of interest.
Appendix A
Proof of Theorem 1.
According to , and , we can obtain that and decrease with the increase of and . By , and , we can obtain that and decrease with the increase of and when .
Then, Theorem 1 is proven. □
Proof of Theorem 2.
,
,
, ,
, ,,,, ,. We can obtain that all decrease with the increase of and , ,, and decrease with the increase of .
(2) and , we can obtain , we can obtain . From , , that is, . From , we can obtain .
Then, Theorem 2 is proven. □
Proof of Theorem 3.
(1) From , , , , , , we can obtain and decrease with the increase of and . and decrease with the increase of and .
(2) From , we can obtain , that is, .
Then, Theorem 3 is proven. □
Proof of Theorem 4.
From , we can obtain , that is . From , we can obtain, that is.
Then, Theorem 4 is proven. □
Proof of Theorem 5.
From , we can obtain that is . From , we can obtain , that is . □
Then, Theorem 5 is proven. □
Proof of Theorem 6.
From , we can obtain . From Theorem 4 and Theorem 5, if .
Then, Theorem 6 is proven. □
References
- Chekima, B.; Wafa, S.A.W.S.K.; Igau, O.A.; Chekima, S.; Sondoh, S.L., Jr. Examining green consumerism motivational drivers: Does premium price and demographics matter to green purchasing? J. Clean. Prod. 2016, 112, 3436–3450. [Google Scholar] [CrossRef]
- Li, G.; Li, L.; Choi, T.M.; Sethi, S.P. Green supply chain management in Chinese firms: Innovative measures and the moderating role of quick response technology. J. Oper. Manag. 2020, 66, 958–988. [Google Scholar] [CrossRef]
- Pujari, D. Eco-innovation and new product development: Understanding the influences on market performance. Technovation 2006, 26, 76–85. [Google Scholar] [CrossRef]
- Peng, H. Optimal subsidy policy for accelerating the diffusion of green products. J. Ind. Eng. Manag. 2013, 6, 626–641. [Google Scholar] [CrossRef] [Green Version]
- Park, S.J.; Cachon, G.P.; Lai, G.; Seshadri, S. Supply chain design and carbon penalty: Monopoly vs. monopolistic competition. Prod. Oper. Manag. 2015, 24, 1494–1508. [Google Scholar]
- Song, S.; Govindan, K.; Xu, L.; Du, P.; Qiao, X. Capacity and production planning with carbon emission constraints. Transp. Res. Part E Logist. Transp. Rev. 2017, 97, 132–150. [Google Scholar] [CrossRef]
- Zhang, L.; Wang, J.; You, J. Consumer environmental awareness and channel coordination with two substitutable products. Eur. J. Oper. Res. 2015, 241, 63–73. [Google Scholar] [CrossRef]
- Dong, C.; Shen, B.; Chow, P.S.; Yang, L.; Ng, C.T. Sustainability investment under cap-and-trade regulation. Ann. Oper. Res. 2016, 240, 509–531. [Google Scholar] [CrossRef]
- Porter, M.E.; Kramer, M.R. The link between competitive advantage and corporate social responsibility. Harv. Bus. Rev. 2006, 84, 78–92. [Google Scholar]
- Luchs, M.G.; Naylor, R.W.; Irwin, J.R.; Raghunathan, R. The sustainability liability: Potential negative effects of ethicality on product preference. J. Mark. 2010, 74, 18–31. [Google Scholar] [CrossRef] [Green Version]
- Grimmer, M.; Bingham, T. Company environmental performance and consumer purchase intentions. J. Bus. Res. 2013, 66, 1945–1953. [Google Scholar] [CrossRef]
- Salimifard, K.; Raeesi, R. A green routing problem: Optimising CO2 emissions and costs from a bi-fuel vehicle fleet. Int. J. Adv. Oper. Manag. 2014, 6, 27–57. [Google Scholar]
- Deng, W.; Feng, L.; Zhao, X.; Lou, Y. Effects of supply chain competition on firms’ product sustainability strategy. J. Clean. Prod. 2020, 275, 124061. [Google Scholar] [CrossRef]
- Zhu, W.; He, Y. Green product design in supply chains under competition. Eur. J. Oper. Res. 2017, 258, 165–180. [Google Scholar] [CrossRef]
- Zhang, Q.; Zhao, Q.; Zhao, X.; Tang, L. On the introduction of green product to a market with environmentally conscious consumers. Comput. Ind. Eng. 2020, 139, 106190. [Google Scholar] [CrossRef]
- Du, P.; Yang, X.; Xu, L.; Tan, Y.; Li, H. Green design strategies of competing manufacturers in a sustainable supply chain. J. Clean. Prod. 2020, 265, 121853. [Google Scholar] [CrossRef]
- Li, X.; Li, Y. Chain-to-Chain Competition on Product Sustainability. J. Clean. Prod. 2016, 112, 2058–2065. [Google Scholar] [CrossRef]
- Ma, P.; Zhang, C.; Hong, X.; Xu, H. Pricing decisions for substitutable products with green manufacturing in a competitive supply chain. J. Clean. Prod. 2018, 183, 618–640. [Google Scholar] [CrossRef] [Green Version]
- Agi, M.A.; Yan, X. Greening products in a supply chain under market segmentation and different channel power structures. Int. J. Prod. Econ. 2020, 223, 107523. [Google Scholar] [CrossRef]
- Dong, C.; Liu, Q.; Shen, B. To be or not to be green? Strategic investment for green product development in a supply chain. Transp. Res. Part E Logist. Transp. Rev. 2019, 131, 193–227. [Google Scholar] [CrossRef]
- Li, P.; Rao, C.; Goh, M.; Yang, Z. Pricing strategies and profit coordination under a double echelon green supply chain. J. Clean. Prod. 2021, 278, 123694. [Google Scholar] [CrossRef]
- Yang, F.; Kong, J.; Liu, T.; Ang, S. Cooperation and coordination in green supply chain with R&D uncertainty. J. Oper. Res. Soc. 2022, 73, 481–496. [Google Scholar]
- Guo, S.; Choi, T.M.; Shen, B. Green product development under competition: A study of the fashion apparel industry. Eur. J. Oper. Res. 2020, 280, 523–538. [Google Scholar] [CrossRef]
- Jamali, M.B.; Rasti-Barzoki, M. A game theoretic approach for green and non-green product pricing in chain-to-chain competitive sustainable and regular dual-channel supply chains. J. Clean. Prod. 2018, 170, 1029–1043. [Google Scholar] [CrossRef]
- Wu, Y.; Zhang, X.; Chen, J. Cooperation of green R&D in supply chain with downstream competition. Comput. Ind. Eng. 2021, 160, 107571. [Google Scholar]
- Zhu, X.; Liu, K.; Liu, J.; Yan, A. Is government R&D subsidy good for BEV supply chain? The challenge from downstream competition. Comput. Ind. Eng. 2022, 165, 107951. [Google Scholar]
- Li, W.; Chen, J. Pricing and quality competition in a brand-differentiated supply chain. Int. J. Prod. Econ. 2018, 202, 97–108. [Google Scholar] [CrossRef]
- Wang, W.; Fan, L.; Ma, P.; Zhang, P.; Lu, Z. Reward-penalty mechanism in a closed-loop supply chain with sequential manufacturers’ price competition. J. Clean. Prod. 2017, 168, 118–130. [Google Scholar] [CrossRef]
- Wang, W.; Liu, X.; Zhang, W.; Gao, G.; Zhang, H. Coordination of a green supply chain with one manufacturer and two competing retailers under different power structures. Discret. Dyn. Nat. Soc. 2019, 2019, 3453850. [Google Scholar] [CrossRef] [Green Version]
- Yu, Y.; Han, X.; Hu, G. Optimal production for manufacturers considering consumer environmental awareness and green subsidies. Int. J. Prod. Econ. 2016, 182, 397–408. [Google Scholar] [CrossRef] [Green Version]
- Zheng, Y.; Shu, T.; Wang, S.; Chen, S.; Lai, K.K.; Gan, L. Analysis of product return rate and price competition in two supply chains. Oper. Res. 2018, 18, 469–496. [Google Scholar] [CrossRef]
- Guan, Z.; Zhang, X.; Zhou, M.; Dan, Y. Demand information sharing in competing supply chains with manufacturer-provided service. Int. J. Prod. Econ. 2020, 220, 107450. [Google Scholar] [CrossRef]
- Hafezalkotob, A. Competition of two green and regular supply chains under environmental protection and revenue seeking policies of government. Comput. Ind. Eng. 2015, 82, 103–114. [Google Scholar] [CrossRef]
- Li, B.; Zhu, M.; Jiang, Y.; Li, Z. Pricing policies of a competitive dual-channel green supply chain. J. Clean. Prod. 2016, 112, 2029–2042. [Google Scholar] [CrossRef]
- Barman, A.; Das, R.; De, P.K.; Sana, S.S. Optimal pricing and greening strategy in a competitive green supply chain: Impact of government subsidy and tax policy. Sustainability 2021, 13, 9178. [Google Scholar] [CrossRef]
- Wang, J.; Wan, Q.; Yu, M. Green supply chain network design considering chain-to-chain competition on price and carbon emission. Comput. Ind. Eng. 2020, 145, 106503. [Google Scholar] [CrossRef]
- Chen, X.; Wang, X.; Zhou, M. Firms’ green R&D cooperation behavior in a supply chain: Technological spillover, power and coordination. Int. J. Prod. Econ. 2019, 218, 118–134. [Google Scholar]
- Hong, Z.; Wang, H.; Yu, Y. Green product pricing with non-green product reference. Transp. Res. Part E Logist. Transp. Rev. 2018, 115, 1–15. [Google Scholar] [CrossRef]
- Ranjan, A.; Jha, J.K. Pricing and coordination strategies of a dual-channel supply chain considering green quality and sales effort. J. Clean. Prod. 2019, 218, 409–424. [Google Scholar] [CrossRef]
- Wang, J.; Shin, H. The impact of contracts and competition on upstream innovation in a supply chain. Prod. Oper. Manag. 2015, 24, 134–146. [Google Scholar] [CrossRef]
- Zhang, C.; Liu, Y.; Han, G. Two-stage pricing strategies of a dual-channel supply chain considering public green preference. Comput. Ind. Eng. 2021, 151, 106988. [Google Scholar] [CrossRef]
- Zhang, X.; Yousaf, H.A.U. Green supply chain coordination considering government intervention, green investment, and customer green preferences in the petroleum industry. J. Clean. Prod. 2020, 246, 118984. [Google Scholar] [CrossRef]
- Xu, X.; He, P.; Xu, H.; Zhang, Q. Supply chain coordination with green technology under cap-and-trade regulation. Int. J. Prod. Econ. 2017, 183, 433–442. [Google Scholar] [CrossRef]
- Basiri, Z.; Heydari, J. A mathematical model for green supply chain coordination with substitutable products. J. Clean. Prod. 2017, 145, 232–249. [Google Scholar] [CrossRef] [Green Version]
- Heydari, J.; Govindan, K.; Basiri, Z. Balancing price and green quality in presence of consumer environmental awareness: A green supply chain coordination approach. Int. J. Prod. Res. 2021, 59, 1957–1975. [Google Scholar] [CrossRef]
- Gao, J.; Xiao, Z.; Wei, H. Competition and coordination in a dual-channel green supply chain with an eco-label policy. Comput. Ind. Eng. 2021, 153, 107057. [Google Scholar] [CrossRef]
- Hong, Z.; Guo, X. Green product supply chain contracts considering environmental responsibilities. Omega 2019, 83, 155–166. [Google Scholar] [CrossRef]
- Liu, L.; Feng, L.; Jiang, T.; Zhang, Q. The impact of supply chain competition on the introduction of clean development mechanisms. Transp. Res. Part E Logist. Transp. Rev. 2021, 155, 102506. [Google Scholar] [CrossRef]
- Pi, Z.; Fang, W.; Zhang, B. Service and pricing strategies with competition and cooperation in a dual-channel supply chain with demand disruption. Comput. Ind. Eng. 2019, 138, 106130. [Google Scholar] [CrossRef]
Figure 1.
The profit of manufacturer 1 in three types of green R&D strategies.

Figure 2.
The profit of retailer 1 in three types of green R&D strategies.

Figure 3.
The profit of manufacturer 2 in three types of green R&D strategies.

Figure 4.
The benefit of retailer 2 in three types of green R&D strategies.

Figure 5.
The impact of the green R&D cost coefficient on the profit of manufacturer 1.

Figure 6.
The impact of the green R&D cost coefficient on the profit of the retailer 1.

Figure 7.
The impact of green R&D cost coefficient on the profit of manufacturer 2.

Figure 8.
The impact of green R&D cost coefficient on the profit of retailer 2.

Figure 9.
The profits of supply chain in three types of green product R&D strategies.

Figure 10.
The fixed fee and competition intensity of supply chain 1 in YN strategy.

Figure 11.
The fixed fee and competition intensity of supply chain 2 in YN strategy.

Figure 12.
The fixed fee and green R&D cost coefficient of supply chain 1 in YN strategy.

Figure 13.
The fixed fee and green R&D cost coefficient of supply chain 2 in YN strategy.

Figure 14.
The fixed fee and competition intensity in YY strategy.

Figure 15.
The fixed fee and the green R&D cost coefficient in YY strategy.


Table 1.
The notations used in this paper.
| Notations | Descriptions |
|---|---|
| denote supply chain 1 and supply chain 2 respectively | |
| the market demand of supply chain i | |
| the potential market demand | |
| α | the sensitivity coefficient of customers to the retail price of product |
| γ | the competition intensity of the retail price. |
| β | the sensitivity coefficient of the green level |
| η | the green R&D cost coefficient |
| NN | neither supply chain conducts green product R&D |
| YN | only one supply chain conducts green product R&D |
| YY | both supply chains conduct green product R&D |
| YNJ | centralized Scenario of YN |
| YN* | decentralized Scenario of YN |
| YYJ | centralized Scenario of YY |
| YY* | decentralized Scenario of YY |
| F | fixed fee |
Publisher’s Note: MDPI stays neutral with regard to jurisdictional claims in published maps and institutional affiliations. |
© 2022 by the authors. Licensee MDPI, Basel, Switzerland. This article is an open access article distributed under the terms and conditions of the Creative Commons Attribution (CC BY) license (https://creativecommons.org/licenses/by/4.0/).
Share and Cite
MDPI and ACS Style
Feng, Q.; Liu, T. Selection Strategy and Coordination of Green Product R&D in Sustainable Competitive Supply Chain. Sustainability 2022, 14, 8884. https://0-doi-org.brum.beds.ac.uk/10.3390/su14148884
AMA Style
Feng Q, Liu T. Selection Strategy and Coordination of Green Product R&D in Sustainable Competitive Supply Chain. Sustainability. 2022; 14(14):8884. https://0-doi-org.brum.beds.ac.uk/10.3390/su14148884
Chicago/Turabian StyleFeng, Qinghua, and Tong Liu. 2022. "Selection Strategy and Coordination of Green Product R&D in Sustainable Competitive Supply Chain" Sustainability 14, no. 14: 8884. https://0-doi-org.brum.beds.ac.uk/10.3390/su14148884
Note that from the first issue of 2016, this journal uses article numbers instead of page numbers. See further details here.