
Customized Investment Decisions for New and Remanufactured Products Supply Chain Based on 3D Printing Technology


1
School of Business Administration, Hunan University, Changsha 410082, China
2
School of Economics and Trade, Hunan University, Changsha 410006, China
*
Authors to whom correspondence should be addressed.
Sustainability 2022, 14(5), 2502; https://0-doi-org.brum.beds.ac.uk/10.3390/su14052502
Submission received: 18 January 2022
/
Revised: 11 February 2022
/
Accepted: 18 February 2022
/
Published: 22 February 2022
(This article belongs to the Special Issue Green and Sustainable Supply Chains)
Abstract
:Three-dimensional printing and customized products are gradually emerging, and many manufacturers use 3D printing technology to customize products according to the individual needs of consumers. We focus on the differential pricing of new products and remanufactured products after being customized by 3D printing and the profit distribution of supply chain members. Through building the Stackelberg game model led by the manufacturer, we discuss how supply chain members should make investment decisions about customized new and customized remanufactured products with the goal of maximizing the manufacturer’s profit when there are two models of remanufacturing by the OEM and remanufacturing by the retailer. Finally, through the simulation analysis of MATLAB, we explain how the manufacturer and the retailer make decisions under the influence of customization sensitivity coefficient and customization cost. We also analyze the impact of relevant factors on the level of customization effort and whether supply chain members are suitable for custom production. We found that when the level of customization effort is relatively low, both the manufacturer and the retailer should choose the manufacturer to complete the customization process. However, when the level of customization effort is relatively high the manufacturer can transfer the customization process to the retailer, but the retailer should still let the manufacturer lead the customization process for his own profit maximization.
1. Introduction
In recent years, the development of remanufacturing has received strong support from the Chinese government, and in 2009, AQSIQ (the General Administration of Quality Supervision, Inspection and Quarantine) and other departments organized the scheme “exchange old products for remanufactured products” to encourage people to exchange their used products for remanufactured products [1]. In addition, China will vigorously develop a circular economy during the 14th Five-Year-Plan period, and by 2025, circular production methods will be fully implemented in China [2], which shows that the remanufacturing industry is developing rapidly. In foreign countries, Lund Robert T., an American scholar, first proposed the concept of remanufacturing in 1984 [3]. He believed that through remanufacturing, damaged products could be restored to a state where they could be used again in an economical and environmentally friendly way. The remanufacturing industry in Europe and the United States started early and achieved large scale, and now has involved in many fields. In contrast, China’s remanufacturing industry started late and there are still some problems in the development process. Chinese consumers lack sufficient knowledge of remanufactured products, and the remanufacturing industry lacks key technology, logistics systems and policy environments, which limits its further development [4].
Our research is mainly motivated by the following facts. On the one hand, China strongly supports the development of 3D printing technology. In February 2015, the Ministry of Industry and Information Technology, the Development and Reform Commission and the Ministry of Finance jointly issued a document stating that the development of 3D printing has been elevated to the level of national strategy, making an overall plan and layout for the development of 3D printing technology in China’s manufacturing industry [5]. Academically, 3D printing technology is known as Rapid Prototyping Manufacturing (RPM), and from a manufacturing technology perspective, 3D printing technology is also known as Additive Manufacturing (AM). Based on a designed 3D model file, 3D printing is technology that uses different printing techniques and printing methods to enable the manufacture of objects by stacking specific materials layer by layer. In real life, scientists have used 3D printing technology applications in medicine to print nose braces, teeth and so on. Continuum Fashion, an American design studio, has launched their first line of 3D printed shoes that can actually be worn [6]. Meanwhile, Nike, a well-known sports brand, also released the world’s first pair of soccer shoes printed through 3D printing technology [7]. In addition, the world’s first printed car called Urbee2 has also been released, and all its parts are made through 3D printing technology, while its printing material is mostly plastic, where the floor and engine are printed out of steel material [8].
On the other hand, with the continuous development of economy and technology, people’s demand for quality of life is also improving; standardized products in many aspects can no longer meet the needs of the majority of consumers, and customization has become a new production method for many companies to attract consumers. It is worth pointing out that 3D printing technology provides a new way to achieve consumer customization, which is gradually changing the organization of manufacturing and the methods of innovation. In the future, this will certainly overturn and change the traditional large-scale standardized centralized manufacturing model and will also have a significant impact on the retail model.
With the development of 3D printing and customized production, it makes sense for us to consider the possibility of using 3D printing technology to achieve customization of remanufactured products, which could probably break through the development dilemma of remanufacturing. From a technical point of view, the use of 3D printing has been highly effective in the manufacture of parts for industrial supplies and the performance of printed industrial products is comparable to traditional manufacturing processes. From a cost perspective, 3D printing already has economic benefits in the aerospace, aviation, military and medical industries. Three-dimensional printing technology is capable of manufacturing complex items with the features of short production cycles, space saving, portable manufacturing and material saving, so it offers the possibility for the development of remanufactured goods.
Based on the above specific facts, we propose the following research questions:
- How can the OEM and the retailer make optimal pricing decisions and determine the optimal level of customization effort in the existence of both new and remanufactured products after customization?
- What is the impact of different models on their optimal decision when there are two production models, i.e., the manufacturer and the retailer are responsible for customized production, respectively? Which model is preferred by supply chain members?
- What determines the level of customization effort of supply chain members driven by profit maximization?
Our research is closely related to the literature on remanufacturing production, customized decision making, and 3D printing production. Many scholars have studied the optimal pricing decisions regarding remanufactured products, and most of them consider both new and remanufactured products [9,10,11,12,13]. However, they limited their studies to standard remanufactured products. The main difference between our study and theirs is that we consider customization of remanufactured products and new products, and then study how remanufacturing supply chain participants should make decisions after customized production. Regarding customized investment decision-making, some scholars have studied the differentiated pricing of customized products and standard products and the factors that determine the price [14,15], and further explored the optimal decision-making level of customization [16,17,18]. Wang et al. (2019) studied the factors influencing the level of customization effort of designers of 3D printing platforms, but only analyzed the effect of consumer customization sensitivity on effort levels [19]. With the development of 3D printing technology, scholars have also studied the impact of 3D printing on the supply chain and linked 3D printing with customization [20,21,22]. In order to answer the research questions posed above and to fill these research gaps, we establish a manufacturer-led Stackelberg game model in which the OEM or the retailer independently complete the 3D printing customization process to find out the optimal pricing and optimal revenue of 3D printed customized products for manufacturers and retailers, and focus on analyzing the factors influencing the level of customization effort in the remanufacturing supply chain, then give the relevant companies suggestions on whether to adopt 3D printing for product customization and product differential pricing by comparing the two models.
In summary, the main contributions of our study are as follows:
- As far as we know, we are the first to link customization with remanufacturing and set the customized production to be completed by 3D printing technology to study investment decisions for customized remanufactured products.
- Unlike previous studies, we focus on analyzing the influencing factors of the optimal customization effort level, which is of great significance for enterprises to make investment decisions.
- We compared and analyzed the differences in optimal decision under different models, including the level of customization effort, demand and profit, and finally came to more conclusions, which provide important references for enterprises to make profit-maximizing decisions.
The rest of this article is organized as follows. In Section 2, we review the existing literature that is closely related to this paper. In Section 3, we describe the research problem and construct the model, establish the profit model of the manufacturer and the retailer in the two cases where the OEM is responsible for remanufacturing and the retailer is responsible for remanufacturing, and obtain and analyze the equilibrium solution. In addition, we compare and analyze the two customized effort levels in each mode. In Section 4, we use MATLAB to perform numerical simulation analysis on the impact of customization sensitivity coefficient and customization cost. In Section 5, we sort and summarize all the conclusions of this paper, and make suggestions to relevant companies. In addition, we also summarize the shortcomings of this paper and propose further research directions.
2. Literature Review
Our paper is closely related to the literature in three areas. This section reviews the literature related to each of these areas and concludes with a summary of the differences between existing research and our work.
2.1. Mass Customization
Relying on the increase in productivity levels and the development of the information technology industry, the consumer market continues to refine, consumers are less interested in homogeneous products, and their personalized preferences and diversified needs are gradually becoming more prominent. Customized products increase consumers’ willingness to pay, thus allowing manufacturers to charge a higher premium. Offering a wide enough variety of products/services to meet any customer specification facilitates greater supply chain agility and operating system flexibility [23]. However, customized production creates diseconomies of scale and thus increases unit manufacturing costs [24]. Mass customization is a new production strategy that balances the efficiency of mass production and the ability to customize, and more and more firms are considering using mass customization strategies to improve their competitive advantage. Whether a firm adopts a mass customization strategy depends largely on the competitive position of that firm; a firm will never adopt mass customization strategy if it is at a disadvantage in terms of overall cost and quality [25]. Since the profits achievable from mass customization production are limited by various factors, such as the number of competitors [26], investment costs [27], firms’ risk-averse attitudes [28], and consumers’ sensitivity to product suitability [29], mass customizers may seek to maximize profits at a limited level of customization, choosing to satisfy only some consumer preferences rather than all consumers. A firm implementing a high customization level strategy is not guaranteed to sell more. When the cost difference between producing at a high level of customization and at a low level of customization is large, then producing at a low level of customization can sell more products [16]. Takagoshi and Matsubayashi (2013) considered the location of a firm’s core product in their study of customization strategies and found that a firm can hold a competitive advantage even when it is at a lower level of customization. When a firm’s core product is closer to the center of the market than its competitors’ core products, its customization can always cover more of the market center space while maintaining its level of customization smaller than that of its competitors [17]. Similarly, Zhang and Zheng (2020) found that online and offline retailers should decide the scope of customization at the middle of the product line when implementing customization in order to expand the demand as much as possible [18]. In addition, to enhance profits, firms’ pricing of customized products must also effectively reflect consumers’ willingness to pay in order to sustain and tap more market demand. Xia and Rajagopalan (2009) studied two firms’ standardized and customized production decisions in a competitive environment and found that increasing product diversity does not increase price competition because it better meets consumer demand and achieves a higher price premium [14]. Wang and Jiang (2021) considered a dual-channel customized supply chain containing one manufacturer and one retailer, and their findings suggest that the prices and service levels of products sold through different channels are different, and that under price and service competition, manufacturers should differentiate between the prices and services of standard and customized products sold directly according to market conditions [15].
2.2. Three-Dimensional Printing Technologies
The rapid development of 3D printing technology in recent years has provided an effective way to achieve personalization, and 3D printing technology has inspired a revolution in product customization design. The ultra-flexibility and high precision of 3D printing technology allows digital interaction and direct manufacturing between manufacturers and consumers, enabling complex customer requirements to be met and improving the quality and efficiency of complex products. So far, manufacturers in fields such as biomedical areas, fashion, and apparel have successfully applied 3D printing technology for customized production [30,31]. Compared to traditional manufacturing, 3D printing reduces the need for tooling and thus enables flexible manufacturing, which can directly convert 3D data into physical parts by using digital manufacturing processes, which significantly reduces customization costs and saves delivery time [32,33,34]. In addition, 3D printing technology allows consumers to co-design products that perfectly match their needs. Three-dimensional printing websites allow consumers to create 3D personalized models of their desired products by changing different design parameters [35]. Three-dimensional printers can be seamlessly integrated with computer-aided design software and other digital files, which makes custom design and production easier and more economical [36]. Sun et al. (2020) analyzed the optimal pricing strategy for 3D printing platforms selling standard and customized products and found that the price of customized products produced by 3D printing increases with their own quality and decreases with the quality of standard products [20]. Chen et al. (2021) studied the impact of 3D printing on firms’ product supply, pricing, and inventory decisions under dual channels and found that 3D printing replaced the traditional production model, prompting an increase in the variety of products offered online, enabling firms to charge a price premium to online customers; when 3D printing was used in store, firms realized deferred gains in inventory management [21]. Arbabian and Wagner (2021) consider the impact of 3D printing on a supply chain consisting of a manufacturer and a retailer, and conclude that both manufacturers and retailers are likely to earn more profit than they would have if they had not produced using 3D printing [22].
2.3. Remanufacturing Production
As resources are finite and environmental pollution is becoming more and more serious, the role of remanufactured products for sustainable development is becoming more and more significant, remanufacturing technologies are upgrading, and more manufacturers are establishing reverse channels to recycle used products for remanufacturing. Remanufacturing is the process of disassembling, cleaning, reprocessing, inspecting, and then reassembling certain components of a used product for reuse, with the final production of products whose quality and performance are capable of meeting or even exceeding those of new products. As a new production method, remanufacturing is not yet widely understood by the Chinese public, and the acceptance and consumption rate of remanufactured products are still low [37,38]. The problem that only a few consumers are willing to buy remanufactured products has been widely recognized as the biggest obstacle to the development of the remanufacturing sector [39]. Consumers choose between remanufactured and new products based on product price and service information, and their demand is directly influenced by the selling price [40]. Jung and Wang (2011) studied the optimal pricing policies of OEM and remanufacturer under two cases of competition and cooperation to find the optimal prices and buyback costs for new and remanufactured products on the basis of a repeated game model [9]. Wu (2012) considerd a supply chain consisting of a traditional manufacturer, a remanufacturer, and a retailer, examines the remanufacturer’s level of effort and the price and service decisions of all members of the supply chain, and analyzes the impact of the interactions between price and service on profits [10]. Arda (2016) used a Stackelberg game model to investigate the effect of an emissions tax on the remanufacturer’s optimal production and pricing decisions [11]. Ma et al. (2017) consider the optimal pricing decisions of firms under the coexistence of “trading in old products for new products” (TON) and “trading in old products for remanufactured products” (TOR), and determine whether firms should offer both. The results indicate that the simultaneous use of both approaches does not necessarily benefit the firm and that the firm should use different trade-in programs under different conditions [12]. Wang et al. (2019) considered a closed-loop supply chain with competitive recycling markets and product markets (new and remanufactured products) and studied the optimal pricing strategies of different individuals in the closed-loop supply chain and found that price changes for different products depend on customer sensitivity to competitive prices and market competition, and that collecting used items through outsourcing makes retailers more willing to lower prices [13]. Chen and Chi (2019) presented a two-echelon supply chain with one manufacturer and one retailer and three reverse channel formats to investigate how the choice of reverse channel structure affects wholesale prices, retail prices, collection rates, and total channel profit. Their findings suggest that manufacturer tends to choose a direct collection system to reduce remanufacturing costs and discounted valuation of remanufactured goods, and an indirect collection system to reduce collection costs for retailer [41]. Mondal and Giri (2021) considered a supply chain containing two competing manufacturers selling remanufactured goods and a retailer selling substitutable products under government sponsorship to explore how manufacturers can develop strategies to achieve better outcomes and find that the Stackelberg game works in the manufacturers’ favor [42]. One of the important initiatives for remanufacturers to enhance their revenue is differential pricing, i.e., to increase consumer demand for remanufactured products by pricing them differently from new products. However, some studies have found that consumers hold strong negative perceptions of the quality of remanufactured products, and these negative perceptions significantly reduce the attractiveness of remanufactured products. The perceived value of these consumers for remanufactured products actually outweighs the price discount in overall importance [43]. There is usually a direct positive correlation between perceived value and purchase intention; therefore, it is also important to enhance the perceived value of remanufactured products to consumers. To enhance consumers’ perceived value, the success of customization provides new ideas. We propose using 3D printing technology to extend the production of remanufactured goods into the customization process. Customized production can provide products that better match consumer preferences and will increase consumer perception of product value. On the one hand, 3D printing technology can realize convenient and economical customization for remanufactured products, and on the other hand, it can improve consumers’ utility through high-level customization, thus motivating consumers to make purchases. At this point the decision for remanufacturers shifts to whether to invest in customized products printed by 3D and how to price and determine the level of customization that will maximize profits.
2.4. Summary
In the above literature, many scholars have studied the pricing of manufactured and remanufactured products in the supply chain. They studied the impact of product differences on pricing strategies through the Stackelberg game model, and obtained the optimal pricing and optimal profits for new products and remanufactured products by each member in the supply chain. In addition, many scholars have also studied the differential pricing of customized products and standardized products. They obtained the optimal pricing of customized products, the scope of customization, and the profit distribution of members by studying the sensitivity of consumers to customized products. However, few scholars have combined these two types of research to consider differential pricing of new and remanufactured products after customization. Therefore, on the basis of existing research, we focus on the impact of customization effort level on the pricing strategy of customized products. In view of the market environment where there are different demands for new products and remanufactured products at the same time, we establish the profit functions of manufacturers and retailers under the two modes, respectively, and then further explore which mode can achieve the maximum level of customization effort, as well as the optimal profit of the manufacturer.
3. The Model
3.1. Problem Description
As consumers’ demand for customized products continues to increase, the development of 3D printing technology provides a way to realize customization. Therefore, more and more companies use 3D printing technology to complete the production of customized products. We consider that the customization process of new products and remanufactured products are all performed with 3D printing technology, but the remanufacturing process and the 3D printing customization process are performed by the OEM and retailer, respectively. Then we compare the level of customization efforts of supply chain members and the most optimal decision-making in two modes.
3.2. Basic Assumptions
Assumption 1.
We assume thatbecause remanufactured products are less well known and accepted by consumers than new products. At the same time, we introduce the product difference coefficient. The larger the value of, the greater the product difference. The reason for introducing the product difference coefficient is shown in Assumption 4.
Assumption 2.
The company’s ultimate goal is to make profits. Although our country strongly encourages companies to produce remanufactured products, companies must also consider whether they can make profits. To ensure that companies have meaningful remanufacturing interactions, it should be assumed that the unit production cost of new products is higher than that of remanufactured products, i.e., >, and .
Assumption 3.
In order to indicate consumers’ preference for customized products, we introduce δ to represent the customization sensitivity coefficient of consumers to customized products. Ifis larger, it means that consumers receive more utility from customized products and have higher preference for customized products. Therefore, the value range ofis 0 << 1.
Assumption 4.
There are differences in production between new products and remanufactured products. Although they have been customized by 3D printing, if consumers do not know enough about the concept and performance of remanufactured products, consumers always think that new products and remanufactured products are different. A lot of literature shows that under certain circumstances, consumers will prefer new products more. Because it seems that consumers’ concept and cognition of remanufactured products are very incomplete at present, many consumers always think that remanufactured products are second-hand products that are re-sold and used after simple processing of waste products. Therefore, we set. In addition, in order to better study consumers’ evaluation and choice of these two products, we also introducedas the product difference coefficient. The larger the value of , the greater the difference between the two products was perceived by consumers.
Assumption 5.
e is the customized effort level, and the range of e is set to (0, 1) based on the research of Wang et al. [19], and e = 0 and 1 are two extreme cases. When e = 0, it is a standardized product, and when e = 1, the product can be fully customized. This article does not consider these two extreme cases.
Assumption 6.
m is the customization cost coefficient. Referring to the research of Wang et al. [19], the cost of customization is closely related to the degree of effort, and it is marginally increasing, so it can be set to me2. When m > 0, it represents the customized cost factor.
3.3. Basic Model
The basic model of the manufacturer’s profit function is . The basic model of the retailer’s profit function is . Based on the need to study the differentiated pricing of customized new products and remanufactured products, relevant parameters will be introduced in the following model, and a demand function model can be established according to the assumptions.
The new product demand is
The demand for remanufactured products is
3.4. Decision Research under Two Models
OEM are leaders and have the right to make decisions first, while retailers follow and make decisions later. In the first stage, the manufacturer will first set the wholesale price of new products and remanufactured products customized by 3D printing. In the second stage, the retailer determines the final sale price of the customized new and remanufactured products based on the wholesale price set by the manufacturer. In the following, we will use the reverse induction method to solve the decision variables in the game process, and finally obtain the profit function of both parties and compare them.
3.4.1. OEM Remanufacturing
In this model, the OEM is responsible for the remanufacturing and customization process, and the decision variables for the first and second stages are and , respectively.
The OEM’s profit is
The retailer’s profit is
Take their partial derivative to we get
Making the derivative equation equal to zero we get
Similarly, we can obtain
Solving Equations (4) and (6) simultaneously, we get
Substituting Equations (7) and (8) into the relevant coefficients in Equation (1), and taking its partial derivative to , we can get the maximum . Then maximum can be obtained by substituting into Equation (8).
Proposition 1.
Under OEM remanufacturing mode,
(1) The optimal wholesale price of new products and remanufactured products are
(2) The optimal selling price of new products and remanufactured products are
(3) The optimal level of customization effort is
(4) The profits of the manufacturer and the retailer are
According to the above assumptions, we set the following constraints when 0 < e <1 in order to ensure that the following research is meaningful.
② () >
③ Furthermore, we define −1 < C =< 0
Corollary 1.
In the OEM remanufacturing model, the customization effort level e is proportional to the total size of the new product consumer market, and is also proportional to the remanufactured product consumer market size, i.e.,,.
Proof of Corollary 1.
Corollary 1 states that when the level of customization effort is between 0 and 1, neither standard nor fully customized products are on the market. As more and more consumers are attracted by customization and enter the market, the market scale is expanding. Therefore, in order to meet the different needs of consumers for customization, the level of customization efforts should be correspondingly increased to meet these consumers.
At the same time, Corollary 1 also shows that when the scale of the consumer market is small enough and the level of customization effort is reduced to zero, then the product is a standard product, and the market is not suitable for the introduction of customized products. If the manufacturer wants to introduce customized products in this type of market, he should first expand the total size of the market. On the contrary, for some products with a particularly large market size, the customization effort level can reach up to 1, and at this time full customization has been reached. □
Corollary 2.
In the OEM remanufacturing model, the customization level e is inversely proportional to the cost of both new and remanufactured products. The higher the level of customization effort, the lower the production cost, i.e.,,
Corollary 2 shows that the reduction in production cost increases the level of customization effort. If the level of customization efforts can be improved, the manufacturer can reduce part of the process in the early production of the initial product, and leaves this part of the process to be completed by 3D printing customized equipment. Therefore, if the manufacturer wants to reduce product costs and obtain higher profits, he can consider increasing the level of customization efforts to achieve their goals.
3.4.2. Retailer Remanufacturing
Under this model, remanufacturing and customized production are carried out by the retailer. The decision variables of the first stage are , and the decision variables of the second stage are and e.
The OEM’s profit is
The retailer’s profit is
Solving these three equations simultaneously, we get
Substituting Equations (17)–(19) into Equation (9) to derive the Optimal solution for .
Then we also substitute into Equations (17)–(19) to derive the Optimal solution for , and .
To equation the formula, we define L =.
Proposition 2.
Under retailer remanufacturing mode,
- (1)
- The optimal wholesale price of new products is
- (2)
- The optimal selling price of new products and remanufactured products are
- (3)
- The optimal level of customization effort is
- (4)
- The profits of the manufacturer and the retailer are
According to the above assumptions, we set the following constraints when 0 < e < 1 in order to ensure that the following research is meaningful.
① Setting −1 < < 0, −1 < B =
−1 < C =< 0,
A > C > B > D
② 0 <
10> 4m > 10, |C| − < 0
③ , −1 < B =so< 0.
Corollary 3.
In the retailer remanufacturing model, the customization effort level e is proportional to the total size of the new product consumer market, and is also proportional to the remanufactured product consumer market size, i.e.,
Proof of Corollary 3.
As we define A < 0, B < 0, C < 0,, 0 <, > 0, 0 < () < 1, , A > C > B, |B| > |C|, so|| < |B|, 0 <| < 1, it can be seen from the above that 2B < 0, so , then .
Similarly, it can be proved that
Corollary 4.
Under the retailer remanufacturing model, the level of customization e is inversely proportional to the cost of new and remanufactured products. The higher the level of customization, the lower the production cost, i.e., ,
Corollaries 3 and 4 show that when the scale of the consumer market expands, in order to meet more and more consumers’ different needs for customization, the level of customization should also be correspondingly improved to produce customized products that better meet the needs of consumers. In addition, if the manufacturer wants to reduce the cost of producing customized products, he can consider reducing production costs by increasing the level of customization. Corollaries 3 and 4 here are similar to the Corollaries 1 and 2 of Proposition 1 under OEM remanufacturing, so the explanation is not repeated here.
3.4.3. Comparison of Customized Effort Levels under the Two Models
When 0 < e < 1, it can be seen from the above:
We define as the customization effort level under OEM remanufacturing, and as the customization effort level under retailer remanufacturing.
Knowing 0 < < 1, 0 << 1, 0 > A > C > B > −1, and 4ABC > 0, we get
If ① ②:
so and , which means that the level of customization effort under the OEM remanufacturing model is lower than that under the retailer remanufacturing model.
If :
so and , which means that the level of customization effort under the OEM remanufacturing model is higher than that under the retailer remanufacturing model.
4. Numerical Analysis
In the above, we have constructed the objective functions of the manufacturer and retailer for both cases and analyzed the model. Next, we will analyze the impact of variables on the pricing strategy more intuitively through numerical simulation. The following constraints are made based on the above assumptions.
4.1. Analysis of the Impact of Customized Sensitivity Coefficients
Next, we will explore the impact of the customization sensitivity coefficient on the level of customization effort, market demand, and profit. The increase in the consumer customization sensitivity coefficient means that consumers’ requirements for the degree of customization of customized products and their preferences for customized products both improve.
According to the above assumptions, the following parameters can be set when 0 < e < 1.
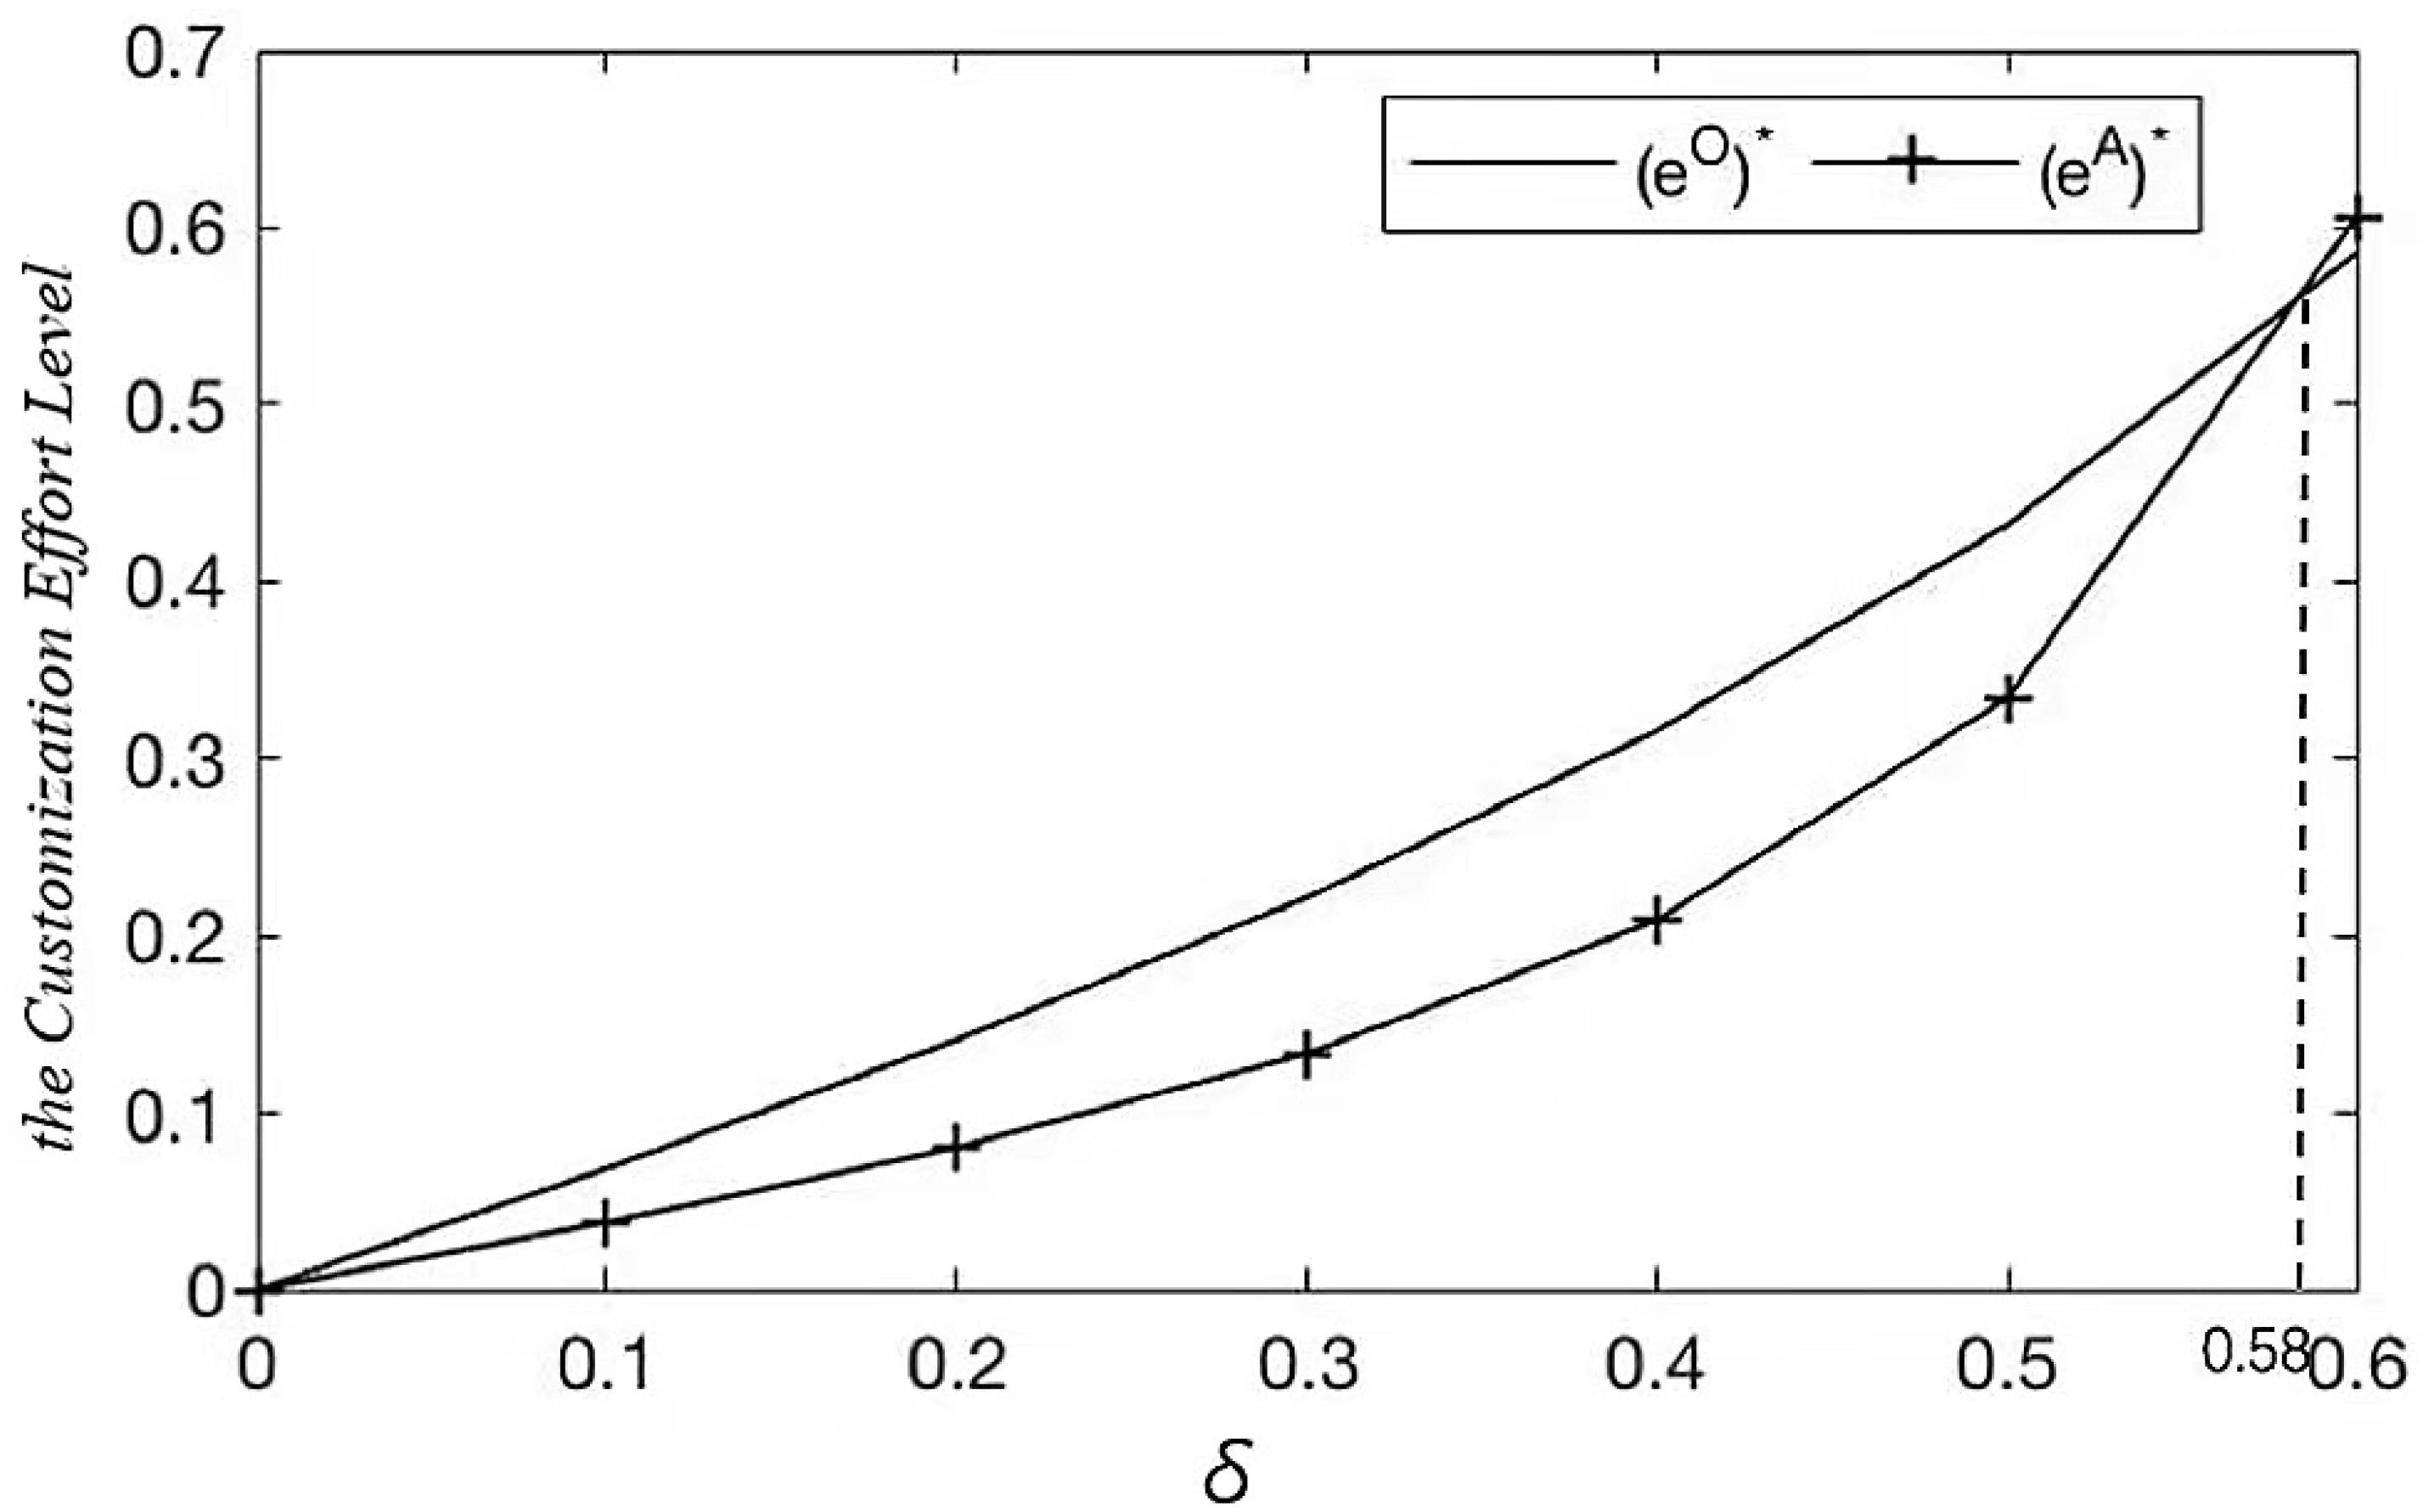
4.1.1. The Effect of Customization Sensitivity Coefficient on Customization Effort Level
According to Figure 1, the customization sensitivity coefficient is proportional to the level of customization effort. The increase in the consumer customization sensitivity coefficient means that consumers have higher requirements for customization of customized products, and consumers expect customized products to be more suitable for them. Therefore, the manufacturer of customized products should improve his customization capabilities to make his customized products more in line with consumer needs, so as to reduce mismatch costs and encourage consumers to buy. In addition, it can be seen from Figure 1 that the customization effort level under the OEM remanufacturing mode will be higher than the customization effort level under the retailer remanufacturing mode when the customization sensitivity coefficient is low at 0.58, and when exceeds 0.58, the customization level of the retailer’s remanufacturing mode will be greater than that of the OEM remanufacturing mode.
Therefore, if the retailer wants to lead the customization process, they should focus on improving their own customization efforts as consumers pay more and more attention to customized products; only then can the retailer produce customized products that are more market competitive than the manufacturer.
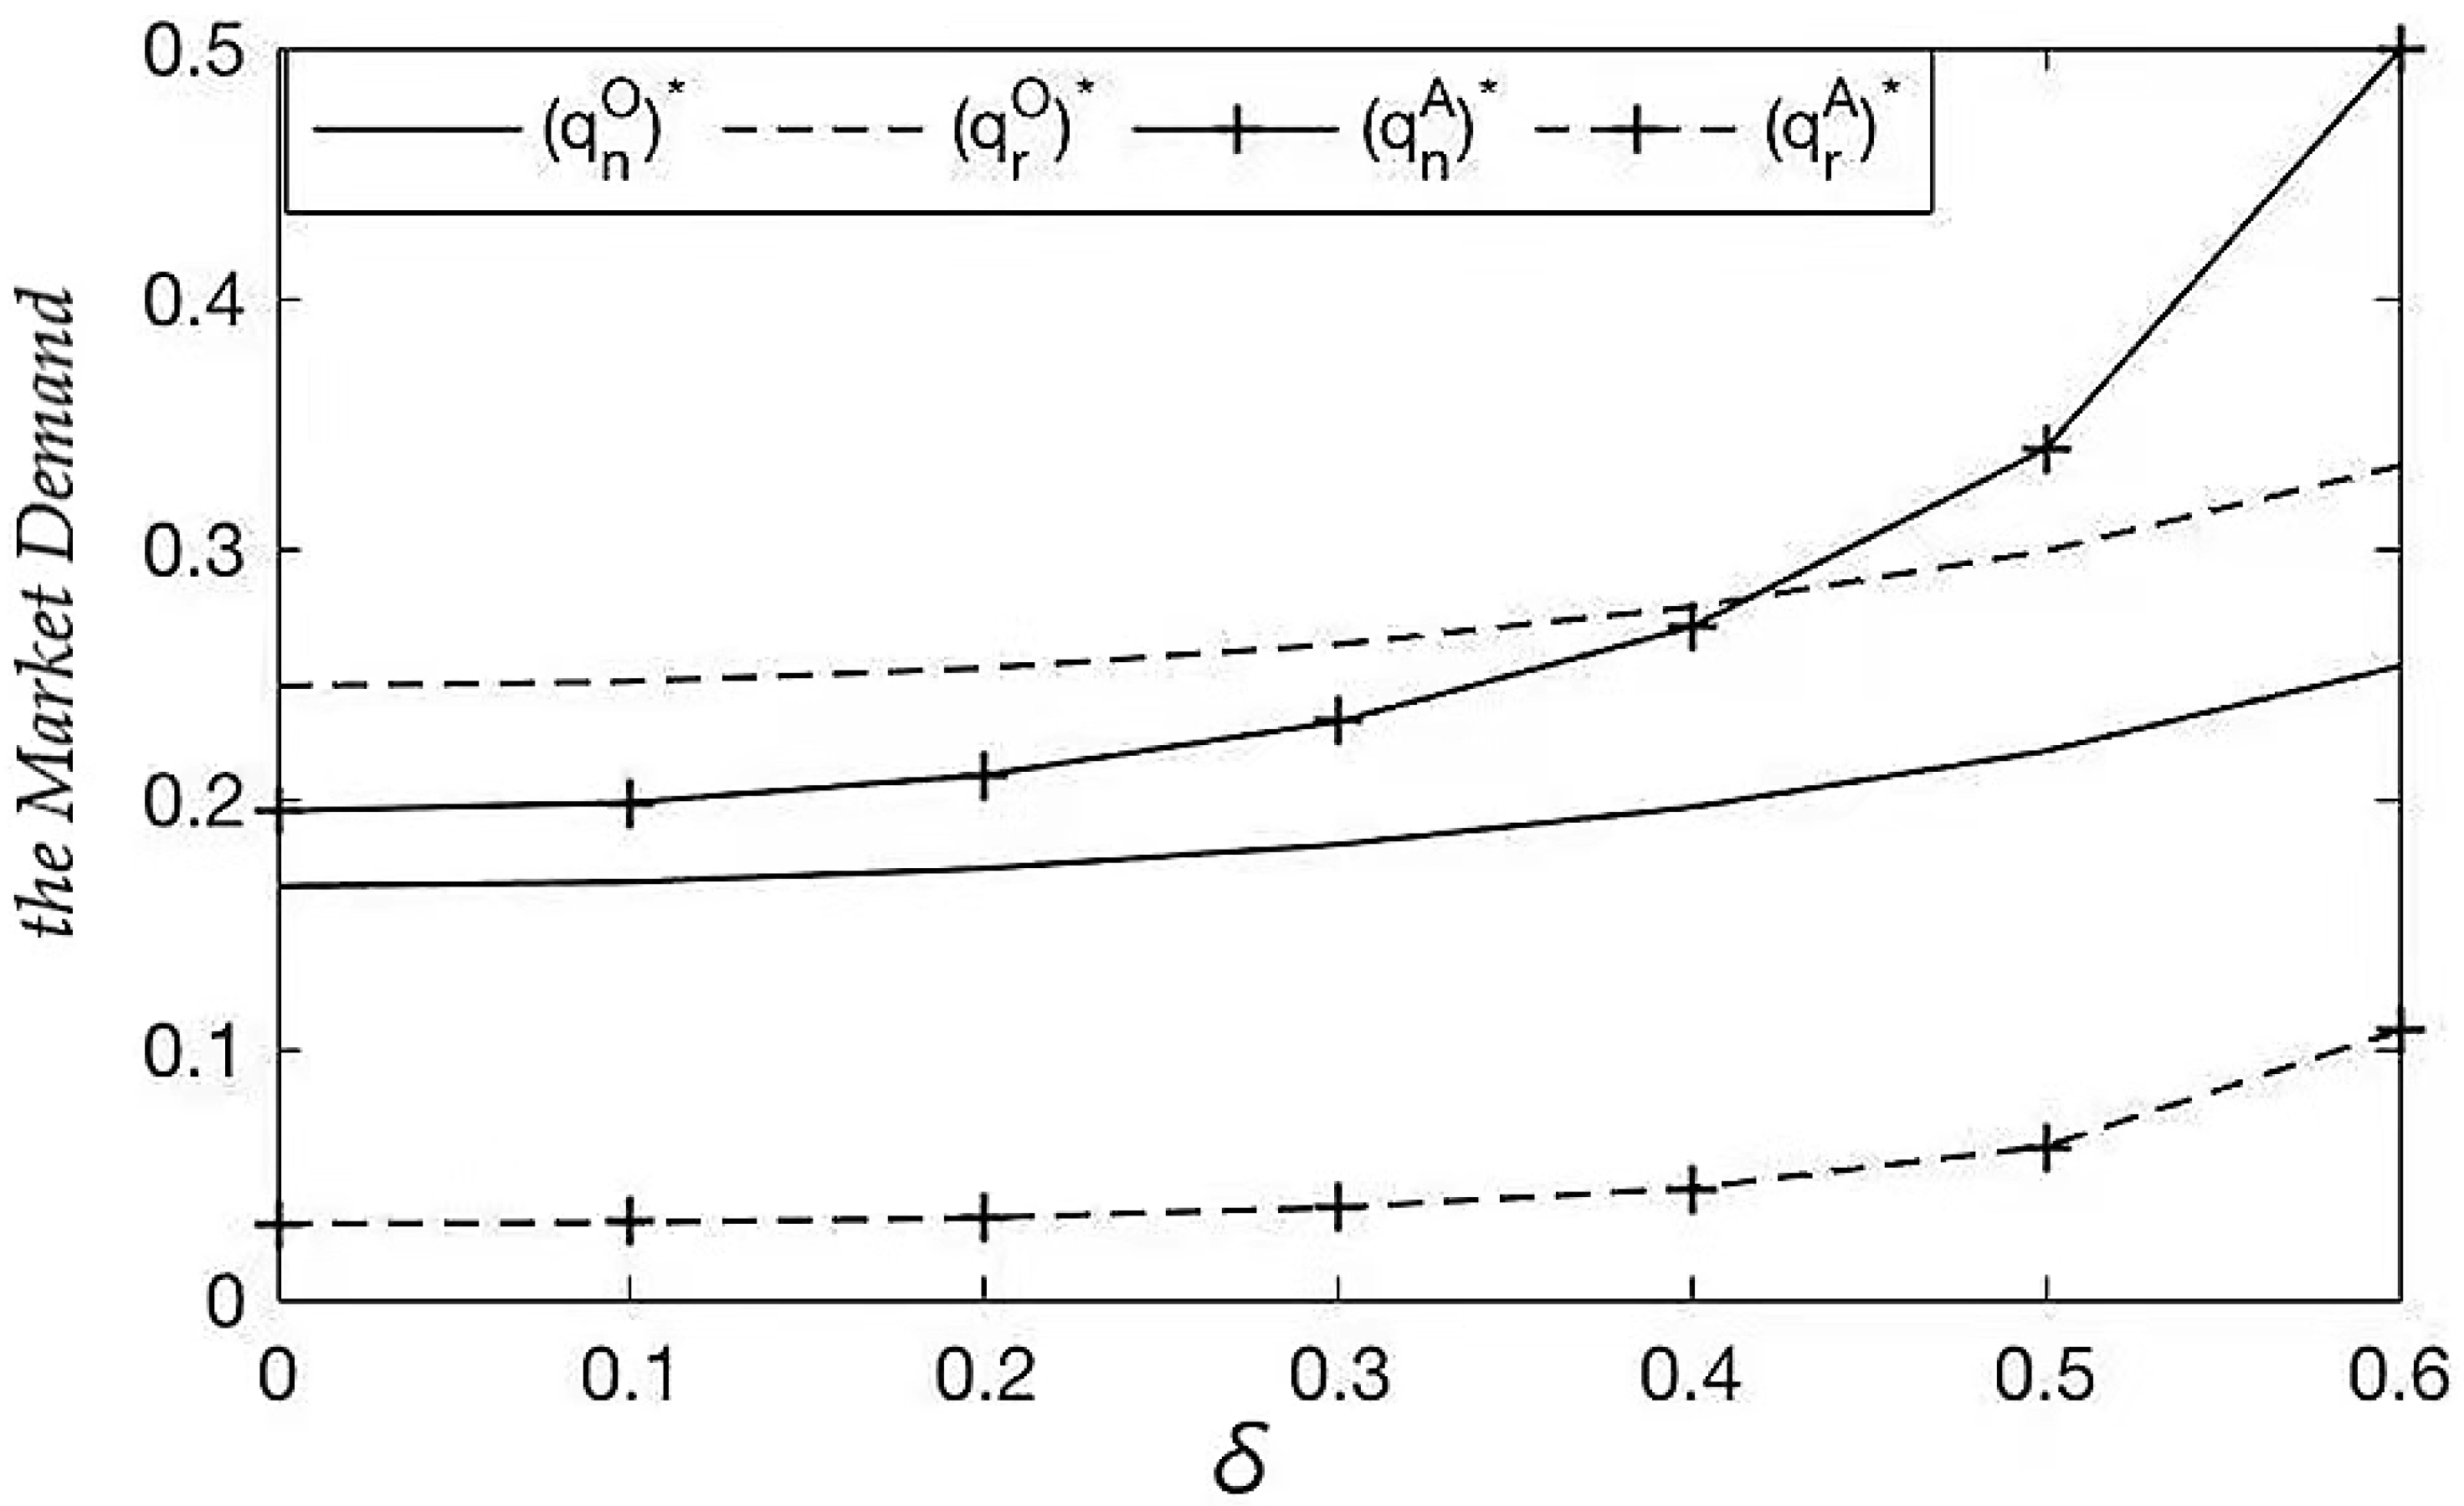
4.1.2. The Impact of Customized Sensitivity Coefficient on Market Demand
According to Figure 2, the market demand for new and remanufactured products in both models will increase as consumers become more sensitive to customization. Under the OEM remanufacturing model, the market demand for remanufactured products is higher than the market demand for new products, while the opposite is true under the retailer remanufacturing model. When the customization sensitivity coefficient exceeds 0.4, the market demand for the new product under the retailer’s remanufacturing model will exceed the demand for the two products under the OEM remanufacturing model.
It may be because the repair and customization of remanufactured products requires more powerful technology and craftsmanship, and the manufacturer is stronger than the retailer in terms of repair technology, so consumers will trust the customized remanufactured products repaired and processed by the manufacturer more. However, for new products it only needs to be customized on the basis of finished products, which can be performed directly through 3D printing. The retailer has the ability to complete the customization process of new products, and they are closer to consumers so that they can more directly understand the needs of consumers. Therefore, it is convenient for the retailer to continuously communicate with consumers and modify products. In summary, the manufacturer can more effectively improve their profits by customizing remanufactured products, while the retailer can make more profits by customizing new products.
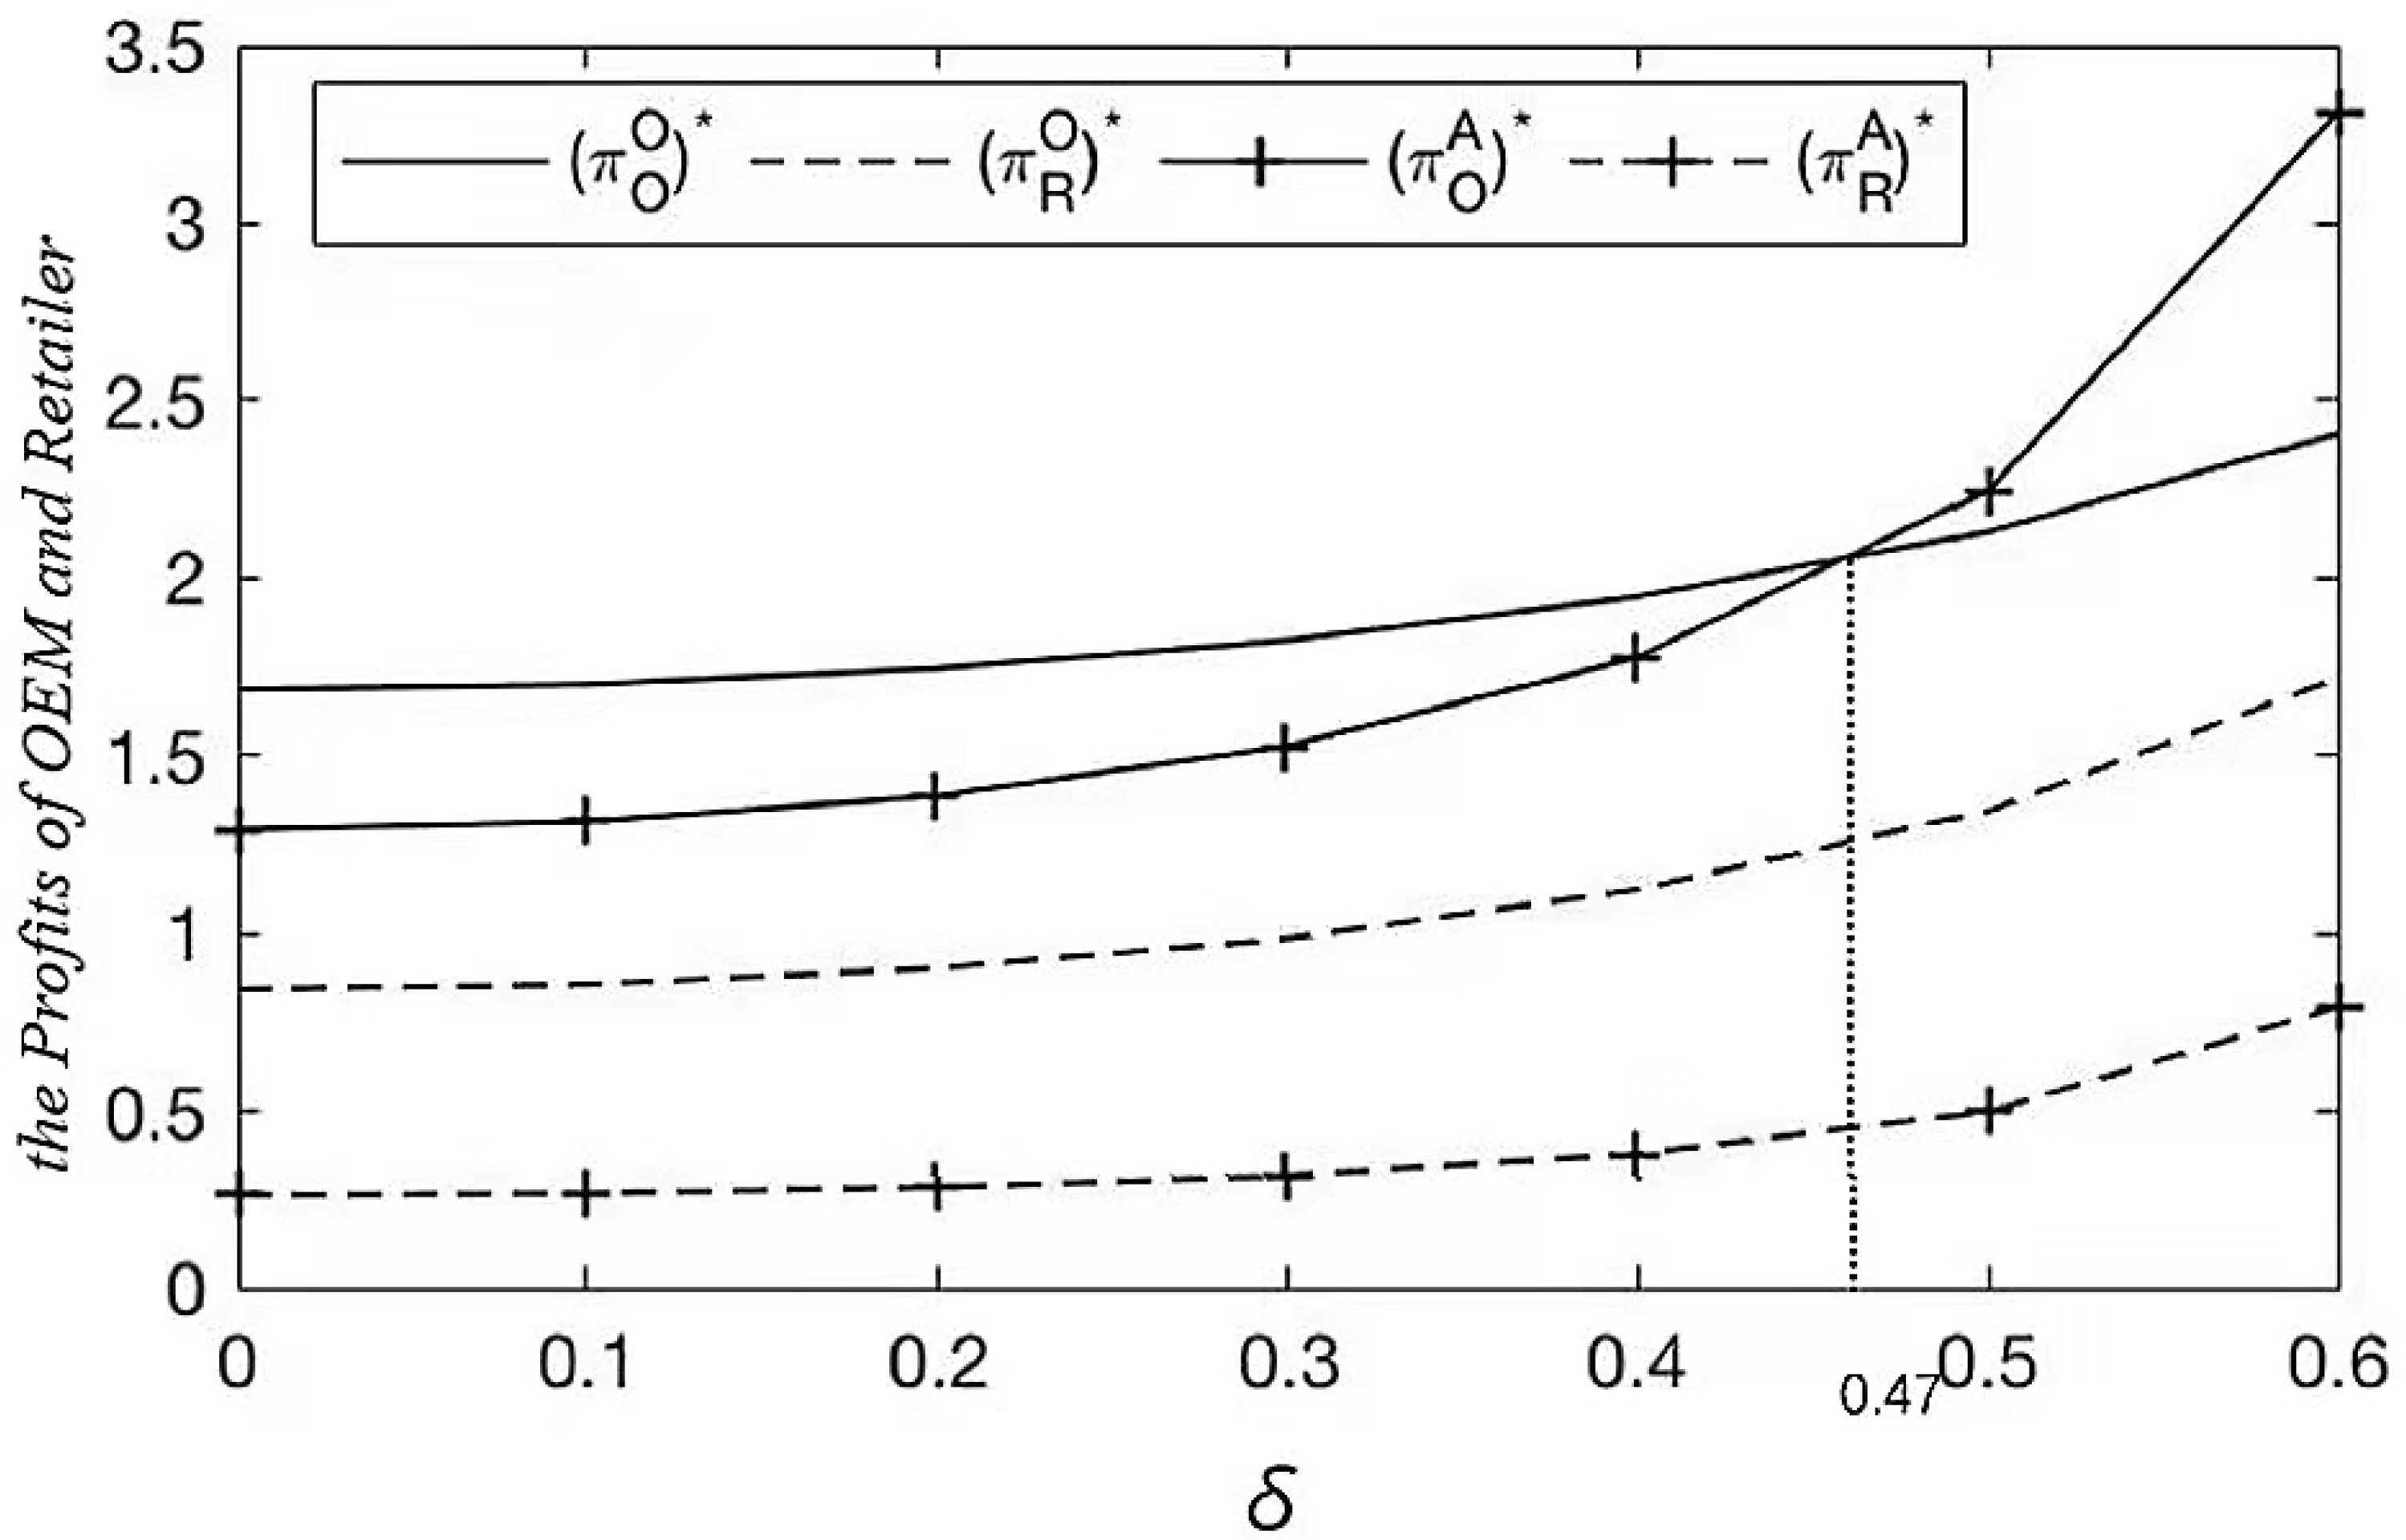
4.1.3. The Impact of Customized Sensitivity Coefficients on Profits
According to Figure 3, the profits of the manufacturer and the retailer in both models will increase as consumers become more sensitive to customization. In both the OEM remanufacturing model and the retailer remanufacturing model, the profit of the manufacturer is higher than that of the retailer. Comparing the profits of the two modes, we can find that the profit of the retailer under OEM remanufacturing model is always higher than that under the retailer remanufacturing model, while the profit of the manufacturer under the OEM remanufacturing model is initially higher than that under the retailer remanufacturing model. However, when the customization sensitivity coefficient exceeds 0.47, the profit of the manufacturer under the retailer remanufacturing model will be greater than that under the OEM remanufacturing, and the manufacturer becomes the most profitable party in the two models.
Therefore, transferring the customization process from the manufacturer to the retailer will reduce the profit of the retailer, and also reduces the profit of the manufacturer when the customization sensitivity coefficient is less than 0.47. That is to say, when the customization sensitivity coefficient is lower than 0.47, both the manufacturer and the retailer obtain relatively high profits when the OEM completes the customized production. However, when the customization sensitivity coefficient is greater than 0.47, it will make the manufacturer obtain higher profits, but the retailer’s profit will decrease when the customized production is carried out by the retailer.
4.2. Analysis of the Impact of Customization Costs
Next, we will analyze the impact of customization cost on customization effort level, market demand, and profit. The increase in customization cost means that the cost of 3D printing customization process will increase, which may be due to the high cost of 3D printing equipment, High material cost and high model debugging cost
According to the assumptions above, we set the following parameters when 0 < e < 1.
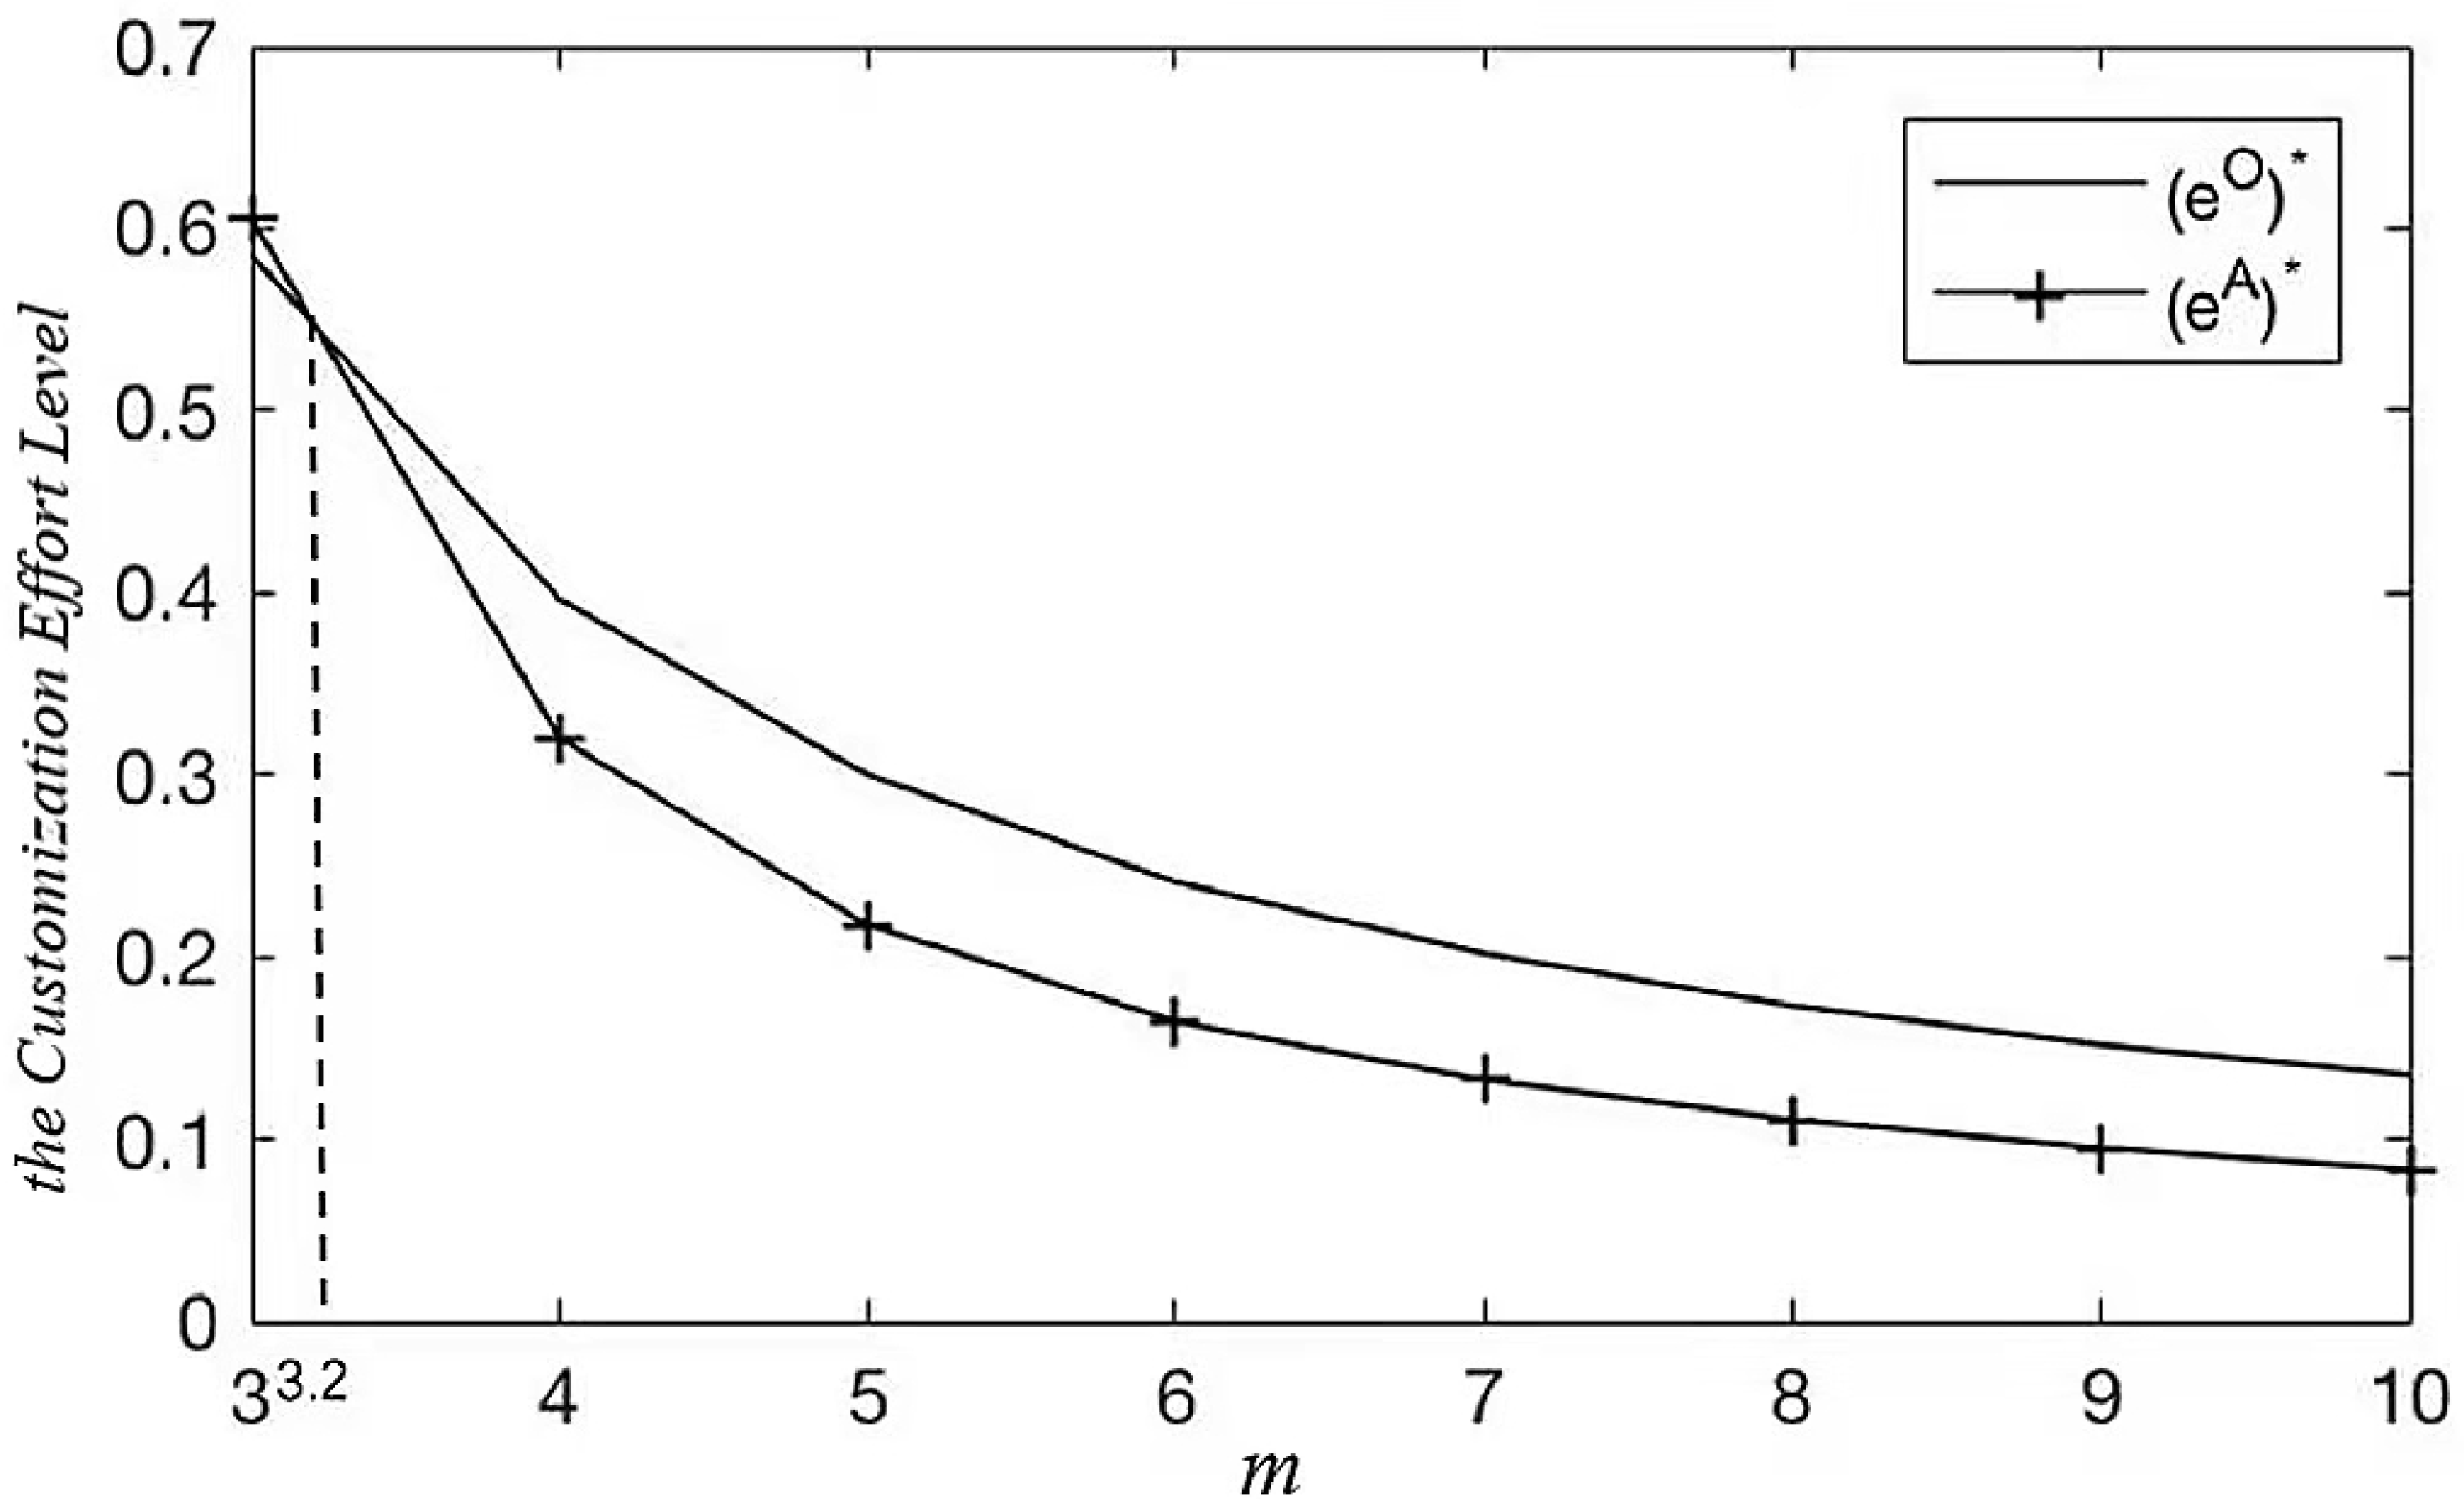
4.2.1. The Effect of Customization Cost on Customization Effort Level
According to Figure 4, the cost of customization is inversely proportional to the level of customization effort. The higher the customization cost, the less mature the technology is, and more money needs to be spent to complete the customization process. Therefore, in both models, manufacturer and retailer should increase their customization efforts if they want to reduce customization costs. In addition, it can be seen from Figure 4 that when the customization cost is less than 0.32, the optimal customization level in the retailer remanufacturing model is higher than the optimal customization level in the OEM remanufacturing model. Conversely, the level of customization under OEM remanufacturing will be higher than that under retailer remanufacturing.
From Figure 1 and Figure 4, it can be concluded that when the customization technology is just emerging and the consumer awareness is still low, the manufacturer has more advantages and the ability to implement the customization process, and the customization level of his products is higher than that of the retailer’s. This may be because it is easier for the manufacturer to master new technologies when he has been in the manufacturing industry for a long time. The retailer can produce customized products themselves when the technology matures.
4.2.2. The Impact of Customization Cost on Market Demand
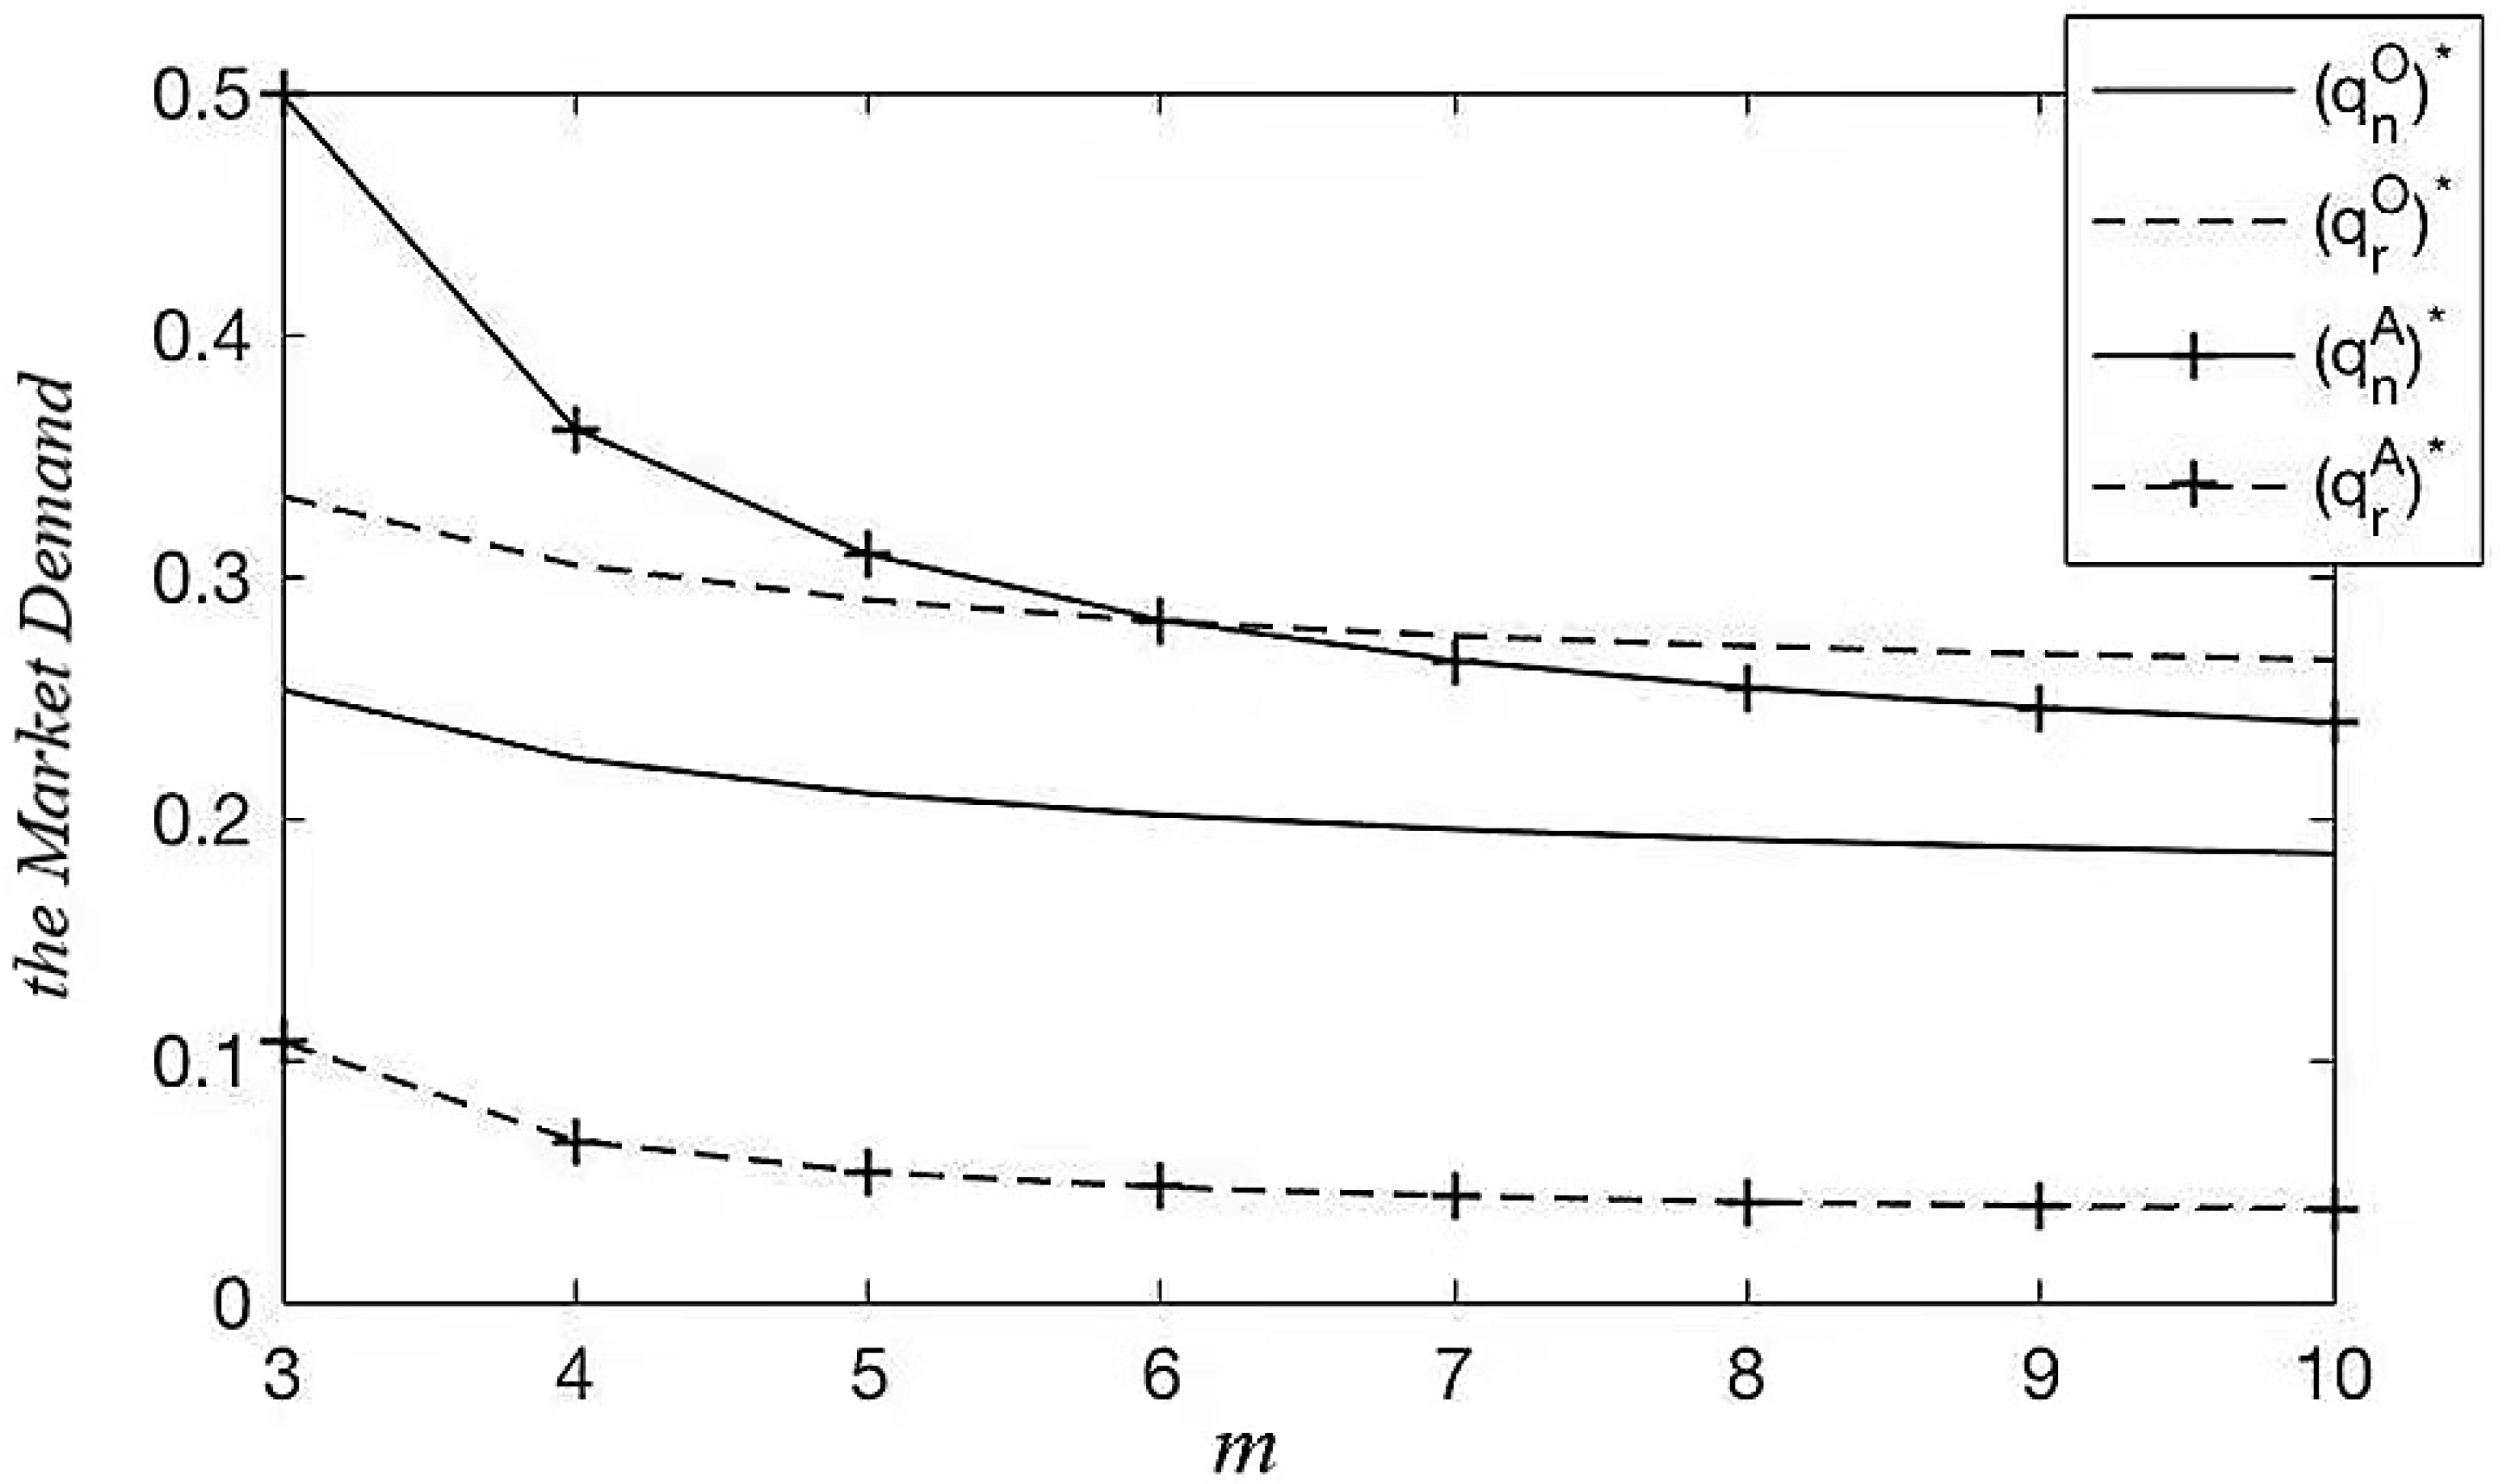
It can be seen from Figure 5 that the market demand for new products and remanufactured products will decrease with the increase in customization cost. The market demand for new products and remanufactured products under OEM remanufacturing will decline relatively slowly, but the market demand for new products under retailer remanufacturing will decline significantly. The market demand for remanufactured products is higher than the market demand for new products under the OEM remanufacturing model, while the market demand for new products is higher under the retailer remanufacturing model. The reason for this has been analyzed in the analysis of Figure 2, and will not be repeated here.
Therefore, according to the above analysis, when the customization cost is high, the customization technology is not mature enough and the products cannot attract too many consumers. In order to improve the overall profit of the supply chain, supply chain members should choose the OEM remanufacturing model. As customization technology continues to develop so that the cost of customization is less than six, the manufacturer can complete the remanufacturing and customization process of remanufactured products, while the customization process of new products is left to the retailer to complete, which can attract more many consumers.
4.2.3. The Impact of Customization Costs on Profits
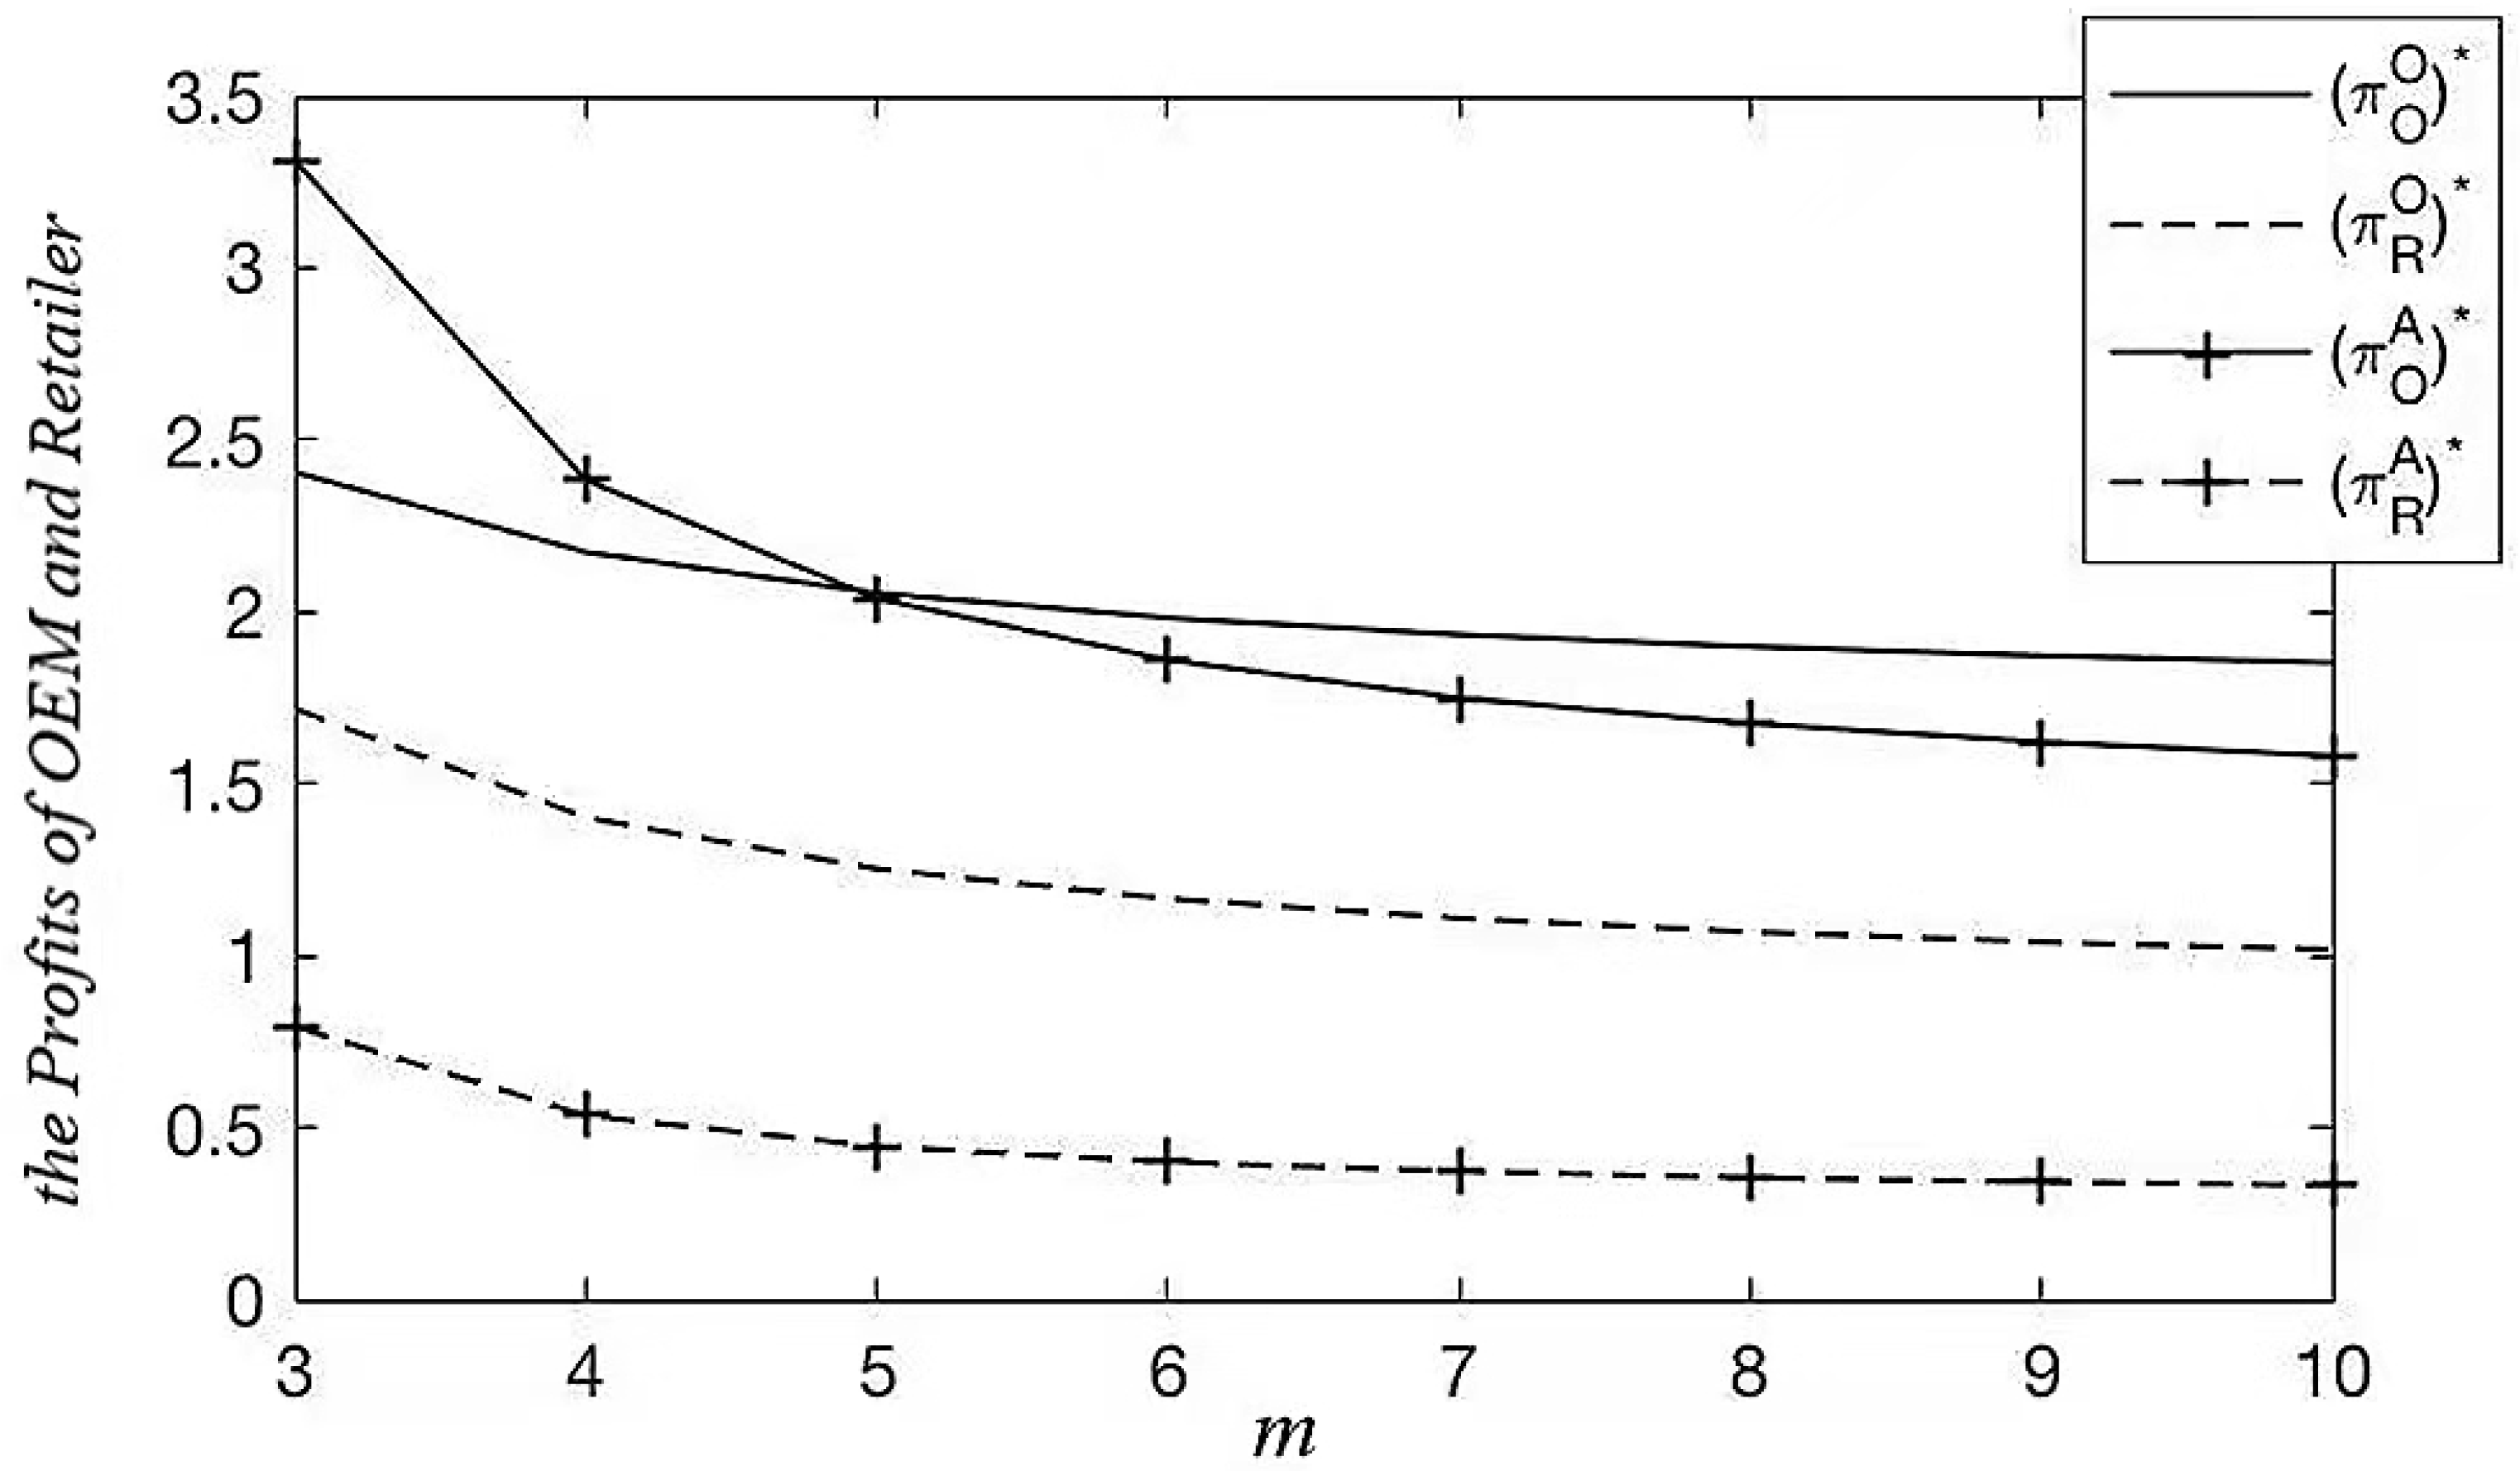
It can be seen from Figure 6 that the impact of customization cost on profit is consistent with its impact on market demand. The increased cost of customization will lead to lower profits for manufacturer and retailer in both models. However, no matter under which model, the profit of the manufacturer is always higher than that of the retailer, which is consistent with the conclusion obtained in Figure 3.
Therefore, when the customization cost is lower than five, the manufacturer should choose the retailer remanufacturing model to obtain higher profits. As the cost of customization continues to increase, especially when the cost of customization is greater than five, the manufacturer should choose the OEM remanufacturing model. However, no matter how the cost of customization increases, the profit of retailer under OEM remanufacturing is always higher than that under retailer remanufacturing, so the retailer should choose the OEM remanufacturing mode to maximize their own profits.
5. Conclusions
By establishing a Stackelberg game model, with the goal of maximizing the profits of supply chain members, we studied the pricing strategy of new products and remanufactured products customized by 3D printing and the profit of the related manufacturer under the two models of OEM remanufacturing and retailer remanufacturing. The main contribution of this paper is the integration of customization and 3D printing into an analytical framework for remanufacturing investment decisions. Based on the OEM remanufacturing and retailer remanufacturing models, we focused on analyzing the factors influencing the level of customization effort, which helps members of the remanufacturing supply chain to make more scientific decisions and enriches circular economy theory.
5.1. Theoretical Results
Our research has produced the following results, which can provide useful guidance for the practical operation of a business.
- The size of the consumer market will have an impact on the level of customization efforts, and the expansion of the consumer market size will promote the level of customization efforts. An increase in customization susceptibility will lead to an increase in the level of customization effort. The improvement of the level of customization effort can effectively reduce the cost of product customization, so improving the level of customization effort can help the manufacturer reduce costs.
- When the customization sensitivity coefficient is higher than 0.58 or the customization cost is lower than 3.2, the customization effort level of the retailer is slightly higher than that of the OEM. However, if the above conditions are not met, the level of customization effort of the OEM is higher than that of the retailer in most cases.
- Consumers prefer remanufactured products under OEM remanufacturing and new products under retailer remanufacturing. When the customization sensitivity coefficient exceeds 0.4, consumers prefer remanufactured products under OEM remanufacturing. On the contrary, new products under retailer remanufacturing have more market demand.
- The improvement of the customization sensitivity coefficient will increase the profit of the manufacturer, and the profit of the manufacturer is higher than that of the retailer in either case. When the customization sensitivity coefficient is lower than 0.47, the profit of the manufacturer under the retailer’s remanufacturing model will eventually be greater than that of the OEM remanufacturing model. However, when the customization sensitivity coefficient is higher than 0.47, the manufacturer’s profit under the retailer remanufacturing model will eventually exceed its profit under the OEM remanufacturing model. No matter how the customization sensitivity coefficient changes, the profit of the retailer under OEM remanufacturing is always higher than that under the retailer’s remanufacturing.
- The mode of transferring the customization process from the OEM to the retailer will make the manufacturer more profitable only when the customization sensitivity coefficient is higher than 0.47, while for the retailer, the transfer of the customization process will reduce the retailer’s profit.
- The increased cost of customization reduces the profits of the manufacturer and the retailer in both models. When the customization cost is less than five, the manufacturer should choose the retailer remanufacturing model; otherwise, they should choose the OEM remanufacturing model. Differently, no matter how the customization cost changes, the profit of the retailer under the OEM remanufacturing model is always higher than that under the retailer’s remanufacturing model.
5.2. Suggestions
Based on the research of this paper, the following suggestions are proposed.
For the manufacturer, because the customization technology is not advanced enough and the level of customization is limited, the customized products cannot fully meet the personalized needs of consumers. At this point, in order to maximize their own profits, the manufacturer can choose to carry out customized production by themselves, and then sell the products to the retailer. However, when the level of customization effort becomes relatively high with the continuous development of customization technology, the manufacturer may consider transferring the customization process to the retailer, or just transfer the customization process of the new product to the retailer; at this time the manufacturer can make more profits.
However, for the retailer, if he wants to participate in the supply chain of customized products, in order to maximize his own profits, he should choose for the manufacturer to complete the customization process and sell the customized products themselves. Even when the customization technology is gradually advanced, the market demand for new products customized by the retailer is large, but this does not help the retailer to increase profits, so the transfer of the customization process cannot help the retailer increase profits.
If the manufacturer and the retailer want to introduce customized products in their target market, they should also investigate and evaluate the market size of the target market before deciding whether to introduce customized products. This will help the manufacturer increase the level of customization efforts to attract more consumers, thereby increasing profits.
5.3. Further Research
In recent years, 3D printing has received increasing attention, and more and more researchers are studying and exploring the application of 3D printing in the industry. At present, 3D printing has made great achievements in parts manufacturing, and 3D printing products will be more widely used in the future. In the model of this paper, the OEM is the dominant party in both cases, with insufficient consideration for the retailer and consumers. In terms of customization effort level, this paper only considers the situation when the customization effort level e is in the range of 0 to 1, and does not consider the two cases of standardized products with e = 0 and fully customized products with e = 1. Therefore, the conclusions of this paper have some limitations. This paper can further study in the following aspects.
First of all, for the level of customization effort, we can also consider the situation of standard products and full customization, and study the pricing differences and investment strategies of standard products and full customization. Secondly, products can be further subdivided; for example, new products and remanufactured products can be subdivided into living products, industrial manufactured products, etc. Finally, recycling costs and government subsidies for remanufactured products and return costs for custom products are not taken into account in our model. Therefore, these factors can also be taken into account in the model in future research, so that the conclusions drawn will be more realistic.
Author Contributions
Conceptualization, H.S. and W.L.; methodology, H.S.; software, H.Z.; validation, H.S., X.S. and W.L.; formal analysis, H.Z.; investigation, W.L.; resources, H.S.; data curation, H.Z.; writing—original draft preparation, H.S.; writing—review and editing, H.Z.; visualization, H.Z.; supervision, W.L.; project administration, H.S.; funding acquisition, H.S. All authors have read and agreed to the published version of the manuscript.
Funding
The article is supported by The National Natural Science Foundation of China (71601074; 71971078).
Institutional Review Board Statement
Not applicable.
Informed Consent Statement
Not applicable.
Data Availability Statement
Not applicable.
Conflicts of Interest
The authors declare no conflict of interest.
Nomenclature
| Notation | Description |
| New product consumption market size | |
| Remanufactured product consumption market size | |
| The wholesale prices for new products | |
| The wholesale prices for remanufactured products | |
| OEM’s profit | |
| Retailer’s profit | |
| The sale price of the new product | |
| The sale price of remanufactured products | |
| The unit production cost of new products | |
| The unit production cost of the remanufactured product by the manufacturer | |
| Retailer’s unit production cost | |
| Retailer’s license fee to manufacturer | |
| Customization effort level | |
| Customized cost coefficient | |
| Price-sensitive coefficient | |
| Product variation coefficient | |
| Customized sensitivity coefficient | |
| Customization effort level when remanufactured by the OEM | |
| Level of customization effort when remanufactured by the retailer | |
| Market demand for new products when remanufactured by the OEM | |
| Market demand for remanufactured products when remanufactured by the OEM | |
| Market demand for new products when remanufactured by the retailer | |
| Market demand for remanufactured goods when remanufactured by the retailer | |
| Manufacturer’s profit when remanufactured by the OEM | |
| Retailer profit when remanufactured by the OEM | |
| Manufacturer’s profit when remanufactured by the retailer | |
| Retailer profit when remanufactured by the retailer |
References
- China to Launch “Trade-in” Pilot. Available online: http://politics.people.com.cn/n/2013/0830/c1001-22743865.html (accessed on 7 February 2022).
- China Will Vigorously Develop a Circular Economy in the 14th Five-Year Plan. Available online: https://epaper.gmw.cn/gmrb/html/2021-07/08/nw.D110000gmrb_20210708_1-10.htm (accessed on 7 February 2022).
- Lund, R. Remanufacturing: The Experience of the United States and Implications for Developing Countries; World Bank: Washington, DC, USA, 1984; Volume 31. [Google Scholar]
- Wei, S.; Cheng, D.; Sundin, E.; Tang, O. Motives and barriers of the remanufacturing industry in China. J. Clean. Prod. 2015, 94, 340–351. [Google Scholar] [CrossRef]
- Additive Manufacturing, Reshaping the Future of Manufacturing. Available online: https://epaper.gmw.cn/gmrb/html/2018-06/21/nw.D110000gmrb_20180621_3-13.htm (accessed on 7 February 2022).
- Continuum Fashion. Available online: http://www.continuumfashion.com/projects.php (accessed on 7 February 2022).
- Nike News. Available online: https://news.nike.com/news/nike-debuts-first-ever-football-cleat-built-using-3d-printing-technology (accessed on 7 February 2022).
- Stratasys. Available online: https://www.stratasysdirect.com/industries/transportation/3d-printed-car-fuel-efficient-fdm-urbee-2 (accessed on 7 February 2022).
- Jung, K.S.; Hwang, H. Competition and cooperation in a remanufacturing system with take-back requirement. J. Intell. Manuf. 2011, 22, 427–433. [Google Scholar] [CrossRef]
- Wu, C. Price and service competition between new and remanufactured products in a two-echelon supply chain. Int. J. Prod. Econ. 2012, 140, 496–507. [Google Scholar] [CrossRef]
- Yenipazarli, A. Managing New and Remanufactured Products to Mitigate Environmental Damage under Emissions Regulation. Eur. J. Oper. Res. 2016, 249, 117–130. [Google Scholar] [CrossRef]
- Ma, Z.J.; Zhou, Q.; Dai, Y.; Sheu, J.B. Optimal pricing decisions under the coexistence of “trade old for new” and “trade old for remanufactured” programs. Transp. Res. Part E Logist. Transp. Rev. 2017, 106, 337–352. [Google Scholar] [CrossRef]
- Wang, N.; He, Q.; Jiang, B. Hybrid closed-loop supply chains with competition in recycling and product markets. Int. J. Prod. Econ. 2019, 217, 246–258. [Google Scholar] [CrossRef]
- Xia, N.; Rajagopalan, S. Standard vs. Custom Products: Variety, Lead Time, and Price Competition. Mark. Sci. 2009, 28, 887–900. [Google Scholar] [CrossRef]
- Jian, W.; Huijuan, J. Price and Service Competition in a Dual-Channel Supply Chain with Product Customization. Complexity 2021, 2021, 8833174. [Google Scholar]
- Shao, X.-F. What is the right production strategy for horizontally differentiated product: Standardization or mass customization? Int. J. Prod. Econ. 2019, 223, 107527. [Google Scholar] [CrossRef]
- Takagoshi, N.; Matsubayashi, N. Customization competition between branded firms: Continuous extension of product line from core product. Eur. J. Oper. Res. 2013, 225, 337–352. [Google Scholar] [CrossRef]
- Zhang, C.; Zheng, X. Customization strategies between online and offline retailers. Omega 2020, 100, 102230. [Google Scholar] [CrossRef]
- Canyou, W.; Qin, S.; Ding, Z. 3D printing platform-based product pricing, designer efforts and supply chain coordination strategies. Chin. J. Manag. 2018, 15, 1059–1068. [Google Scholar]
- Sun, L.; Hua, G.; Cheng, T.C.E.; Wang, Y. How to price 3D-printed products? Pricing strategy for 3D printing platforms. Int. J. Prod. Econ. 2020, 226, 107600. [Google Scholar] [CrossRef]
- Chen, L.; Cui, Y.; Lee, H.L. Retailing with 3D Printing. Prod. Oper. Manag. 2021, 30, 1986–2007. [Google Scholar] [CrossRef]
- Arbabian, M.E.; Wagner, M.R. The impact of 3D printing on manufacturer–retailer supply chains. Eur. J. Oper. Res. 2020, 285, 538–552. [Google Scholar] [CrossRef]
- Bui, T.D.; Tsai, F.M.; Tseng, M.L.; Tan, R.R.; Yu, K.D.S.; Lim, M.K. Sustainable supply chain management towards disruption and organizational ambidexterity: A data driven bibliometric analysis. Sustain. Prod. Consum. 2021, 26, 373–410. [Google Scholar] [CrossRef]
- Jost, P.; Süsser, T. Company-customer interaction in mass customization. Int. J. Prod. Econ. 2019, 220, 107454. [Google Scholar] [CrossRef]
- Mendelson, H.; Parlaktürk, A.K. Competitive Customization. Manuf. Serv. Oper. Manag. 2008, 10, 377–390. [Google Scholar] [CrossRef] [Green Version]
- Syam, N.B.; Kumar, N. On Customized Goods. Stand. Goods Compet. Mark. Sci. 2006, 25, 525–537. [Google Scholar]
- Zipkin, P. The Limits of Mass Customization. MIT Sloan Manag. Rev. 2001, 42, 81–87. [Google Scholar]
- Choi, T.-M.; Ma, C.; Shen, B.; Sun, Q. Optimal pricing in mass customization supply chains with risk-averse agents and retail competition. Omega 2019, 88, 150–161. [Google Scholar] [CrossRef]
- Yazdani, A.; Çil, E.B.; Pangburn, M.S. What if Hotelling’s Firms Can Mass Customize? Decis. Sci. 2020, 51, 395–422. [Google Scholar] [CrossRef]
- Sun, L.; Wang, Y.; Hua, G.; Cheng, T.; Dong, J. Virgin or recycled? Optimal pricing of 3D printing platform and material suppliers in a closed-loop competitive circular supply chain. Resour. Conserv. Recycl. 2020, 162, 105035. [Google Scholar] [CrossRef]
- Ngo, T.D.; Kashani, A.; Imbalzano, G.; Nguyen, K.T.Q.; Hui, D. Additive manufacturing (3D printing): A review of materials, methods, applications and challenges. Compos. Part B 2018, 143, 172–196. [Google Scholar] [CrossRef]
- Phaal, R.; O’Sullivan, E.; Routley, M.; Ford, S.; Probert, D. A framework for mapping industrial emergence. Technol. Forecast. Soc. Chang. 2010, 78, 217–230. [Google Scholar] [CrossRef]
- Dankar, I.; Haddarah, A.; Omar, F.E.; Sepulcre, F.; Pujolà, M. 3D printing technology: The new era for food customization and elaboration. Trends Food Sci. Technol. 2018, 75, 231–242. [Google Scholar] [CrossRef]
- Weller, C.; Kleer, R.; Piller, F.T. Economic implications of 3D printing: Market structure models in light of additive manufacturing revisited. Int. J. Prod. Econ. 2015, 164, 43–56. [Google Scholar] [CrossRef]
- Acher, M.; Baudry, B.; Barais, O.; Jézéquel, J.-M. Customization and 3D printing: A challenging playground for software product lines. Assoc. Comput. Mach. 2014, 1, 142–146. [Google Scholar]
- Berman, B. 3-D printing: The new industrial revolution. Bus. Horiz. 2012, 55, 155–162. [Google Scholar] [CrossRef]
- Zhang, T.; Chu, J.; Wang, X.; Liu, X.; Cui, P. Development pattern and enhancing system of automotive components remanufacturing industry in China. Resour. Conserv. Recycl. 2011, 55, 613–622. [Google Scholar] [CrossRef]
- Khor, K.; Hazen, B. Remanufactured products purchase intentions and behaviour: Evidence from Malaysia. Int. J. Prod. Res. 2016, 55, 2149–2162. [Google Scholar] [CrossRef]
- Yu, Z.; Yu, X.; Minyue, J. Less is More: Consumer Education in a Closed-Loop Supply Chain with Remanufacturing. Omega 2020, 101, 102259. [Google Scholar]
- Guide, V.D.R.; Teunter, R.H.; van Wassenhove, L.N. Matching Demand and Supply to Maximize Profits from Remanufacturing. Manuf. Serv. Oper. Manag. 2003, 5, 303–316. [Google Scholar] [CrossRef] [Green Version]
- Chen, J.; Chi, C. Reverse channel choice in a closed-loop supply chain with new and differentiated remanufactured goods. J. Ind. Prod. Eng. 2019, 36, 81–96. [Google Scholar] [CrossRef]
- Mondal, C.; Giri, B.C. Investigating strategies of a green closed-loop supply chain for substitutable products under government subsidy. J. Ind. Prod. Eng. 2021, 1–24. [Google Scholar] [CrossRef]
- Abbey, J.D.; Meloy, M.G.; Guide, V.D.R.; Atalay, S. Remanufactured Products in Closed-Loop Supply Chains for Consumer Goods. Prod. Oper. Manag. 2015, 24, 488–503. [Google Scholar] [CrossRef]
Figure 1.
The effect of customization sensitivity coefficient on customization effort level.

Figure 2.
The impact of customized sensitivity coefficient on market demand.

Figure 3.
The impact of customized sensitivity coefficients on profits.

Figure 4.
The effect of customization cost on customization effort level.

Figure 5.
The impact of customization cost on market demand.

Figure 6.
The impact of customization costs on profits.

Publisher’s Note: MDPI stays neutral with regard to jurisdictional claims in published maps and institutional affiliations. |
© 2022 by the authors. Licensee MDPI, Basel, Switzerland. This article is an open access article distributed under the terms and conditions of the Creative Commons Attribution (CC BY) license (https://creativecommons.org/licenses/by/4.0/).
Share and Cite
MDPI and ACS Style
Sun, H.; Zheng, H.; Sun, X.; Li, W. Customized Investment Decisions for New and Remanufactured Products Supply Chain Based on 3D Printing Technology. Sustainability 2022, 14, 2502. https://0-doi-org.brum.beds.ac.uk/10.3390/su14052502
AMA Style
Sun H, Zheng H, Sun X, Li W. Customized Investment Decisions for New and Remanufactured Products Supply Chain Based on 3D Printing Technology. Sustainability. 2022; 14(5):2502. https://0-doi-org.brum.beds.ac.uk/10.3390/su14052502
Chicago/Turabian StyleSun, Haoyu, Huiqi Zheng, Xiaoyang Sun, and Wei Li. 2022. "Customized Investment Decisions for New and Remanufactured Products Supply Chain Based on 3D Printing Technology" Sustainability 14, no. 5: 2502. https://0-doi-org.brum.beds.ac.uk/10.3390/su14052502
Note that from the first issue of 2016, this journal uses article numbers instead of page numbers. See further details here.