
Homogenising the Design Criteria of a Community Battery Energy Storage for Better Grid Integration


Discipline of Engineering and Energy, Murdoch University, Perth, WA 6150, Australia
*
Author to whom correspondence should be addressed.
Sustainability 2022, 14(2), 733; https://0-doi-org.brum.beds.ac.uk/10.3390/su14020733
Submission received: 3 November 2021
/
Revised: 22 December 2021
/
Accepted: 31 December 2021
/
Published: 10 January 2022
(This article belongs to the Special Issue Frontier Technologies for the Utilization of Power Generation and Energy Sources)
Abstract
:Historically, minimum system demand has usually occurred overnight. However, in recent years, the increased penetration of rooftop photovoltaic systems (RPVs) has caused an even lower demand at midday, forcing some of the conventional generators to shut down only hours before the evening peak demand period. This further complicates the job of power system operators, who need to run the conventional generator at the minimum stable level at the midday low-demand period so that they can reliably supply power during the peak periods. Employing a community battery storage system can alleviate some of the technical issues caused by the high penetration of RPVs. This paper proposed a design criterion for community battery energy storage systems and employed the battery for the improvement of the duck curve profile and providing the desired level of peak-shaving. Furthermore, remote communities with high penetration of RPVs with a community battery energy storage can achieve the desired level of self-sufficiency. To this end, this study recommends and confirms an applicable design criterion for community battery energy storage. The study shows that the suitable size of community battery storage should be based on the community’s daily excess generation and consumption requirements. The results of various scenarios performed on the proposed design criterion show the extent to which the desired objectives of peak-shaving, duck curve mitigation, and self-sufficiency can be achieved.
1. Introduction
The increase in rooftop photovoltaic systems (RPVs) penetration, mainly in residential buildings, has significantly decreased carbon footprints and has assisted governments in achieving clean energy targets. The RPVs in some of the utilities now represent the largest energy resources, with an output equivalent to as high as three times the largest dispatchable generator [1]. Moreover, the generation from RPVs has satisfied almost half of the underlying energy demand for some trading intervals on some days [1]. As a result of this, conventional generators are bidding at low prices during low demand to ensure they get dispatched and avoid shutting down. The wholesale electricity market has even started to experience negative prices at midday, which historically happened overnight [2].
On the other hand, a cluster of moving clouds over a small region can significantly fluctuate the output power of the RPVs. Therefore, the conventional generators must run at the minimum stable level in order to be available to supply the load when demand abruptly increases in such cases. If the conventional generators are shut down, they usually have a minimum start-up of a couple of hours before they can supply the load. Hence, the conventional generators are not flexible enough to respond to such rapid load demand changes.
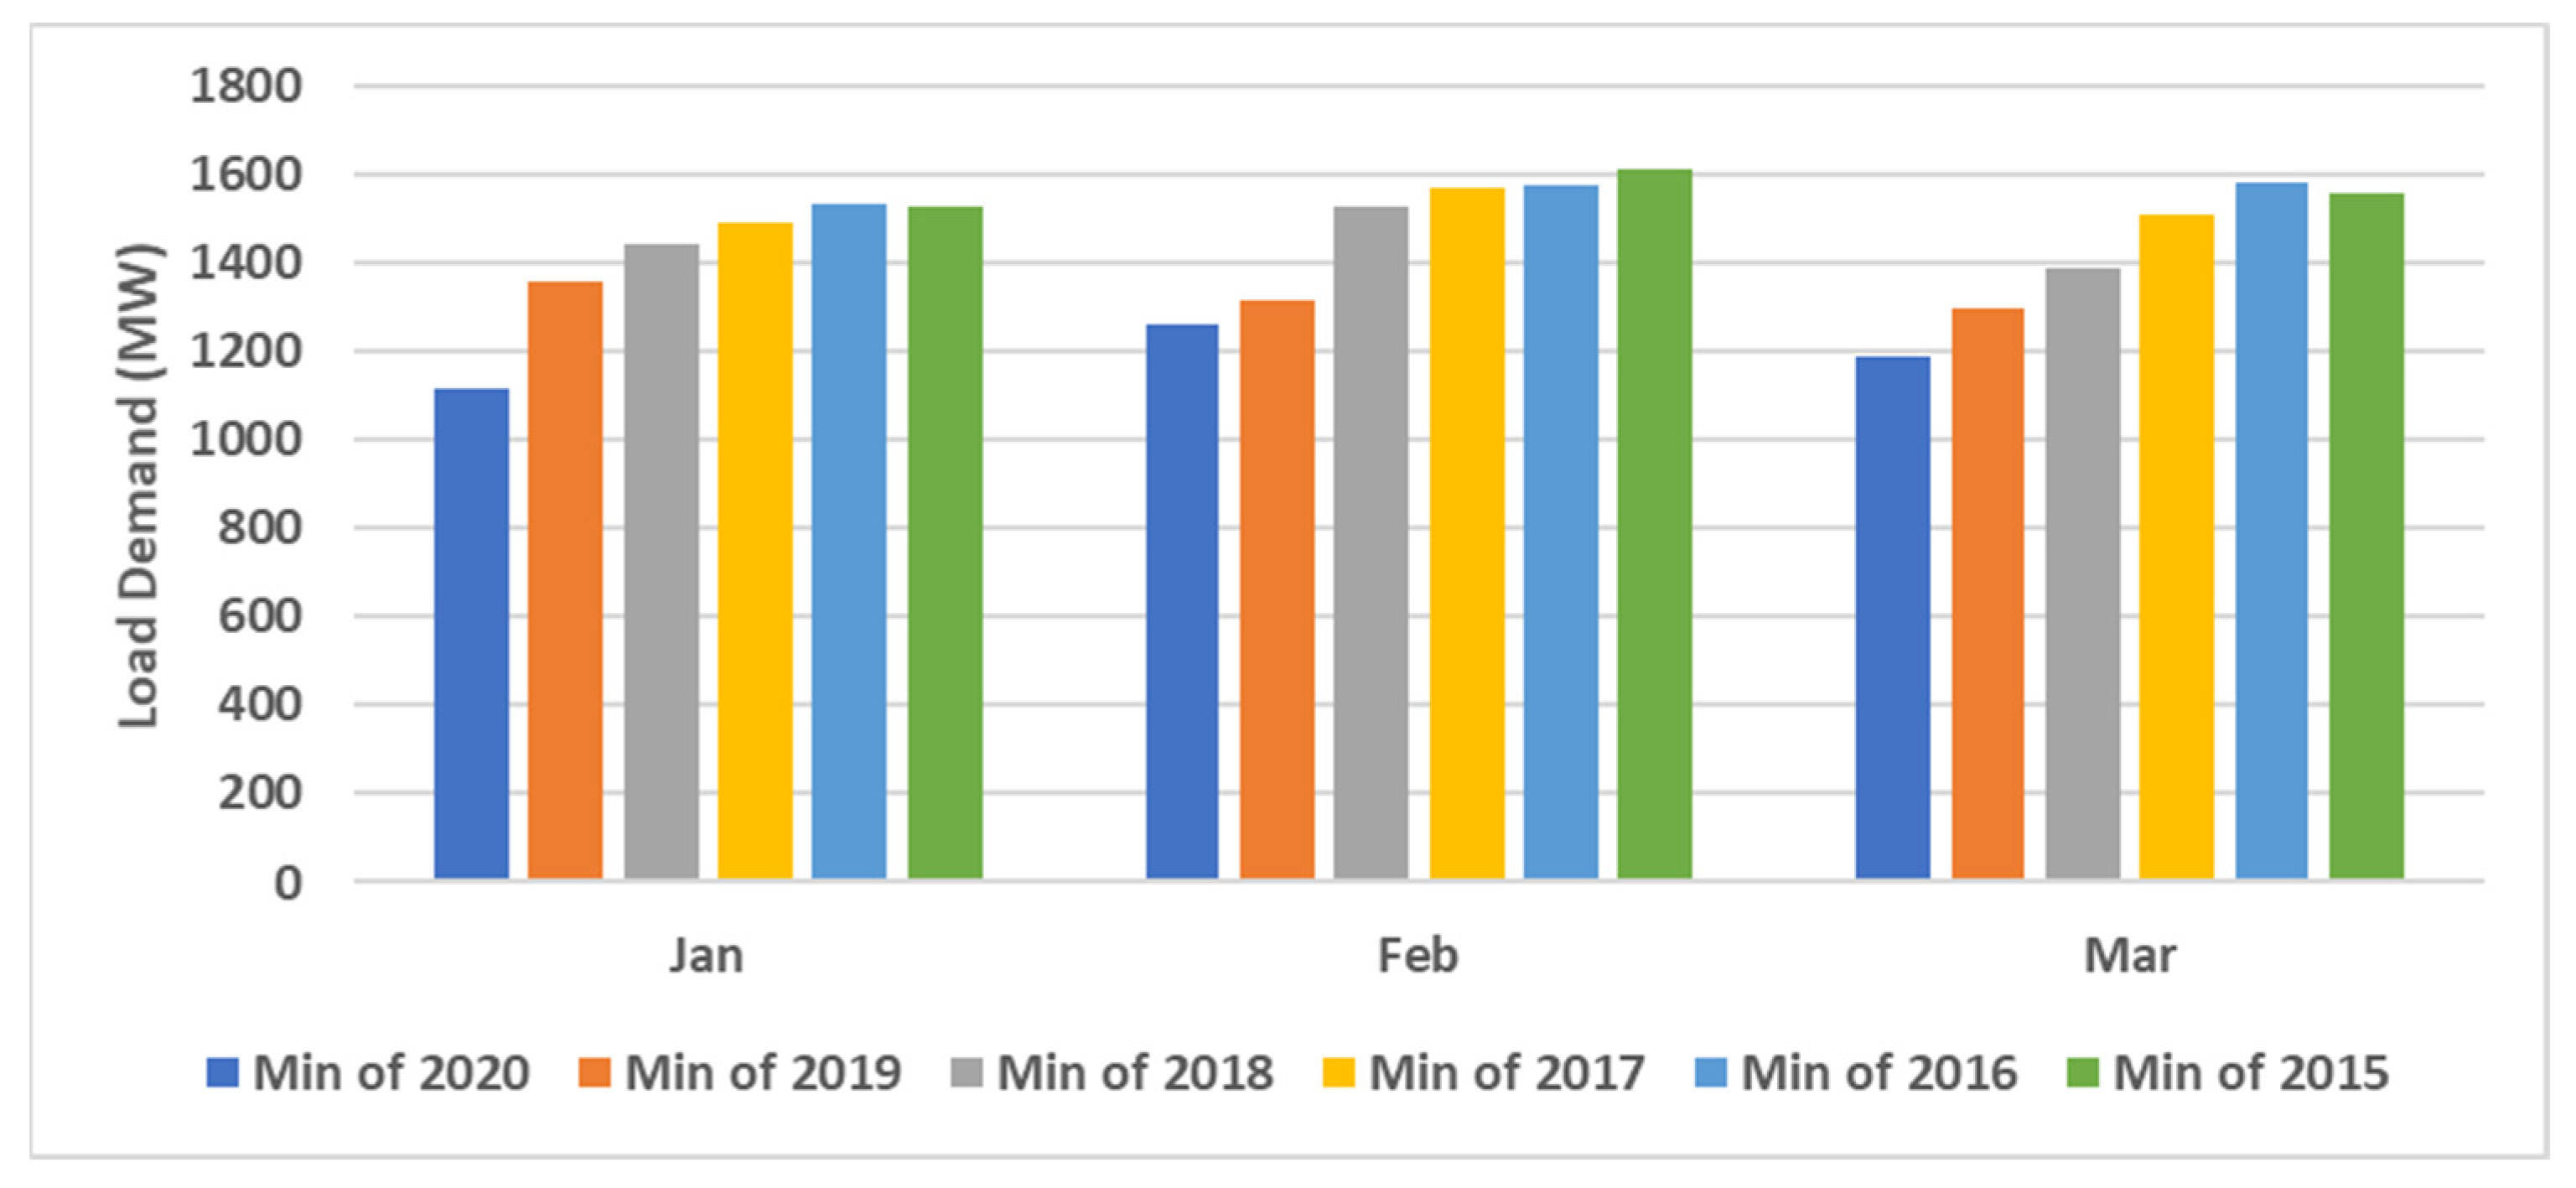
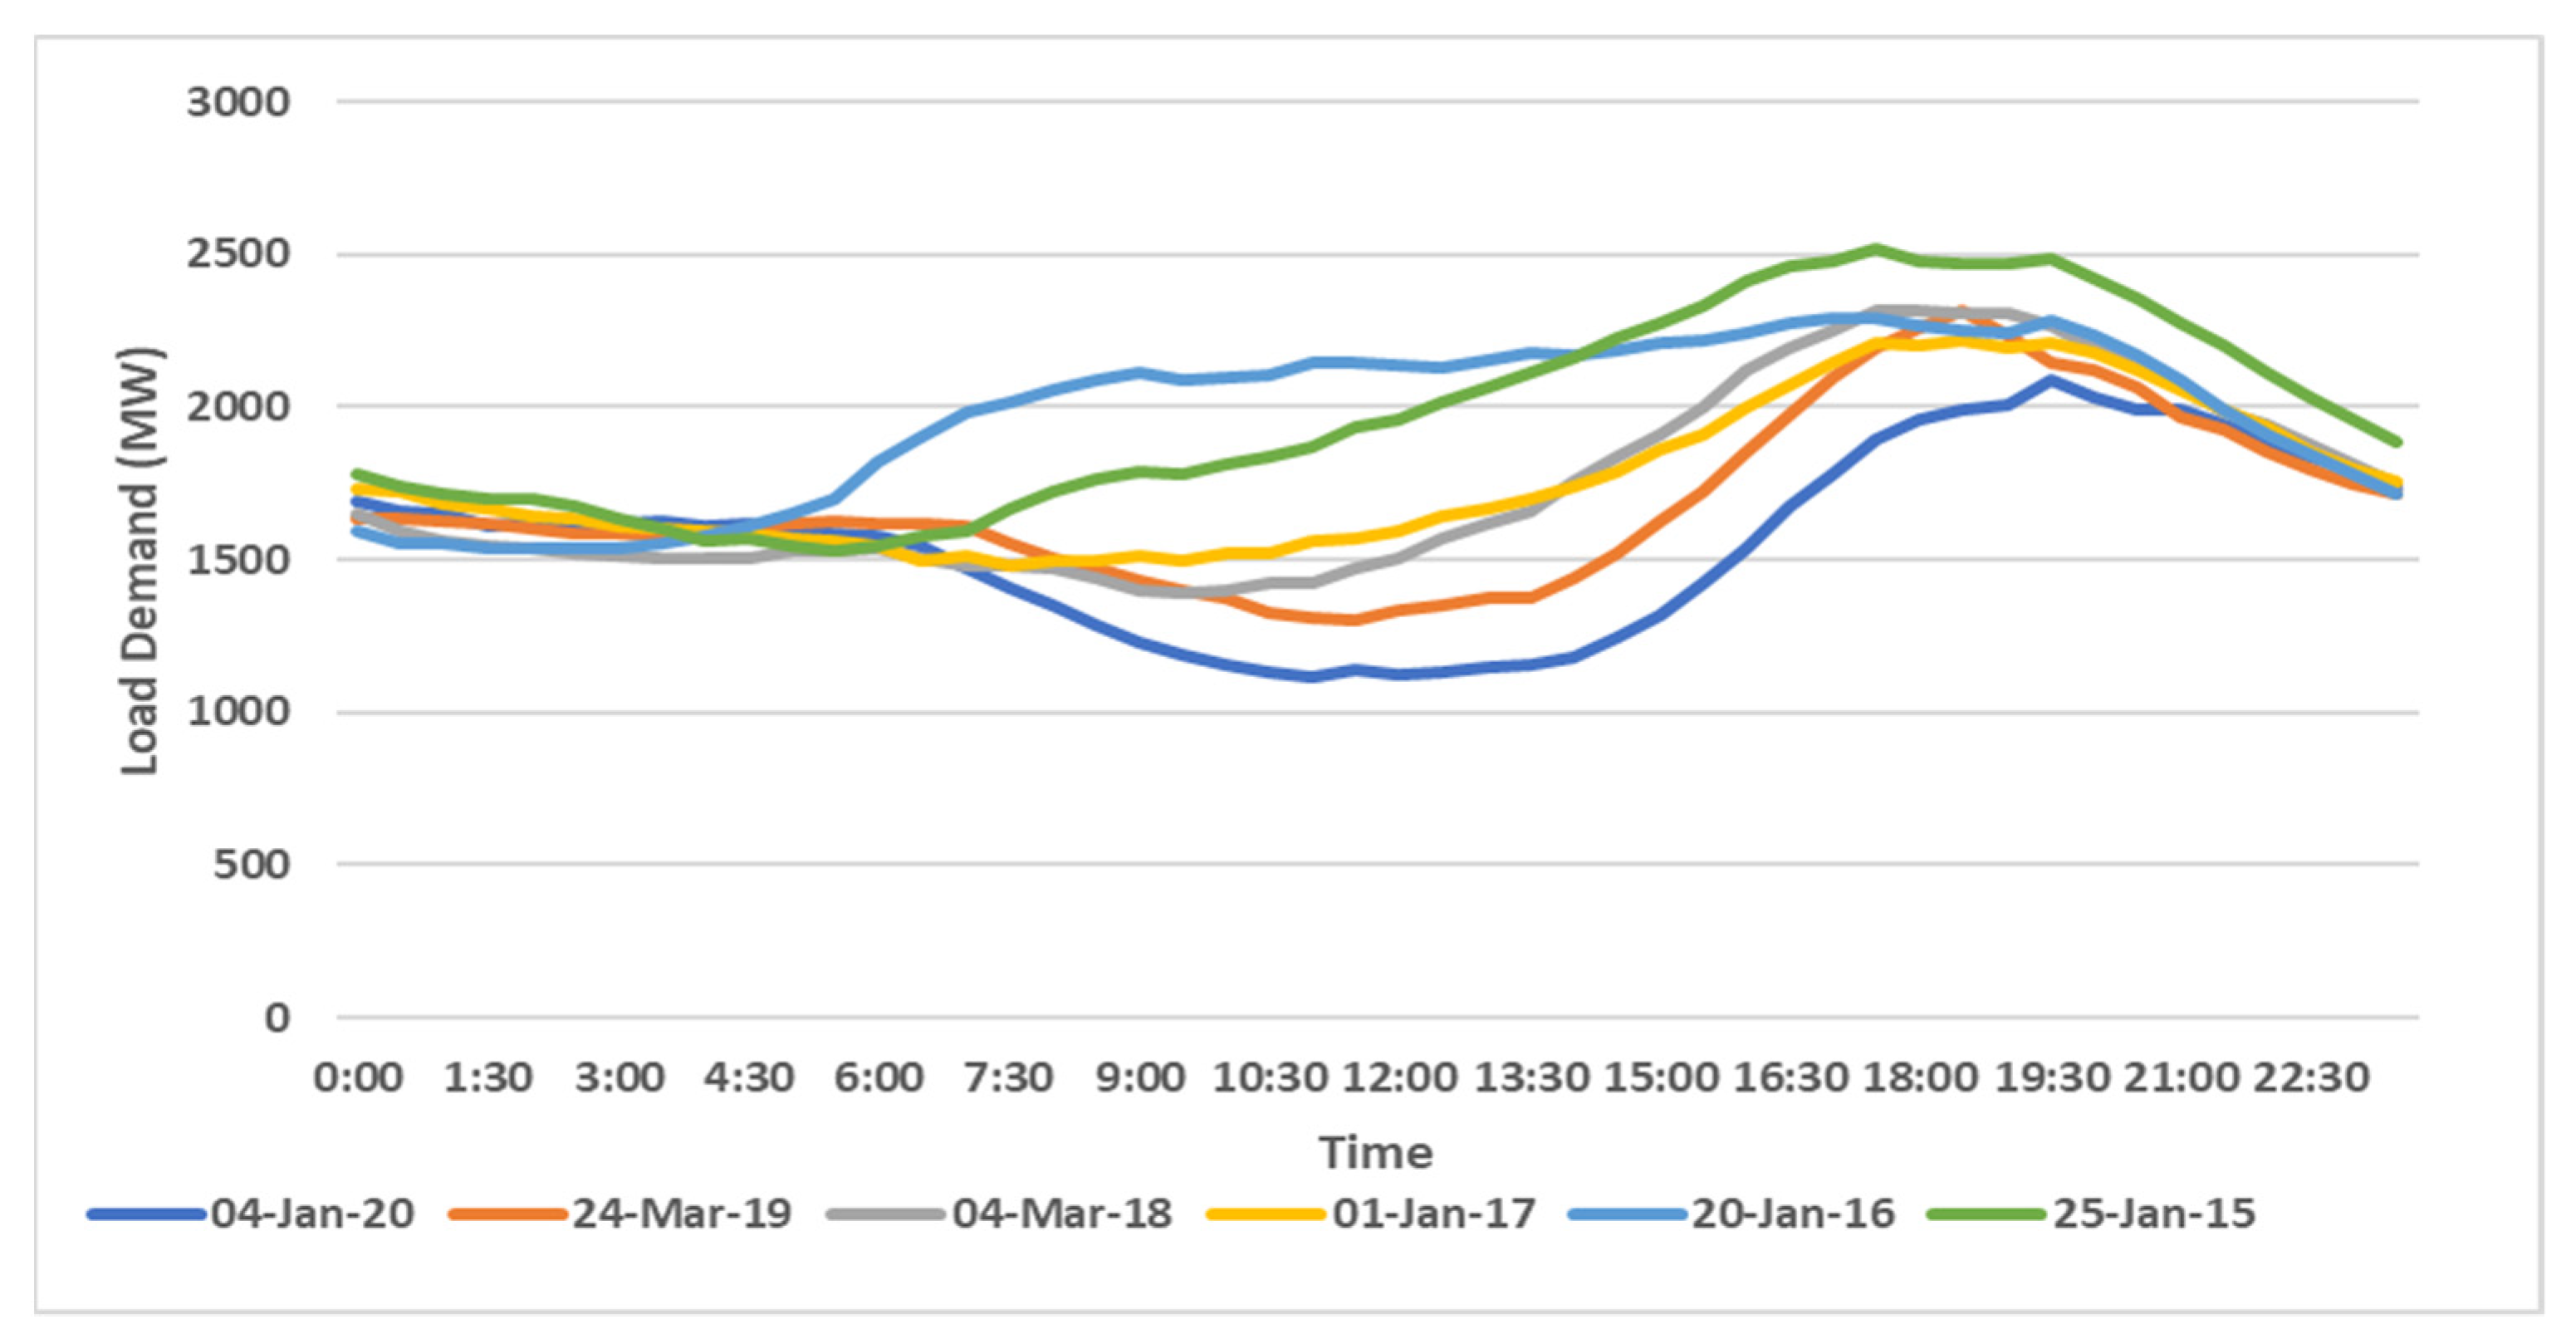
Figure 1 shows the average minimum monthly load demand of the South West Interconnected System in Western Australia. This figure shows that the minimum load demand has decreased by approximately 25% from the first quarter of 2016 to 2020 [3]. However, before 2016, the lowest demand was usually observed overnight, which was a relatively suitable time for conventional generators to shut down temporarily and restart the next day. However, recently, as low demand periods started to occur during midday, as shown in Figure 2, the generator usually does not have enough flexibility to shut down and restart to cover the evening peak in a short period. Suppose this trend of increased penetration of RPVs continues. In this case, it will not be an economically viable option for these generators to remain online during midday low-demand periods, presenting a real risk of blackout or extensive load-shedding. Moreover, the RPVs cannot contribute towards peak-shaving and improving self-sufficiency on their own.
The highly inexpensive market for RPV system installation and upfront subsidy provided by most governments has resulted in a further increase in the penetration of RPVs. Reference [4] addresses the challenges of increased penetration of RPVs by proposing the employment of community solar projects with embedded residential battery energy storage systems (BES). This scheme can be utilised in some newly built strata complexes. However, the BES installation in residential households is minimal currently, primarily due to the high cost and long payback period [5]. This means that challenges brought in by the increased unmanaged penetration of RPVs will further worsen and threaten the power system security and reliability.
One of the suggested technological solutions to address the challenges of high penetration of RPVs is the deployment of community BES (CBES) [1], which is economical at the utility and commercial-scale level. A CBES can be important in peak-shaving to alleviate an unwanted duck curve profile in the network, thus achieving the desired level of self-sufficiency. The stored energy in a CBES can also be purchased by the neighbouring households in the community (that do not have an RPV) under a power purchase agreement (PPA), at an economical rate compared to the electricity unit charge rate [6,7]. A CBES provides a reasonable level of flexibility to get the maximum use of generation from the RPV and could avoid exporting a significant portion of that to the grid. In addition to this, the CBES has a sufficient design margin that can handle the uncertainty of solar generation during days of varying solar generation.
On the other hand, it is interesting to note that the electricity tariffs are significantly different at the rural and remote locations because of the financial and technical challenges associated with supplying electricity to such areas [8]. The majority of remote locations rely on fossil fuel-based electricity generation, which is costly, and these costs can be significantly reduced by deploying RPVs integrated with CBES [9]. In such a case, the CBES can enhance the self-sufficiency of such remote localities.
A significant amount of research on self-sufficiency aspects of residential and individual BESs, peak-shaving, and duck curve profile have been conducted. Klingler [10] proposed that the customer’s load, base, and peak demand be considered for the system size’s design. On the other hand, [11] outlined the importance of peak-shaving capabilities in integrating RPVs into the grid, while system design accomplishing maximum self-sufficiency may lead to BES oversizing [12].
In terms of BES design criteria, [13] outlines the fact that a BES low-energy capacity and significant power charge rate results in a rapid BES saturation, leading to the export of unwanted power to the utility feeder. Furthermore, a high discharge rate of BES can limit the potentiality of BES to address the demand at levels that are rational [14]. The possibility of remotely controlling BES for communities where households have RPVs has been outlined by [15], whilst the optimal sizing and placement of RPV and BES to reduce the total cost and improve reliability was discussed in [16,17]. Various real-time operation modes for BES design for households with RPVs operating under time-of-use tariffs were proposed in [18]. Likewise, [19] proposed a framework for optimal charge and discharge operation of BES for RPVs to gain the maximum cost-benefit. Similarly, [20] developed a control approach for the optimal energy flow from RPVs with BES on the basis of its state of charge. Alternatively, another method was proposed in [21] for the energy management and optimisation in smart households consisting of RPVs and BES in a controllable or uncontrollable load situation. Reference [22] studied the optimal sitting and sizing of BES while minimising the cost incurred resulting from voltage fluctuation, losses, and peak demand. Reference [23] studied how the BES models affect its state of charge and state of health estimation and how simplified models may lead to oversized BESs. Reference [24] developed a BES model based on its charging and discharging characteristics, whereas [25] conducted a review of current perspectives in the economic analysis of BES investment.
The majority of the reviewed literature has outlined the potential advantages of RPVs and discussed the BES design criteria for individual households. BES is significantly expensive on a small scale, and also there is less load profile flexibility to better utilise BES. However, the above literature has not comprehensively addressed how CBES can address RPVs’ unmanaged penetration and employ them to improve the community’s self-sufficiency and peak shaving. The above literature highlights some areas in which a new design criterion can be developed. On the basis of this background, this paper proposes a design criterion for CBESs based on the penetration level of RPVs in the community. The proposed design criterion can help improve the utilities’ technical issues, such as increasing the community’s self-sufficiency, mitigating duck curve profile, and enabling peak-shaving. The proposed design criteria formulate the design requirements to achieve each objective. The system designer can appropriately size the system based on the more preferential objectives than others. Thus, the significant contribution is formulating the parameters for the mitigation of duck curve, increasing peak-shaving, and enabling self-sufficiency on the basis of the size of the community with RPVs with the help of a CBES.
2. Proposed CBES Design Criteria
As discussed above, a CBES is more economical than individual residential-owned BESs [1], especially when its costs are distributed over a community with several households. In this background, sooner or later, it will be inevitable for the utilities or aggregators to employ properly designed CBES to address technical challenges such as duck curve profile and peak-shaving, regardless of the imposed additional cost.
This study outlines a design for the CBES system based on self-sufficiency improvement, peak-shaving of the demand, and mitigation of the duck curve. This design is not location-specific and can be employed when a CBES is to be used at any location within the network. CBES’ design is influenced mainly by input parameters of the number of customers willing to purchase energy from the CBES under a PPA and the number of households with RPVs (). These input parameters are employed in the proposed CBES design for determining the CBES’s energy capacity () and power charge/discharge rate (). Table 1 lists and defines the proposed concept’s design indices. If , the excess is fed to the grid. For load-balancing and peak-shaving, the CBES design should aim to recognise a peak load that is less than or equal to the annual average addressed by the CBES. Table 2 presents the critical assumptions on timings used in this study; the assumptions made are valid for most of the year, but this can vary on the basis of the location, weather, and other parameters.
The CBES discharging/charging rate is supposed to be greater than the community’s RPVs peak generation for duck curve mitigation, i.e.,
Nonetheless, in order for it to be further improved, CBES discharging/charging rate is supposed to be greater than the community’s RPVs average of maximum daily excess generation, i.e.,
For the accuracy of conditions (2) and (3), the capacity of the CBES’s energy storage is supposed to be larger than or equal to the daily excess generation’s average over the year, i.e.,
However, the CBES discharging/charging rate is supposed to be greater than the peak demand, for peak-shaving, i.e.,
Additionally, the CBES’s energy storage capacity is supposed to be greater than the community’s energy consumption over the peak duration, i.e.,
Ultimately, for self-sufficiency, the average of maximum daily excess generation from the RPVs and the discharging/charging rate of CBES is supposed to be larger than the maximum daily excess consumption, i.e.,
Moreover, the CBES’s energy capacity and the mean of the daily excess generation over a year should be larger than the mean of the consumed daily excess energy over a year, i.e.,
Although (7) and (8) result in competitive self-sufficiency, for attaining maximum self-sufficiency, the discharge/charge rate of CBES is supposed to be larger than the maximum excess consumption observed in the year, i.e.,
Furthermore, the CBES’s energy capacity and the mean of the daily excess generation over a year should be larger than the maximum of the consumed daily excess energy over a year, i.e.,
To sum up, the optimum design criterion of the CBES to reduce the export to the grid and ensure power requirement satisfaction is expressed by
Once the CBES is designed, its performance in achieving the desired objectives can be reviewed on the basis of the following capability indices. The capability of the CBES’s discharge rate in terms of realising the improved duck curve profile can be expressed by
On the other hand, the capability of the CBES’s energy capacity in terms of realising the improved duck curve profile can be given by
Similarly, the capability index of the CBES’s charge/discharge rate in terms of realising the peak-shaving can be expressed by
while that capability of CBES’s energy capacity for the same purpose can be given by
Finally, the capability index of CBES’s charge/discharge rate for realising high self-sufficiency can be expressed by
while its energy capacity for the same objective can be given by
The capability indices close to unity show the CBES is adequately designed to achieve the respective objective. The following section presents the performance evaluation of the proposed design criteria.
It is to be noted that the internal information of the BES such as its model or controller do not need to be considered at this design stage, as far as some key parameters such as the roundtrip efficiency and charge/discharge rate are considered. It is also to be noted that the over- and under-generation issues were the focus of the above design criteria. Thus, its key aim is using the CBES for mitigating the fluctuations in power system by decreasing the exported power to the grid at midday and enhancing the network’s peak-shaving. Even though this over- and under-generation indirectly impacts the voltage, the voltage variations were not directly considered in this study.
3. System Performance Evaluation
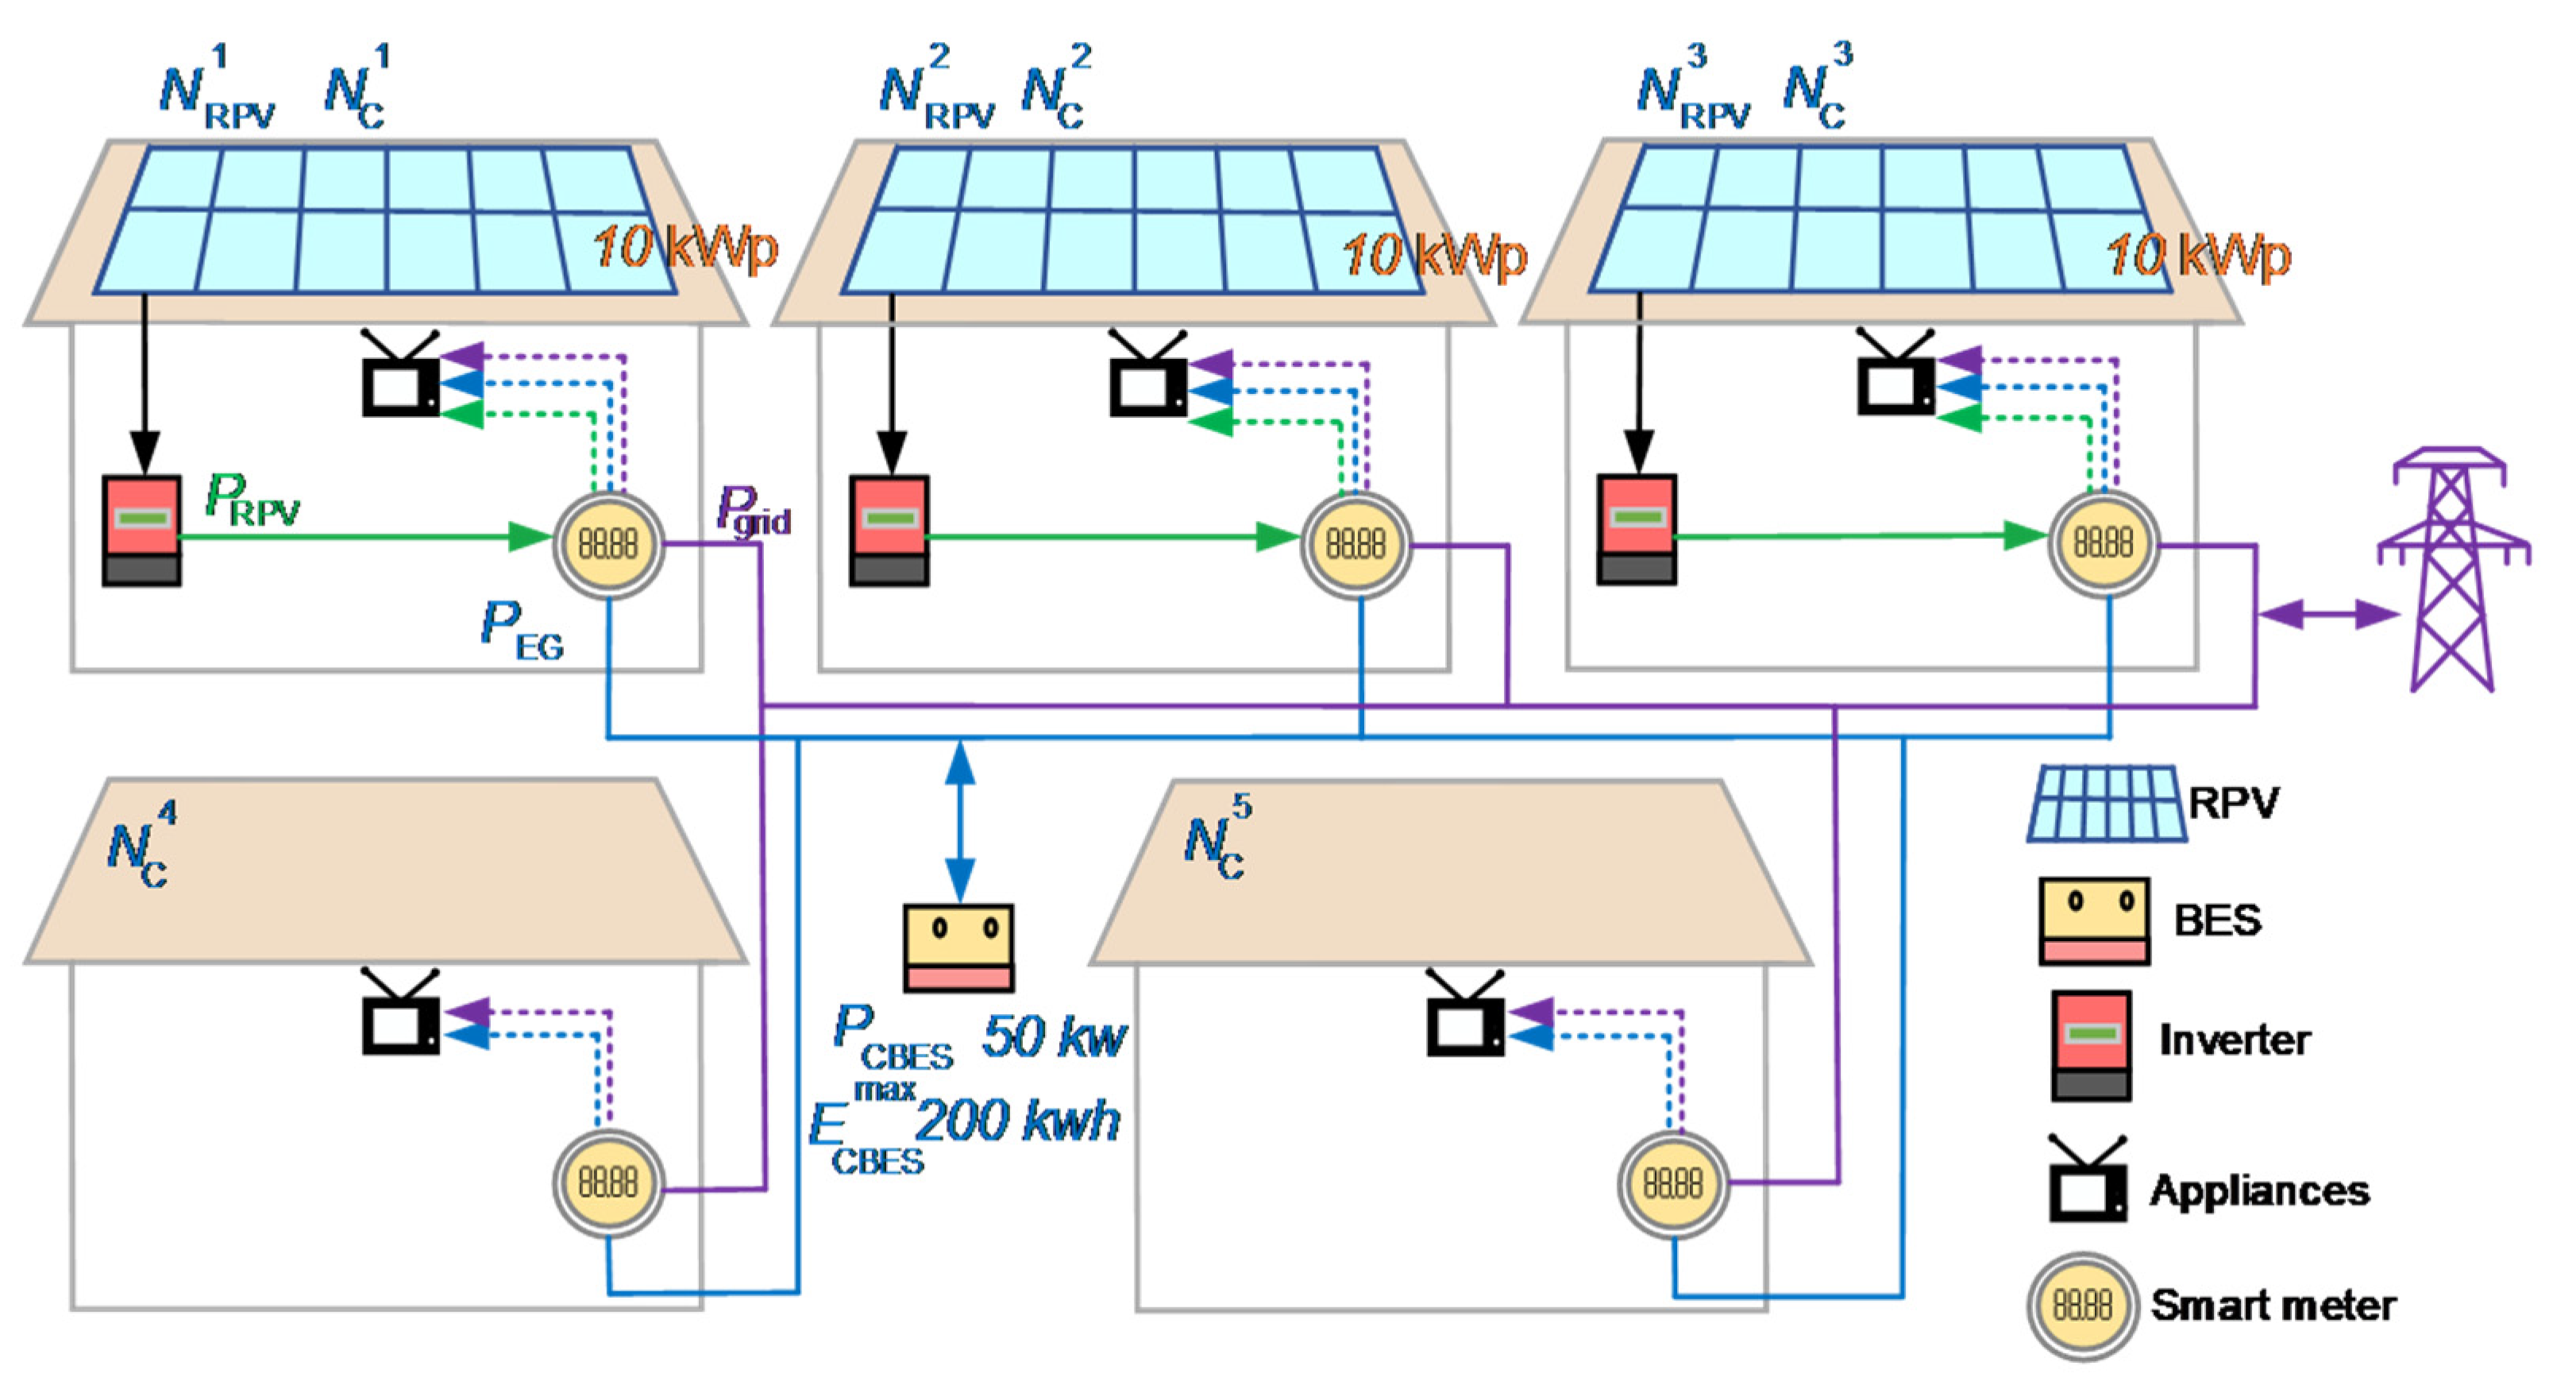
For the proposed concept’s performance evaluation, a CBES consists of some (3 to 10) households with RPVs of 10 kWp each, and some (5 to 50) households within the same community that are willing to purchase energy from the CBES under a PPA contract, were considered. The CBES proposed for the system had a power charge/discharge rate of 5 to 200 kW, and its energy storage capacity was 20 to 600 kWh. The study considers the new BES with roundtrip efficiency of 89%. The example case consists of three households with RPVs of 10 kWp and five households within the community involved with this program, as shown schematically in Figure 3. The RPV generation and residential consumption and data used in this study were retrieved from Ausgrid’s 2013 Solar Home Electricity Data [26]. This data shows 30 min RPVs generation and electricity consumption of 300 households. Relevant number of households are picked up on the basis of the study requirement for each scenario. The RPVs installed in this community were of small size. Therefore, a suitable multiplier was applied to scale the RPVs generation output for 10 kWp system. MATLAB was employed used for performance evaluation.
The performance of the suggested design is discussed by observing the quantities for self-sufficiency, peak-shaving capability, and the duck curve profile during three different periods as the result of the designed CBES, as discussed below.
3.1. RPV-Equipped Households and Number of Customers
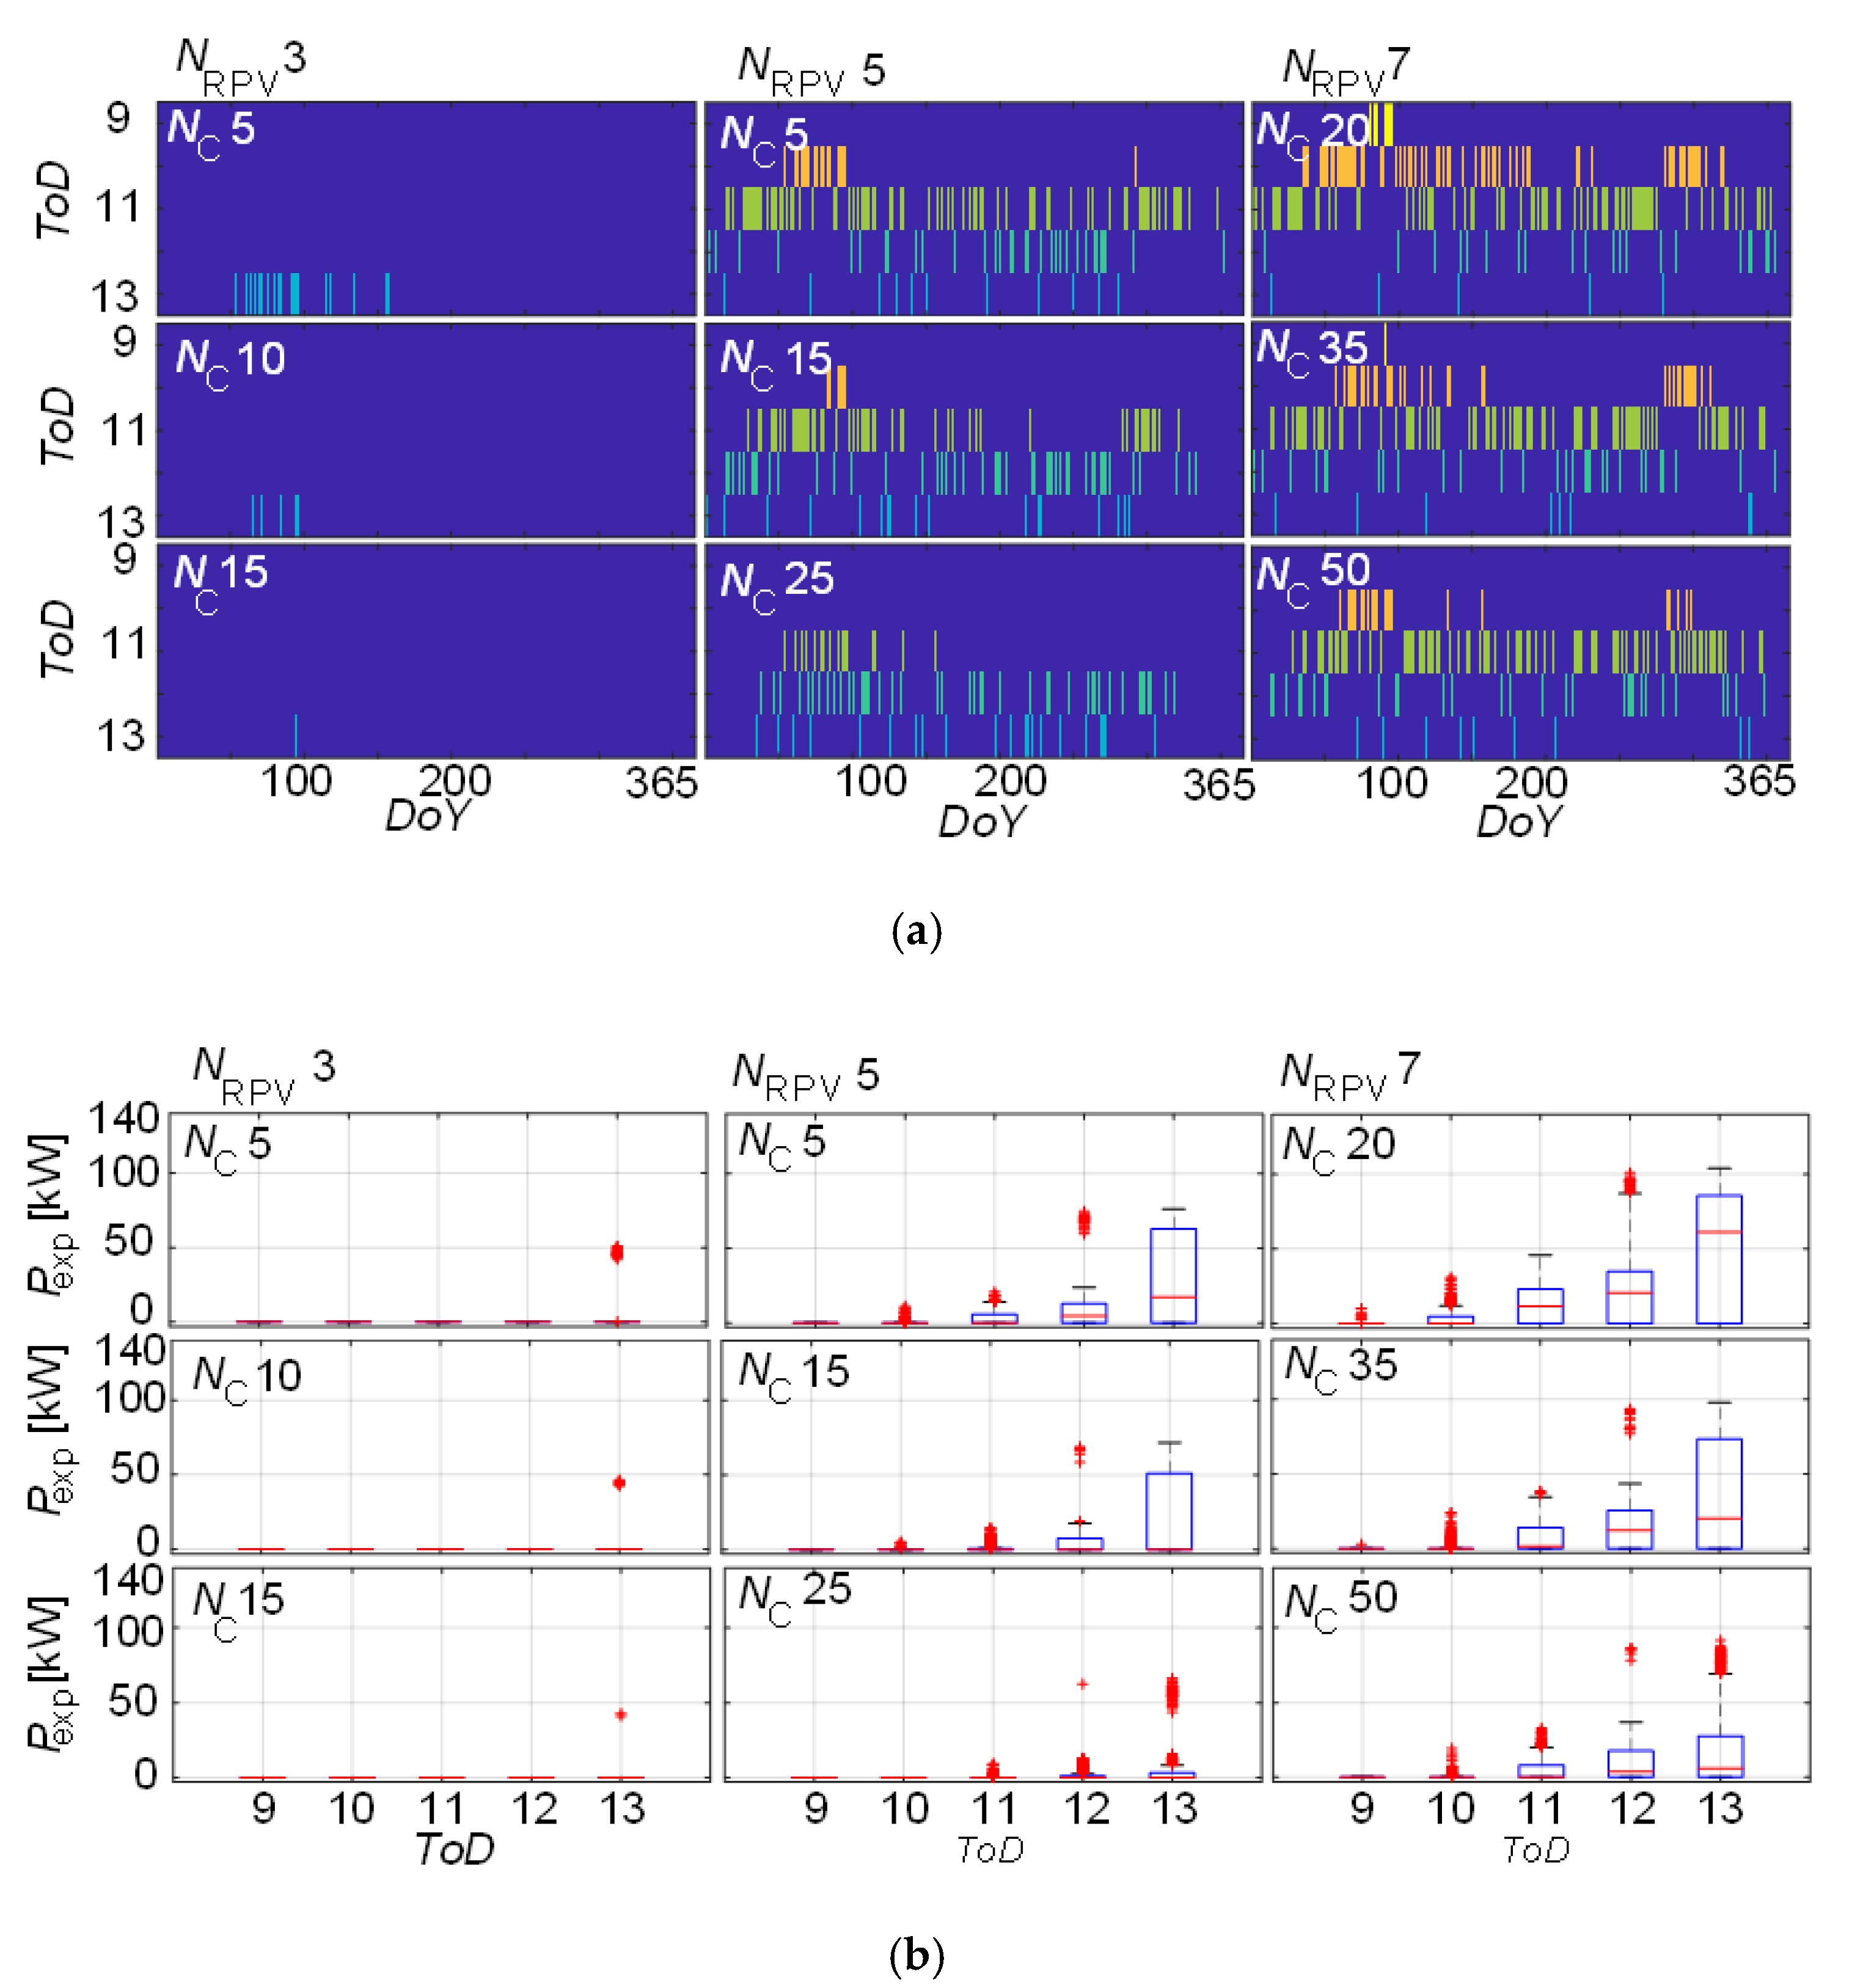
The impact of the number of customers purchasing energy from the CBES under a PPA and households with RPVs in the community is evaluated using a sensitivity analysis. In this study, the first was varied from 3 to 10, while the latter was varied from 5 to 50. It was given that the CBES’s energy capacity and power charge/discharge rate were 200 kWh and 50 kW, respectively, as displayed in Table 3. The performance evaluation for self-sufficiency realisation, peak-shaving enhancement, and duck curve mitigation of the proposed design criterion is explained below.
The first scenario assumed three community households with RPVs, while customers who purchased electricity under a PPA increased from 5 to 15. In such a case, the CBES’s observed performance was as below:
- In terms of power, condition (7) to achieve high self-sufficiency was met by having the average maximum daily excess consumption ( less than and the average daily maximum daily excess RPVs generation ). The system design parameter can even satisfy the yearly highest excess consumption in all studied three instances. A greater than unity self-sufficiency capability index for the CBES’s charge/discharge rate of Table 3 verified this.
- In terms of energy, the high self-sufficiency condition of (8) was met by having the average daily excess energy consumption () less than and the average daily excess generation ). A greater than unity self-sufficiency capability index of in Table 3 also verified this.
As seen from Table 3 and Figure 4, Figure 5 and Figure 6, these input design parameters for the specified size of CBES ticked all the boxes by mitigating duck curve profile and providing high self-sufficiency, which came with high peak-shaving capability.
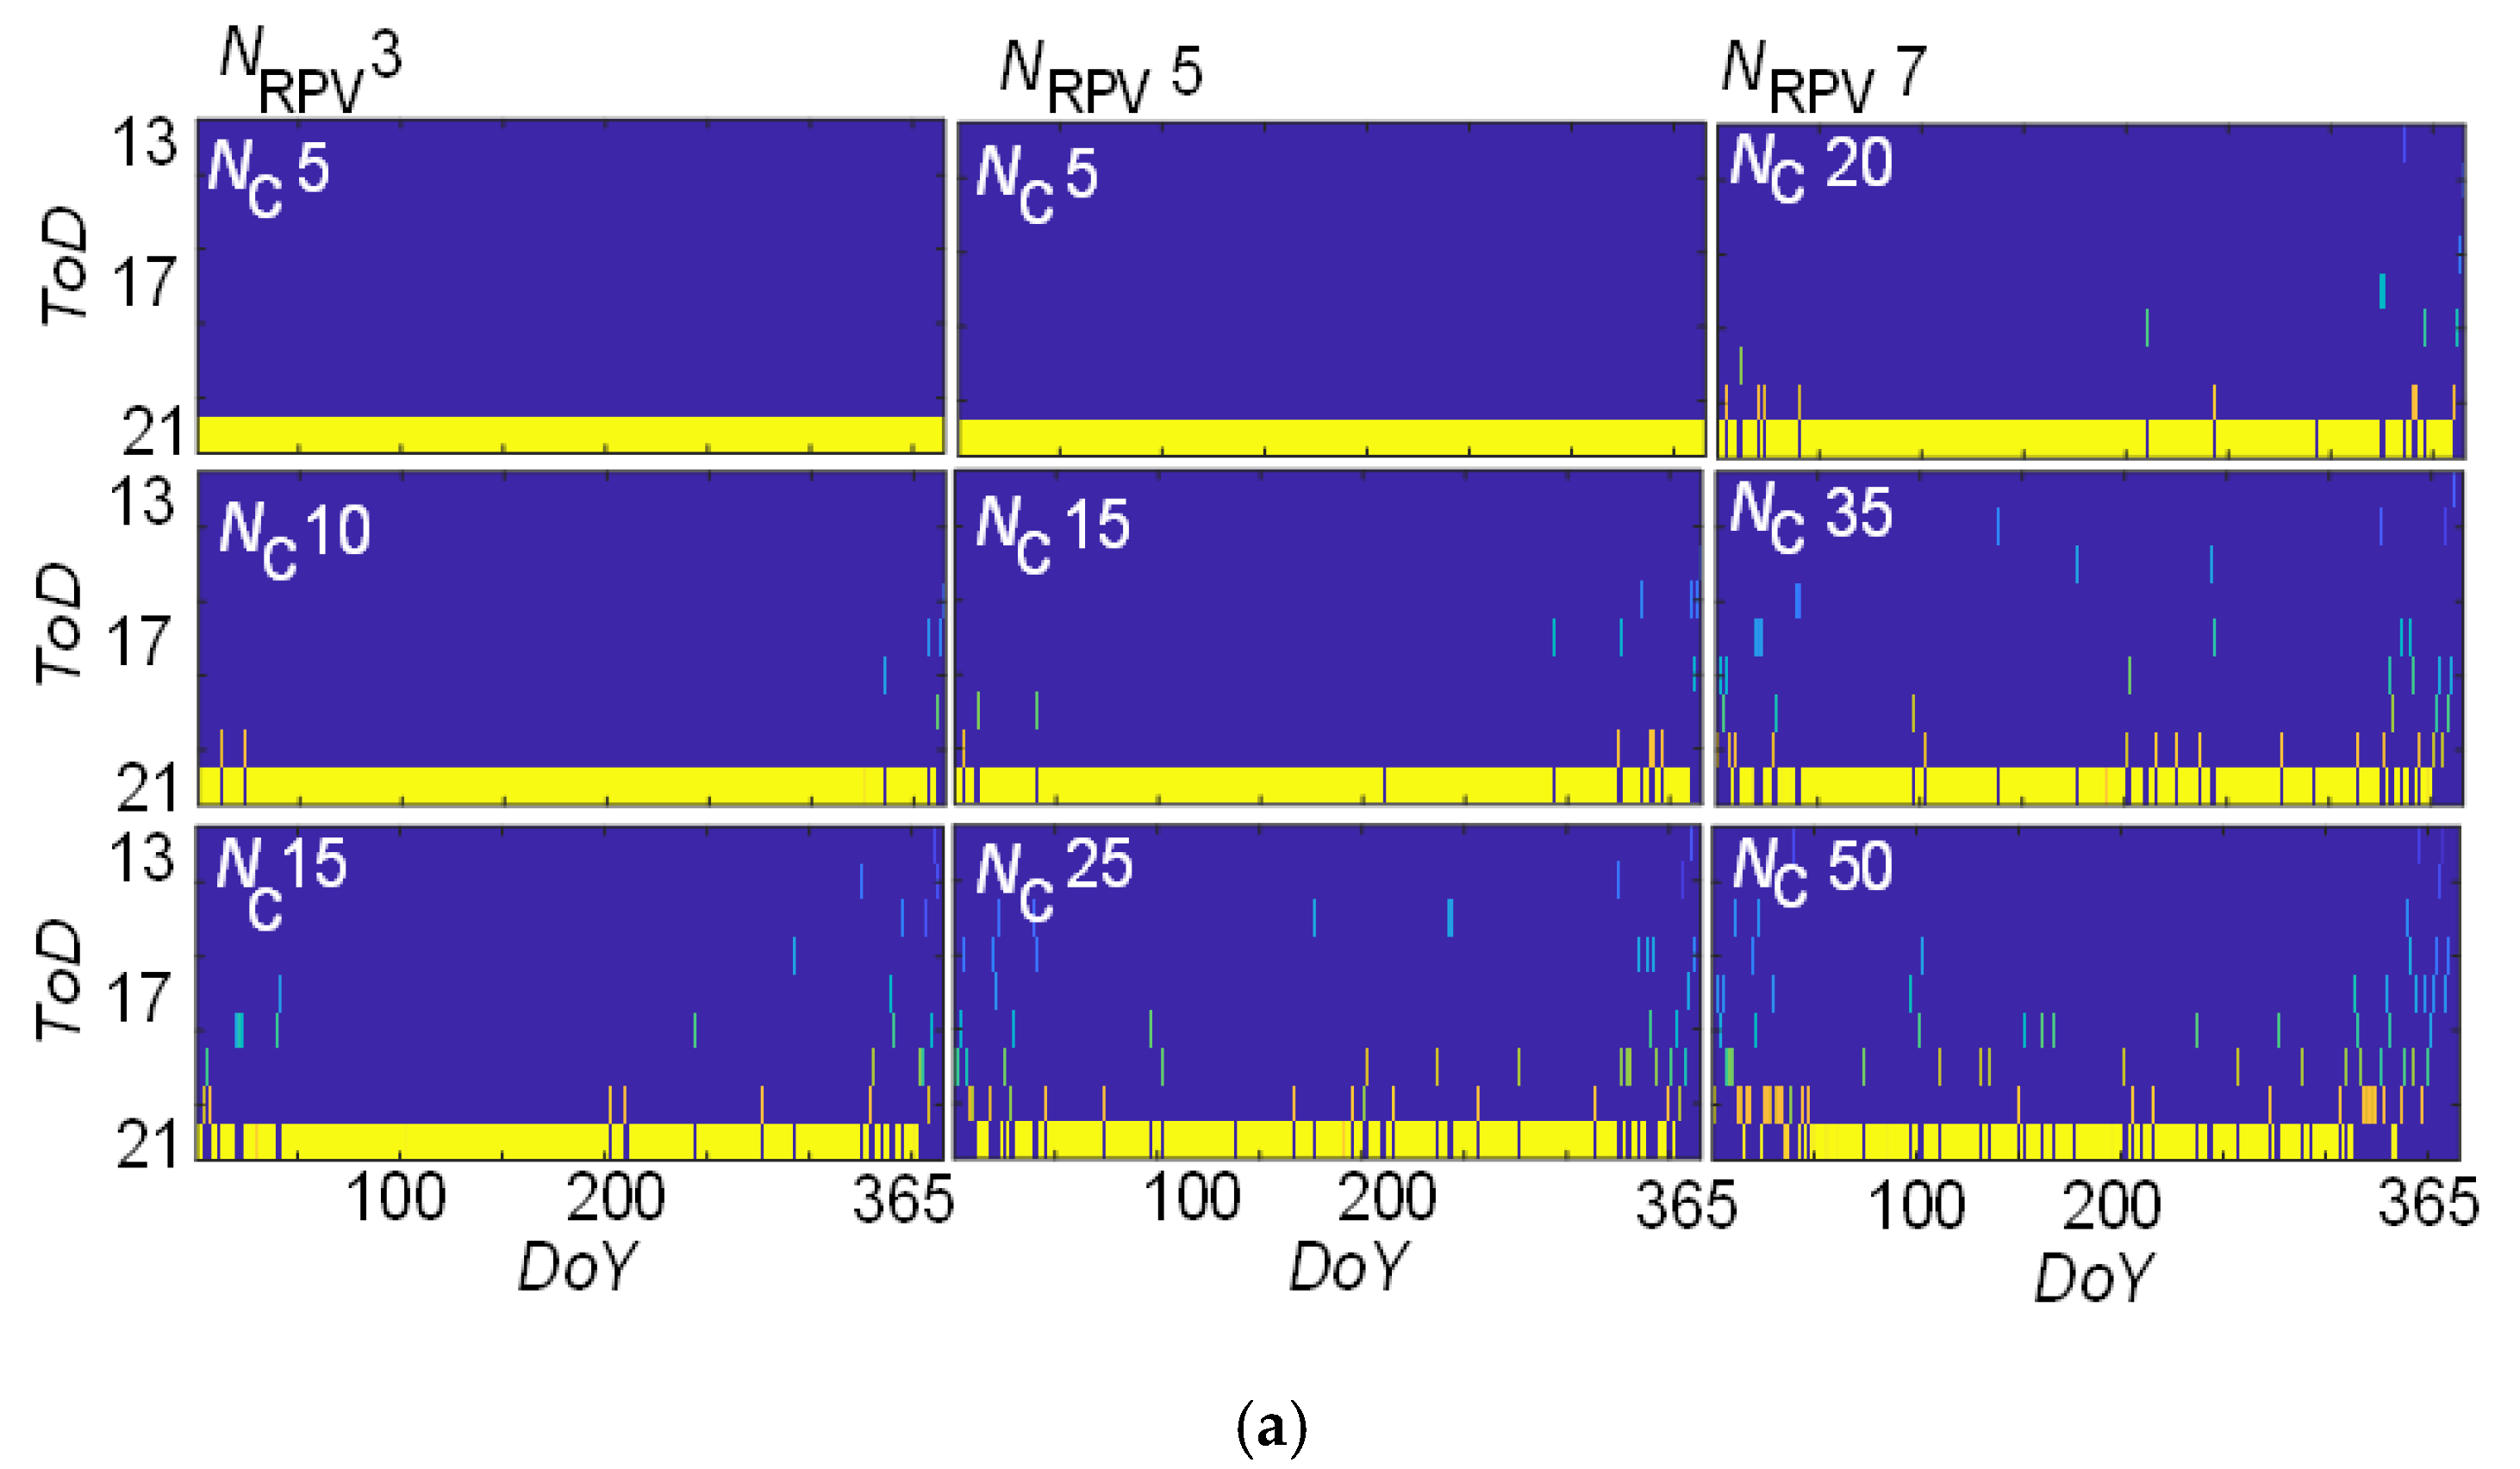
The second scenario assumed five community households with RPVs, while the number of customers under a PPA increased from 5 to 25. In such a case, the CBES’s observed performance was as below:
- In terms of power, condition (3) for the duck curve profile mitigation was unsatisfied as the RPVs’ average excess daily maximum generation ) was higher than and . Therefore, the duck curve profile would be observed, as seen from Figure 5a, less than the unity duck curve profile improvement capability index of ; Table 3 also verifies this.
- In terms of energy, the self-sufficiency condition of (8) was met by having the average daily excess generation lower than and the average daily excess energy consumption over a year . However, due to the low , firstly the duck curve profile was observed.
Secondly, because of the CBES’s inability to store most of the excess generation, a medium SS was observed in the third time slot when the number of households under PPA was quite large (i.e., 25).
Likewise, Figure 4, Figure 5 and Figure 6 show that the duck curve profile flattened with a slight reduction in self-sufficiency when increased from 15 to 25.
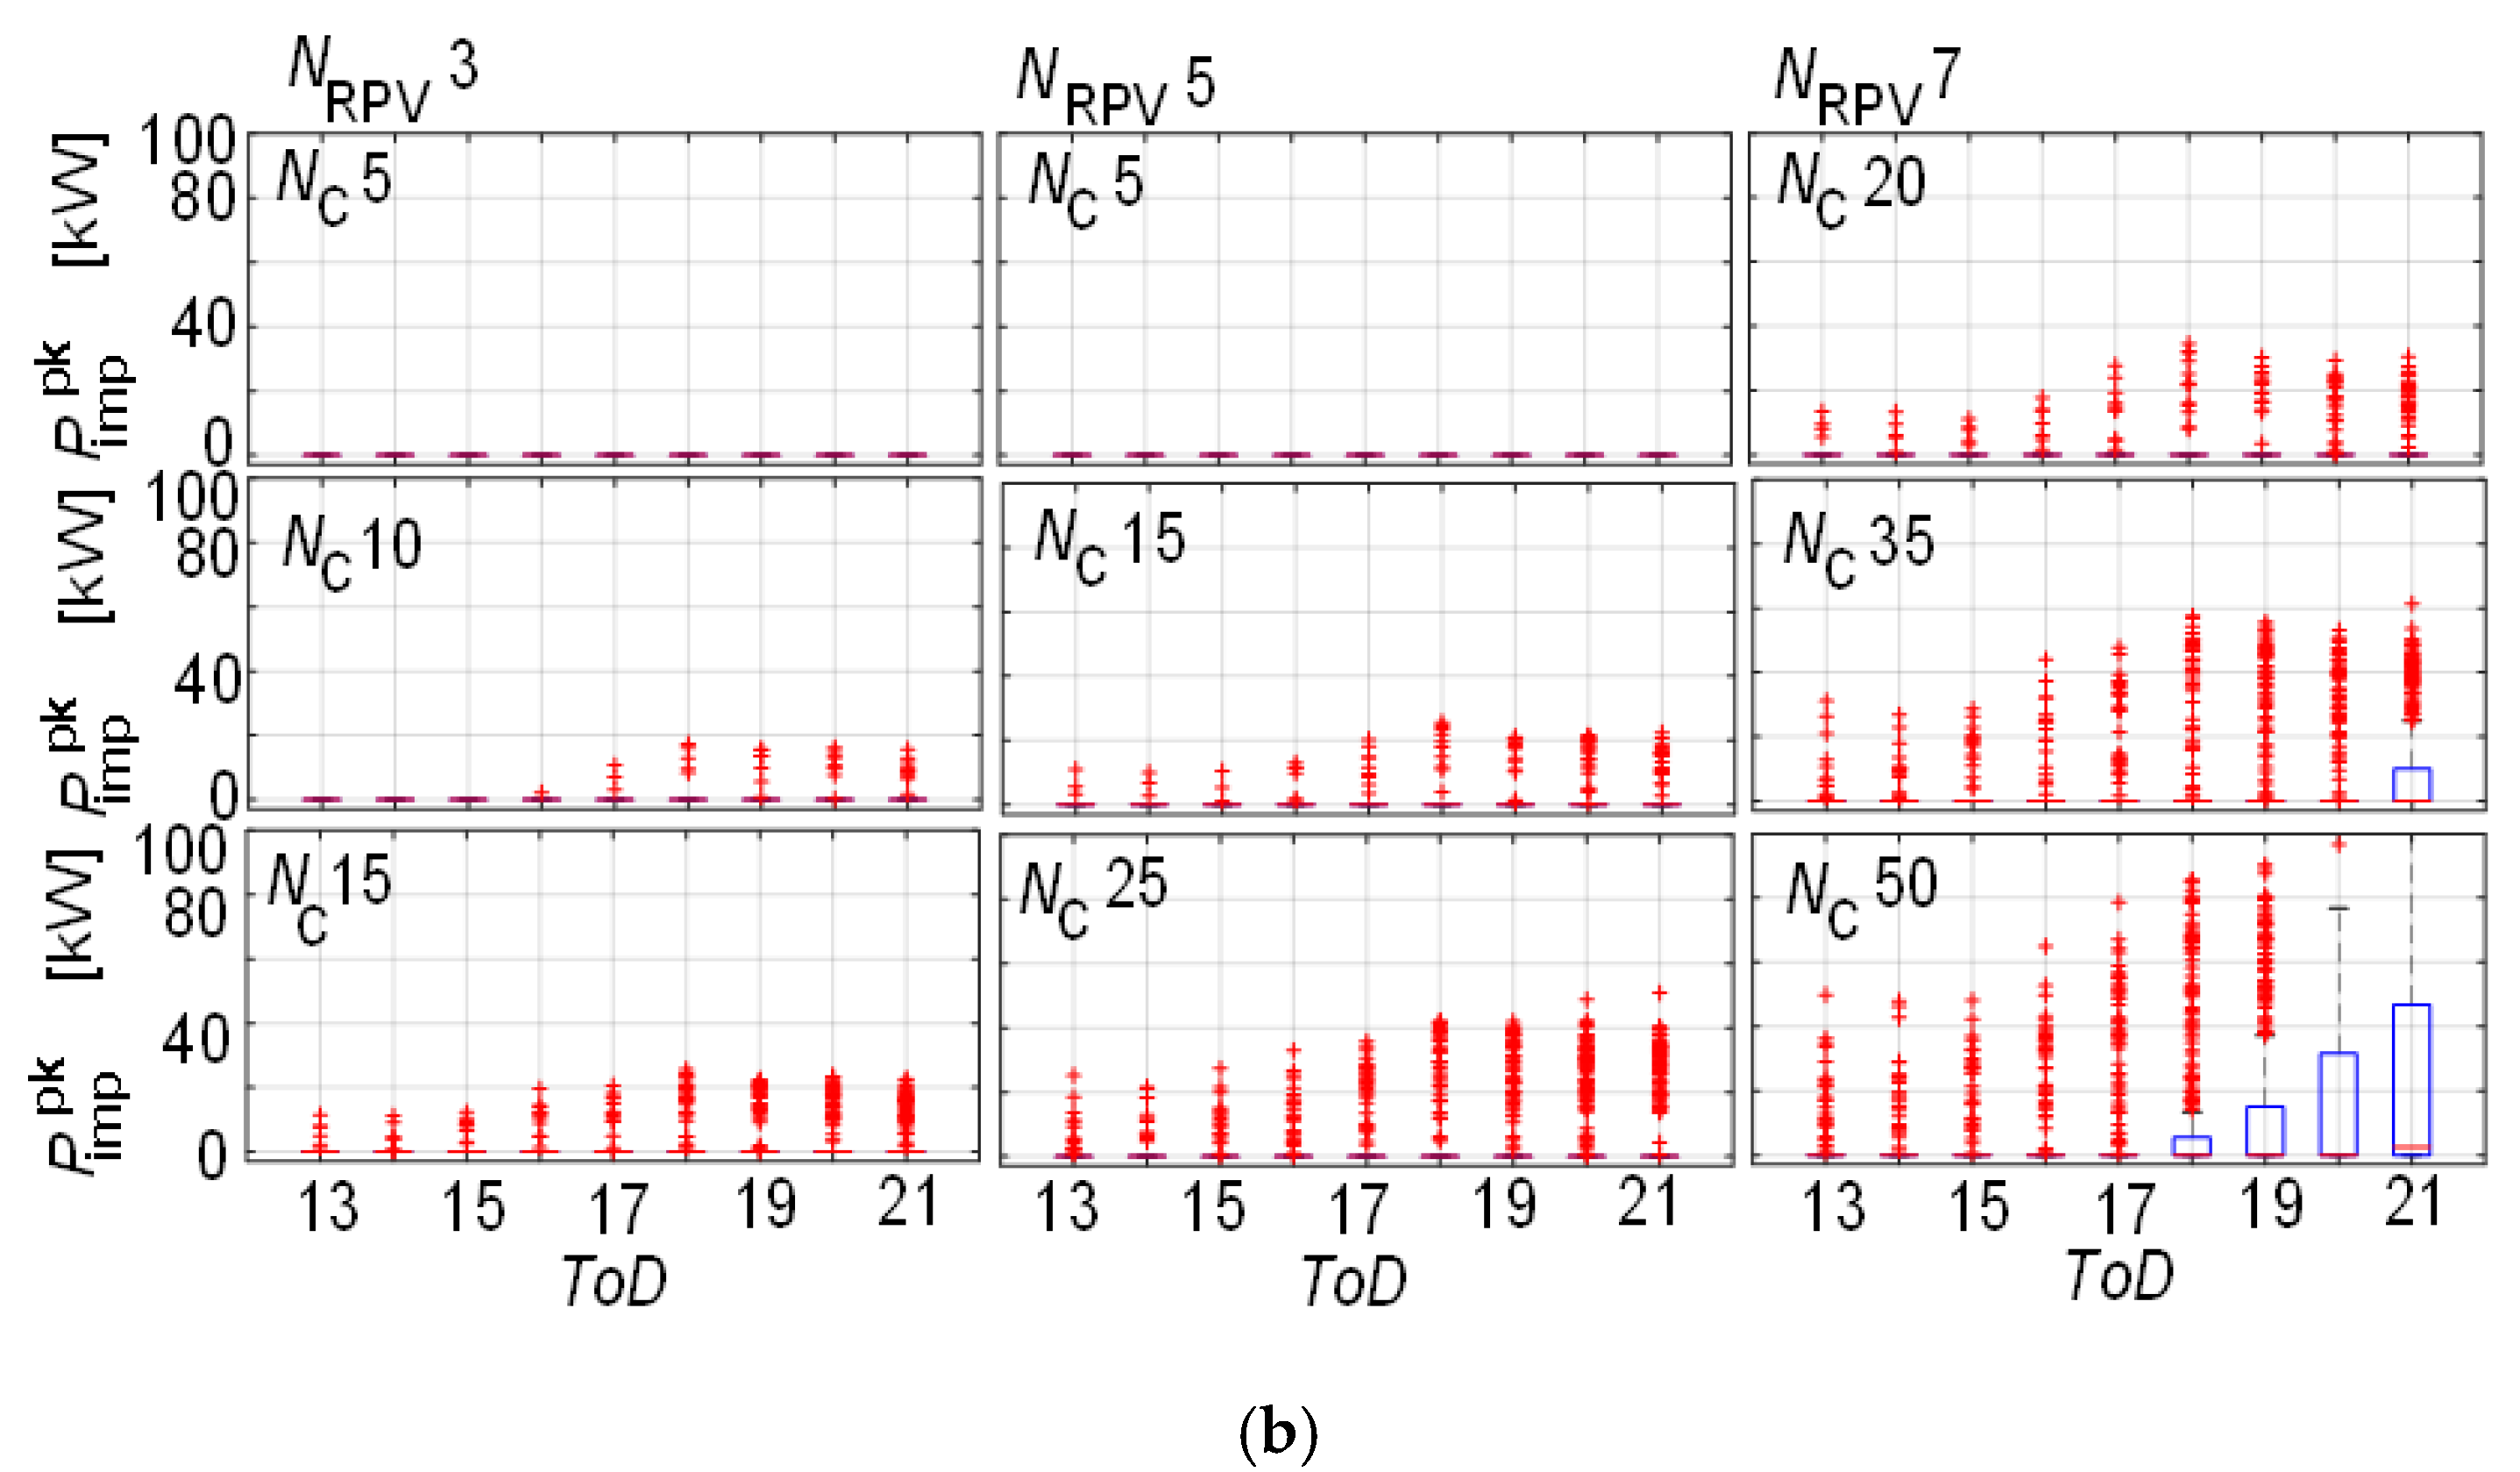
Scenario 3 assumes seven community households with RPVs, while customers under a PPA increased from 20 to 50. In such a case, the CBES’s observed performance was as below:
- In terms of power, the high self-sufficiency condition of (7) was not met as either both the RPVs’ average daily maximum excess generation (), and were lower than the average maximum daily excess consumption , resulting in low or medium self-sufficiency.
- In terms of energy, the high self-sufficiency condition of (8) was also not met, as the yearly average daily excess energy consumption ( was greater than either or both of the average daily excess generation and . However, condition (6) of achieving peak-shaving was still met, resulting in achieving high peak-shaving capability. These results were also verified by the respective capability indices in Table 3.
3.2. CBES’s Energy Capacity and Power Charge/Discharge Rate
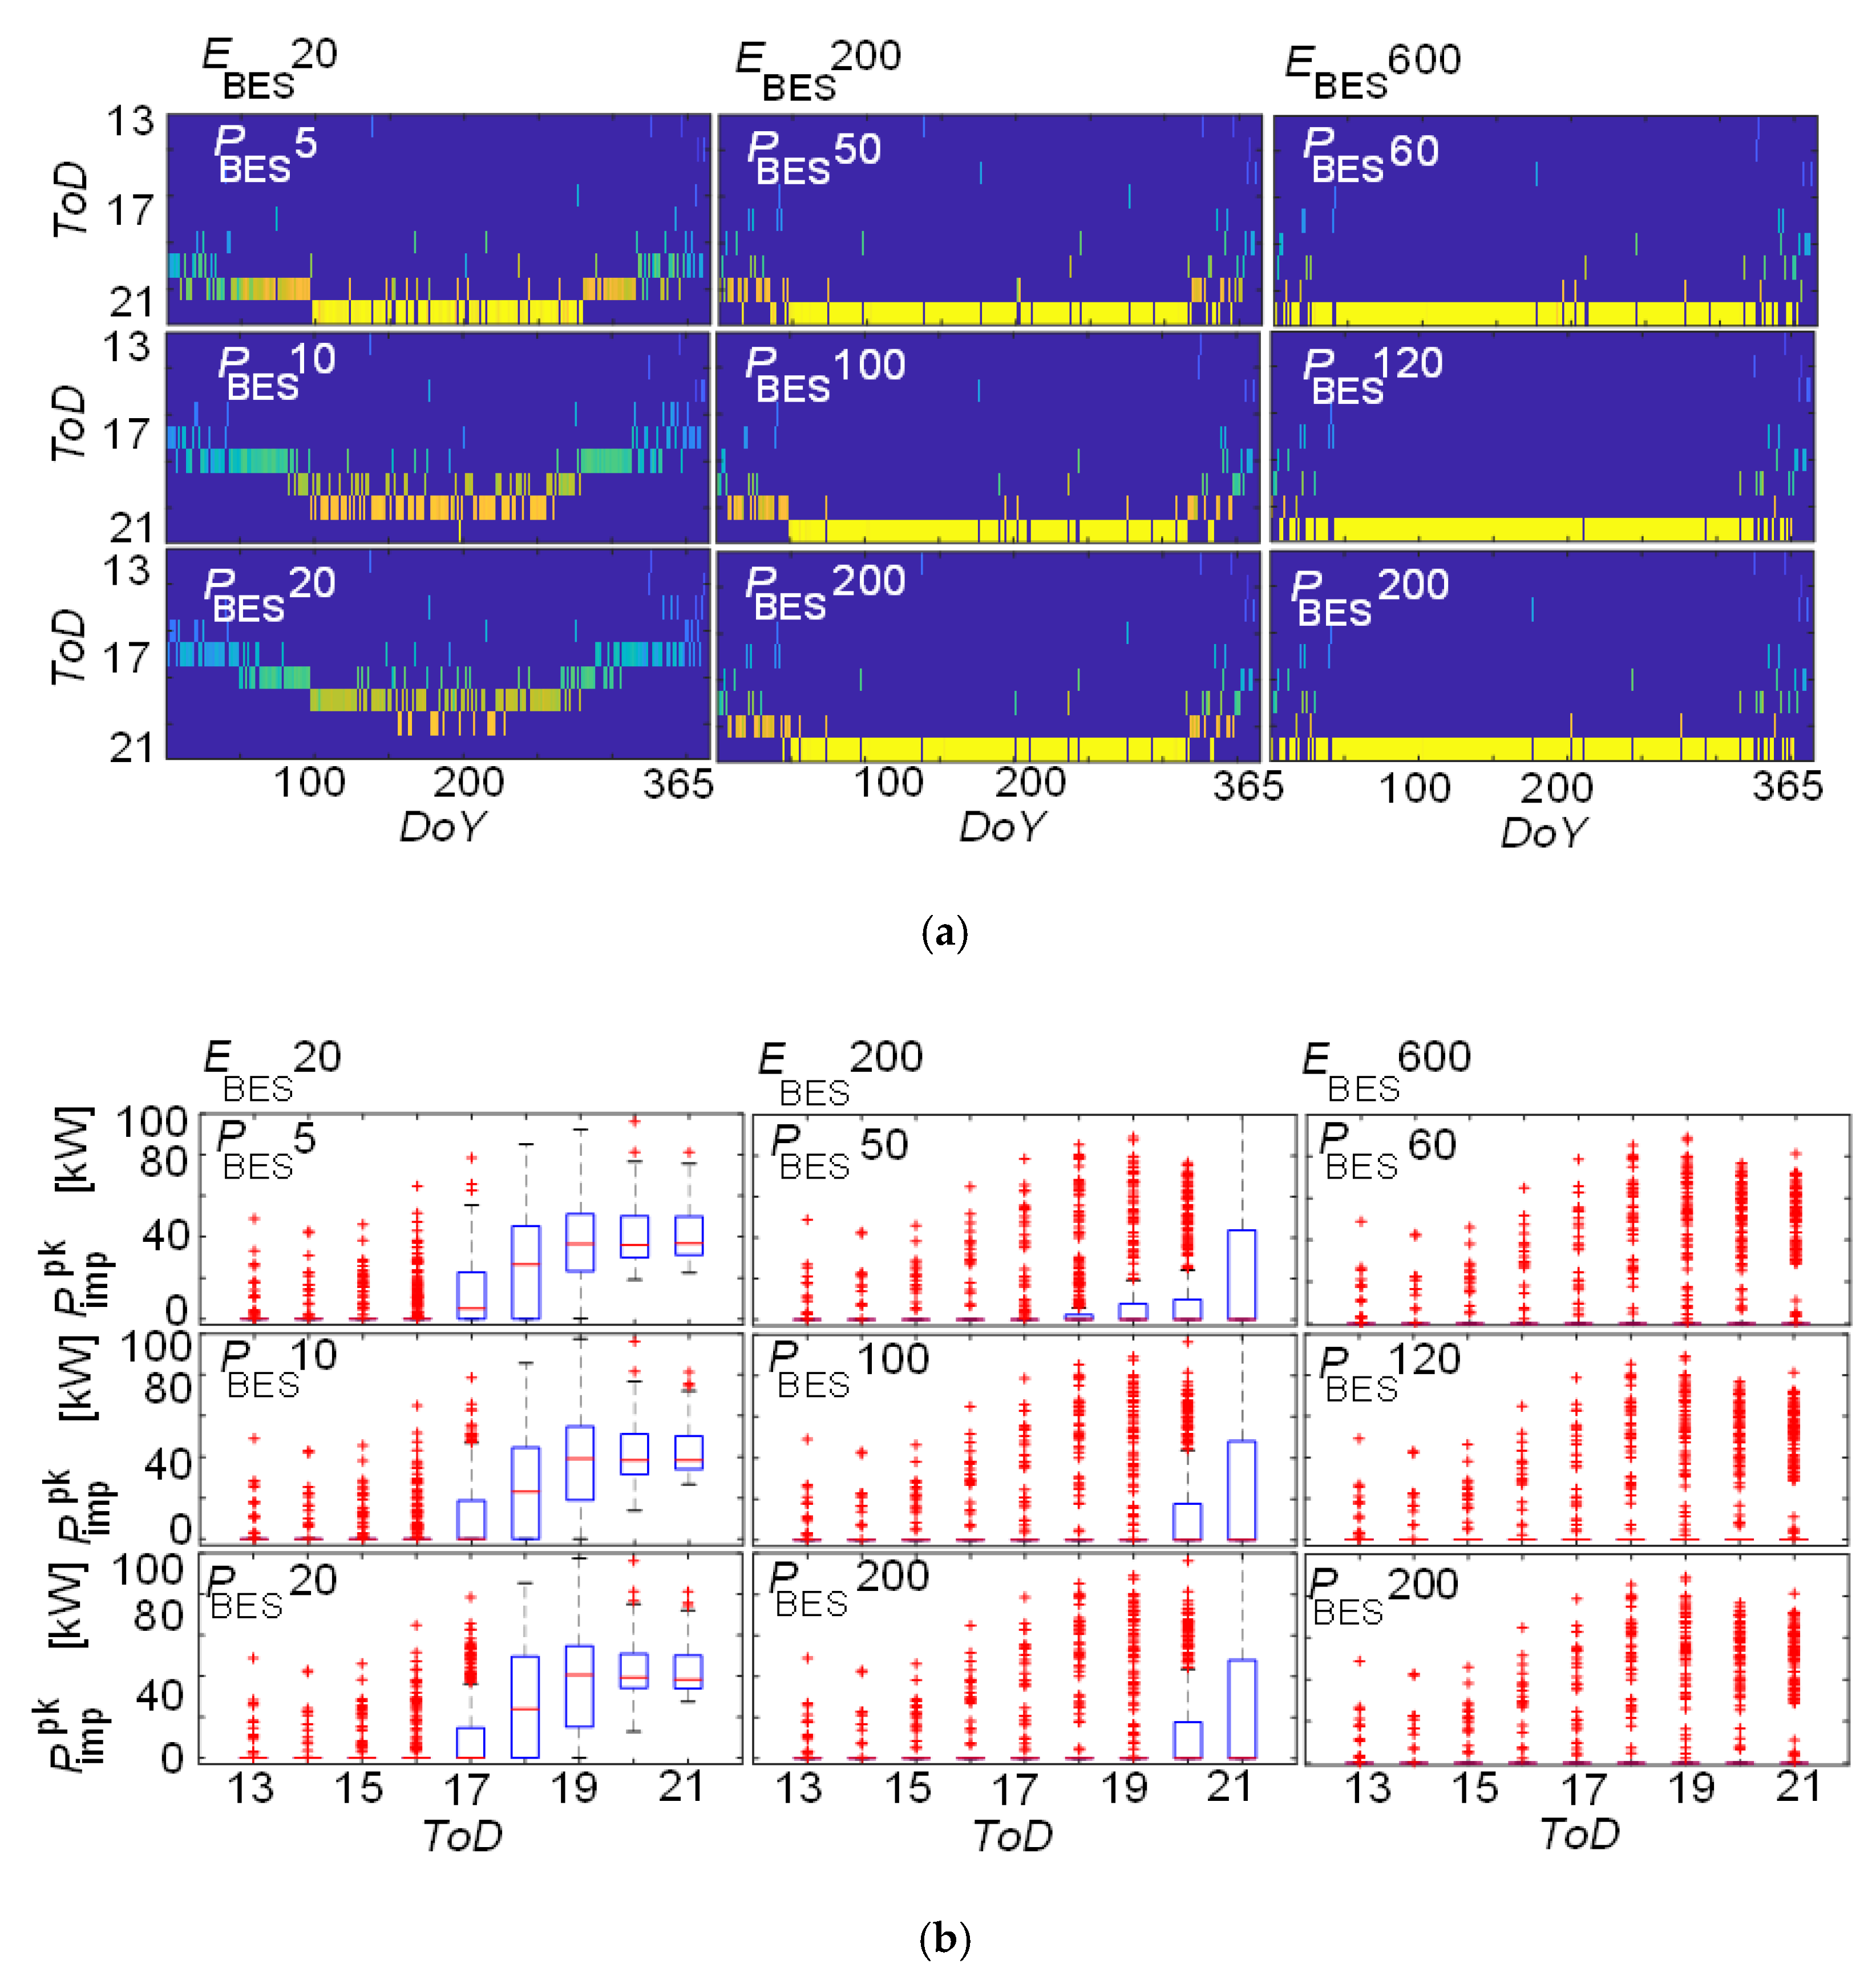
In most of the scenarios, it is important to keep the CBES size based on the excess generation from the RPVs and size of the community. It is expected in most of the markets that CBES must be available during peak hours; therefore, for better grid integration, it is recommended that CBES sizing should be based on the proposed design criteria in this paper. A sensitivity analysis to evaluate the impact of the energy rating and power of the CBES while 10 customers were under a PPA and 50 community households had RPVs was conducted. Figure 7a illustrates the presence of the duck curve profile, which was because of the excess power, which was neither consumed by customers nor stored by the CBES, and exported to the grid. Figure 7b displays the exported power, which was equivalent to the excess generation above the CBES charge rate during CBES charging mode until it was fully saturated. According to Table 3’s assumed parameters, kW, became the minimum threshold of the BES power ratings to restrict majority power export to the grid; as displayed in Figure 7a, significant improvement in the duck curve profile was seen by utilising a CBES charge rate equal to or greater than of 139 kW.
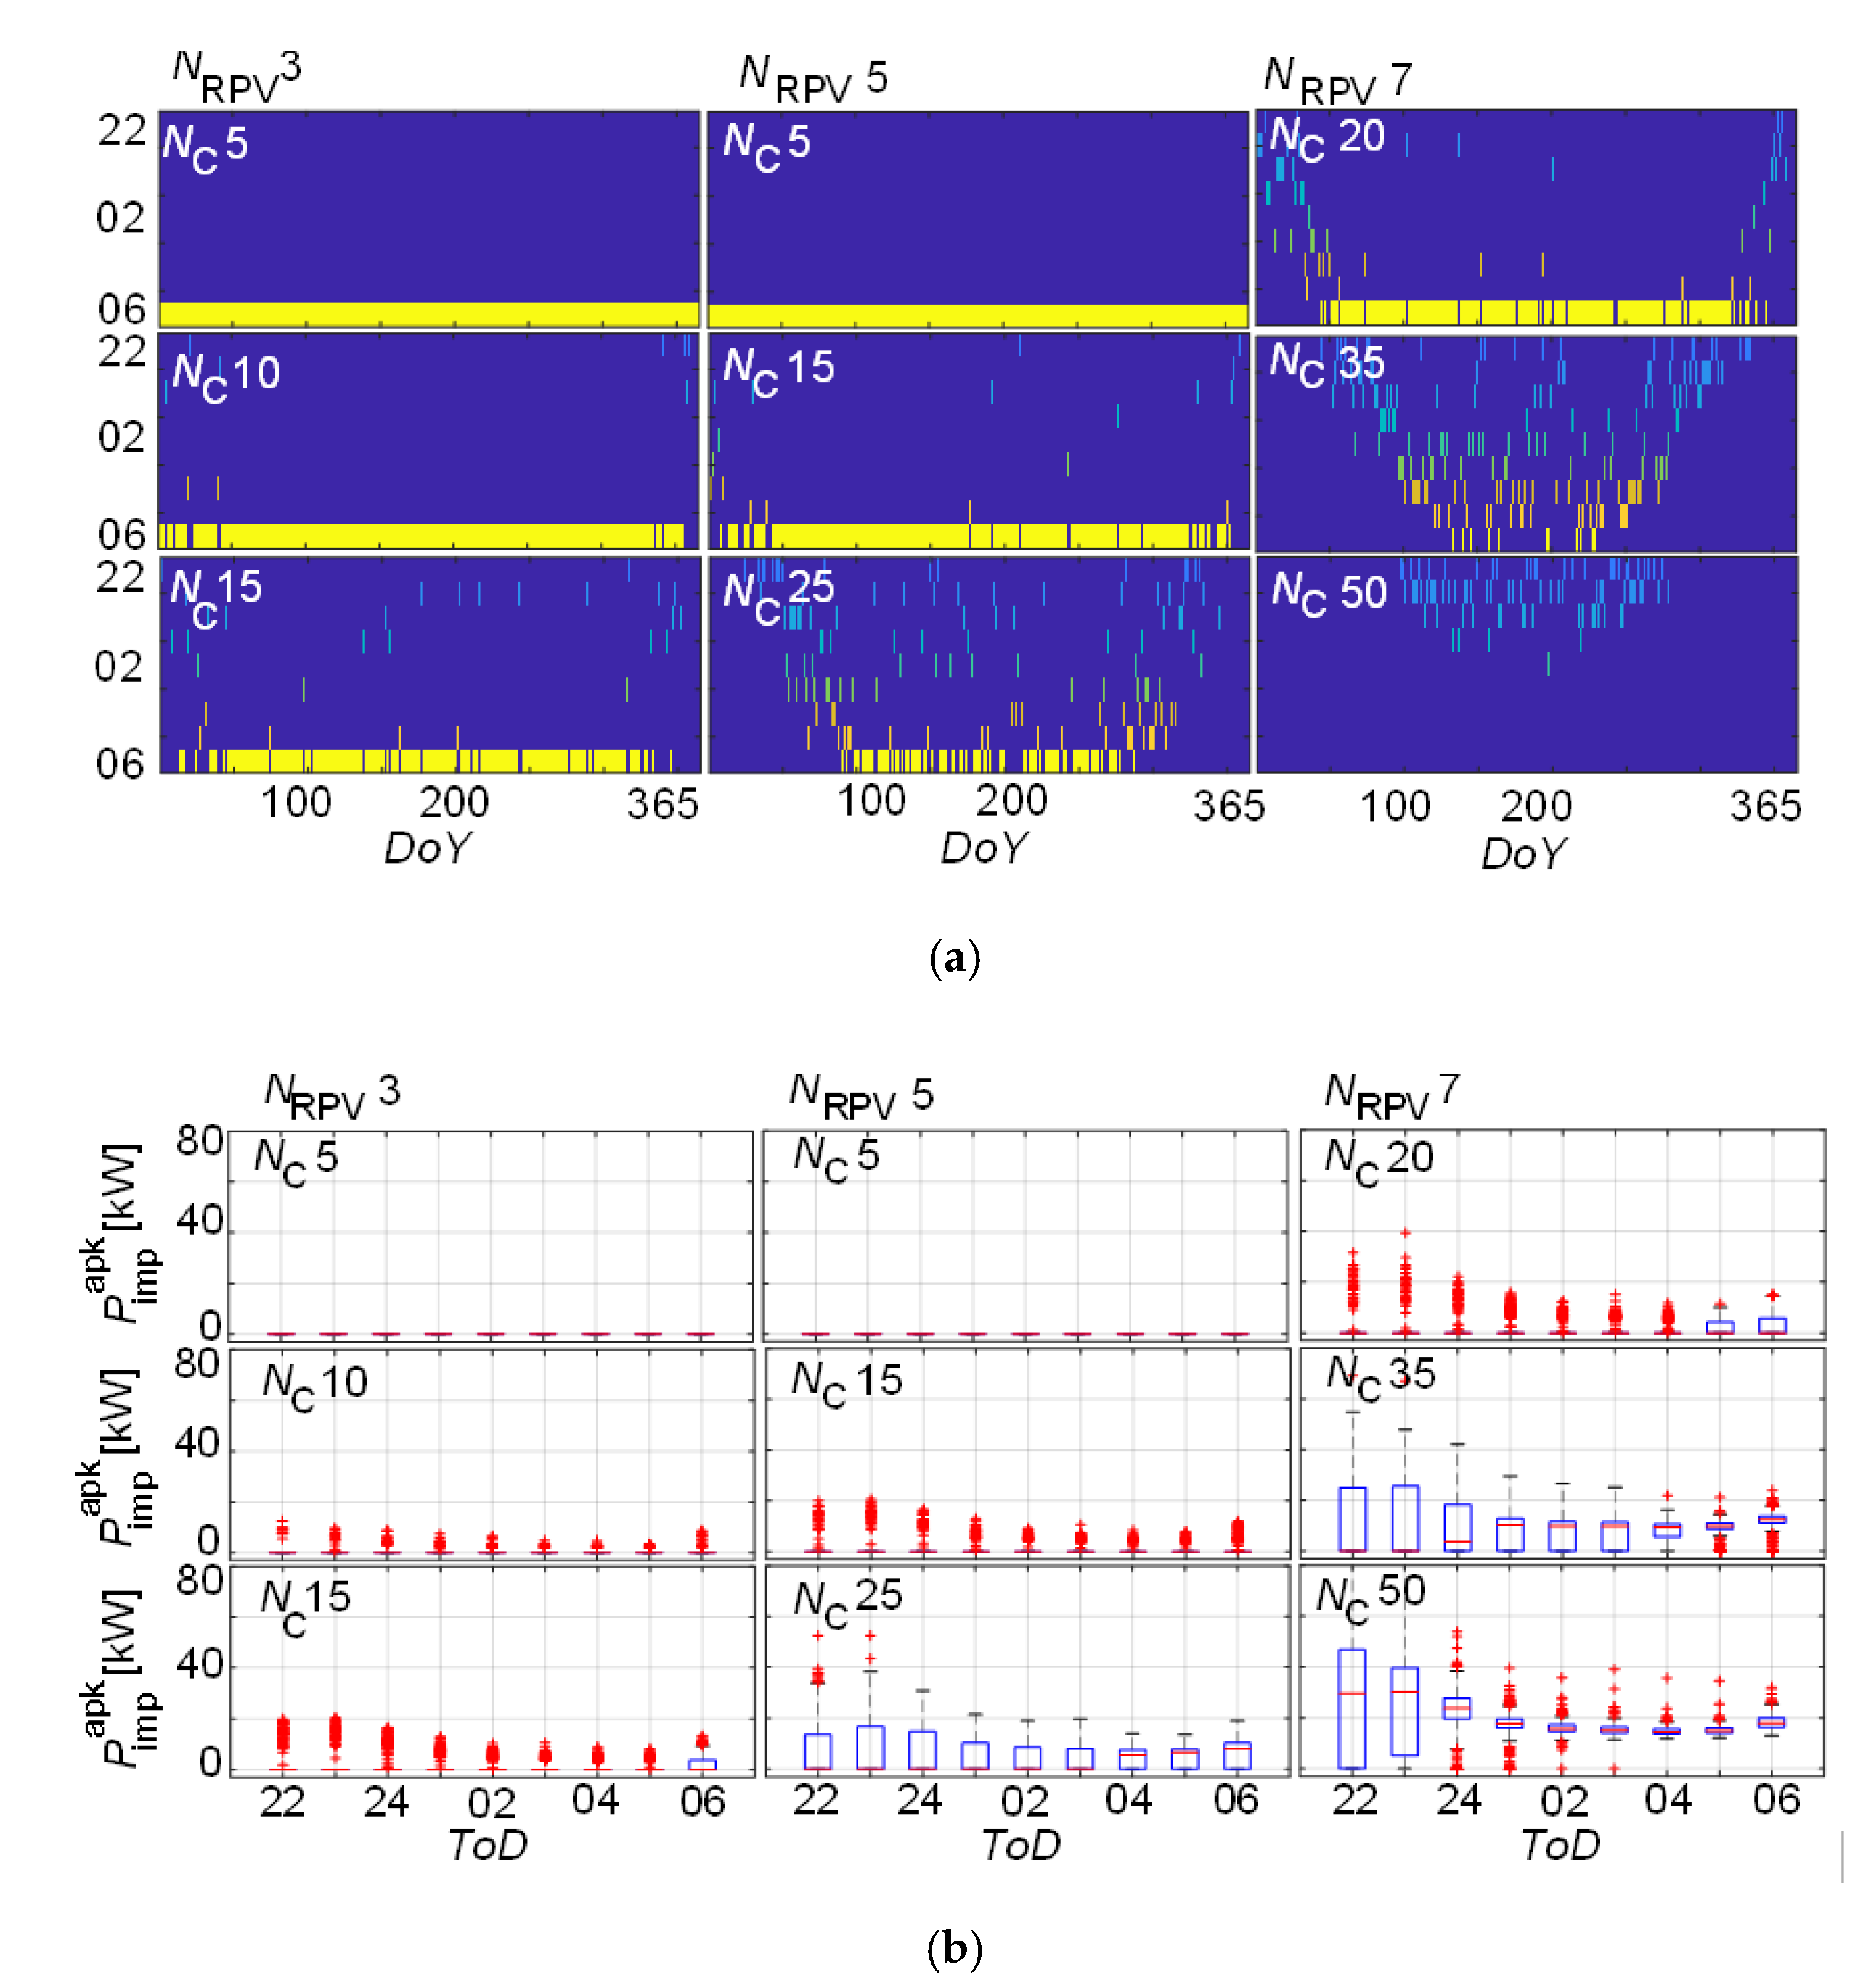
In terms of peak-shaving, Figure 8a displays the period that the CBES was fully discharged. Figure 8b displays the times the demand was not addressed by the BES and RPVs, thus importing energy from the utility grid. The BES supplied a significant fraction of the peak hour duration when higher values of were relatively higher than . However, after 18:00, no peak-shaving was noticed, and a low peak-shaving capability was observed with small ratings. The proposed design criteria of CBES suggests that the peak-shaving capability was smartly exploited by a combination of having the equal to the peak demand of 19 kW, defined by (1), and the equal to 171 kW (i.e., the peak demand integrated over the peak period defined by (6)).
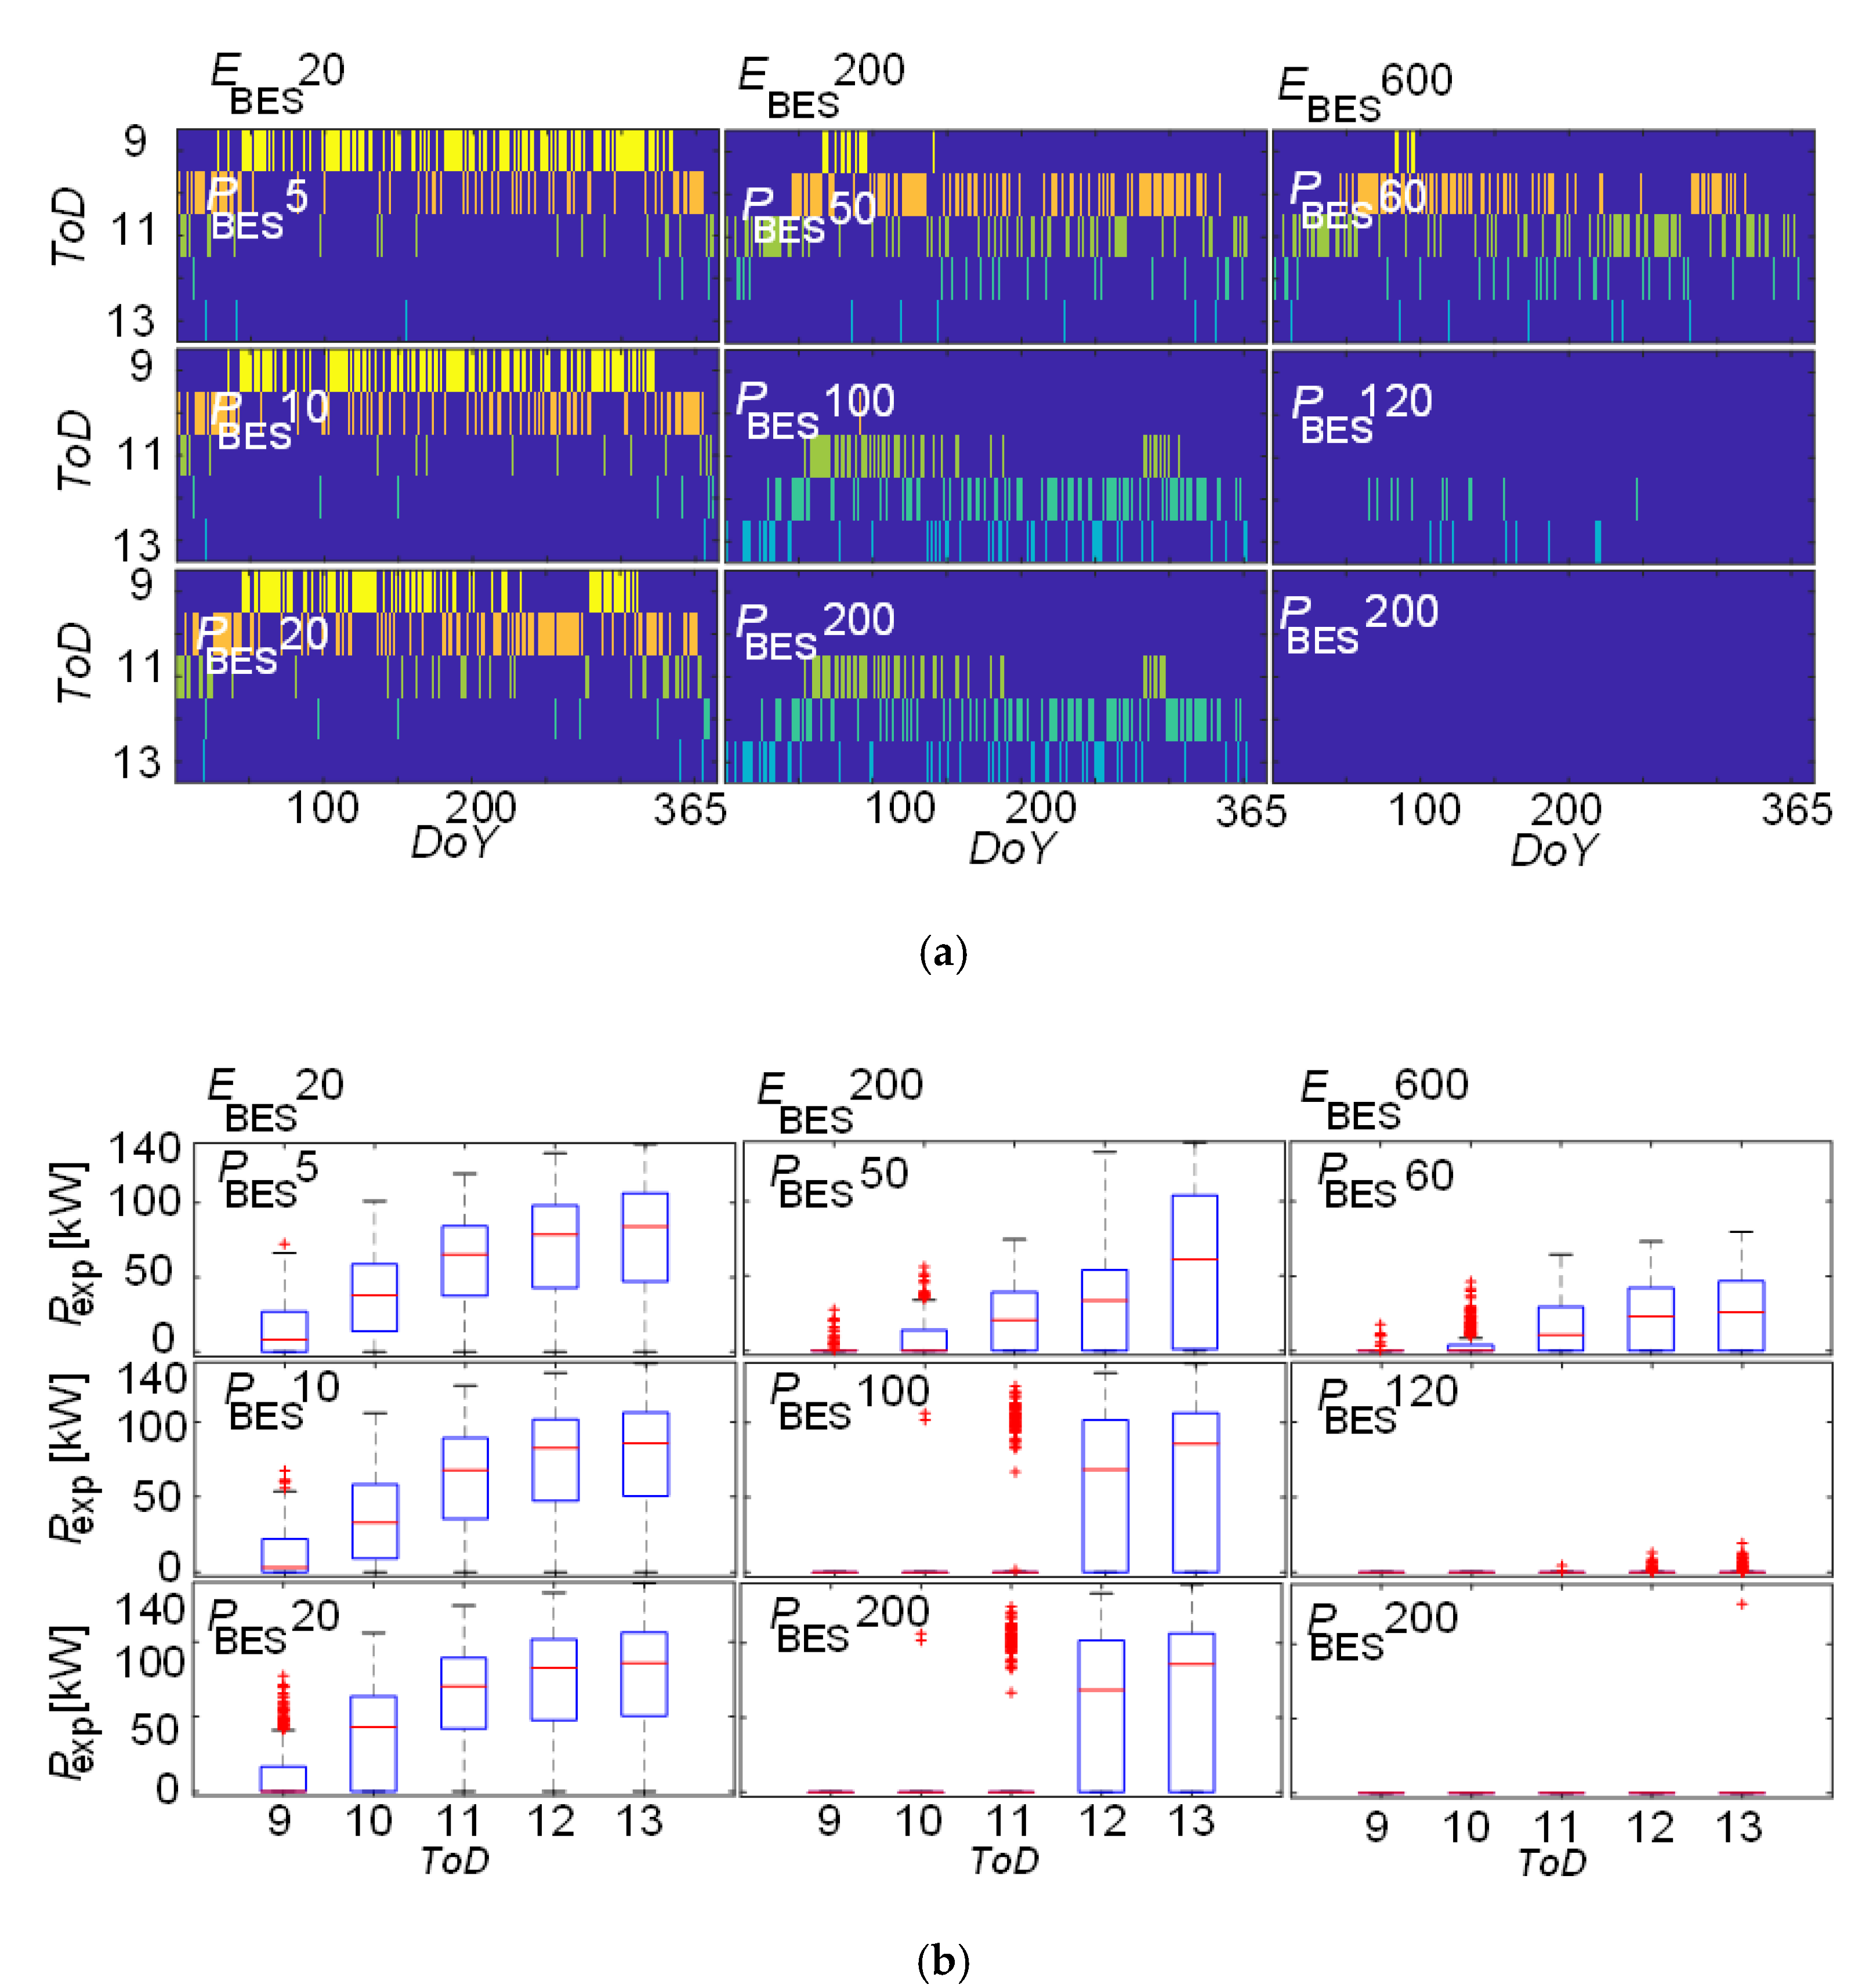
To restrict energy export to the grid due to having a BES fully saturated, the should be equal to or greater than the yearly average excess daily generation kWh, as shown in Figure 9.
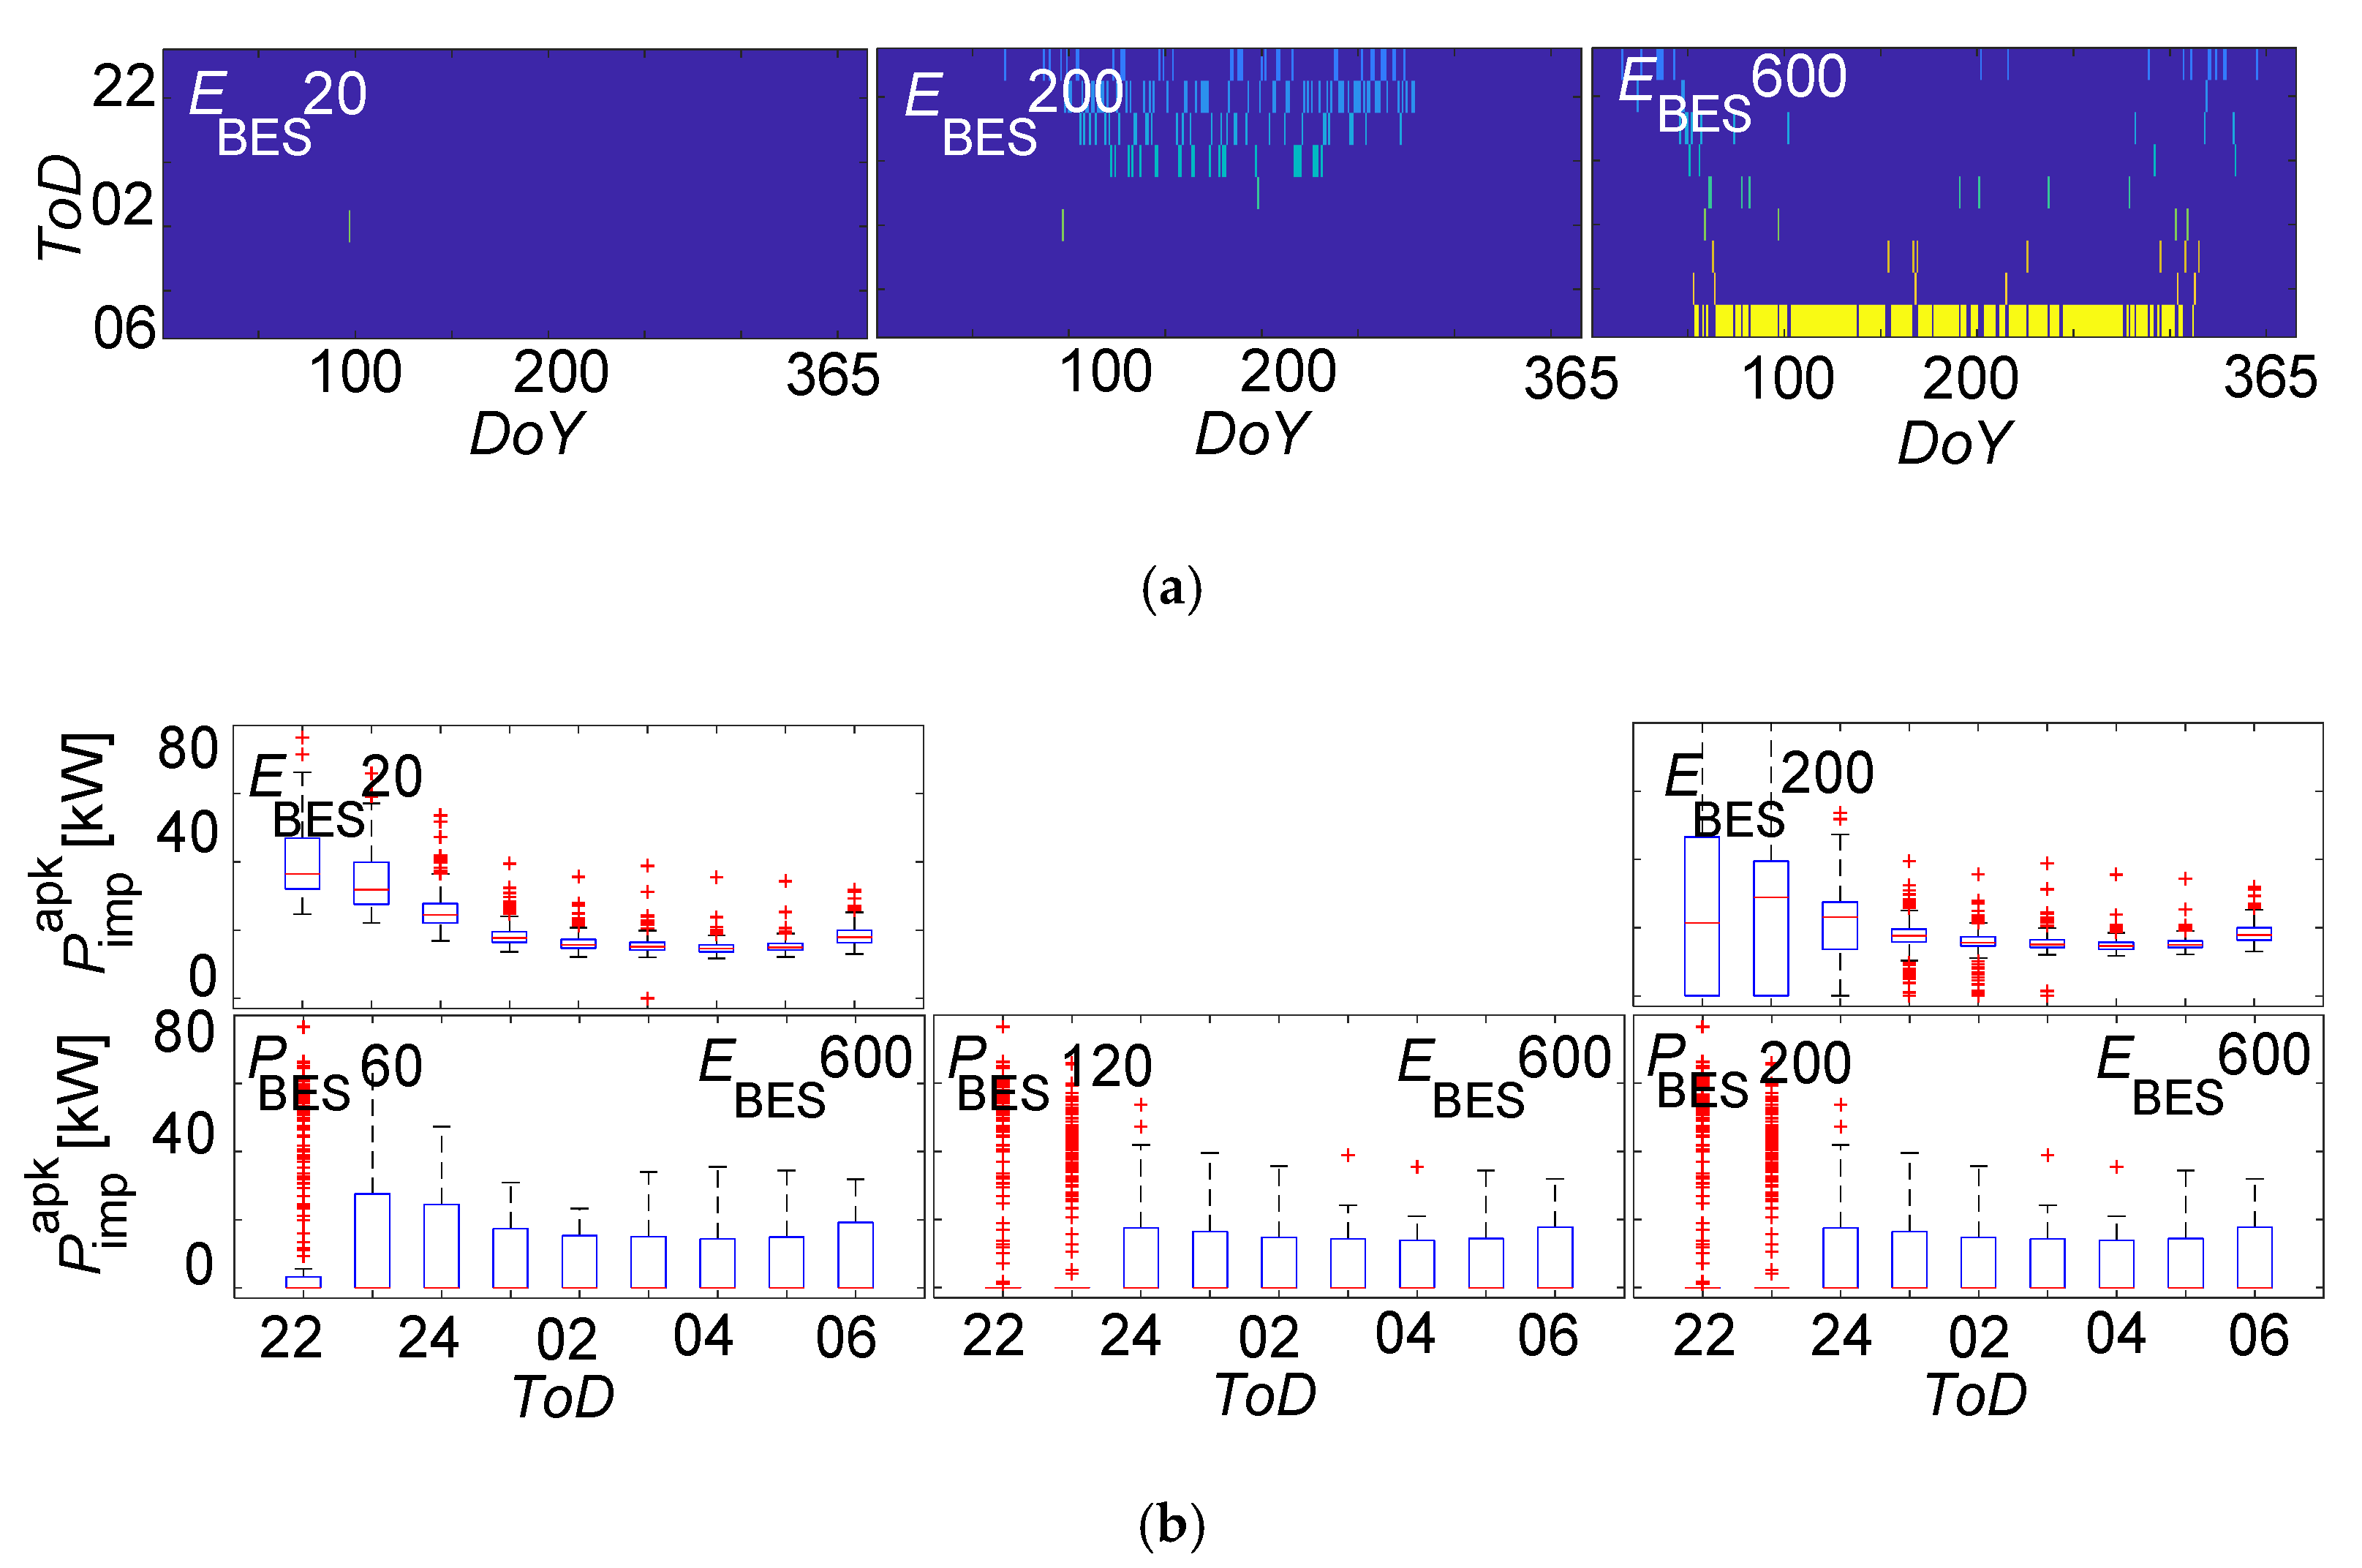
In terms of self-sufficiency, with a moderate of 200 kWh, the community’s self-sufficiency was not affected by varying the rate. However, the impacts were observed on the peak-shaving capabilities and duck curve flattening. For instance, a BES with a of 50kW and an of 200 kWh performed better in terms of peak-shaving capability and duck curve flattening than the other studied ratings, as displayed in Figure 7 and Figure 8. Increasing the CBES’s energy capacity to 600 kWh matched with the proposed design criteria of (8), better in achieving high self-sufficiency, as observed in Figure 9 and from Table 3. Different rates did not significantly affect the peak-shaving capability in the case of an higher than 600 kWh. However, Figure 9 shows that failure to meet condition (2) results in the export of energy to the grid, as seen when kW. Furthermore, self-sufficiency was affected by lower , as seen in Figure 9b; the corresponding capability indices in Table 3 also verify the above observations.
4. Discussion
This study focused on various design components of a CBES to achieve the desired technical objectives of peak-shaving capabilities, self-sufficiency, and duck curve profile improvements. The study introduced indices based on the input parameters of historical generation to define the CBES size, which can address the consumption at an appropriate level. The studies show that a larger portion of the households should have RPV in a community to increase self-sufficiency. This also needs to be accompanied by a proper capacity of the CBES, since an undersized CBES will increase the amount of exported energy to the utility feeder and worsen the duck curve profile. On the other hand, an oversized CBES may not be utilised optimally, thus making the CBES financially less justified. The studies show that a suitably sized CBES can store all or most of the excess generation from the RPVs and supply the community demand in a longer demand period, hence improving the peak-shaving capability.
Moreover, the studies show that the charge/discharge rate of the employed CBES in the community should be based on the average excess maximum daily generation from the RPVs and average highest excess daily consumption of the community, while its energy capacity should be based on the average daily excess generation and consumption over a year. A deviation between the employed BES capacity and these quantities will result in a larger portion of the RPVs’ excess generation being fed to the utility feeder, causing a duck curve profile. In terms of peak-shaving, the charge/discharge rate of the employed CBES should be equal to the difference between the average maximum excess daily consumption and the average hourly consumption over a year. Then, the BES’ energy capacity should also be such that the CBES can supply the community demand over the entire peak period. Under such a design objective, the charge/discharge rate and the energy capacity of CBES will be relatively lower.
Suppose the key design objective is realising high self-sufficiency for the community. In that case, the number and rating of the RPVs should be large enough such that the yearly average excess daily generation over a year from the RPVs on any day becomes at least equal to the yearly average excess daily energy consumption. Moreover, the CBES’s energy capacity and charge/discharge rate should be high enough to store the excess generation and address the demand at any interval. Moreover, employing a CBES with a larger capacity and charge/discharge rate increases self-sufficiency. However, the study also shows that realising high self-sufficiency requires significantly overdesigned CBES.
On the basis of the performance evaluation, we found that the proposed CBES design criteria provide an accurate forecast on the level of duck curve profile improvement, peak-shaving capability, and self-sufficiency. It should be noted that the proposed design criteria were evaluated on the basis of the historical data, as the real-time data may be above or below this threshold, resulting in the value of indices being defined slightly differently. Therefore, the CBES designer should place some tolerance to achieve the desired objectives. The proposed CBES design criteria can be used as a guideline for the utilities when employing CBES in existing communities to accomplish either or all of the discussed objectives.
5. Conclusions
This paper presented the design criteria for the installers of CBES to mitigate the negative technical impacts of high penetration of RPVs. For a properly designed CBES, its stored energy can be efficiently utilised to enable high community self-sufficiency, improve the duck curve profile, and enable peak-shaving. The study outlines that the complexity of designing a suitable solution increases with an increase in the number of households and satisfying all objectives can be more complex in large communities due to load variations. Therefore, there is a need to compromise between the most minor and most preferred objectives. The studies show that duck curve profile mitigation and achieving high peak-shaving are possible in most cases; however, achieving high self-sufficiency diminishes the possibility of the duck curve flattening. The performance evaluation studies are conducted based on the power, energy, and efficiency of new CBES. This study can be further extended to consider parameters such as depth of discharge of BES to improve state of health and life of CBES and the resultant impact on roundtrip efficiency of the CBES, as well as the voltage variations in the community network. It should be noted that the proposed design criteria are evaluated on the basis of the historical data, as the real-time data based on the weather and other factors may be slightly above or below this threshold, resulting in the value of indices defined slightly different. Therefore, the CBES designer can employ some tolerances to guarantee to achieve the desired objectives.
Author Contributions
Conceptualisation, M.A.H. and F.S.; methodology, M.A.H. and F.S.; writing—original draft preparation, M.A.H.; writing—review and editing, F.S., G.S., and R.S.; supervision, F.S. and G.S. All authors have read and agreed to the published version of the manuscript.
Funding
This research received no external funding.
Institutional Review Board Statement
Not applicable.
Informed Consent Statement
Not applicable.
Data Availability Statement
Not applicable.
Conflicts of Interest
The authors declare no conflict of interest.
References
- DER Roadmap. EPWA, Technical Report. Available online: https://www.wa.gov.au/government/publications/der-roadmap (accessed on 13 April 2020).
- Quarterly Energy Dynamics Q3 2019 Market Insights and WA Market Operations, Technical Report. Available online: https://aemo.com.au/-/media/files/media_centre/2019/qed-q3-2019.pdf (accessed on 13 April 2020).
- AEMO Market Data Western Australia, Balancing Market Summary. Available online: http://data.wa.aemo.com.au/#balancing-summary (accessed on 13 April 2020).
- Hayat, M.A.; Shahnia, F.; Shafiullah, G. Improving Duck Curve Profile, Enabling Peak-shaving and Increasing Self-sufficiency by Properly Designing Community Solar Projects. In Proceedings of the 9th International Conference on Power and Energy Systems (ICPES), Perth, Australia, 10–12 December 2019; pp. 1–5. [Google Scholar]
- Hayat, M.; Shahnia, F.; Arefi, A.; Iu, H.; Fernando, T. Comparison of the economic benefits and the payback periods of rooftop solar panels in Australia. In Proceedings of the IEEE 3rd International Conference on Power Generation Systems and Renewable Energy Technologies (PGSRET), Johor Bahru, Malaysia, 4–6 April 2017; pp. 113–117. [Google Scholar]
- Liu, X.; Eric, G.O.; Tyner, W.E.; Pekny, J.F. Purchasing vs. leasing: A benefit-cost analysis of residential solar PV panel use in California. Renew. Energy 2014, 66, 770–774. [Google Scholar] [CrossRef]
- Awad, H.; Gül, M. Optimization of community shared solar application in energy-efficient communities. Sustain. Cities Soc. 2018, 43, 221–237. [Google Scholar] [CrossRef]
- Hayat, M.A.; Shahnia, F.; Arefi, A. Comparison of the electricity tariffs and bills across the zones of Australian power distribution companies. In Proceedings of the 2016 Australasian Universities Power Engineering Conference (AUPEC), Brisbane, QLD, Australia, 25–28 September 2016; IEEE: Piscataway Township, NJ, USA; pp. 1–6. [Google Scholar]
- Arriaga, M.; Cañizares, C.A.; Kazerani, M. Renewable Energy Alternatives for Remote Communities in Northern Ontario, Canada. IEEE Trans. Sustain. Energy 2013, 4, 661–670. [Google Scholar] [CrossRef]
- Klingler, A.-L. Self-consumption with PV + Battery systems: A market diffusion model considering individual consumer behaviour and preferences. Appl. Energy 2017, 205, 1560–1570. [Google Scholar] [CrossRef]
- Dongol, D.; Feldmann, T.; Schmidt, M.; Bollin, E. A model predictive control based peak shaving application of battery for a household with photovoltaic system in a rural distribution grid. Sustain. Energy Grids Netw. 2018, 16, 1–13. [Google Scholar] [CrossRef]
- von Appen, J.; Braun, M. Interdependencies between self-sufficiency preferences, techno-economic drivers for investment decisions and grid integration of residential PV storage systems. Appl. Energy 2018, 229, 1140–1151. [Google Scholar] [CrossRef]
- Alam, M.J.E.; Muttaqi, K.; Sutanto, D. Mitigation of Rooftop Solar PV Impacts and Evening Peak Support by Managing Available Capacity of Distributed Energy Storage Systems. IEEE Trans. Power Syst. 2013, 28, 3874–3884. [Google Scholar] [CrossRef] [Green Version]
- Leadbetter, J.; Swan, L. Battery storage system for residential electricity peak demand shaving. Energy Build. 2012, 55, 685–692. [Google Scholar] [CrossRef]
- Gupta, R.; Bruce-Konuah, A.; Howard, A. Achieving energy resilience through smart storage of solar electricity at dwelling and community level. Energy Build. 2019, 195, 1–15. [Google Scholar] [CrossRef]
- Hakimi, S.M.; Hasankhani, A.; Shafie-Khah, M.; Catalão, J.P. Optimal sizing and siting of smart microgrid components under high renewables penetration considering demand response. IET Renew. Power Gener. 2019, 13, 1809–1822. [Google Scholar] [CrossRef] [Green Version]
- Chis, A.; Koivunen, V. Coalitional Game-Based Cost Optimization of Energy Portfolio in Smart Grid Communities. IEEE Trans. Smart Grid 2017, 10, 1960–1970. [Google Scholar] [CrossRef] [Green Version]
- Henri, G.; Lu, N.; Carrejo, C. Mode-based energy storage control approach for residential photovoltaic systems. IET Smart Grid 2019, 2, 69–76. [Google Scholar] [CrossRef]
- Jayawardana, A.; Agalgaonkar, A.P.; Robinson, D.A.; Fiorentini, M. Optimization framework for the operation of battery storage within solar-rich microgrids. IET Smart Grid 2019, 2, 504–513. [Google Scholar] [CrossRef]
- Mbungu, N.T.; Bansal, R.C.; Naidoo, R.M. Smart energy coordination of autonomous residential home. IET Smart Grid 2019, 2, 336–346. [Google Scholar] [CrossRef]
- Hakimi, S.M.; Saadatmandi, M.; Shafie-Khah, M.; Catalão, J.P. Smart household management systems with renewable generation to increase the operation profit of a microgrid. IET Smart Grid 2019, 2, 522–528. [Google Scholar] [CrossRef]
- Boonluk, P.; Siritaratiwat, A.; Fuangfoo, P.; Khunkitti, S. Optimal siting and sizing of battery energy storage systems for distribution network of distribution system operators. Batteries 2020, 6, 56. [Google Scholar] [CrossRef]
- Moncecchi, M.; Brivio, C.; Mandelli, S.; Merlo, M. Battery Energy Storage Systems in Microgrids: Modeling and Design Criteria. Energies 2020, 13, 2006. [Google Scholar] [CrossRef] [Green Version]
- Kaczorowska, D.; Rezmer, J.; Jasinski, M.; Sikorski, T.; Suresh, V.; Leonowicz, Z.; Kostyla, P.; Szymanda, J.; Janik, P. A Case Study on Battery Energy Storage System in a Virtual Power Plant: Defining Charging and Discharging Characteristics. Energies 2020, 13, 6670. [Google Scholar] [CrossRef]
- Junior, P.R.; Rocha, L.; Morioka, S.; Bolis, I.; Chicco, G.; Mazza, A.; Janda, K. Economic Analysis of the Investments in Battery Energy Storage Systems: Review and Current Perspectives. Energies 2021, 14, 2503. [Google Scholar] [CrossRef]
- Solar Home Electricity Data, Ausgrid, Technical Data. Available online: https://www.ausgrid.com.au/Industry/Innovation-and-research/Data-to-share/Solar-home-electricity-data (accessed on 17 May 2019).
Figure 1.
Minimum monthly load demand (MW) of the first quarter of 2015 to 2020 in Western Australia.
Figure 1.
Minimum monthly load demand (MW) of the first quarter of 2015 to 2020 in Western Australia.

Figure 2.
Sample daily load profile with the observed minimum load demand between 2015 and 2020 in Western Australia.
Figure 2.
Sample daily load profile with the observed minimum load demand between 2015 and 2020 in Western Australia.

Figure 3.
Schematic illustration of a residential community with a CBES.

Figure 4.
(a) Time of day (ToD) at which power export to the grid was started; (b) magnitude of exported power over a year by varying and .
Figure 4.
(a) Time of day (ToD) at which power export to the grid was started; (b) magnitude of exported power over a year by varying and .

Figure 5.
(a) Time of day (ToD) until BES contributed to peak-shaving; (b) magnitude of imported power over a year by varying and .
Figure 5.
(a) Time of day (ToD) until BES contributed to peak-shaving; (b) magnitude of imported power over a year by varying and .


Figure 6.
(a) Time of day (ToD) until load demand was fully satisfied; (b) magnitude of load demand after supplying the load by the BES over a year.
Figure 6.
(a) Time of day (ToD) until load demand was fully satisfied; (b) magnitude of load demand after supplying the load by the BES over a year.

Figure 7.
(a) Time of day at which power export to the grid was started; (b) magnitude of exported power over a year by varying and .
Figure 7.
(a) Time of day at which power export to the grid was started; (b) magnitude of exported power over a year by varying and .

Figure 8.
(a) Time of day until BES shaves peak demand; (b) magnitude of imported power during peak period over a year by varying and .
Figure 8.
(a) Time of day until BES shaves peak demand; (b) magnitude of imported power during peak period over a year by varying and .

Figure 9.
(a) Time of day until load demand is fully satisfied; (b) magnitude of imported power after peak period over a year by varying and .
Figure 9.
(a) Time of day until load demand is fully satisfied; (b) magnitude of imported power after peak period over a year by varying and .


Table 1.
Indices employed for the design concept.
| Index | Definition |
|---|---|
| Generated power by households at any time instant t. | |
| A portion ofdirectly consumed by consumers. | |
| Excess generated power by the RPV, not directly consumed by the households. | |
| Excess generated energy by the RPV, not directly consumed by the households. | |
| Excess consumed power by the household, not directly supplied by the RPVs. | |
| Excess consumed energy by the household, not directly supplied by the RPVs. | |
| Power demand of the load. | |
| Average hourly power consumption over a year. | |
| Peak demand above-average hourly consumption seen by the CBES. | |
| Average highest daily excess power consumption. | |
| Highest excess power consumption seen over a year. | |
| Energy demand of the load. | |
| Average highest daily excess energy consumption. | |
| Highest excess energy consumption seen over a year. | |
| Power generated by the RPV. | |
| Average hourly excess power generated by the RPV. | |
| Average highest daily excess power generated by the RPV seen over a year. | |
| Power exported to or imported from utility grid. | |
| Energy generated by the RPV. | |
| Average highest daily excess energy generated by the RPV seen over a year. |
Table 2.
Key assumptions on timings used in the study.
| Period | Parameter Monitoring Strategy |
|---|---|
| 09.00–13.00 | Monitoring exported energy and power to the grid generating the duck curve profile. |
| 13.00–21.00 | Monitoring peak-shaving to ensure that the demand is less than or equal to the average annual demand. |
| 22.00–06.00 | Monitoring the level of the community’s self-sufficiency. |
Table 3.
Analysis of design criteria to peak shave demand and increase self-sufficiency while mitigating duck curve.
Table 3.
Analysis of design criteria to peak shave demand and increase self-sufficiency while mitigating duck curve.
| 3 | 5 | 50 | 200 | 36 | 52 | 218 | 2 | 5 | 11 | 3 | 31 | 79 | 0.96 | 0.92 | 16.67 | 8.33 | 4.55 | 2.53 | VL | VH | VH |
| 3 | 10 | 50 | 200 | 34 | 50 | 196 | 5 | 8 | 20 | 3 | 66 | 166 | 1.00 | 1.02 | 16.67 | 8.33 | 2.50 | 1.20 | VL | VH | H |
| 3 | 15 | 50 | 200 | 31 | 46 | 162 | 9 | 14 | 37 | 5 | 132 | 278 | 1.09 | 1.23 | 10.00 | 5.00 | 1.35 | 0.72 | VL | H | H |
| 5 | 5 | 50 | 200 | 55 | 76 | 337 | 2 | 5 | 10 | 3 | 30 | 76 | 0.66 | 0.59 | 16.67 | 8.33 | 5.00 | 2.63 | H | H | H |
| 5 | 15 | 50 | 200 | 49 | 72 | 275 | 9 | 14 | 36 | 5 | 125 | 269 | 0.69 | 0.73 | 10.00 | 5.00 | 1.39 | 0.74 | H | VH | VH |
| 5 | 25 | 50 | 200 | 42 | 67 | 218 | 16 | 26 | 60 | 10 | 235 | 492 | 0.75 | 0.92 | 5.00 | 2.50 | 0.83 | 0.41 | M | H | M |
| 7 | 20 | 50 | 200 | 70 | 104 | 403 | 12 | 20 | 48 | 8 | 169 | 350 | 0.48 | 0.50 | 6.25 | 3.13 | 1.04 | 0.57 | H | VH | H |
| 7 | 35 | 50 | 200 | 62 | 98 | 331 | 20 | 34 | 79 | 14 | 300 | 610 | 0.51 | 0.60 | 3.57 | 1.79 | 0.63 | 0.33 | H | H | M |
| 7 | 50 | 50 | 200 | 54 | 91 | 277 | 29 | 48 | 110 | 19 | 443 | 1003 | 0.55 | 0.72 | 2.63 | 1.32 | 0.45 | 0.20 | H | H | L |
| 10 | 50 | 5 | 20 | 84 | 139 | 457 | 29 | 48 | 110 | 19 | 425 | 972 | 0.04 | 0.04 | 0.26 | 0.13 | 0.05 | 0.02 | H | M | VL |
| 10 | 50 | 10 | 20 | 84 | 139 | 457 | 29 | 48 | 110 | 19 | 425 | 972 | 0.07 | 0.04 | 0.53 | 0.13 | 0.09 | 0.02 | H | M | VL |
| 10 | 50 | 20 | 20 | 84 | 139 | 457 | 29 | 48 | 110 | 19 | 425 | 972 | 0.14 | 0.04 | 1.05 | 0.13 | 0.18 | 0.02 | H | M | VL |
| 10 | 50 | 50 | 200 | 84 | 139 | 457 | 29 | 48 | 110 | 19 | 425 | 972 | 0.36 | 0.44 | 2.63 | 1.32 | 0.45 | 0.21 | H | H | L |
| 10 | 50 | 100 | 200 | 84 | 139 | 457 | 29 | 48 | 110 | 19 | 425 | 972 | 0.72 | 0.44 | 5.26 | 1.32 | 0.91 | 0.21 | M | H | L |
| 10 | 50 | 200 | 200 | 84 | 139 | 457 | 29 | 48 | 110 | 19 | 425 | 972 | 1.44 | 0.44 | 10.53 | 1.32 | 1.82 | 0.21 | M | H | L |
| 10 | 50 | 60 | 600 | 84 | 139 | 457 | 29 | 48 | 110 | 19 | 425 | 972 | 0.43 | 1.31 | 3.16 | 3.95 | 0.55 | 0.62 | H | VH | M |
| 10 | 50 | 120 | 600 | 84 | 139 | 457 | 29 | 48 | 110 | 19 | 425 | 972 | 0.86 | 1.31 | 6.32 | 3.95 | 1.09 | 0.62 | VL | VH | H |
| 10 | 50 | 200 | 600 | 84 | 139 | 457 | 29 | 48 | 110 | 19 | 425 | 972 | 1.44 | 1.31 | 10.53 | 3.95 | 1.82 | 0.62 | VL | VH | H |
Publisher’s Note: MDPI stays neutral with regard to jurisdictional claims in published maps and institutional affiliations. |
© 2022 by the authors. Licensee MDPI, Basel, Switzerland. This article is an open access article distributed under the terms and conditions of the Creative Commons Attribution (CC BY) license (https://creativecommons.org/licenses/by/4.0/).
Share and Cite
MDPI and ACS Style
Hayat, M.A.; Shahnia, F.; Shafiullah, G.; Samu, R. Homogenising the Design Criteria of a Community Battery Energy Storage for Better Grid Integration. Sustainability 2022, 14, 733. https://0-doi-org.brum.beds.ac.uk/10.3390/su14020733
AMA Style
Hayat MA, Shahnia F, Shafiullah G, Samu R. Homogenising the Design Criteria of a Community Battery Energy Storage for Better Grid Integration. Sustainability. 2022; 14(2):733. https://0-doi-org.brum.beds.ac.uk/10.3390/su14020733
Chicago/Turabian StyleHayat, Muhammad Adnan, Farhad Shahnia, GM Shafiullah, and Remember Samu. 2022. "Homogenising the Design Criteria of a Community Battery Energy Storage for Better Grid Integration" Sustainability 14, no. 2: 733. https://0-doi-org.brum.beds.ac.uk/10.3390/su14020733
Note that from the first issue of 2016, this journal uses article numbers instead of page numbers. See further details here.