
Evaluation of Ecosystem Services in Mining Basins: An Application in the Piedmont Region (Italy)


Abstract
:1. Introduction
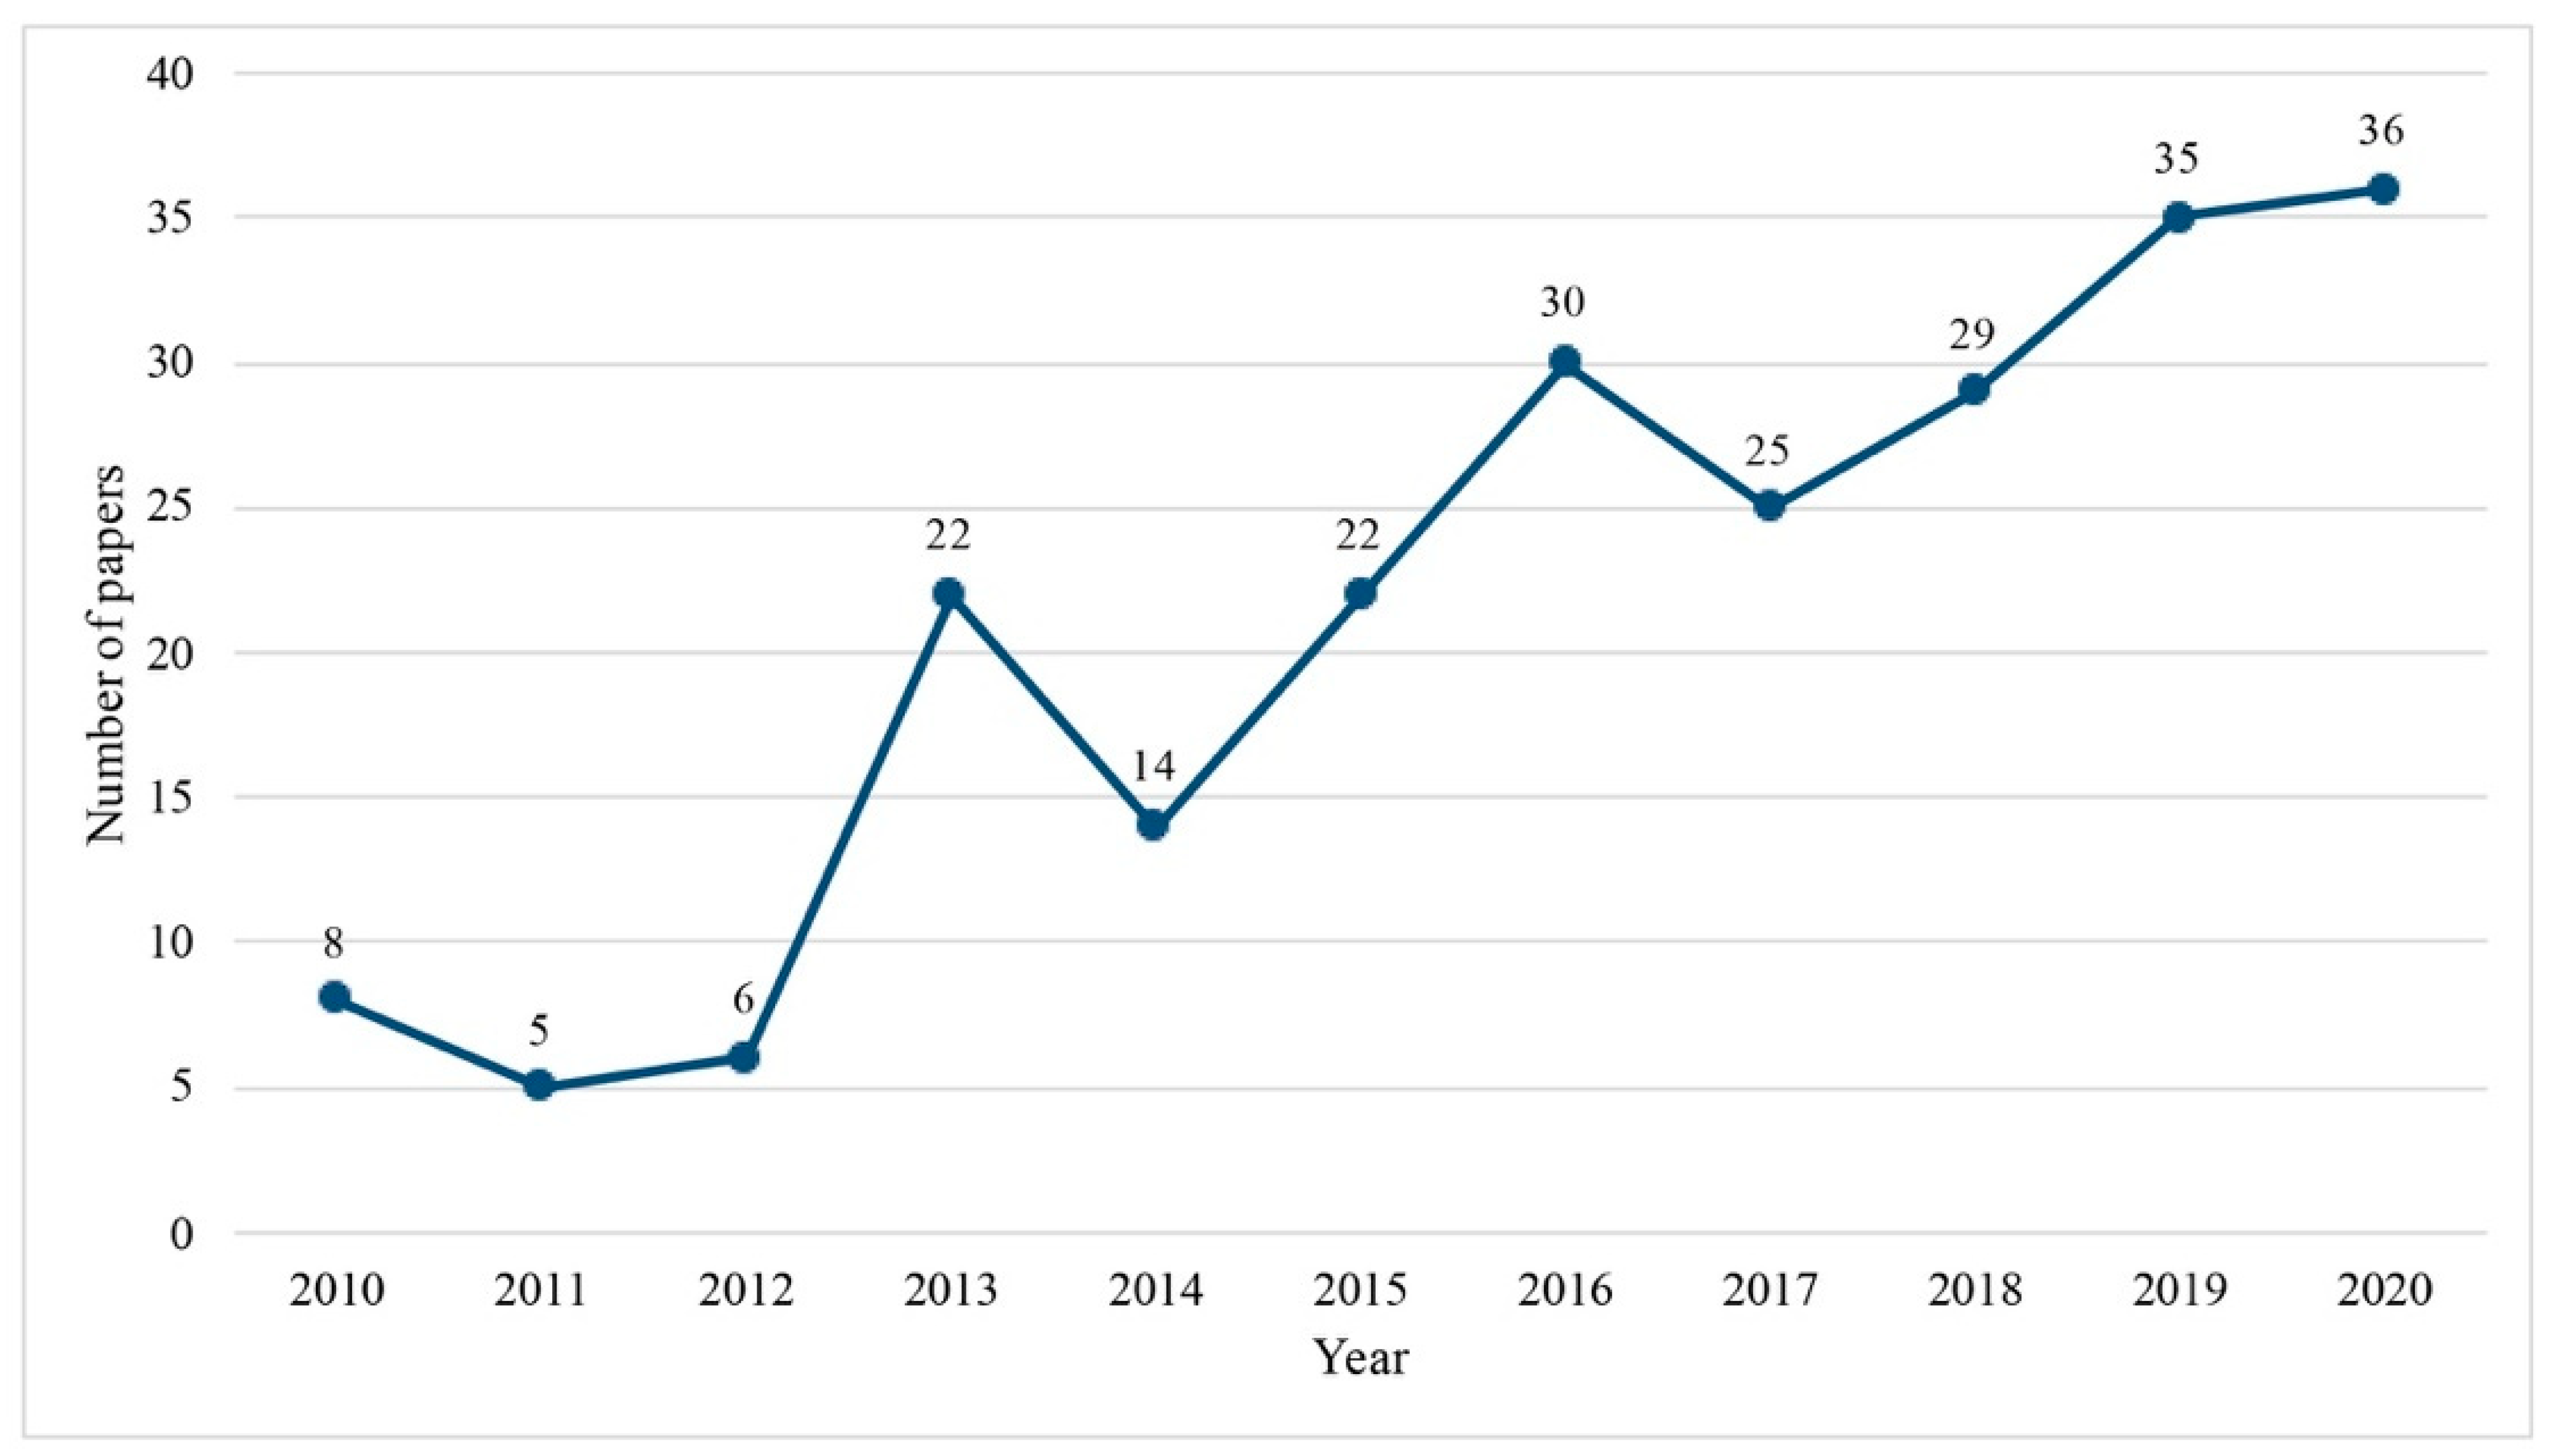
2. Literature Review of the Ecosystem Services in Mining Activities
- Supporting both the planning and management of mining sites, through the assessment of its cumulative impact on the environmental system;
- Informing about the possible impact over time of mining restoration interventions.
3. Materials and Methods
3.1. Valuing Ecosystem Services in the Mining Context
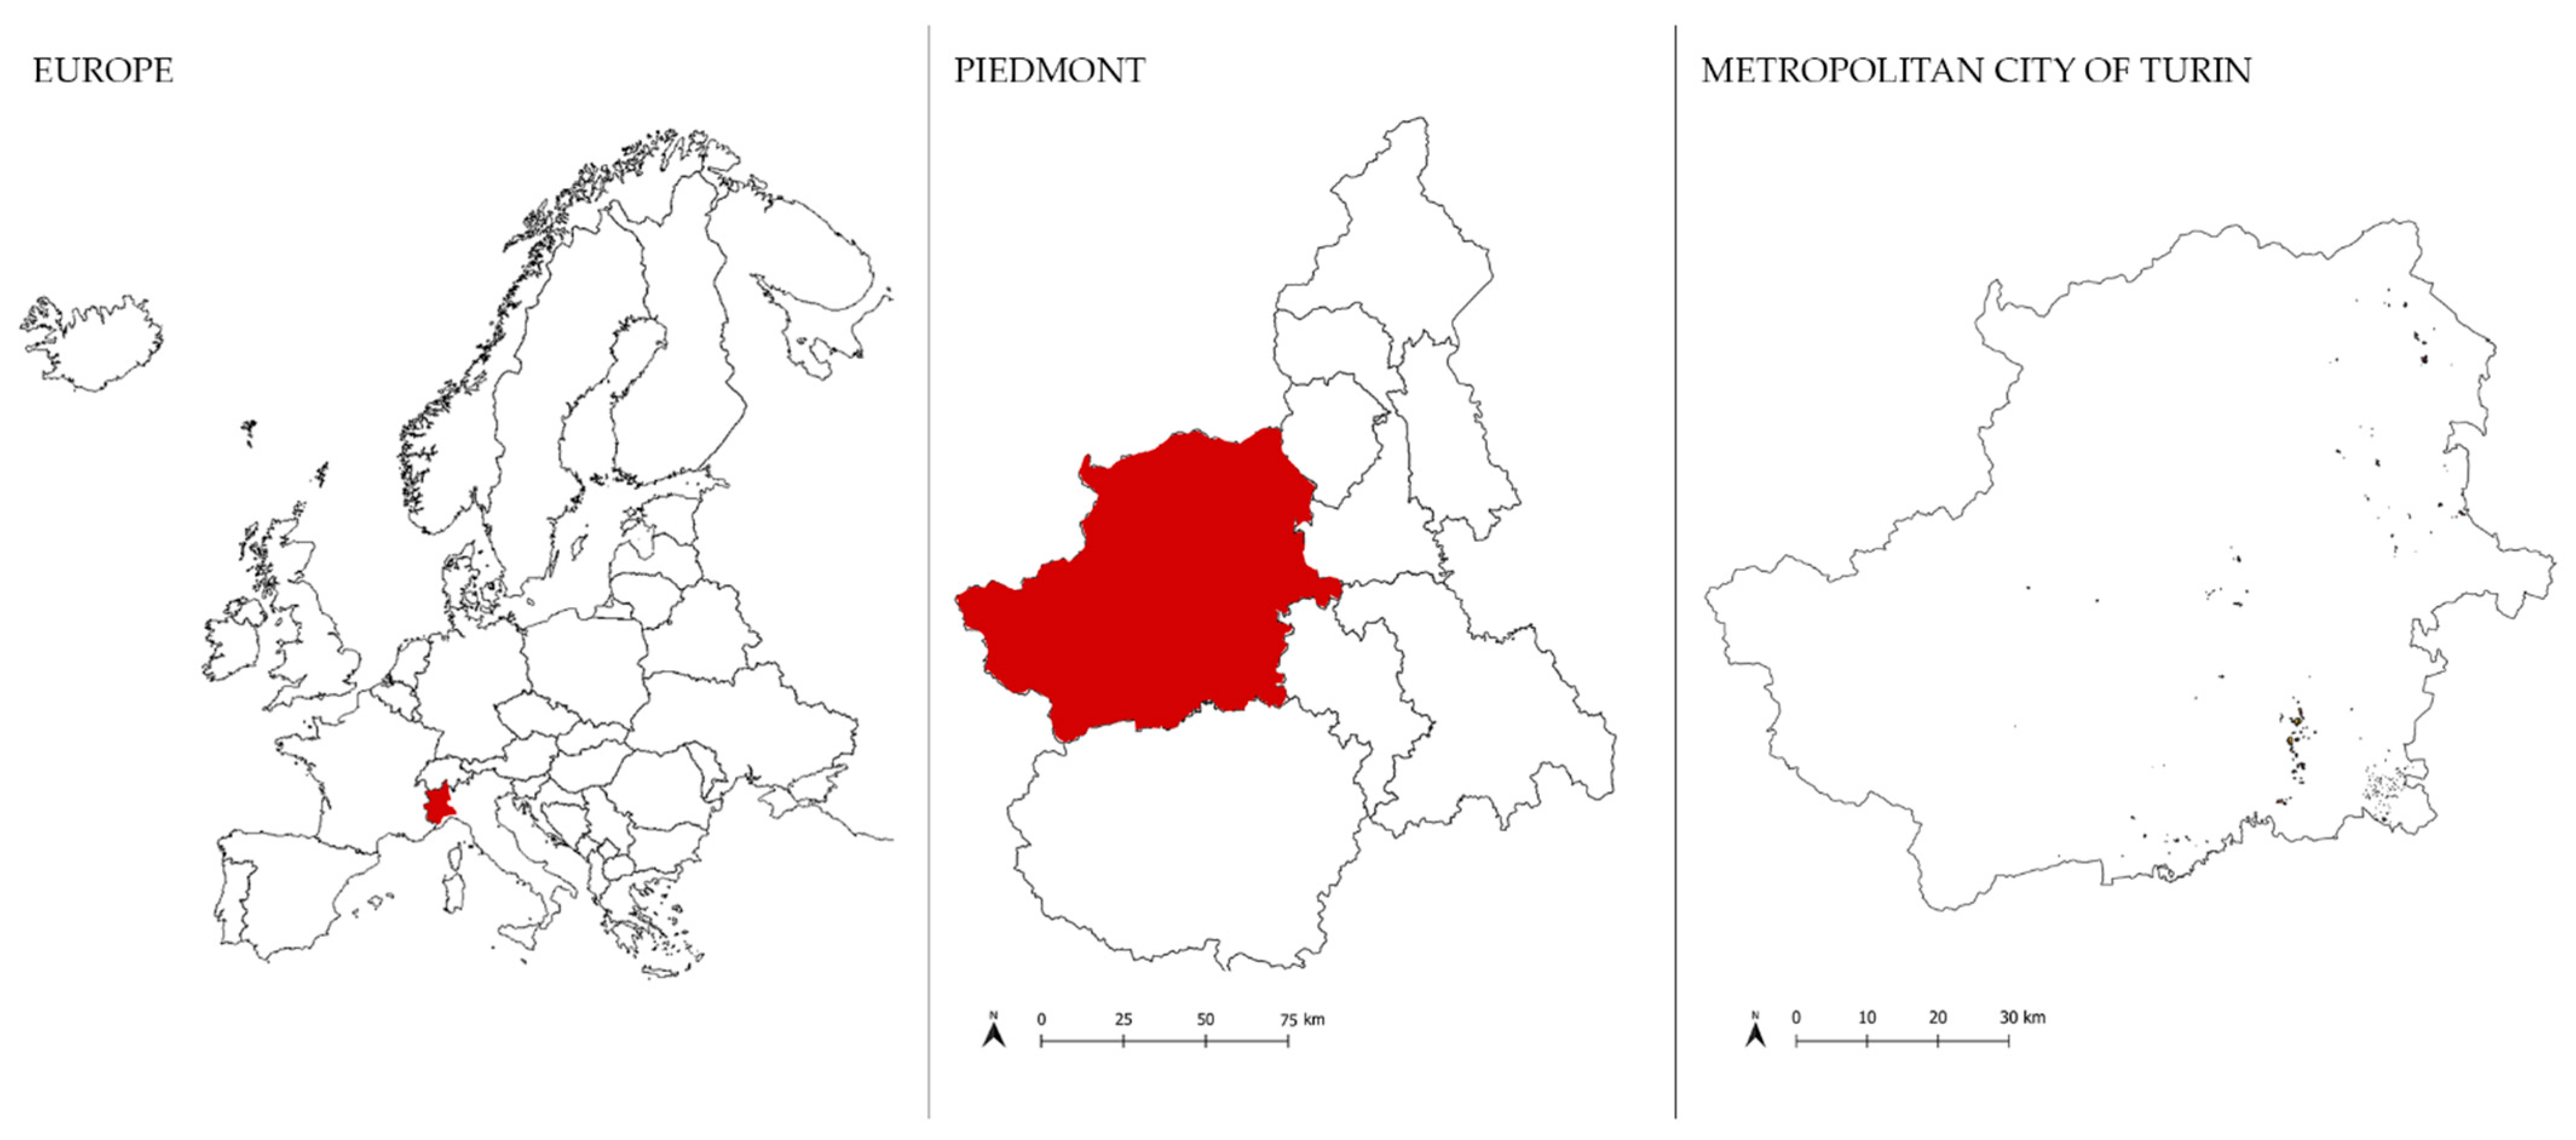
3.2. Study Area
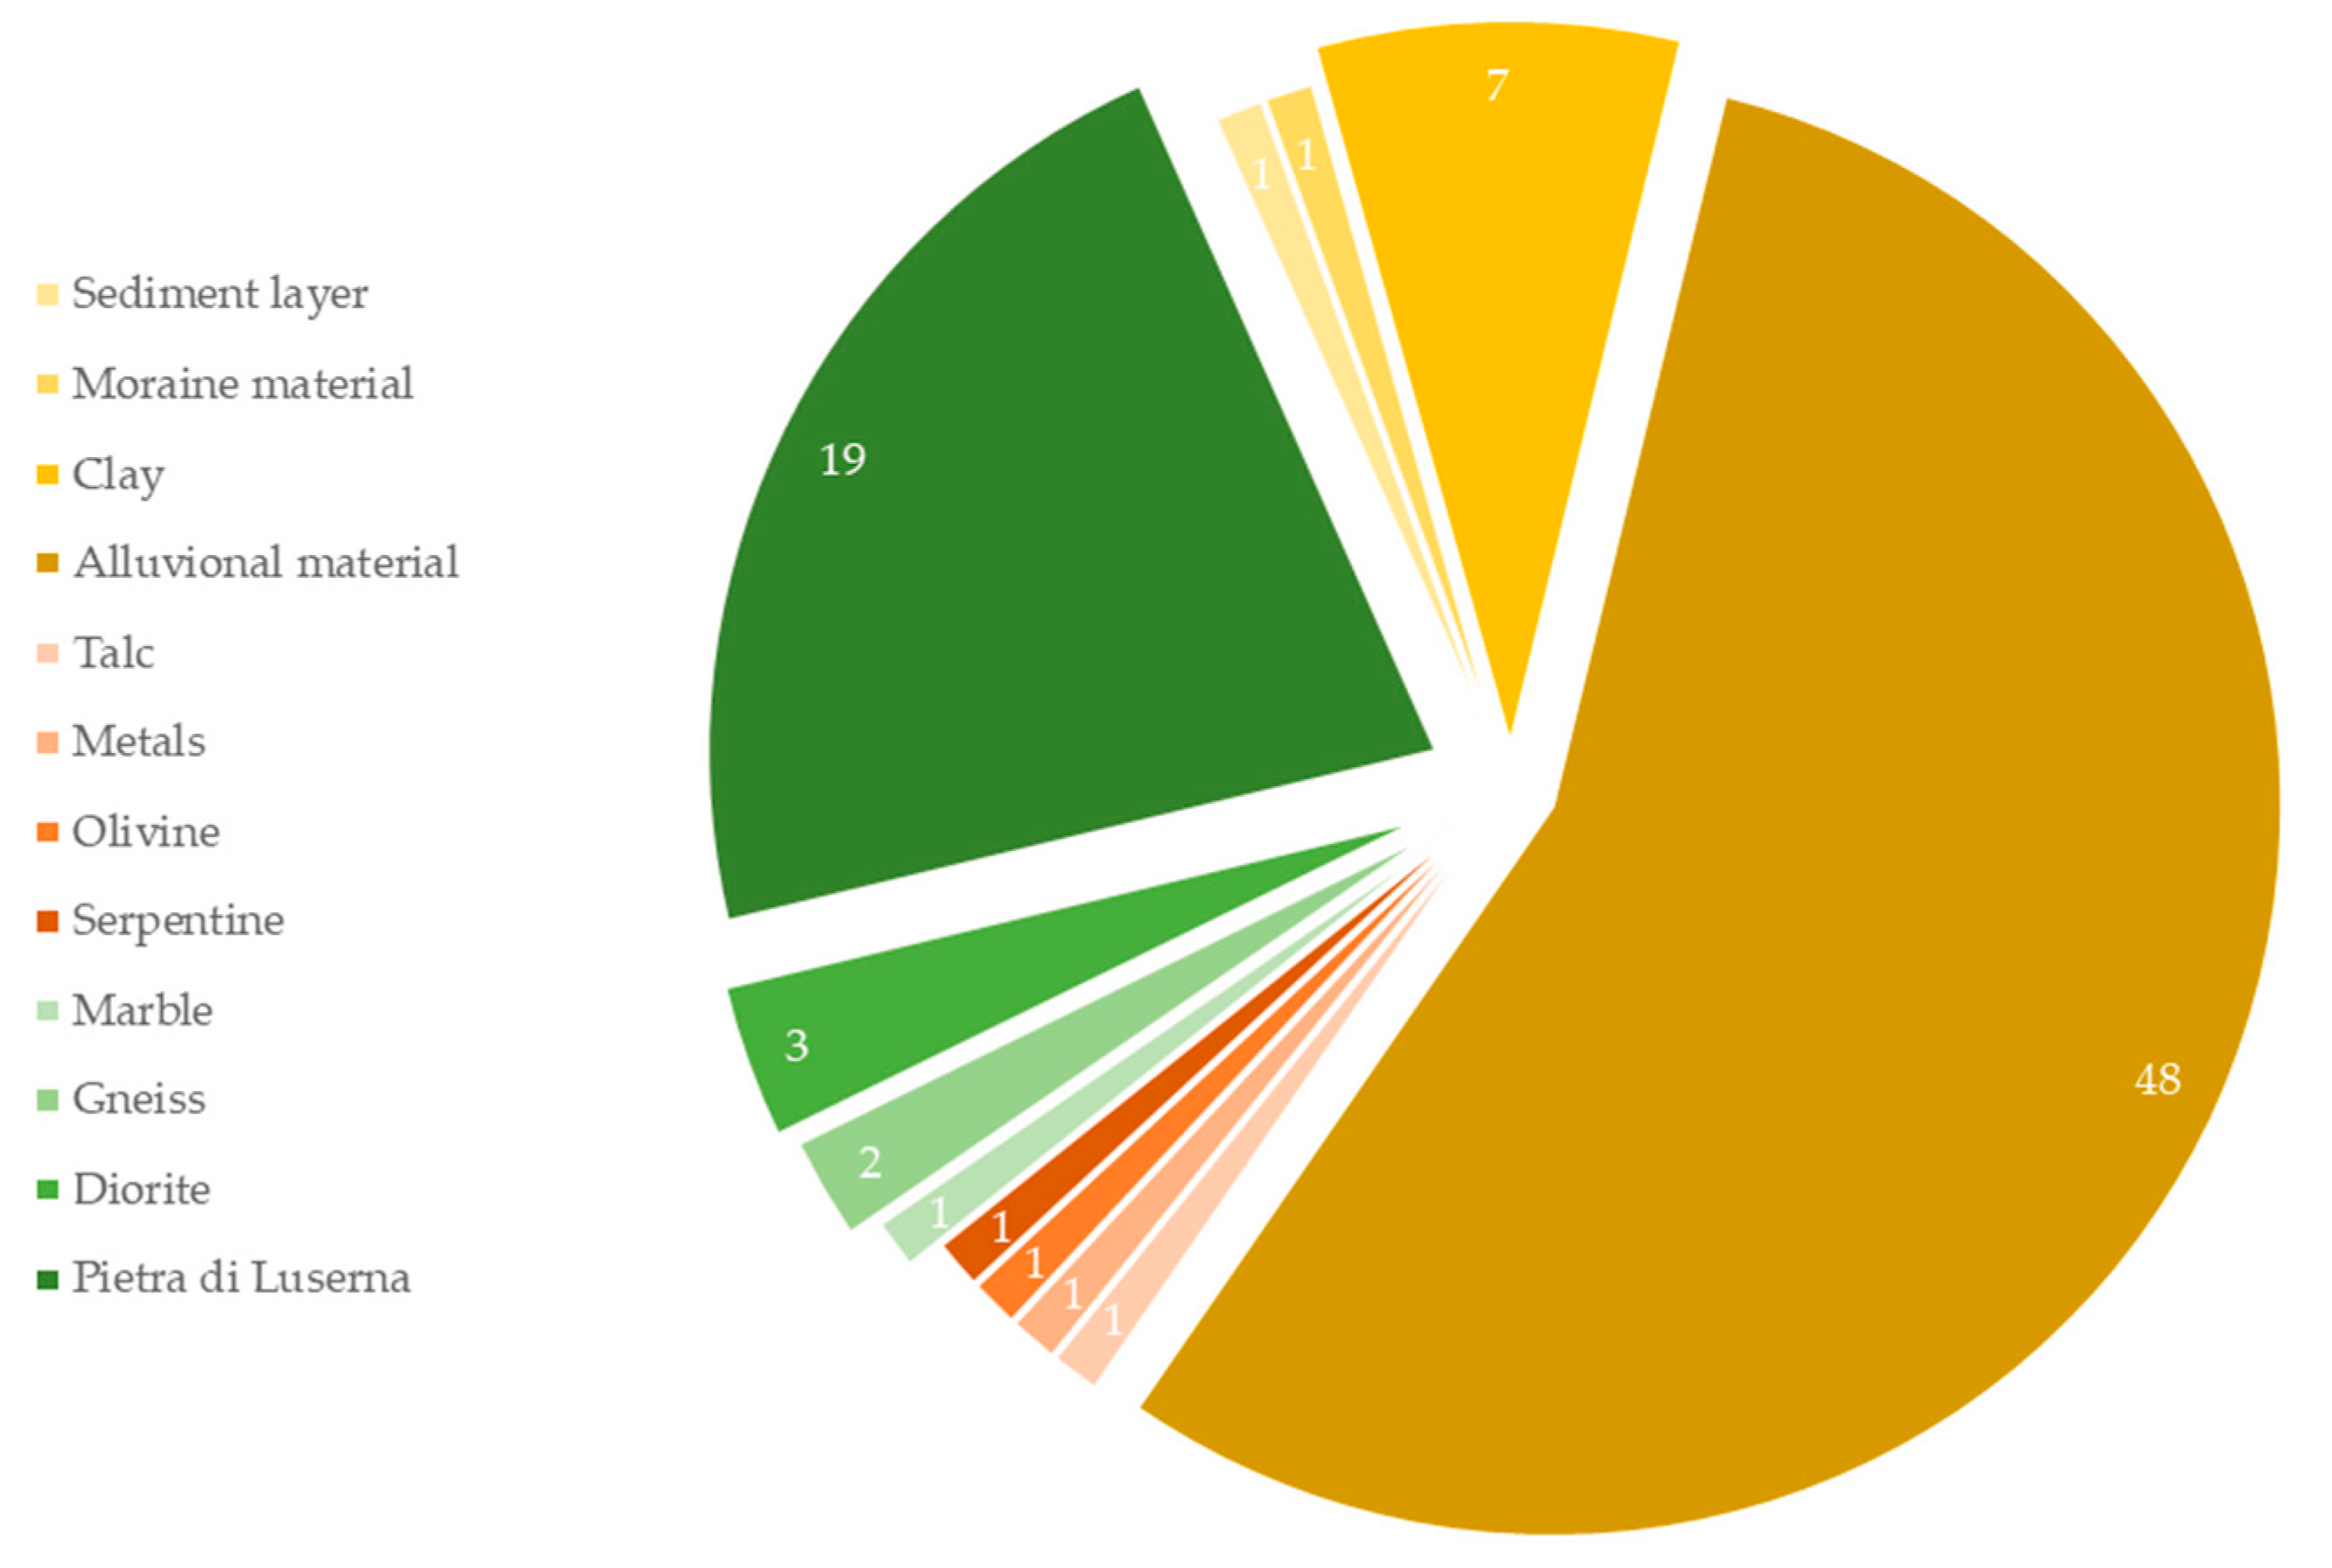
3.3. Spatial Database Assembly and ES Analysis
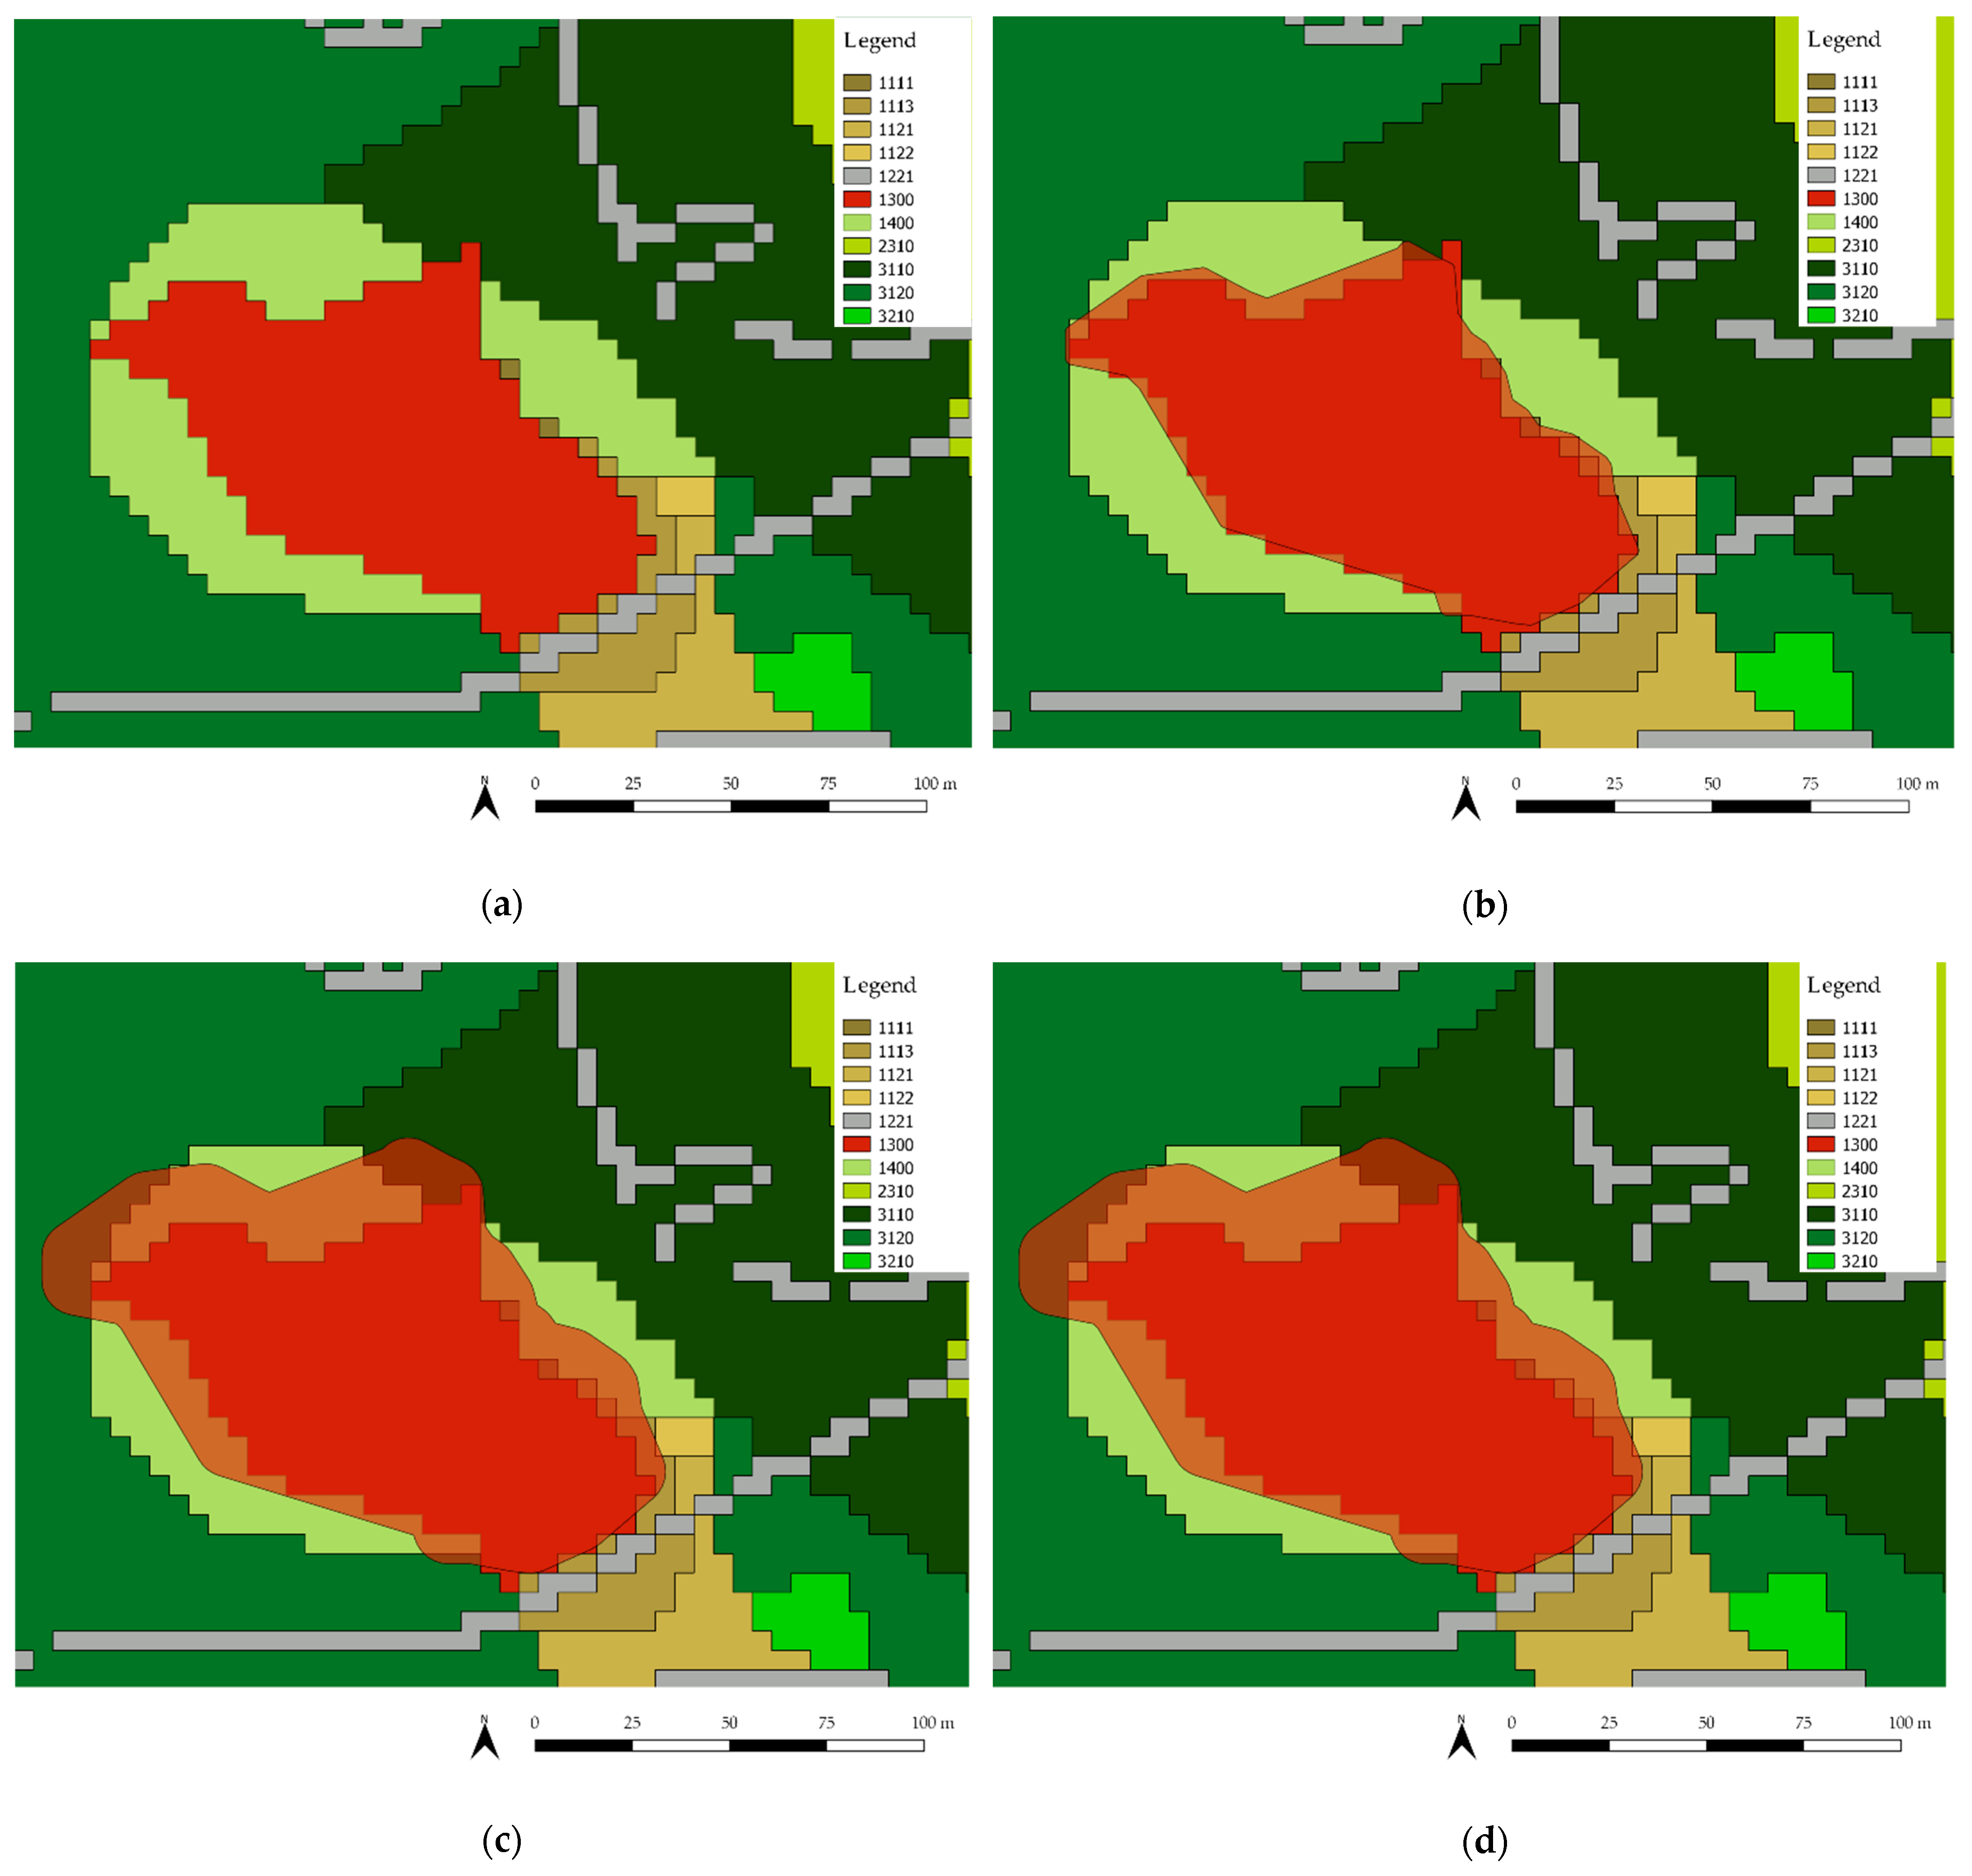
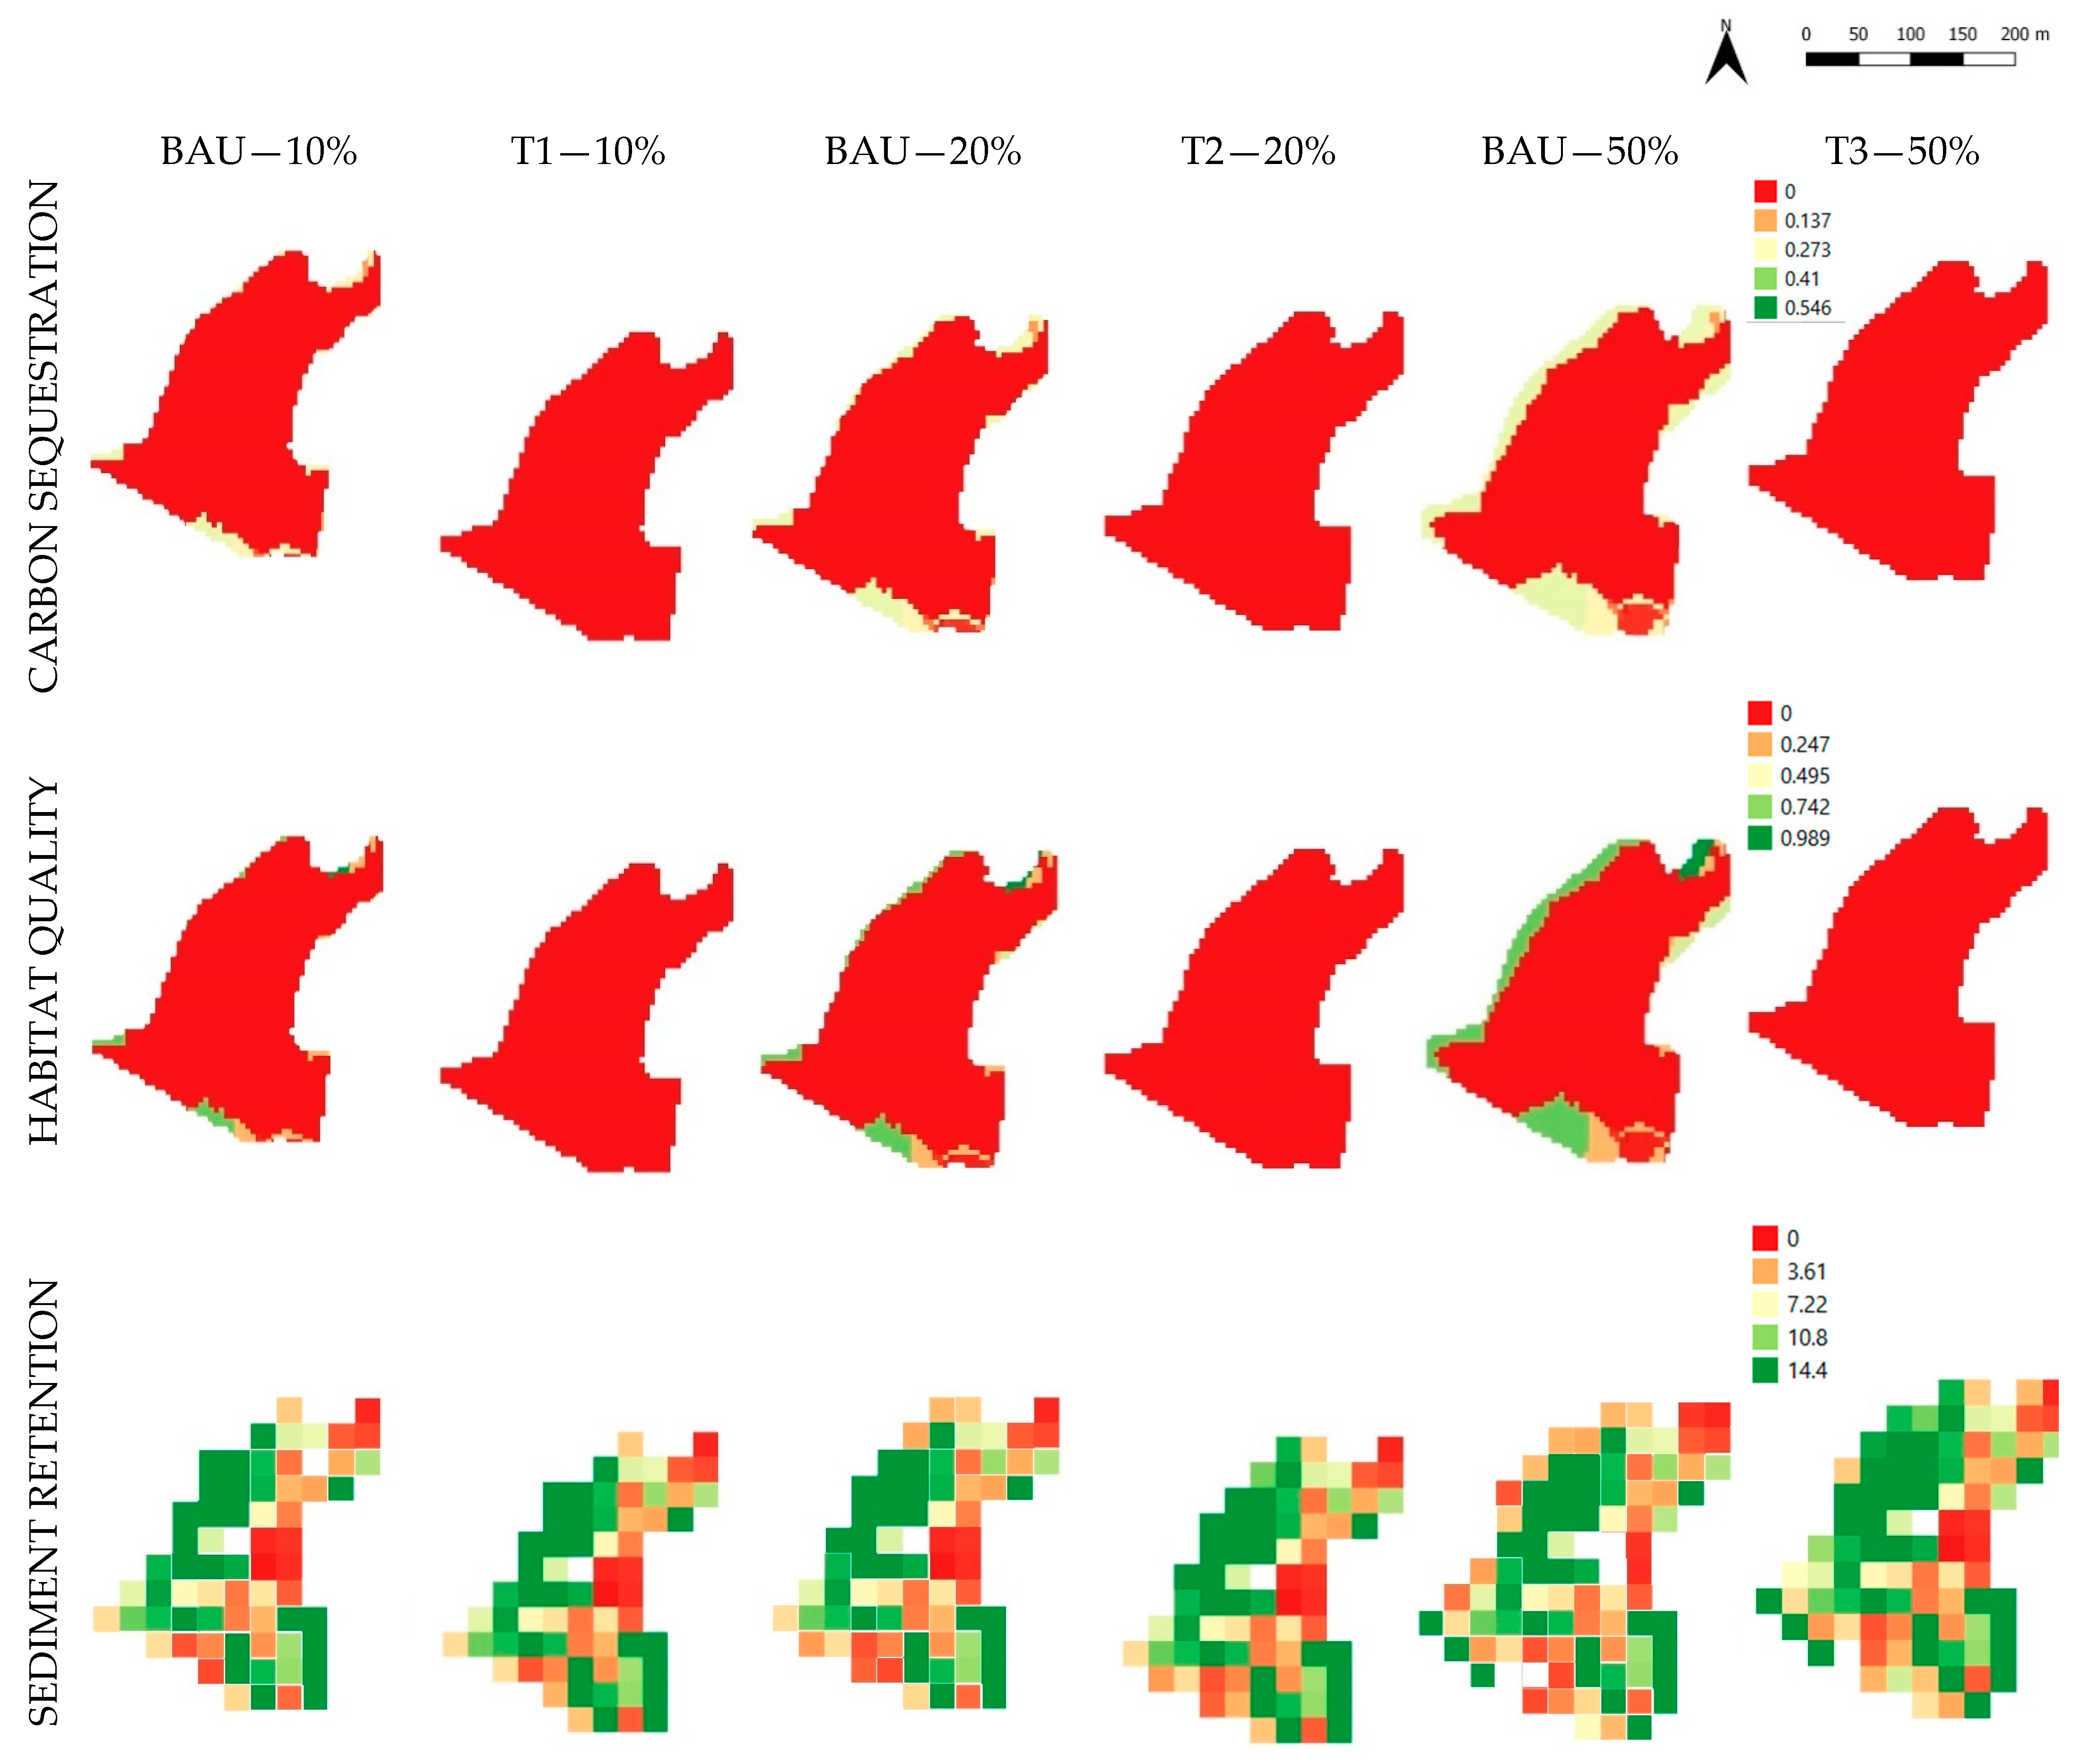
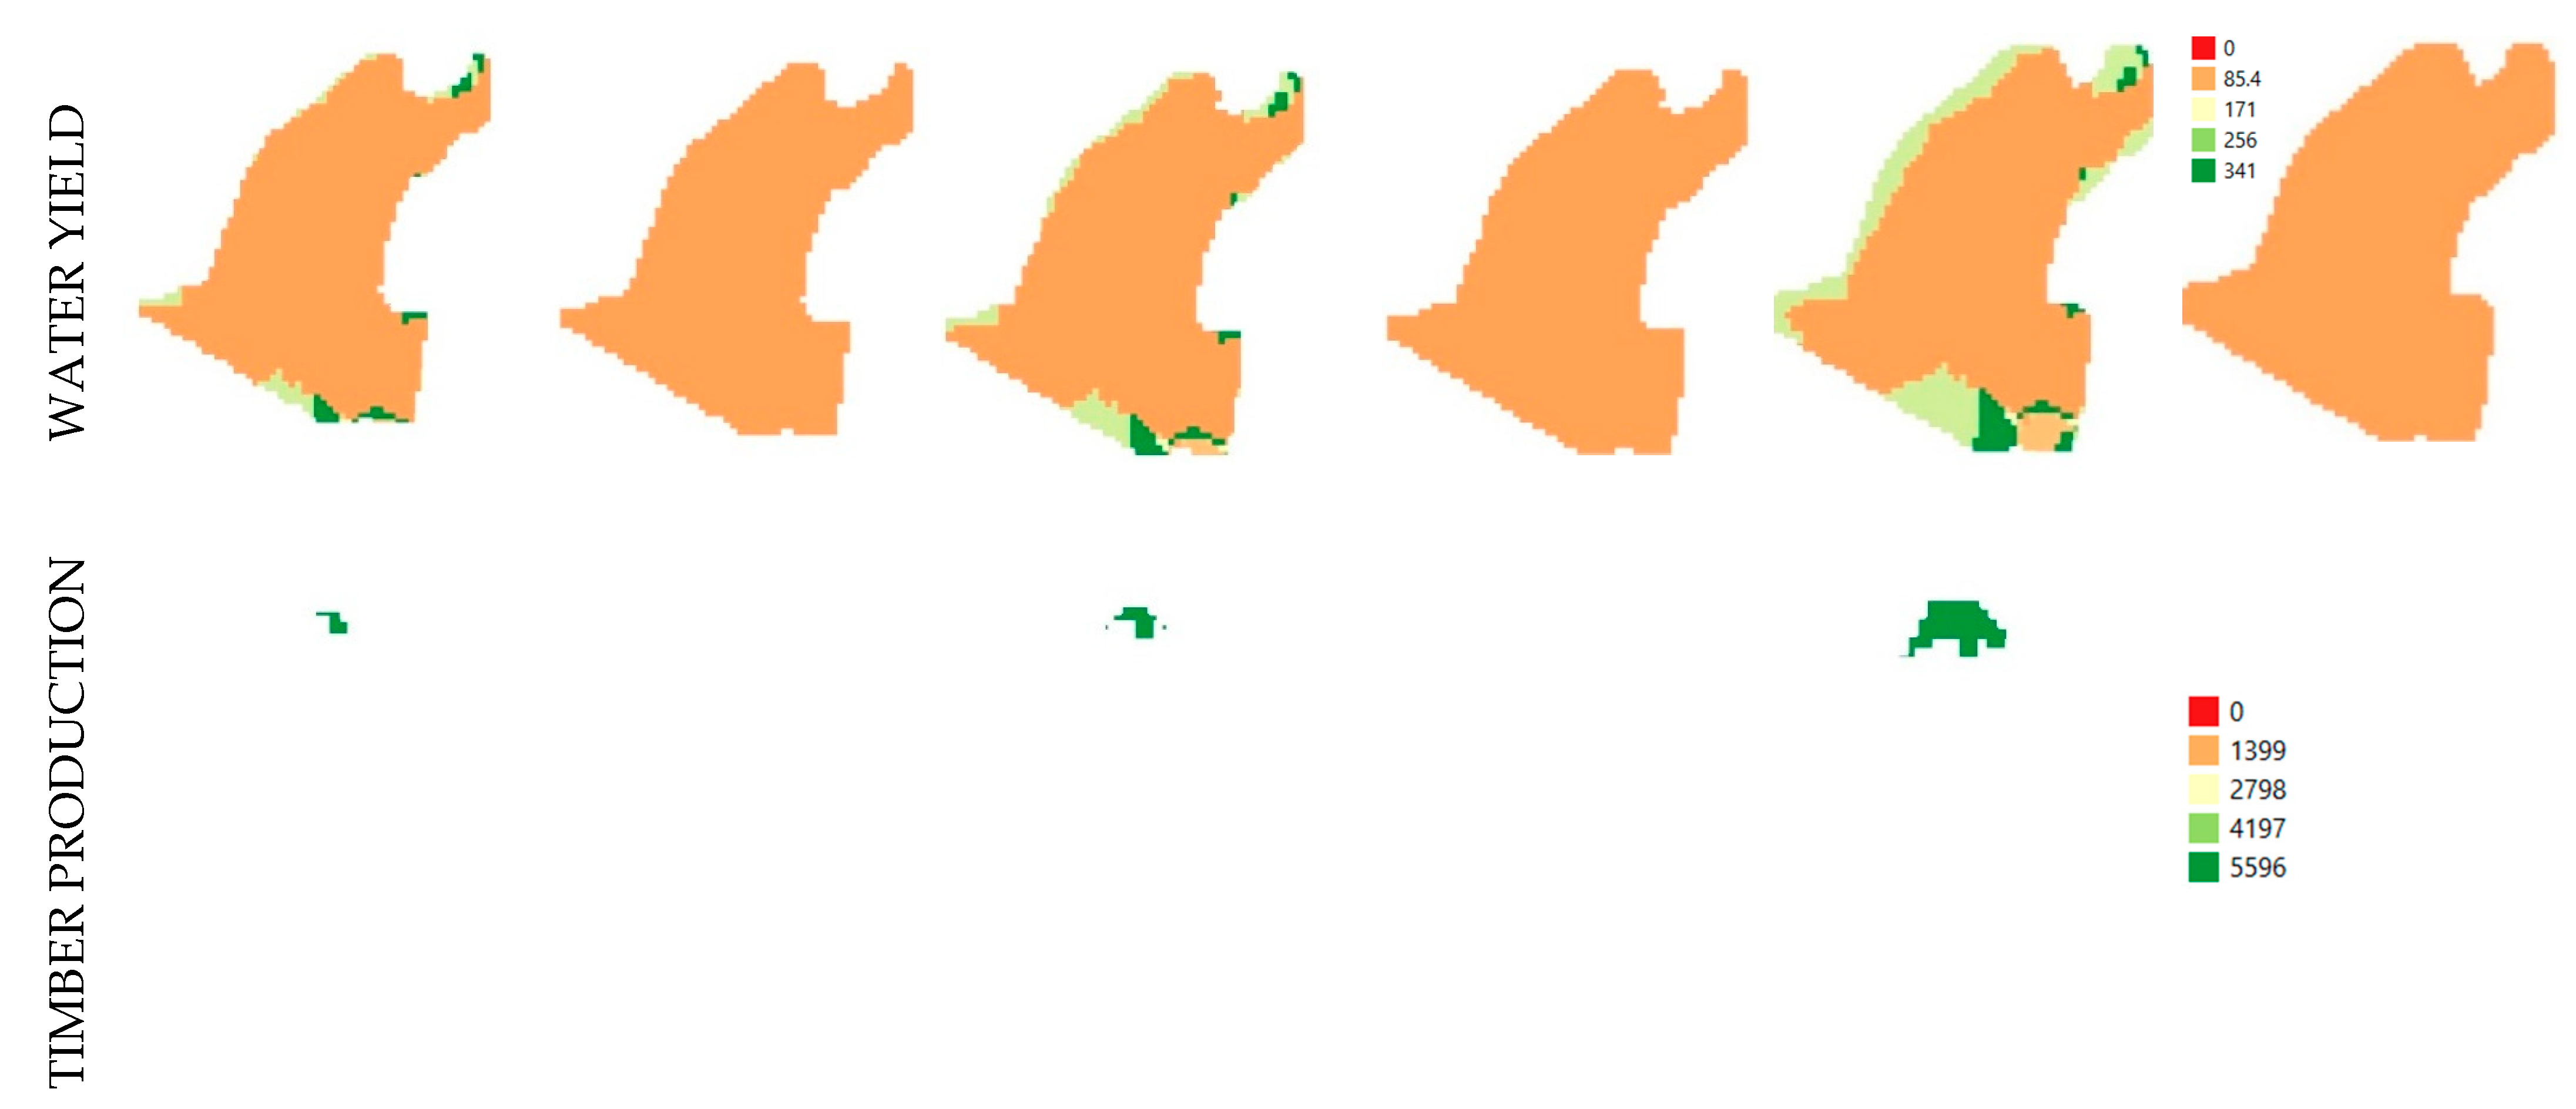
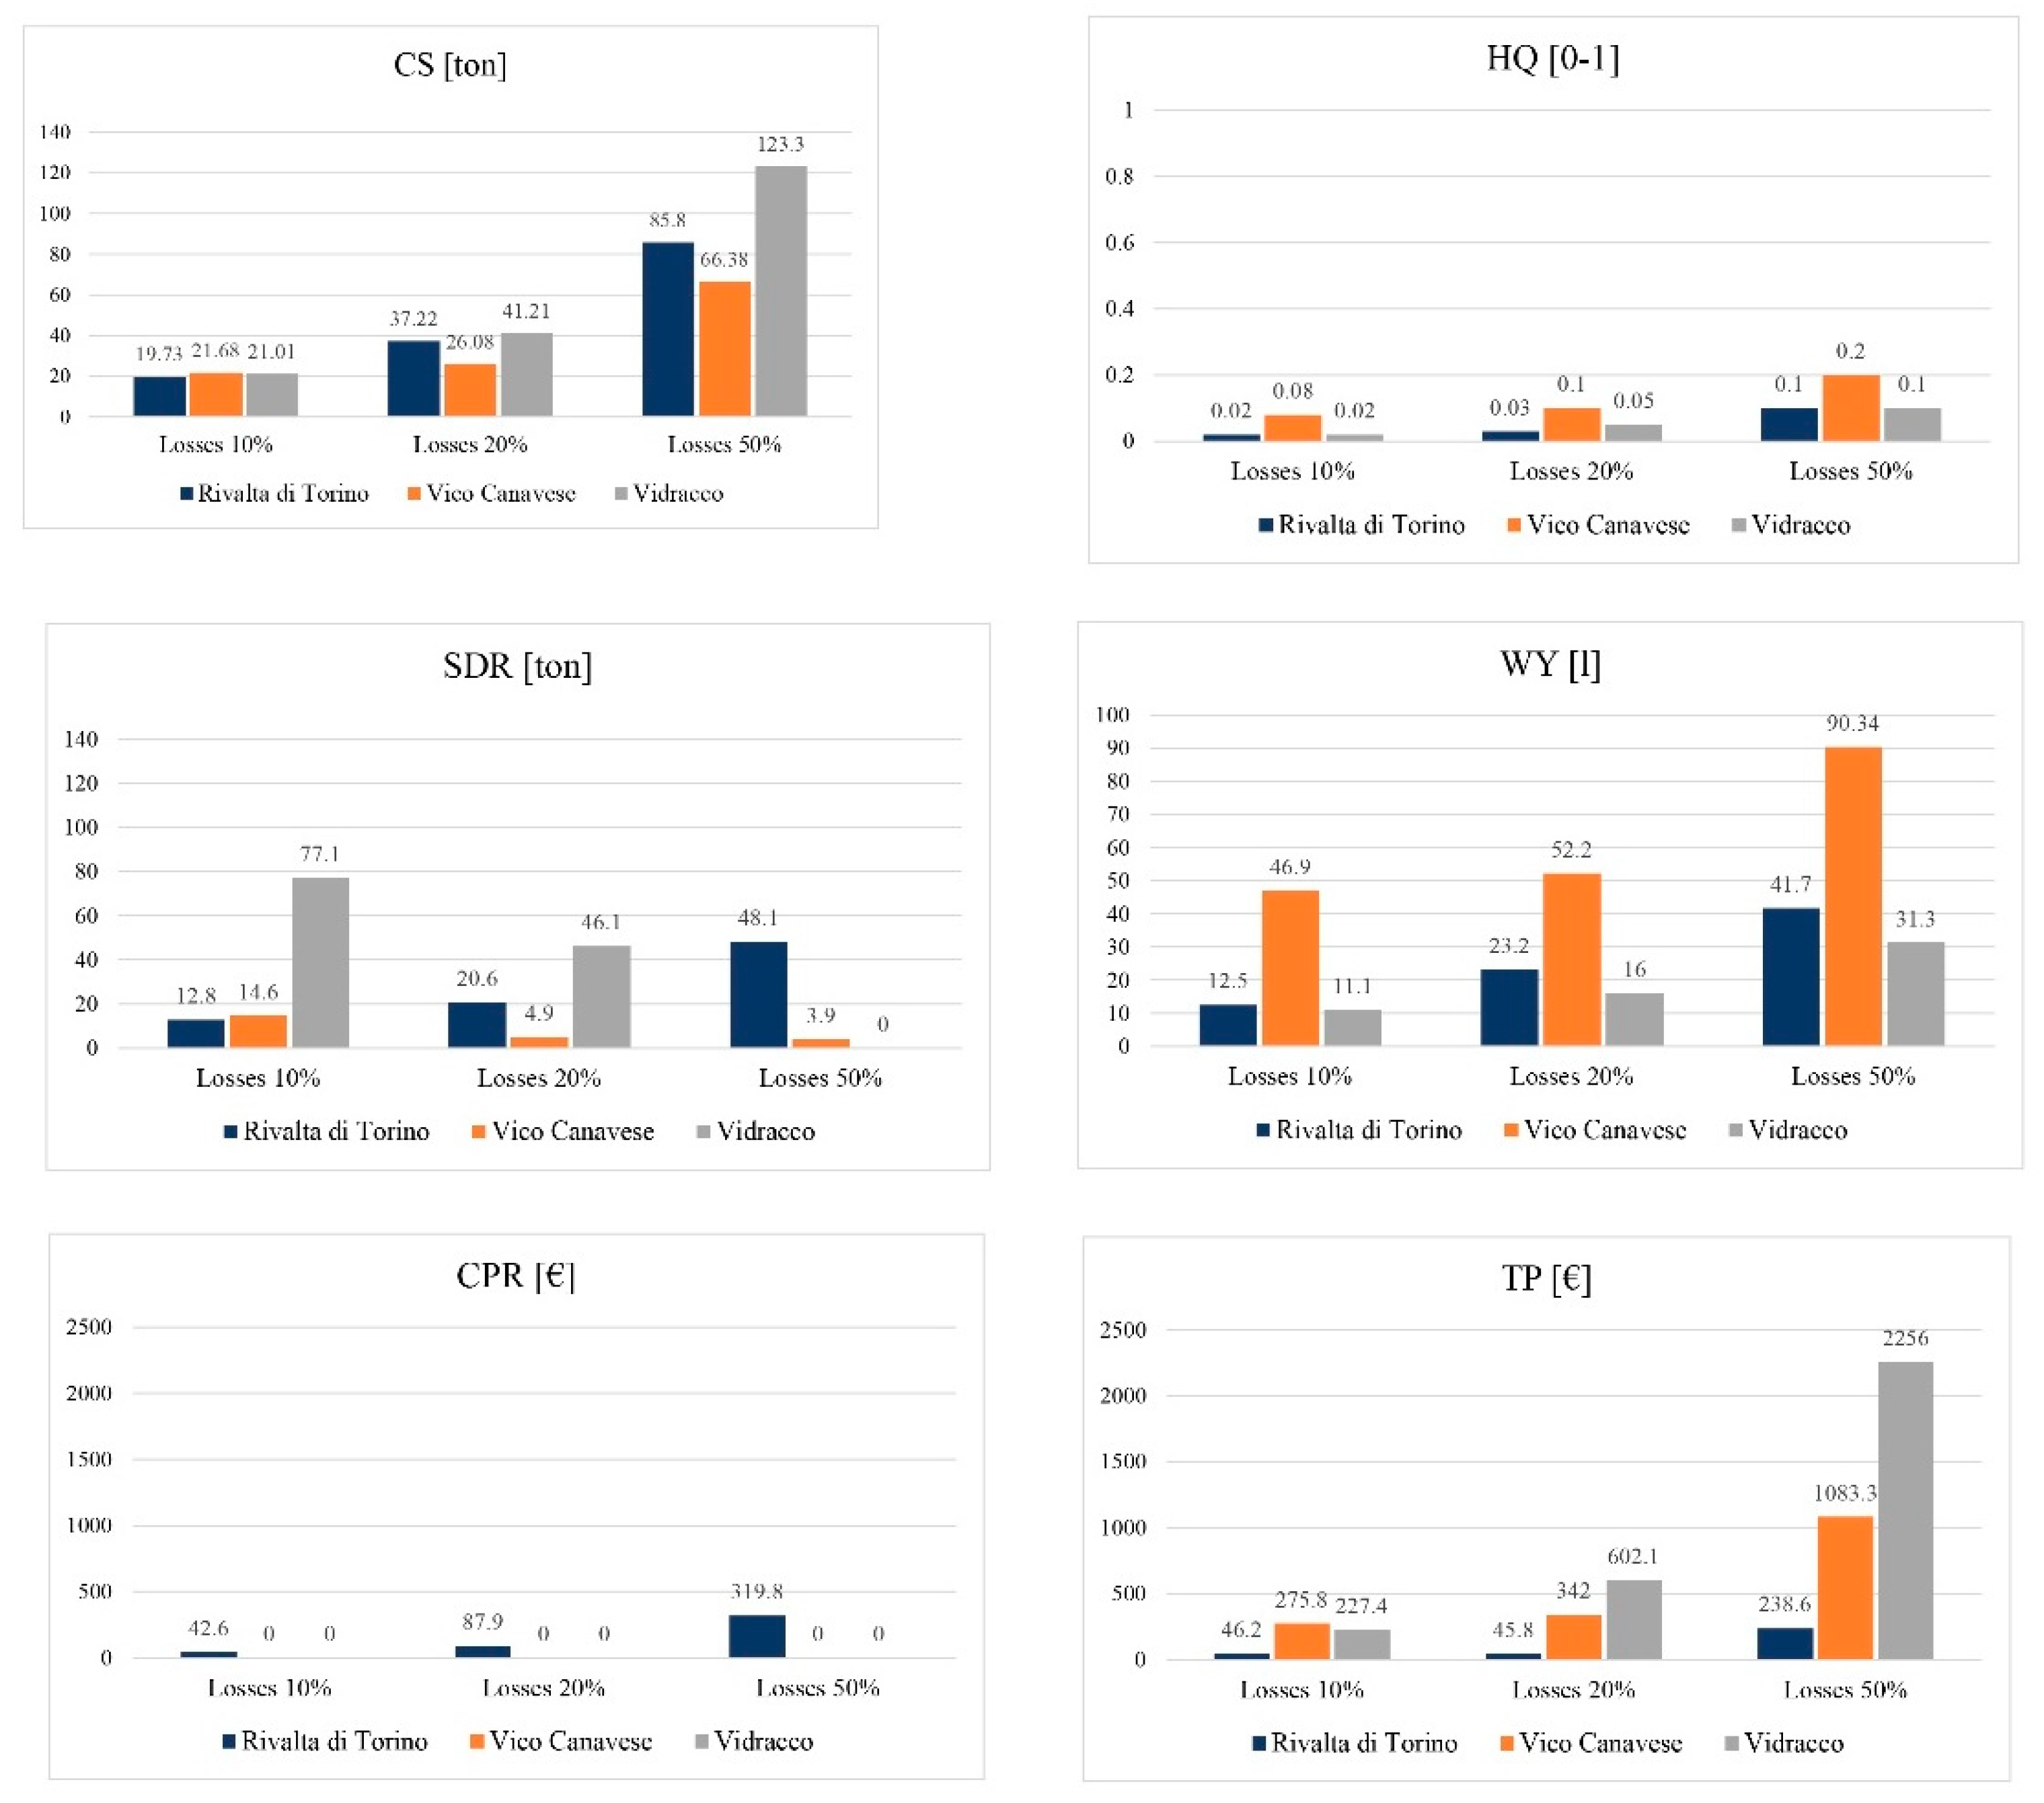
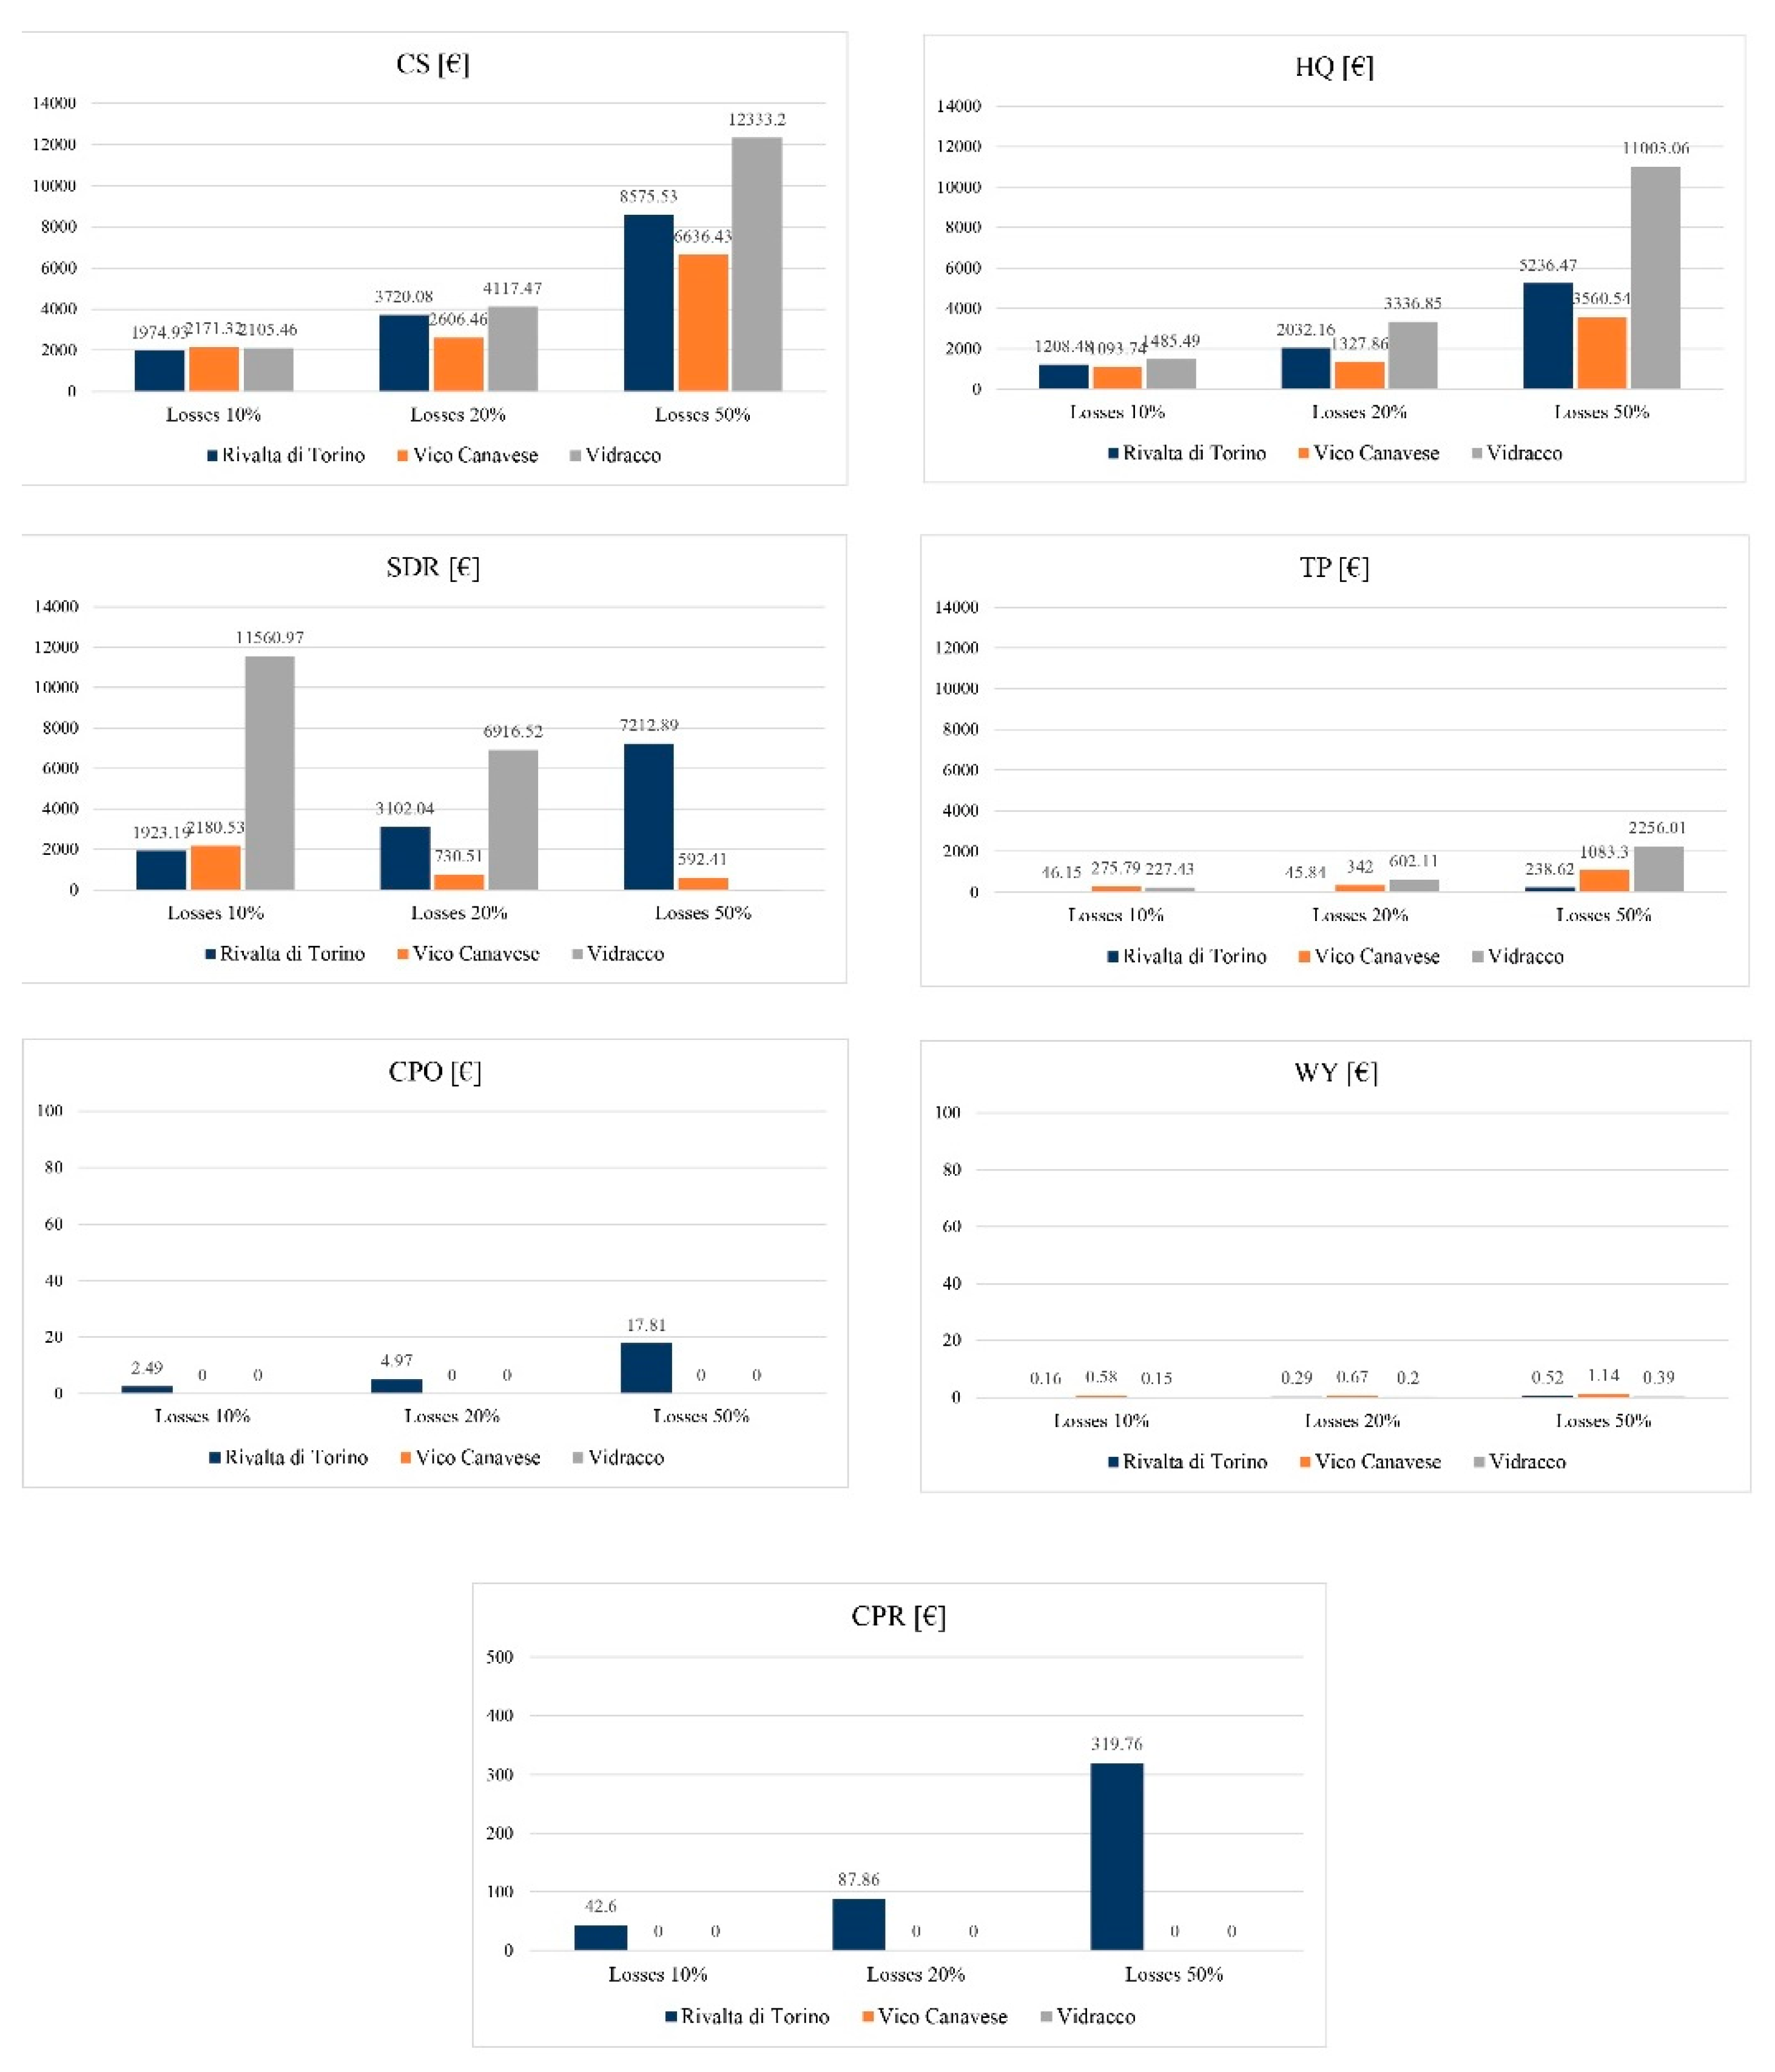
4. Results
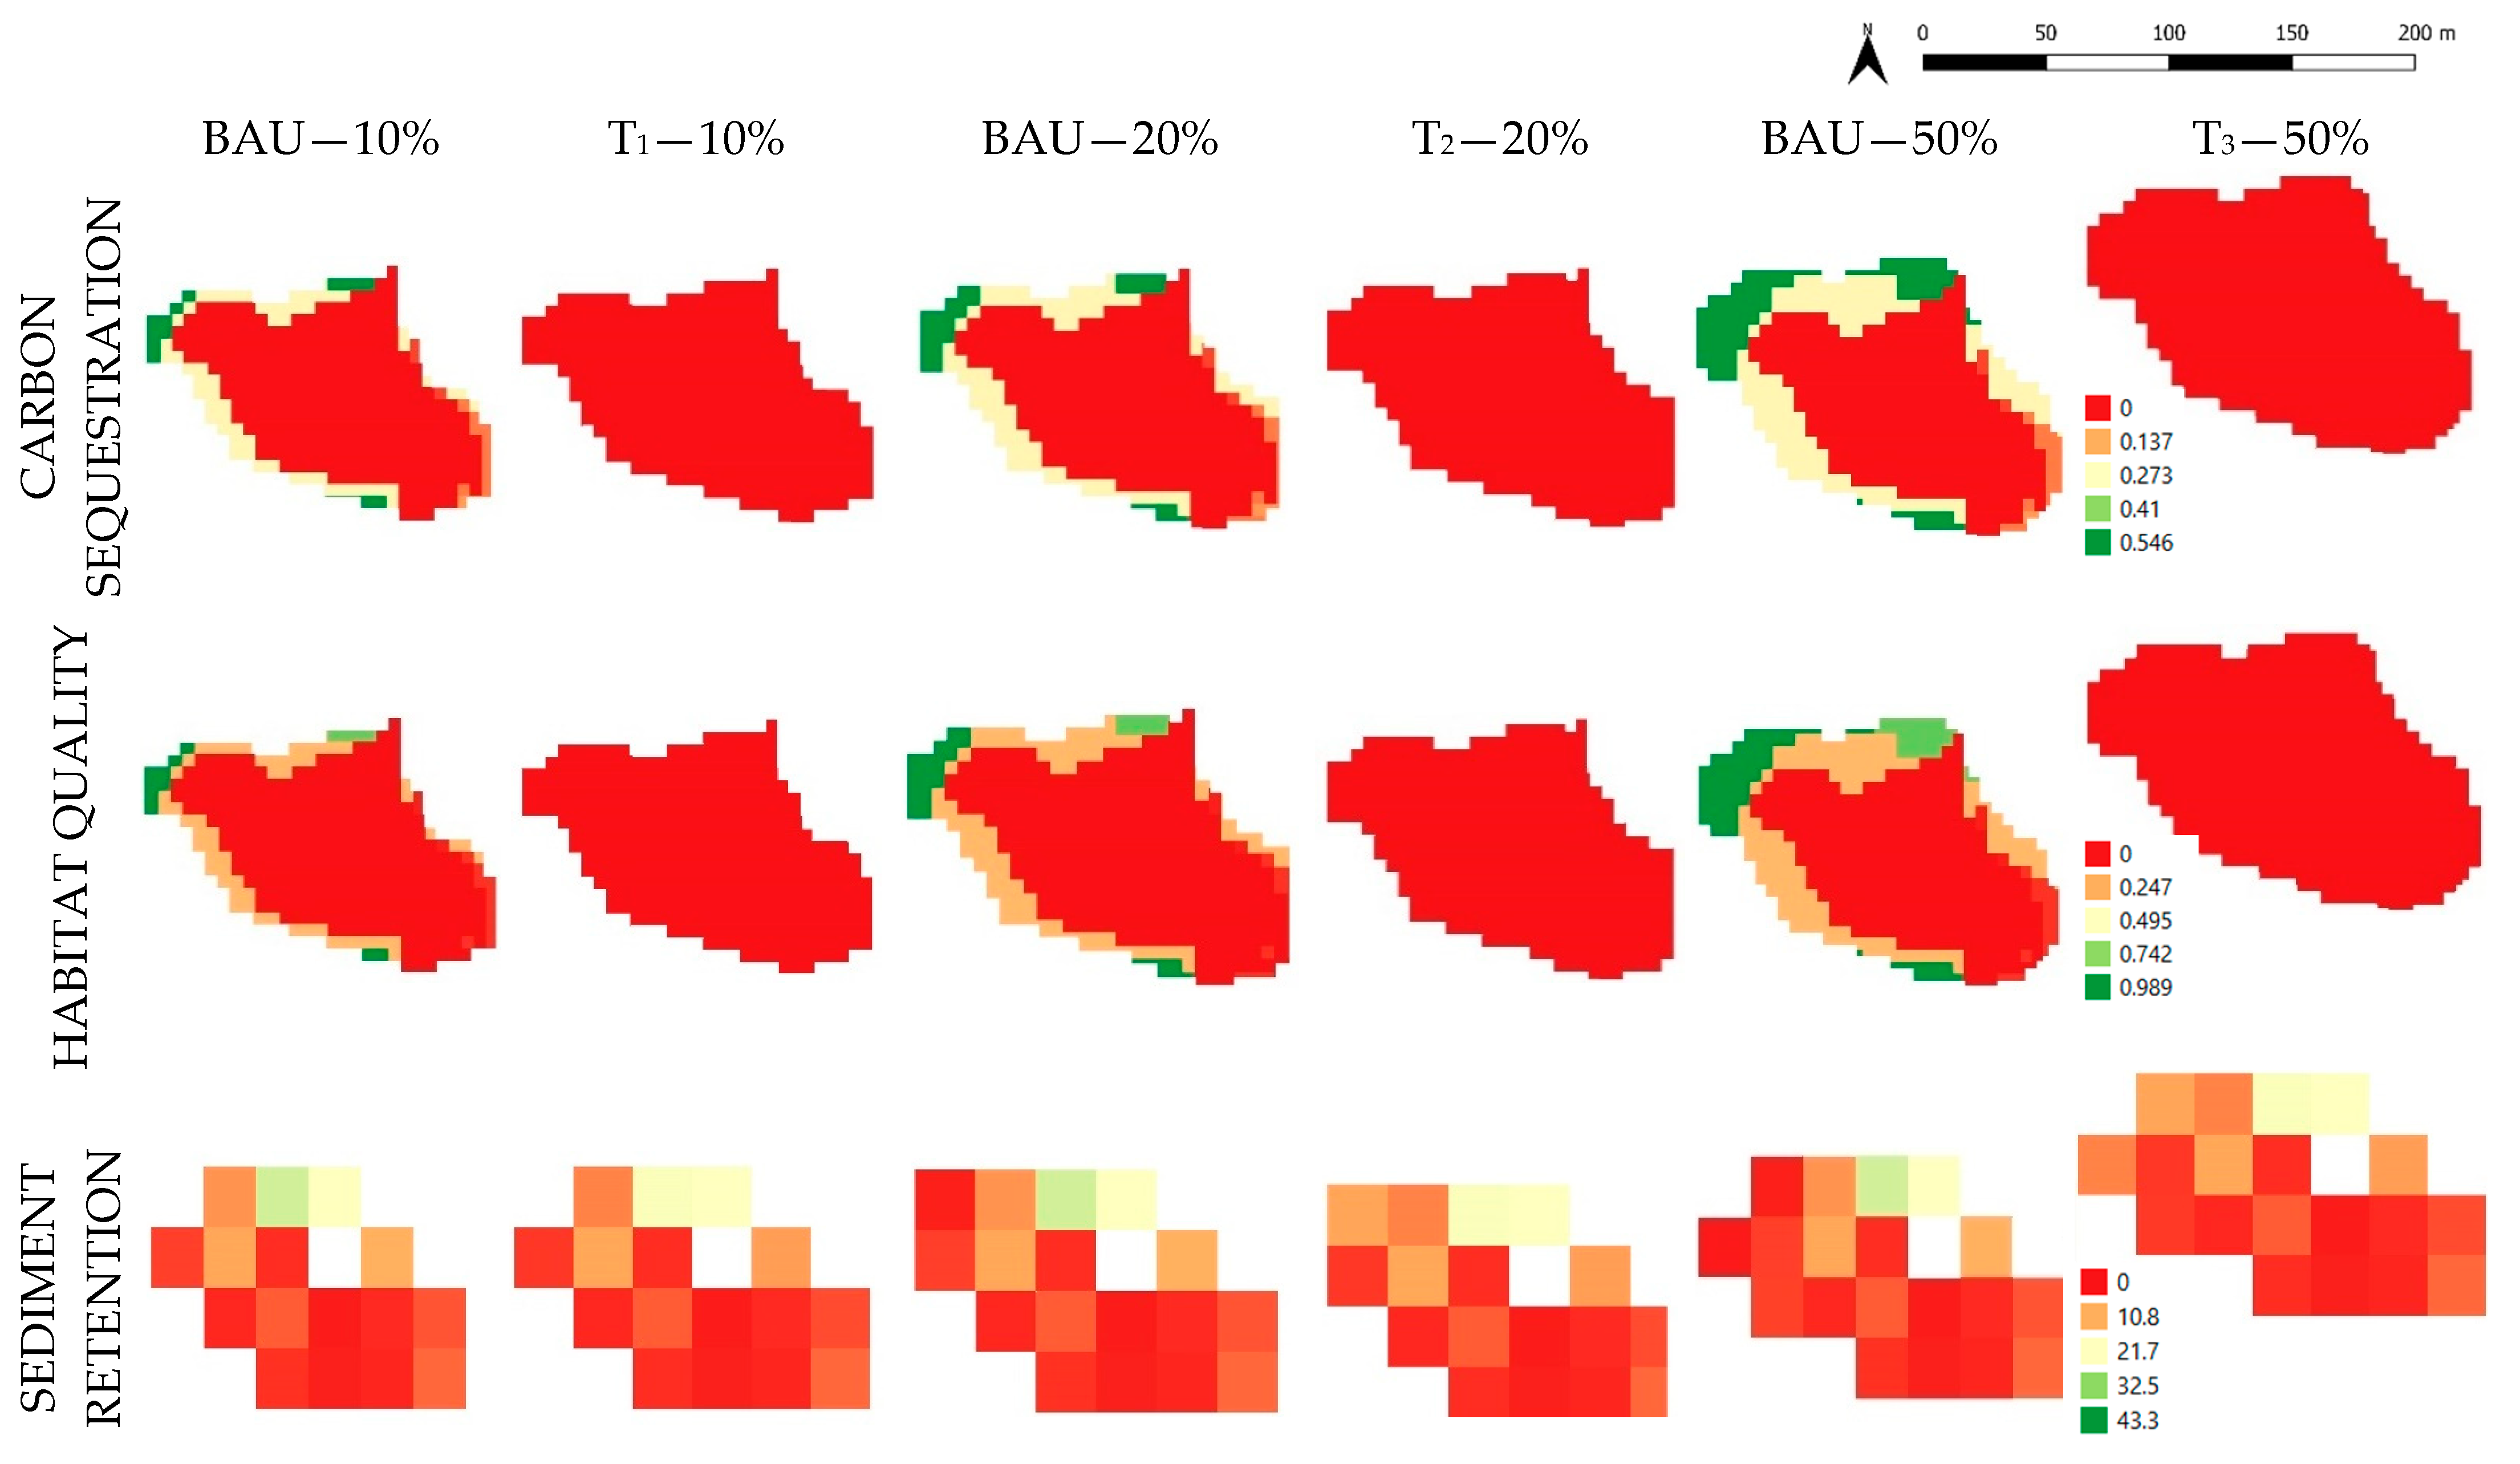
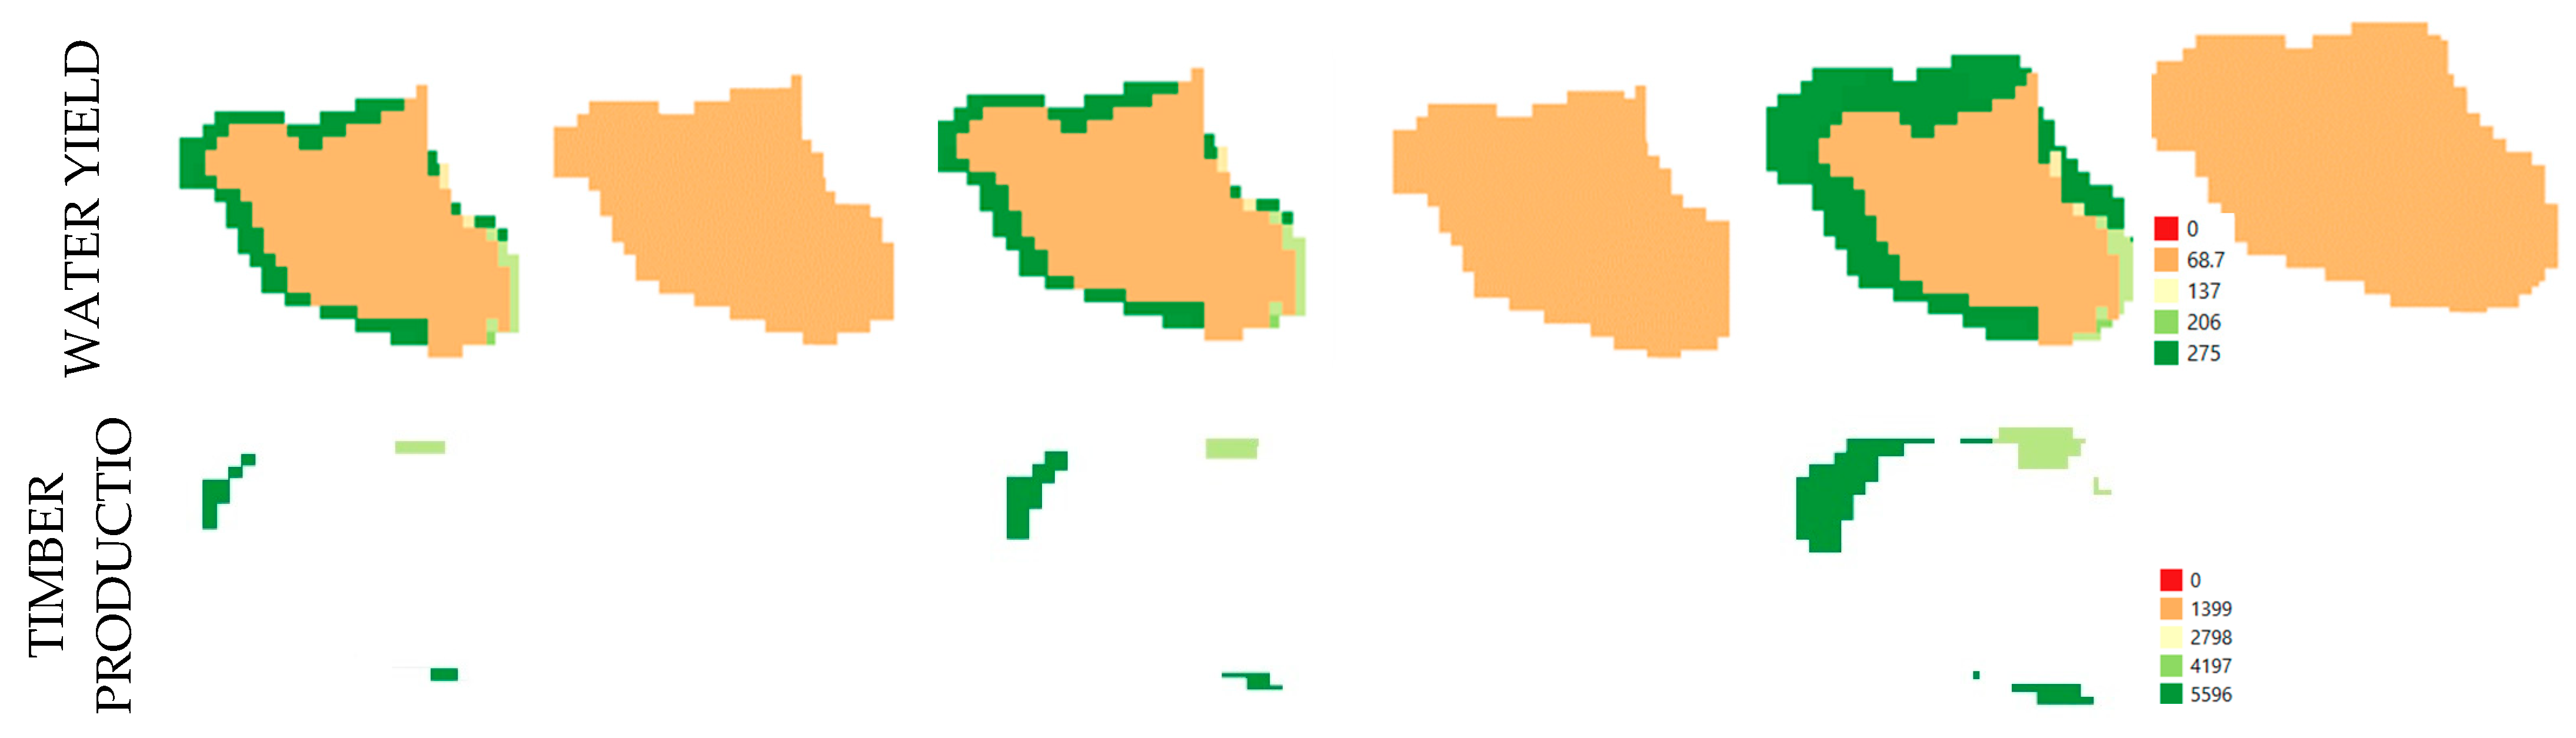
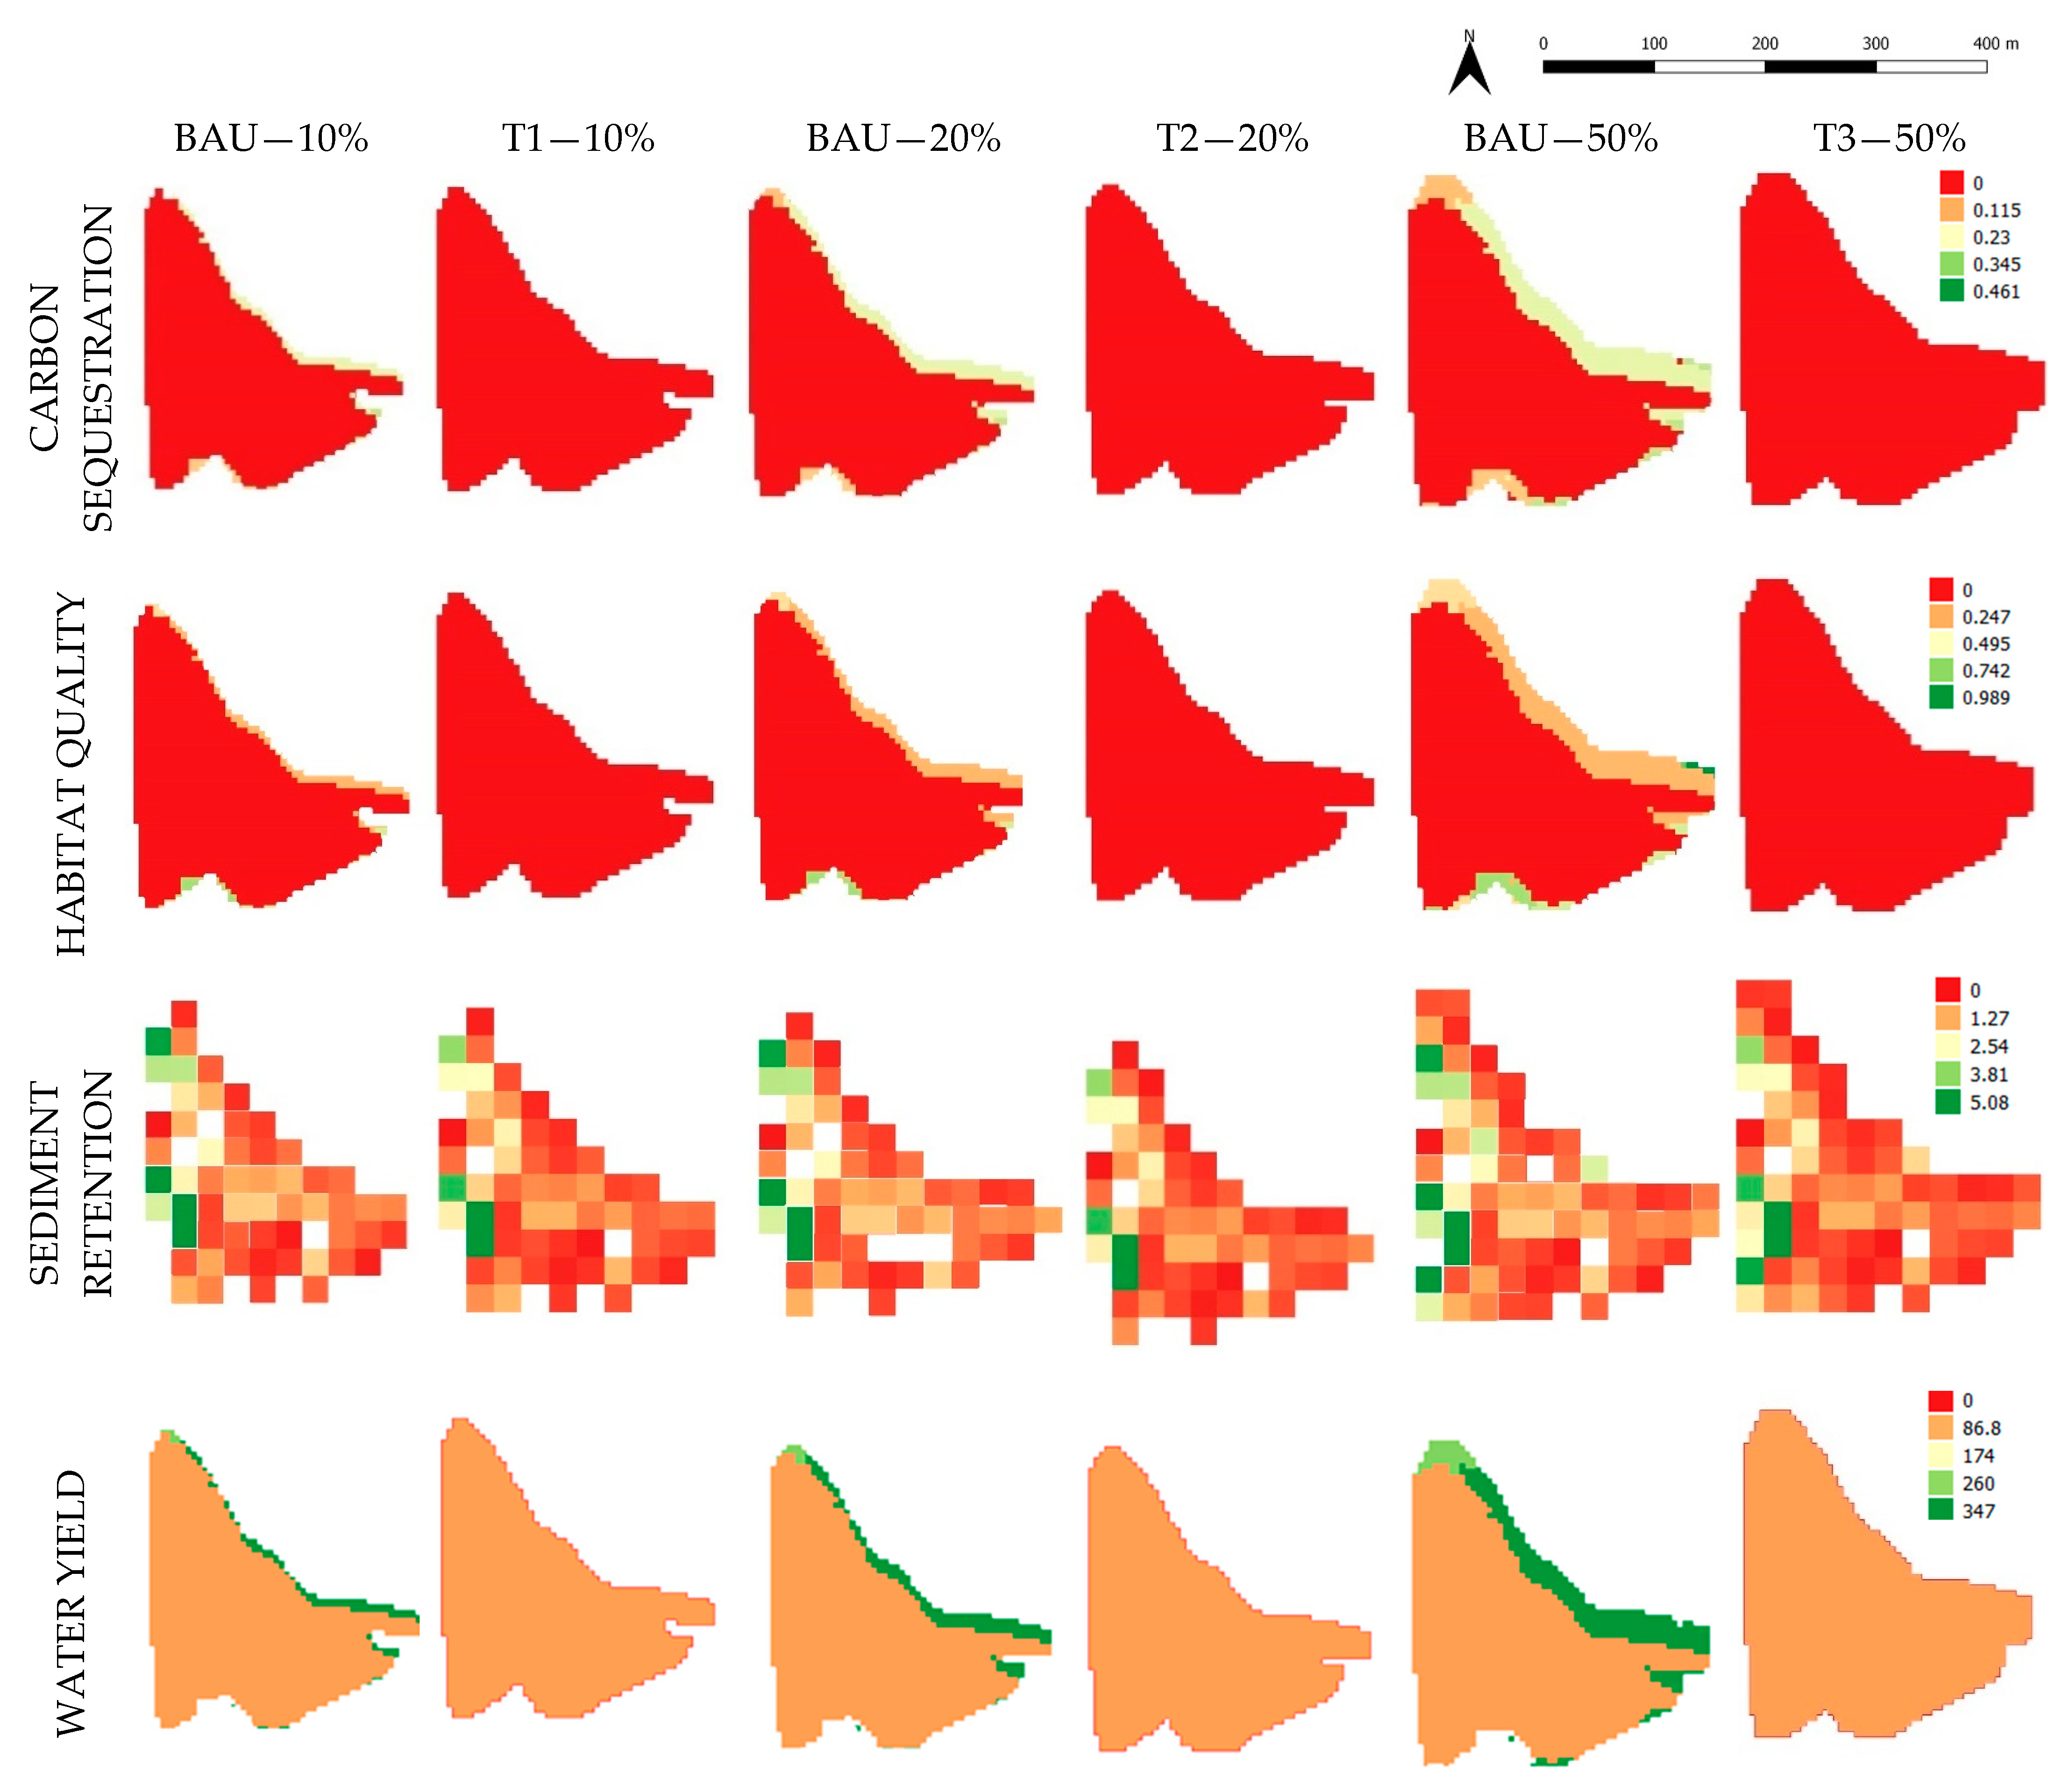
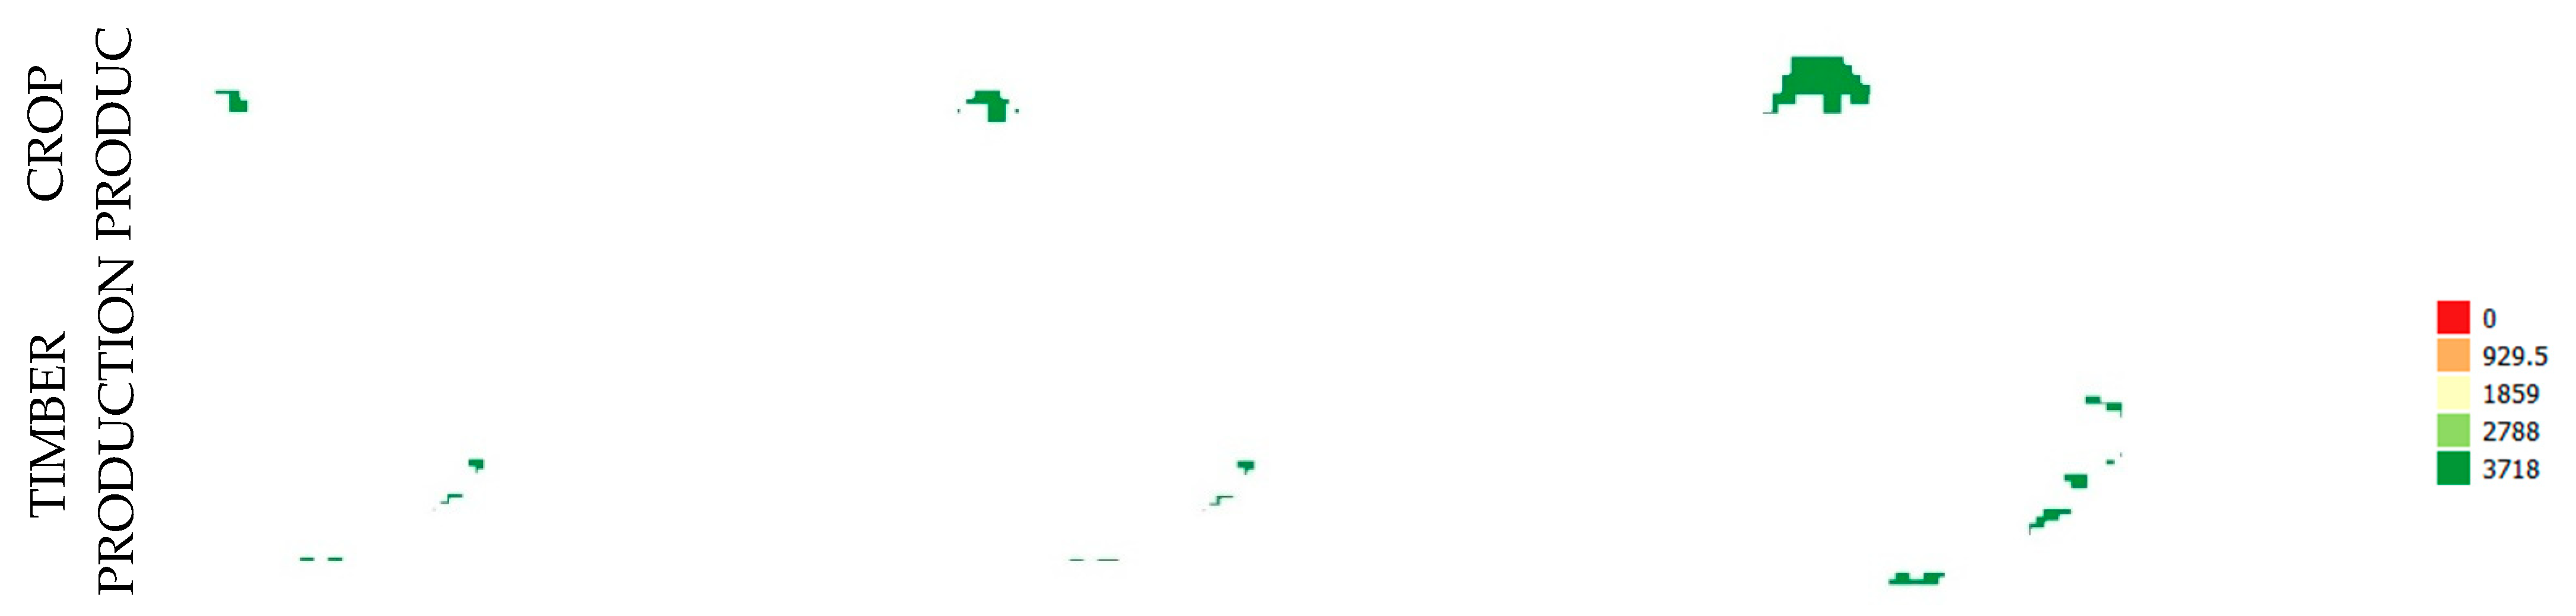
4.1. Values 10%
4.2. Values 20%
4.3. Values 50%
5. Discussion of the Results
6. Conclusions
Author Contributions
Funding
Institutional Review Board Statement
Informed Consent Statement
Data Availability Statement
Acknowledgments
Conflicts of Interest
References
- Zalasiewicz, J.; Waters, C.N.; Williams, M.; Barnosky, A.D.; Cearreta, A.; Crutzen, P.; Ellis, E.; Ellis, M.A.; Fairchild, I.J.; Grinevald, J.; et al. When did the Anthropocene begin? A mid-twentieth century boundary level is stratigraphically optimal. Quat. Int. 2015, 383, 196–203. [Google Scholar] [CrossRef] [Green Version]
- Assumma, V.; Bottero, M.; Mondini, G.; Zanetta, E. An Analytic Network Process (ANP)-Based Approach for Investigating Alternative Planning Scenarios of Mining Activities in Piedmont Region. In Lecture Notes in Computer Science; Springer: Cham, Switzerland, 2020; Volume 12253, pp. 355–365. ISBN 978-3-030-58813-7. [Google Scholar]
- Percy, S.; Lubchenco, J.; Almeida, F.; Armsworth, P.; Bennett, A.; Ebi, K.; Ehrmann, J.; Griffith, J.; Kumar, P.; Pagiola, S.; et al. Millennium Ecosystem Assessment Business and Industry Synthesis Team Synthesis Team Members Synthesis Team Co-Chairs Business Council for Sustainable Development-Brazil World Business Council for Sustainable Development A Report of the Millennium Ecosystem. 2005, p. 36. Available online: https://www.millenniumassessment.org/documents/document.354.aspx.pdf (accessed on 1 January 2022).
- Baveye, P.C.; Baveye, J.; Gowdy, J. Soil “Ecosystem” Services and Natural Capital: Critical Appraisal of Research on Uncertain Ground. Front. Environ. Sci. 2016, 4, 41. [Google Scholar] [CrossRef]
- Onwe, R.; Abraham, E. Environmental Problems of Surface and Underground Mining: A review. Int. J. Eng. Sci. 2015, 4, 12–20. [Google Scholar]
- Assumma, V.; Bottero, M.; Monaco, R.; Mondini, G. Assessing the landscape value: An integrated approach to measure the attractiveness and pressures of the vineyard landscape of piedmont (Italy). In Smart Innovation, Systems and Technologies; Springer: Berlin/Heidelberg, Germany, 2019. [Google Scholar]
- Laurence, D. Establishing a sustainable mining operation: An overview. J. Clean. Prod. 2011, 19, 278–284. [Google Scholar] [CrossRef]
- Bottero, M.C.; Polo Pérez, I.; Taddia, G.; Lo Russo, S. A geodatabase for supporting planning and management of mining activities: The case of Piedmont Region. Environ. Earth Sci. 2020, 79, 1–2. [Google Scholar] [CrossRef]
- (SNPA) Sistema Nazionale per la Protezione dell’Ambiente; Munafò, M. (Eds.) Rapporto Consumo di Suolo, Dinamiche Territoriali e Servizi Ecosistemici (Report on Land Take, Territorial Dynamics and Ecosystem Services); Report SNPA 08/19; 2019; ISBN ISBN 9788844809645. Available online: https://www.isprambiente.gov.it/it/sistema-nazionale-protezione-ambiente (accessed on 1 March 2021).
- Johnston, R. Arsenic and the 2030 Agenda for Sustainable Development. In Arsenic Research and Global Sustainability-Proceedings of the 6th International Congress on Arsenic in the Environment, AS 2016; 2016; pp. 12–14. ISBN 9781138029415. Available online: https://www.semanticscholar.org/paper/Arsenic-and-the-2030-Agenda-for-Sustainable-Johnston/ce835c47d4eb12b1764b61a83d0b16182e933c3b (accessed on 1 March 2021).
- Bennett, J.W.; Pearce, D.W.; Turner, R.K. Economics of Natural Resources and the Environment; Johns Hopkins University Press: Baltimore, MD, USA, 1990; Volume 378, pp. 227–228. [Google Scholar] [CrossRef]
- Grande, J.A.; Santisteban, M.; de la Torre, M.L.; Fortes, J.C.; de Miguel, E.; Curiel, J.; Dávila, J.M.; Biosca, B. The paradigm of Circular Mining in the world: The Iberian Pyrite Belt as a potential scenario of interaction. Environ. Earth Sci. 2018. [Google Scholar] [CrossRef]
- Rosa, J.C.S.; Sanchez, L.E. Revisiting the EIS of a Mining Project Using Ecosystem Services. IAIA13 Conf. Proc. 2013, 1–5. Available online: https://www.researchgate.net/publication/254258008_Revisiting_the_EIS_of_a_mining_project_using_ecosystem_services (accessed on 1 January 2022).
- Parlamento Italiano. Constitutional Law no.3/2001 “Modifica al Titolo V della Parte Seconda della Costituzione”; Gazzetta Ufficiale n. 248; Parlamento Italiano: Rome, Italy, 2001; Available online: https://www.gazzettaufficiale.it/eli/id/2001/10/24/001G0430/sg (accessed on 1 January 2022).
- Regional Law No. 23/2016 “Disciplina delle Attività Estrattive: Disposizione in Materia di Cave”. Regione Piemonte, Turin: 2016 Regione. Available online: piemonte.it/governo/bollettino/abbonati/2016/46/attach/l201623cave.pdf (accessed on 1 January 2022).
- Doley, D.; Audet, P. Adopting novel ecosystems as suitable rehabilitation alternatives for former mine sites. Ecol. Process. 2013, 2, 22. [Google Scholar] [CrossRef] [Green Version]
- Perrings, C.; Naeem, S.; Ahrestani, F.S.; Bunker, D.E.; Burkill, P.; Canziani, G.; Elmqvist, T.; Fuhrman, J.A.; Jaksic, F.M.; Kawabata, Z.; et al. Ecosystem services, targets, and indicators for the conservation and sustainable use of biodiversity. Front. Ecol. Environ. 2011, 9, 512–520. [Google Scholar] [CrossRef]
- D’Alpaos, C.; D’Alpaos, A. The Valuation of Ecosystem Services in the Venice Lagoon: A Multicriteria Approach. Sustainability 2021, 13, 9485. [Google Scholar] [CrossRef]
- Franks, D.M.; Brereton, D.; Moran, C.J. The cumulative dimensions of impact in resource regions. Resour. Policy 2013, 38, 640–647. [Google Scholar] [CrossRef]
- Lechner, A.M.; McIntyre, N.; Witt, K.; Raymond, C.M.; Arnold, S.; Scott, M.; Rifkin, W. Challenges of integrated modelling in mining regions to address social, environmental and economic impacts. Environ. Model. Softw. 2017, 93, 268–281. [Google Scholar] [CrossRef]
- Damigos, D.; Menegaki, M.; Kaliampakos, D.; Kazakidis, V. Rethinking impact assessment of mining projects in the context of ecosystem services. Int. Min. Congr. Turk. 2015, 24, 53–64. [Google Scholar]
- Anstee, S.; Bishop, J.; Olsen, N. Exploring Ecosystem Valuation to Move towards Net Positive Impact on Biodiversity in the Mining Sector. 2011, pp. 1–49. Available online: https://portals.iucn.org/library/sites/library/files/documents/2011-062.pdf (accessed on 1 January 2022).
- Li, F.; Liu, X.; Zhao, D.; Wang, B.; Jin, J.; Hu, D. Evaluating and modeling ecosystem service loss of coal mining: A case study of Mentougou district of Beijing, China. Ecol. Complex. 2011, 8, 139–143. [Google Scholar] [CrossRef]
- Larondelle, N.; Haase, D. Valuing post-mining landscapes using an ecosystem services approach—An example from Germany. Ecol. Indic. 2012, 18, 567–574. [Google Scholar] [CrossRef]
- King, H. Introducing an Ecosystem Approach to Quarry Restoration. In Natural Capital & Ecosystem Services; Final Report, 13 July 2013; Cranfield University: Cranfield, UK, 2013; pp. 1–78. Available online: https://dspace.lib.cranfield.ac.uk/handle/1826/8024 (accessed on 1 January 2022).
- Wang, J.; Zhao, F.; Yang, J.; Li, X. Mining site reclamation planning based on land suitability analysis and ecosystem services evaluation: A case study in Liaoning Province, China. Sustainability 2017, 9, 890. [Google Scholar] [CrossRef] [Green Version]
- Qian, D.; Yan, C.; Xiu, L.; Feng, K. The impact of mining changes on surrounding lands and ecosystem service value in the Southern Slope of Qilian Mountains. Ecol. Complex. 2018, 36, 138–148. [Google Scholar] [CrossRef]
- Wang, Z.; Lechner, A.M.; Baumgartl, T. Mapping cumulative impacts of mining on sediment retention ecosystem service in an Australian mining region. Int. J. Sustain. Dev. World Ecol. 2018, 25, 69–80. [Google Scholar] [CrossRef]
- Demirbugan, A. Changes in ecosystem service benefit in Soma lignite region of Turkey. Resour. Policy 2019, 64, 101522. [Google Scholar] [CrossRef]
- Wang, Z.; Lechner, A.M.; Yang, Y.; Baumgartl, T.; Wu, J. Mapping the cumulative impacts of long-term mining disturbance and progressive rehabilitation on ecosystem services. Sci. Total Environ. 2020, 717, 137214. [Google Scholar] [CrossRef]
- Li, J.; Liang, J.; Wu, Y.; Yin, S.; Yang, Z.; Hu, Z. Quantitative evaluation of ecological cumulative effect in mining area using a pixel-based time series model of ecosystem service value. Ecol. Indic. 2021, 120, 106873. [Google Scholar] [CrossRef]
- Kubiszewski, I.; Costanza, R.; Anderson, S.; Sutton, P. The future value of ecosystem services: Global scenarios and national implications. Ecosyst. Serv. 2017, 26, 289–301. [Google Scholar] [CrossRef]
- Millennium Ecosystem Assessment. Living Beyond Our Means: Natural Assets and Human Well-Being Statement from the Board. 2005. Available online: https://www.wri.org/research/millennium-ecosystem-assessment-living-beyond-our-means (accessed on 1 January 2022).
- TEEB (The Economics of Ecosystems & Biodiversity). Mainstreaming the Economics of Nature: A Synsthesis of the Approach, Conclusions and Recommendations of TEEB; UNEP, 2010; pp. 1–39. ISBN 9783981341034. Available online: http://teebweb.org/publications/teeb-for/synthesis/ (accessed on 1 January 2022).
- Elmqvist, T. The URBES Project. Factsheet 1; URBES, 2015; Available online: https://www.mistraurbanfutures.org/sites/mistraurbanfutures.org/files/urbesbrochurefinal.pdf (accessed on 1 January 2022).
- Haines-Young, R.; Potschin, M. Common International Classification of Ecosystem Services (CICES): Consultation on Version 4, August–December 2012; University of Nottingham, 2013; pp. 1–17. Available online: https://cices.eu/content/uploads/sites/8/2012/09/CICES-V4_Final_26092012.pdf (accessed on 1 January 2022).
- Caprioli, C.; Bottero, M.; Mondini, G. Urban Ecosystem Services: A Review of Definitions and Classifications for the Identification of Future Research Perspectives. In Computational Science and Its Applications; Springer: Cham, Switzerland, 2020; Volume 12253. [Google Scholar] [CrossRef]
- Rosa, J.C.S.; Sánchez, L.E.; Morrison-Saunders, A. Getting to ‘agreed’ post-mining land use–an ecosystem services approach. Impact Assess. Proj. Apprais. 2018, 36, 220–229. [Google Scholar] [CrossRef]
- Geneletti, D. Reasons and options for integrating ecosystem services in strategic environmental assessment of spatial planning. Int. J. Biodivers. Sci. Ecosyst. Serv. Manag. 2011, 7, 143–149. [Google Scholar] [CrossRef] [Green Version]
- Partidario, M.R.; Gomes, R.C. Ecosystem services inclusive strategic environmental assessment. Environ. Impact Assess. Rev. 2013, 40, 36–46. [Google Scholar] [CrossRef]
- Scolozzi, R.; Morri, E.; Santolini, R. Delphi-based change assessment in ecosystem service values to support strategic spatial planning in Italian landscapes. Ecol. Indic. 2012, 21, 134–144. [Google Scholar] [CrossRef]
- Gaglio, M.; Aschonitis, V.G.; Gissi, E.; Castaldelli, G.; Fano, E.A. Land use change effects on ecosystem services of river deltas and coastal wetlands: Case study in Volano–Mesola–Goro in Po river delta (Italy). Wetl. Ecol. Manag. 2017, 25, 67–86. [Google Scholar] [CrossRef]
- Scolozzi, R.; Schirpke, U.; Morri, E.; D’Amato, D.; Santolini, R. Ecosystem services-based SWOT analysis of protected areas for conservation strategies. J. Environ. Manag. 2014, 146, 543–551. [Google Scholar] [CrossRef]
- Palomo, I.; Martín-López, B.; López-Santiago, C.; Montes, C. Participatory scenario planning for protected areas management under the ecosystem services framework: The Doñana social-ecological system in Southwestern Spain. Ecol. Soc. 2011, 16, 33. [Google Scholar] [CrossRef] [Green Version]
- Compton, J.E.; Harrison, J.A.; Dennis, R.L.; Greaver, T.L.; Hill, B.H.; Jordan, S.J.; Walker, H.; Campbell, H.V. Ecosystem services altered by human changes in the nitrogen cycle: A new perspective for US decision making. Ecol. Lett. 2011, 14, 804–815. [Google Scholar] [CrossRef]
- Bherwani, H.; Nair, M.; Kapley, A.; Kumar, R. Valuation of Ecosystem Services and Environmental Damages: An Imperative Tool for Decision Making and Sustainability. Eur. J. Sustain. Dev. Res. 2020, 4, em0133. [Google Scholar] [CrossRef]
- Wang, Z.; Lechner, A.M.; Baumgartl, T. Ecosystem services mapping uncertainty assessment: A case study in the Fitzroy basin mining region. Water 2018, 10, 88. [Google Scholar] [CrossRef] [Green Version]
- Maes, J.; Egoh, B.; Willemen, L.; Liquete, C.; Vihervaara, P.; Schägner, J.P.; Grizzetti, B.; Drakou, E.G.; La Notte, A.; Zulian, G.; et al. Mapping ecosystem services for policy support and decision making in the European Union. Ecosyst. Serv. 2012, 1, 31–39. [Google Scholar] [CrossRef]
- Egoh, B.; Reyers, B.; Rouget, M.; Richardson, D.M.; Le Maitre, D.C.; van Jaarsveld, A.S. Mapping ecosystem services for planning and management. Agric. Ecosyst. Environ. 2008, 127, 135–140. [Google Scholar] [CrossRef]
- Sharp, R.; Tallis, H.T.; Ricketts, T.; Guerry, A.D.; Wood, S.A.; Chaplin-Kramer, R.; Nelson, E.; Ennaanay, D.; Wolny, S.; Olwero, N.; et al. InVEST User’s Guide. The Natural Capital Project, Stanford University, University of Minnesota, The Nature Conservancy, and World Wildlife Fund. 2014, pp. 1–307. Available online: https://invest-userguide.readthedocs.io/_/downloads/en/3.5.0/pdf/ (accessed on 1 January 2022).
- Villa, F.; Bagstad, K.J.; Voigt, B.; Johnson, G.W.; Portela, R.; Honzák, M.; Batker, D. A methodology for adaptable and robust ecosystem services assessment. PLoS ONE 2014, 9, e91001. [Google Scholar] [CrossRef]
- LIFE+ Making Good Natura. Available online: http://www.lifemgn-serviziecosistemici.eu/ (accessed on 1 January 2022).
- Simulsoil Web Page. Available online: http://www.sam4cp.eu/simulsoil/ (accessed on 1 January 2022).
- Mandle, L.; Tallis, H. Spatial ecosystem service analysis for Environmental Impact Assessment of projects. In Handbook on Biodiversity and Ecosystem Services in Impact Assessment; Edward Elgar Publishing: Cheltenham, UK, 2016; pp. 15–40. [Google Scholar]
- Caprioli, C.; Bottero, M.; Zanetta, E.; Mondini, G. Ecosystem services in land-use planning: An application for assessing transformation scenarios at the local scale. In NMP 2020, SIST 178; Bevilacqua, C., Al, E., Eds.; Springer Nature: Cham, Switzerland, 2021; pp. 1–10. [Google Scholar]
- Simulsoil User Guide. Available online: http://www.sam4cp.eu/wp-content/uploads/2018/06/SimulSoil_UserGuide-it.pdf (accessed on 1 January 2022).
- Hernández-Blanco, M.; Costanza, R.; Anderson, S.; Kubiszewski, I.; Sutton, P. Future scenarios for the value of ecosystem services in Latin America and the Caribbean to 2050. Curr. Res. Environ. Sustain. 2020, 2, 100008. [Google Scholar] [CrossRef]
- Raymond, C.M.; Bryan, B.A.; MacDonald, D.H.; Cast, A.; Strathearn, S.; Grandgirard, A.; Kalivas, T. Mapping community values for natural capital and ecosystem services. Ecol. Econ. 2009, 68, 1301–1315. [Google Scholar] [CrossRef]
- Foley, J.A.; DeFries, R.; Asner, G.P.; Barford, C.; Bonan, G.; Carpenter, S.R.; Chapin, F.S.; Coe, M.T.; Daily, G.C.; Gibbs, H.K.; et al. Global consequences of land use. Science 2005, 309, 570–574. [Google Scholar] [CrossRef] [Green Version]
- Dell’Ovo, M.; Dell’Anna, F.; Simonelli, R.; Sdino, L. Enhancing the Cultural Heritage through Adaptive Reuse. A Multicriteria Approach to Evaluate the Castello Visconteo in Cusago (Italy). Sustainability 2021, 13, 4440. [Google Scholar] [CrossRef]
- Caprioli, C.; Oppio, A.; Baldassarre, R.; Grassi, R.; Dell’Ovo, M. A Multidimensional Assessment of Ecosystem Services: From Grey to Green Infrastructure. In Lecture Notes in Computer Science (Including Subseries Lecture Notes in Artificial Intelligence and Lecture Notes in Bioinformatics); Springer: Berlin/Heidelberg, Germany, 2021; pp. 569–581. ISBN 9783030870065. [Google Scholar]
- Bottero, M.; Datola, G.; De Angelis, E. A System Dynamics Model and Analytic Network Process: An Integrated Approach to Investigate Urban Resilience. Land 2020, 9, 242. [Google Scholar] [CrossRef]
- Bottero, M.; D’Alpaos, C.; Oppio, A. Multicriteria evaluation of urban regeneration processes: An application of PROMETHEE method in northern Italy. Adv. Oper. Res. 2018, 2018, 9276075. [Google Scholar] [CrossRef]
- Dell’Anna, F.; Bottero, M.; Becchio, C.; Corgnati, S.P.; Mondini, G. Designing a decision support system to evaluate the environmental and extra-economic performances of a nearly zero-energy building. Smart Sustain. Built Environ. 2020, 9, 413–442. [Google Scholar] [CrossRef]


| Authors | Case Study | Issue | ES Typology | Valuation Objective | Description | Final Outputs | Tools and Methods |
|---|---|---|---|---|---|---|---|
| Olsen et al., 2011 [22] | Rio Tinto miles Ilmenite, southeast of Madagascar | Environment; Economy; Social. | Biodiversity Hydrological Services; Carbon storage and sequestration; Bioprospecting Ecotourism. | Quantifying and evaluating the change in ES resulting from intervention of forester conservation. | The focus has been on forest biodiversity and the economic benefit associated with carbon sequestration and the hydrogeological functions of forested watersheds. | Scheme of the distribution of the cost and benefits of the conservative interventions of forests. | Benefit transfer to estimate the economic value of the considered ES. |
| Li et al., 2011 [23] | Mentougou district of Beijing, China | Environment | Loss due to the coal solid wastes; Loss of water self-restraint value; Loss due to the coal mining sinks; Reclamation of the abandoned lands; Loss of the soil and water. | Evaluating the mined coal value and its loss of ES in economic terms. | This evaluation puts into relation the economic value of the mined coal with the ES losses. | Economic values of different ES losses. | Market Value Method to calculate the economic value of coal mining. Market Value Method and Opportunity-Cost Method for ES losses. |
| Larondelle, N. et al., 2012 [24] | The largest opencast lignite mining areas in Europe is located in the south of Leipzig (Germany) | Environment | Landscape; Food and fibre production; Water resources: freshwater provision; Climate regulation; Flood regulation; Primary production; Recreation; Biodiversity. | Scenario analysis of ES. | Map regional ES and identify future development, based on current planning documents. | Maps of ES provision for a range of ES for three different scenarios. Final spidergram to illustrate the providing of ES of the three different scenarios. | ArcGis |
| Sanchez and Rosa, 2013 [13] | Minas Gerais State, Belo Horizonte Brazil | Environment; Social. | Crops; Livestock; Aquaculture; Wild food; Timer production; Air quality; Erosion control; Pollination; Habitat; Ethical and spiritual values; Educational and inspirational values. | Enquiring the challenges of incorporating an ecosystem services approach (ESA) to environmental impact assessment (EIA). | The study compares the approach of traditional EIA to ESA. | Matrix to correlate the impact described in EIS with the ES. | Matrix impact |
| King H., 2013 [25] | Ripon city quarry, Yorkshire, England | Environment | Crop production; Flood control; Carbon sequestration; Biodiversity; Recreation; Life stock. | Assessing the types and scale of economic benefits associated with a proposed wetland restoration. Assessing the value of these services to the local community. | It is necessary to underline that the proposed post-extraction restoration will concern biodiversity and recreation. | Sum of the benefits of the different ES to the local community. | The value of these services to local communities was calculated using a benefit transfer approach which made use of Willingness to Pay (WTP). |
| Wang et al., 2017 [26] | Mining site in Liaoning Province, China | Environment | Product supply Water conservation Soil protection Carbon sequestration Oxygen release Air purification | Assessing the land suitability for three reclamation alternatives and identify sustainable land uses for each location. | A large mining site can be reclaimed to different land uses, providing a practical framework for integrating ES into mine reclamation. | Mapping the land suitability of forest, agricultural land and developed land. Mapping suitable post-mining land-use types. Evaluation of the ES in monetary terms. | ArcGIS; Total economic value of ES (TEV). |
| Qian et al., 2018 [27] | Qinghai-Tibet Plateau in the Southern Slope of Qilian Mountain, China | Environment | Food production; Raw material; Water supply; Gas regulation; Climate regulation; Environment cleaning; Water regulation; Soil formation and retention; Nutrient circulation; Biodiversity protection; Recreation and culture. | Estimate the surrounding ecosystem services value (ESV) changes by considering spatial adjacency effects. Monitor the changes in mining extent and the surrounding land cover from 1975 to 2016. | Compare the mining benefit and ESV loss associated with the development of mining areas with trade-offs. | Quantification of mining area changes in the six regions from 1975 to 2016. Mapping and spatial visualization of different land use and mining areas from 1975 to 2016. | Total Economic value (TEV); Trade-off analysis. |
| Wang et al., 2018 [28] | Australian mining region. Isaac River and Mackenzie River drainage sub-catchments are located in Queensland, Australia. | Environment; Society; Economy. | Biodiversity; Water quality; Erosion; Sediment transition; Sediment retention. | Quantify regional-scale cumulative impact of mining on sediment retention ES. | Sediment delivery ratio model of integrated valuation of ES. Trade-offs to calculate and map the sediment retention. The associated land-use change has significantly affected the regional ecosystem and biodiversity. | Two impact indices to quantify the cumulative impact. Sediment retention index. Mapping of sediment retention and sediment export. | ArcGis and SDR model of the InVEST software |
| Demirbugan, A., 2019 [29] | Soma lignite Region, in Turkey | Environment; Society. | Timber value; Carbon sequestration; Soil erosion control; Watershed protection. | The net benefits of ES and change profile emerged in the historical process is examined in the Soma coal region located in the western part of Turkey. | Analysis of different effects of ES in different time frames and on different ES. This study also focuses the attention on the social benefits determined by the ecosystem change. | Mapping of the different mining activities in different years. Changes in economic terms of the different plantation rate. | Landsat; Total Economic value (TEV). |
| Wang et al., 2020 [30] | Curragh mine which is one of the largest open-cut coal mine in Australia (Figure 1). It is located in the Bowen Basin which is the largest coal basin in Australia and a catchment adjacent to the Great Barrier Reef World Heritage Marine Park | Environment | Carbon sequestration; Air quality regulation; Soil conservation; Water yield. | Assessing the cumulative impact of mining disturbance and rehabilitation on ES through mapping and quantifying changes at multiple spatial and temporal scales. | It also assesses and evaluates the synergies and the trade-offs of the considered ES with Spearman’s correlation coefficient for different classes and scale. | Landscape changes from disturbance and rehabilitation were mapped using LandTrendr and the spatial patterns of those changes. | LandTrendr algorithm to detect the disturbance and the recovery in the mining with Landsat |
| Li et al., 2021 [31] | Yanzhou coalfield, located in Jining city, Shandong Province, China | Environment; Cultural. | Food production; Raw material production; Gas regulation; Climate regulation; Hydrogeological regulation; Waste disposal; Maintaining soil; Biodiversity; Landscape. | Identifying the ecological cumulative effect in a mining area and its spatial distribution, heterogeneity, and dynamic process. | It could display the spatial and temporal changes of ESV. | Mapping the spatial distribution of the ESV at four different timings. | Pixel-bases time series model of ecosystem services value (ESV). |
| Municipality | Lithotype | Group | Expansion | Surface |
|---|---|---|---|---|
| Rivalta di Torino | alluvial material | aggregate | yes | 30,363 m2 |
| Vico Canavese | diorite | ornamental | yes | 7307 m2 |
| Vidracco | olivine | industrial | yes | 35,071 m2 |
| BAU Scenario: 10% Expansion of the Quarries Surface | |||||||||||||||
|---|---|---|---|---|---|---|---|---|---|---|---|---|---|---|---|
| ES | Biophisical Values | ES | Economic Values | ||||||||||||
| Rivalta di Torino | Vico Canavese | Vidracco | Rivalta di Torino | Vico Canavese | Vidracco | ||||||||||
| Code * | u.m. | BAU-10% | T1—10% | BAU-10% | T1—10% | BAU-10% | T1—10% | Code * | u.m. | BAU-10% | T1—10% | BAU-10% | T1—10% | BAU-10% | T1—10% |
| CS | ton | 19.8 | 0.07 | 21.7 | 0.02 | 21.1 | 0.09 | CS | EUR | 1982.3 | 7.37 | 2173.2 | 1.83 | 2114.0 | 8.5 |
| CPO | 0-1 | 0.0 | 0.0 | 0.0 | 0.0 | 0.0 | 0.0 | CPO | EUR | 2.5 | 0.0 | 0.0 | 0.0 | 0.0 | 0.0 |
| HQ | 0-1 | 0.02 | 0.0 | 0.08 | 0.0 | 0.02 | 0.0 | HQ | EUR | 1208.5 | 0.00 | 1093.7 | 0.0 | 1485.5 | 0.0 |
| NR | ton | 0.0 | 0.0 | 0.0 | 0.0 | 0.0 | 0.0 | NR | EUR | 0.0 | 0.0 | 0.0 | 0.0 | 0.0 | 0.0 |
| SDR | ton | 93.9 | 81.1 | 102.8 | 88.2 | 791.1 | 714.1 | SDR | EUR | 14,089.6 | 12,166.4 | 15,411.9 | 13,231.4 | 118,668.2 | 107,107.2 |
| WY | l | 90.1 | 77.6 | 124.2 | 77.3 | 88.6 | 77.5 | WY | EUR | 1.1 | 1.0 | 1.6 | 1.0 | 1.1 | 1.0 |
| CPR | EUR | 42.6 | 0.0 | 0.0 | 0.0 | 0.0 | 0.0 | CPR | EUR | 42.6 | 0.0 | 0.0 | 0.0 | 0.0 | 0.0 |
| TP | EUR | 46.2 | 0.0 | 275.8 | 0.0 | 227.4 | 0.0 | TP | EUR | 46.2 | 0.0 | 275.8 | 0.0 | 227.4 | 0.0 |
| Total | 17,372.8 | 12,174.79 | 18,956.2 | 13,234.25 | 122,496.2 | 107,116.71 | |||||||||
| BAU Scenario: 20% Expansion of the Quarries Surface | |||||||||||||||
|---|---|---|---|---|---|---|---|---|---|---|---|---|---|---|---|
| ES | Biophisical Values | ES | Economic Values | ||||||||||||
| Rivalta di Torino | Vico Canavese | Vidracco | Rivalta di Torino | Vico Canavese | Vidracco | ||||||||||
| Code * | u.m. | BAU-20% | T2—20% | BAU-20% | T2—20% | BAU-20% | T2—20% | Code * | u.m. | BAU-20% | T2—20% | BAU-20% | T2—20% | BAU-20% | T2—20% |
| CS | ton | 37.3 | 0.08 | 26.1 | 0.02 | 41.3 | 0.09 | CS | EUR | 3728.2 | 8.1 | 2608.4 | 1.9 | 4126.9 | 9.4 |
| CPO | 0-1 | 0.0 | 0.0 | 0.0 | 0.0 | 0.0 | 0.0 | CPO | EUR | 5.0 | 0.0 | 0.0 | 0.0 | 0.0 | 0.0 |
| HQ | 0-1 | 0.03 | 0.0 | 0.1 | 0.0 | 0.05 | 0.0 | HQ | EUR | 2032.2 | 0.0 | 1327.9 | 0.0 | 3336.9 | 0.0 |
| NR | ton | 0.0 | 0.0 | 0.0 | 0.0 | 0.0 | 0.0 | NR | EUR | 0.0 | 0.0 | 0.0 | 0.0 | 0.0 | 0.0 |
| SDR | ton | 99.7 | 79.1 | 103.2 | 98.3 | 874.1 | 828.0 | SDR | EUR | 14,961.4 | 11,859.4 | 15,476.1 | 14,745.6 | 131,113.9 | 124,197.3 |
| WY | l | 100.6 | 77.4 | 129.8 | 77.6 | 93.5 | 77.5 | WY | EUR | 1.3 | 1.00 | 1.6 | 1.0 | 1.2 | 1.0 |
| CPR | EUR | 87.9 | 0.0 | 0.0 | 0.0 | 0.0 | 0.0 | CPR | EUR | 87.9 | 0.0 | 0.0 | 0.0 | 0.0 | 0.0 |
| TP | EUR | 45.8 | 0.0 | 342.0 | 0.0 | 602.1 | 0.0 | TP | EUR | 45.8 | 0.0 | 342.0 | 0.0 | 602.1 | 0.0 |
| Total | 20,861.8 | 11,868.54 | 18,428.1 | 14,748.5 | 139,180.9 | 124,207.7 | |||||||||
| BAU Scenario: 50% Expansion of the Quarries Surface | |||||||||||||||
|---|---|---|---|---|---|---|---|---|---|---|---|---|---|---|---|
| ES | Biophisical Values | ES | Economic Values | ||||||||||||
| Rivalta di Torino | Vico Canavese | Vidracco | Rivalta di Torino | Vico Canavese | Vidracco | ||||||||||
| Code * | u.m. | BAU-50% | T3—50% | BAU-50% | T3—50% | BAU-50% | T3—50% | Code * | u.m. | BAU-50% | T3—50% | BAU-50% | T3—50% | BAU-50% | T3—50% |
| CS | ton | 85.9 | 0.1 | 66.4 | 0.02 | 123.5 | 0.1 | CS | EUR | 8585.5 | 10.0 | 6638.9 | 2.5 | 12,344.9 | 11.7 |
| CPO | 0-1 | 0.0 | 0.0 | 0.0 | 0.00 | 0.0 | 0.0 | CPO | EUR | 17.8 | 0.0 | 0.0 | 0.0 | 0.0 | 0.0 |
| HQ | 0-1 | 0.1 | 0.0 | 0.2 | 0.00 | 0.1 | 0.0 | HQ | EUR | 5236.5 | 0.0 | 3560.5 | 0.0 | 11,003.1 | 0.0 |
| NR | ton | 0.0 | 0.0 | 0.0 | 0.00 | 0.0 | 0.0 | NR | EUR | 0.0 | 0.0 | 0.0 | 0.0 | 0.0 | 0.0 |
| SDR | ton | 150.1 | 102.0 | 109.8 | 105.9 | 970.9 | 982.1 | SDR | EUR | 22,515.1 | 15,302.2 | 16,469.8 | 15,877.4 | 145,635.4 | 147,309.9 |
| WY | l | 119.3 | 77.6 | 167.9 | 77.56 | 108.8 | 77.5 | WY | EUR | 1.5 | 1.0 | 2.1 | 1.0 | 1.4 | 1.0 |
| CPR | EUR | 319.8 | 0.0 | 0.0 | 0.0 | 0.0 | 0.0 | CPR | EUR | 319.8 | 0.0 | 0.0 | 0.0 | 0.0 | 0.0 |
| TP | EUR | 238.6 | 0.0 | 1083.3 | 0.0 | 2256.0 | 0.0 | TP | EUR | 45.8 | 0.0 | 342.0 | 0.0 | 602.1 | 0.0 |
| Total | 36,914.7 | 15,313.1 | 27,754.7 | 15,880.8 | 160,237.7 | 147,322.5 | |||||||||
Publisher’s Note: MDPI stays neutral with regard to jurisdictional claims in published maps and institutional affiliations. |
© 2022 by the authors. Licensee MDPI, Basel, Switzerland. This article is an open access article distributed under the terms and conditions of the Creative Commons Attribution (CC BY) license (https://creativecommons.org/licenses/by/4.0/).
Share and Cite
Assumma, V.; Bottero, M.; Caprioli, C.; Datola, G.; Mondini, G. Evaluation of Ecosystem Services in Mining Basins: An Application in the Piedmont Region (Italy). Sustainability 2022, 14, 872. https://0-doi-org.brum.beds.ac.uk/10.3390/su14020872
Assumma V, Bottero M, Caprioli C, Datola G, Mondini G. Evaluation of Ecosystem Services in Mining Basins: An Application in the Piedmont Region (Italy). Sustainability. 2022; 14(2):872. https://0-doi-org.brum.beds.ac.uk/10.3390/su14020872
Chicago/Turabian StyleAssumma, Vanessa, Marta Bottero, Caterina Caprioli, Giulia Datola, and Giulio Mondini. 2022. "Evaluation of Ecosystem Services in Mining Basins: An Application in the Piedmont Region (Italy)" Sustainability 14, no. 2: 872. https://0-doi-org.brum.beds.ac.uk/10.3390/su14020872