Article

Public and Private Economic Feasibility of Green Areas as a Passive Energy Measure: A Case Study in the Mediterranean City of Trapani in Southern Italy

1
Department of Architecture, University of Palermo, 90128 Palermo, Italy
2
Department of Engineer, University of Palermo, 90128 Palermo, Italy
*
Author to whom correspondence should be addressed.
Sustainability 2022, 14(4), 2407; https://0-doi-org.brum.beds.ac.uk/10.3390/su14042407
Submission received: 5 January 2022 / Revised: 11 February 2022 / Accepted: 17 February 2022 / Published: 19 February 2022

Abstract

:
Green infrastructure in urban environments provides a wide range of ecological, social, aesthetic, and health co-benefits. Urban plant covers in particular contribute to improved outdoor environmental conditions that, in turn, influence the energy behavior of buildings and their indoor thermo-hygrometric comfort performance. Within this context, this study illustrates a methodology aimed at verifying the economic feasibility of alternative types of green areas for public and private stakeholders, which are analyzed as passive energy measures. Therefore, our methodology integrates approaches from different disciplines and consists of a microclimatic analysis of different vegetation scenarios and of the outdoor comfort level, an evaluation of the energy needs of a sample of houses, and an economic feasibility estimation considering different scenarios and public and private investors. The methodology is illustrated through its application to a suburban district of the Sicilian city of Trapani in the South of Italy, considered representative of Mediterranean climate conditions. Results showed significant differences between the scenario outcomes depending on the type of vegetation used in the green areas and put in evidence how economic feasibility for some stakeholders may be achieved in the management phase if adequate incentives equal to the planting cost are assumed.

1. Introduction

Defining and evaluating the co-benefits that green infrastructure generates in urban contexts is a very complex issue that can be analyzed from multiple perspectives [1]. Several studies have focused on the ability of urban trees to mitigate CO2 emissions by incorporating carbon into their biomass [2] and on the subsequent possibility of using urban tree plantations within carbon credit markets [3]. In addition, trees can also produce monetary benefits owing to their ability to provide shade [4] and, consequently, to achieve energy savings by cooling buildings [5]. At the urban level, the benefits of such shading are manifold, including increased thermal comfort in summer and reduced impact of hot temperatures at the pedestrian level [6]. Previous studies have focused on demonstrating the benefits derived from the use of vegetation as a passive strategy for mitigating microclimate changes and the effects of urban heat islands (UHIs) [7,8]. All these benefits may be estimated through the application of a replacement cost approach (using the costs of parasols), demonstrating that trees are also a worthwhile long-term investment in terms of microclimate control [9].
The various ecological, social, aesthetic, health, and comfort benefits that urban tree cover provides to city residents are also implicitly captured in housing prices. In order to estimate the appreciation of urban vegetation in residential areas, the hedonic price method has been applied to several studies in various cities. Some studies used the hedonic price model to assess the impact trees cover on dwelling price [10,11] or residential land [12]; others analyzed the residential housing market to test how marginal willingness to pay (MWTP) differs by proximity to parks and green areas [13]. In addition, there is a green premium in house prices directly related to energy consumption (kWh) and carbon dioxide (CO2) emissions, which may also depend on the presence of vegetation and urban trees near the house [14].
It is worth noting that the growing social appreciation of the benefits of urban vegetation has generated increasing concern that these benefits are not equally distributed among citizens and are becoming a new form of environmental injustice [15,16]. Green areas are an important component of urban quality, and despite being a right for all citizens, they are often completely absent in peripheral and degraded neighborhoods.
Paraphrasing “The right to the city” by Lefebvre and Harvey [17,18], “the right to green areas” is interconnected with environmental sustainability, urban climate, and microclimate, as well as with the technological characteristics and energy performance of buildings. Promoting strategies and actions aimed at making buildings—and hence urban environments—more sustainable both in private [19] and tertiary sectors [20] is a pillar of the European Union long-term vision for a climate-neutral economy [21], and the building sector is among those capable of causing the most impact. The building sector is responsible for 36% of energy use worldwide, corresponding to 39% of total energy-related CO2 emissions [22,23], whereas at the European level, it accounts for between 25% and 40% of total energy consumption, resulting in about 35% of overall CO2 emissions throughout Europe [24]. Regarding the Italian context in particular the figures stand at about 40% and 17.5% for energy consumption and CO2 emissions, respectively. [25,26]. The EU has funded several programs to pilot energy-efficiency measures for buildings and districts, such as the My Smart City District group programs, and launched the European Green Deal in 2019, generating new challenges to draft sustainability protocols [27] but also to assess the economic feasibility of actions that reduce environmental impact in urban contexts and to propose innovative types of financing for such actions [28,29].
Within this context, urban green surfaces represent an important solution for dealing with rising overheating in urban areas, as they can limit the effects of UHIs and heatwaves related to the increasing frequency of extreme weather events, primarily due to climate change [30]. All typologies of “green surfaces” (green roofs, green walls, gardens, and parks), in addition to bringing visual and aesthetic advantages to the urban landscape, also contribute to improved outdoor environmental conditions, which, in turn, affect the energy behavior of buildings and their indoor thermo-hygrometric comfort [31,32]. That is why assessing the effectiveness of these types of passive energy measures to reduce environmental impacts in urban contexts [33] has become a matter of interest in literature, although their economic feasibility remains a relative shortcoming [34], which is the subject of the present paper.
Economic and financial feasibility analysis of active energy-efficiency measures at building, district and city scales has been widely applied to the evaluation of energy retrofit projects for nearly zero-energy buildings (NZEBs) and to various types of existing buildings [35,36], even in the presence of public incentives [37,38], as well as for the definition of the best urban energy scenarios [39], also supporting public decisions with multicriteria models [40,41]. Other issues related to economic feasibility arise when public and private actors are involved in the decision to implement green areas. The choice of stakeholders for different types of gardens should be based not only on recreational, aesthetic, ecological and wellness purposes but also on the correct evaluation of green areas as a passive energy measure and on the economic benefits that can be derived from their implementation.
This paper proposes the application of an integrated methodology aimed at verifying the economic feasibility of alternative types of green areas for public and private stakeholders, which are analyzed as passive energy measures. To achieve this goal, the proposed methodology integrates economic feasibility assessment with microclimate, outdoor comfort analyses and evaluation of energy consumption for air conditioning. This methodology allows us to: (i) evaluate to what extent different types of vegetation are an effective passive energy measure; (ii) verify the conditions of economic feasibility for all public and private parties involved; and (iii) measure any incentives necessary to ensure the implementation of the project.
The methodology was applied to a case study selected according to climatic, urban and social contexts. Concerning the climatic context, a Mediterranean coastal city (Trapani, Sicily, southern Italy) was chosen as a representative example of many other cities characterized by mild winters and hot summer months. Current literature is limited in terms of balanced geographic distribution. A review by Roy et al. [1], found that 64% of research has been concentrated in North America, and there are very few studies applied to mid-latitude cities [2,42,43]. Because the benefits and costs of urban trees vary across cities and climates, this study may help address the lack of research in Mediterranean areas and reflect local environmental and economic conditions, as well as the attitudes of residents and local authorities toward planting and managing green areas.
Regarding the urban and social context, a suburban and degraded area where low-income families live and where the provision of green areas should be a duty of the municipality in order to mitigate social inequalities was considered for the analyses.
In addition, the proposed approach analyzes the entire process of analysis, up to the verification of the conditions of financial sustainability of all stakeholders, both public and private, and differs from other literature research in several respects. Some scholars have deepened the analysis of only particular types of benefits, whereas others have analyzed several costs and benefits but from a different point of view.
McHale et al. [3] studied the benefit of CO2 emission reduction due to the action of assimilation, decomposition and maintenance of trees and evaluated all the benefits of tree planting, including energy savings, through the monetary value of saved CO2. In Castro Neto’s research [2], monetary value was only associated with carbon storage by the most represented urban trees in the city of Lisbon, and carbon sequestration was not measured, nor was the contribution of herbaceous and shrub vegetation in urban green areas considered. Soraes et al. [43] evaluated many types of costs and benefits produced by urban trees in Lisbon and applied i-Tree STRATUM software to evaluate the return on investment in tree management. This research only considered trees on public streets, and there was no reference to the role of incentives or other financial instruments to support private investors. In addition, there was a severe limitation in the application of i-Tree STRATUM due to the absence of data on the predominant tree species in Lisbon and in other climate zones throughout Europe. A study by Kunsch and Parks [44] provided a cost-benefit analysis of a tree-planting scenario in a district of the city of Los Angeles using US Forest Service software. The value of trees was estimated as the sum of several benefits, including energy savings, and several costs were used for different tree species and locations, distinguishing between “street trees” located on public streets and “yard trees” located in private areas. However, this was an overall assessment of costs and benefits and was not broken down by type of investor.
To fill this gap, our study aims to analyze a case where the ownership of land and buildings is a mix of public and private. Since the implementation of a green-area project depends not only on public but also private decisions, our study focuses on the conditions that can convince a private stakeholder to participate, considering only the monetary benefits obtained as a passive energy measure. The study aims to go beyond the aggregate assessment of project costs and revenues and to define separate budgets for each category of stakeholders, both public and private, the latter including both homeowners and tenants. In fact, a public stakeholder usually makes decisions based on all the economic benefits produced by green areas, such as carbon sequestration, habitat provision, air quality, UHI mitigation, etc., or according to the goals of removing the inequitable distribution of ecosystem services in low-income neighborhoods. In contrast, the decision of private individuals to invest in a green-space project is based more on tangible monetary benefits, such as electricity bill savings or availability of public incentives.
From a purely financial point of view, the results differ with respect to public and private actors. The former must add to the public budget the costs of implementation and management of green areas, along with other charges for the supply of public goods and services and to increase social welfare; for the latter, the implementation of green areas would be affordable if public incentives are granted.
This paper is organized as follows. The next section provides a description of the case study and the different green-area scenarios. Section 3 describes the methodological approach that integrates microclimate and outdoor comfort analysis with energy consumption evaluation and economic feasibility assessment. Section 4 shows the results. Finally, some critical issues are reported in Discussion, leading to the concluding remarks of the study and to some considerations for possible further research developments.

2. A Mediterranean City as a Case Study

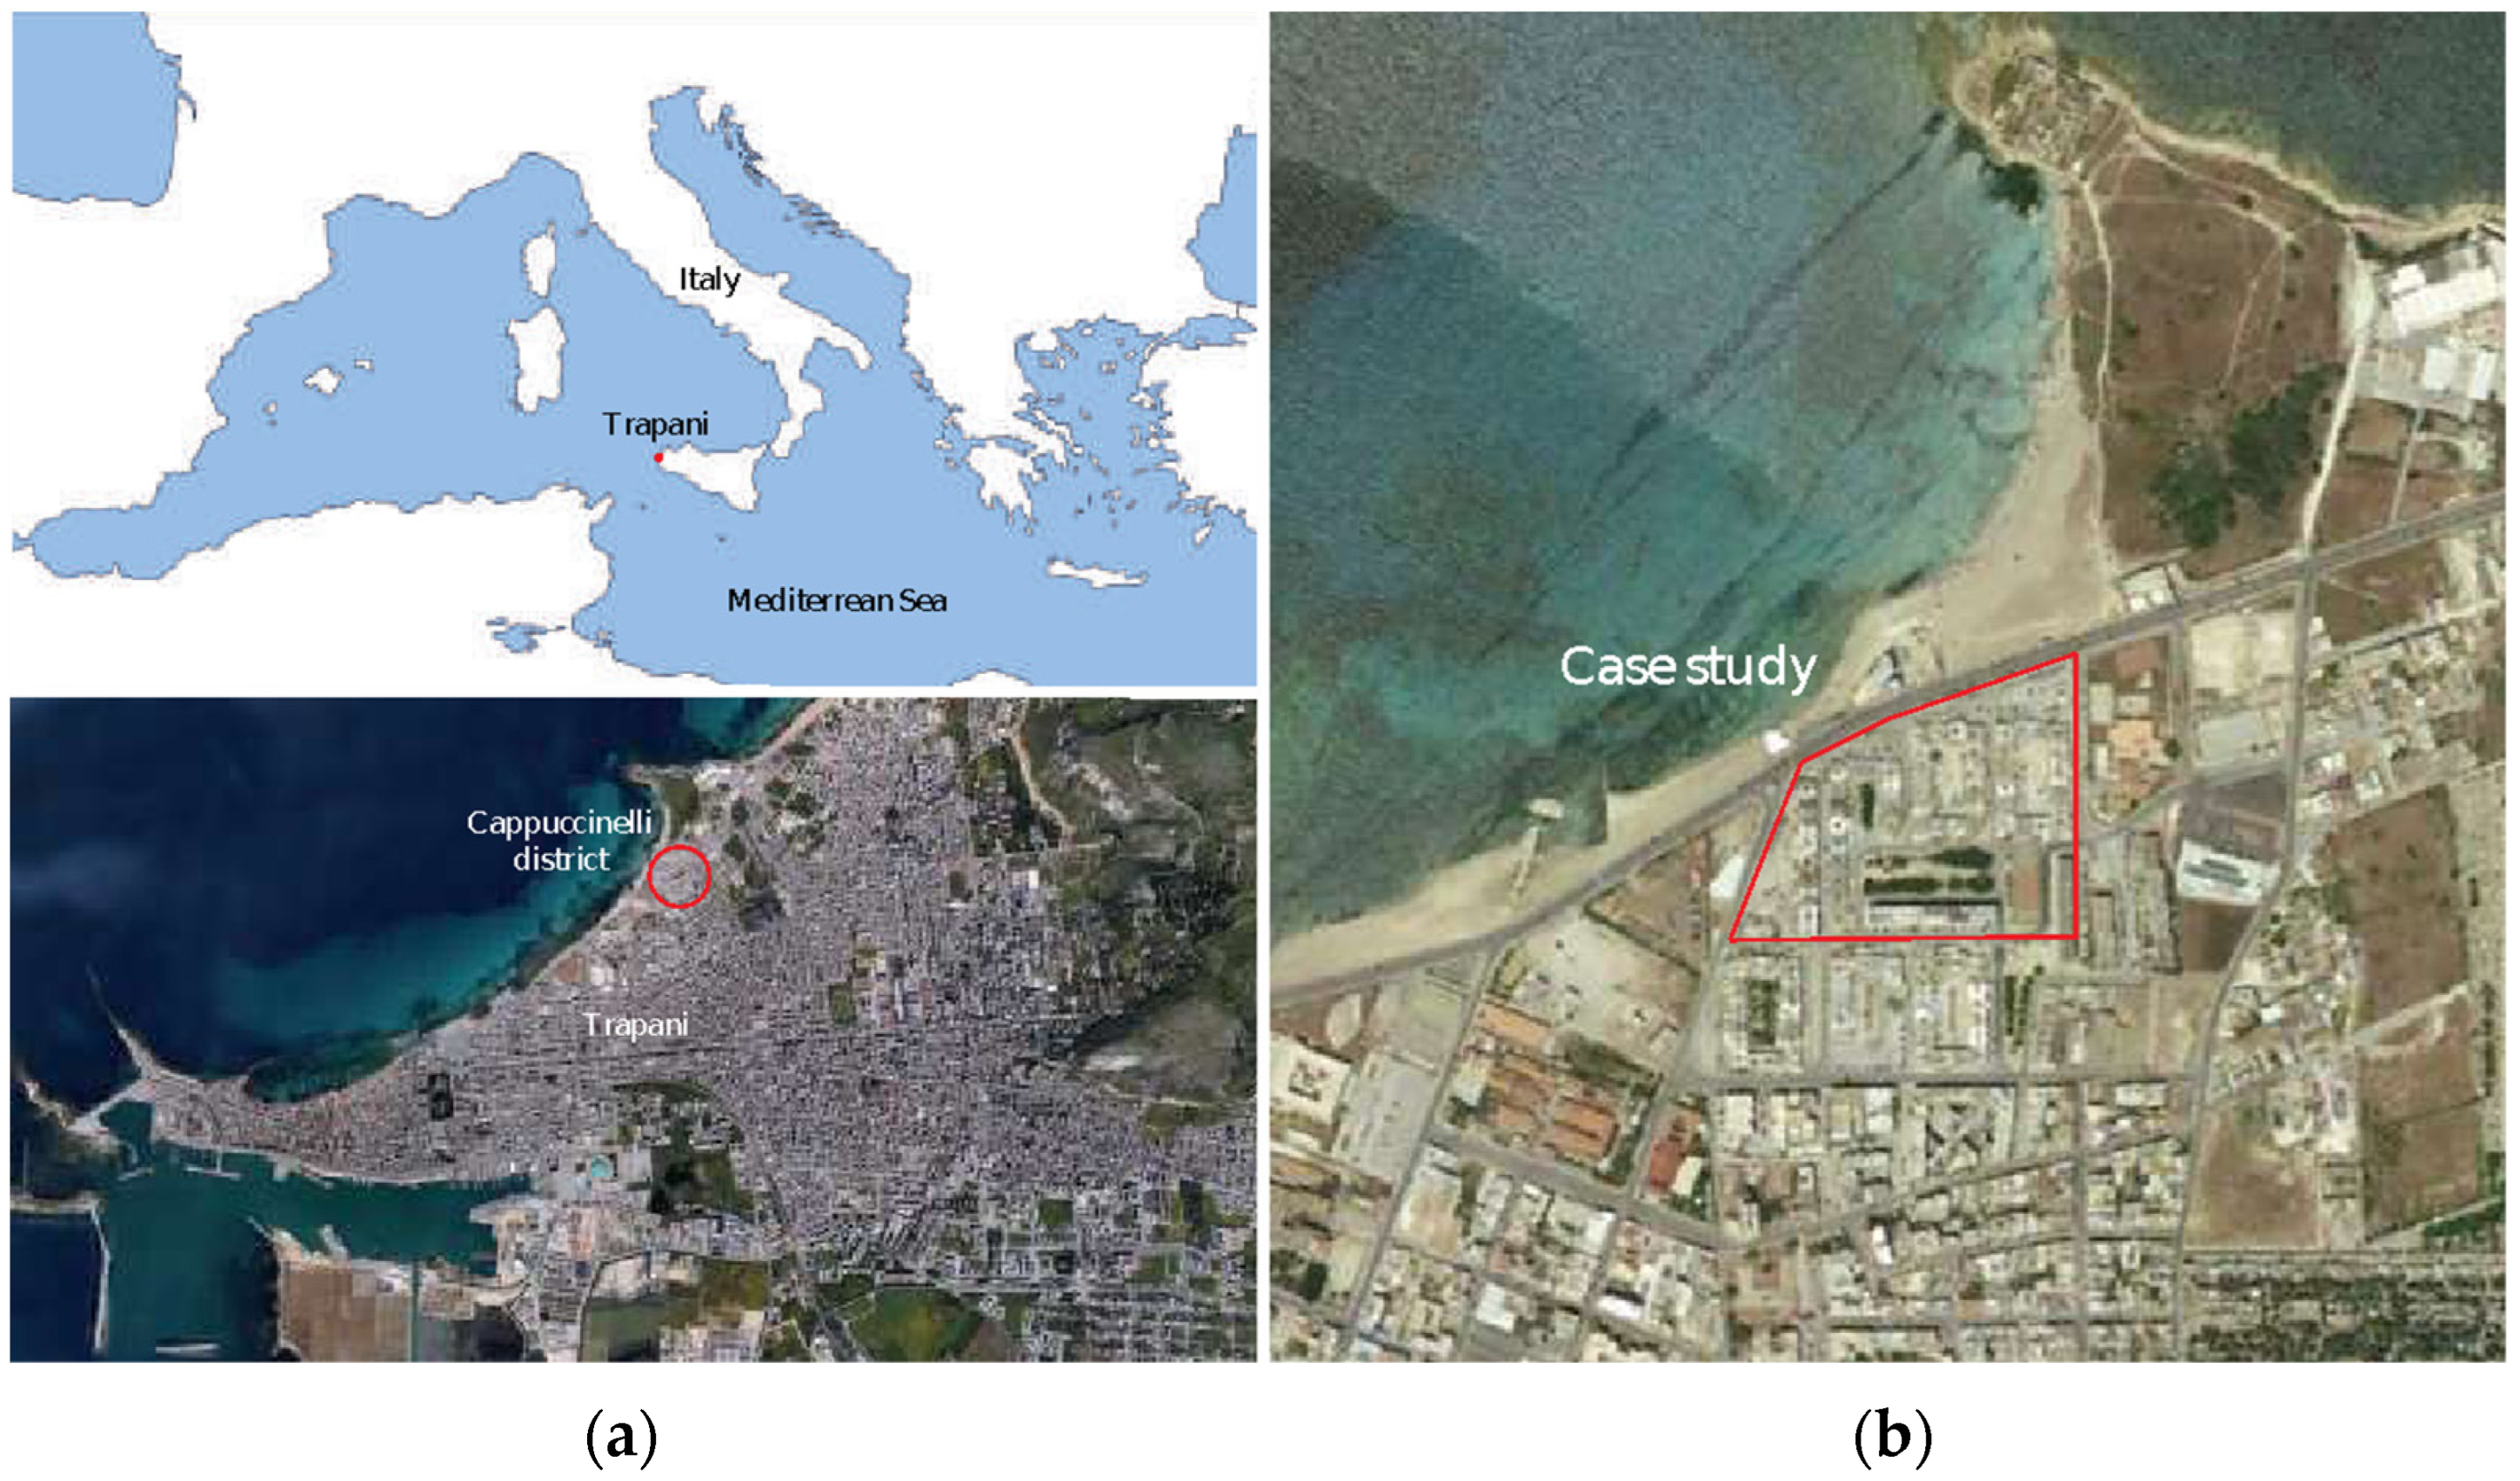
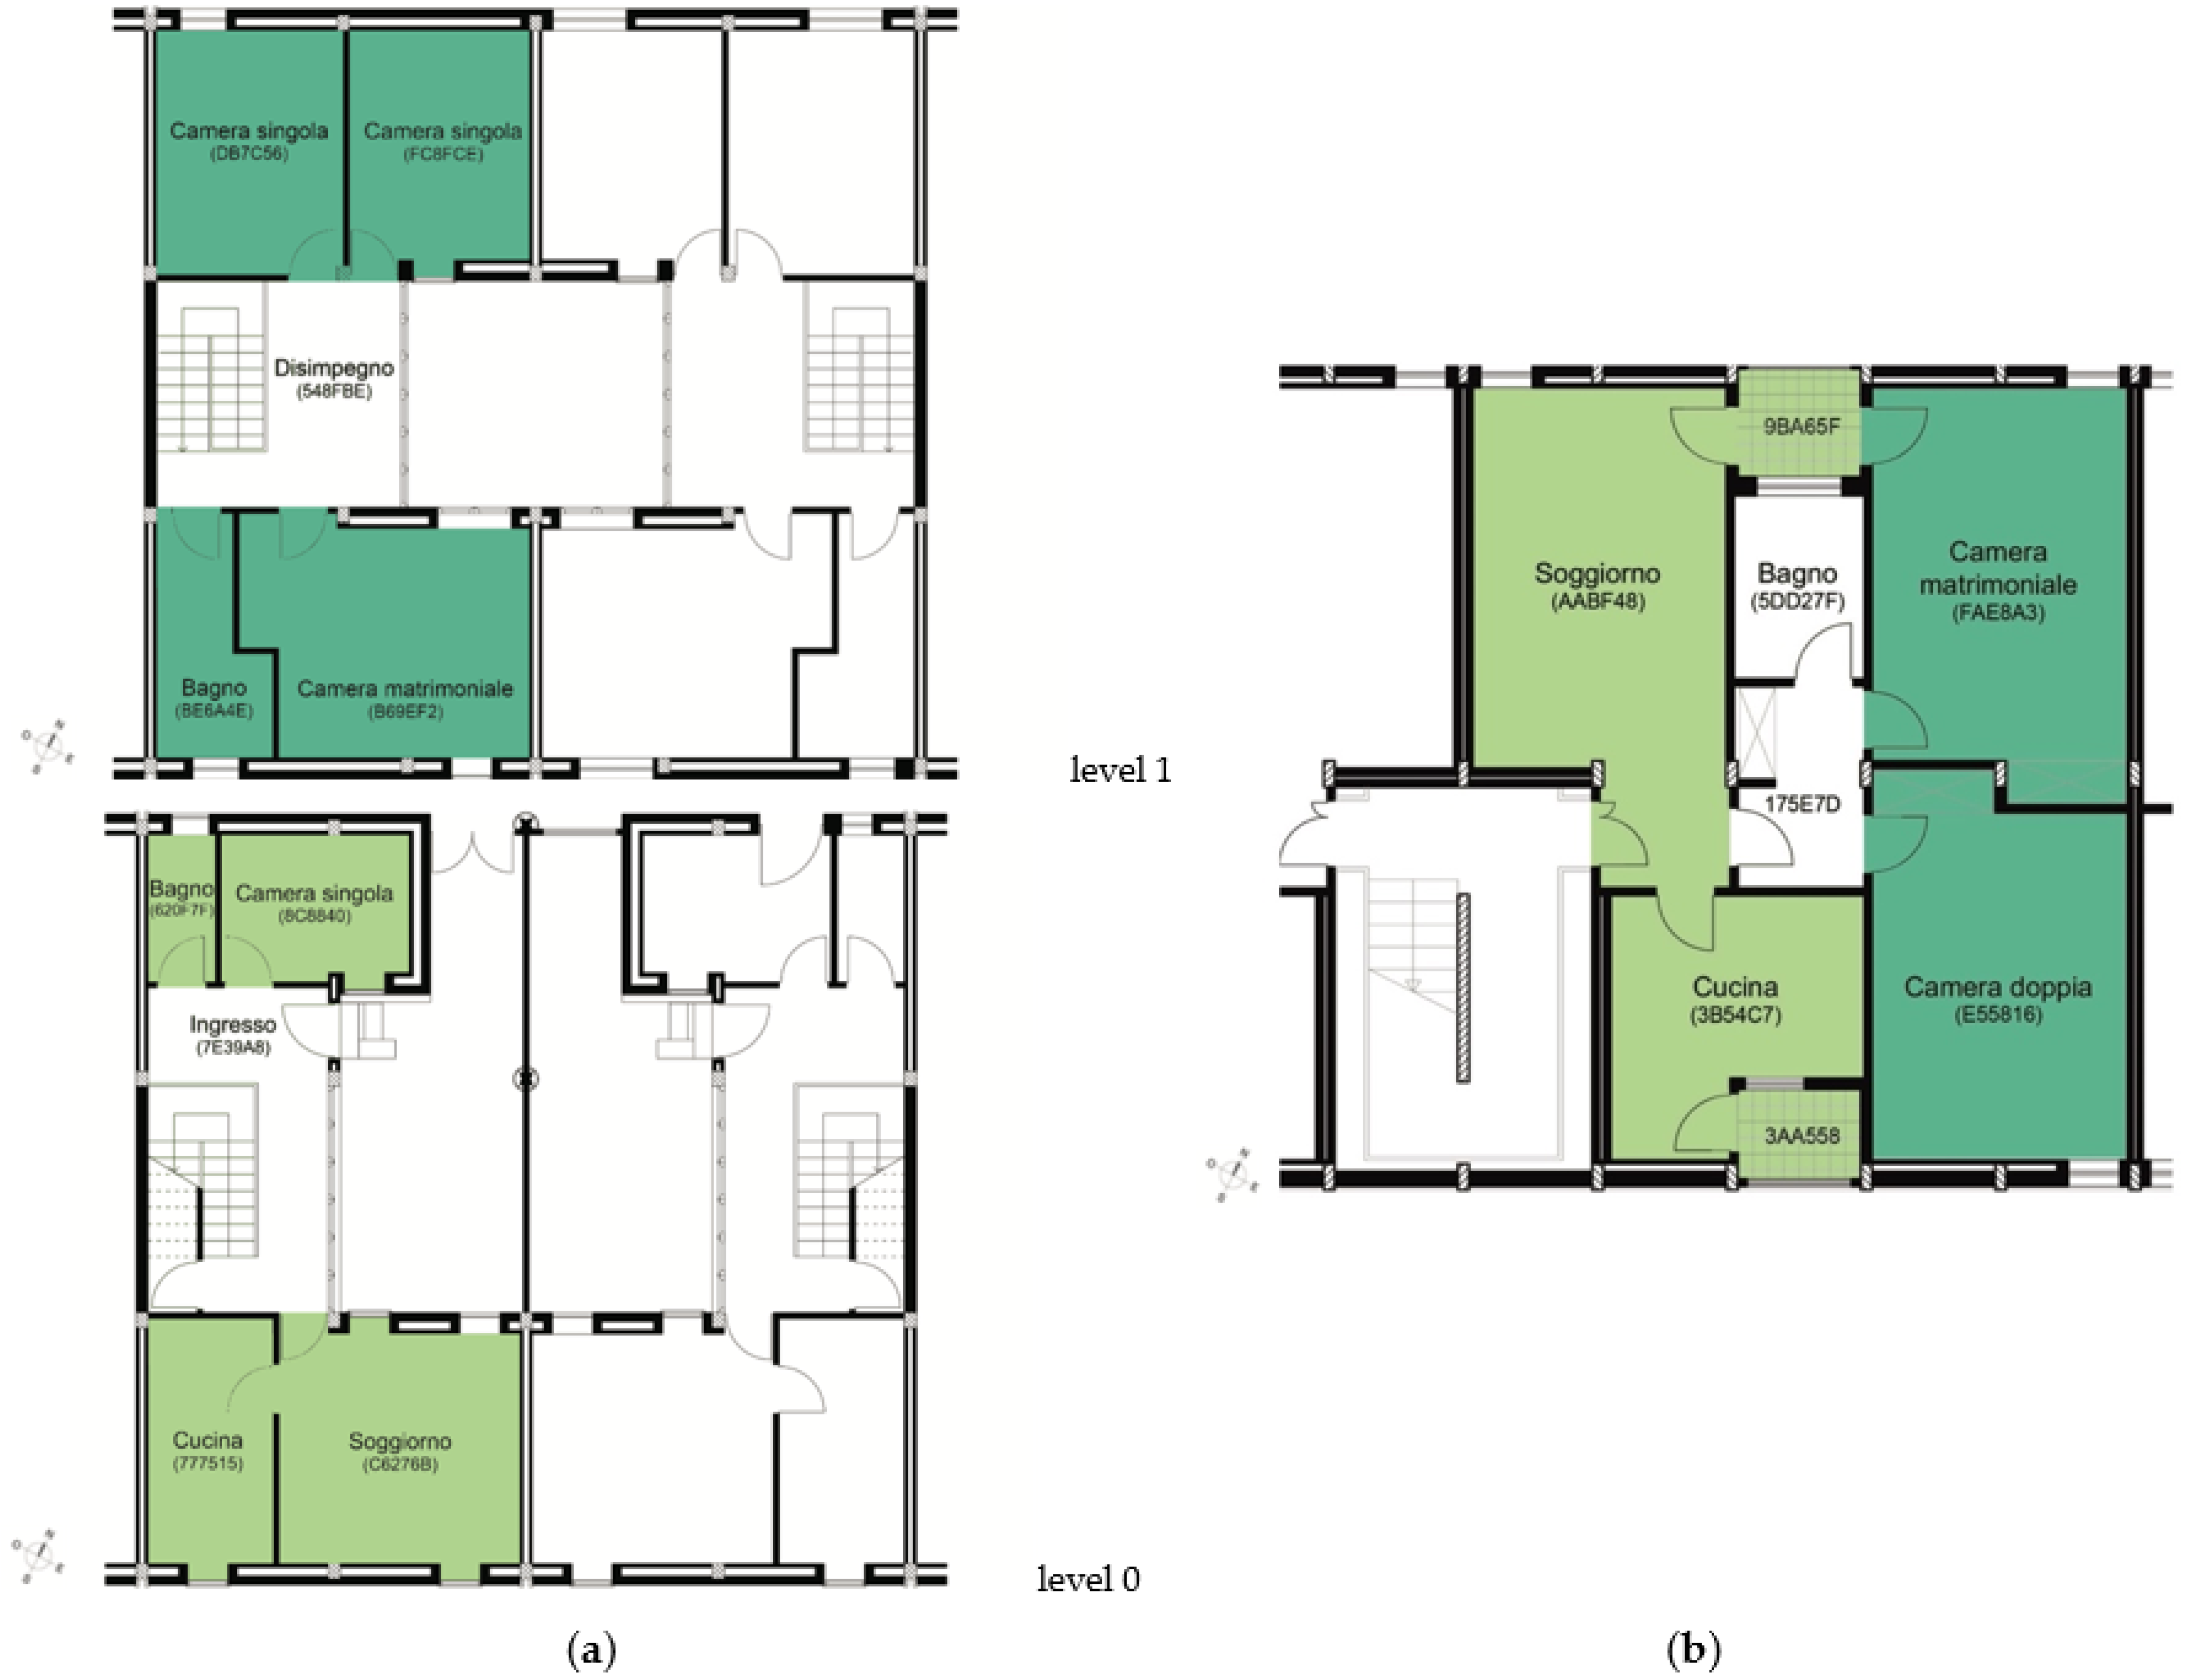
2.1. The Case Study: Cappuccinelli District in Trapani (Italy)

Our case study considered the Cappuccinelli district of Trapani in the south of Italy. Trapani is a provincial capital, with a population of 65,378 [45], located at the western end of the island of Sicily, in the center of the Mediterranean Basin (Figure 1a). Trapani was chosen as a representative example of the climatic conditions of many Mediterranean cities characterized by mild winters and hot summers (Koppen Climate Classification: Csa). Cappuccinelli in particular is a district where there are extreme conditions of social, urban and building degradation and where urban redevelopment and building energy retrofits are needed. Currently, the housing tenure is a mixture of public and private, which allows the study of how the economic feasibility of green areas differs with respect to the interests of all actors involved.
Cappuccinelli was built in the 1960s as a public housing district for very low-income families and was owned by the “Istituto Autonomo Case Popolari” (IACP), which is a public agency whose mission is to build and manage affordable rental housing. In total, there are 268 housing units and 13 warehouses in the Cappuccinelli district. In recent decades, because of national policies to divest from public housing stock, the IACP sold many housing units to families who lived in them at a subsidized price set by law, leading to a debate on the conflict between equity and efficiency in the management of public housing assets [46].
The case-study area consists of the northern part of the district (Figure 1b), including five buildings identified as E, F, G, L and X and representing 55.5% of the housing units in the district.
Cappuccinelli district was designed by Michele Valori (one of the main architects involved in the Italian post-war reconstruction) and built along the northern coast of the city of Trapani on the base of a 12.60 m square grid [47]. The longitudinal axis of the district is oriented in a northwest/southeast direction; perpendicular to this axis, 9 m wide driveways were designed to connect the buildings of the district to the road along the coast and to the other neighborhoods of the city. The fulcrum around which the district is organized is a large square that originally conceived by Valori as a pedestrian green area where, on the south side, a multi-storey building is located. Three types of buildings were designed for the district: court buildings with four- or five-room duplex apartments symmetrically coupled to a 12.60 m square internal courtyard; terraced buildings; and a five-storey building with single-level apartments with three or four rooms each. The open spaces of the court buildings were intended by Valori as both common spaces and small fenced-in areas to be used as private gardens. The first building yard was opened in 1958, and the construction of the district was developed in different phases until the 1970s. During these years, the district underwent several changes, especially in relation to the organization of open spaces, which, today, are in a state of widespread degradation, as well as buildings. Currently, the central square of the district is a completely paved area with very few Fabaceae trees of the genus Erythrina, a genus of flowering plants in the pea family. (Figure 2a), whereas the courtyard spaces, originally conceived as private green spaces, have been cemented and modified by tenants, who have built canopies and higher fences (in addition to the existing walls) to provide more privacy and safety (Figure 2b).
Housing tenure in Cappuccinelli district has also changed over the years and is currently 42.7% public (IACP) and 57.3% private. In the case-study area, the percentage of private housing units is 64.1%, which is higher than the district average. The composition of public/private tenure varies within buildings, reaching 88% in building X (Figure 3a).
Land tenure includes another public authority, the Municipality of Trapani, and is broken down as follows:
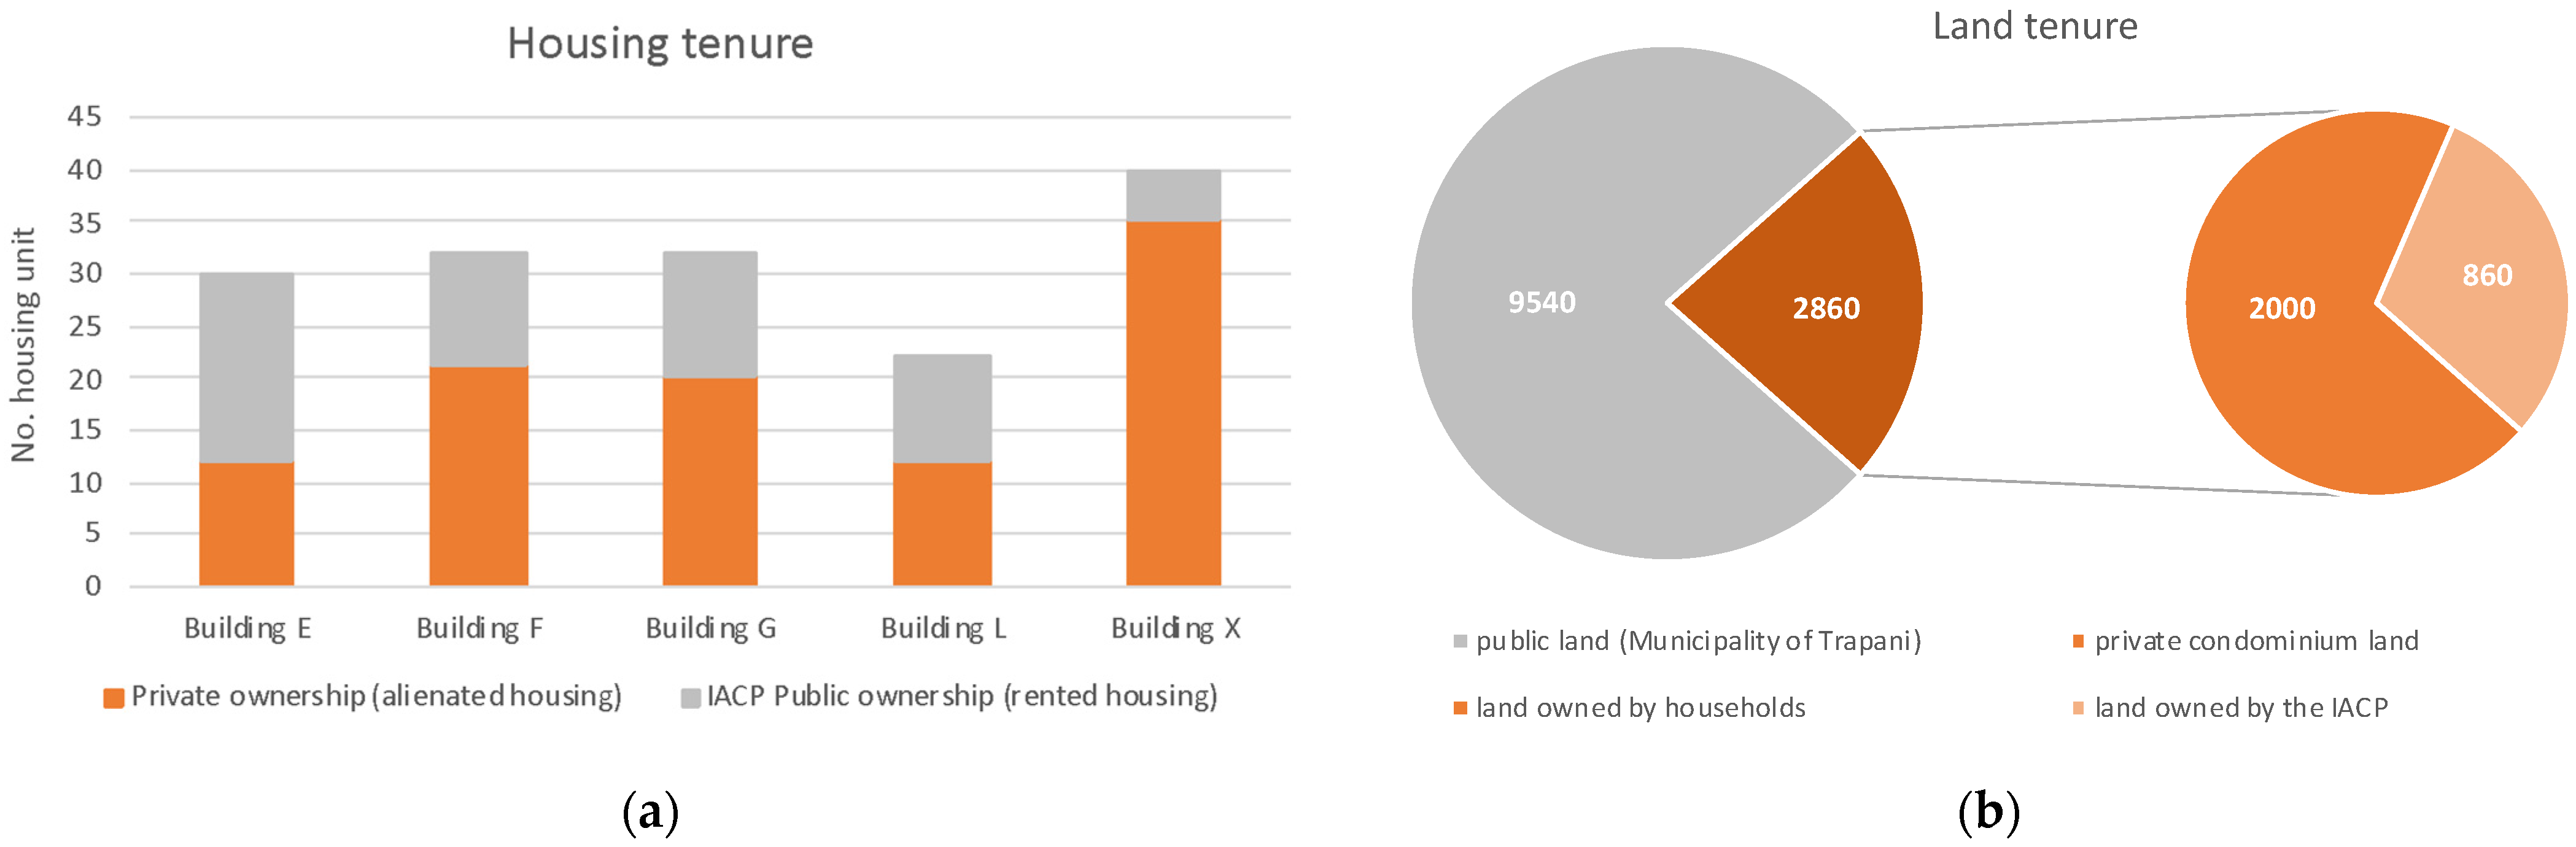
  • 9540 sq.m (76.9%) are owned by the Municipality of Trapani;
  • 2860 sq.m (23.1%) are owned by the condominiums and correspond mainly to the inner courtyard of the buildings.
Condominium land, in turn, consists of two parts:
  • 2000 sq.m relate to the rented dwellings owned by the IACP;
  • 860 sq.m relate to dwellings owned by households (Figure 3b).
The nature of the “peripheral” district, originally located between the historic city center and the Tyrrhenian Sea and close to the countryside, has been transformed over the years into a place of social segregation, where there is a complete lack of vegetated spaces and public services. The Municipality of Trapani has manifested its intention to regenerate the district, providing green areas, which are an urbanistic standard required by Italian legislation, and it recently won a competition promoted by the Ministry of Ecological Transition Directorate for Climate, Energy and Air in close collaboration with ANCI (Association of Sicilian Municipalities) and with the scientific contribution of ISPRA (Higher Institute for Protection and Environmental Research). The competition, “Experimental program of interventions for adaptation to climate change in urban areas”, is aimed at increasing the resilience of urban centers to the risks generated by climate change, with reference to heat waves and extreme rainfall and drought phenomena [48]. With these aims in mind, the project submitted by the Municipality of Trapani, in collaboration with IACP, proposed planting trees and shrubs in Cappuccinelli district, even if without a specific preliminary study to verify the real benefits that can be derived from the use of such a passive microclimate mitigation strategy.
In the context of an energy and environmental retrofit project for Cappuccinelli district, which could also trigger urban and socioeconomic regeneration phenomena, the implementation of vegetation inspired by the original project developed by Michele Valori may represent an opportunity to preventively analyze the effects of different types of green areas as a primary passive strategy on the comfort of outdoor and indoor spaces, as well as building energy consumption [49]. This strategy was validated through analysis of its effects on microclimate mitigation, evaluating, based on the results obtained from simulations, the extent to which vegetation can contribute to improved outdoor comfort and, consequently, reduce technological and economic demands of the interventions [50,51,52]. To this end, different scenarios were investigated, designed according to the original project by Valori.

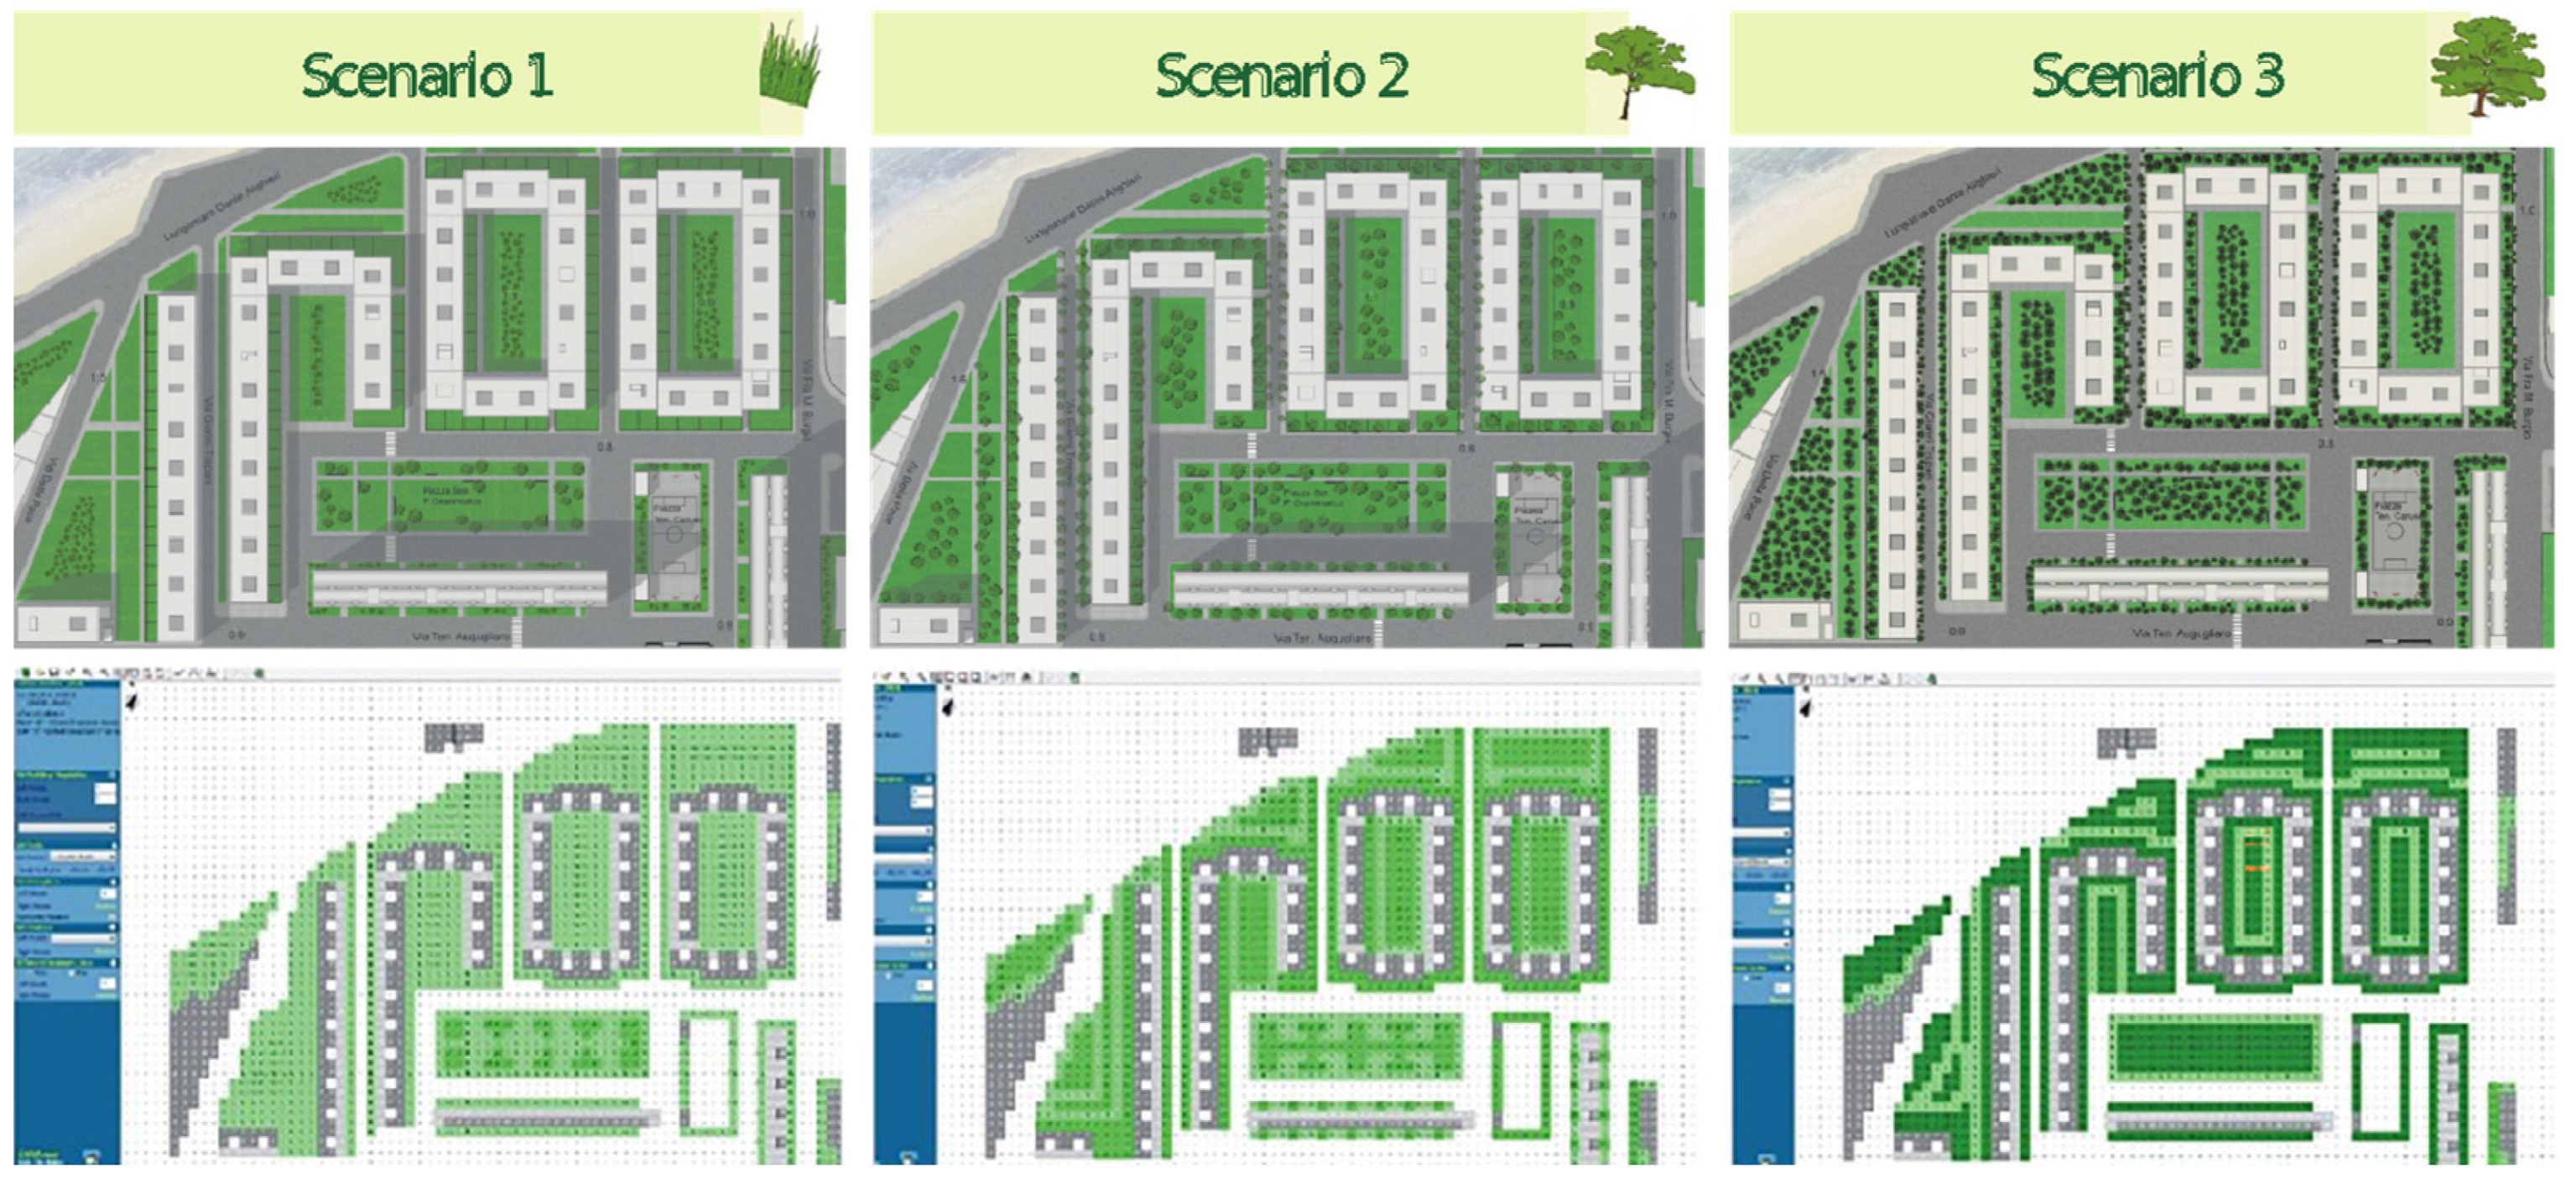
2.2. Vegetation Scenarios

As discussed in [51], the green areas are 12,400 square meters in size, and the different alternatives are:
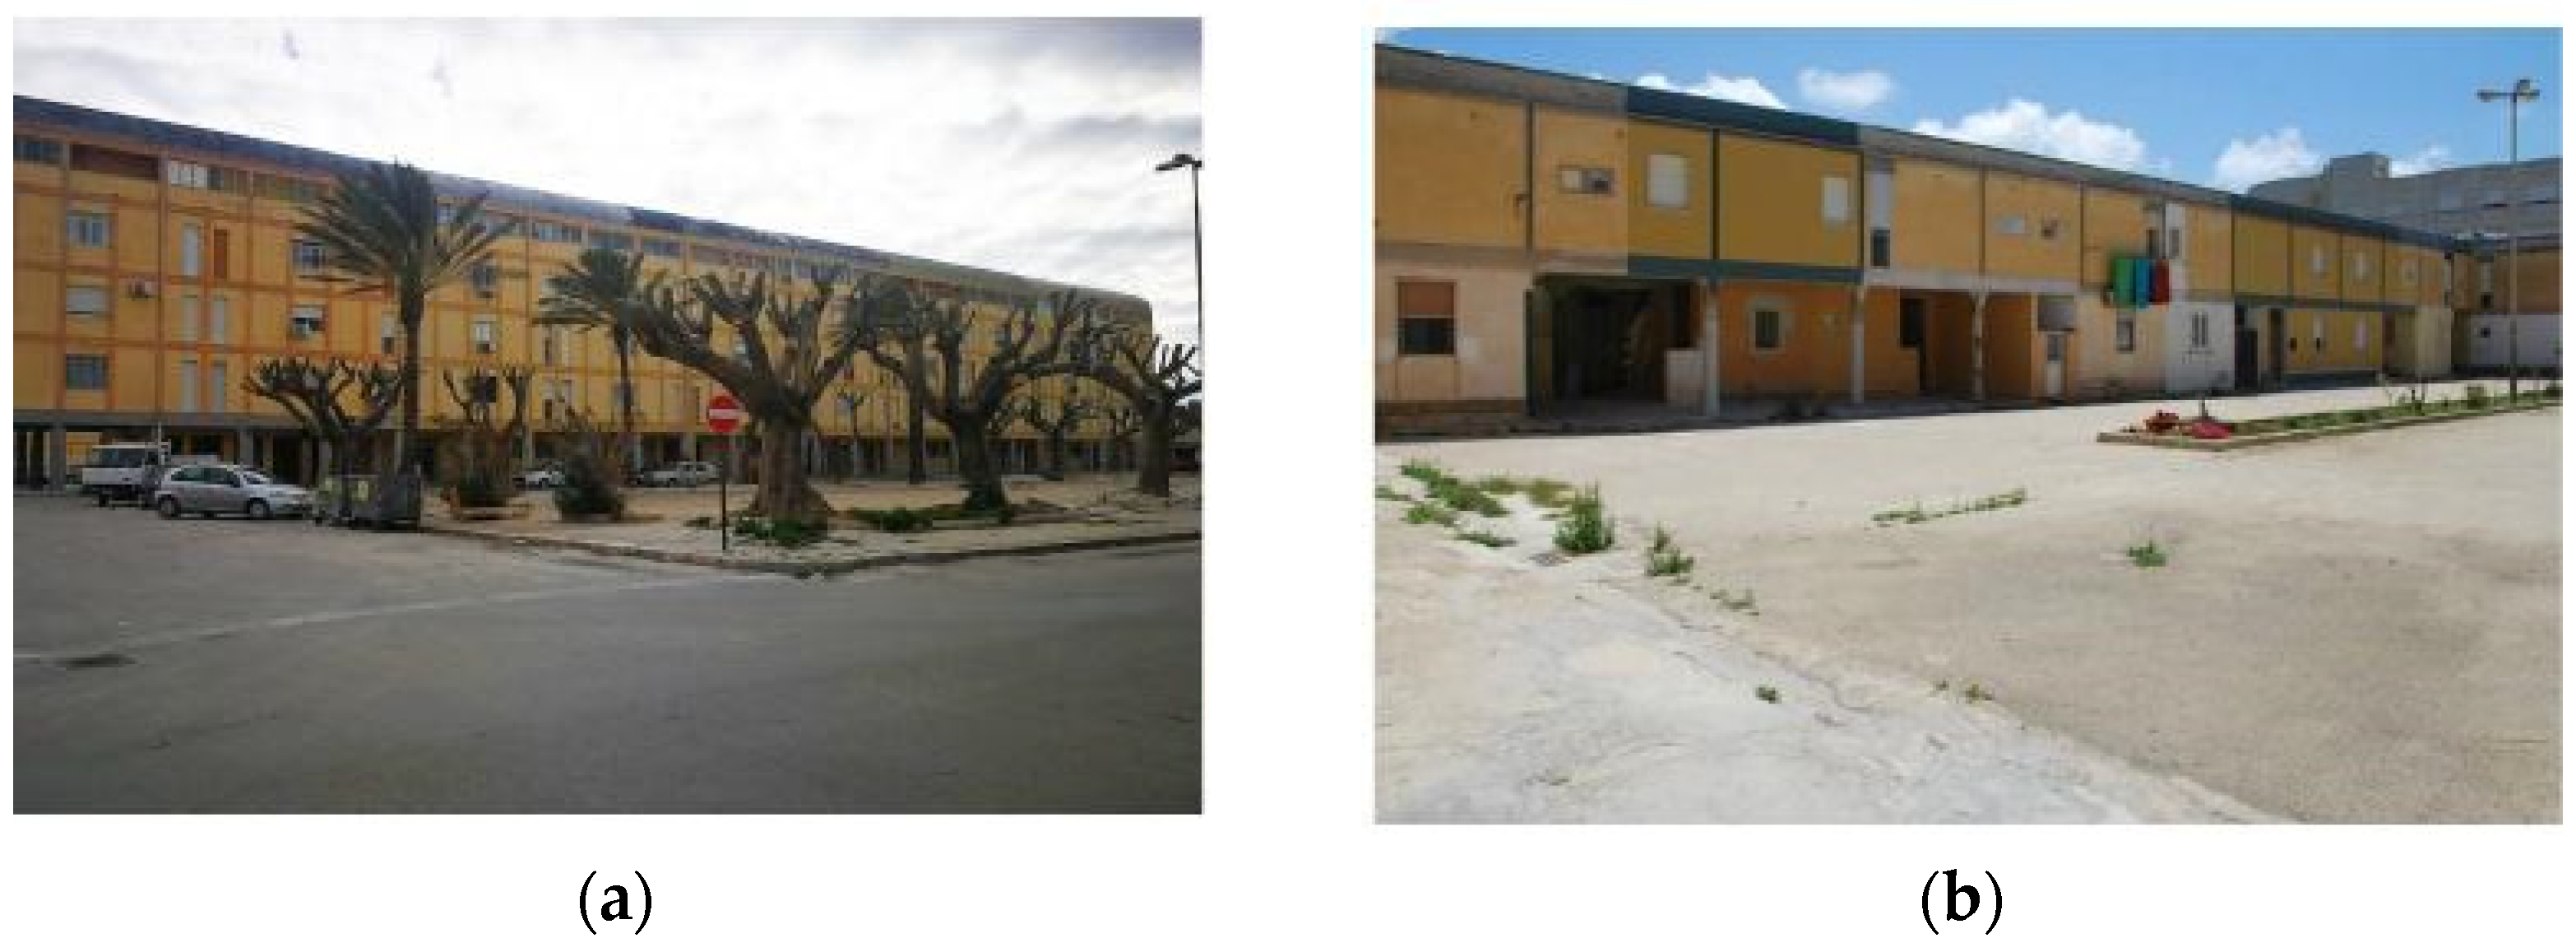
  • Scenario 0. This is the current situation of the examined site, where green areas are almost non-existent (hereafter S0) (Figure 4);
  • Scenario 1. This scenario corresponds to the basic minimum intervention that consists of replacing the existing pavement with green areas characterized by turf and deciduous plants of 1 m in height (hereafter S1);
  • Scenario 2. Same as S1, but green areas are characterized by turf and deciduous plants of 4–6 m in height (hereafter S2);
  • Scenario 3. Same as S1, but green areas are characterized by turf and deciduous plants of 15 m in height (hereafter S3) (Figure 5).

3. An Integrated Methodology to Evaluate the Co-Benefits of Green Areas

The methodology applied in this study is based on the integration of approaches from different disciplines to adequately analyze the complexity of the co-benefits generated by green areas as an energy retrofit action. The methodology consists of the following parts:
  • Microclimatic analysis in all the previously defined scenarios of vegetation by means of ENVI-met software and evaluation of the related local climates;
  • Assessment of the energy needs of a sample of houses for each scenario by means of the EnergyPlus model;
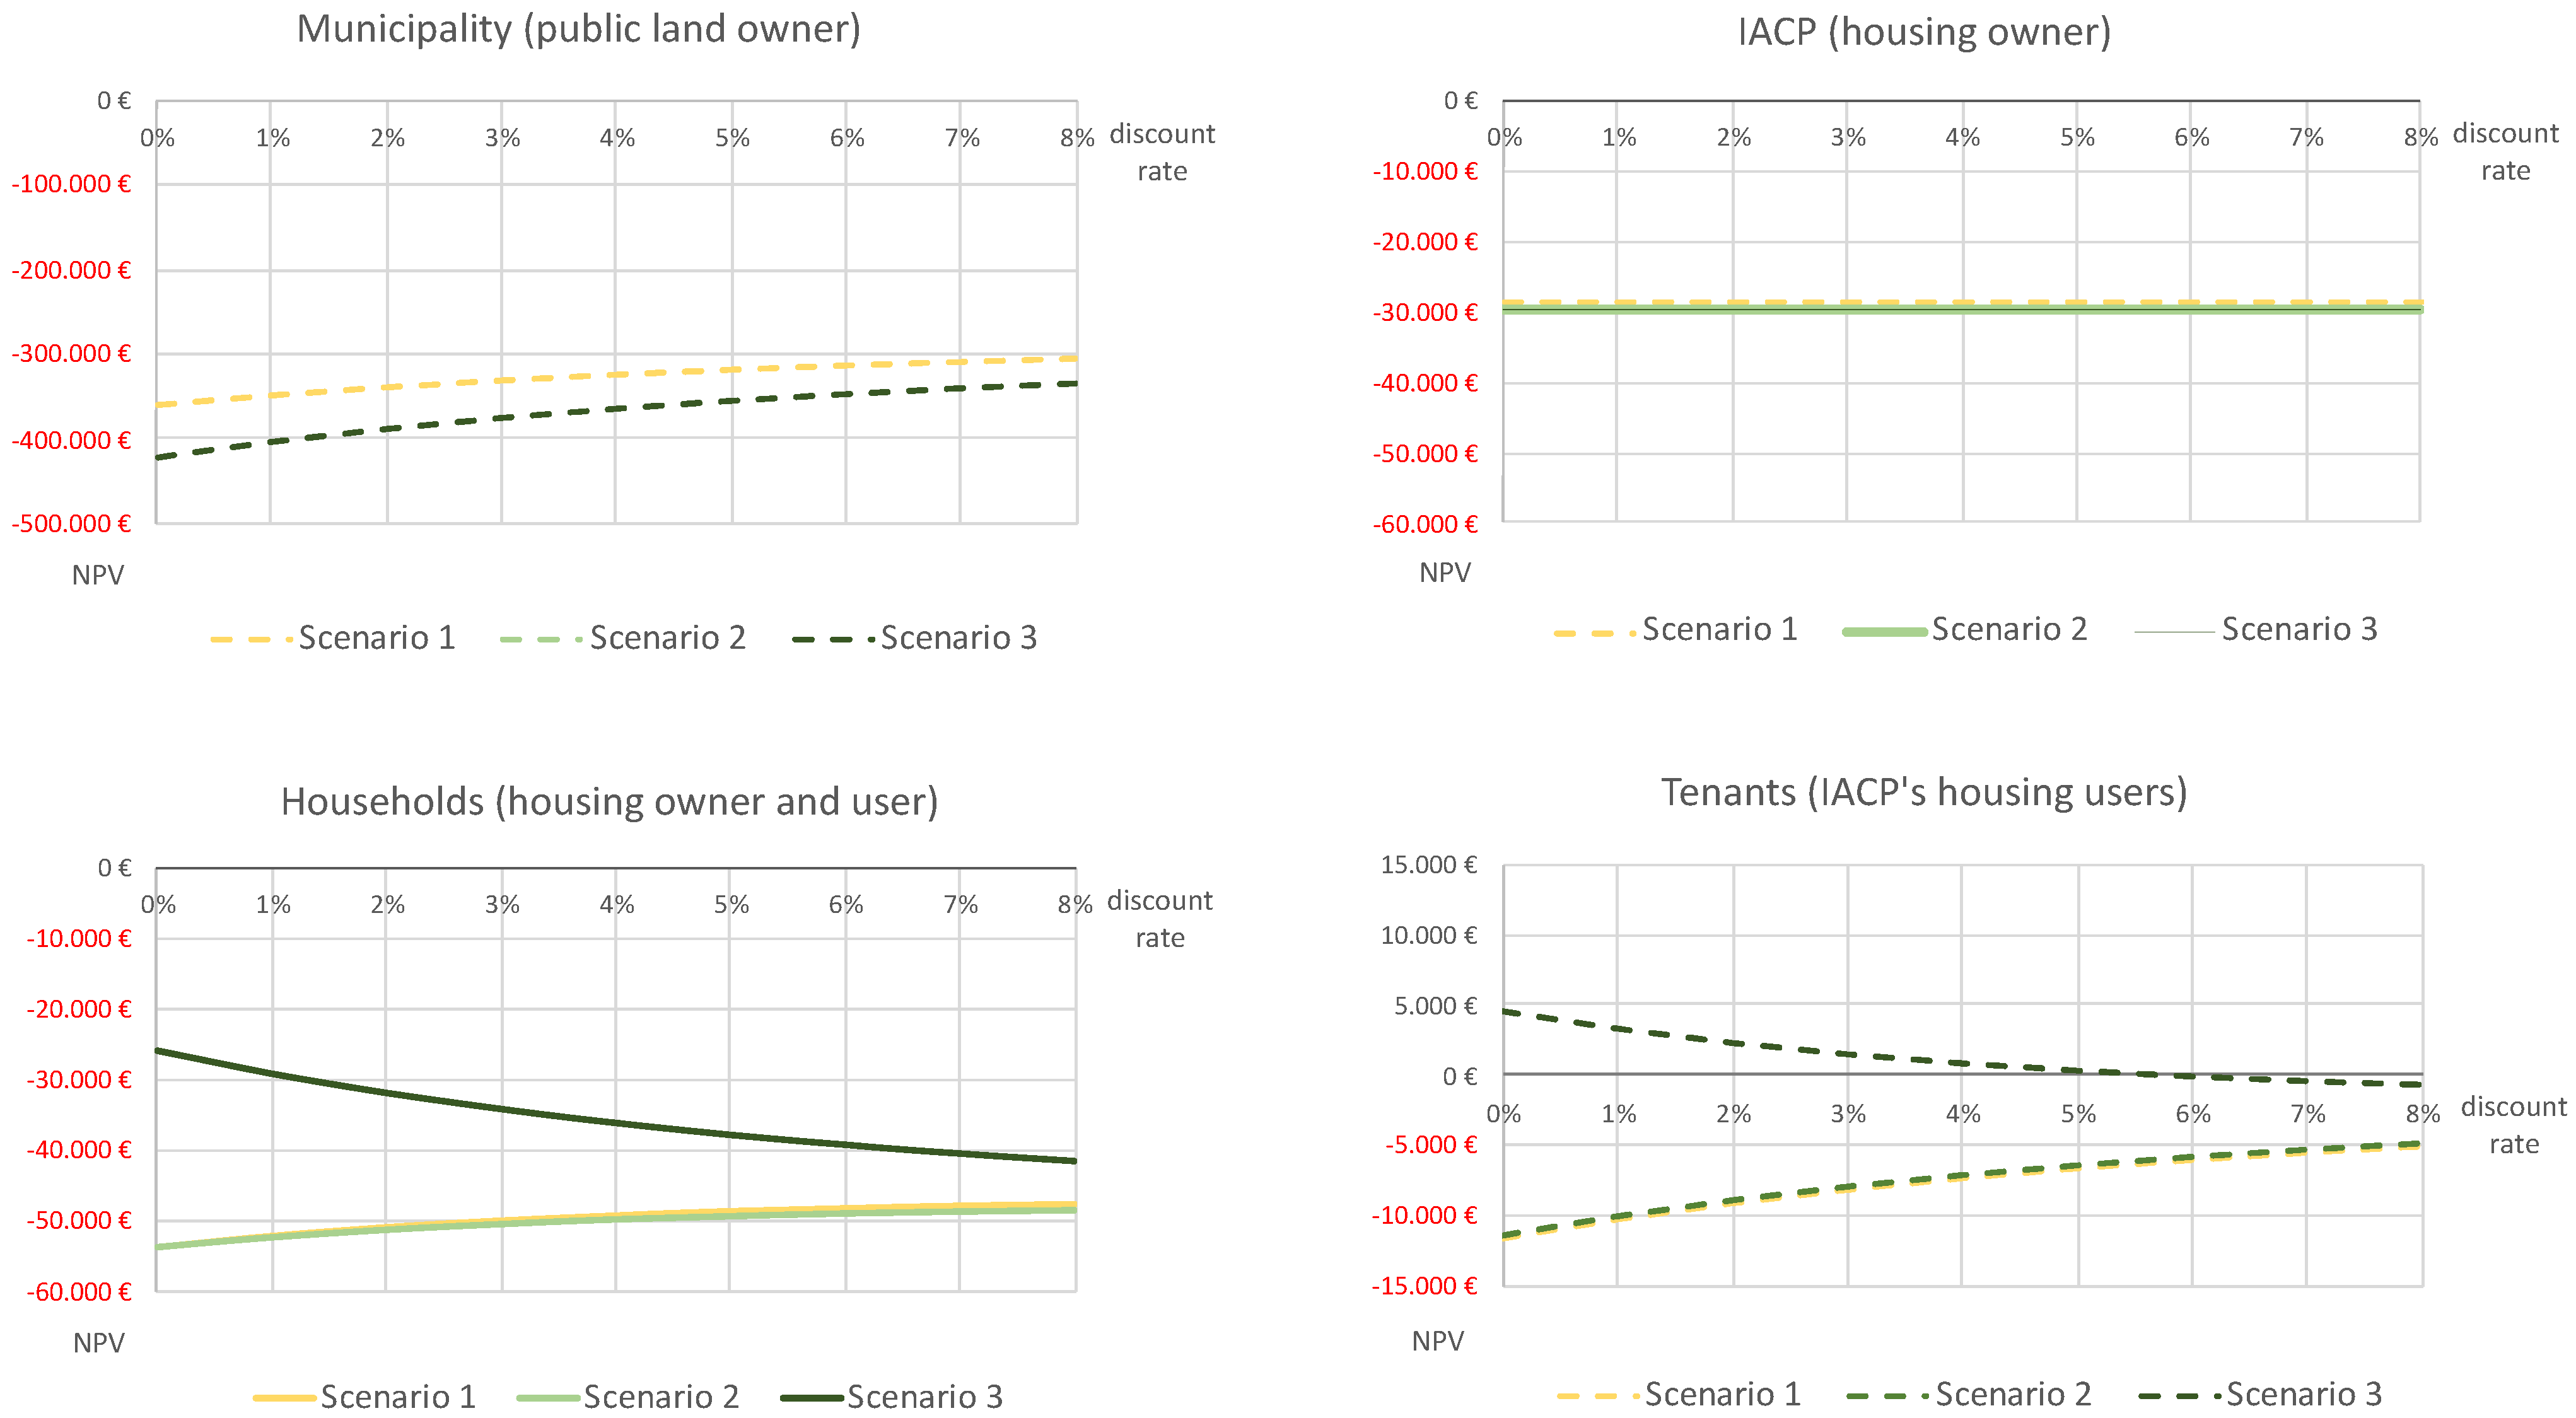
  • Economic feasibility analysis according to scenario and public and private investors through the calculation of the net present value (NPV) and the internal rate of return (IRR).

3.1. Analysis of Microclimate and Implementation of Vegetation

According to the results of previous works [52,53], the local climate conditions were analyzed to simulate alternative outdoor climate scenarios. The local climate conditions were obtained from climate data supplied by the weather station near the district or from the available online database related to the weather station near the site. Then, a three-dimensional model of the case-study area was built, considering the ground elevation model, the build volume and the green area. The latter is an independent variable for the different scenarios.
All these data represent the input data for an ENVI-met simulation model that considers the influence of vegetation on local climate, the main parameter for this step. Hence, the local climate for all the different scenarios characterized by different types of plants or green areas was assessed through ENVI-met software according to a multiscale simulation methodology described in [54] for both the coldest and the hottest days at the hourly level.
To proceed with the aforementioned assessments, the district was preliminarily analyzed according to building typologies, climatic conditions and vegetation currently present in the public and private open spaces.
The analysis of microclimate with ENVI-met software achieved simulations at two different scales: macro area and micro area.
  • The macro-area simulation included about 100 hectares that, in the absence of in situ surveys, allowed for study of the climatic conditions of Cappuccinelli district in a wider urban context to evaluate the influence of the neighboring areas by recalibrating the climate data extracted from the weather stations of Trapani-Birgi and Trapani-Fulgatore (two weather stations near the city).
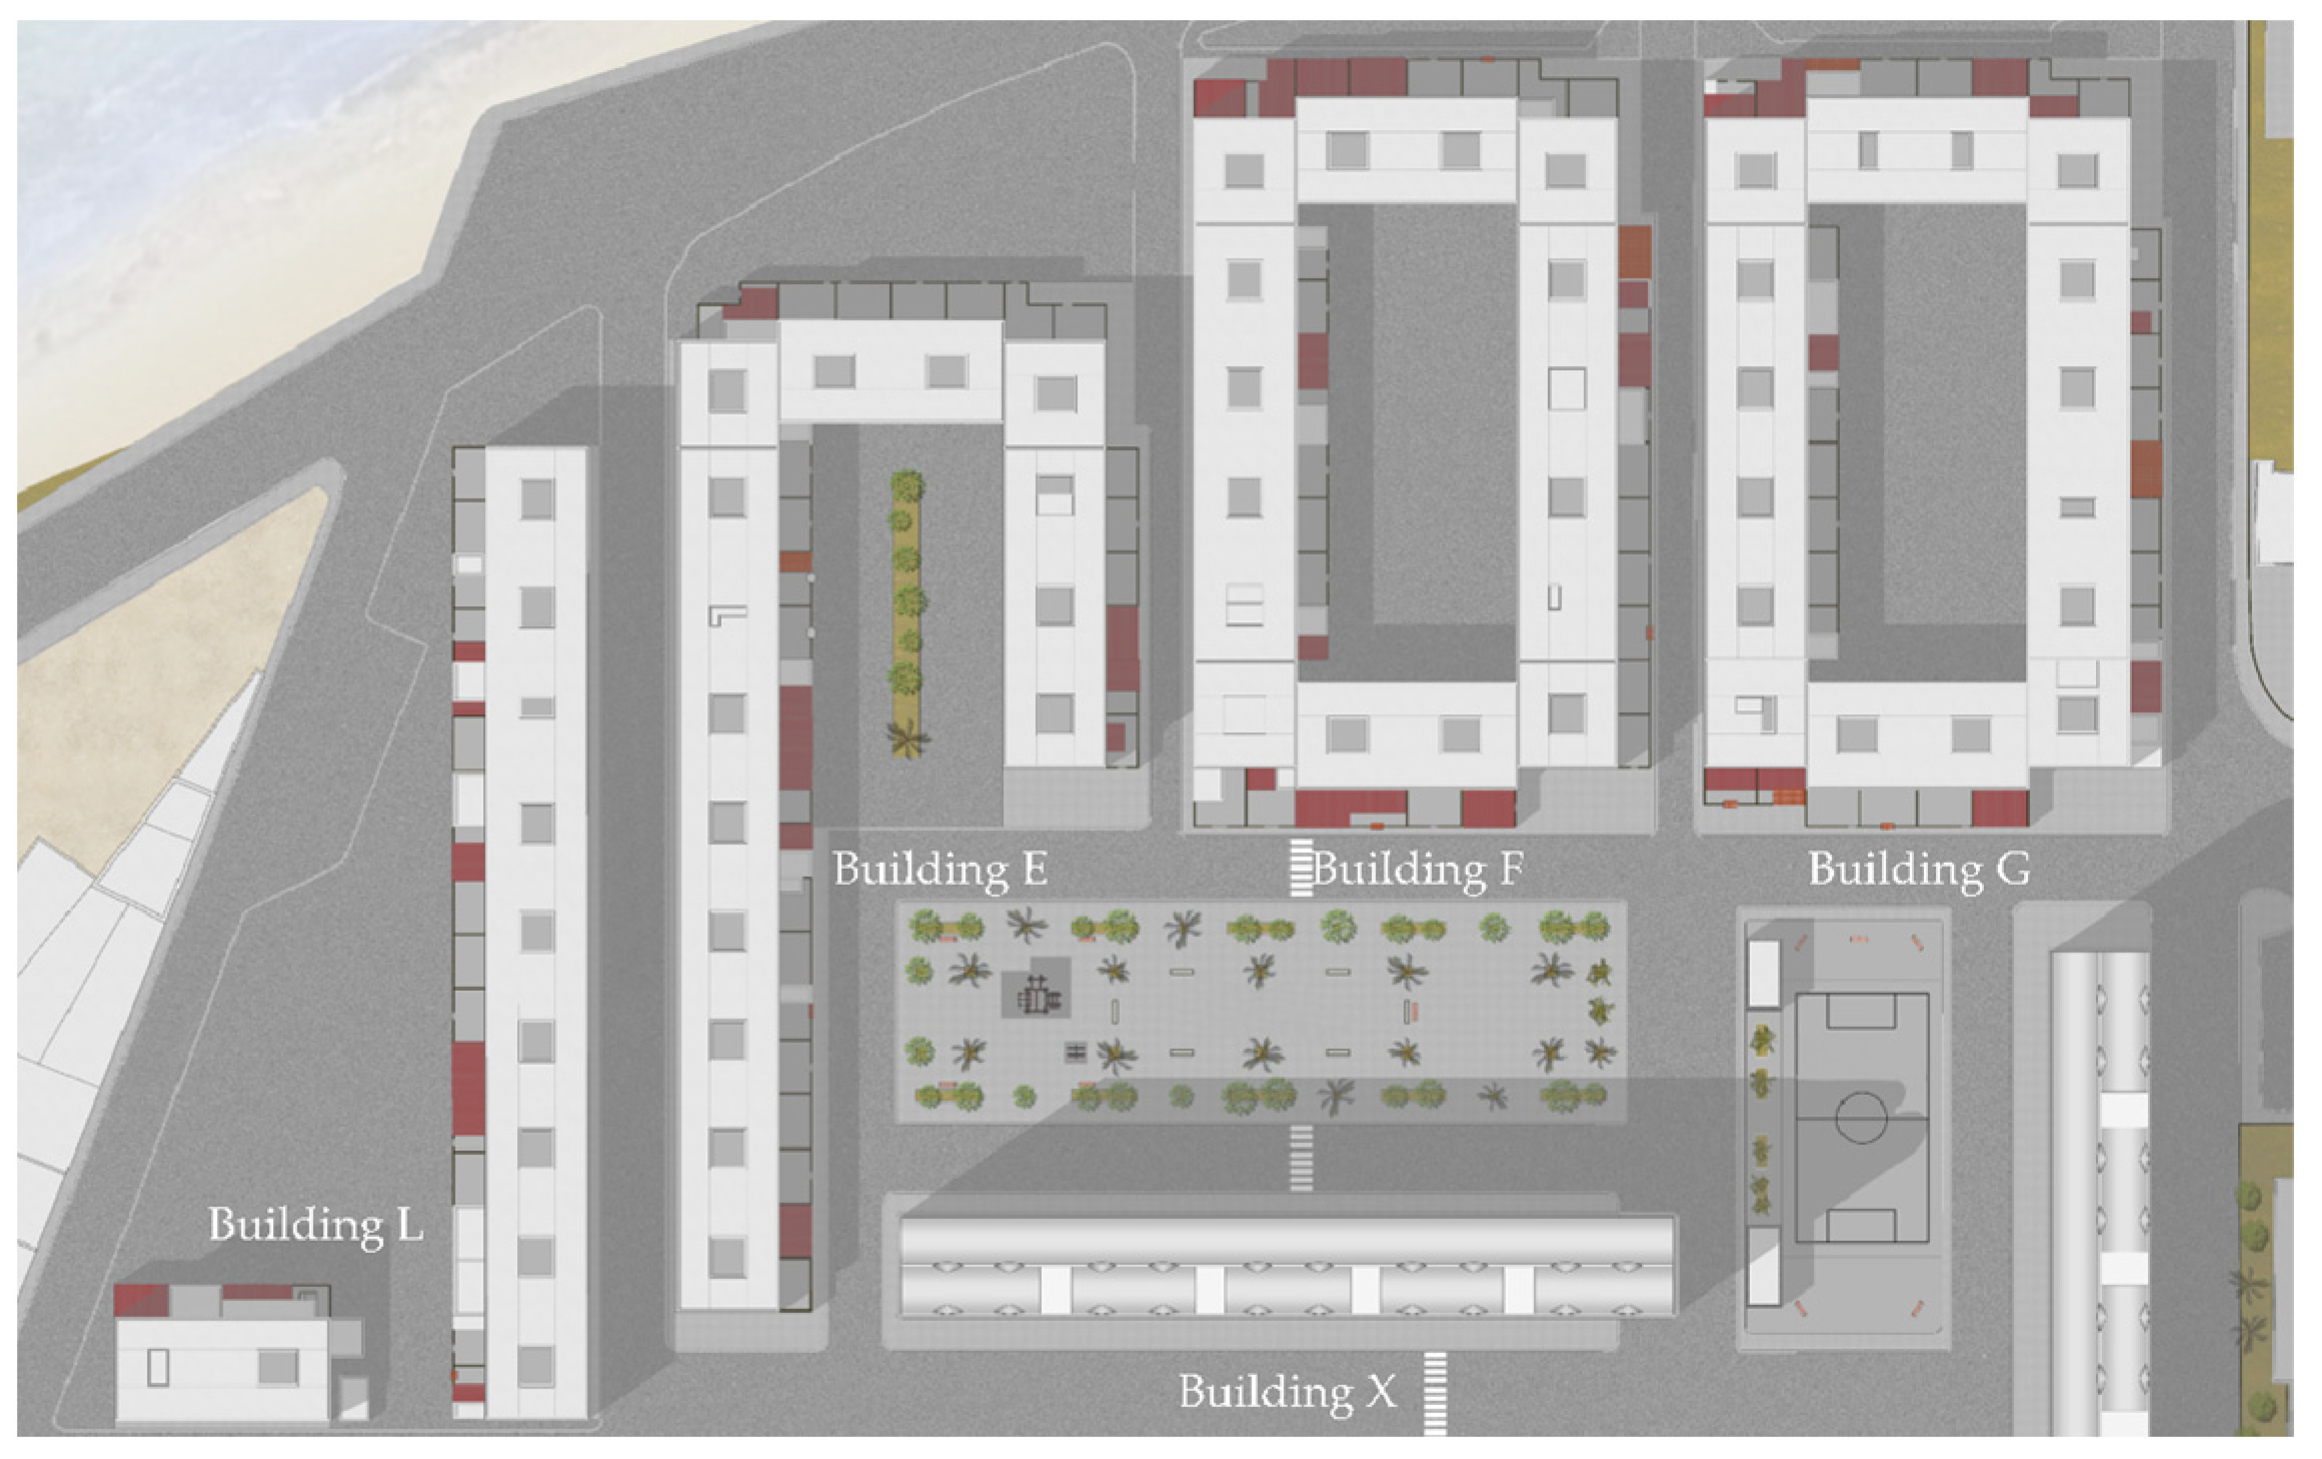
  • The micro-area simulation included about 7 hectares, corresponding to the central part of Cappuccinelli district in which the square, multi-storey building X and court buildings E, F, G and L are located (Figure 4). The previously obtained output climatic data were used as input values for the assessment of the microclimate at the microscale.
Before performing the ENVI-met simulations, receptors were appropriately positioned in the modeled area for the acquisition of output data. One receptor was positioned in the center of the central square of the district, and two were placed in the proximity of an apartment in building X and court F. Two representative apartments were considered. The first apartment is representative of a high-rise building (hereafter HRB); the second apartment is representative of a low-rise building (hereafter LRB).
In LRB, the living area is located on the ground floor and consists of a living room with double exposure to the northwest and southeast, a kitchen and a study facing southeast and a bathroom facing northwest. The sleeping area, located on the first floor, consists of a single bedroom facing southeast, as well as a double bedroom, a second single bedroom and a toilet facing northwest. The staircase, around which all the rooms are arranged, is exposed to the north-east and has glass surfaces with the sole function of letting sunlight filter inside (Figure 6a).
In the HRB apartment in building X, the living area consists of a living room facing northwest, a kitchen facing southeast, a double bedroom facing northwest and a bedroom facing southeast. On both sides of the apartment, there is a veranda, created by tenants closing the two lodges provided for in the original project (Figure 6b).

3.2. Evaluating the Building Energy Consumption

The building energy consumption associated with the heating, ventilation and air conditioning (HVAC) system, able to maintain suitable thermal indoor conditions for each scenario, was evaluated. The presence of vegetation contributes to reduced values of outdoor air temperature due to the evapotranspiration phenomenon: the taller plants are, the greater the reduction in outdoor air temperature. Hence, during the cooling season, this phenomenon undoubtedly has a positive effect on building energy consumption and indoor comfort conditions, whereas it could have a negative effect during the heating season. Therefore, this approach has been shown to be more useful in climatic zones characterized by very warm summers and mild winters, such as the Mediterranean regions [55].
The evaluation of the building energy behavior was performed by means of an EnergyPlus model [56]. EnergyPlus is a very well-known dynamic energy simulation model that allows for the evaluation of energy consumption for climatization of indoor environments for the heating and cooling season.
At the urban/district level, in order to evaluate consumption for each dwelling and to avoid a long computation time of the applied mathematical model, a representative sample of dwellings needs to be defined [13]. The above-described representative apartments, HRB and LRB, were simulated with the EnergyPlus model. Table 1 and Table 2 report usual values of the main parameters concerning building-envelope components, characteristics and internal heat gains required by EnergyPlus as input data, which were used for the simulation model with the aim of depicting a configuration consistent with real conditions.
The yearly weather data file for a business-as-usual (BaU) scenario, i.e., S0, is the original weather data file retrieved from the EnergyPlus weather database. The yearly weather data files for each alternative scenario (S1, S2 and S3) were constructed on the basis of the BaU weather file and the local climate data obtained for two conventional severe days, i.e., 21 August and 20 February, identified as reference hottest and coldest days, respectively.

3.3. Economic Feasibility of the Scenarios

The economic feasibility of a scenario can be assessed using several economic indicators. The most common indicators are the net present value (NPV) and internal rate of return (IRR).
NPV is the discounted present value of the cash flows resulting from the difference between inflows and outflows over a period of time. An investment or project is profitable when the NPV is positive; consequently, investments with negative NPV values should be rejected by investors. The NPV formula is as follows:
NPV = t = 1 n ( R t C t ) ( 1 + r ) t C 0
where Rt is revenues for year t, Ct is costs for year t, r is the discount rate, n is the period of analysis, and C0 is the initial investment.
IRR is the rate that makes the NPV of a project equal to zero; consequently, IRR is calculated by applying the following formula:
t = 1 n ( R t C t ) ( 1 + IRR ) t C 0 = 0
An investment or project with an IRR greater than its cost of capital is profitable.
Both indicators, NPV and IRR, express the economic feasibility of a project from the investor’s point of view. When public and private investors are involved in a project, as in the case of the implementation of green areas in a mixed-ownership district, it is necessary to differentiate cash flows because the purposes and expectations may be dissimilar and even conflicting.
Analyzing the ownership of land that could become green areas (Figure 3) was an essential preliminary step in allocating both project implementation and management costs, as well as garden operating revenues as a passive energy measure.
It is important to note that the costs of implementing green areas are borne by the landowners, which are the Municipality of Trapani, the IACP and the families who own the houses. On the other hand, the maintenance costs of condominium gardens in the inner courtyards of buildings are borne by households (homeowners) and the tenants of the IACP housing units, and both can directly benefit from the operating revenues in terms of reduced energy bills. Finally, only homeowner households are eligible for public incentives (Table 3).
In order to evaluate the initial investment cost, C0, for garden planting and the operating costs, Ct, of the green areas (e.g., grass cutting, leaf collection, tree pruning, etc.), a market survey was conducted, which resulted in unit parametric costs (euro/sq.m) for the three scenarios. To determine planting costs, two large plant nursery companies based in Sicily were consulted, and to assess maintenance costs, a private contractor who already manages green areas in urban parks in the city of Palermo was contacted. The average annual cost of trees used in the case study is EUR 36, which is similar to costs for public trees used in Los Angeles [44], ranging from USD 29.39 to USD 39.44. The operating revenues, Rt, derived from the use of vegetation as a passive energy retrofit measure, were calculated from the utility bill savings resulting from reduced climatization energy consumption. These data and those in Table 3 are the inputs to Equations (1) and (2) for calculating NPV and IRR, respectively, by stakeholder, taking into account land and homeownership rates.

4. Results

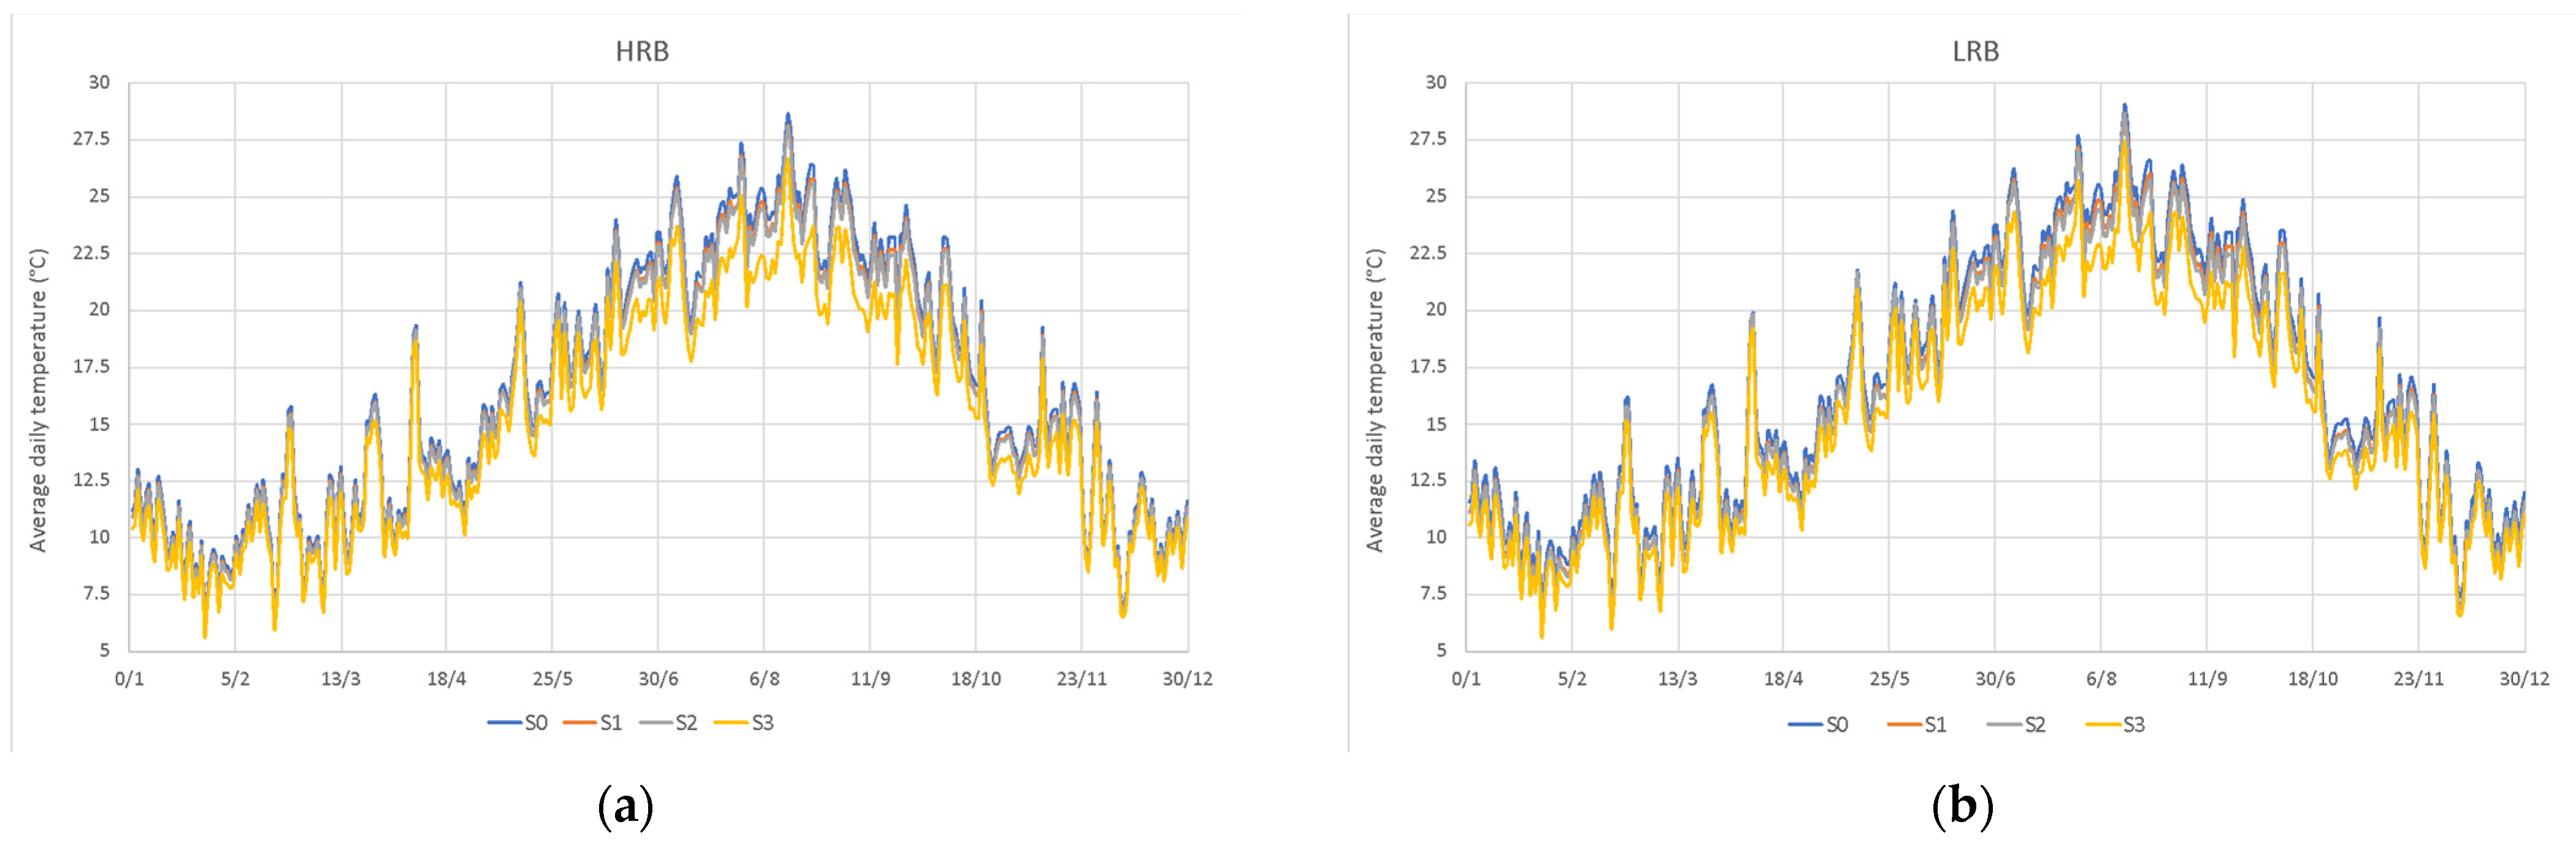
4.1. The Microclimate in the Case Study Area

The results of the simulation executed with the ENVI-met model allowed us to understand how the local climate would change with respect to the original weather data due to the presence of green areas and their characteristics [49]. In particular, during the cooling seasons, the simulations highlight maximum reductions of outdoor air temperature equal to 0.79 °C, 0.98 °C and 2.23 °C for S1, S2 and S3, respectively. With respect to S0, those reductions generate a positive effect on outdoor comfort. During the heating seasons, the maximum reductions of outdoor air temperature are equal to 0.45 °C, 0.48 °C and 1.51 °C for S1, S2 and S3, respectively (Table 4). With respect to S0, those reductions generate a negative effect on outdoor comfort and probably on the energy consumption of buildings. These values refer to the two most severe days.
In order to evaluate the yearly building-climatization energy consumption for the alternative scenarios, the hourly weather data for the whole year and for each alternative scenario were calculated on the basis of S0 weather data. To do so, a simple linear interpolation equation was used. In particular, the interpolation equations for outdoor air temperature and vapor pressure, both as a function of outdoor air temperature and vapor pressure, were built on the basis of the two severe days. These hourly weather data were the input data for the EnergyPlus model.
Figure 7 shows the outdoor average daily air temperature trend for HRB and LRB, the two selected representative dwellings.

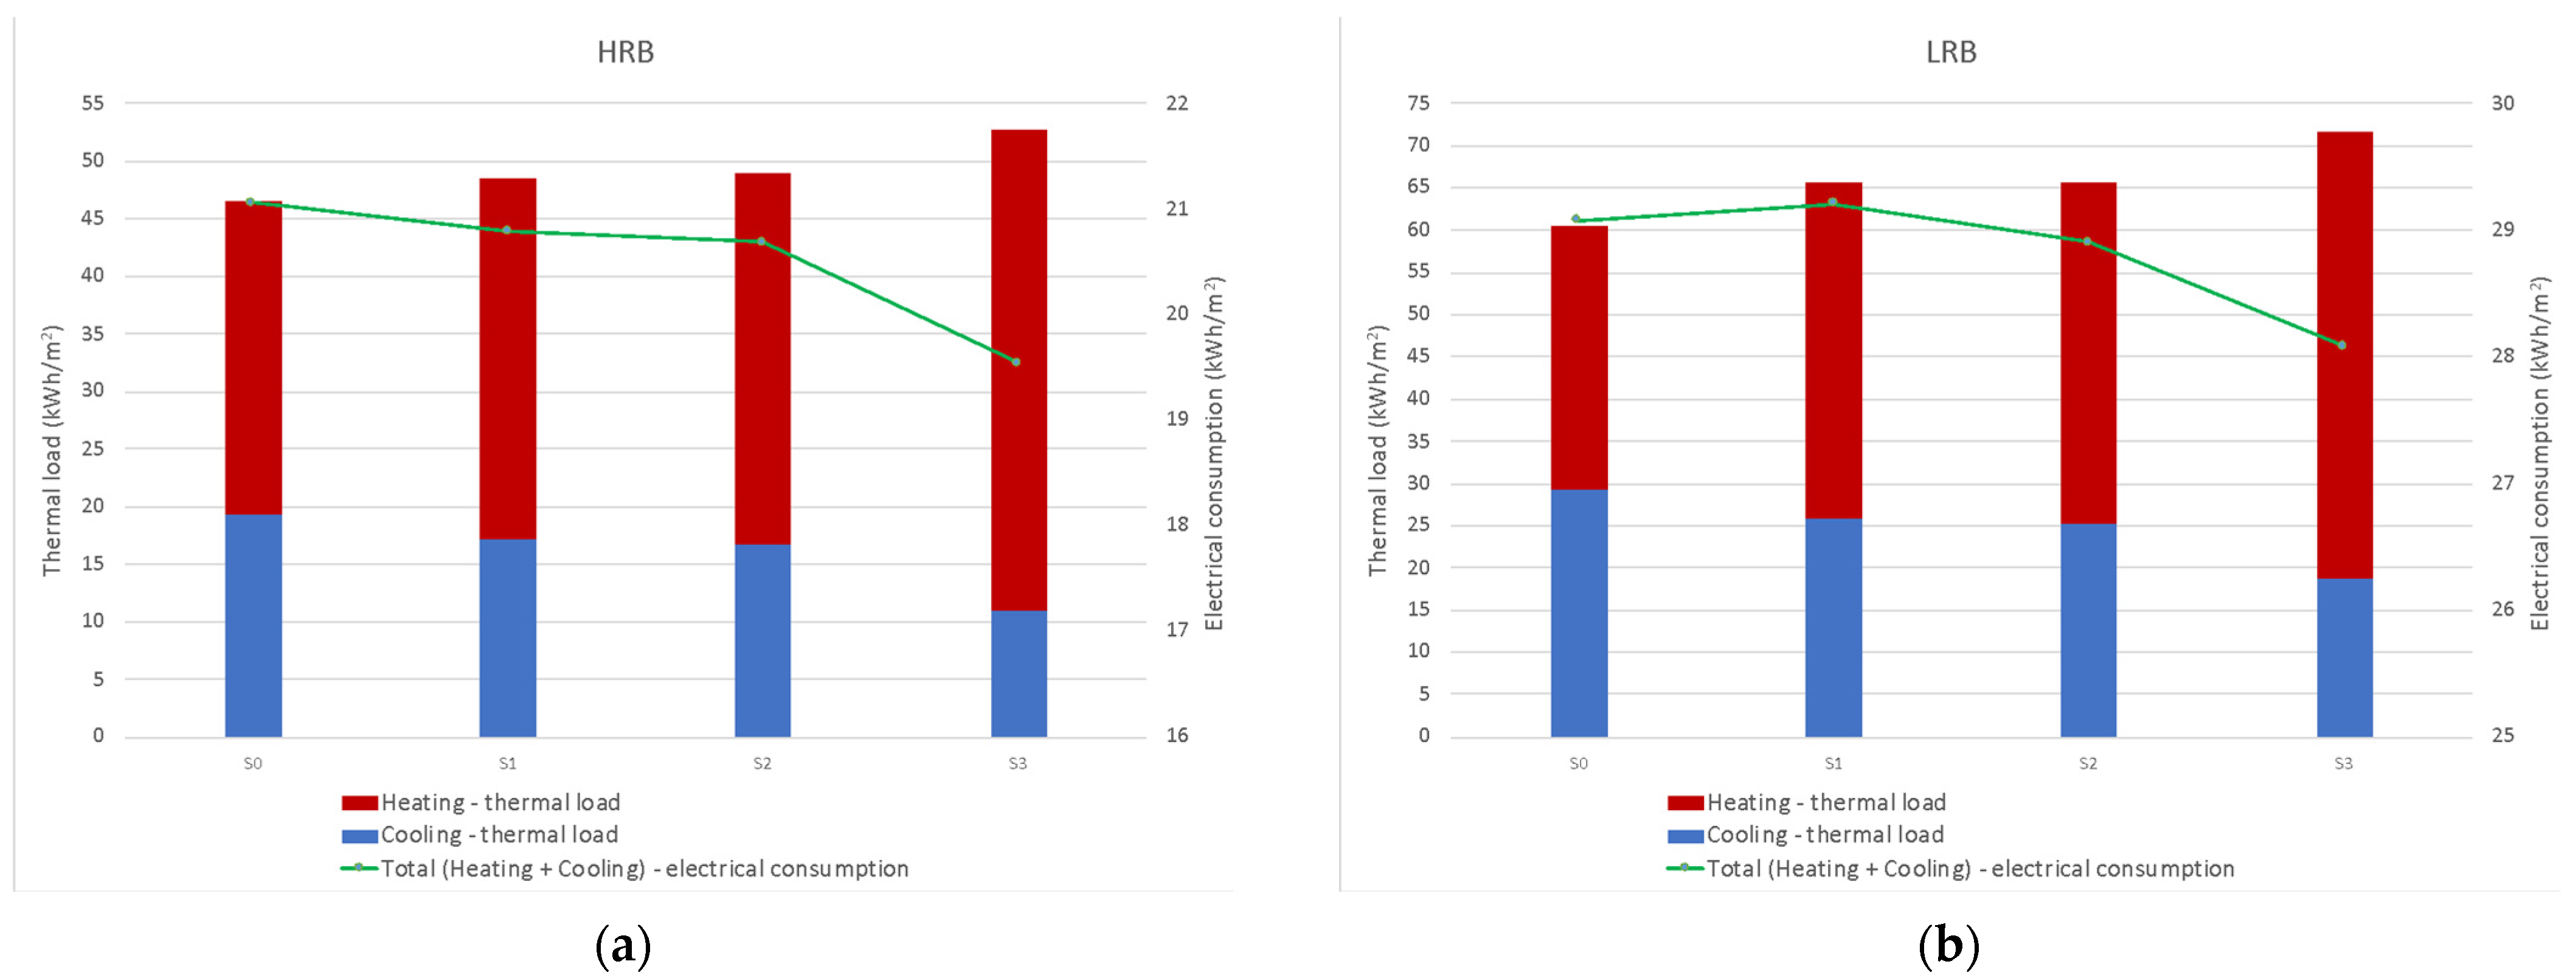
4.2. Energy Consumption of the Buildings

After having singled out the high-rise (HRB) and low-rise (LRB) dwelling samples, simulations of the different scenarios were carried out using the EnergyPlus model. The results of simulations in terms of heating and cooling thermal loads and related electrical consumption, expressed in kWh/m2, are reported in Figure 8 and Table 5, where the energy-saving percentages related to the different scenarios are also shown. Specifically, energy savings related to heating and cooling consumption were estimated by setting the coefficients of performance (COPs) to 3.5 for heat pumps and 2.5 for chillers, based on values adopted in previous research [33,55].

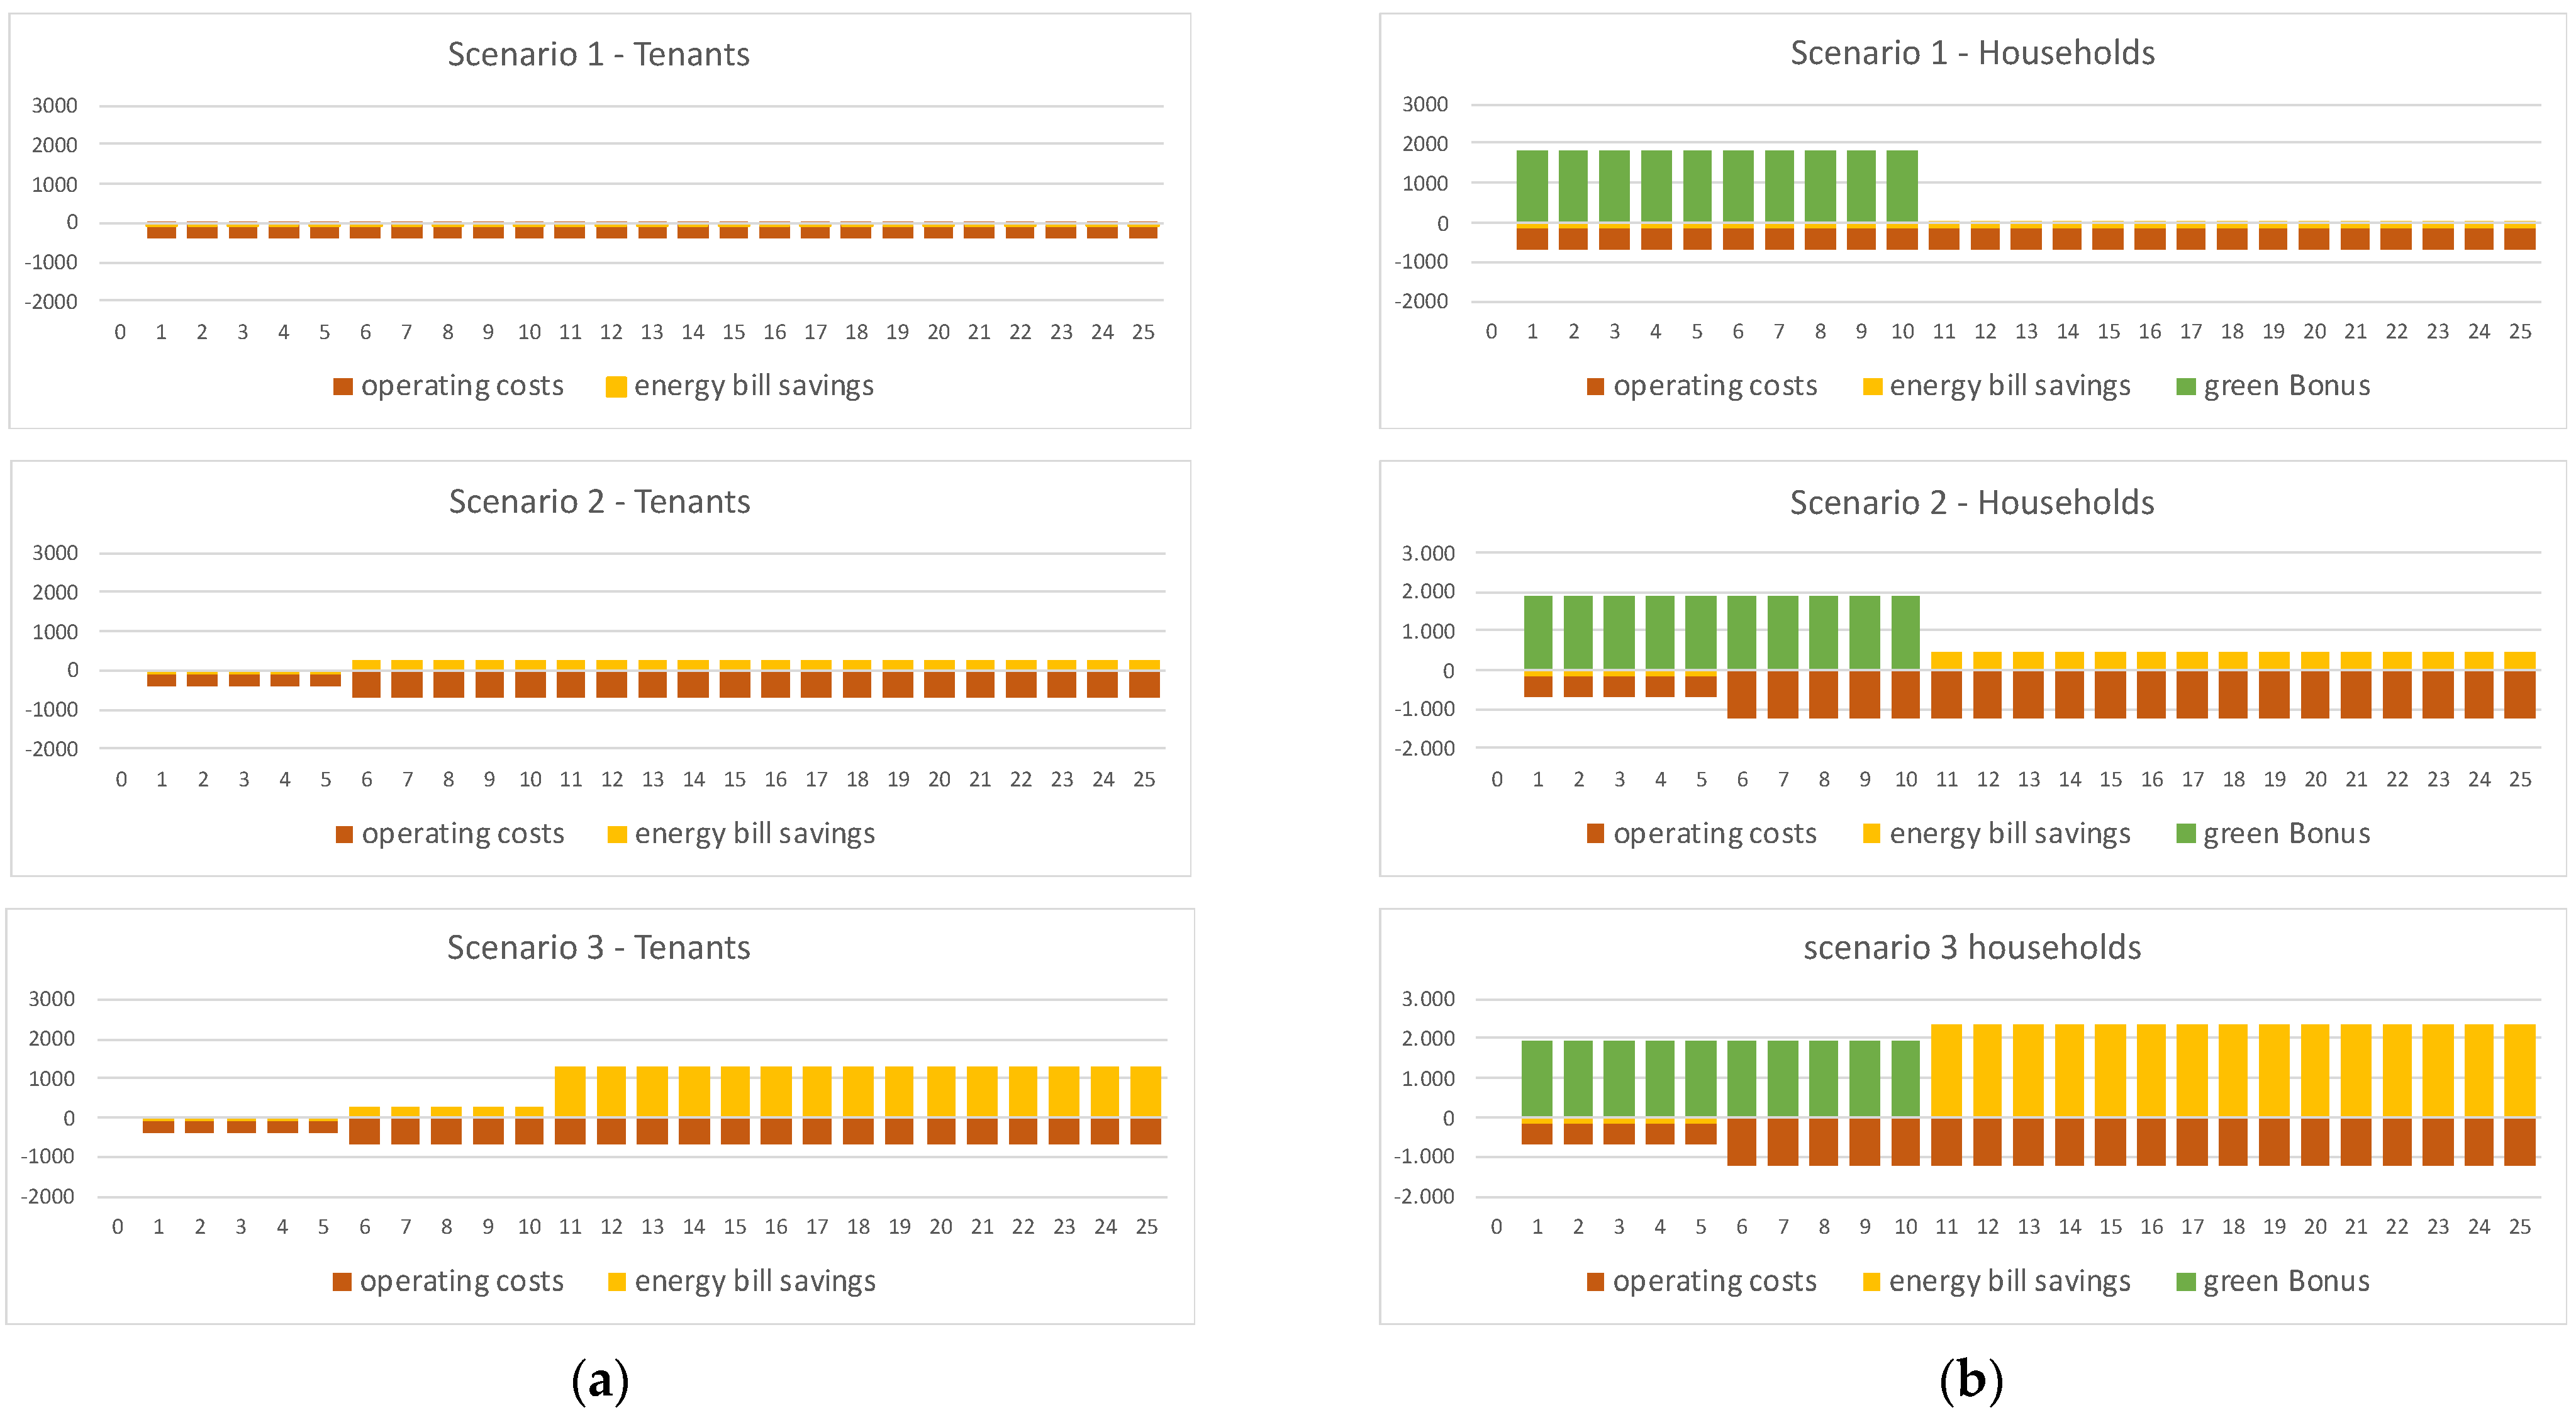
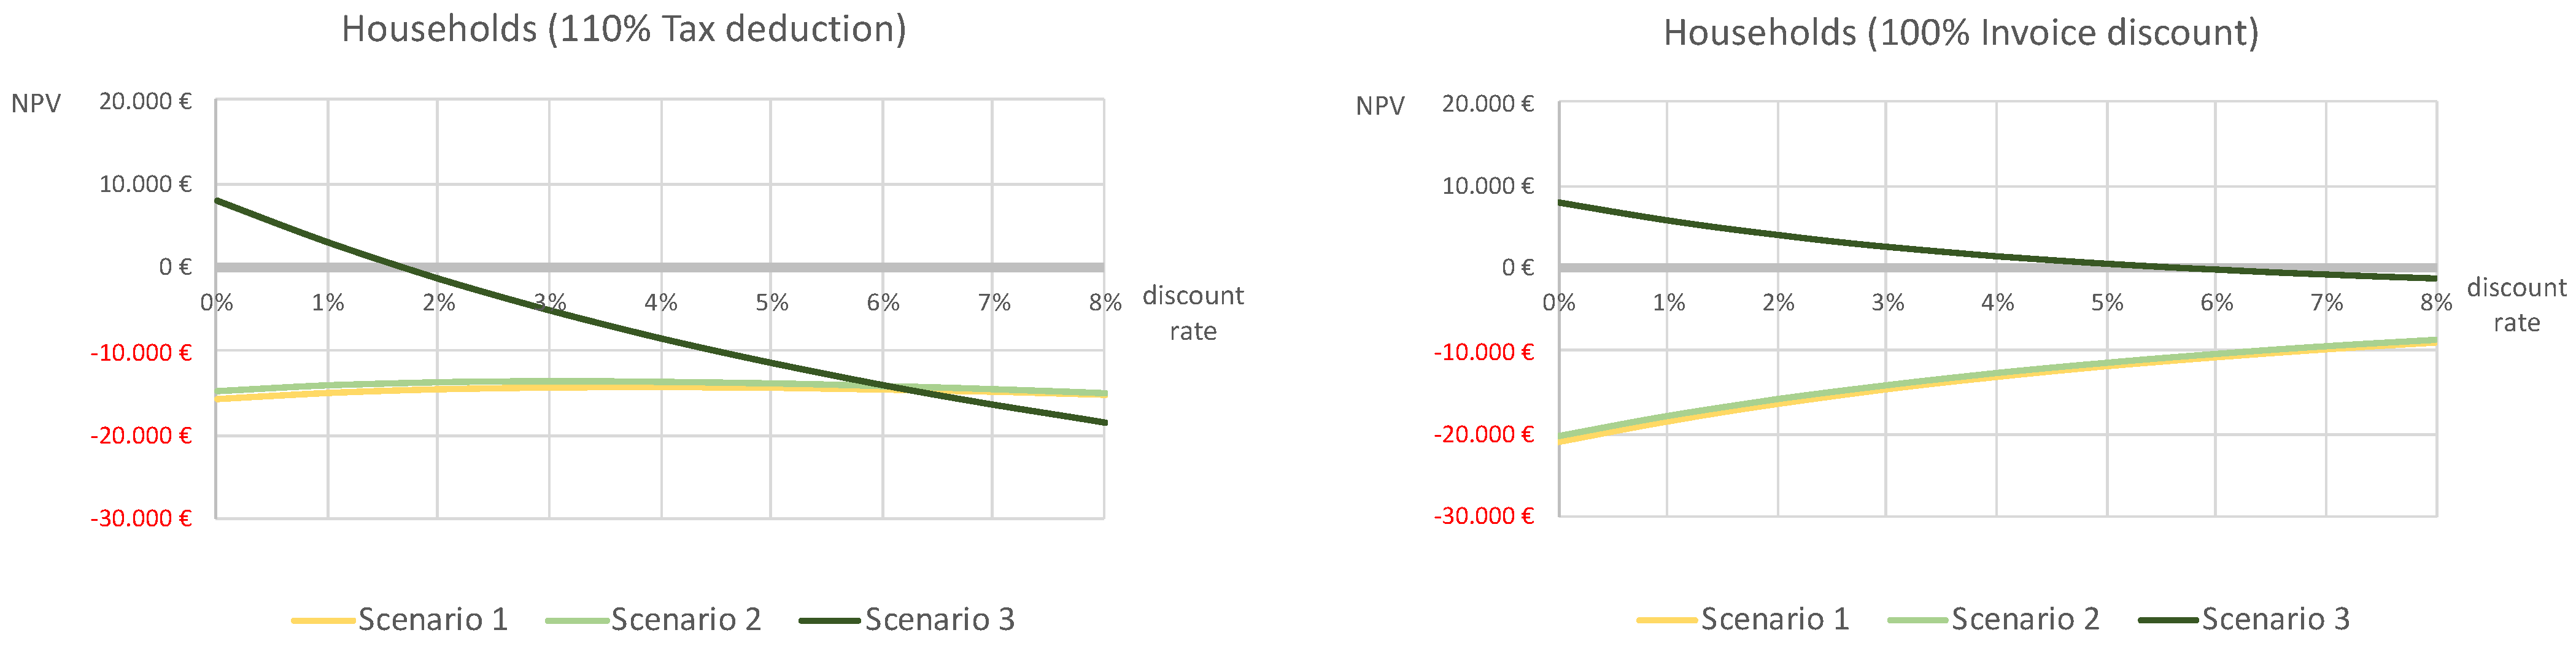
4.3. Economic Feasibility of the Passive Energy Measure

The cash flows of the scenarios were calculated on the basis of the results of the previous analyses and, in particular, the evaluation of the energy savings to which the energy bill savings correspond.
The cost of garden planting is differentiated by scenario and depends on the type of vegetation. The operating costs, on the other hand, vary both according to the scenario and according to progressive tree growth. In S2, a full growth was assumed within 5 years; in S3, full growth was assumed within 10 years, with an intermediate step after 5 years. Operating revenues also vary according to the tree growth, and maximum revenue is assumed in the 6th year for S2 and in the 11th year for S3.
The cash flow includes a public incentive, namely “Bonus Verde” (Green Bonus), currently in effect in Italy (law no. 205/2017 and law no. 178/2020). This incentive supports owners or holders of a residential property who want to transform the outdoor spaces of their home into gardens and consists of a tax deduction of 36% on a maximum expenditure of EUR 5000 per property unit (or EUR 1800 max), which is divided into 10 annual installments. In the case study, the Green Bonus can only be applied to homeowner expenses and not to the total cost (Table 6).
The cost of garden planting (Table 7) and the cash flows were recalculated on the basis of the sharing of costs and revenues (Table 3) for the following stakeholders directly involved in the project:
  • The municipality, as owner of public land;
  • Households that own residential units and related condominium areas (Figure 9a);
  • IACP, as owner of some housing units and condominium areas;
  • Tenants, as users of IACP housing units (Figure 9b).
Figure 10 shows the resulting NPVs of the three scenarios by stakeholder. All NPVs are negative, except the NPV of Scenario 3 for tenants, but only if the discount rate is less than 5.8%.
In order to achieve environmental sustainability goals, in Italy, there are currently public incentives to support energy retrofits of buildings, covering up to 110% of expenses as a tax deduction, as a discount on the invoice or as a tax credit (law no. 77/2020). For the purpose of the simulated calculation of economic feasibility, it was assumed that a similar incentive can also be applied to the implementation of green areas by including them in the list of eligible actions of energy retrofits of buildings.
This simulation was applied to the calculation of the NPV of households according to two types of repayment:
  • A 110% tax deduction of expenses over 5 years;
  • A 100% invoice discount, consisting of the immediate repayment of 100% of expenses as a discount on the invoice. The transfer of a tax credit to banks is very similar to this type of repayment, as it is equal to approximately 102% of expenses.
Figure 11 shows that in both cases, the NPVs are still negative for Scenarios 1 and 2, whereas the NPV of Scenario 3 is positive discount rates below the IRRs, i.e., 1.7% for the 110% tax deduction and 5.58% for the 100% invoice discount.

5. Discussion

The results of the performed analysis put in evidence that there are significant differences between the outcomes of the studies scenarios, depending on the type of vegetation. Outdoor temperature annual trend changes between the different scenarios influence the energy consumption of buildings in different ways. In particular, in reference to the climatic condition of the district and for all the considered scenarios, during the heating season, green areas cause an increase in energy consumption, although it is fully offset by the energy savings during the cooling season. According to the overall balance, the energy savings are very low for Scenarios 1 and 2, while Scenario 3, i.e., a garden with tall plants, provides significant savings for both HRB (−7.3%) and LRB (−3.4%) dwellings.
The financial analysis, in terms of costs and benefits cash flow, shows that investment in green areas as a passive energy measure is a not profitable for any stakeholder when the vegetation consists of turf and/or low plants (Scenarios 1 and 2). Scenario 3 is only cost-effective for tenants. The NPV is positive for the latter because they do not pay the planting costs but benefit from energy bill savings in excess of operating costs.
These results were expected because many studies have obtained a positive value by adding up all the benefits of green areas, such as the value of carbon storage, pollution removal, etc. For a public stakeholder, this result can be considered as a data to be integrated with other evaluations on social benefits. Kunsch and Parks [44] have argued that public authorities should implement green areas as a tool to remove environmental inequity, especially in the redevelopment of low-income districts, as in the case of the Cappuccinelli district.
Our case study is an example of mixed land and building tenure; therefore, to implement the project, it is crucial to engage private stakeholders and to seek conditions of financial feasibility. Public incentives in particular play an important role in achieving financial feasibility of energy retrofit interventions [37]. If incentives are assumed and equal to the planting cost, then economic feasibility in the management phase can also be achieved for homeowner households in fully operational Scenario 3, when the trees are fully grown, even without considering the other additional benefits.
Moreover, in order to achieve the global objectives of sustainability and CO2 reduction, in recent years, the EU and many national governments have granted incentives for energy retrofit measures that, in Italy, can equal up to 100% or even 110% of the expenditure, as mentioned in the previous section. If green areas are included among the energy-efficiency measures and an incentive equal to 100% of planting expenditure is granted, integrated climatic, energy and economic analysis can support the choice of investing in vegetation planting and management for private stakeholders, such as homeowner households and tenants.
Another significant result is that the type of incentive influences the degree of convenience of private stakeholders. This aspect should be considered by legislators when implementing incentive regulations if the goal is to achieve the greatest involvement of local communities. In the case study, two types of incentives were applied, i.e., a tax credit distributed over multiple years and an invoice discount. As a result, the former, Scenario 3 (Tax deduction), is cost effective if the investors have a very low expectation of profitability, whereas the latter, Scenario 3 (Invoice discount), achieves profitability because the IRR is higher than the opportunity cost of capital. If we consider investment in green areas as a long-term investment, although it is private, we could compare IRR to long-term investment rates, i.e., 1.7% or 3.0% (the 30-year yield of Italian government bonds as of October 2021 [57] and the performance target rate of the Social Housing Fund (FIA) of Italian Cassa Depositi e Prestiti [58], respectively). However, IRR is higher than the social time-preference rate (STPR), set at 3.5% by the Green Book and used by several companies in the assessment of tree value [59]. Although the variability of energy prices increases the investment risk rate, it depends on many different factors, the evolution of which is difficult to predict (e.g., national and international energy policies, production systems, alternative energy sources, etc.). However, a positive IRR is a good starting point for adding other monetary benefits (including an increase in the value of the property) in order to convince private investors to participate in the project. In addition, urban green areas provide multiple co-benefits, including monetary benefits, such as increased market price of real estate; qualitative benefits, such as aesthetics; and social and ecological benefits, the value of which may be adequate to justify the public and private expenditure for planting and maintenance.
In the management of complex issues, such as energy efficiency in urban areas, the integration of scientific knowledge and approaches of different disciplines is necessary and useful to correlate various factors, such as macro- and microclimatic conditions, technological characteristics of buildings, building typology, type of vegetation, land and building tenure, investment costs, operating costs and revenues and public incentives. Owing to its flexibility and to the possibility of adapting to different climatic conditions and building characteristics, the proposed integrated approach can also be applied in larger urban areas, i.e., at the sub-district, district, city and metropolitan level. Variation of the spatial scale affects the accuracy of the results due to a generally poorer precision of the input data and limited computational resources (computational costs).

6. Conclusions

The proposed approach includes a feasibility assessment for both public and private stakeholders participating in the financial support of urban green areas, considered a passive energy measure. The integrated methodology was applied to a representative case study of a Mediterranean coastal city to determine the optimal type of vegetation for a green area in order to achieve the greatest comfort and energy savings and to evaluate the cost-effective conditions for different stakeholders.
The results showed significant differences between the outcomes of the studied scenarios, depending on the type of vegetation used in the green areas, and put in evidence how economic feasibility for some stakeholders can be achieved in the management phase if adequate incentives equal to the planting cost are assumed. Such results are representative of the examined case study in terms of climatic conditions, size of the considered urban area and thermal characteristics of buildings.
Therefore, further research is needed and should be developed under different climate conditions, technological characteristics of buildings, public/private rate of land ownership, etc. Future research should also study the costs and benefits for each type of stakeholder and for larger urban areas, i.e., at the sub-district, district, city and metropolitan level. For example, operating costs can be reduced if the maintenance of the green area is outsourced to non-profits or volunteer associations in an attempt to directly involve local communities and residents. Hence, future research could analyze how funding tools used in other contexts could be applied in green-space projects and assess their implications for economic feasibility.
Such future research could support the decision-making process of private operators, as they can evaluate the advantages/disadvantages of investing in urban green-area projects and thus induce public institutions to promote appropriate policies, recognizing the role of green areas as a passive energy measure that deserves incentive funding.

Author Contributions

Conceptualization, G.N., R.C. and G.S.; formal analysis, S.B. and L.C.; methodology, G.N., R.C. and G.S. All authors have read and agreed to the published version of the manuscript.

Funding

This research received no external funding.

Institutional Review Board Statement

Not applicable.

Informed Consent Statement

Not applicable.

Acknowledgments

The authors thank Manfredi Leone for his valuable suggestions on vegetation selection.

Conflicts of Interest

The authors declare no conflict of interest.

References

  1. Roy, S.; Byrne, J.; Pickering, C. A systematic quantitative review of urban tree benefits, costs, and assessment methods across cities in different climatic zones. Urban For. Urban Green. 2012, 11, 351–363. [Google Scholar] [CrossRef]
  2. De Castro Neto, M.; Sarmento, P. Assessing Lisbon Trees’ Carbon Storage Quantity, Density, and Value Using Open Data and Allometric Equations. Information 2019, 10, 133. [Google Scholar] [CrossRef]
  3. McHale, M.R.; McPherson, E.G.; Burke, I.C. The potential of urban tree plantings to be cost effective in carbon credit markets. Urban For. Urban Green. 2007, 6, 49–60. [Google Scholar] [CrossRef]
  4. Simpson, J.R.; McPherson, E.G. Simulation of tree shade impacts on residential energy use for space conditioning in Sacramento. Atmos. Environ. 1998, 32, 69–74. [Google Scholar] [CrossRef]
  5. Pandit, R.; Laband, D.N. Energy savings from tree shade. Ecol. Econ. 2010, 69, 1324–1329. [Google Scholar] [CrossRef]
  6. Sabrin, S.; Karimi, M.; Nazari, R.; Pratt, J.; Bryk, J. Effects of Different Urban-Vegetation Morphology on the Canopy-level Thermal Comfort and the Cooling Benefits of Shade Trees: Case-study in Philadelphia. Sustain. Cities Soc. 2021, 66, 102684. [Google Scholar] [CrossRef]
  7. Santamouris, M. Energy and Climate in the Urban Built Environment, 1st ed.; Santamouris, M., Ed.; Routledge: London, UK, 2001. [Google Scholar] [CrossRef]
  8. Marando, F.; Heris, M.P.; Zulian, G.; Udías, A.; Mentaschi, L.; Chrysoulakis, N.; Parastatidis, D.; Maes, J. Urban heat island mitigation by green infrastructure in european functional urban areas. Sustain. Cities Soc. 2022, 77, 103564. [Google Scholar] [CrossRef]
  9. Horvathova, E.; Badura, T.; Duchkova, H. The value of the shading function of urban trees: A replacement cost approach. Urban For. Urban Green. 2021, 62, 127166. [Google Scholar] [CrossRef]
  10. Siriwardena, S.D.; Boyle, K.J.; Holmes, T.P.; Wisemand, P.E. The implicit value of tree cover in the U.S.: A meta-analysis of hedonic property value studies. Ecol. Econ. 2016, 128, 68–76. [Google Scholar] [CrossRef]
  11. Pandita, R.; Polyakov, M.; Tapsuwan, S.; Morand, T. The effect of street trees on property value in Perth, Western Australia. Landsc. Urban Plan. 2013, 110, 134–142. [Google Scholar] [CrossRef]
  12. Glaesener, M.L.; Caruso, G. Neighborhood green and services diversity effects on land prices: Evidence from a multilevel hedonic analysis in Luxembourg. Landsc. Urban Plan. 2015, 143, 100–111. [Google Scholar] [CrossRef]
  13. Łaszkiewicz, E.; Czembrowski, P.; Kronenberg, J. Can proximity to urban green spaces be considered a luxury? Classifying a non-tradable good with the use of hedonic pricing method. Ecol. Econ. 2019, 161, 237–247. [Google Scholar] [CrossRef]
  14. Taltavull de La Paz, P.; Perez-Sanchez, V.R.; Mora-Garcia, R.T.; Perez-Sanchez, J.C. Green Premium Evidence from Climatic Areas: A Case in Southern Europe, Alicante (Spain). Sustainability 2019, 11, 686. [Google Scholar] [CrossRef]
  15. Lin, J.; Wang, Q.; Li, X. Socioeconomic and spatial inequalities of street tree abundance, species diversity, and size structure in New York City. Landsc. Urban Plan. 2021, 206, 103992. [Google Scholar] [CrossRef]
  16. Greene, C.S.; Robinson, P.J.; Millward, A.A. Canopy of advantage: Who benefits most from city trees? J. Environ. Manag. 2018, 208, 24–35. [Google Scholar] [CrossRef]
  17. Lefebvre, H. Le Droit à la Ville; Anthropos: Paris, France, 1968. [Google Scholar]
  18. Harvey, D. The right to the city. New Left Review 2008, 53, 23–40. [Google Scholar] [CrossRef]
  19. European Commission. Commission Delegated Regulation (EU) No 244/2012 of 16 January 2012. Off. J. Eur. Union 2012, L. 81/18–L. 81/36. [Google Scholar]
  20. Cirrincione, L.; Gennusa, M.L.; Peri, G.; Rizzo, G.; Scaccianoce, G. Towards nearly zero energy and environmentally sustainable agritourisms: The effectiveness of the application of the European ecolabel brand. Appl. Sci. 2020, 10, 5741. [Google Scholar] [CrossRef]
  21. European Commission. A Clean Planet for all—A European Strategic Long-Term Vision for a Prosperous, Modern, Competitive and Climate Neutral Economy; Communication from the Commission to the European Parliament, the European Council, the Council, the European Economic and Social Committee, the Committee of the Regions and the European Investment Bank 2018, COM (2018) 773 Final; European Commission: Brussels, Belgium, 2018. [Google Scholar]
  22. International Energy Agency (IEA). 2019 Global Status Report for Buildings and Construction—Towards a Zero-Emission, Efficient and Resilient Buildings and Construction Sector—UN Environment Programme; International Energy Agency (IEA): Paris, France, 2019; ISBN 978-92-807-3768-4. [Google Scholar]
  23. International Energy Agency. CO2 Emissions from Fuel Combustion Highlights; International Energy Agency (IEA): Paris, France, 2019. [Google Scholar]
  24. Tsemekidi-Tzeiranaki, S.; Bertoldi, P.; Paci, D.; Castellazzi, L.; Serrenho, T.; Economidou, M.; Zangheri, P. Energy Consumption and Energy Efficiency Trends in the EU-28, 2000–2018; EUR 30328 EN; Publications Office of the European Union: Luxembourg, 2020. [Google Scholar]
  25. Agenzia Nazionale per le Nuove Tecnologie, l’Energia e lo Sviluppo Economico Sostenibile (ENEA). Rapporto Annuale Efficienza Energetica (RAEE) 2020; Agenzia Nazionale per le Nuove Tecnologie, l’Energia e lo Sviluppo Economico Sostenibile (ENEA): Rome, Italy, 2020; Available online: www.efficienzaenergetica.enea.it/component/jdownloads/?task=download.send&id=453&catid=40%20&Itemid=101 (accessed on 15 December 2021).
  26. Caputo, A. Emissioni Nazionali di Gas Serra: Indicatori di Efficienza e Decarbonizzazione Nei Principali Paesei Europei; ISPRA Rapporti 295/2918; ISPRA—Istituto Superiore per la Protezione e la Ricerca Ambientale: Rome, Italy, 2018; ISBN 978-88-448-0914-0. [Google Scholar]
  27. D’Alpaos, C.; Andreolli, F. Renewable Energy Communities: The challenge for new policy and regulatory frameworks design. In New Metropolitan Perspectives. NMP 2020. Smart Innovation, Systems and Technologies, 1st ed.; Bevilacqua, C., Calabrò, F., Della Spina, L., Eds.; Springer: Cham, Switzerland, 2021; Volume 178, pp. 500–509. [Google Scholar] [CrossRef]
  28. Barbaro, S.; Napoli, G. The financial costs in energy efficient district. alternative scenarios from the demo sites of the CITyFiED program. In Computational Science and Its Applications–ICCSA 2021, 1st ed.; Gervasi, O., Murgante, B., Misra, S., Garau, C., Blečić, I., Taniaret, D., Eds.; Springer: Cham, Switzerland, 2021; Volume 12954, pp. 93–108. [Google Scholar] [CrossRef]
  29. Napoli, G.; Barbaro, S.; Giuffrida, S.; Trovato, M.R. The European Green Deal: New Challenges for the Economic Feasibility of Energy Retrofit at District Scale. In New Metropolitan Perspectives. NMP 2020. Smart Innovation, Systems and Technologies, 1st ed.; Bevilacqua, C., Calabrò, F., Della Spina, L., Eds.; Springer: Cham, Switzerland, 2021; Volume 178, pp. 1248–1258. [Google Scholar] [CrossRef]
  30. Cirrincione, L.; Marvuglia, A.; Scaccianoce, G. Assessing the effectiveness of green roofs in enhancing the energy and indoor comfort resilience of urban buildings to climate change: Methodology proposal and application. Build. Environ. 2021, 205, 108198. [Google Scholar] [CrossRef]
  31. Shafique, M.; Kim, R.L.; Rafiq, M. Green roof benefits, opportunities and challenges—A review. Renew. Sustain. Energy Rev. 2018, 90, 757–773. [Google Scholar] [CrossRef]
  32. Francis, L.F.M.; Jensen, M.B. Benefits of green roofs: A systematic review of the evidence for three ecosystem services. Urban For. Urban Green. 2017, 28, 167–176. [Google Scholar] [CrossRef]
  33. Cirrincione, L.; Gennusa, M.L.; Marino, C.; Nucara, A.; Marvuglia, A.; Peri, G. Passive components for reducing environmental impacts of buildings: Analysis of an experimental green roof. In Proceedings of the 2020 IEEE 20th Mediterranean Electrotechnical Conference (MELECON), Palermo, Italy, 16–18 June 2020; Volume 9140546, pp. 494–499. [Google Scholar] [CrossRef]
  34. Cirrincione, L.; Peri, G. Covering the gap for an effective energy and environmental design of green roofs: Contributions from experimental and modelling researches. In Rethinking Sustainability Towards a Regenerative Economy. Future City; Andreucci, M.B., Marvuglia, A., Baltov, M., Hansen, P., Eds.; Springer: Cham, Switzerland, 2021; Volume 15. [Google Scholar] [CrossRef]
  35. Barthelmes, V.M.; Becchio, C.; Bottero, M.; Corgnati, S.P. Cost-optimal analysis for the definition of energy design strategies: The case of a Nearly-Zero Energy Building. Valori Valutazioni 2016, 21, 61–76. [Google Scholar]
  36. Napoli, G.; Mamì, A.; Barbaro, S.; Lupo, S. Scenarios of climatic resilience, economic feasibility and environmental sustainability for the refurbishment of the early 20th century buildings. In Values and Functions for Future Cities, Green Energy and Technology, 1st ed.; Mondini, G., Stanghellini, S., Oppio, A., Bottero, M., Abastante, F., Eds.; Springer: Cham, Switzerland, 2020; pp. 89–115. [Google Scholar]
  37. Napoli, G.; Gabrielli, L.; Barbaro, S. The efficiency of the incentives for the public buildings’ energy retrofit. The case of the Italian Regions of the “Objective Convergence”. Valori Valutazioni 2017, 18, 25–39. [Google Scholar]
  38. Bottero, M.; D’Alpaos, C.; Dell’Anna, F. Boosting investments in buildings energy retrofit: The role of incentives. In New Metropolitan Perspectives. ISHT 2018. Smart Innovation, Systems and Technologies, 1st ed.; Calabrò, F., Della Spina, L., Bevilacqua, C., Eds.; Springer: Cham, Switzerland, 2019; Volume 101, pp. 593–600. [Google Scholar] [CrossRef]
  39. Abastante, F.; Lami, I.M.; Lombardi, P. An Integrated Participative Spatial Decision Support System for Smart Energy Urban Scenarios: A Financial and Economic Approach. Buildings 2017, 7, 103. [Google Scholar] [CrossRef]
  40. Lombardi, P.; Abastante, F.; Torabi Moghadam, S.; Toniolo, J. Multicriteria Spatial Decision Support Systems for Future Urban Energy Retrofitting Scenarios. Sustainability 2017, 9, 1252. [Google Scholar] [CrossRef]
  41. Napoli, G.; Bottero, M.; Ciulla, G.; Dell’Anna, F.; Figueira, J.R.; Greco, S. Supporting public decision process in buildings energy retrofitting operations: The application of a Multiple Criteria Decision Aiding model to a case study in Southern Italy. Sustain. Cities Soc. 2020, 60, 102214. [Google Scholar] [CrossRef]
  42. Fahmy, M.; Sharples, S.; Yahiya, M. LAI based trees selection for mid latitude urban developments: A microclimatic study in Cairo, Egypt. Build. Environ. 2010, 45, 345–357. [Google Scholar] [CrossRef]
  43. Soares, A.L.; Rego, F.C.; McPherson, E.G.; Simpson, J.R.; Peper, P.J.; Xiao, Q. Benefits and costs of street trees in Lisbon, Portugal. Urban For. Urban Green. 2011, 10, 69–78. [Google Scholar] [CrossRef]
  44. Kunsch, A.; Parks, R. Tree Planting Cost-Benefit Analysis: A Case Study for Urban Forest Equity in Los Angeles; Chen, Y., Gonez, M., Eds.; TreePeople: Beverly Hills, CA, USA, 2021; Available online: https://www.treepeople.org/wp-content/uploads/2021/07/tree-planting-cost-benefit-analysis-a-case-study-for-urban-forest-equity-in-los-angeles.pdf (accessed on 1 February 2021).
  45. ISTAT. Popolazione Residente al 1° Gennaio 2021. Available online: https://www.istat.it/it (accessed on 3 December 2021).
  46. Napoli, G.; Giuffrida, S.; Trovato, M.R. Efficiency versus Fairness in the Management of Public Housing Assets in Palermo (Italy). Sustainability 2019, 11, 1199. [Google Scholar] [CrossRef]
  47. Corrao, R. Conoscere per valorizzare e rigenerare: Il progetto di Michele Valori per il quartiere Cappuccinelli a Trapani (1957–1963). In Patrimonio in Divenire. Conoscere, Valorizzare, Abitare, Proceedings of the VII Convegno Internazionale ReUSO, Matera, Italy, 23–26 October 2019; Conte, A., Guida, A., Eds.; Gangemi Editore International: Rome, Italy, 2019; pp. 1451–1462. [Google Scholar]
  48. Ministero della Transizione Ecologica. Adattamento Climatico. Available online: https://www.mite.gov.it/pagina/adattamento-climatico (accessed on 27 December 2021).
  49. Corrao, R. Il quartiere Cappuccinelli a Trapani: Per un intervento di retrofit sostenibile attraverso l’uso della vegetazione. In Edilizia Circolare, 1st ed.; Cuboni, F., Desogus, G., Quaquero, E., Eds.; Edicom Edizioni: Monfalcone, Italy, 2018; pp. 906–917. [Google Scholar]
  50. Corrao, R. The vegetation for mitigating the microclimate and designing livable and healthy public spaces in Palermo City Centre. In Urbanistica Informazioni, Proceedings of the 11th INU Study Day—Interruptions, Intersections, Sharing and Overlappings. New perspectives for the Territory, Napoli, Italy, 14 December 2018; Moccia, F.D., Sepe, M., Eds.; INU Edizioni: Rome, Italy, 2018; pp. 29–36. [Google Scholar]
  51. Calabrò, E.; Della Corte, C.; Raveduto, I. Retrofit e Sostenibilità. Influenza della Vegetazione sul Microclima Urbano e Ricadute Sul Comfort delle Diverse Tipologie di Alloggi nel Quartiere Cappuccinelli a Trapani. Master’s Thesis, University of Palermo, Palermo, Italy, 2013. [Google Scholar]
  52. Corrao, R. La vegetazione per la rigenerazione della città: Possibili scenari a Palermo. In Palermo Città delle Culture. Contributi per la Valorizzazione di Luoghi e Architetture, 1st ed.; Fatta, G., Ed.; 40due Edizioni: Palermo, Italy, 2014; pp. 261–274. [Google Scholar]
  53. Pastore, L.; Corrao, R.; Kvols Heiselberg, P. The effects of vegetation on indoor thermal comfort: The application of a multi-scale simulation methodology on a residential neighbourhood renovation case study. Energy Build. 2017, 146, 1–11. [Google Scholar] [CrossRef]
  54. ENVI-met. Calculate the Microclimate of a City Down to the Square Metre. Available online: https://www.envi-met.com (accessed on 15 December 2021).
  55. Cirrincione, L.; Gennusa, M.L.; Peri, G.; Rizzo, G.; Scaccianoce, G.; Sorrentino, G.; Aprile, S. Green roofs as effective tools for improving the indoor comfort levels of buildings—An application to a case study in Sicily. Appl. Sci. 2020, 10, 893. [Google Scholar] [CrossRef]
  56. EnergyPlus. EnergyPlus. Available online: https://energyplus.net (accessed on 20 June 2021).
  57. Ministero dell’Economia e delle Finanze. BTP 30 Anni. Available online: http://www.dt.mef.gov.it/it/debito_pubblico/emissioni_titoli_di_stato_interni/risultati_aste/risultati_aste_btp_30_anni/index.html (accessed on 27 December 2021).
  58. Cassa Depositi e Prestiti. FIA Fondo Investimenti per L’abitare, Fund Characteristics and Purpose. Available online: https://www.cdpisgr.it/en/social-housing/FIA/fund-characteristics-and-purpose/fund-characteristics-and-purpose.html (accessed on 1 February 2021).
  59. GreenBlue Urban. Street Tree Cost Benefit Analysis, 2018; GreenBlue Urban: Robertsbridge, UK, 2018; Available online: https://www.treeconomics.co.uk/wp-content/uploads/2018/08/GBU_Street-Tree-Cost-Benefit-Analysis-2018.pdf (accessed on 1 February 2021).
Figure 1. Location of Trapani (Italy) (a) and of the case-study area in Cappuccinelli district (b).
Sustainability 14 02407 g001
Figure 2. The central square and building X (a); a private courtyard (b).
Sustainability 14 02407 g002
Figure 3. Housing (a) and land (b) tenures in the case-study area.
Sustainability 14 02407 g003
Figure 4. Scenario 0.
Sustainability 14 02407 g004
Figure 5. Scenarios S1, S2 and S3 and their discretization for ENVI-met software modelling.
Sustainability 14 02407 g005
Figure 6. Plans of the duplex apartment in court F: ground-floor (level 0) and first-floor (level 1) plans (a). Plan of the apartment in building X (b). Light green rooms represent living areas; dark green rooms represent sleeping areas.
Sustainability 14 02407 g006
Figure 7. Outdoor average daily air temperature trend for HRB (dwelling in building X) (a) and for LRB (duplex in court F) (b).
Sustainability 14 02407 g007
Figure 8. Thermal load, electrical consumption during heating and cooling seasons and total electrical consumption (heating + cooling) for HRB (a) and LRB (b) dwellings in the different scenarios.
Sustainability 14 02407 g008
Figure 9. Cash flows (without the cost of garden planting) for tenants (a) and households (b) in the different scenarios, in euros.
Sustainability 14 02407 g009
Figure 10. NPVs of the scenarios by stakeholder.
Sustainability 14 02407 g010
Figure 11. Households: NPVs of Scenarios 1, 2 and 3 by type of repayment.
Sustainability 14 02407 g011
Table 1. Thermo-physical properties of the envelope components.
Envelope ComponentTypologyThickness (m)Thermal Transmittance (W/m2K)Internal Heat Capacity (kJ/m2K)Solar Heat Gain Coefficient
External wallsopaque0.392.092459-
Windowsglazed0.0045.871-0.871
Table 2. Internal heat gains.
Internal Heat Gain ElementUnitAdopted Value
People Person/m20.035
Equipment W/m23
Ventilation 1/hour0.3
Heating: set-point temperature°C20
Cooling: set-point temperature °C27
Table 3. Percentage of costs and revenues of the implementation of a green area by type of tenure.
Costs and RevenuesLandownersTenantsTotal
MunicipalityCondominium
IACPHouseholds
Initial investment (garden planting cost)76.9%8.3%14.8%-100%
Operating costs (grass cutting, leaf collection, tree trimming, etc.)76.9%-14.8%8.3%100%
Operating revenues (energy bill savings due to passive retrofit)--64.1%35.9%100%
Operating revenues (public incentives)--100%-100%
Table 4. Maximum variation of outdoor air temperature in reference to Scenario 0.
ScenarioMaximum Variation of Outdoor Air Temperature (°C)
Cooling SeasonsHeating Seasons
S1−0.79−0.45
S2−0.98−0.48
S3−2.23−1.51
Table 5. Electrical energy savings for HRB and LRB dwellings in the different scenarios in reference to S0.
ScenarioEnergy Savings
HRBLRB
Heating
(kWh/m2)
Cooling
(kWh/m2)
Total
(kWh/m2)
Total
(%)
Heating
(kWh/m2)
Cooling
(kWh/m2)
Total
(kWh/m2)
Total
(%)
S10.60−0.87−0.27−1.3%1.44−1.310.130.5%
S20.70−1.08−0.38−1.8%1.48−1.65−0.17−0.6%
S31.82−3.35−1.53−7.3%3.18−4.17−0.99−3.4%
Table 6. Total cash flows in the different scenarios.
Years01–56–1111–25
Garden planting, EUR−346,740
Operating costs, EUR −4800−4800−4800
S1Energy bill savings, EUR −195−195−195
Green Bonus, EUR 18461846
Cash Flow, EUR−346,740−3150−3150−4995
Garden planting, EUR−357,740
Operating costs, EUR −4800−8400−8400
S2Energy bill savings, EUR −195694694
Green Bonus, EUR 19041904
Cash Flow EUR−357,740−3091−5802−7706
Garden planting, EUR−358,440
Operating costs, EUR −4800−8400−8400
S3Energy bill savings, EUR −1956943626
Green Bonus, EUR 19081908
Cash Flow, EUR−358,440−3087−5798−4774
Table 7. Costs of garden planting by stakeholder and by scenario.
ScenarioLandownersTenantsTotal
MunicipalityCondominium

EUR
IACP
EUR
Households
EUR

EUR

EUR
1266,76651,26528,709-346,740
2275,22952,89229,619-357,740
3275,76852,99529,677-358,440
Publisher’s Note: MDPI stays neutral with regard to jurisdictional claims in published maps and institutional affiliations.

