Article

Analytical Procedures for the Evaluation of Infrastructural Measures for Increasing the Capacity of Railway Lines

Department of Railway Transport, Faculty of Operation and Economics of Transport and Communications, University of Žilina, 01026 Žilina, Slovakia
*
Author to whom correspondence should be addressed.
Sustainability 2022, 14(21), 14430; https://0-doi-org.brum.beds.ac.uk/10.3390/su142114430
Submission received: 14 July 2022 / Revised: 21 October 2022 / Accepted: 31 October 2022 / Published: 3 November 2022
(This article belongs to the Special Issue Sustainable Operation and Maintenance of Railway Systems)

Abstract

:
The issues that determine the capacity of railway infrastructure are topical in situations that are reaching operating limits. According to the objectives of the European transport policy, it is assumed that up to 30% of road freight over 300 km should shift to other modes such as rail or waterborne transport by 2030. The transport system should become more competitive and efficient in the use of resources. This places high demands on the railway infrastructure, which is mainly operated in a mixed transport mode, with both passengers and freight. It is necessary to increase the capacity of these lines as a priority. The intent of this paper is to propose procedures that will simply and accurately determine the quantification of benefits for increasing the throughput performance of the line. For the initial estimates and assessments of investment measures, it is advantageous to use analytical methods to determine the throughput performance. The methodological approach for determining the throughput performance in the anticipated timetable and case study were approximated on the example of the rail freight corridor marked “Amber” that passes through Slovakia. Analytical procedures have been proposed according to the methodology used on the railways of Slovakia, and the quality issues were assessed using a new approach for determining the optimal and critical throughput performance. The mentioned procedures are advantageous for assessing infrastructural measures from the point of view of a railway infrastructure manager.

1. Introduction

The transport policy of the European Union (EU) aims to achieve a reduction of 60% in GHG emission by 2050; the transport system should become more competitive and efficient in its use of resources. To achieve this, more than 30% of road freight over 300 kilometres should be shifted to other modes such as rail or waterborne transport by 2030, and more than 50% should be shifted by 2050, facilitated by efficient and green freight corridors [1].
The EU supports the development of rail freight corridors (RFCs). There are nine established RFCs focused on offering quality customer-oriented rail freight services with improved capacity and harmonised technical standards [2,3]. The RFCs reinforce the cooperation among infrastructure managers to increase the efficiency of cross-border traffic. Passenger and freight transport must use the same railway infrastructure, often interfering and putting pressure on the different schedules. Currently, passenger trains, even when delayed, still receive priority over freight trains, which negatively impacts the necessary flexibility and efficiency. Optimising the use of railway infrastructure is a complex and difficult task of railway infrastructure management [4]. Therefore, numerous capacity studies are being performed to investigate what part of extra traffic can be absorbed by the existing infrastructure and how much investment will be required for new infrastructure [5]. The results of these studies must be rapid and precise to know how many train paths can be offered to railway operators and how much railway traffic can be supported by the current network [6]. These studies must also provide regional and national authorities as well as owners of the infrastructure with information that proves the investment in the development of the rail network to be necessary and financially worthwhile. Based on the analysis of the operational and technical parameters of the infrastructure, it is possible to determine the factors that influence the use of the railway line by planned traffic flow [7]. The running time, planned and unplanned waiting time, and buffer time are decisive. Knowing these factors will enable infrastructure managers to take measures and, ultimately, will create a long-term strategy that will achieve the desired use of infrastructure capacity [8,9]. The main purpose of optimising the scope of railway infrastructure capacity is to adapt the technical parameters of railway infrastructure to the expected traffic flow and to clearly define and establish its capacity [10,11].
The aim of this research is to propose procedures that will simply and accurately determine the quantification of benefits for increasing the throughput performance of the line. For initial estimates and assessments of investment measures, it is advantageous to use analytical methods to determine the throughput performance. There is a need to research the qualitative factors of capacity indicators.
The subject of the case study is the RFC marked “Amber”, which connects the Mediterranean region with central Poland. This corridor has lines with longer single-track sections, meaning a lack of capacity. The methodological approach for determining the throughput performance in the anticipated timetable and the case study are approximated on a restrictive section of this north-south RFC corridor. The focus is a single-track section Kysak–Prešov, which is extremely busy with passenger and freight traffic. Figure 1 shows the network of corridors in the “Amber” RFC, which is related to the assessed track. Several variants of infrastructural measures were explored in this study to increase the capacity.

2. Literature Overview

In railway transport, in the case of some railway infrastructure managers, it is customary to refer to the capacity as the line throughput performance; sometimes, the abbreviated term line throughput is also used [12]. The throughput performance of rail freight corridors is described and analysed in the study by Kontaxi and Ricci [13]. The different techniques for capacity calculation are divided into three main categories: synthetic, analytical, and analogical. The methodology of Railways of the Slovak Republic (introduced in Internal Regulation D24 [14]) develops three approaches to determine the throughput performance—graphical, analytical, and a combination of both. Comparisons, analyses, and research with proposals for innovations of this methodology have been presented in both teaching books [12,15,16] as well in several scientific studies [17,18,19,20,21]. In order to determine the meaning limit of the relationship between the definition of capacity and throughput, the study by Gašparík and Šulko [12] proposed a modified definition of capacity in the following wording: “The capacity of the railway infrastructure is determined by the number of train paths that can be planned in a certain time window on a certain part of the railway infrastructure, given the heterogeneity of the train types and the required quality of train traffic”.
The capacity of the main railway lines as well as the analysis of methodologies for its calculation are solved in research [18] that focuses on the analytical determination of the practical capacity of main tracks and the issue of the required capacity. The studies describe and compare the methodology for calculating the throughput capacity under national and international conditions. The consequences of crisis situations on railway infrastructure were often observed to lead to a significant reduction in its throughput or a disruption of its traffic flows.
The capacity of the railway infrastructure is expressed by the number of train paths in a specific sequence of individual train types on a defined line section of the infrastructure for a certain time window; furthermore, it reflects the requirements for achieving the required quality of the transport process [19,20]. Capacity is therefore the usable throughput performance within the sequence of train routes. The term “timetable robustness” is also used, which refers to the ability to not increase, or reduce, the initial delay.
When examining and determining the capacity options in general and with respect to the railway infrastructure, it is necessary to consider the operating conditions. Even if the operation will mostly take place under stochastic conditions, it cannot be ruled out that the operating conditions will be deterministic on a certain track section [22,23]. The calculated throughput performance of individual technical devices is the basis for the assessment of a series of connected devices (cascade of service systems). The resulting throughput performance of a continuous sequence of several technical devices, e.g., entrance tracks as service lines in the establishment station, several stations and their connecting interstation or track sections, we may refer to it as the operational performance [24,25].
To assess investment measures in the railway infrastructure, the capacity of the railway infrastructure is evaluated using different methodologies, but most often using simulation procedures. The outcome of the simulation provides recommendations for future modifications of the infrastructure layout. For example, the International Union of Railways (abbreviated UIC) published its recommended methodology [26], which is based on the graphic principle and prefers simulation procedures for the determination the degree of capacity utilisation.
The technical and mathematical bases for the calculation of the permeable performance of railway transport are proposed in [27], which were used in the creation of a simulation program for the optimal organisation of railway operational work after the disruption of their operation. The relation between basic operational indicators has been researched by using the developed stochastic mesoscopic simulation model [28]. A railway infrastructure capacity assessment via computer simulation method was performed in paper [29] where the paper discussed the tools and possibilities for line segments selection to obtain proper spatial segments for improving the capacity using more advanced systems.
Railway control systems in operation were addressed in [30,31]. The dependencies of railway infrastructure capacity were described in [17], with testing being conducted via a computer-based simulation model, which provided results for further research on the issue. Two hypotheses oriented towards researching the linear dependence of capacity on the number of train paths as well as the need for the capacity estimation of a whole track or for only one block section were tested. An efficiency of increasing the track speed using the OpenTrack simulation tool was presented in [32,33]; there was an emphasis on the operation capacity of rail freight corridors because of the mixed traffic, i.e., passengers and freight. The authors described the configuration of railway infrastructure elements that may have a potential impact on the capacity. Subsequently, indicators were proposed that could be used to detect possible changes in capacity due to train operation. In the last phase, the authors implemented several simulation scenarios in the OpenTrack software. Another set of OpenTrack simulations was also described in [34,35] as well as in similar research studies on railway simulations and modelling transport routes in rail transport [36,37]. Industry 4.0 has an impact on the modernisation of railway infrastructure. Industry 4.0 technologies have been widely used in the railway industry, which have been mainly focused on the maintenance and control tasks that are necessary in railway infrastructure [38]. The compilation of the periodic train timetable in rail passenger transport is a new evolving trend that increases the efficiency of rail transport. For focused research on the operational reliability of a railway line operated by a periodic timetable, refer to [39]. The authors of [40] offered one way to contribute to this area, and thus raised and improved this method of organising rail transport. The authors proposed a methodology that evaluates the level of stability of periodic train traffic diagrams based on operational and infrastructural factors. The methodology identifies operational–infrastructural factors that affect the stability and reliability of periodic train traffic diagrams.
The aim of [41] was the optimisation of distance between stops. The authors of [42,43] aimed to discover what track speed is effective in terms of shortening the travel time, traction energy consumption, and other operational indicators.
Assessing the impact of railway modernisation on the socio-economic regional development is described in [44].

3. Materials and Methods

The main purpose of optimising the scope of the railway infrastructure capacity is to adapt the technical parameters of the railway infrastructure to the expected traffic flow and to clearly define and establish its capacity [45]. The goal of capacity analysis is to determine the maximum number of trains that would be able to operate on a given railway infrastructure, during a specific time interval and given the operational conditions. Numerous approaches and tools have been developed to address this problem, and they have been based on traffic patterns [46], single-track analytical models [47], or algebraic approaches [48].
The different techniques and methodologies for calculating the capacity can be divided into three main categories according to the used methodology, compiled data, and level of detail. They are, according to [49]:
  • Synthetic: these methods use deterministic expressions, i.e., the variables contained in these cannot change their state and assume fixed values during the reference time. From the mathematical point of view, they are equations where the unknown quantities are mutually independent, and they are also called static;
  • Analytical: these methods use probabilistic expressions; from the mathematical point of view, they are equations where the unknown quantities are mutually dependent, and they are also called dynamic;
  • Analogical: these methods can be further divided into asynchronous methods (which covers methods that provide the optimisation of one or more variables) and synchronous methods (traffic simulation); for example, the optimisation methods are based on procedures that look for the minimisation of delays in mixed-speed traffic as well as on simulation methods that represent the evolution of advanced research and are often used to validate the results of other methods.
The use of the analytical method appears in-line for the scope of high-level analyses that identify the most appropriate infrastructure layouts and signalling systems to adopt in a long-term perspective, independently upon a specific timetable structure.
The capacity of a line is defined as the number of scheduled trains that can run on the line in the reference time. Key elements that have a direct influence on the value of the capacity are [50]:
  • Geometrical configuration of the track;
  • Line and station layout;
  • Features of signalling systems;
  • Movement rules and corresponding minimum distance between trains;
  • Operation and maintenance planning.
In this research, we adapted the solution according to the Slovak infrastructure management rules and the regulations to determine the permeability of railway lines (Regulation “D24”: designation of the infrastructure manager), which use an analytical method [14]. We present the basic principles of this methodology of determining the practical throughput performance here; subsequently, we propose an improved view of evaluating the results of the quality of duty operation performance.
To determine the throughput performance in the perspective timetable, it is necessary to apply the following methodological procedure, which uses the principles of mathematical statistics and probability [15]. All of the calculations are performed for the boundary interstationary section that shows the lowest theoretical throughput. Trains are divided by category, where N is the total number of trains, i is a designation for a train type (Ex: express train; Reg: regional; Fr: freight running; Fc: freight commuter; Fex: freight express; Loc: locomotive) and Ni is the number of trains in individual categories (types); for example, NEx is the number of trains of type Ex. The probability of a train of a given type is then determined from the relationship [14]:
p ( i ) = N i N   [ - ]
where:
p(i) 
is the probability of the ith category train running [-];
Ni 
is the number of trains in the ith category [trains];
N 
is the number of all trains on the track section [trains].
To determine the characteristics of the perspective train traffic diagram, it is necessary to know not only the probability of the train running, but also the probability of running a given sequence of trains. The probability for running a specified train sequence is calculated according to this equation [12]:
p ( i , j ) = N i N N j N = N i N j N 2   [ - ]
where:
p(i,j) 
is the probability of running a sequence of trains of the ith and jth types [-];
Nj 
is the number of trains of the jth category [trains].
Probability is a relative quantity; therefore, instead of the probability of a sequence of trains, it is more appropriate to work with the frequency of their occurrence, which is determined according to the relationship [12]:
h ( i , j ) = p ( i , j ) N   [ trains ]
where:
h(i,j) 
is the frequency of occurrences of trains of the i-th and j-th types [number of occurrences].
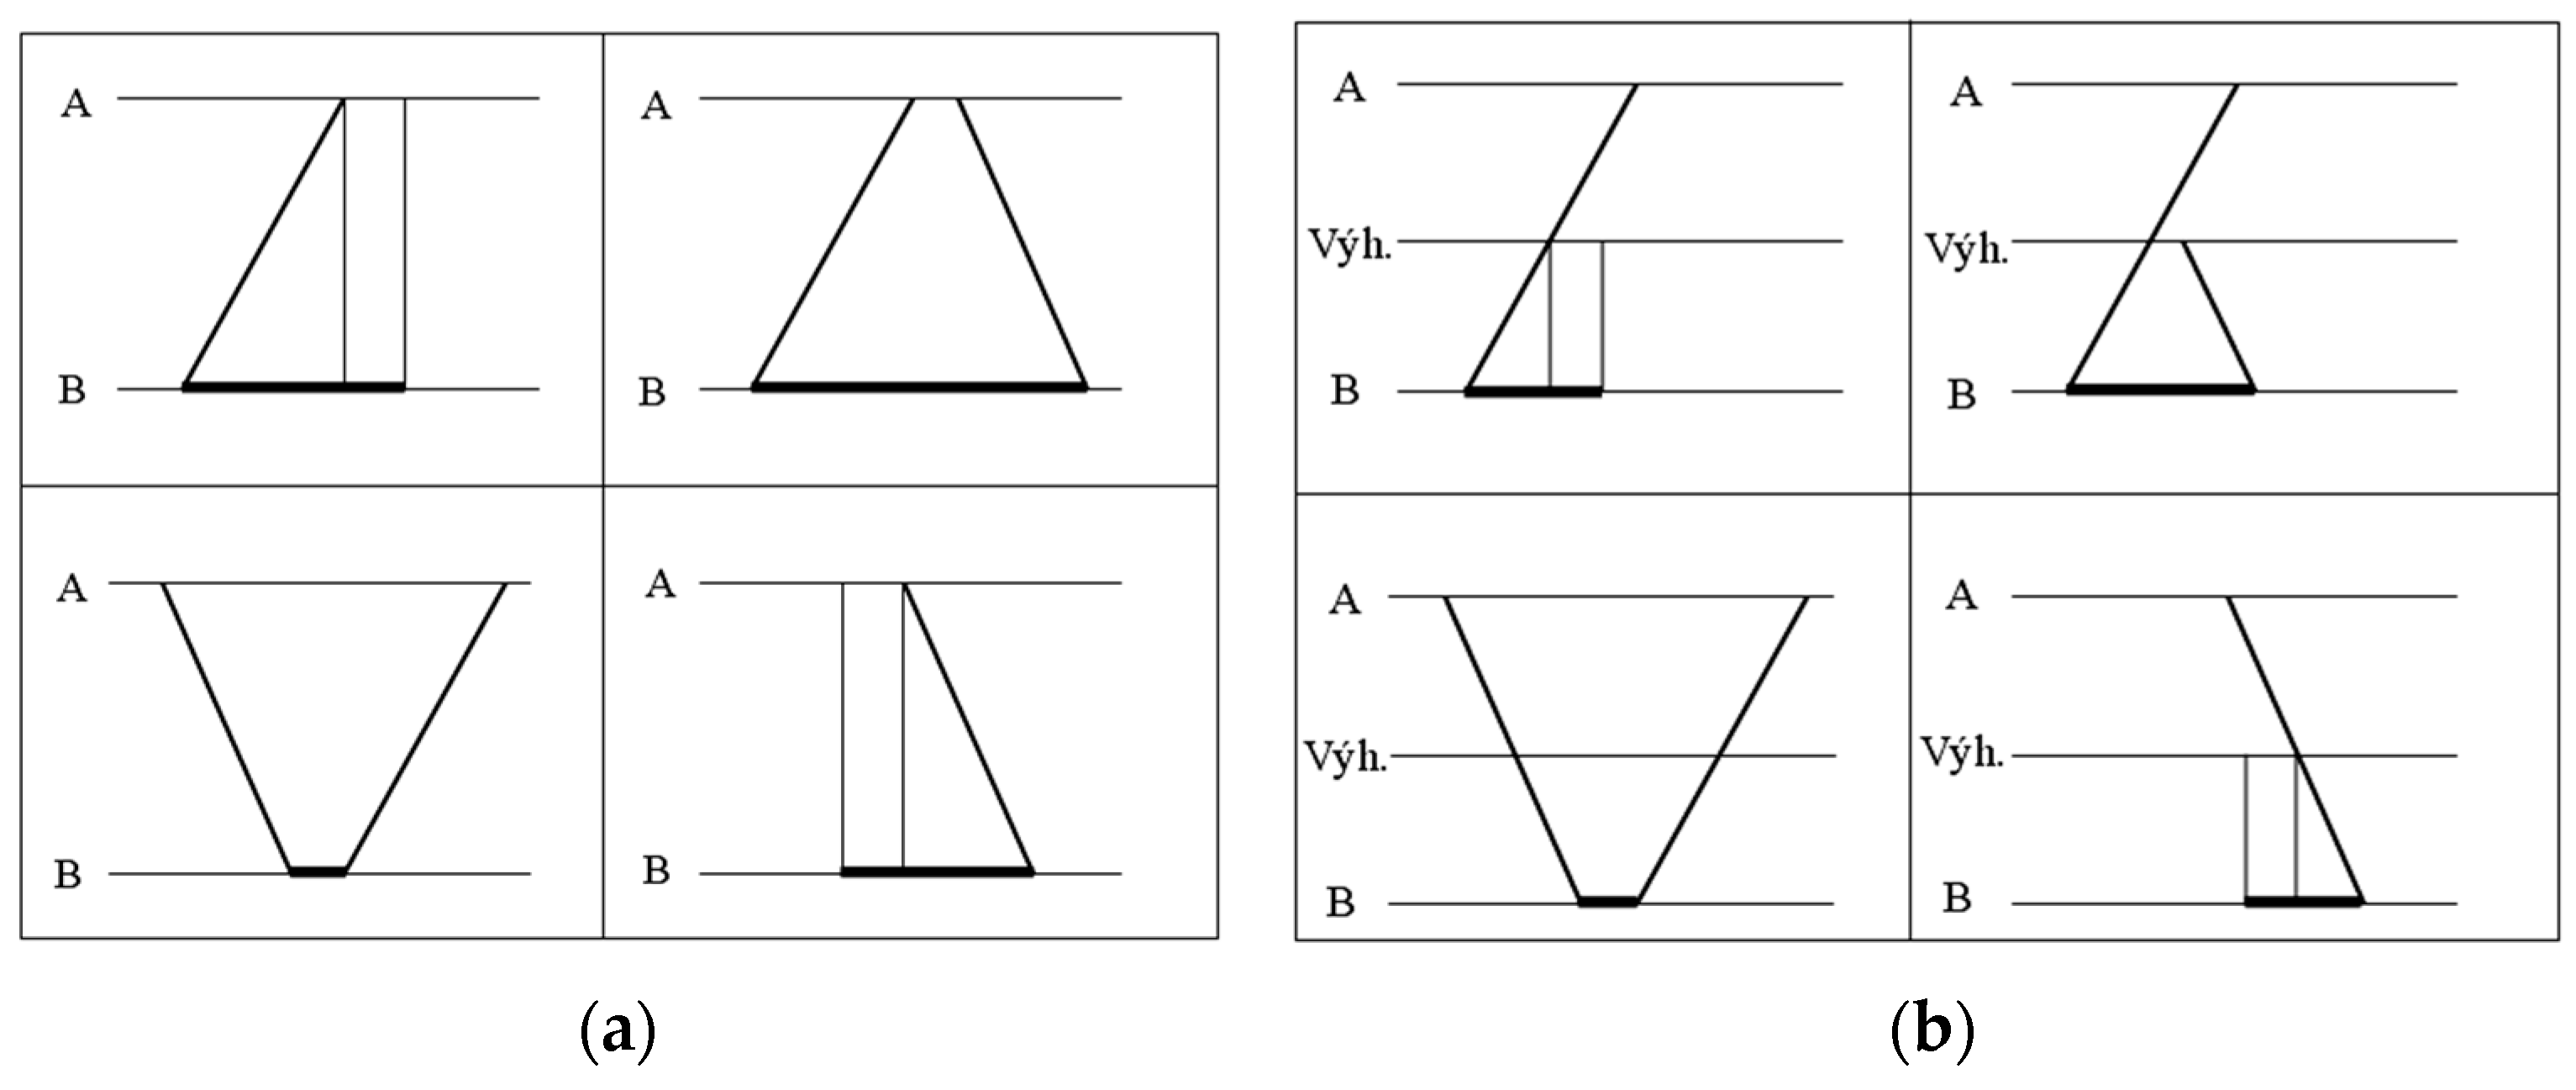
The basic approach is to determine the occupancy time for individual train sequences. They are calculated based on knowledge of running times, operating intervals, or subsequent intermediate times (see Figure 2).
The train sequences themselves need to be analysed for four options of train sequences (see Figure 2), while the occupancy time is usually related to one of the stations in the boundary section (usually the “lower” station) [15]:
  • The sequence of the first train is even, and the second train is also even (occupancy time is the headway time, i.e., the time period between the departure of the first train from station B and the departure of the second, subsequent train from station B; in variant (a), the first train must pass until station B, while in case (b), only until the first train passes the passing point);
  • The sequence of the first train is odd, and the second train is even (occupancy time is the sum of the running time of the odd and even trains and the station interval in the “upper” station, i.e., the time period between the departure of the first train from station B and the arrival of the second train in the opposite direction to station B; in variant (b), the second train crosses at the passing point, and therefore we calculate the travel times of the trains only after the switch and vice versa);
  • The sequence of the first train is even, and the second train is odd (the occupancy time is the station interval in the “lower” station, to which we refer the calculation of the occupancy time);
  • The sequence of the first even-numbered train, the second even-numbered train (occupancy time is the headway time at the “lower” station, i.e., the time period between the arrival of the first train to station B and the arrival of the second, subsequent train to station B; in variant (a), the second train must pass from station A, while in case (b), the second train must only pass from the passing point).
It is necessary to conduct an analysis of the occupancy times for all possible train sequences according to the types of trains, considering whether a train is passing through a given station. If the interstation section is divided into more block sections, in the cases of one-by-one train sequences, the headways must be calculated and must emphasise whether the first train is slower or faster. The beneficial effect of increasing the practical throughput of the interstation section by building a crossing point is shown in Figure 2b, which shows the analysis of the occupancy times of the interstation section after the construction of a new crossing point. The figure illustrates the shortening of the occupation times.
The total occupation time of the interstationary section of all trains Σ to (or To) is determined as the scalar product of the frequency table and table of the shortest occupation times, respectively, by compiling a table of total occupancy times of individual train sequences and the sum of their elements. The calculation table can be simplified by rounding the table of the number of sequences to whole numbers (according to common mathematical principles), but in such a way that the sum of the trains in the table remains the same.
In addition, null values can be omitted. In the case of a procedure based on the use of probability theory and mathematical statistics, the buffer time plays an important role.
Buffer time Tbr is calculated as a difference between the time window T and the total occupancy time To and time of permanent operations Ts, according to the formula [15]:
T b r = T T o T s   [ minutes ]
The determination of the practical throughput performance considers the need for the maintenance of the infrastructure, and the device is also used to carry out other operations than its primary use. The calculation includes necessary buffer time (to remove eventual disorders or irregularities in the transport operation). The practical throughput performance is determined according to the formula [14]:
n = T ( T v + T s ) t o + t b r   [ trains ]
where:
n 
is the practical throughput performance (capacity) [trains];
T 
is the time window [minutes];
Tv 
is the total time in which the operating device within the computing time is barred from operation due to prescribed inspections, repairs, and maintenance [minutes];
Ts 
is the total time of permanent manipulations, i.e., the time in which the operating device is occupied by other actions than those mentioned above [minutes];
to 
is the technological time of occupation for one train (calculated as an average train) [minutes];
tbr 
is the real average buffer time per train [minutes];
tbt 
is the needed buffer time per one train according to ŽSR methodology [minutes].
This applies for the evaluation of the throughput performance of the constructed train traffic diagram. For the assessment of the perspective train traffic diagram, the value of needed buffer time tbt is used instead of real average buffer time tbr in Equation (5). The condition for the feasibility of the train traffic diagram is: tbr > tbt. The qualitative factor is the infrastructure occupation rate So and the throughput utilisation coefficient Kp [15].
The determination of all required qualitative and quantitative indicators of practical throughput performance is shown in Table 1.
For the evaluation of the quality of traffic operation, the most important indicator is the infrastructure occupation rate in addition to the practical throughput, throughput performance utilisation, and waiting time. According to the ŽSR methodology, the critical value of occupation rate So = 0.67 was set [14,51]. If the critical value is exceeded, an insufficient capacity must be assumed, and the infrastructure is considered overloaded. However, this indicator does not account for the risk for the organisation of the traffic flow in terms of quality. Based on our own research [15,17,19,20,21,51], comparative studies, and the approach based on the knowledge of methodologies, we proposed to expand this indicator by the value of the optimal level of quality of throughput performance. This was determined with So = 0.40 based on the research and knowing the realisation of the planned timetable. We determined the degree of occupancy according to the previous methodology as a critical (limit) value. From the point of view of the quality of operation, it is necessary that the value of the relevant capacity indicator does not, in principle, exceed the set optimal value. If the value of this indicator is higher than the optimal value, there is a risk of insufficient quality. The graph in Figure 3 expresses the principal dependence of the range of traffic (number of train routes) and the level of quality.
As a rule, the capacity consumption is assessed in simulation procedures. When there is a lower occupancy, it can be assumed that the track line is not being sufficiently used. Table 2 explains the connections between the track occupancy rate, the relationship to the optimal and critical value of capacity indicators, and the expected quality level.

4. Capacity Results

The case study focused on the Slovak part of the “Amber” freight corridor, specifically on the busiest single-track line section Kysak–Prešov. The motivation for this study was to investigate the impact of infrastructure measures on the throughput performance of an important international freight corridor. There are bottlenecks on the line, and both passenger and freight traffic are operated in this section. The interstationary section Prešov–Drienovská Nová Ves is marked as A in this research. The Drienovská Nová Ves–Ličartovce track section is marked as B. This is a flat section between the Prešov railway station and the Drienovská Nová Ves railway station, which spans 8.395 kilometres between the stations (traffic offices) and 6.590 m between the entrance signals [52,53]. The current profile of the track has relatively large radios of arcs; originally during construction, it was designed for a line speed of 100 km/h [54].
Table 3 shows the quantitative and qualitative indicators of the practical throughput performance of the assessed track section after an analysis of the constructed timetable.
The determination of the current throughput performance was analysed in two interstationary sections:
  • Prešov–Drienovská Nová Ves.
  • Drienovská Nová Ves–Ličartovce.
  • The throughput performance was determined using the principles of the probability and mathematical statistics. The operating intervals were found from the train traffic 2021/2022 diagram of running trains, running times, and other input data [55]. The Prešov–Drienovská Nová Ves section was set as boundary according to the analysis of the running times of freight trains (see Table 4).
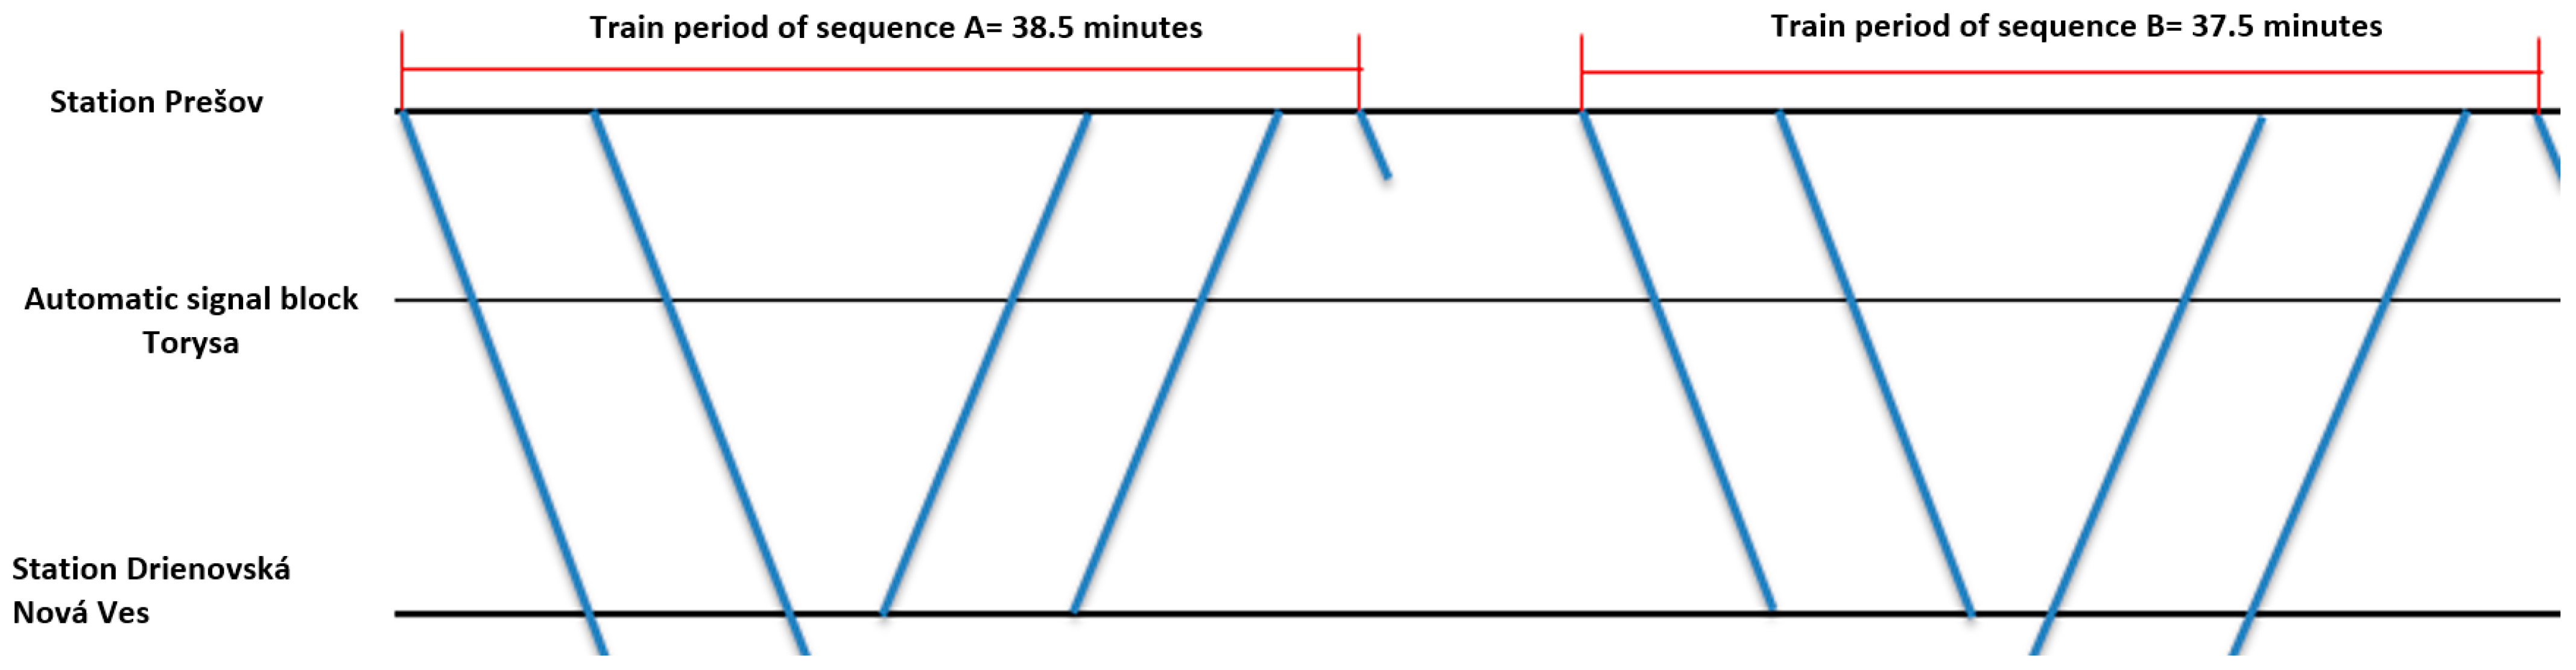
The automatic signal block Torysa divides this interstationary section into two block sections. This enables the bundling of trains. This traffic organisation is shown in Figure 4 where we define a traffic period for a train sequence. This is key for the occupancy time calculation. The results are shown in Table 5. For each sequence (combination) of train type (in this case, freight running trains), the table shows the unrounded frequency of the train sequence occurrence according to Equation (3); the rounded occurrence is given as the number of sequences, the unit occupancy time according to the analysis for each train sequence (see Figure 3 and Figure 4), and the total occupancy time for the given train sequence are rounded values. The result of the calculation is the total occupancy time of all trains.
The result from Table 5 is the total occupancy time; subsequently, we determined all required qualitative and quantitative indicators of the practical throughput performance (see Table 6). Because tbt < tbr, the train traffic diagram is feasible. The practical throughput performance is 118 trains per day.
The determination of the throughput performance of the current state of the Drienovská Nová Ves–Ličartovce track section:
  • We proceeded in the same way as in the previous determination for the Prešov–Drienovská Nová Ves track section. The sum of the lower right corners for the individual quadrants provides the total occupancy times of the quadrants, which are listed in Table 7.
Subsequently from Table 7, we determined all required qualitative and quantitative indicators of the practical throughput performance, which are shown in Table 8.

5. Capacity Measures

On the technological side of the elaboration of the given proposal, the applicability of variants to the train traffic diagram was assessed with respect to the compliance with the connections of the Prešov railway station, shortening dwell times as well travel times in this section, enabling feasibility of the periodic train traffic diagram (for the future integrated transport system), and reducing the transmission of delays during the crossing and turnover of trains.

5.1. Proposals of Prešov–Drienovská Nová Ves Track Section

5.1.1. A1—Increasing the Track Speed up to 120/110 km/h While Maintaining the Original Track Profile

In this proposal, the original track speed of 80 km/h would be increased by increasing the current cant in arcs. Specifically, from the 8.896 to 14.955 line-kilometre mark at a speed of 120 km/h and from the 14.955 to 15.558 line-kilometre mark at a speed of 110 km/h. During the implementation, it would be necessary to adjust the platforms at the Kendice railway stop and Haniska pri Prešove railway stop to suit the new geometric position of the track. It would also be necessary to modify the approach sections of seven level crossings devices located in the interstation section. As the line speed increases, the stopping distance changes from 700 m to 1000 m. This will result in the need to relocate the foresignal.
Table 9 provides information on the radius of the individual arcs, the current cant of the rails, the required cant for the relevant speed according to the STN 73 6360-1 standard, and the lack of cant at the proposed speed [56].
Cant p in millimetres is the actual cant between the rails. The lack of cant I at maximum speed allows for values of up to 100 mm and a maximum of 130 mm with the consent of the Railway Building Authority. It is also necessary to consider the excess cant E for slow trains, where it is certain that they will travel at a significantly lower speed (for example, a stop, running around an entrance signal, etc.).
Determination of cant deficiency [56]:
I = 11.8 V 2 r p   [ mm ; km / h ; m ; mm ]
Determination of the excess cant [56]:
E = p 11.8 V 2 r   [ mm ; km / h ; m ]
For tracks with mixed operation, the recommended cant according to the STN 73 6360-1 standard should be designed in the curve for speeds up to 120 km/h inclusive according to the formula [56]:
p d 1 = 7.1 V 2 r   [ mm ; km / h ; m ]
where:
V2 
is the lowest speed of a group of regular slowest trains;
r 
is the arc radius;
p 
is the track elevation.
In arc number 5 at the proposed speed of 110 km/h and cant p = 128 mm, there will be a lack of cant of I = 130 mm. At a speed of 77 km/h, the cant excess is E = 1.7 mm, and at a speed of 40 km/h, the cant excess is E = 94 mm.
By reducing the track speed to 100 km/h, it would be possible to reduce the p to 90 mm. This would mean that at a speed of 100 km/h, there will be a cant deficiency of I = 123 mm, and at a speed of 65 km/h, there will be a cant excess of E = 0.001 mm; at a speed of 40 km/h, there will be a cant excess of E = 56 mm.
The determination of the throughput performance for proposal A1 is performed according to the occupancy time calculation for this proposal within the new set operating intervals, as well as travel times. The calculation of To is shown in Table 10.
From Table 10, we subsequently determine all required qualitative and quantitative indicators of the practical throughput performance, which are shown in the Table 11. Because tbt < tbr, the train traffic diagram is feasible.

5.1.2. A2—Construction of a New Passing Point Instead of Automatic Signal Block Torysa

Replacing the automatic signal block Torysa with a new passing point is possible in two places; it is possible either in Haniska pri Prešove railway station or just behind it, at the level of automatic signal block Torysa in the direction of Kysak. In both variants, the problem is the numerous crossing levels and the short distances between them.
If the passing point was in the stop area, there would be two frequented crossings. There is enough space where it could be replaced by a road underpass or overpass; for example, a level crossing with a 3Z-type safety device at the 13.595 line-kilometre mark which crosses the road II. The class can be replaced by a road underpass due to spatial conditions. The proposed situation is shown in Figure 5.
Determination of the throughput performance for proposal A2 is calculated on the found of occupancy time for this proposal, which is shown in Table 12 and Table 13. Because tbt < tbr, the proposed train traffic diagram is feasible.

5.1.3. A3—Partial Double-Tracking of the Prešov—Automatic Signal Block Torysa Track Section

A partial double track building in this section would be possible from the Prešov railway station up to the automatic signal block Torysa. The level crossing at the line 13.223 line-kilometre mark across the I. class road would be replaced by a road underpass, such as in proposal A2. The design is shown in Figure 6.
This proposal includes the removal of the current block signal So at the 13.183 line-kilometre mark and the block signal Lo at the 13.248 line-kilometre mark. Three new block signals would be built, with So at 12.000 km and 1Lo and 3Lo at 12.200 km along the line, respectively. All three would depend on the activity of the crossing at the 12.007 line-kilometre mark, which crosses a purpose-built road. Due to the space conditions, the current platform at Haniska pri Prešove railway station would be removed. New platforms would be built on the opposite side of the current track and next to the new track, as pictured in Figure 6.
A switch would be placed between the section lights. The type of switch used will depend on the track speed to avoid excessive deceleration of the trains when running over the switch. For a speed of 80 km/h, a switch of 1:14–760 would be suitable; for a speed of 120 km/h, a switch of 1:18.5–1200 (speed to a turn of 100 km/h) or 1:26.5–2500 would be with a moveable point frog. The modification of the Prešov railway station for proposal A3 is shown in Figure 7.
The development of switches would also be modified at Prešov railway station. A new 1S entrance signal would be built, and the current S entrance signal would be renamed 3S. Manipulation track 1a would be rebuilt into a transport track and extended towards Haniska pri Prešove railway station. This situation changes the occupancy time due to the changed operational intervals at Prešov station, and at all crossing intervals, we consider 1.5 min.
The determination of occupancy time for this proposal is shown in Table 14, and the calculation of practical throughput and its quantitative indicators is shown in Table 15. The proposed traffic volume is feasible, as tbt < tbr.

5.1.4. A4—Partial Double-Tracking of the Automatic Signal Block Torysa—Drienovská Nová Ves Track Section

A partial double-tracking of the section would be situated between the current location of automatic signal block Torysa at 13.212 km down the line and at Drienovská Nová Ves railway station. The section would be 4.384 km long. As in proposal A2 and A3, crossing the 1st class road at the 13.223 line-kilometre mark would be replaced by a road underpass.
The current block signal Lo of Drienovská Nová Ves railway station would remain, and So would be dismantled and placed to the right of the new track on the right as 3So. New 1So and 3So section lights would be built instead of the current So sign at 13.183 km. In the opposite direction, the Lo signal would remain. New platforms would be built at Kendice railway station instead of the current one. As in variant A3, a switch would be placed between the compartment lights. The type of switch used will depend on the track speed. The partial double-track of the section is shown in Figure 8.
At the Drienovská Nová Ves railway station, the development of switches would be modified. The proposed station layout is shown in Figure 9.
Determination of throughput performance for proposal A4 is conducted according to the occupancy time calculation for this proposal shown in Table 16.
The qualitative and quantitative indicators of practical throughput performance are shown in the Table 17. The proposed traffic volume is feasible, as tbr < tbr.

5.1.5. A5—Complete Doubling of Prešov–Drienovská Nová Ves Track Section

The complete double-tracking of the line section is a combination of the A3 and A4 proposals. The Prešov railway station would be modified in the same way as in proposal A3 (Figure 5). Drienovská Nová Ves railway station would be modified in the same way as in proposal A4 (Figure 7).
With a complete double-track line, the Kendice and Haniska pri Prešove railway stations would be rebuilt, and a road underpass would be built instead of the level crossing device at the 13.223 line-kilometre mark. The proposal layout is shown in Figure 10.
The determination of occupancy time for this proposal is in Table 18. It is necessary to set the occupancy times for sequences of trains to only appear in a row (even–even, odd–odd). The calculation of line throughput is developed for each track line separately (even direction, odd direction). The results are listed in the Table 19.

5.2. Proposal of Drienovská Nová Ves–Ličartovce Track Section

This track section “B” is the shortest section in a given part of the track line. The current profile of the track is on the flat section, with sufficiently large radii of arcs. At the beginning of the arc with a radius of only 405 m, there is a level crossing with a first-class road. Another arc with a small radius of 378 m is located just in front of the remote-controlled passing point Ličartovce.

5.2.1. B1—Increase in Track Speed up to 90/100 km/h in the Old Track Profile

In this proposal, there would be a slight increase in the original track speed of 80 km/h by adjusting the cant in arcs and at three points by changing their radius. Specifically, from 4.914 km to 5.376 km, the original track speed would remain 80 km/h; from 5.376 km to 6.478 km and from 6.842 km to 8.007 km, there would be an increase to 100 km/h. Between 6.478 km and 6.842 km, the speed would increase to 90 km/h.
Table 20, which displays the individual arcs, shows their radii, current cant of the rails, required cant for the respective speed according to the STN 73 6360-1 standard, and lack of cant at the proposed speed.
The determination of the throughput performance for proposal B1 is calculated on the grounds of occupancy time (see Table 21).
Subsequently from Table 21, we determined all required qualitative and quantitative indicators of the practical throughput performance, which are shown in Table 22. The proposed traffic volume is feasible, as tbr < tbr.

5.2.2. B2—Complete Double-Tracking of the Drienovská Nová Ves–Ličartovce Track Section

The completion of a double racking section creates a need for the Drienovská Nová Ves station to be rebuilt. The new layout of the station is shown in Figure 11.
The development of switches is adjusted at the passing point Ličartovce, and the handling track 3a is rebuilt into a transport one. The situation with other changes is shown in Figure 12.
The determination of the occupancy time for this proposal is in Table 23. As with proposal A3 and A4, it is necessary to determine the entrance interval at the remotely controlled passing point Ličartovce, where it was calculated for 2 min.
Subsequently from Table 23, we determined all required qualitative and quantitative indicators of practical throughput performance, which are shown in the Table 24. The proposed traffic volume is feasible, whereas tbr < tbr.

5.2.3. Determination of the Throughput Performance for Combination of Speed-Increasing Proposals

In Table 25, the individual qualitative and quantitative indicators of practical throughput performance are determined from the respective determination occupancy time. For comparison, the tables also show proposal A1 and B1. At the same time, the degree of occupancy was evaluated as a qualitative level.

6. Discussion

In the research, we analysed the capacity of the narrow gate of the freight corridor track. The chosen analytical method is suitable for determining the prospective throughput performance. The case study focused on the Slovak part of the “Amber” freight corridor, specifically on the single-track section Kysak–Prešov. We obtained eight variants.
The main benefit of proposal A1 and B1 is the shortening of train running times. The running time between Prešov railway station and Ličartovce railway station will be reduced from the current 16 min to 13 min in both directions in the express train type (Ex). For passenger regional trains (Re), the reduction is from 22 min to 17 min. For freight running trains (Fr) in the direction from Prešov to Ličartovce, the reduction is from 20 min to 17 min, and it is from 20.5 to 19 min in the opposite direction. This difference is due to the height track slope of 15‰. Shortening the travel times will significantly increase the current throughput performance. In the Prešov–Drienovská Nová Ves track section, the current 118 trains per day would increase to 146 trains per day. In the Drienovská Nová Ves–Ličartovce track section, the current 144 trains per day would increase to 156 trains per day.
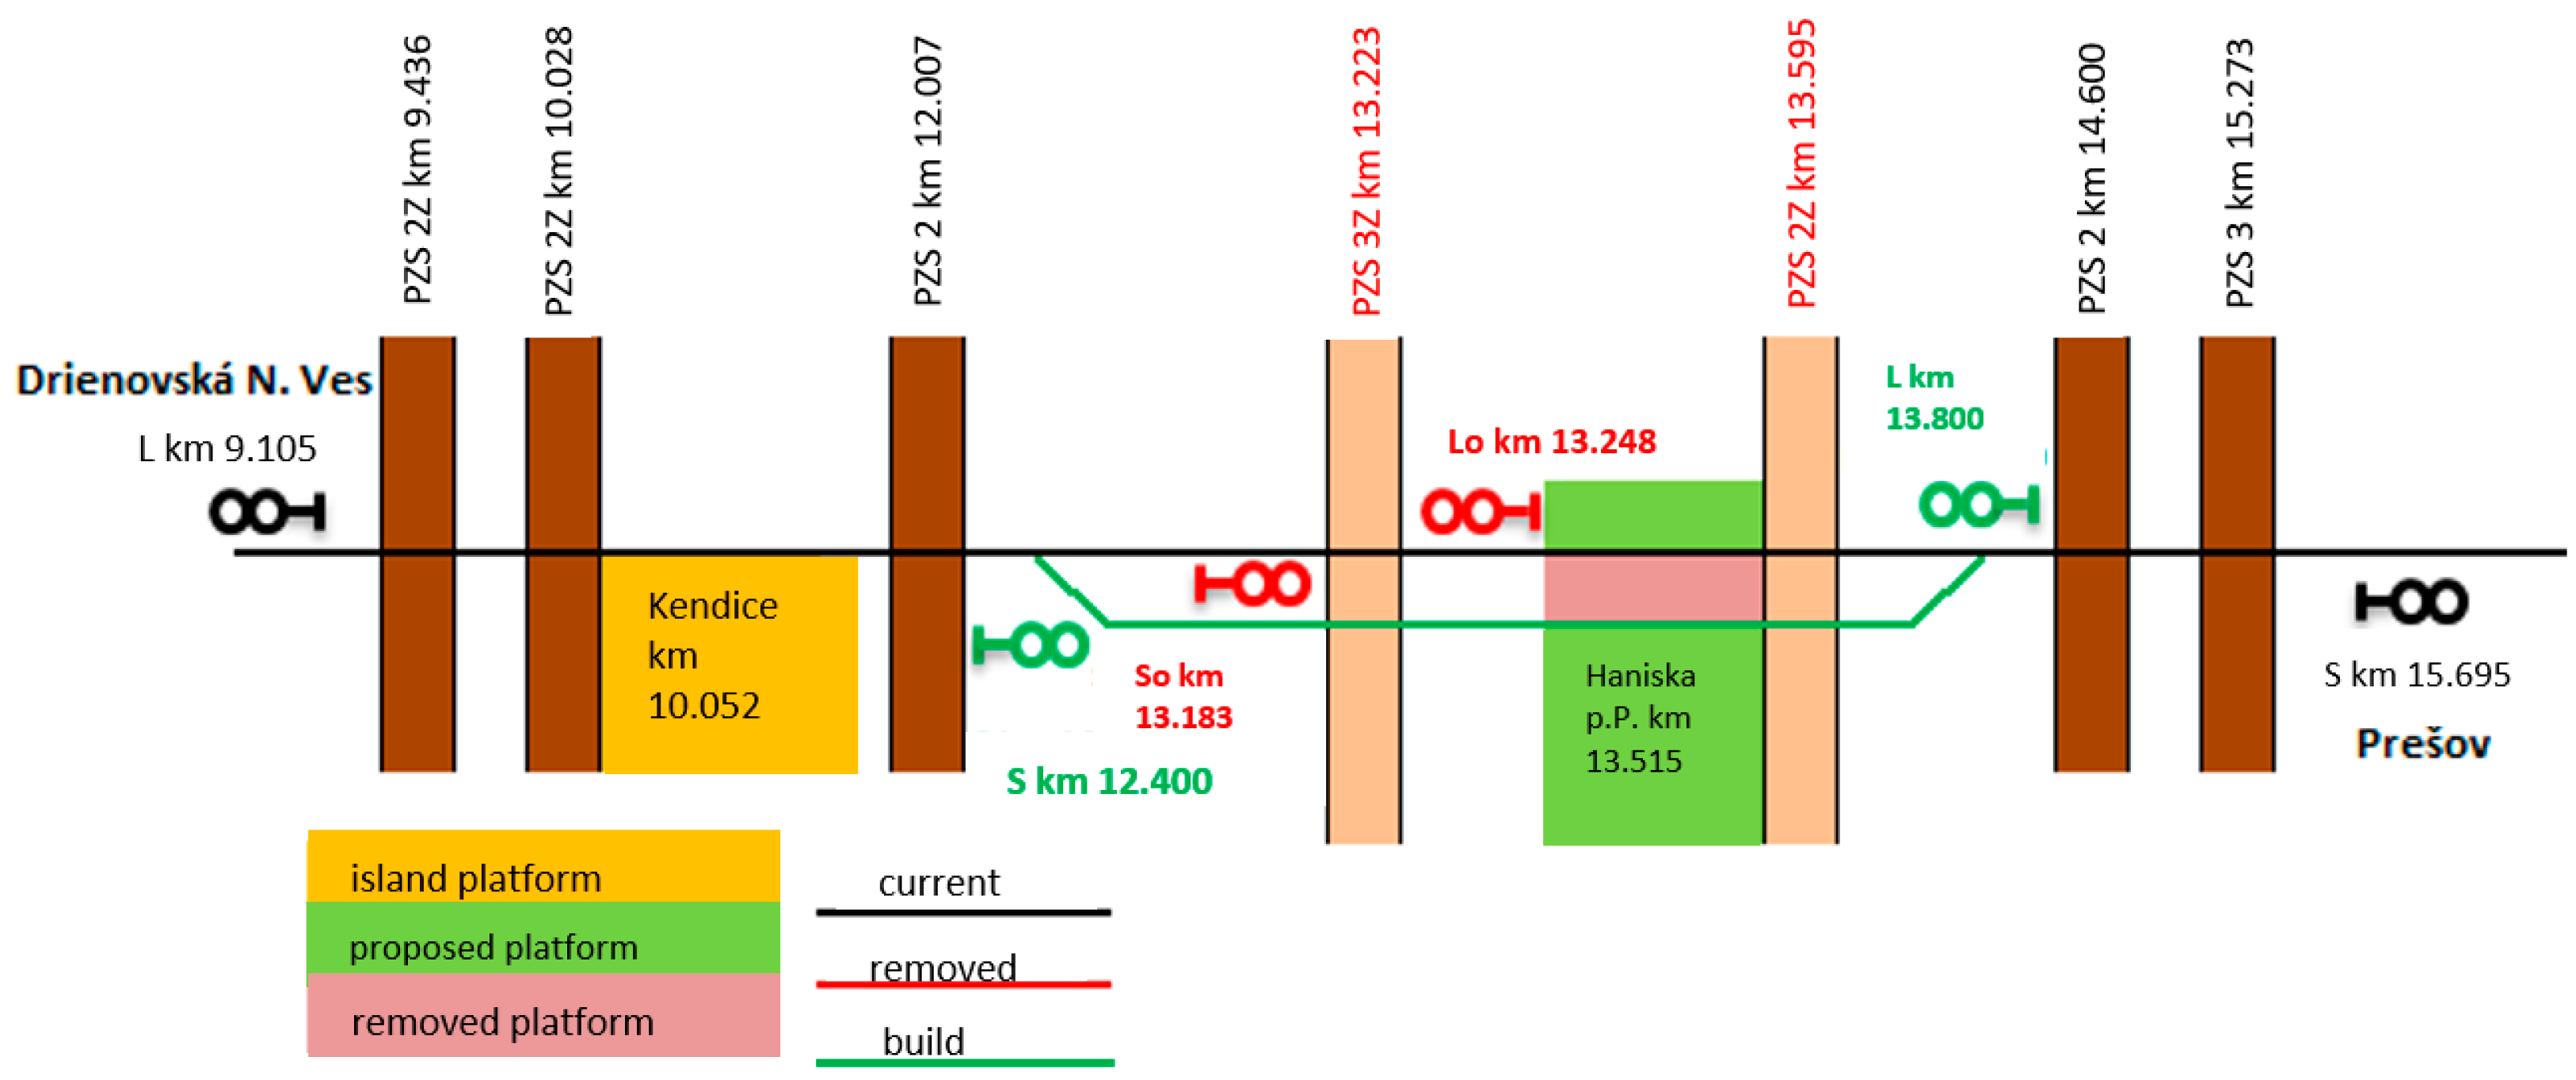
The construction of a new passing point instead of the automatic signal block Torysa at Haniska pri Prešove would have a positive impact on the capacity of the track. The significant disadvantage is the level crossing with the first and second class roads. For the construction of the passing point to be possible at all, a minimum level crossing with a first-class road must be built. From the point of view of transport organisation, it is necessary to modify the station safety device in the Prešov railway station, from which this passing point would be controlled. In addition, it would be necessary to have the exchanges heated on all switches in the passing point because of the weather in the winter. The advantage of building the passing point is the increase in the practical throughput from 134 trains per day to 165 trains per day. In addition, it would be much easier to transport freight trains during the day in the peak hours. Furthermore, if built, the noise would significantly increase due to the crossing of trains, especially freight transport.
The advantages of a partial double-track section at the Prešov railway station–automatic signal block Torysa section is the increase in the practical capacity of up to 198 trains per day and a significant reduction in the transmission of delays on passenger trains. Compared with the passing point, the impact of noise at the crossing would be significantly lower, as in most cases there would be a crossing on the track and not in the village. Another advantage is that there is a railway stop on the double-track section, which reduces operating intervals for passenger trains. Compared with proposal A4, the investment costs associated with the development of switches adjustment would be lower, as the track would be connected to the original loading track 1a. The disadvantage is the need to build an extra-level crossing with a first-class road at 13.223 km to remove the original platform of the Haniska pri Prešove railway stop and to build new platforms for both tracks. Another disadvantage is that the Kendice railway stop is located on a single-track section.
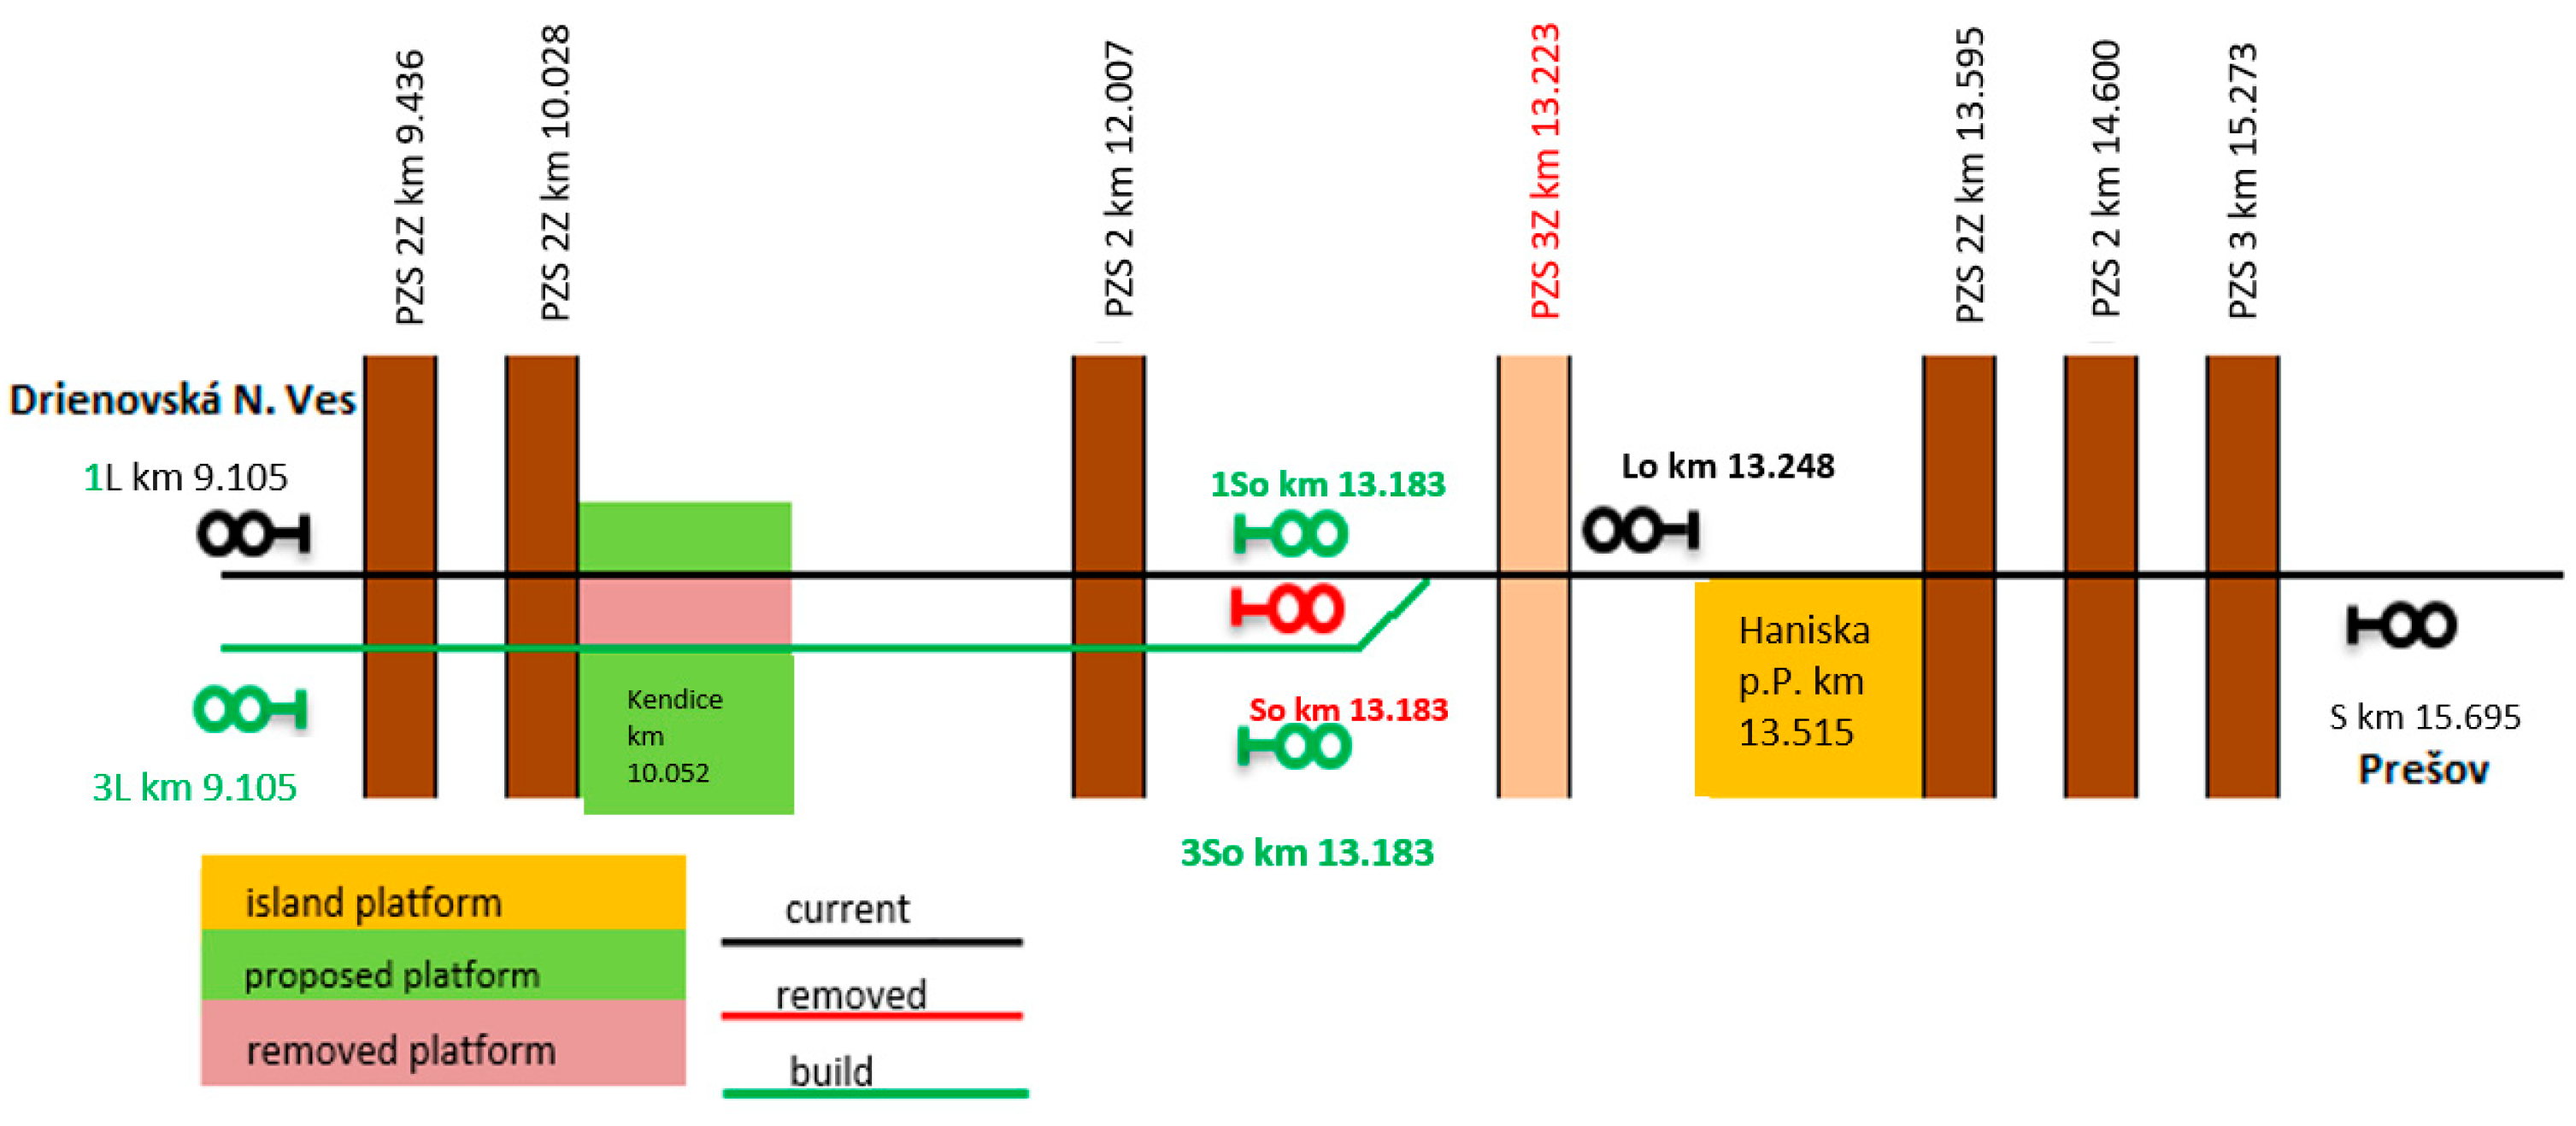
A partial double-tracking of the automatic signal block Torysa–Drienovská Nová Ves railway station section is similar to proposal A3. The practical throughput performance would increase to 201 trains per day. Compared with proposal A3, there would be less noise in the village during a possible crossing at the end of the double-track section. The advantage is the reduction of the transmission of delays between passenger trains, but this is smaller than in the case of proposal A3. The disadvantage is that Haniska pri Prešove railway stop is on a single-track section and the level crossing must be removed and replaced by the under-passing road. From the point of view of the capacity of the track section, the complete double-tracking of the Prešov–Drienovská Nová Ves track section is the best option. This proposal would increase the capacity of the line to up to 183 trains per day for the even direction and up to 178 trains per day for the odd direction. Compared with the crossing point and partial doubling of the track sections, there would be no increase in travel times nor an increase in the occupancy of approach sections due to train crossings. The disadvantage is the higher area of land required, the need to rebuild the railway stations, and the reconstruction of the head and modification of the station safety system in the nearby stations. From the point of view of investment costs, this is the most expensive solution.
It would also help to trace freight trains that have a crossing problem at the remote-controlled Ličartovce crossing point, which is located on a large slope of 12–13‰; this together with the arc reducing the effect of traction makes it significantly difficult for heavy and long freight trains to start. As in proposal A5, the double-track section allows for the maintaining of single-track operation in the case of closure. This is a significant benefit compared with the current situation, as alternative bus transport must be introduced in the Ličartovce–Drienovská Nová Ves track section due to space conditions. Buses will not enter the remote pass Ličartovce. To further increase the track speed in the Drienovská Nová Ves-Prešov track section, it would be possible to adjust the crossing of passenger trains in the Prešov–Lipany track section and to extend short turnovers in Lipany. In terms of the practical throughput, despite the doubling of the Drienovská Nová–Ličartovce track section, the throughput in the Ličartovce–Drienovská Nová Ves track section would not increase. It would also be necessary to build a level crossing instead of a crossing at 6.773 km, which is crossed by a first-class road.
We used analytical procedures to determine the practical throughput performance in the anticipated timetable. We received results for the specified range of traffic, to which we applied the new proposed classification from the point of view of the quality of operation. The correctness of setting the occupation rate limit So = 0.40 for the optimal throughput level was confirmed. The issue for discussion is the setting of the critical value. According to the Railways of the Slovak Republic, whose methodology used So = 0.67, this level can be evaluated as appropriately set. It is possible to discuss the harmonisation of this level with the UIC methodology which is mainly intended for simulation procedures, where the limit level of capacity utilisation is set at 60%. If we set So = 0.60, then we would evaluate variant A1 as unfeasible. Considering the several research scenarios carried out including the one presented, and the knowledge of the authors, we recommend keeping the critical value of the degree of occupancy So = 0.67 for analytical procedures.
We have confirmed that:
  • The use of the analytical approach is very useful for the identification of the most appropriate infrastructure layouts and signalling systems to adopt in a long-term perspective, independently upon a specific timetable structure;
  • The implementation of a simulation model is necessary for in-depth analyses aiming at the optimisation of the use of the capacity and timetable structure itself.

7. Conclusions

Rail transport must be coordinated at all management levels and is determined by technological processes. The main process is the planning of the transport volume and infrastructure configuration. When examining and determining the capacity of the railway line, it is necessary to consider the operating dimensions.
This paper introduces a method for determining the practical throughput performance in the anticipated train traffic diagram using probability calculus and mathematical statistics. The part of the “Amber” EU freight corridor which makes a bottleneck at the Prešov–Ličartovce track section on the Slovak part of the corridor on the Plaveč–Kysak–Košice line was divided into two parts for the purpose of determining the practical throughput performance. The paper contains the determination of the capacity of the line section regarding the current state and provides an overview of several proposals for increasing the capacity of the Prešov–Ličartovce track section. Each proposal contains a description of the determination of the throughput performance of this line, and tables with individual determinations and figures illustrate how the individual proposals would be implemented.
The travel time would be reduced to 33 min from Prešov to Košice. After the planned modernisation of the Kysak–Košice line section, the travel time would be reduced to less than half an hour. The advantage is that the delays are simultaneously transmitted at peak times at the intersection of express trains, and the presence of regional trains would be reduced at peak hours between Prešov railway station and Ličartovce railway station. Due to the increase in the track speed, it is necessary to modify several parts of the railway infrastructure, namely:
  • Platforms at the Haniska pri Prešove, Kendice, and Drienovská Nová Ves stops and stations;
  • Relocate the block signals in the Prešov–Drienovská Nová Ves track section to optimise the length of the block sections;
  • Modify the approach sections of level crossings signalling between Prešov and the Obišovce railway stop;
  • By changing the cant in the arc, it would be necessary to adjust the level crossing at 6.773 km through the first-class road.
The modernisation of this track section with the application of individual proposals is of international importance and has an impact on the capacity of the railway corridor.
Nevertheless, further developments of the research should include a larger testing phase to systematically check the sensibility of the results to various timetable structures and to different signalling systems, e.g., according to the various European Rail Traffic Management System (ERTMS) levels. The optimisation and simulation methods must be adapted to each application environment [49]. The three levels represent a general methodology for capacity management, where the first level represents a preliminary solution and the second level obtains a desired train schedule, which is validated by simulation software (as the third level). Therefore, the current trend is to develop tools with an integrated methodology that embed analytical, optimisation, and simulation approaches [58].

Author Contributions

J.G. and V.Z. conceptualised and designed the research methodology; J.M. and Z.B. performed the resources, calculation, and investigation of the data; J.M. and Z.B. performed the writing—review and editing; V.Z. supervised the project; J.G. performed project administration and funding acquisition. All authors have read and agreed to the published version of the manuscript.

Funding

This work was supported by the Slovak Research and Development Agency under Contract no. APVV-19-0444.

Institutional Review Board Statement

Not applicable.

Informed Consent Statement

Informed consent was obtained from all subjects involved in the study.

Data Availability Statement

The study did not report any specific data.

Conflicts of Interest

The authors declare no conflict of interest.

References

  1. European Commission. White Paper Roadmap to a Single European Transport Area—Towards a Competitive and Resource Efficient Transport System. 2011. Available online: https://eur-lex.europa.eu/legal-content/EN/TXT/PDF/?uri=CELEX:52011DC0144&from=SK (accessed on 20 June 2022).
  2. European Union. Regulation (EU) No 913/2010 of the European Parliament and of the Council of 22 September 2010 Concerning a European Rail Network for Competitive Freight. 2010. Available online: https://eur-lex.europa.eu/legal-content/EN/TXT/PDF/?uri=CELEX:32010R0913&from=EN (accessed on 20 June 2022).
  3. RFC. Rail Freight Corridor—Corridor Information Document, 2022 Timetable Year. 2019. Available online: https://rfc-amber.eu/assets/downloads/corridor_information_document/CID_common_texts_2022%20Amber%20RFC.pdf (accessed on 20 June 2022).
  4. Pachl, J.; White, T. Analytical Capacity Management with Blocking Times. In Proceedings of the 83rd Annual Meeting Transportation Research Board, Braunschweig, Germany, 11–15 January 2004. [Google Scholar] [CrossRef]
  5. Khadem Sameni, M.; Moradi, A. Railway capacity: A review of analysis methods. J. Rail Transp. Plan. Manag. 2022, 24, 100357. [Google Scholar] [CrossRef]
  6. Bešinović, N.; Goverde, R.M.P. Capacity assessment in railway networks. Handb. Optim. Railw. Ind. 2018, 268, 25–45. [Google Scholar] [CrossRef]
  7. Kendra, M.; Skrúcaný, T.; Grenčík, J.; Šulko, P. Impact of Railway Track Parameters on Energy Consumption and GHG Production of Passenegr Train Operation. In Proceedings of the 5th International Conference on Road and Rail Infrastructure, Zadar, Croatia, 17–19 May 2018. [Google Scholar] [CrossRef] [Green Version]
  8. Dedík, M.; Gašparík, J.; Záhumenská, Z.; Ľupták, V.; Hřebíček, Z. Proposal of the measures to increase the competitiveness of rail freight transport in the EU. Naše More 2018, 65, 202–207. [Google Scholar] [CrossRef]
  9. Pachl, J. Railway Signalling Principles; Technische Universität Braunschweig: Braunschweig, Germany, 2020; p. 83. [Google Scholar] [CrossRef]
  10. Parbo, J.; Nielsen, O.A.; Prato, C.G. Passenger perspectives in railway timetabling: A literature review. Transp. Rev. 2016, 36, 500–526. [Google Scholar] [CrossRef]
  11. Abril, M.; Barber, F.; Ingolotti, L.; Salido, M.A.; Tormos, P.; Lova, A. An assessment of railway capacity. Transp. Res. Part E: Logist. Transp. Rev. 2008, 44, 774–806. [Google Scholar] [CrossRef] [Green Version]
  12. Gašparík, J.; Šulko, P. Aspects of Utilization of Railway Infrastructure Capacity, 1st ed.; University of Žilina: Žilina, Slovakia, 2021; p. 128. (In Slovak) [Google Scholar]
  13. Kontaxi, E.; Ricci, S. Techniques and methodologies for carrying capacity evaluation: Comparative analysis and integration perspectives. Ing. Ferrov. 2009, 64, 1051–1080. [Google Scholar]
  14. ŽSR. D24. Regulation for Determining the Permeability of Railway Lines; Slovak Railways: Bratislava, Slovakia, 1965. (In Slovak) [Google Scholar]
  15. Gašparík, J.; Šulko, P. Railway Transport Technology—Line Transport Processes, 1st ed.; EDIS, University of Žilina: Žilina, Slovakia, 2015; p. 384. (In Slovak) [Google Scholar]
  16. Široký, J.; Gašparík, J.; Abramović, B.; Nachtigall, P. Transport Technology and Traffic Management; University of Pardubice: Pardubice, Czech Republic, 2018. [Google Scholar]
  17. Gašparík, J.; Abramović, B.; Zitrický, V. Research on dependences of railway infrastructure capacity. Teh. Vjesn. 2018, 25, 1190–1195. [Google Scholar] [CrossRef]
  18. Černá, L.; Ľupták, V.; Šulko, P.; Blaho, P. Capacity of main railway linesAnalysis of methodologies for its calculation. Naše More 2018, 65, 213–217. [Google Scholar] [CrossRef]
  19. Gašparík, J.; Zitrický, V.; L’upták, V.; Čechovič, L. Assessment of slovak rail capacity in terms of freight transport. Ing. Ferrov. 2020, 75, 105–119. [Google Scholar]
  20. Mašek, J.; Kendra, M.; Čamaj, J. Model of the transport capacity on the train and railway track based on used types of wagons. In Proceedings of the 20th International Conference Transport Means, Juodkrante, Lithuania, 5–7 October 2016; Available online: https://www.dropbox.com/s/hdrjt799ungrbug/Transport_means_2016.pdf?dl=0 (accessed on 1 July 2022).
  21. Gašparík, J.; Abramović, B.; Halás, M. New graphical approach to railway infrastructure capacity analysis. Promet-Traffic Transp. 2015, 27, 283–290. [Google Scholar] [CrossRef] [Green Version]
  22. Sessa, P.G.; De Martinis, V.; Bomhauer-Beins, A.; Weidmann, U.A.; Corman, F. A hybrid stochastic approach for offline train trajectory reconstruction. Public Transp. 2021, 13, 675–698. [Google Scholar] [CrossRef]
  23. Bažant, M.; Bulíček, J. Assessment of partial double-tracked railway lines with focus on capacity. In Proceedings of the 24th International Scientific Conference Transport Means 2020, Kaunas, Lithuania, 30 September–2 October 2020; Available online: https://transportmeans.ktu.edu/wp-content/uploads/sites/307/2018/02/Transport-means-A4-I-dalis.pdf (accessed on 30 June 2022).
  24. Wang, R.; Nie, L.; Tan, Y. Evaluating line capacity with an analytical UIC code 406 compression method and blocking time stairway. Energies 2020, 13, 1853. [Google Scholar] [CrossRef] [Green Version]
  25. Dávid, A.; Makó, P.; Galieriková, A.; Stupalo, V. Transshipment activities in the Rhine ports. In Proceedings of the International Scientific Conference Horizons of Railway Transport 2020, Žilina, Slovakia, 22–23 September 2021. [Google Scholar] [CrossRef]
  26. UIC. UIC Code 406: Capacity; International Union of Railways: Paris, France, 2004. [Google Scholar]
  27. Sventeková, E.; Gašparíková, Z. Basis for simulating the permeable performance of rail transport in crisis situations. In Proceedings of the 24th International Scientific Conference Transport Means, Kaunas, Lithuania, 30 September–2 October 2020; Available online: https://transportmeans.ktu.edu/wp-content/uploads/sites/307/2018/02/Transport-means-A4-I-dalis.pdf (accessed on 30 June 2022).
  28. Fedorko, G.; Molnár, V.; Honus, S.; Neřadilova, V.; Kampf, R. The Application Of Simulation Model Of A Milk Run To Identify The Occurrence Of Failures. Int. J. Simul. Model. 2018, 17, 444–457. [Google Scholar] [CrossRef]
  29. Bulíček, J.; Bažant, M. Selection of railway line segments that allow occupation by more trains based on simulation. In Proceedings of the 32nd European Modeling and Simulation Symposium—EMSS 2020, Online, 16–18 September 2020. [Google Scholar] [CrossRef]
  30. Aliev, R. Analysis of the track sections control system a rolling stock axle counting sensor. In Proceedings of the AIP Conference Proceedings, Varna, Bulgaria, 13–15 May 2021. [Google Scholar] [CrossRef]
  31. Zamouche, D.; Mohammedi, M.; Aissani, S.; Omar, M. Ultra-safe and reliable enhanced train-centric communication-based train control system. Computing 2022, 104, 533–552. [Google Scholar] [CrossRef]
  32. Nachtigall, P.; Tischer, E. Efficiency of increasing of the track speed using simulation in opentrack. In Proceedings of the 32nd European Modeling and Simulation Symposium—EMSS 2020, Online, 16–18 September 2020. [Google Scholar] [CrossRef]
  33. Zhang, J.; Zhang, J. Structure optimization of mixed-speed train traffic for cyclic timetable: Model and algorithm development. Discret. Dyn. Nat. Soc. 2022, 2022, 2228197. [Google Scholar] [CrossRef]
  34. Dragićević, B.; Schoebel, A.; Milinković, S. Traffic Optimization in Tent’s Industrial Railway by Using Open Tranck and Kronecker Algebra. In Proceedings of the International Conference on Traffic and Transport Engineering (ICTTE), Belgrade, Serbia, 27–28 September 2018; Available online: http://ijtte.com/uploads/news_files/Proceedings-2018-final-ispravljen.pdf (accessed on 30 June 2022).
  35. Stopka, O.; Zitricky, V.; Abramovic, B.; Marinov, M.; Ricci, S. Innovative technologies for sustainable passenger transport. J. Adv. Transp. 2019, 2019, 4197246. [Google Scholar] [CrossRef]
  36. Stopka, O.; Ľupták, V.; Drozdziel, P.; Rybicka, I. Modeling transportation routes of the pick-up system using location problem: A case study. Open Eng. 2020, 10, 784–792. [Google Scholar] [CrossRef]
  37. Jin, B.; Feng, X.; Wang, Q.; Sun, P. Real-time train regulation method for metro lines with substation peak power reduction. Comput. Ind. Eng. 2022, 168, 108113. [Google Scholar] [CrossRef]
  38. Bulíček, J.; Drdla, P.; Matuška, J. Operational reliability of a periodic railway line. In Proceedings of the International Scientific Conference Horizons of Railway Transport 2020, Žilina, Slovakia, 22–23 September 2021. [Google Scholar] [CrossRef]
  39. Laiton-Bonadiez, C.; Branch-Bedoya, J.W.; Zapata-Cortes, J.; Paipa-Sanabria, E.; Arango-Serna, M. Industry 4.0 technologies applied to the rail transportation industry: A systematic review. Sensors 2022, 22, 2491. [Google Scholar] [CrossRef]
  40. Dedík, M.; Bulková, Z.; Gašparík, J.; Čechovič, L.; Kurenkov, P.V. Proposal of methodology for stability evaluation of train timetables from the operational-infrastructural point of view. In Proceedings of the 7th International Conference on Road and Rail Infrastructure, Pula, Croatia, 11–13 May 2022. [Google Scholar] [CrossRef]
  41. Široký, J.; Nachtigall, P.; Tischer, E.; Gašparík, J. Simulation of railway lines with a simplified interlocking system. Sustainability 2021, 13, 1394. [Google Scholar] [CrossRef]
  42. Olentsevich, V.A.; Belogolov, Y.I.; Kramynina, G.N. Set of organizational, technical and reconstructive measures aimed at improvement of section performance indicators based on the study of systemic relations and regularities of functioning of railway transport system. IOP Conf. Ser. Mater. Sci. Eng. 2020, 832, 012038. [Google Scholar] [CrossRef]
  43. Al-Shumari, A. Weight and speed optimization for goods trains on cargo-intensive railway sections. In International Scientific Siberian Transport Forum TransSiberia—2021 Lecture Notes in Networks and Systems; Springer: Berlin/Heidelberg, Germany, 2022; Volume 402, pp. 211–220. [Google Scholar] [CrossRef]
  44. Popova, Y. Assessing the impact of railroad modernization on the socio-economic regional development. In International Scientific Siberian Transport ForumTransSiberia—2021 Lecture Notes in Networks and Systems; Springer: Berlin/Heidelberg, Germany, 2022; Volume 402, pp. 955–963. [Google Scholar] [CrossRef]
  45. Meško, P.; Gašparík, J.; Lalinská, J. Railway capacity issues on Slovak international corridors. In Proceedings of the 21st International Scientific Conference Transport Means, Juodkrante, Lithuania, 20–22 September 2017; Available online: https://www.dropbox.com/sh/7sjhe2ln3e3qin6/AABBl1Gbrf0_t8lM7Kho8KmVa?dl=0&preview=Transport+mens+2017+(Part+1).pdf (accessed on 10 June 2022).
  46. Forsgren, M. Computation of Capacity on Railway Networks. In Technical Report T2003-12; Swedish Institute of Computer Science: Stockholm, Sweden, 2003. [Google Scholar]
  47. Petersen, E.R. Over-the-road transit time for a single track railway. Transp. Sci. 1974, 8, 65–74. Available online: https://0-www-jstor-org.brum.beds.ac.uk/stable/25767727 (accessed on 20 June 2022). [CrossRef]
  48. Van Egmond, R.J. Railway Capacity Assessment, an Algebraic Approach. In TRAIL Studies in Transportation Science Series S99/2; Delft University Press: Delft, The Netherlands, 1999; Available online: https://repository.tudelft.nl/islandora/object/uuid%3A341b612e-0dda-4806-9e31-b240ac485cb8 (accessed on 30 June 2022).
  49. Kontaxi, E.; Ricci, S. Railway Capacity Handbook: A Systematic Approach to Methodologies. Procedia-Soc. Behav. Sci. 2012, 48, 2689–2696. [Google Scholar] [CrossRef] [Green Version]
  50. Kianinejadoshah, A.; Ricci, S. Comparative application of methods for the combined lines-nodes capacity assessment. Int. J. Transp. Dev. Integr. 2020, 4, 243–251. [Google Scholar] [CrossRef]
  51. Šulko, P.; Gašparík, J.; Dedík, M. Line track capacity—Analysis of the implementation of the UIC 406 methodology in ŽSR conditions. Trans Motauto World 2018, 3, 181–184. [Google Scholar]
  52. ŽSR. Operating Rules of Drienovská Nová Ves Railway Station; Slovak Railways: Bratislava, Slovakia, 2016. (In Slovak) [Google Scholar]
  53. ŽSR. Operating Rules of Prešov Railway Station; Slovak Railways: Bratislava, Slovakia, 2016. (In Slovak) [Google Scholar]
  54. ŽSR. Tables of Track Condition of Track 107; Slovak Railways: Bratislava, Slovakia, 2019. (In Slovak) [Google Scholar]
  55. ŽSR. Train Traffic Diagram 2021/2022 of Track Section 107; Slovak Railways: Bratislava, Slovakia, 2021. (In Slovak) [Google Scholar]
  56. STN 73 6360-1; Railways. Rail. Part 1: Geometric position and Track Layout of 1435 Milimeters Gauge. Slovak Railways: Bratislava, Slovakia, 2015. Available online: https://fpedas.uniza.sk/~gasparik/STN%20736360%201.pdf (accessed on 15 June 2022). (In Slovak)
  57. Geometrical arrangement of the track axis according to STN 73 6360 on the track section Kysak—Čirč state border; kilometers: 8.892–15.880 continuous track, Annex no. 1: Longitudinal section; Annex no. 7: Technical report. 2004; in print. (In Slovak)
  58. Kianinejadoshah, A.; Ricci, S. Comparative application of analytical and simulation methods for the combined railway nodes-lines capacity assessment. In Proceedings of the 14th International Scientific Conference on Sustainable, Modern and Safe Transport—TRANSCOM, Online, 26–28 May 2021. [Google Scholar] [CrossRef]
Figure 1. The EU “Amber” rail freight corridor [3].
Sustainability 14 14430 g001
Figure 2. Analysis of the occupancy time for train sequences: (a) in the interstationary section; (b) if there is a passing point in the interstationary section, or signal box [15].
Sustainability 14 14430 g002
Figure 3. Dependence of the quality of the transport model in train traffic diagram on the train paths number.
Sustainability 14 14430 g003
Figure 4. Method of train period sequence and type train (in this case, freight running train) in the boundary section Prešov–Drienovská Nová Ves (Source: authors).
Sustainability 14 14430 g004
Figure 5. Location passing point in the Haniska pri Prešove case for proposal A2 (Source: authors).
Sustainability 14 14430 g005
Figure 6. Partial double-track section for proposal A3.
Sustainability 14 14430 g006
Figure 7. Modification of the Prešov station tracks for proposal A3.
Sustainability 14 14430 g007
Figure 8. Partial double-track section for proposal A4.
Sustainability 14 14430 g008
Figure 9. Modification of the Drienovská Nová Ves railway station for proposal A4.
Sustainability 14 14430 g009
Figure 10. Complete double-track section for proposal A5.
Sustainability 14 14430 g010
Figure 11. Modification of the Drienovská Nová Ves railway station for proposal B2 (Source: authors).
Sustainability 14 14430 g011
Figure 12. Modification of the remotely controlled passing point Ličartovce and adjacent track section in the direction of Drienovská Nová Ves for proposal B2.
Sustainability 14 14430 g012
Table 1. Overview of all qualitative and quantitative indicators of the practical throughput performance and the method of determination.
Average occupation by one trainto = To/N[minutes]
Total buffer timeTbr = TTvTsTo[minutes]
Buffer time per traintbr = Tbr/N[minutes]
Required buffer time per train according to Regulation ŽSR D24tbt[minutes]
Practical throughput performance (in perspective timetable)n = (TTvTs)/(to + tbt)trains
Throughput performance utilisationKp = N/n[%]
Infrastructure occupation rateSo = To/T-
Source: authors, according to [12].
Table 2. Connections between the capacity indicators and the quality level of transport operations.
Usage by TrainsIndicatorsQualitative LevelDelay IncreaseInfrastructure Occupation Rate (Analytic Approach)
Capacity reserveslower than optimal valuesoptimalnegativeup to 0.45
Optimallevel of optimal valuesoptimalwithout changeup to 1.00
Without capacity reserveshigher than optimal values and lower than critical values at the same timeriskpositiveup to 1.50
Congested infrastructureexceed critical valuesinsufficientexponentialover 1.50
Table 3. Qualitative and quantitative indicators of the practical throughput performance of Drienovská Nová Ves–Prešov track line section.
Total time of occupation To1324 min
Average occupation time to11.4 min
Practical throughput performancen112 trains per day
Infrastructure occupation rateSo0.67
Capacity utilisation indexKp72.4%
Number of train paths for free capacityNf27
Time for regular shutdowns and maintenanceTv52 min
Source: authors.
Table 4. Overview of the running times of the freight trains [min].
Track SectionEven Direction
Prešov–Ličartovce
Odd Direction
Ličartovce–Prešov
Σ tj
Prešov–Automatic signal block Torysa4.04.017.0
Automatic signal block Torysa–Drienovská Nová Ves4.54.5
Drienovská Nová Ves–Ličartovce4.04.58.5
Source: authors, according to [55].
Table 5. Determination of the occupancy time of the Prešov–Drienovská Nová Ves track section in the current state.
N = 94Odd DirectionEven DirectionTobs [min]
ExRegFrFcFexLocExRegFrFcFexLoc
111913007111710009
Odd directionEx111.2912.2221.5220.1200.0000.5911.2911.9921.1710.1200.0000.70142.0
5.05.07.014.07.515.011.00.06.00.05.55.50.50.50.51.00.50.50.50.00.50.00.50.5
Reg192.2223.8442.6330.2010.0001.112.2223.4432.220.2000.0001.21170.0
4.08.06.024.06.519.510.010.05.00.04.54.50.51.00.51.50.51.00.50.00.50.00.50.5
Fr131.5222.6331.8020.1400.0000.6901.5222.3521.3810.1400.0000.83149.0
5.010.07.021.07.515.011.00.06.00.05.50.00.51.00.51.00.50.50.50.00.50.00.50.5
Fc10.1200.2000.1400.0100.0000.0500.1200.1810.1100.0100.0000.0600.5
4.00.05.00.04.50.08.00.04.50.04.50.00.50.00.50.50.50.00.50.00.50.00.50.0
Fex00.0000.0000.0000.0000.0000.0000.0000.0000.0000.0000.0000.0000.0
4.50.06.50.07.00.010.50.05.50.05.00.00.50.00.50.00.50.00.50.00.50.00.50.0
Loc50.5911.110.6900.0500.0000.2700.5910.9010.5310.0500.0000.32012.5
4.54.56.56.57.00.010.50.05.50.05.00.00.50.50.50.50.50.50.50.00.50.00.50.0
Even directionEx111.2912.2221.5220.1200.0000.5911.2911.9921.1710.1200.0000.701138.5
16.516.519.539.020.040.023.50.018.50.018.018.06.06.04.59.04.54.54.00.05.00.05.55.5
Reg171.9923.4432.3520.1800.0000.9011.9923.731.8120.1810.0001.91227.0
18.537.021.564.522.044.025.50.020.50.020.020.08.016.06.519.56.513.05.55.57.00.07.57.5
Fr101.1712.221.3810.1100.0000.5311.1711.8121.610.1100.0000.641147.0
19.519.522.545.022.022.026.50.020.50.021.021.09.09.07.515.07.57.56.50.08.00.08.58.5
Fc10.1200.2010.1400.0100.0000.0500.1200.1800.1100.0100.0000.06023.5
20.50.023.523.523.00.027.50.021.50.022.00.010.00.08.50.08.50.07.50.09.00.09.50.0
Fex00.0000.0000.0000.0000.0000.0000.0000.0000.0000.0000.0000.0000.0
17.50.020.50.021.00.024.50.018.50.019.00.07.00.05.50.05.50.05.00.06.00.06.50.0
Loc60.7011.2110.8310.0600.0000.3200.7011.910.6410.0600.0000.38070.0
16.516.519.519.519.019.023.50.017.50.018.00.06.06.04.54.54.54.54.50.05.00.05.50.0
Tobs [min]117.0257.0174.510.00.069.040.052.532.05.50.023.0780.5
Table 6. Determination of all indicators of the practical throughput performance of the Prešov–Drienovská Nová Ves track section in the current state.
Average time occupied by one trainto = 780.5/948.30 [min]
Total buffer timeTbr = (1440 − 780.5 − 52 − 0)607.5 [min]
Real buffer time per traintbr = 607.5/946.46 [min]
Required buffer time for one train according to Regulation ŽSR D24tbt3.41 [min]
Practical throughput performancen118 trains per day
Throughput performance utilisationKp = 94/11879.66 [%]
Infrastructure occupation rateSo = 780.6/14400.542
Table 7. Determination of the occupancy time of the Drienovská Nová Ves–Ličartovce track section in the current state.
N = 94Odd DirectionEven DirectionTobs [min]
ExRegFrFcFexLocExRegFrFcFexLoc
111913105111710106
Odd directionEx111.2512.1521.47100000.7911.2521.9321.13100001.02143.5
668.5178.1810.50706.16.112121110101.51.5
Reg192.1523.7242.55300001.3712.1523.3331.96200001.76279.5
6128327.522.51006.506.16.11213.100100012
Fr131.4722.5531.74200000.9411.4712.2821.34100001.21165.5
6128.525.58.11610.50706.1622120.50.50.50201.51.5
Fc10000000000000000000000000.0
60706.50906.106.10101010101010
Fex00000000000000000000000000.0
6.108.508010.507.10601.500.500.500.50201.50
Loc50.7911.3710.94100000.5100.7911.2310.72100000.65125.5
6.16.18.58.58810.507.10600.50.51111100.500.50.5
Even directionEx111.2512.1521.47200000.7911.2511.9321.13100001.021100.0
10.110.111.52312.52513.5011.509.59.5775.5117.57.55.507.507.17.1
Reg171.9323.3332.28200001.2311.9322.9831.75200001.582172.0
10.52112.13614.52914.1013.5010109187.121.19.5196.50.19.509.118.1
Fr101.1311.9621.34100000.7211.1311.7521.03100000.93192.0
10.510.512.12415.515.515.1012.1010.510.5775.1107.57.55.107.507.17.1
Fc10000000000000000000000000.0
13.5015.10.116017.1015.1012013011.1013.5010.5013.5013.10
Fex00000000000000000000000000.0
10.5011.5014.5014.1011.1010.50605.106.504.506.506.10
Loc61.0211.7621.21100000.6511.0211.5820.93100000.84076.0
10.110.110.521.111.511.512.5011.501010665.511.16.56.55.506.506.10
Tobs [min]87.5187.0135.50.00.058.044.561.043.00.00.037.5654.0
Table 8. Determination of all indicators of the practical throughput performance of the Drienovská Nová Ves–Ličartovce track section in the current state.
Average time occupied by one trainto = 654.0/976.74 [min]
Buffer timeTbr = (1440 − 654.0 − 52 − 0)734 [min]
Real buffer time per traintbr = 734/977.57 [min]
Required buffer time for one train according to Regulation ŽSR D24tbt2.89 [min]
Practical throughput performancen114 trains per day
Throughput performance utilisationKp = 97/11467.36%
Infrastructure occupation rateSo = 654.0/14400.673
Because tbt < tbr, the train traffic diagram is feasible, which we assumed because we had data from the current train traffic diagram.
Table 9. Cant changes in arcs for proposal A1.
Arc Number1.2.3.4.5.
Kilometre Position8.912–9.2229.868–10.21712.083–12.38113.227–14.33814.955–15.558
Arc radius [meters]Current state800945850r1 = 1054555
r2 = 1039
Proposal800940910r1 = 1080554
r2 = 1160
r3 = 1060
r4 = 1010
p-cant [millimeters]Current state8620202051
Proposal86828870128
I-lack of cant [millimeters]Proposal127999988130
77
91
99
Source: [57].
Table 10. Determination of the occupancy time for proposal A1.
N = 94Odd DirectionEven DirectionTobs [min]
ExRegFrFcFexLocExRegFrFcFexLoc
111913105111710106
Odd directionEx111.291.02.222.01.522.00.120.00.00.00.591.01.291.01.992.01.171.00.120.00.00.00.701.040.0
4.54.56.012.07.515.013.00.07.00.06.06.00.50.50.51.00.50.50.50.00.50.00.50.5
Reg192.222.03.844.02.633.00.201.00.00.01.11.02.222.03.443.02.22.00.200.00.00.01.211.067.5
3.57.05.020.06.519.512.012.06.00.05.05.00.51.00.51.50.51.00.50.00.50.00.50.5
Fr131.522.02.633.01.802.00.140.00.00.00.690.01.522.02.352.01.381.00.140.00.00.00.831.038.0
2.57.05.015.06.513.012.00.06.00.05.00.00.51.00.51.00.50.50.50.00.50.00.50.5
Fc10.120.00.200.00.140.00.010.00.00.00.050.00.120.00.181.00.110.00.010.00.00.00.060.00.5
3.00.04.00.04.00.08.50.04.50.04.50.00.500.50.50.50.00.50.00.50.00.50.0
Fex00.00.00.00.00.00.00.00.00.00.00.00.00.00.00.00.00.00.00.00.00.00.00.00.00.0
3.00.04.50.06.00.011.50.05.50.04.50.00.50.00.50.00.50.00.50.00.50.00.50.0
Loc50.591.01.11.00.6900.050.00.00.00.270.00.591.00.901.00.531.00.050.00.00.00.320.09.0
3.03.04.54.56.00.011.50.05.50.04.50.00.50.50.50.50.50.50.50.00.50.00.50.0
Even directionEx111.291.02.222.01.522.00.120.00.00.00.591.01.291.01.992.01.171.00.120.00.00.00.701.0108.0
12.012.014.529.016.032.021.50.015.50.014.514.54.54.54.08.03.53.53.50.03.50.04.54.5
Reg171.992.03.443.02.352.00.180.00.00.00.901.01.992.03.73.01.812.00.181.00.00.01.91.0166.5
13.026.015.546.517.034.022.50.016.50.015.515.55.511.05.015.04.59.04.04.04.50.05.55.5
Fr101.171.02.22.01.381.00.110.00.00.00.531.01.171.01.812.01.61.00.110.00.00.00.641.0116.5
14.514.517.034.017.517.524.00.017.00.017.017.07.07.06.513.06.06.04.50.06.00.07.07.0
Fc10.120.00.201.00.140.00.010.00.00.00.050.00.120.00.180.00.110.00.010.00.00.00.060.020.5
18.00.020.520.521.00.027.50.020.50.020.50.010.50.010.00.09.50.07.50.09.50.010.50.0
Fex00.00.00.00.00.00.00.00.00.00.00.00.00.00.00.00.00.00.00.00.00.00.00.00.00.0
14.00.016.50.018.00.023.50.016.50.016.50.06.50.06.00.05.50.04.50.05.50.06.50.0
Loc60.701.01.211.00.831.00.060.00.00.00.320.00.701.01.91.00.641.00.060.00.00.00.380.056.5
12.512.515.015.015.515.522.00.015.00.015.00.05.05.04.54.54.04.03.50.04.00.05.00.0
Tobs [min]86.5196.5146.512.00.058.030.545.025.04.00.018.5622.5
Table 11. Determination of all indicators of the practical throughput performance for proposal A1.
Average time occupied by one trainto = 622.5/946.62 [min]
Buffer timeTbr = (1440 − 622.5 − 52 − 0)765.5 [min]
Real buffer time per traintbr = 765.5/948.14 [min]
Required buffer time for one train according to Regulation ŽSR D24tbt2.85 [min]
Practical throughput performancen146 trains per day
Throughput performance utilisationKp = 94/14664.38%
Infrastructure occupation rateSo = 622.5/14400.432
Table 12. Determination of occupancy time for proposal A2.
N = 94Odd DirectionEven DirectionTobs [min]
ExRegFrFcFexLocExRegFrFcFexLoc
111913105111710106
Odd directionEx111.291.02.222.01.522.00.120.00.00.00.591.01.291.01.992.01.171.00.120.00.00.00.701.049.5
5.55.57.515.08.016.011.50.06.50.06.06.02.02.01.02.01.01.02.00.02.00.02.02.0
Reg192.222.03.844.02.633.00.201.00.00.01.11.02.222.03.443.02.22.00.200.00.00.01.211.078.5
4.59.06.526.07.021.010.510.55.50.05.05.00.51.01.03.01.02.01.00.01.00.01.01.0
Fr131.522.02.633.01.802.00.140.00.00.00.690.01.522.02.352.01.381.00.140.00.00.00.831.057.5
5.511.07.522.58.016.011.50.06.50.06.00.01.53.00.51.02.02.02.00.02.00.02.02.0
Fc10.120.00.200.00.140.00.010.00.00.00.050.00.120.00.181.00.110.00.010.00.00.00.060.00.5
4.50.05.50.05.00.08.50.05.00.05.00.01.50.00.50.51.50.01.50.01.50.01.50.0
Fex00.000.00.00.00.00.00.00.00.00.00.00.00.00.00.00.00.00.00.00.00.00.00.00.0
5.00.07.00.07.50.011.00.06.00.05.50.01.50.00.50.01.50.02.00.02.00.02.00.0
Loc50.591.01.11.00.690.00.050.00.00.00.270.00.591.00.901.00.531.00.050.00.00.00.320.015.5
5.05.07.07.07.50.011.00.06.00.05.50.01.51.50.50.51.51.51.50.01.50.02.00.0
Even directionEx111.291.02.222.01.522.00.120.00.00.00.591.01.291.01.992.01.171.00.120.00.00.00.701.0108.5
10.510.512.525.016.533.015.50.014.50.012.012.07.07.04.59.05.55.54.50.06.00.06.56.5
Reg171.992.03.443.02.352.00.180.00.00.00.901.01.992.03.73.01.812.00.181.00.00.01.91.0169.5
12.024.011.534.516.032.015.00.014.00.011.511.59.018.06.519.57.515.06.56.58.00.08.58.5
Fr101.171.02.22.01.381.00.110.00.00.00.531.01.171.01.812.01.61.00.110.00.00.00.641.0120.5
15.515.516.032.016.516.517.00.014.50.013.513.510.010.07.515.08.58.57.50.09.00.09.59.5
Fc10.120.00.201.00.140.00.010.00.00.00.050.00.120.00.180.00.110.00.010.00.00.00.060.016.0
15.50.016.016.018.00.016.00.016.00.014.50.011.00.08.50.09.50.08.50.010.00.010.50.0
Fex00.00.00.00.00.00.00.00.00.00.00.00.00.00.00.00.00.00.00.00.00.00.00.00.00.0
14.00.014.50.015.50.014.50.013.00.012.50.08.00.05.50.06.50.05.50.07.00.07.50.0
Loc60.701.01.211.00.831.00.060.00.00.00.320.00.701.01.91.00.641.00.060.00.00.00.380.055.5
11.511.512.512.514.014.014.50.012.00.010.50.07.07.05.05.05.55.55.00.06.00.06.50.0
Tobs [min]92.0190.5148.510.50.048.049.555.541.06.50.029.5671.5
Table 13. Determination of all indicators of the practical throughput performance for proposal A2.
Average time occupied by one trainto = 671.5/947.14 [min]
Total buffer timeTbr = (1440 − 671.5 − 52 − 0)716.5 [min]
Real buffer time per traintbr = 716.5/947.62 [min]
Required buffer time for one train according to Regulation ŽSR D24tbt3.18 [min]
Practical throughput performancen134 trains per day
Throughput performance utilisationKp = 94/13470.15%
Infrastructure occupation rateSo = 671.5/14400.466
Table 14. Determination of occupancy time for proposal A3.
N = 94Odd DirectionEven DirectionTobs [min]
ExRegFrFcFexLocExRegFrFcFexLoc
111913105111710106
Odd directionEx111.291.02.222.01.522.00.120.00.00.00.591.01.291.01.992.01.171.00.120.00.00.00.701.075.5
5.55.54.59.05.511.04.50.05.00.05.05.08.08.09.519.09.59.510.50.09.00.08.58.5
Reg192.222.03.844.02.633.00.201.00.00.01.11.02.222.03.443.02.22.00.200.00.00.01.211.0151.5
6.513.06.526.06.519.56.56.56.50.06.56.59.018.010.531.510.521.011.50.010.00.09.59.5
Fr131.522.02.633.01.802.00.140.00.00.00.690.01.522.02.352.01.381.00.140.00.00.00.831.0115.0
8.016.07.021.08.016.05.00.07.50.07.50.09.519.010.521.012.012.012.50.010.00.010.010.0
Fc10.120.00.200.00.140.00.010.00.00.00.050.00.120.00.181.00.110.00.010.00.00.00.060.011.5
11.50.010.50.011.50.08.50.011.00.011.00.010.50.011.511.512.00.013.50.011.00.011.00.0
Fex00.00.00.00.00.00.00.00.00.00.00.00.00.00.00.00.00.00.00.00.00.00.00.00.00.0
6.50.05.50.06.50.05.00.06.00.06.00.09.00.010.00.010.50.012.00.09.50.09.50.0
Loc50.591.01.11.00.690.00.050.00.00.00.270.00.591.00.901.00.531.00.050.00.00.00.320.039.5
6.06.05.05.06.00.05.00.05.50.05.50.08.58.510.010.010.010.011.00.09.50.09.00.0
Even directionEx111.291.02.222.01.522.00.120.00.00.00.591.01.291.01.992.01.171.00.120.00.00.00.701.046.0
1.51.51.53.01.53.01.50.01.50.01.51.56.06.08.016.09.09.010.00.07.00.06.06.0
Reg171.992.03.443.02.352.00.180.00.00.00.91.01.992.03.73.01.812.00.1810.00.01.91.062.5
1.53.00.51.50.51.00.50.00.50.00.50.54.59.06.519.57.515.08.58.55.50.04.54.5
Fr101.171.02.22.01.381.00.110.00.00.00.531.01.171.01.812.01.61.00.110.00.00.00.641.035.0
1.51.50.51.01.51.51.50.01.50.01.51.54.54.56.513.07.57.58.50.05.50.04.54.5
Fc10.120.00.201.00.140.00.010.00.00.00.050.00.120.00.180.00.110.00.010.00.00.00.060.00.5
1.50.00.50.51.50.00.50.01.50.01.50.04.00.05.50.06.50.07.50.05.00.04.50.0
Fex00.00.00.00.00.00.00.00.00.00.00.00.00.00.00.00.00.00.00.00.00.00.00.00.00.0
1.50.00.50.01.50.01.50.01.50.01.50.05.00.07.00.08.00.09.00.06.00.05.00.0
Loc60.701.01.211.00.831.00.060.00.00.00.320.00.701.01.91.00.641.00.060.00.00.00.380.023.0
1.51.50.50.51.51.51.50.01.50.01.50.05.55.55.55.58.58.59.50.06.50.05.50.0
Tobs [min]48.067.553.56.50.015.078.5147.092.58.50.043.0560.0
Table 15. Determination of all indicators of the practical throughput performance for proposal A3.
Average time occupied by one trainto = 560.0/945.96 [min]
Buffer timeTbr = (1440 − 560.0 − 52 − 0)828 [min]
Real buffer time per traintbr = 828/948.81 [min]
Required buffer time for one train according to Regulation ŽSR D24tbr2.62 [min]
Practical throughput performancen161 trains per day
Throughput performance utilisationKp = 94/16158.39%
Infrastructure occupation rateSo = 560.0/14400.389
Table 16. Determination of occupancy time for proposal A4.
N = 94Odd DirectionEven DirectionTobs [min]
ExRegFrFcFexLocExRegFrFcFexLoc
111913105111710106
Odd directionEx111.291.02.222.01.522.00.120.00.00.00.591.01.291.01.992.01.171.00.120.00.00.00.701.045.0
5.55.57.515.08.016.011.50.06.50.06.06.00.50.50.51.00.50.50.50.00.50.00.50.5
Reg192.222.03.844.02.633.00.201.00.00.01.11.02.222.03.443.02.22.00.200.00.00.01.211.075.5
4.59.06.526.07.021.010.510.55.50.05.05.00.51.00.51.50.51.00.50.00.50.00.50.5
Fr131.522.02.633.01.802.00.140.00.00.00.690.01.522.02.352.01.381.00.140.00.00.00.831.052.5
5.511.07.522.58.016.011.50.06.50.06.00.00.51.00.51.00.50.50.50.00.50.00.50.5
Fc10.120.00.200.00.140.00.010.00.00.00.050.00.120.00.181.00.110.00.010.00.00.00.060.00.5
4.50.05.50.05.00.08.50.05.00.05.00.00.50.00.50.50.50.00.50.00.50.00.50.0
Fex00.00.00.00.00.00.00.00.00.00.00.00.00.00.00.00.00.00.00.00.00.00.00.00.00.0
5.00.07.00.07.50.011.00.06.00.05.50.00.50.00.50.00.50.00.50.00.50.00.50.0
Loc50.591.01.11.00.690.00.050.00.00.00.270.00.591.00.901.00.531.00.050.00.00.00.320.013.5
5.05.07.07.07.50.011.00.06.00.05.50.00.50.50.50.50.50.50.50.00.50.00.50.0
Even directionEx111.291.02.222.01.522.00.120.00.00.00.591.01.291.01.992.01.171.00.120.00.00.00.701.080.5
8.08.09.018.010.521.011.00.08.50.08.58.56.06.04.59.04.54.54.00.05.00.05.55.5
Reg171.992.03.443.02.352.00.180.00.00.00.901.01.992.03.73.01.812.00.181.00.00.01.91.0144.0
9.519.010.531.511.022.012.50.010.00.010.010.08.016.06.519.56.513.05.55.57.00.07.57.5
Fr101.171.02.22.01.381.00.110.000.00.531.01.171.01.812.01.61.00.110.00.00.00.641.092.5
9.59.510.521.012.012.012.50.010.00.010.010.09.09.07.515.07.57.56.50.08.00.08.58.5
Fc10.120.00.201.00.140.00.010.00.00.00.050.00.120.00.180.00.110.00.010.00.00.00.060.011.5
10.50.011.511.511.50.013.50.011.00.011.00.010.00.08.50.08.50.07.50.09.00.09.50.0
Fex00.00.00.00.00.00.00.00.00.00.00.00.00.00.00.00.00.00.00.00.00.00.00.00.00.0
9.000.10.00.010.50.012.00.09.50.09.50.07.00.05.50.05.50.05.00.06.00.06.50.0
Loc60.701.01.211.00.831.00.060.00.00.00.320.00.701.01.91.00.641.00.060.00.00.00.380.043.0
8.58.59.59.510.010.011.50.09.00.09.00.06.06.04.54.54.54.54.50.05.00.05.50.0
Tobs [min]75.5162.0118.010.50.039.540.052.532.05.50.023.0558.5
Table 17. Determination of all indicators of the practical throughput performance for proposal A4.
Average time occupied by one trainto = 558.5/945.94 [min]
Total buffer timeTbr = (1440 − 558.5 − 52 − 0)829.5 [min]
Real buffer time per trainTbr = 829.5/948.82 [min]
Required buffer time for one train according to Regulation ŽSR D24tbr2.62 [min]
Practical throughput performancen162 trains per day
Throughput performance utilisationKp = 94/16258.02%
Infrastructure occupation rateSo = 558.5/14400.388
Table 18. Determination of occupancy time for proposal A5.
N = 94Odd DirectionEven DirectionTobs [min]
Odd = 49ExRegFrFcFexLocExRegFrFcFexLoc
Even = 45111913105111710106
Odd directionEx112.473.04.274.02.923.00.220.00.00.01.121.0 76.5
5.516.57.530.08.024.011.50.06.50.06.06.0
Reg194.274.07.377.04.225.00.391.00.00.00.02.0 119.0
4.518.06.545.57.035.010.510.55.50.05.510.0
Fr132.923.04.225.03.454.00.270.00.00.00.01.0 92.0
5.516.57.537.58.032.011.50.06.50.06.06.0
Fc10.220.00.391.00.270.00.020.00.00.00.100.0 5.5
4.50.05.55.55.00.08.50.05.00.05.00.0
Fex00.00.00.00.00.00.00.00.00.00.00.00.0 0.0
5.00.07.00.07.50.011.00.06.00.05.50.0
Loc51.121.01.12.01.331.00.100.00.00.00.511.0 32.0
5.05.07.014.07.57.511.00.06.00.05.55.5
Even directionEx11 2.693.04.164.02.442.00.240.00.00.01.472.056.0
6.018.04.518.04.59.04.00.05.00.05.511.0
Reg17 4.164.01.66.03.784.00.381.00.00.01.22.0117.5
8.032.06.539.06.526.05.55.57.00.07.515.0
Fr10 2.443.03.784.01.22.00.220.00.00.01.331.080.5
9.027.07.530.07.515.06.50.08.00.08.58.5
Fc1 0.240.00.381.00.220.00.020.00.00.00.130.08.5
10.00.08.58.58.50.07.50.09.00.09.50.0
Fex0 0.00.00.00.00.00.00.00.000.00.00.00.0
7.00.05.50.05.50.05.00.06.00.06.50.0
Loc6 1.471.01.22.01.332.00.130.00.00.00.801.029.5
6.06.04.59.04.59.04.50.05.00.05.55.5
Tobs [min]56.0132.598.510.50.027.583.0104.559.05.50.040.0352.0Odd
292.0Even
Table 19. Determination of all indicators of the practical throughput performance for proposal A5.
IndicatorsEven DirectionOdd Direction
Average time occupied by one traintoeven = 292.0/456.49 [min]toodd = 352.0/496.63 [min]
Total buffer timeTbreven = (1440 − 292.0 − 52 − 0)1096 [min]Tbrodd = (1440 − 352.0 − 52 − 0)1063 [min]
Real buffer time per traintbreven = 1096/4524.36 [min]tbrodd = 1063/4921.69 [min]
Required buffer time for one train according to Regulation ŽSR D24tbt2.80 [min]tbr2.85 [min]
Practical throughput performanceneven149 trains per daynodd146 trains per day
Throughput performance utilisationKpeven = 45/14930.2%Kpodd = 49/14633.6%
Infrastructure occupation rateSoeven = 292.0/14400.3012Soodd = 352.0/14400.335
Table 20. Cant changes in arcs for proposal B1.
Arc Number1.2.3.4.5.6.7.8.
Kilometre Position4.914–5.3775.468–5.9316.110–6.2216.478–6.5916.591–6.8437.093–7.5127.729–7.8357.889–7.996
Arc radius [meters]Current state3789501600260040596525002500
Proposal3789501600336240596536003600
p-cant [millimetres]Current state136543001285300
Proposal101454501144400
I-lack of cant [millimetres]Proposal99792928122783333
Source: [57].
Table 21. Determination of occupancy time for proposal B1.
N = 94Odd DirectionEven DirectionTobs [min]
ExRegFrFcFexLocExRegFrFcFexLoc
111913007111710709
Odd directionEx111.251.02.152.01,471.00.00.00.00.00.791.01.252.01.932.01.131.00.00.00.00.01.21.040.5
5.05.08.016.08.08.011.50.07.00.05.05.01.02.01.02.01.01.01.00.01.00.01.51.5
Reg192.152.03.724.02.553.00.00.00.00.01.371.02.152.03.333.01.962.00.00.00.00.01.762.074.5
5.010.07.530.07.522.511.00.06.50.05.05.01.02.01.03.00.00.01.00.00.00.01.02.0
Fr131.472.02.553.01.742.00.00.000.0.00.941.01.471.02.282.01.341.00.00.00.00.01.211.058.0
5.010.07.522.57.515.011.00.06.50.05.05.01.51.51.02.00.50.50.50.02.00.01.51.5
Fc10.00.00.00.00.00.00.00.00.00.00.00.00.00.00.00.00.00.00.00.00.00.00.00.00.0
5.00.05.50.05.50.09.00.05.50.05.00.01.00.01.00.01.00.01.00.01.00.01.00.0
Fex00.00.00.00.00.00.00.00.00.00.00.00.00.00.00.00.00.00.00.00.00.00.00.00.00.0
5.00.07.50.07.50.011.00.06.50.05.00.01.50.00.50.00.50.00.50.02.00.01.50.0
Loc50.791.01.11.00.941.00.00.00.00.00.510.00.791.01.231.00.721.00.00.00.00.00.651.023.5
5.05.08.08.08.08.011.00.07.00.05.00.00.00.01.01.01.01.01.00.00.50.00.50.5
Even directionEx111.251.02.152.01.472.00.00.00.00.00.791.01.251.01.932.01.131.00.00.00.00.01.21.089.5
9.09.010.521.011.523.013.00.010.50.08.08.06.56.54.59.06.56.54.50.06.50.06.56.5
Reg171.932.03.333.02.282.00.00.00.00.01.231.01.932.02.983.01.752.00.00.00.00.01.582.0158.5
9.519.011.033.013.527.013.50.012.50.09.09.08.517.06.519.58.517.05.50.08.50.08.517.0
Fr101.131.01.12.01.341.00.00.00.00.00.721.01.131.01.752.01.31.00.00.00.00.00.931.086.5
9.59.511.022.014.514.514.50.011.00.09.59.57.07.05.010.07.07.04.50.07.00.07.07.0
Fc10.00.00.00.00.00.00.00.000.0.00.00.00.00.00.00.00.00.00.00.00.00.00.00.00.0
13.00.014.50.015.50.017.00.014.50.012.50.014.00.012.00.014.00.010.50.014.00.014.00.0
Fex00.00.00.00.00.00.00.00.00.00.00.00.00.00.00.00.00.00.00.00.00.00.00.00.00.0
9.00.010.50.013.50.013.50.010.00.09.00.06.00.04.50.06.00.04.00.06.00.06.00.0
Loc61.21.01.762.01.211.00.00.00.00.00.651.01.21.01.582.00.931.00.00.00.00.00.840.067.0
9.09.09.519.010.510.512.00.010.50.08.58.55.55.54.59.05.55.54.50.05.50.05.50.0
Tobs [min]76.5171.5128.50.00.050.041.555.538.50.00.036.0598.0
Table 22. Determination of all indicators of the practical throughput performance for proposal B1.
Average time occupied by one trainto = 598.0/946.16 [min]
Total buffer timeTbr = (1440 − 598.0 − 52 − 0)790 [min]
Real buffer time per trainTbr = 790/948.14 [min]
Required buffer time for one train according to Regulation ŽSR D24Tbt2.69 [min]
Practical throughput performancen156 trains per day
Throughput performance utilisationKp = 94/15651.9%
Infrastructure occupation rateSo = 598.0/14400.517
Table 23. Determination of occupancy for proposal B2.
N = 94Odd DirectionEven DirectionTobs [min]
ExRegFrFcFexLocExRegFrFcFexLoc
111913007111710009
Odd directionEx111.251.02.152.01.471.00.00.00.00.00.791.01.252.01.932.01.131.00.00.00.00.01.21.0106.0
6.56.58.016.09.09.010.00.08.00.06.06.011.523.011.523.012.012.015.00.011.00.010.510.5
Reg192.152.03.724.02.553.00.00.00.00.01.11.02.152.03.333.01.12.00.00.00.00.01.762.0188.5
6.513.07.028.09.027.010.00.08.00.06.06.013.026.012.537.513.527.016.50.012.50.012.024.0
Fr131.472.02.553.01.742.00.00.00.00.00.941.01.471.02.282.01.341.00.00.00.00.01.211.0123.0
6.513.07.021.09.018.010.00.08.00.06.06.012.512.512.525.014.514.517.50.013.50.013.013.0
Fc10.00.00.00.00.00.00.00.00.00.00.00.00.00.00.000.00.00.00.00.00.00.00.00.0
6.50.07.00.09.00.010.00.08.00.06.00.015.00.013.00.013.50.018.50.014.50.014.00.0
Fex00.00.00.00.00.00.00.00.00.00.00.00.00.00.00.00.00.000.00.00.00.00.00.00.0
6.50.07.00.09.00.010.00.08.00.06.00.013.00.013.00.013.50.016.50.012.50.012.00.0
Loc50.791.01.11.00.941.00.00.00.00.00.510.00.791.01.231.00.721.00.00.00.00.00.651.067.5
6.56.58.58.59.09.010.50.08.00.06.00.011.011.011.011.011.511.514.50.010.50.010.010.0
Even directionEx111.25102.152.01.472.00.00.00.00.00.791.01.251.01.932.01.131.00.00.00.00.01.21.038.5
0.50.50.51.00.51.00.50.00.50.00.50.57.07.07.515.07.57.59.00.06.50.06.06.0
Reg171.932.03.333.02.282.00.00.00.00.01.231.01.932.02.983.01.752.00.00.00.00.01.12.070.0
0.51.00.51.50.51.00.50.00.50.00.50.57.515.07.021.07.515.09.50.07.50.07.515.0
Fr101.131.01.12.01.341.00.00.00.00.00.721.01.131.01.752.01.31.00.00.00.00.00.931.036.0
0.50.50.51.00.50.50.50.00.50.00.50.57.07.06.513.07.57.59.50.06.50.06.06.0
Fc10.00.00.00.00.00.00.00.00.00.00.00.00.00.00.00.00.00.00.00.00.00.00.00.00.0
0.50.00.50.00.50.00.50.00.50.00.50.08.50.08.00.08.50.09.50.08.50.08.50.0
Fex00.00.00.00.00.00.00.00.00.00.00.00.00.00.00.00.00.00.00.00.00.00.00.00.00.0
0.50.00.50.00.50.00.50.00.50.00.50.07.00.06.50.07.50.09.50.06.50.06.00.0
Loc61.21.01.762.01.211.00.00.00.00.00.651.01.21.01.582.00.931.00.00.00.00.00.840.030.0
0.50.50.51.00.50.50.50.00.50.00.50.57.07.06.513.07.57.59.50.06.50.06.00.0
Tobs [min]41.578.066.00.00.020.0108.5158.5102.50.00.084.5659.5
Source: authors.
Table 24. Determination of all indicators of the practical throughput performance for proposal B2.
Average time occupied by one trainto = 659.5/946.80 [min]
Total buffer timeTbr = (1440 − 659.5 − 52 − 0)728.5 [min]
Real buffer time per traintbr = 728.5/947.51 [min]
Required buffer time for one train according to Regulation ŽSR D24tbt2.91 [min]
Practical throughput performancen142 trains per day
Throughput performance utilisationKp = 94/14257.0%
Infrastructure occupation rateSo = 659.5/14400.566
Source: authors.
Table 25. Qualitative and quantitative indicators of the practical throughput performance of all proposals.
ProposalTo
[min]
to
[min]
Tbr
[min]
tbr
[min]
tbt
[min]
n
[trains]
Kp
[%]
So
[-]
Qualitative Level of Train Traffic Diagram
A1622.56.62765.58.142.8514664.38%0.4323risk
A2547.55.82840.58.942.5816556.9%0.3802optimal
A3448.54.77939.59.992.2219847.4%0.3115optimal
A4440.04.68948.010.092.1920146.7%0.3056optimal
A5 even233.55.191154.526.662.3618324.6%0.2449optimal
A5 odd262.55.351125.522.972.4217827.5%0.2746optimal
B1598.06.16790.08.142.6915651.9%0.5170risk
B2600.06.19788.08.122.7015651.9%0.5186risk
Publisher’s Note: MDPI stays neutral with regard to jurisdictional claims in published maps and institutional affiliations.

