Communication

Soil Quality Index of Young and Differently Managed Almond Orchards under Mediterranean Conditions

by
José Manuel Mirás-Avalos
1,*,
Pedro Marco
2,
Sergio Sánchez
2,
Beatriz Bielsa
2,
María José Rubio Cabetas
2,3 and
Vicente González
1
1
Departamento de Sistemas Agrícolas, Forestales y Medio Ambiente, Centro de Investigación y Tecnología Agroalimentaria de Aragón (CITA), Avda. Montañana 930, 50059 Zaragoza, Spain
2
Departamento de Ciencia Vegetal, Centro de Investigación y Tecnología Agroalimentaria de Aragón (CITA), Avda. Montañana 930, 50059 Zaragoza, Spain
3
Instituto Agroalimentario de Aragón–IA2 (CITA-Universidad de Zaragoza), 50059 Zaragoza, Spain
*
Author to whom correspondence should be addressed.
Sustainability 2022, 14(22), 14770; https://0-doi-org.brum.beds.ac.uk/10.3390/su142214770
Submission received: 20 October 2022 / Revised: 7 November 2022 / Accepted: 8 November 2022 / Published: 9 November 2022

Abstract

:
Sustainable agriculture has drawn attention to the maintenance and enhancement of soil health. However, research on soil quality has been carried out mainly in field crops and, to a lesser extent, in mature orchards, neglecting the relevance of assessing the soil quality status in the first years of tree plantations. Therefore, the aim of this study was to assess the soil quality index of young almond orchards located in marginal lands and managed under different practices. The survey was carried out in the Teruel Province (Northeast Spain), in three almond orchards: Alacón (2 years old, 0.75 ha, rainfed, conventionally managed), San Martín (1 year old, 0.4 ha, irrigated, organically managed), and Valdealgorfa (6 years old, 0.2 ha, rainfed, organically managed). The composite soil samples were taken from three spots within each orchard. To determine the soil quality index, four main soil functions were considered: filtering and buffering, nutrient supply, water relations, and crop limitation. The soil quality indices were 0.55, 0.75, and 0.54 for Alacón, San Martín, and Valdealgorfa orchards, respectively. These values suggested that the evaluated soils are adequate for almond production, although they require management actions to improve their quality (for instance, the application of organic amendments) and increase the sustainability of these agroecosystems. Furthermore, this work provides a framework for the assessment of the soil quality in tree orchards at a young stage.

1. Introduction

The need for sustainable agriculture has brought deserved attention to soil and the efforts for maintaining and/or improving its health [1]. In fact, soils support 95% of agricultural production [2], so it is unquestionable that there is a need for achieving sustainable soil management practices at a global scale [3]. Moreover, healthy soils provide a wide range of ecosystem services, including clean water, habitats for biodiversity, nutrient cycling, etc. [4]. However, soil is a scarce resource that is endangered worldwide, especially in the Mediterranean Basin [5]. For instance, conventional tree cultivation frequently causes soil degradation by depleting soil organic matter (SOM), causing erosion, and, in irrigated orchards, causing soil and water pollution [6,7]. These problems increase because of the presence of a large bare soil surface in the alleys between trees, since farmers till soil frequently to avoid the growth of vegetation in these inter-cropping areas [8]. Cover cropping and reduced or no-tillage have been proposed as management practices to overcome the loss of soil, SOM, and nutrients in tree orchards [9]. However, these practices have not been widely adopted in Mediterranean areas because farmers believe that they might negatively affect tree water and phytosanitary statuses [10]. Moreover, local customs lead to the application of intensive tillage and removal of cover crops [11]. Nevertheless, a recent meta-analysis focusing on studies about perennial crops in the Mediterranean Basin highlighted the overall positive effects of intercropping, conservation tillage, and organic fertilization on soil properties when compared to traditional management [12]. This study concluded that the best alternative to increase the SOM and nitrogen content in the soil would be the establishment of annual cover crops in the alleys and applying minimum tillage [12]. Almond (Prunus dulcis (Mill.) D.A. Webb) orchards occupy a large area in the Mediterranean Basin; for instance, in Spain, these orchards cover 587,000 ha and their surface is increasing due to their attractive economic revenues [13], which help retain the population in depressed regions of Central and East Spain. In fact, Spain is the second largest almond producer worldwide, accounting for 10% of the world production in 2020 [14]. However, these orchards are usually established in marginal lands with low productivity potentials, as this tree can grow satisfactorily in low-fertility calcareous soils. Therefore, agricultural practices should always consider soil quality to increase their sustainability.
Soil quality is defined as “the capacity of a soil to function within ecosystem and land-use boundaries to sustain biological productivity, maintain environmental quality, and promote plant and animal health” [15,16]. This definition captures the complexity, site-specificity, and multifunctionality of soils [17], although it has been criticized [18]. From its definition, soil quality is not directly measurable and should be inferred from relevant indicators, which are a set of soil properties that affect its capacity to produce crops or environmental performance and are sensitive to land use change, management, or conservation operations [15,19]. To quantify soil quality, we must define the functions that a given soil should fulfill, identify the attributes related to each function and then, select a minimum data set of indicators to measure each function [19,20,21,22]. The most widespread methodology for assessing soil quality is that proposed by Karlen and Stott [20], who suggested an additive model in which, first, the main soil functions and their respective indicators are defined. Then, they are weighed and added to receive a single index. The results range from 0 to 1. When the soil quality index (SQI) is 1, the soil presents the highest quality for the evaluated function. In contrast, when the SQI is 0, it indicates a low soil quality or a degraded and/or depleted soil. This methodology has been proven useful in a wide range of situations [19,21,23].
However, research on soil quality has been carried out in field crops or in mature orchards, neglecting the relevance of determining soil health status in the first years of plantation in tree orchards. In this context, the current study aims at assessing the soil quality of three young almond orchards differently managed in the Teruel Province (Northeast Spain), a depopulated region, as a first step to determine the viability and sustainability of these agroecosystems. To our knowledge, this is the first time that this topic is performed in the scientific literature and our work provides a framework for establishing a soil quality assessment adapted to tree orchards at a young stage.

2. Materials and Methods

2.1. Description of the Study Sites

This survey was performed in March 2022 in three young and differently managed almond orchards located in the Teruel Province (Aragón, Spain).
  • Conventionally managed and rain-fed: This 0.75 ha almond orchard is located in Alacón (41°1′53.8″ N, 0°42′43.7″ W). Almond trees (Belona, Mardía, and Vialfas cultivars grafted onto Garnem® rootstock) were planted in 2020 at 7 × 7 m spacings (204 trees ha−1). Soil at this site is a Calcisol [24,25], it is loamy textured (46.7% sand, 30.1% silt, and 23.2% clay), has a pH of 8.3, and the organic matter content is 1.4%. In the period 2004–2021, the annual mean temperature was 15.1 °C, the annual rainfall and reference evapotranspiration amounted to 375.4 and 1316.1 mm, respectively. Hereafter, this orchard will be designated as Alacón. This orchard represents a new use of a marginal land.
  • Organically managed and irrigated: This 0.4 ha almond orchard is located in San Martín del Río (41°4′5.2″ N, 1°23′4.0″ W). Almond trees (Belona, Lauranne, Mardía, and Vialfas cultivars grafted onto Garnem®, Pilowred®, and Rootpac® 20 rootstocks) were planted in 2021 at 7 × 7 m spacings (204 trees ha−1). Soil at this site is a Calcic Luvisol [24,25], is sandy loamy textured (63.6% sand, 22.5% silt, and 13.9% clay), has a pH of 8.0, and the organic matter content is 2.1%. In the period 2006–2021, the annual mean temperature was 12.1 °C and the annual rainfall and reference evapotranspiration amounted to 364.7 and 964.5 mm, respectively. Hereafter, this orchard will be designated as San Martín. This orchard represents a new use of a riverbank.
  • Organically managed and rainfed: This 0.2 ha almond orchard is located in Valdealgorfa (41°2′14.1″ N, 0°0′49.7″ W). Almond trees (Mardía cultivar grafted onto Garnem® rootstock) were planted in 2015 at 8 × 8 m spacings (156 trees ha−1). Soil at this site is a Calcisol [24,25], is sandy clay loamy textured (55.5% sand, 18.2% silt, and 26.3% clay), has a pH of 8.6, and the organic matter content is 1.4%. In the period 2004–2021, the annual mean temperature was 15.2 °C and the annual rainfall and reference evapotranspiration amounted to 339.6 and 1255.9 mm, respectively. Hereafter, this orchard will be designated as Valdealgorfa. This orchard represents a traditional use of a marginal land, following the principles of organic agriculture.

2.2. Sampling Collection and Laboratory Determinations

A minimum data set (MDS) of indicators was defined to determine the soil quality index. It consisted of the following soil properties: bulk density (BD), total porosity (Tp), pH, electrical conductivity (EC), total nitrogen (TN), organic matter (OM), total organic carbon (TOC), available phosphorus (AP), cation exchange capacity (CEC), carbonates, active limestone, available boron (AB), and water retention capacity (WRC).
The composite soil samples were collected at three different depths (0–10 cm, 10–20 cm, and 20–40 cm) following a zig-zag design over the studied orchards. Each composite sample consisted of five sub-samples, one collected at a central point, while the remaining four were taken in either direction (north, south, east, and west), both in the tree rows and inter-rows. These sub-samples were bulked to obtain a composite sample per depth. Three composite samples per depth were collected in each orchard, which were considered sufficient to cover the orchard internal variability since the surveyed almond orchards were <0.8 ha in surface.
These disturbed soil samples (≈1 kg) were air dried and sieved through 2 mm mesh. In total, 27 samples (3 orchards × 3 depths × 3 replicates) were collected. They were used for determining soil texture, organic matter, and chemical properties.
The undisturbed soil samples were collected at 6–10 cm depth, amounting 9 samples (3 orchards × 3 replicates). These samples were taken with cores 64.5 mm diameter and 19.5 mm in height. They were used for assessing the total porosity and bulk density.
The soil properties considered in the current study were determined using routine methods [26]. Particle size analysis (coarse and fine fractions as well as the contents in sand, silt, and clay) was conducted after organic matter destruction with H2O2, elimination of Fe and Al oxihydroxides with HCl, and dispersion with hexametaphosphate and sodium carbonate. Particles > 50 mm were separated by wet sieving, while those < 50 mm were separated through the pipette method. The soil pH was determined in water (soil: solution 1:2.5). The organic matter was determined using the loss on ignition method and total organic carbon (TOC) was calculated from the organic matter using a conversion factor (1.72). The exchangeable Ca, Mg, Na, K, Al, and cation exchange capacity (CEC) were determined using absorption and emission spectroscopy [27]. The available phosphorus (AP) was determined using the Olsen method [28]. From these data, soil hydraulic properties (permanent wilting point, field capacity, and soil water retention capacity) were calculated employing pedotransfer functions that account for both the organic matter and the carbonate content in the soils [29].

2.3. Soil Quality Assessment

The soil quality was assessed following the approach suggested by Karlen and Stott [20] because of its flexibility, ease of use, and its potential for interacting with producers. In the current study, we integrated four soil functions into the following equation:
Soil Quality Index (SQI) = (wt1)FB + (wt2)NS + (wt3)WR + (wt4)CL
where FB is the rating for the soil capacity to filter and buffer toxic or hazardous materials, NS is the rating for the soil’s ability to supply nutrients to plants, WR is the rating for the soil capacity to store water, CL is the rating for the soil capacity to limit crop development, and wt1, wt2, wt3, and wt4 are the numerical weights corresponding to each soil function.
These numerical weights are assigned to each soil function according to their importance in fulfilling the overall goals of productivity and environmental protection under the conditions of this study. To quantify the numerical weights for each function, we considered agricultural aspects related to almond production [30]. Since the weights for all soil functions must sum 1 [20], we provided weight values of 0.1, 0.4, 0.3, and 0.2 to FB, NS, WR, and CL, respectively. We considered a lower value for the FB function because of the lower number of indicators used for assessing this function. In contrast, we assigned a higher weight to the NS function since the main goal of the orchard is productivity and because of the greater number of indicators used for determining this function. Since the almond orchards studied are in a Mediterranean region with a high irregularity in rainfall amounts and we do not expect great limitations caused by soil on the development of almond trees, we decided to allot a greater weight to the WR than to the CL function. An ideal soil would fulfill all the considered functions and obtain a SQI of 1. As a given soil fails to meet the ideal criteria, its SQI would fall, with zero being the lowest rating.
The soil quality indicators are associated with each soil function and the numerical weights assigned to these indicators must sum 1. These numerical weights are obtained through standardized scoring functions (SSFs) that normalize the indicator measurements to a value between 0 and 1 [19]. The scoring curves were generated following the principles of Systems Theory [31], as described in Fernandes et al. [21]. Thus, three types of SSFs typically used for soil quality assessment can be generated [32]: more-is-better (upper asymptotic curve), less-is-better (lower asymptote), and mid-point optima (Gaussian function) (Figure 1).
The more-is-better curves score soil properties that are associated with improved soil quality at higher levels. In this study, the following indicators were scored using more-is-better curves: OM, TOC, CEC, and WRC. In contrast, the less-is-better curves score soil properties that indicate poor quality at high levels. In the current study, the following indicators were scored using less-is-better curves: BD, EC, carbonates, active limestone, and AB content. The mid-point optima curves score those properties that have an increasingly positive influence on soil quality up to an optimal level beyond which their influence is detrimental. In this study, Tp, pH, TN, and AP content were scored using mid-point optima curves.
The shapes of the curves (Figure 1) are determined by critical values (Table 1), which were defined based on the literature. These critical values are soil property magnitudes where the scoring function equals one when the measured soil attribute is at an optimal level or equals zero when the soil attribute is at an unacceptable level. Baselines are soil property values where the scoring function equals 0.5 and equal the midpoints between threshold soil property values. In this study, scoring functions and thresholds for normalizing the measurements, assigning them values between 0 and 1, were taken from the literature (Table 1). The threshold and baseline values for the selected soil quality indicators were established as follows:
  • Bulk density (BD): The considered baseline was 1.6 g cm−3 because several studies on almond orchards reported BD around this value [33,34,35,36]. The lower limit was established at 1 g cm−3 because lower values may cause inadequate plant anchoring and a reduction in plant available water capacity [37].
  • Total porosity (Tp): Upper and lower thresholds considered were 25% and 50%, respectively. These values corresponded with the minimum and maximum BD observed in previous studies on almond orchards in Spain [33,35].
  • pH: Lower and upper baselines of 5.5 and 8.4, respectively, were adopted as they are considered as an optimal range for crop production [30].
  • Electrical conductivity (EC): We considered an upper threshold of 4 dS m−1, as this is the limit indicated by Arquero [30]. However, the baseline was set to 1.6 dS m−1 since this value limits almond production.
  • Total nitrogen (TN): The optimal range considered was from 0.11% to 0.2% [30].
  • Organic matter (OM): The considered baseline was 1.5%, as most almond orchards in Spain are grown on marginal lands with low organic matter contents [33,36].
  • Total organic carbon (TOC): As for OM, soils in almond orchards are not expected to have high contents in organic carbon, so we set the baseline at 0.88%.
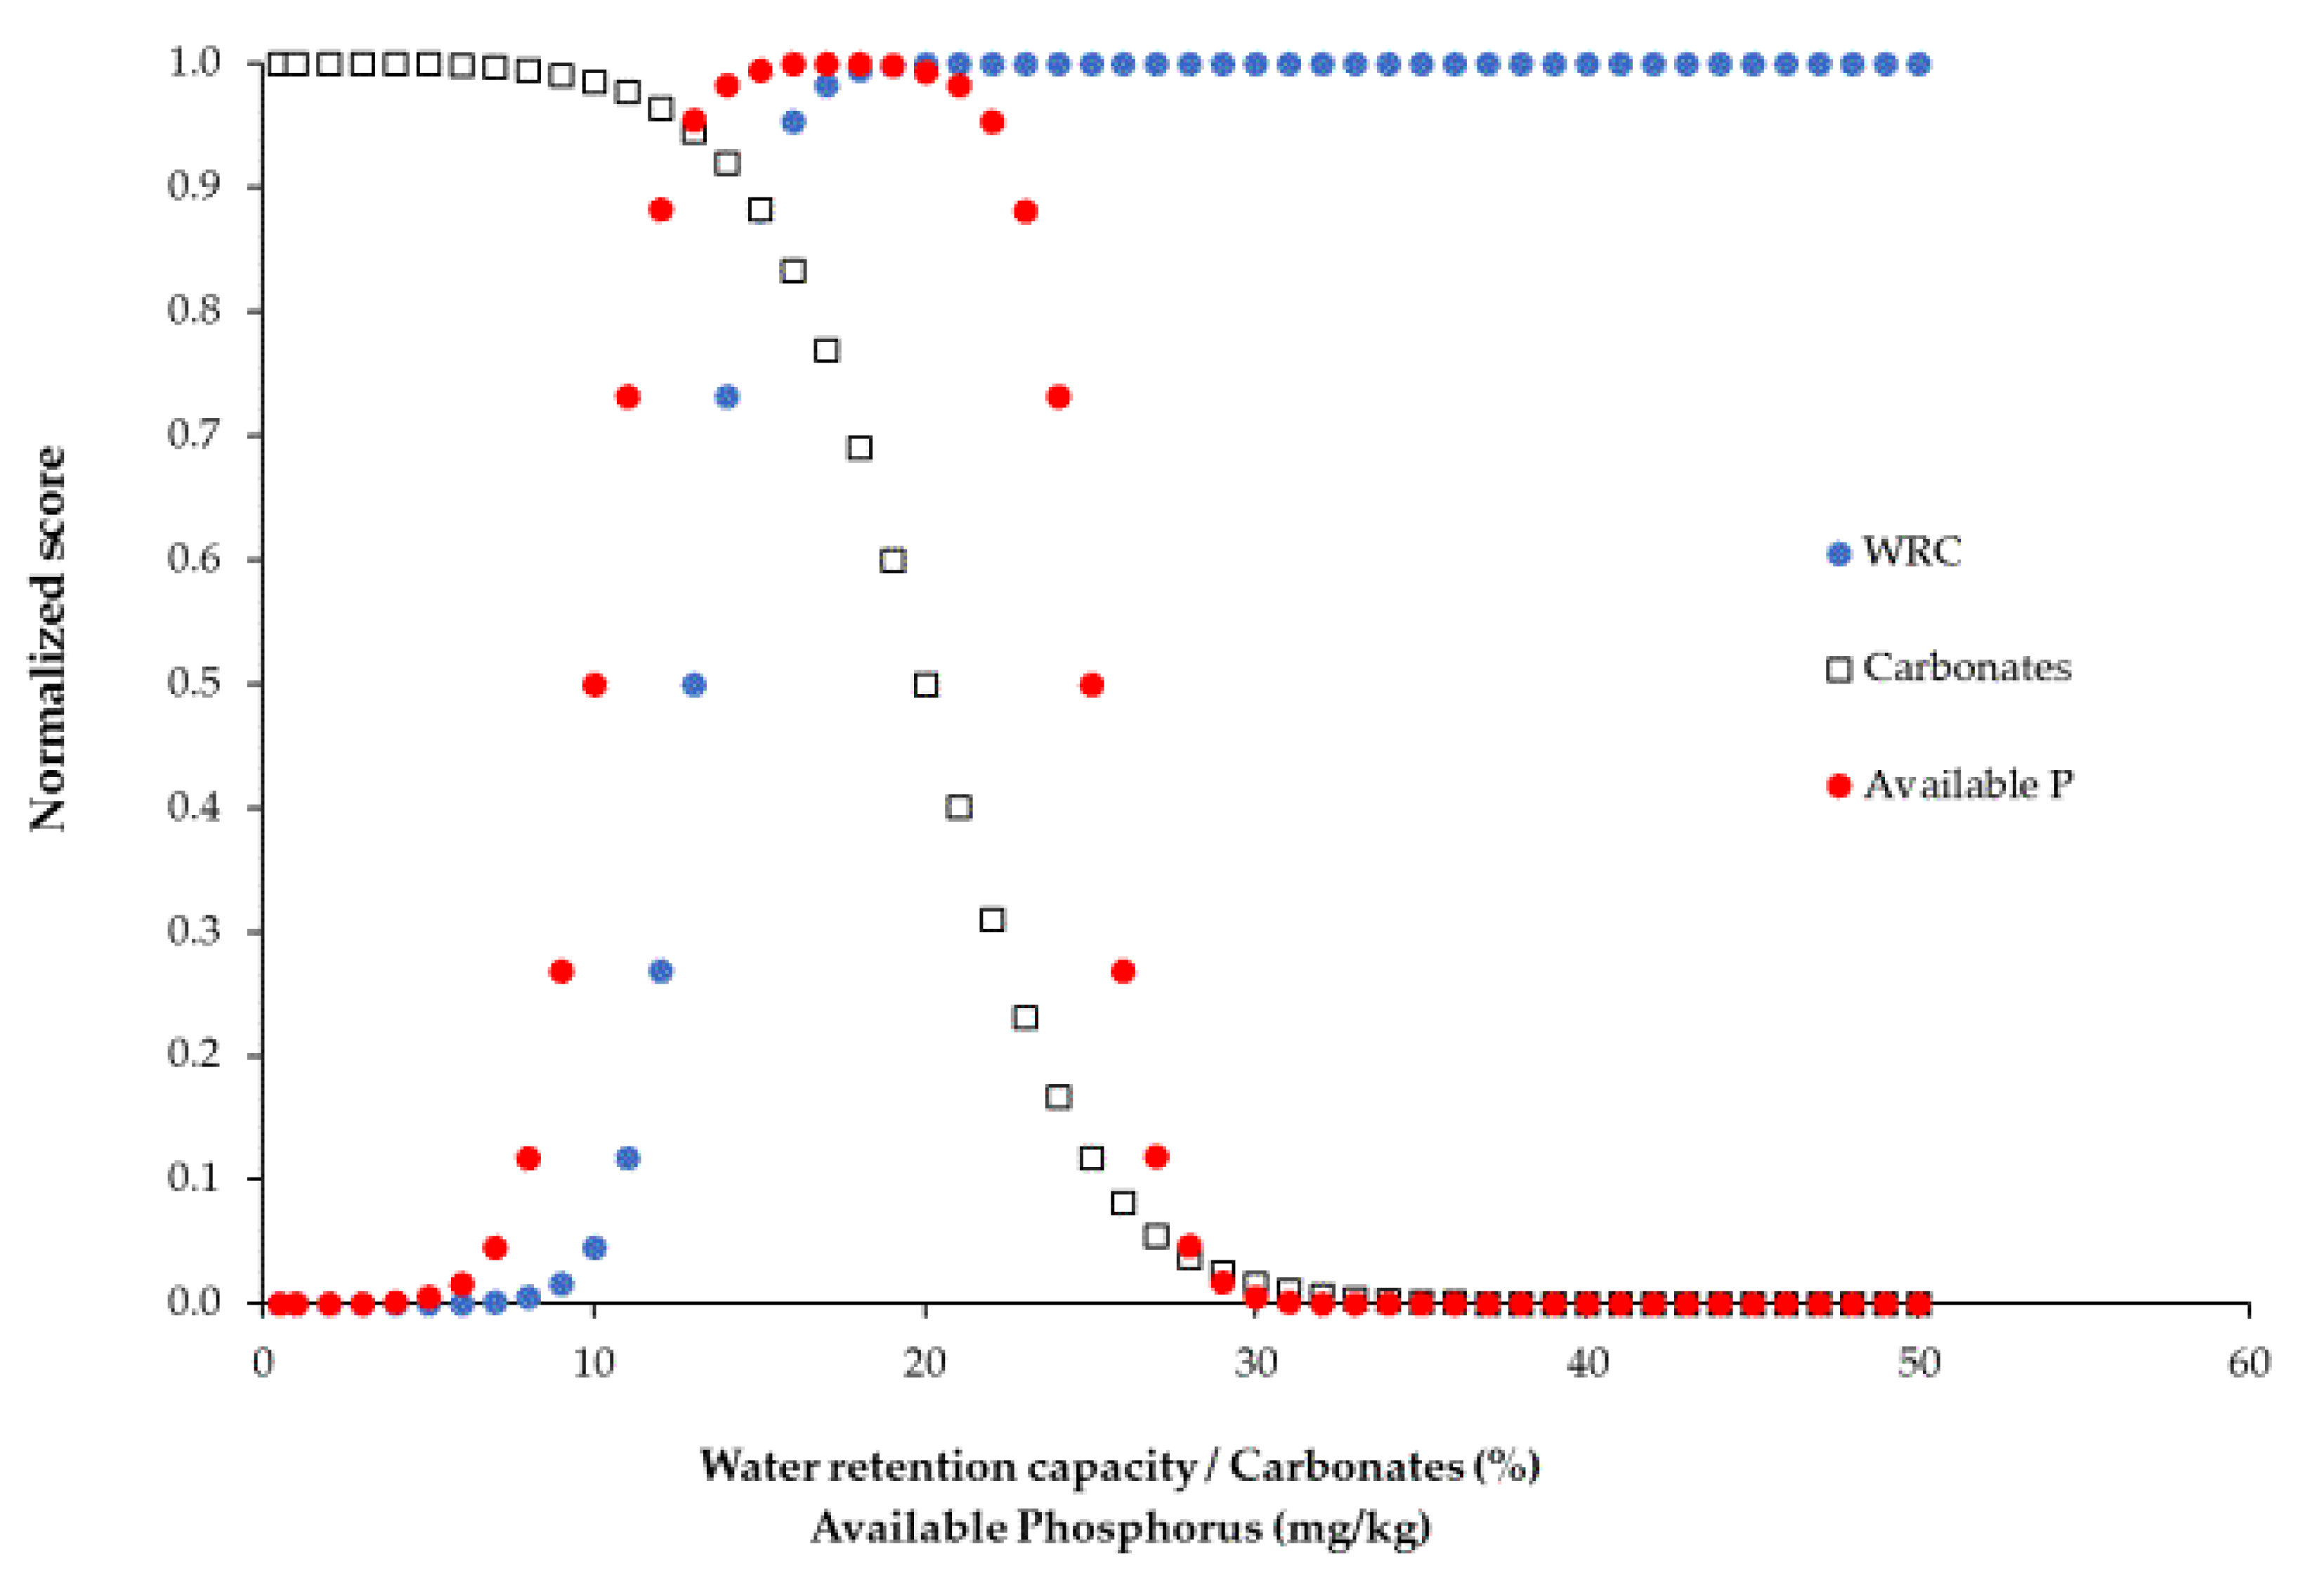
  • Available phosphorus (AP): Arquero [30] reported optimal AP contents between 10 and 25 mg kg−1. Therefore, we used these values as lower and upper baselines, respectively.
  • Cation exchange capacity (CEC): We considered 18 meq 100 g−1 as a baseline [30].
  • Carbonate content: Values around 40% can compromise crop development, so we used this value as the upper threshold [30].
  • Active limestone: Values higher than 9% can compromise crop performance, so we considered this value as the upper threshold [30].
  • Available boron (AB): According to Arquero [30], soil boron contents higher than 0.6 mg kg−1 may pose problems to crop performance, so we used 0.5 mg kg−1 as a baseline.
  • Water retention capacity (WRC): 13% was set as baseline, as this value seems to be usual in almond orchards in Spain [33,34,35,36].
After scoring all soil quality indicators, the values of each soil function are determined by adding the magnitudes of the products between the weight of each soil function and the normalized soil parameter scores. The SQI is obtained by the sum of the soil function scores.

2.4. Statistical Analysis

The data were submitted to Shapiro–Wilk and Bartlett tests to assess their normality and homoscedasticity. When these assumptions were met, a one-way analysis of variance was performed to assess the differences among orchards for a given indicator. The means were separated using the Tukey HSD (Honest Significant Difference) test. When the data did not meet the normality and homoscedasticity assumptions, they were analyzed using the Kruskal–Wallis test and the means were separated using the Dunn test. The statistical analyses were conducted using R statistical software version 4.0.5 [38].

3. Results

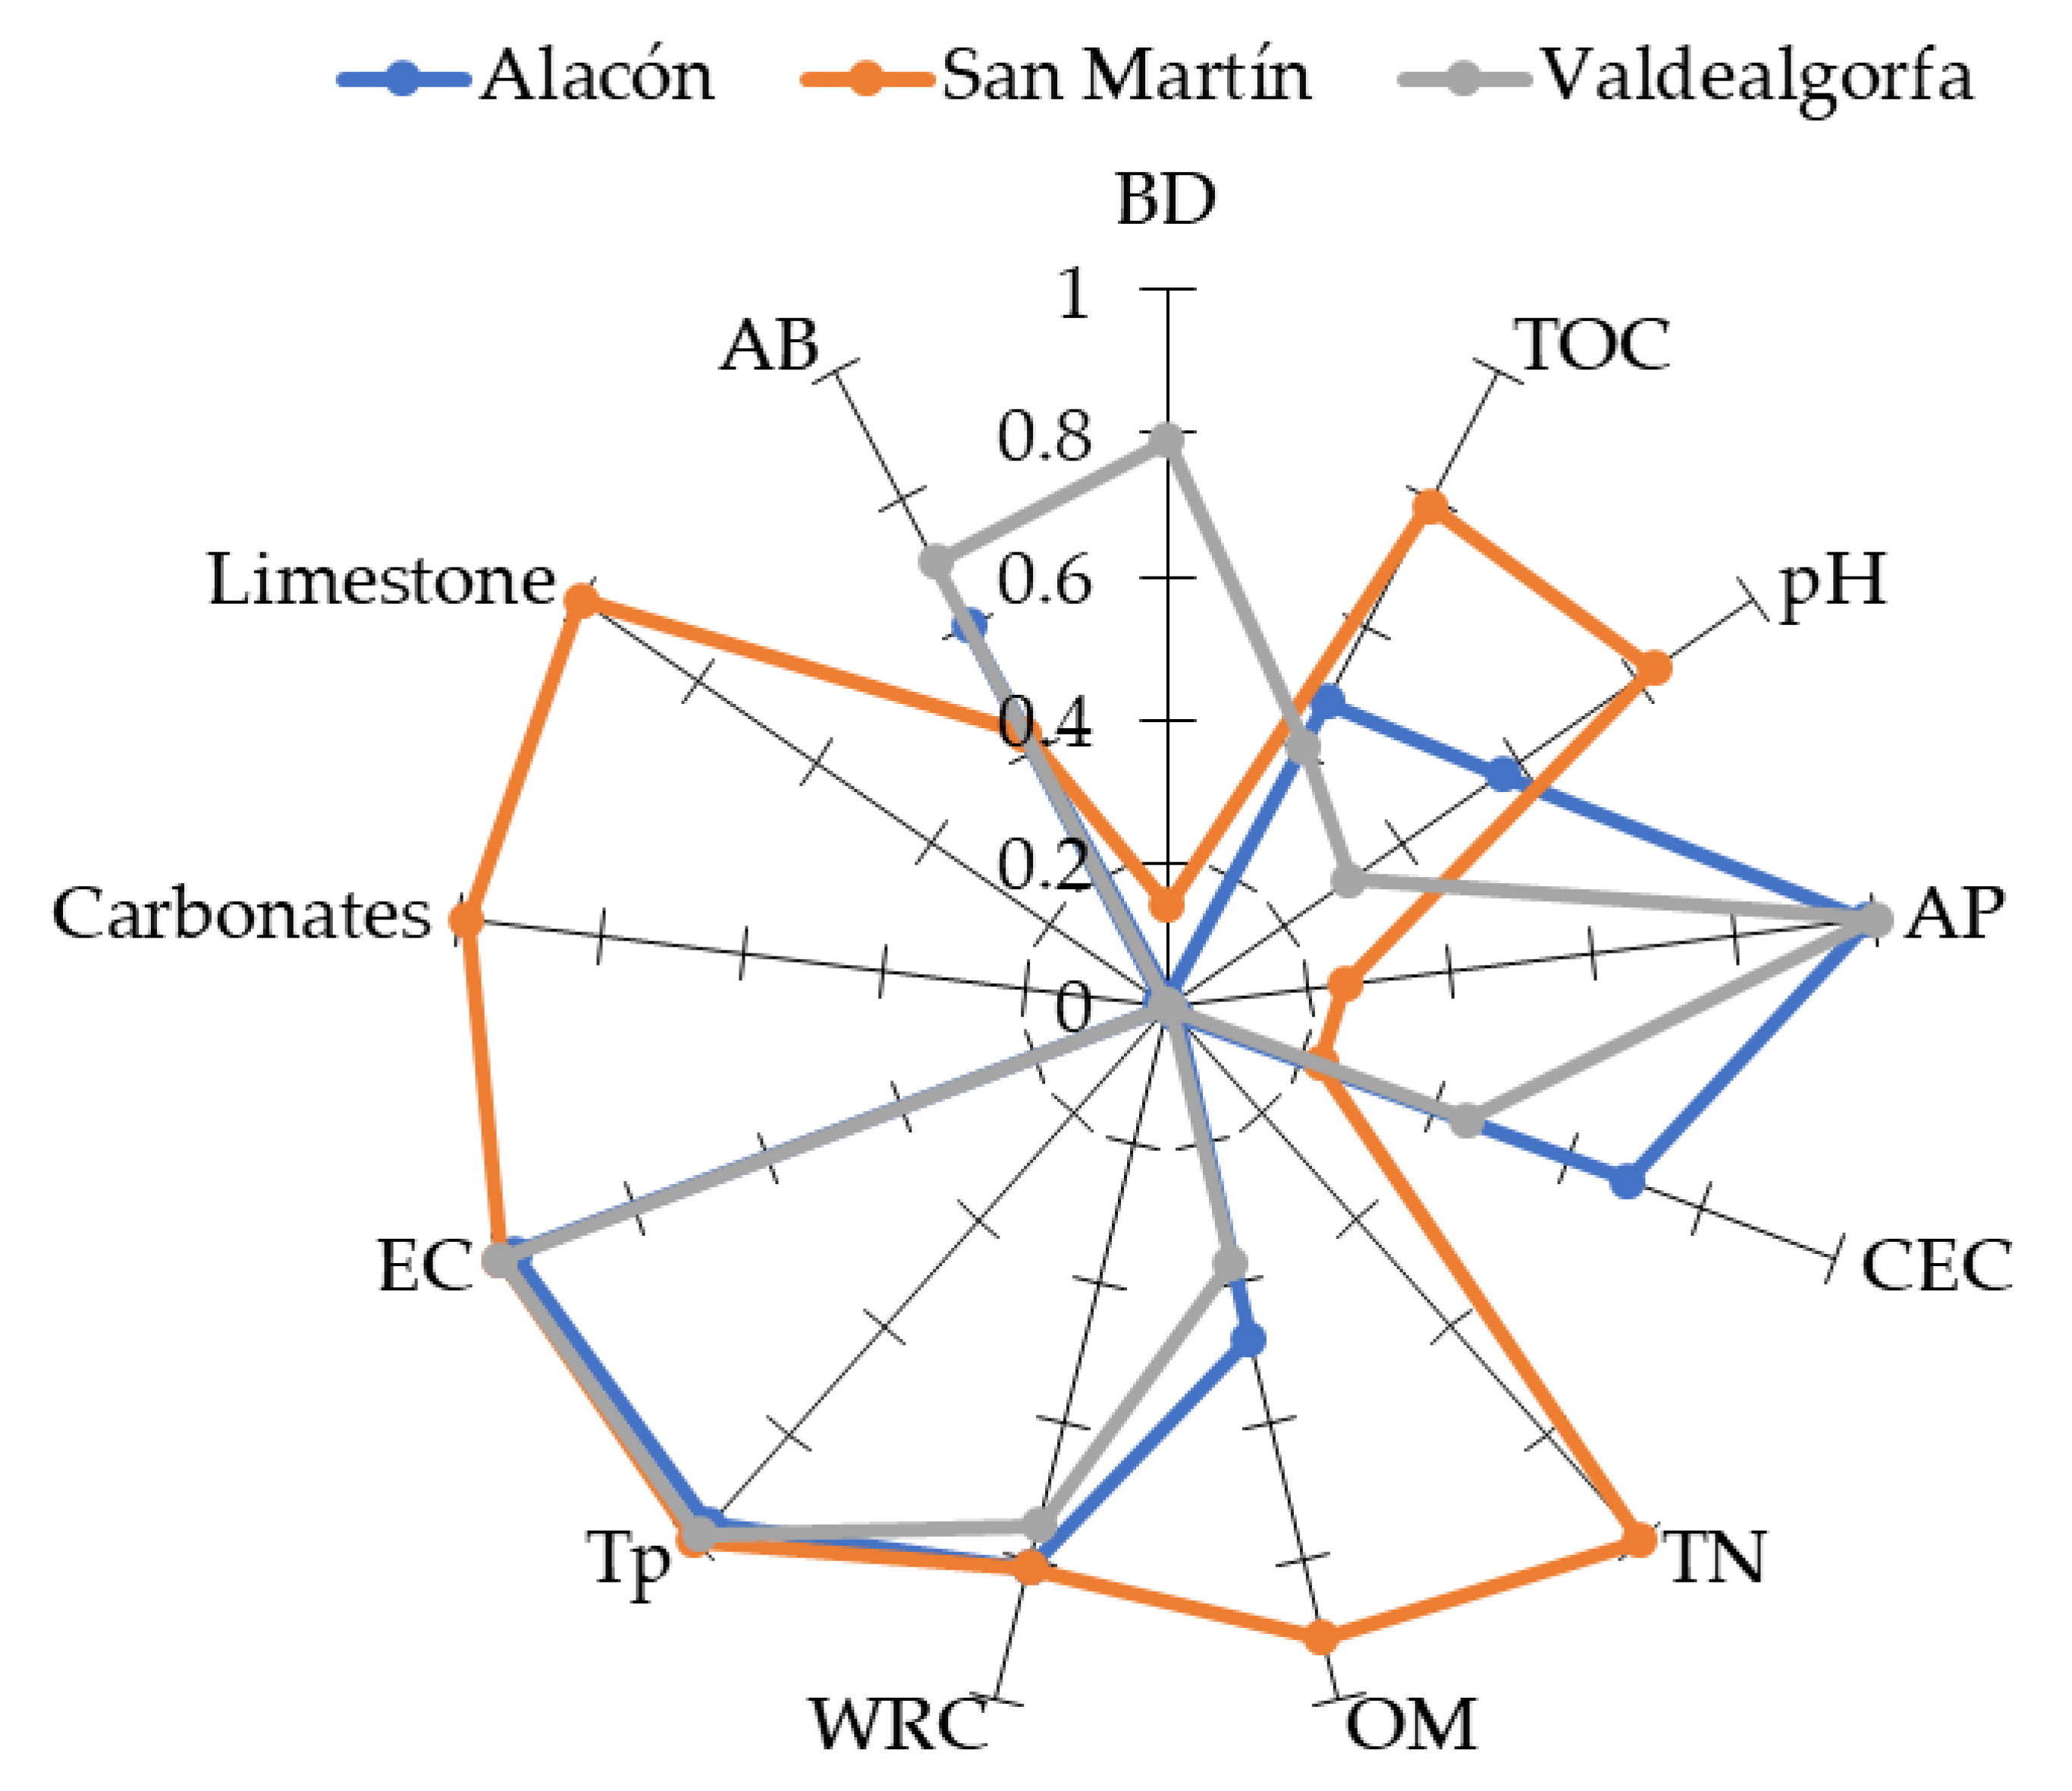
3.1. Soil Quality Indicators: Comparison among Orchards

From the 13 indicators considered in this study, 12 differed significantly among the almond orchards (Table 2). The bulk density was lower in Valdealgorfa than in Alacón, while this indicator had an intermediate value in San Martín. The TOC content was higher in San Martín than in Valdealgorfa, while Alacón had an intermediate value. The soil pH was lower in San Martín and higher in Valdealgorfa. The available P content was higher in San Martín and lower in Valdealgorfa. The CEC was higher in Alacón and lower in San Martín. The highest total nitrogen and OM contents were observed in San Martín. The soil WRC was similar in the three orchards. The porosity was higher in Valdealgorfa than in Alacón. Although low in the three orchards, the EC was higher in San Martín and Alacón. The lowest contents in carbonates and active limestone were observed in San Martín. Finally, the AB was higher in the San Martín soil than in those from Alacón and Valdealgorfa (Table 2).

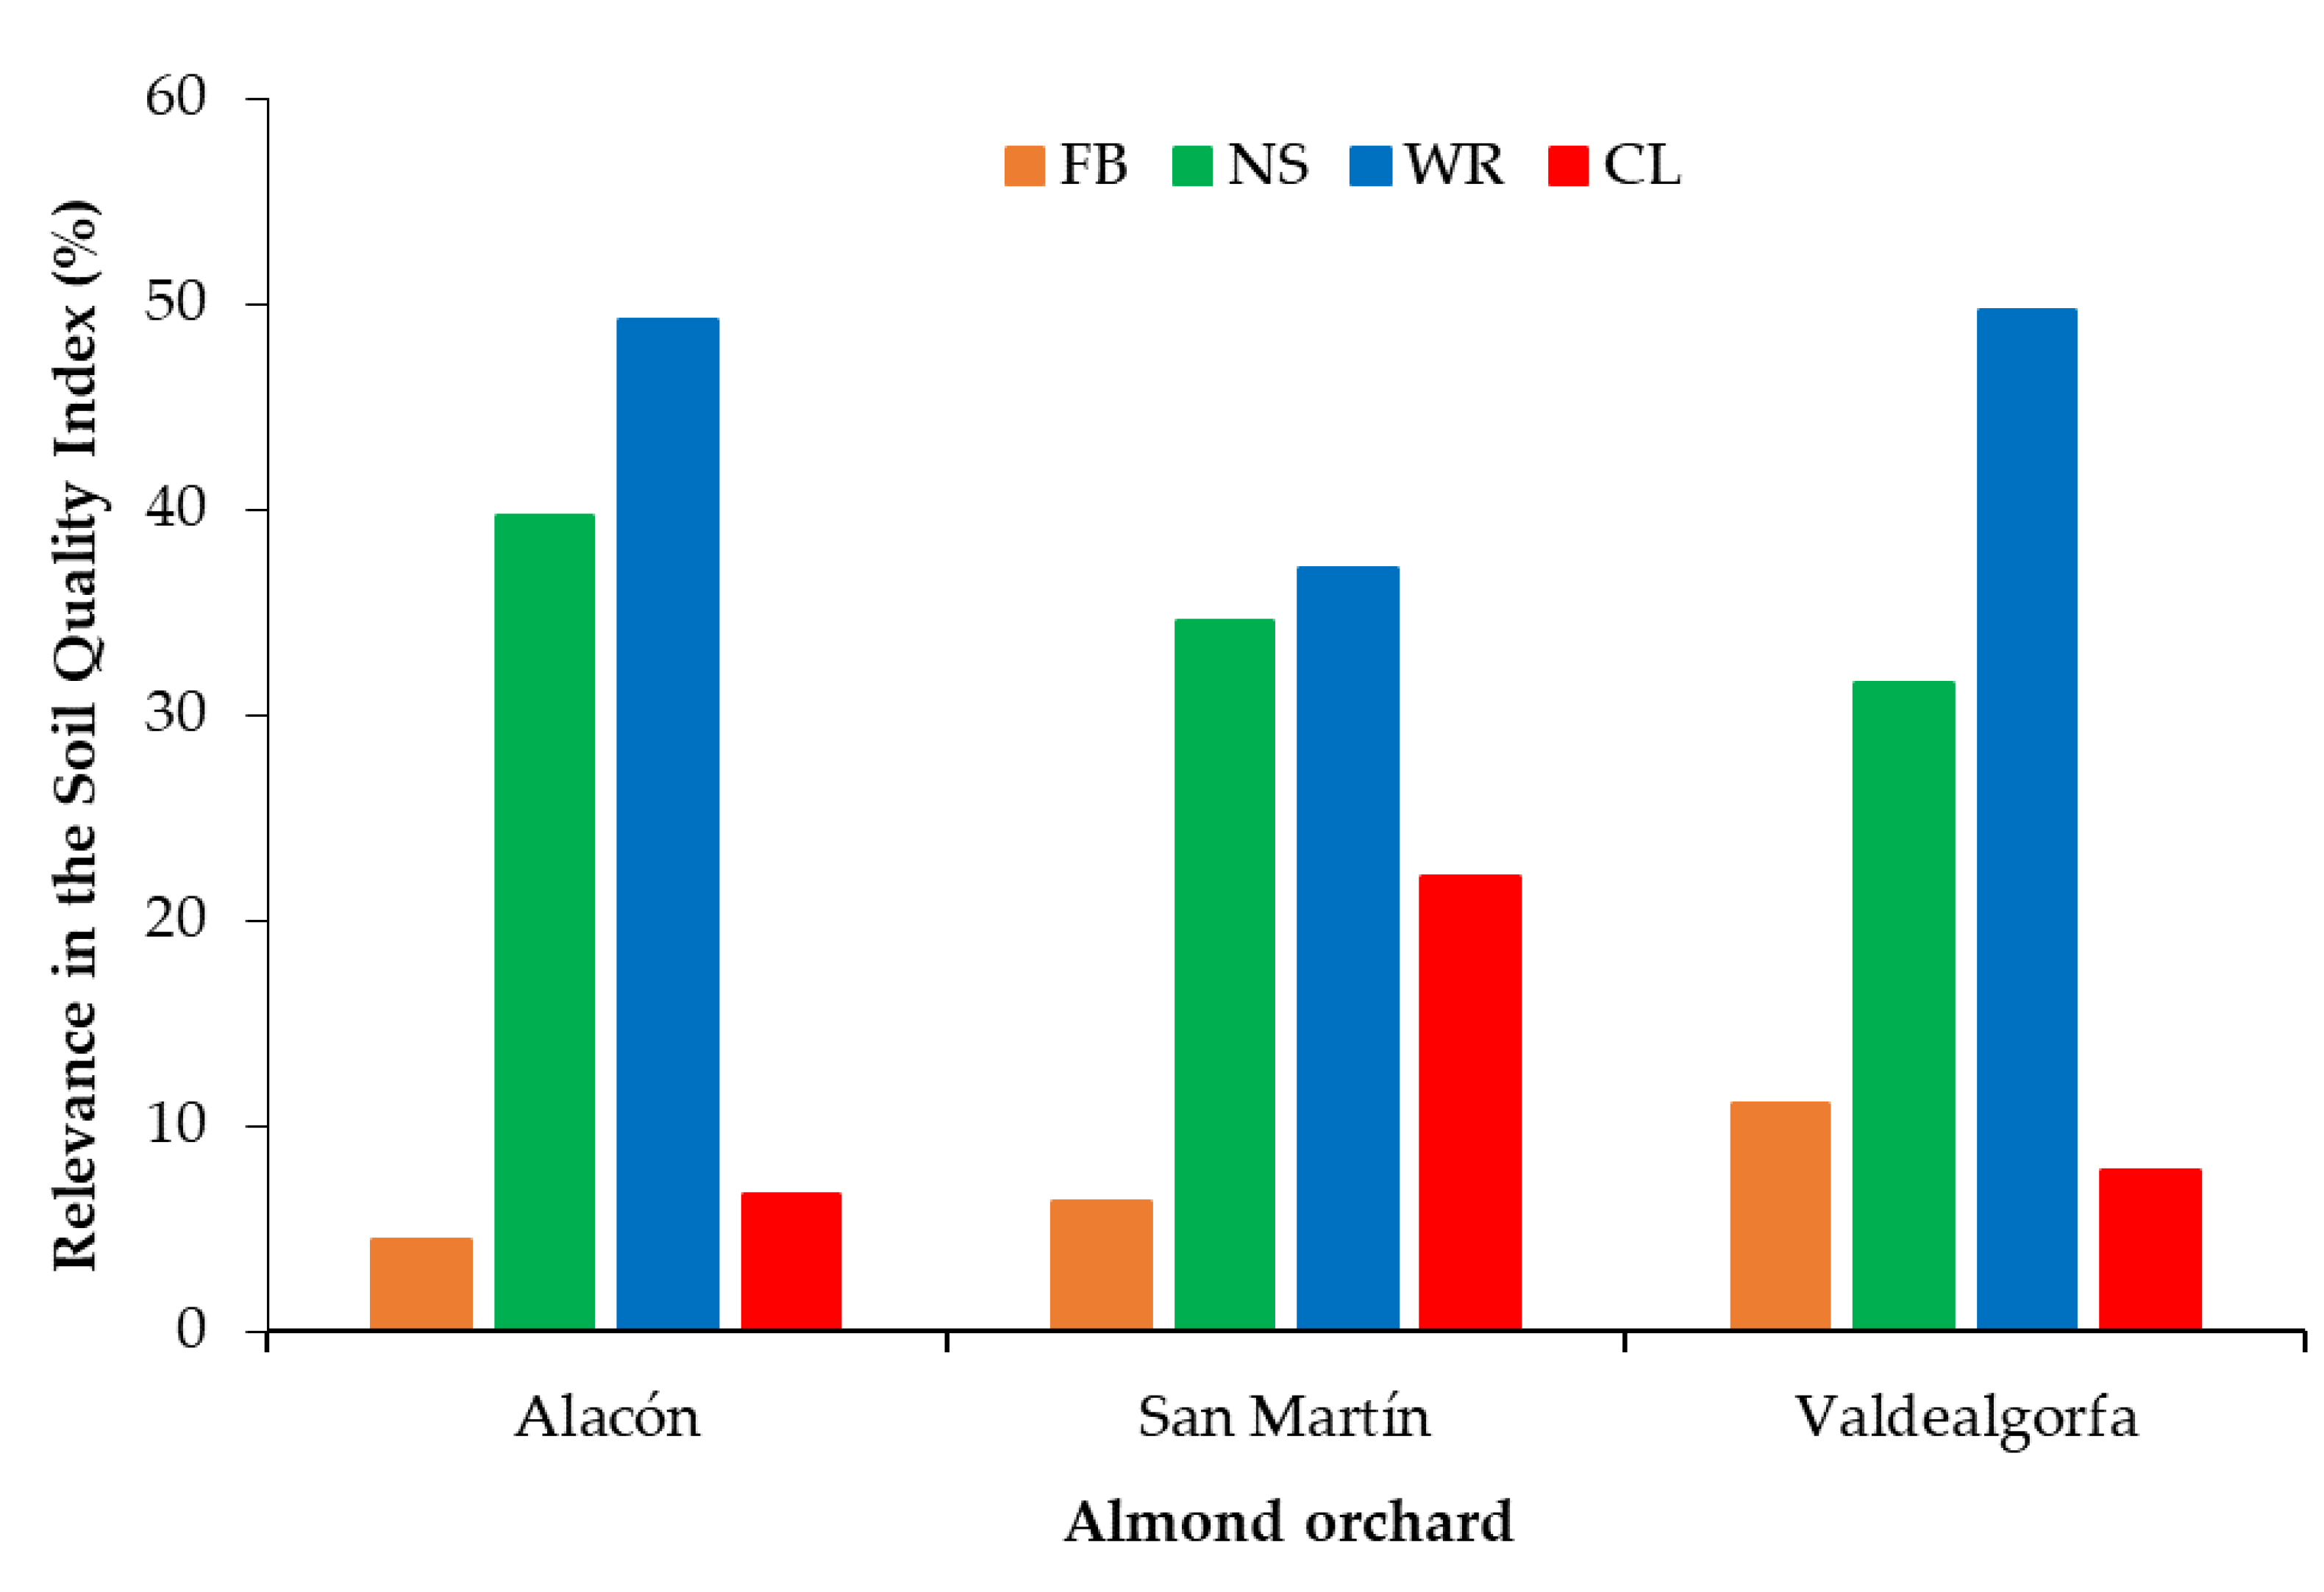
3.2. Soil Quality Score Cards

The SQI of the Alacón orchard was 0.55 (Table 3). In this orchard, several indicators received low scores (less than 0.2), including BD, TN, carbonates, and active limestone contents. However, the SQI of this orchard increased due to the values of indicators such as AP, Tp, and EC (Table 3).
The SQI of the San Martín orchard was 0.75 (Table 4). In this orchard, only one indicator received a score lower than 0.2: BD. In contrast, the SQI of this orchard increased due to the high scores of indicators such as TN, OM, Tp, EC, carbonates, and limestone content (Table 4).
The SQI of the Valdealgorfa orchard was 0.54 (Table 5), very similar to that of Alacón. In this orchard, several indicators received low scores (less than 0.2), including TN, carbonates, and active limestone contents. As in the case of the Alacón orchard, the SQI of Valdealgorfa increased due to the values of indicators such as AP, Tp, and EC (Table 5).
The contribution of the soil functions to the SQI ranged as follows: filtering and buffering (FB) from 4.4% to 11.1%, nutrient supply (NS) from 31.5% to 39.7%, water relations (WR) from 37.2% to 49.6%, and crop limitation (CL) from 6.6% to 22.1%, depending on the orchard location (Figure 2). The WR function contributed to more than 35% of the SQI in all orchards (Figure 2) despite it not receiving the highest weight value (0.3). This function was slightly lower in San Martín than in the remaining two orchards. In addition, the NS function contributed more than 30% to the SQI value, although varying among orchards, likely due to differences in soil nature and in management systems. The FB function was higher in Valdealgorfa than in the other two orchards, likely due to the organic management performed in this site. Finally, the CL function was higher in San Martín (22%) than in the other two orchards (<8%), suggesting that the soil in this orchard would not compromise crop development.
The normalized scores for the soil attributes considered in this study are shown in Figure 3, allowing for the visualization of the differences in each soil quality indicator for the three orchards. A couple of these properties, Tp and EC, received the maximum score value (1.0) for all the surveyed almond orchards. In contrast, BD, AP, pH, CEC, and OM showed highly variable ratings for the three almond orchards. The score of BD was 0.8 for the Valdealgorfa orchard, while it was less than 0.2 for the remaining two orchards. Besides, the soil at the San Martín orchard received scores higher than 0.75 for TOC, pH, TN, OM, WRC, Tp, EC, carbonates, and active limestone. In contrast, the soils from Alacón and Valdealgorfa received scores lower than 0.5 for several indicators, including TN, OM, carbonates, and active limestone (Figure 3).

4. Discussion

The current study confirmed the need for assessing soil quality in tree orchards to warrant their sustainability by performing informed decisions for their management. The soils of the surveyed almond orchards had SQIs between 0.54 and 0.75, depending on their location and nature. According to the SQI classification of Karlen and Stott [20], these soils possess an acceptable quality for crop production and, in the case of San Martín, the soil had a good quality. The SQI obtained in this study reflected the appropriate chemical fertility and the adequate physical structure of the soils in these almond orchards, although the SQI showed some characteristics, such as high contents in carbonates and limestone [30], that may limit almond tree performance.
It must be noticed that a standard classification of soils according to their SQI is not available, which causes comparisons with other studies to be difficult. The limitation of this methodology comes from the fact that the MDS of the soil quality indicators differ among studies, as well as the weights given to each soil function and indicators [21]. Nevertheless, the methodology employed in the current study proved useful for comparing management systems for a given soil [19,21,39,40]. In this context, the selection of the MDS for determining the soil quality is a crucial step that must be carefully conducted. In the current study, we selected soil properties from which we could set thresholds and baselines related to almond production by employing specific examples from the literature [30,33,35,41,42], so we are confident that the obtained results are reliable.
In fact, the current study showed that the selected soil properties were able to differentiate the soil quality status among orchards. From the 13 indicators used in this study, only three did not differ among orchards when normalized to their standardized score: EC, Tp, and WRC. This agrees with former studies showing that these properties tended to remain relatively stable in the soils of almond orchards along a toposequence [43] and in time despite contrasting soil management conditions [42,44]. In contrast, the remaining ten soil properties were able to detect considerable differences among almond orchards, most of them regarding aspects of soil fertility (OM, TOC, pH, CEC, TN, and AP), but also physical quality (BD) and potential restrictions to crop development (carbonates, active limestone, and AB contents). In the studied orchards, the indicators that decreased the soil quality were the low values of OM, TOC, TN, CEC, and AP, since they decreased the magnitude of the function related to nutrient supply. In addition, high values of carbonates, active limestone, and AB reduced the soil quality in the studied orchards because they can compromise crop development. In fact, a recent study showed that low soil boron contents enhanced almond yield in Portugal [45]. These results suggested that the evaluated soils could be adequate for almond production, but they require management actions to improve their quality to increase the sustainability of these agroecosystems, such as the application of organic amendments, as suggested by Villa et al. [46]. It must be noticed that the studied orchards are established in marginal lands with low productivity potentials, which can explain the low magnitudes of the soil fertility attributes. Another management action that could improve soil quality in the surveyed orchards could be the establishment of sown cover crops, as they have been proven effective for mitigating soil erosion, enhancing soil fertility, and carbon sequestration in irrigated almond plantations in South Spain [47].
In fact, orchard location and soil nature influenced the magnitudes of the indicators related with nutrient supply and crop limitation functions. The almond orchard located in the riverbank (San Martín) benefited from low carbonate and active limestone contents when compared to the other two orchards (Alacón and Valdealgorfa), which are planted on calcareous soils from marginal lands. Moreover, OM and nutrient availability were higher in San Martín than in Alacón and Valdealgorfa. This agrees with the observations from a recent study in Iran in which a survey of the soil from a mature almond orchard located on a hillslope was carried out [43]. This survey showed that the soil in the upper parts of the slope (summit and backslope, which can be assimilated to those from Alacón and Valdealgorfa) had lower TOC, TN, and AP contents than the soils in the lower parts of the slope (footslope and toeslope, which can be assimilated to that of San Martín).
In addition, it should be assumed that some of the indicators used to define the magnitudes integrated in the SQI of each studied orchard are a direct function of the taxonomic and functional diversity of the soils where these crops are located (soil macro and micro diversity). These emerging properties associated with the activity of the living fraction of the soil should also be integrated into the approach for determining soil quality, with the incorporation of data obtained from the application of high-performance sequencing techniques that allow characterizing the microbial diversity associated with each type of agroecosystem and its functional role in modeling some of the properties and magnitudes considered in this study (for instance those specifically associated with nutrient supply or filtering and buffering functions) [48].
Unfortunately, research on soil quality indices in tree orchards is scarce [12]. However, Castellini et al. [41] assessed the effects of tillage on the soil physical quality of an almond orchard in South Italy. They observed that, after 30 years of no tillage, the soil could be classified as of good quality. Nevertheless, the tilled soil in their almond orchard also showed signs of good physical quality in terms of bulk density and water retention capacity [41]. In contrast, another study carried out in Southeast Spain concluded that, despite improving soil physical quality, no-tillage can cause reductions in almond yield due to a strong decrease in the concentrations of available nitrogen in the soil [44]. In the current study, the three orchards were tilled, which might have affected the values of soil physical properties, such as high bulk densities. However, the studied soils had a near optimal water retention capacity, when compared to the standards reported by Castellini et al. [41]. Moreover, long term studies showed slight differences in water retention capacities on the first 40 cm deep of soils devoted to almond orchards [42]; therefore, the soils of the surveyed orchards could maintain their acceptable water retention capacities despite tillage operations.
The SQI calculated for the studied almond orchards were similar to those reported by Raiesi and Tavakoli [43] in Iran for the backslope of a toposequence, in the case of Alacón and Valdealgorfa, while the SQI of San Martín was similar to the almond orchards located in the footslope of the toposequence. However, these comparisons are not straightforward due to the different datasets of soil properties used in both studies, as well as the approach employed to compute the SQI. Moreover, the thresholds and baselines used for determining the scoring functions to normalize the values of most of the soil quality indicators used in this study were not specific for almond orchards, but general for crop production. This limitation could have affected the final SQI value, so research for defining specific values for these soil properties in the context of almond production is needed.
In this sense, the correct interpretation of the SQI obtained in the current study requires a full report that must include the score card, the scoring function parameters and information sources used for weighting the soil properties measured. For instance, a soil quality report for the Alacón soil would consist of Table 1 and Table 3. These two tables provide detailed information on the relationship of each soil indicator to the overall soil quality and, more importantly, how that relationship was defined. Finally, as suggested by other authors [19,21], although the SQI shown in this study corresponds to a given timeframe, it could easily be used to assess soil quality dynamics over several seasons. Then, agricultural consultants, extensionists, researchers, and growers can use such a timeline soil quality report to perform informed decisions, interpret field observations, and evaluate laboratory results, leading to the sustainable management of these agroecosystems. Information on soil quality is crucial for achieving the key challenge of designing orchard systems that can integrate sustainable practices, nutrient cycle knowledge, and the promotion of soil biodiversity [49].

5. Conclusions

In the current study, the methodology used for assessing soil quality was efficient in identifying the impact of location, management practices, and soil nature on the quality status of the soils in young almond orchards. However, there were some uncertainties regarding the standardization of soil indicator values due to the difficulty in finding specific baselines and thresholds for this specific agroecosystem. The soil functions that contributed more to the overall soil quality index were nutrient supply and water relations. In addition, the indicators used for quantifying the limitations to crop production generated large differences among sites. In the end, the overall soil quality indexes ranged from 0.54 to 0.75. These values suggested that the evaluated soils are adequate for almond production, although they require management actions to improve their quality (for instance, the application of organic amendments) and increase the sustainability of these agroecosystems. In the future, this framework for assessing soil quality in fruit orchards would be extended to include the biological component of the soil by incorporating data obtained from high-performance sequencing techniques, characterizing the microbial diversity associated with each type of agroecosystem and its functional role in modeling some of the indicators reported in the current study.

Author Contributions

Conceptualization, J.M.M.-A. and V.G.; methodology, J.M.M.-A., P.M., B.B., S.S., M.J.R.C. and V.G.; formal analysis, J.M.M.-A.; investigation, J.M.M.-A., P.M., S.S. and V.G.; resources, P.M., M.J.R.C. and V.G.; data curation, J.M.M.-A.; writing—original draft preparation, J.M.M.-A.; writing—review and editing, J.M.M.-A., P.M., S.S., B.B., M.J.R.C. and V.G.; project administration, V.G.; funding acquisition, V.G. All authors have read and agreed to the published version of the manuscript.

Funding

This research was funded by FITE (Fondo de Inversiones de Teruel), grant number ECOALMOND PLUS. The APC was funded by discount vouchers issued to the corresponding author.

Institutional Review Board Statement

Not applicable.

Informed Consent Statement

Not applicable.

Data Availability Statement

The data presented in this study are available on request from the corresponding author.

Acknowledgments

The authors wish to show their gratitude to the owners of the orchards for the facilities given to carry out the different sampling and monitoring tasks.

Conflicts of Interest

The authors declare no conflict of interest. The funders had no role in the design of the study; in the collection, analyses, or interpretation of data; in the writing of the manuscript; or in the decision to publish the results.

References

  1. Maharjan, B.; Das, S.; Acharya, B.S. Soil Health Gap: A concept to establish a benchmark for soil health management. Global Ecol. Conserv. 2020, 23, e01116. [Google Scholar] [CrossRef]
  2. Borrelli, P.; Robinson, D.A.; Panagos, P.; Lugato, E.; Yang, J.E.; Alewell, C.; Wuepper, D.; Montanarella, L.; Ballabio, C. Land use and climate change impacts on global soil erosion by water (2015–2070). Proc. Natl. Acad. Sci. USA 2020, 117, 21994–22001. [Google Scholar] [CrossRef] [PubMed]
  3. FAO-ITPS. Status of the World’s Soil Resources (SWSR)–Main Report; Food and Agriculture Organization of the United Nations and Intergovernmental Technical Panel on Soils: Rome, Italy, 2015; p. 650. Available online: https://www.fao.org/3/i5199e/I5199E.pdf (accessed on 12 October 2022).
  4. Joint Research Centre, Institute for Environment and Sustainability. Soil Threats in Europe; Tesfai, M., Øygarden, L., Hessel, R., Panagos, P., Kværnø, S., Verheijen, F., Ballabio, C., Stolte, J., Keizer, J., Eds.; European Union Publications Office: Luxembourg, 2015. [Google Scholar] [CrossRef]
  5. Ferreira, C.S.S.; Seifollahi-Aghmiuni, S.; Destouni, G.; Ghajarnia, N.; Kalantari, Z. Soil degradation in the European Mediterranean region: Processes, status and consequences. Sci. Tot. Environ. 2022, 805, 150106. [Google Scholar] [CrossRef] [PubMed]
  6. Ibricki, H.; Cetin, M.; Karnez, E.; Flügel, W.A.; Tilkici, B.; Bulbul, Y.; Ryan, J. Irrigation-induced nitrate losses assessed in a Mediterranean irrigation district. Agric. Water Manag. 2015, 148, 223–231. [Google Scholar] [CrossRef]
  7. Almagro, M.; de Vente, J.; Boix-Fayos, C.; García-Franco, N.; Melgares de Aguilar, J.; González, D.; Solé-Benet, A.; Martínez-Mena, M. Sustainable land management practices as providers of several ecosystem services under rainfed Mediterranean agroecosystems. Mitig. Adapt. Strateg. Glob. Chang. 2016, 21, 1029–1043. [Google Scholar] [CrossRef]
  8. Parras-Alcántara, L.; Lozano-García, B.; Keesstra, S.; Cerdà, A.; Brevik, E.C. Long-term effects of soil management on ecosystem services and soil loss estimation in olive grove top soils. Sci. Total Environ. 2016, 571, 498–506. [Google Scholar] [CrossRef]
  9. Durán Zuazo, V.H.; Rodríguez Pleguezuelo, C.R. Soil-erosion and runoff prevention by plant covers. A review. Agron. Sustain. Develop. 2008, 28, 65–86. [Google Scholar] [CrossRef] [Green Version]
  10. Ramos, M.E.; Benítez, E.; García, P.A.; Robles, A.B. Cover crops under different managements vs. frequent tillage in almond orchards in semiarid conditions: Effects on soil quality. Appl. Soil Ecol. 2010, 44, 6–14. [Google Scholar] [CrossRef]
  11. Cerdà, A.; Rodrigo-Comino, J.; Giménez-Morera, A.; Keesstra, S.D. Hydrological and erosional impact and farmer’s perception on catch crops and weeds in citrus organic farming in Canyoles river watershed, Eastern Spain. Agric. Ecosys. Environ. 2018, 258, 49–58. [Google Scholar] [CrossRef]
  12. Morugán-Coronado, A.; Linares, C.; Gómez-López, M.D.; Faz, A.; Zornoza, R. The impact of intercropping, tillage and fertilizer type on soil and crop yield in fruit orchards under Mediterranean conditions: A meta-analysis of field studies. Agric. Syst. 2020, 178, 102736. [Google Scholar] [CrossRef]
  13. Ministerio de Agricultura, Pesca y Alimentación. Anuario de Estadística 2020; Secretaría General Técnica, Centro de Publicaciones. Gobierno de España: Madrid, Spain, 2021; p. 872. [Google Scholar]
  14. FAOSTAT. Crop and Livestock Products. Food and Agriculture Organization of the United Nations. Available online: https://www.fao.org/faostat/en/#data/QCL (accessed on 5 October 2022).
  15. Doran, J.W.; Parkin, T.B. Defining and assessing soil quality. In Defining Soil Quality for a Sustainable Environment; Doran, J.W., Coleman, D.C., Bezdicek, D.F., Stewart, B.A., Eds.; Soil Science Society of America: Madison, WI, USA, 1994; pp. 3–21. [Google Scholar] [CrossRef] [Green Version]
  16. Doran, J.W.; Parkin, T.B. Quantitative indicators of soil quality: A minimum data set. In Methods for Assessing Soil Quality; Doran, J.W., Jones, A.J., Eds.; Soil Science Society of America: Madison, WI, USA, 1996; pp. 25–37. [Google Scholar] [CrossRef]
  17. Nortcliff, S. Standardisation of soil quality attributes. Agric. Ecosys. Environ. 2002, 88, 161–168. [Google Scholar] [CrossRef]
  18. Bünemann, E.K.; Bongiorno, G.; Bai, Z.; Creamer, R.E.; De Deyn, G.; de Goede, R.; Fleskens, L.; Geissen, V.; Kuyper, T.W.; Mäder, P.; et al. Soil quality—A critical review. Soil Biol. Biochem. 2018, 120, 105–125. [Google Scholar] [CrossRef]
  19. Andrews, S.S.; Karlen, D.L.; Cambardella, C.A. The soil management framework: A quantitative soil quality evaluation method. Soil Sci. Soc. Am. J. 2004, 68, 1945–1963. [Google Scholar] [CrossRef]
  20. Karlen, D.L.; Stott, D.E. A framework fir evaluatinf physical and chemical indicators of soil quality. In Defining Soil Quality for a Sustainable Environment; SSSA Special Publication No. 35; Doran, J.W., Ed.; SSSA: Madison, WI, USA, 1994; pp. 53–72. [Google Scholar]
  21. Fernandes, J.C.; Gamero, C.A.; Rodrigues, J.G.L.; Mirás-Avalos, J.M. Determination of the quality index of a Paleudult under sunflower culture and different management systems. Soil Till. Res. 2011, 112, 167–174. [Google Scholar] [CrossRef]
  22. Hussain, Z.; Deng, L.; Wang, X.; Cui, R.; Liu, G. A review of farmland soil health assessment methods: Current status and a novel approach. Sustainability 2022, 14, 9300. [Google Scholar] [CrossRef]
  23. Samaei, F.; Emami, H.; Lakzian, A. Assessing soil quality of pasture and agriculture land uses in Shandiz county, northwestern Iran. Ecol. Indic. 2022, 139, 108974. [Google Scholar] [CrossRef]
  24. Ibarra Benlloch, P. La diversidad edáfica del territorio aragonés. In Geografía Física de Aragón. Aspectos Generales y Temáticos; Peña, J.L., Longares, L.A., Sánchez, M., Eds.; Universidad de Zaragoza e Institución Fernando el Católico: Zaragoza, Spain, 2004; pp. 41–53. [Google Scholar]
  25. Badía-Villas, D.; del Moral, F. Soils of the arid areas. In The Soils of Spain; Gallardo, J.F., Ed.; World Soil Book Series; Springer International Publishing: Heidelberg, Germany; Cham, Switzerland, 2016; pp. 145–161. [Google Scholar]
  26. Carter, M.R.; Gregorich, E.G. (Eds.) Soil Sampling Methods of Analysis; Canadian Society of Soil Science: Pinawa, MB, Canada; CRC Press: Boca Raton, FL, USA, 2008; p. 1224. [Google Scholar]
  27. Sumner, M.E.; Miller, W.P. Cation exchange capacity and Exchange coefficients. In Methods of Soil Analysis Part 3 Chemical Methods; American Society of Agronomy: Madison, WI, USA, 1996; pp. 437–474. [Google Scholar]
  28. Olsen, S.R.; Sommers, L.E. Phosphorus. Methods of Soil Analysis Part 2 Chemical and Microbiological Properties; American Socitey of Agronomy: Madison, WI, USA, 1982; pp. 403–430. [Google Scholar]
  29. Bagnall, D.K.; Morgan, C.L.S.; Cope, M.; Bean, G.M.; Cappellazzi, S.; Greub, K.; Liptzin, D.; Norris, C.L.; Rieke, E.; Tracy, P.; et al. Carbon-sensitive pedotransfer functions for plant available water. Soil Sci. Soc. Am. J. 2022, 86, 612–629. [Google Scholar] [CrossRef]
  30. Arquero, O. (Ed.) Manual del Almendro; Junta de Andalucía, Consejería de Agricultura, Pesca y Desarrollo Rural: Sevilla, Spain, 2013; pp. 16–18. [Google Scholar]
  31. Wymore, A.W. Model-Based System Engineering: An Introduction to the Mathematical Theory of Discrete Systems and to the Tricotyledon Theory of System Design; CRC Press: Boca Raton, FL, USA, 1993. [Google Scholar]
  32. Andrews, S.S.; Carroll, C.R. Designing a decision tool for sustainable agroecosystem management: Soil quality assessment of a poultry litter management case study. Ecol. Appl. 2001, 11, 1573–1585. [Google Scholar] [CrossRef]
  33. Egea, G.; Nortes, P.A.; González-Real, M.M.; Baille, A.; Domingo, R. Agronomic response and water productivity of almond trees under contrasted irrigation regimes. Agric. Water Manag. 2010, 97, 171–181. [Google Scholar] [CrossRef]
  34. Puerto, P.; Domingo, R.; Torres, R.; Pérez-Pastor, A.; García-Riquelme, M. Remote management of deficit irrigation in almond trees based on maximum daily trunk shrinkage. Water relations and yield. Agric. Water Manag. 2013, 126, 33–45. [Google Scholar] [CrossRef]
  35. Espadafor, M.; Orgaz, F.; Testi, L.; Lorite, I.J.; García-Tejera, O.; Villalobos, F.J.; Fereres, E. Almond tree response to a change in wetted soil volume under drip irrigation. Agric. Water Manag. 2018, 202, 57–65. [Google Scholar] [CrossRef]
  36. García-Tejero, I.F.; Gutiérrez-Gordillo, S.; Souza, L.; Cuadros-Tavira, S.; Durán Zuazo, V.H. Fostering sustainable water use in almond (Prunus dulcis Mill.) orchards in a semiarid Mediterranean environment. Arch. Agron. Soil Sci. 2019, 65, 164–181. [Google Scholar] [CrossRef]
  37. Reynolds, W.D.; Drury, C.F.; Tan, C.S.; Fox, C.A.; Yang, X.M. Use of indicators and pore volume-function characteristics to quantify soil physical quality. Geoderma 2009, 152, 252–263. [Google Scholar] [CrossRef]
  38. R Core Team. A Language and Environment for Statistical Computing; R Foundation for Statistical Computing: Vienna, Austria, 2021; Available online: https://www.R-project.org/ (accessed on 8 November 2021).
  39. Hussain, I.; Olson, K.R.; Wander, M.M.; Karlen, D.L. Adaptation of soil quality indices and application to three tillage systems in southern Illinois. Soil Till. Res. 1999, 50, 237–249. [Google Scholar] [CrossRef]
  40. Glover, J.D.; Reganold, J.P.; Andrews, P.K. Systematic method for rating soil quality of conventional, organic, and integrated apple orchards in Washington State. Agric. Ecosys. Environ. 2000, 80, 29–45. [Google Scholar] [CrossRef] [Green Version]
  41. Castellini, M.; Pirastru, M.; Niedda, M.; Ventrella, D. Comparing physical quality of tilled and no-tilled soils in an almond orchard in southern Italy. Ital. J. Agron. 2013, 8, 149–157. [Google Scholar] [CrossRef]
  42. Cucci, G.; Lacolla, G.; Grecchio, C.; Pascazio, S.; de Giorgio, D. Impact of long term soil management practices on the fertility and weed flora of an almond orchard. Turk. J. Agric. For. 2016, 40, 194–202. [Google Scholar] [CrossRef]
  43. Raiesi, F.; Tavakoli, M. Developing a soil quality index model for assessing landscape-level soil quality along a toposequence in almond orchards using factor analysis. Model. Earth Syst. Environ. 2022, 8, 4035–4050. [Google Scholar] [CrossRef]
  44. Martínez-Mena, M.; Perez, M.; Almagro, M.; Garcia-Franco, N.; Díaz-Pereira, E. Long-term effects of sustainable management practices on soil properties and crop yields in rainfed Mediterranean almond agroecosystems. Eur. J. Agron. 2021, 123, 126207. [Google Scholar] [CrossRef]
  45. Silva, A.P.; Aires, A.; Barreales, D.; Rodrigues, M.Â.; Ribeiro, A.C.; Gonçalves, B.; Morais, M.C. Effects of foliar and soil boron fertilization on yield, leaf physiological traits and fruit attributes in rainfed almond orchards. Agronomy 2022, 12, 2005. [Google Scholar] [CrossRef]
  46. Villa, Y.B.; Khalsa, S.D.S.; Ryals, R.; Duncan, R.A.; Brown, P.H.; Hart, S.C. Organic matter amendments improve soil fertility in almond orchards of contrasting soil texture. Nutr. Cycl. Agroecosyst. 2021, 120, 343–361. [Google Scholar] [CrossRef]
  47. Repullo-Ruibérriz de Torres, M.A.; Moreno-García, M.; Ordóñez-Fernández, R.; Rodriguez-Lizana, A.; Cárceles Rodríguez, B.; García-Tejero, I.F.; Durán Zuazo, V.H.; Carbonell-Bojollo, R.M. Cover crop contributions to improve the soil nitrogen and carbon sequestration in almond orchards (SW Spain). Agronomy 2021, 11, 387. [Google Scholar] [CrossRef]
  48. Djemiel, C.; Dequiedt, S.; Karimi, B.; Cottin, A.; Horrigue, W.; Bailly, A.; Boutaleb, A.; Sadet-Bourgeteau, S.; Maron, P.-A.; Chemidin Prévost-Bouré, N.; et al. Potential of meta omics to provide modern microbial indicators for monitoring soil quality and securing food production. Front. Microbiol. 2022, 13, 889788. [Google Scholar] [CrossRef] [PubMed]
  49. Freitas, J.; Silva, P. Sustainable agricultural systems for fruit orchards: The influence of plant growth promoting bacteria on the soil biodiversity and nutrient management. Sustainability 2022, 14, 13952. [Google Scholar] [CrossRef]
Figure 1. Standard scoring functions used for normalizing soil indicator magnitudes. This example represents the more-is-better, less-is-better, and mid-point optima curves used for normalizing the values of water retention capacity (WRC), carbonates, and available phosphorus content, respectively, of the soils in the current study.
Sustainability 14 14770 g001
Figure 2. Percentage contribution of each soil function to the soil quality index assessment for each almond orchard. Abbreviations: FB = Filtering and buffering; NS = Nutrient supply; WR = Water relations; CL = Crop limitation.
Sustainability 14 14770 g002
Figure 3. Indicator contribution in the evaluation of the soil quality index according to each almond orchard. Abbreviations: BD = Bulk density; TOC = Total organic carbon; AP = Available phosphorus; CEC = Cation exchange capacity; TN = Total nitrogen; OM = Organic matter; WRC = Water retention capacity; Tp = Total porosity; EC = Electrical conductivity; AB = Available boron.
Sustainability 14 14770 g003
Table 1. Threshold limits and standardized scoring functions for the soil quality indicators considered in the current study.
IndicatorUnitsScoring FunctionLBUB1OB2Slope at
Baseline
Soil FunctionReference
BDg cm−3Less is better11.62---−5.005FB[33,34,35,36,37]
TP%Optimum18-602543500.1668WR[33,35]
pH Optimum3-115.578.41.001NS[30]
ECdS m−1Less is better01.64---−1.001WR[30]
TN%Optimum0-0.50.110.150.233.3667NS[30]
OMMore is better0.51.53---1.001NS[33,36]
TOCMore is better0.290.882.2---1.001FB[33,36]
APmg kg−1Optimum5-301015250.2503NS[30]
CECmeq 100 g−1More is better131825---1.001NS[30]
Carbonates%Less is better51540---−0.1001CL[30]
LimestoneLess is better069---−0.05005CL[30]
ABmg kg−1Less is better00.53---0.5005CL[30]
WRC%More is better31323---0.25025WR[33,34,35,36]
Abbreviations: BD = Bulk density; TP = Total porosity; EC = Electrical conductivity; TN = Total nitrogen; OM = Organic matter; TOC = Total organic carbon; AP = Available phosphorus; CEC = Cation exchange capacity; AB = Available boron; WRC = Water retention capacity; L = lower threshold at which or below the score is 0; B = baseline at which score is 0.5; U = upper threshold at which or above score is 1.0; B1 = lower baseline, at which score is 0.5 with bell-shaped relationship; O = optimum level, at which score is 1.0 with bell-shaped relationship; B2 = upper baseline at which score is 0.5 with bell-shaped relationship.
Table 2. Means and standard errors of soil quality indicators (0–40 cm depth) for each of the three almond orchards studied.
Soil FunctionIndicatorUnitsAlacónSan MartínValdealgorfa
Filtering and bufferingBDg cm−31.86 ± 0.04 b1.69 ± 0.09 ab1.53 ± 0.09 a
TOC *%0.86 ± 0.03 ab1.21 ± 0.10 b0.79 ± 0.02 a
Nutrient supplypH-8.33 ± 0.11 b8.00 ± 0.04 a8.60 ± 0.03 c
APmg kg−120.50 ± 2.52 ab26.10 ± 2.62 b17.05 ± 2.19 a
CECmeq 100 g−119.99 ± 1.12 b15.02 ± 0.85 a17.52 ± 1.01 ab
TN%0.08 ± 0.00 ab0.14 ± 0.01 b0.07 ± 0.00 a
OM%1.48 ± 0.05 a2.08 ± 0.16 b1.37 ± 0.04 a
Water relationsWRC%14.42 ± 0.51 a14.46 ± 0.31 a14.07 ± 0.26 a
Tp%30.05 ± 1.41 a36.21 ± 3.45 ab42.17 ± 3.34 b
ECdS m−10.65 ± 0.27 ab0.42 ± 0.07 b0.13 ± 0.00 a
Crop limitationCarbonates%47.57 ± 2.06 b8.65 ± 1.48 a45.42 ± 1.69 b
Limestone%12.67 ± 0.23 b0.26 ± 0.12 a13.73 ± 0.21 c
ABmg kg−10.31 ± 0.10 a0.64 ± 0.05 b0.14 ± 0.02 a
* Abbreviations: BD = bulk density; TOC = Total organic carbon; AP = Available phosphorus; CEC = Cation exchange capacity; TN = Total nitrogen; OM = Organic matter; WRC = Water retention capacity; Tp = Total porosity; EC = Electrical conductivity; AB = Available boron. Means followed by the same letters in the row are not different at p < 0.05 according to Tukey’s test (BD, AP; CEC; WRC; Tp; Carbonates and Limestone) or Dunn’s test (TOC; pH; TN; OM; EC and AB).
Table 3. Soil quality score card for the Alacón almond orchard.
Soil FunctionWeightQI 1Score of QI
(A)
OMVStandardized Score
(B)
A × BSum of ScoresSum of Scores × WeightSQI
FB0.1BD0.51.850.010.0050.2450.0250.554
TOC0.50.860.480.240
NS0.4pH0.28.330.570.1140.5490.220
AP0.220.500.990.198
CEC0.219.990.690.138
TN0.20.080.020.004
OM0.21.480.480.096
WR0.3WRC0.414.420.810.3240.9090.273
Tp0.330.050.970.291
EC0.30.650.980.294
CL0.2Carbonates0.447.570.000.0000.1830.037
Limestone0.312.670.010.003
AB0.30.310.600.180
1 Abbreviations: QI = Quality indicator; OMV = Observed mean value; SQI = Soil quality index; FB = Filtering and buffering; NS = Nutrient supply; WR = Water relations; CL = Crop limitation; BD = Bulk density; TOC = Total organic carbon; AP = Available phosphorus; CEC = Cation exchange capacity; TN = Total nitrogen; OM = Organic matter; WRC = Water retention capacity; Tp = Total porosity; EC = Electrical conductivity; AB = Available boron.
Table 4. Soil quality score card for the San Martín almond orchard.
Soil FunctionWeightQI 1Score of QI
(A)
OMVStandardized Score
(B)
A × BSum of ScoresSum of Scores × WeightSQI
FB0.1BD0.51.690.140.0700.4650.0470.746
TOC0.51.210.790.395
NS0.4pH0.28.000.830.1660.6440.258
AP0.226.100.250.050
CEC0.215.020.230.046
TN0.20.140.990.200
OM0.22.080.910.182
WR0.3WRC0.414.460.810.3240.9240.277
Tp0.336.211.000.300
EC0.30.421.000.300
CL0.2Carbonates0.48.650.990.3960.8250.165
Limestone0.30.261.000.300
AB0.30.640.430.129
1 Abbreviations: QI = Quality indicator; OMV = Observed mean value; SQI = Soil quality index; FB = Filtering and buffering; NS = Nutrient supply; WR = Water relations; CL = Crop limitation; BD = Bulk density; TOC = Total organic carbon; AP = Available phosphorus; CEC = Cation exchange capacity; TN = Total nitrogen; OM = Organic matter; WRC = Water retention capacity; Tp = Total porosity; EC = Electrical conductivity; AB = Available boron.
Table 5. Soil quality score card for the Valdealgorfa almond orchard.
Soil FunctionWeightQI 1Score of QI
(A)
OMVStandardized Score
(B)
A × BSum of ScoresSum of Scores × WeightSQI
FB0.1BD0.51.530.790.3950.6000.0600.542
TOC0.50.790.410.205
NS0.4pH0.28.600.310.0620.4270.171
AP0.217.051.000.200
CEC0.217.520.450.090
TN0.20.070.010.001
OM0.21.370.370.074
WR0.3WRC0.414.070.750.3000.8970.269
Tp0.342.160.990.297
EC0.30.131.000.300
CL0.2Carbonates0.445.420.000.0000.2100.042
Limestone0.313.730.000.000
AB0.30.140.700.210
1 Abbreviations: QI = Quality indicator; OMV = Observed mean value; SQI = Soil quality index; FB = Filtering and buffering; NS = Nutrient supply; WR = Water relations; CL = Crop limitation; BD = Bulk density; TOC = Total organic carbon; AP = Available phosphorus; CEC = Cation exchange capacity; TN = Total nitrogen; OM = Organic matter; WRC = Water retention capacity; Tp = Total porosity; EC = Electrical conductivity; AB = Available boron.
Publisher’s Note: MDPI stays neutral with regard to jurisdictional claims in published maps and institutional affiliations.

