Article

Remote Sensing Data for Geological Mapping in the Saka Region in Northeast Morocco: An Integrated Approach

1
Natural Resources and Environment Laboratory, Geology Department, Polydisciplinary Faculty of Taza, Sidi Mohamed Ben Abdellah University, Fez 1223, Morocco
2
Engineering Sciences and Techniques Center, Environment Department, Faculty of Science and Technology, Sidi Mohamed Ben Abdellah University of Fez, Fez 1223, Morocco
3
Geoengineering and Environment Laboratory, Research Group “Water Sciences and Environment Engineering”, Geology Department, Faculty of Sciences, Moulay Ismail University, Meknes 50050, Morocco
4
Hydrology and Hydraulic Engineering Department, Vrije Universiteit Brussels (VUB), 1050 Brussels, Belgium
5
ITC-CNR, Construction Technologies Institute, National Research Council, Polo Tecnologico di San Giovanni a Teduccio, 80146 Napoli, Italy
6
Geosciences Laboratory, Department of Geology, Faculty of Sciences, University Ibn Tofail, Kenitra 14000, Morocco
7
Research Team: Water and Environment Management, Laboratory of Applied Sciences (LSA), National School of Applied Sciences Al Hoceima, Abdelmalek Essaadi University, Tetouan 93030, Morocco
8
OLMAN BPGE Laboratory, Multidisciplinary Faculty of Nador, Mohamed First University, Oujda 60000, Morocco
9
Institute of Applied Technology, Thu Dau Mot University, Thu Dau Mot City 75000, Binh Duong Province, Vietnam
*
Authors to whom correspondence should be addressed.
Sustainability 2022, 14(22), 15349; https://0-doi-org.brum.beds.ac.uk/10.3390/su142215349
Submission received: 24 August 2022 / Revised: 1 November 2022 / Accepted: 15 November 2022 / Published: 18 November 2022

Abstract

:
Together with geological survey data, satellite imagery provides useful information for geological mapping. In this context, the aim of this study is to map geological units of the Saka region, situated in the northeast part of Morocco based on Landsat Oli-8 and ASTER images. Specifically, this study aims to: (1) map the lithological facies of the Saka volcanic zone, (2) discriminate the different minerals using Landsat Oli-8 and ASTER imagery, and (3) validate the results with field observations and geological maps. To do so, in this study we used different techniques to achieve the above objectives including color composition (CC), band ratio (BR), minimum noise fraction (MNF), principal component analysis (PCA), and spectral angle mapper (SAM) classification. The results obtained show good discrimination between the different lithological facies, which is confirmed by the supervised classification of the images and validated by field missions and the geological map with a scale of 1/500,000. The classification results show that the study area is dominated by Basaltic rocks, followed by Trachy andesites then Hawaites. These rocks are encased by quaternary sedimentary rocks and an abundance of Quartz, Feldspar, Pyroxene, and Amphibole minerals.

1. Introduction

The mapping and differentiation of lithological units and geological features are essential for the monitoring and investigation of mineral deposits. Despite the importance of conventional ground-based mapping techniques in geological studies, they are labor-intensive and costly approaches. Thus, alternative methods are needed to achieve this goal.
Remote sensing (RS) techniques combined with Geographic Information Systems (GIS), are useful tools that can provide crucial contributions to different applications, including, environment [1,2], health [3], land use planning [4], rational exploitation of natural resources, or prevention of natural disasters [5]. The application of space technologies such as earth observation systems is conditioned on a sustained effort of information, formation, capacity reinforcement, and adaptation to local conditions of utilization. In this context, the constitution and consolidation of regional space research and cooperation enable us to ensure the rational control and use of space technologies and in light of the many applications, the sustained development of the region becomes a necessity.
Geological mapping is of great scientific importance for geologists, they need to understand all methodologies and modern techniques of geological studies. RS-based data and satellite imagery processing are becoming the fastest, most accurate, and most reliable geological mapping tools available for geologists, especially when it comes to mapping volcanic activity areas that are often inaccessible and require costly and time elaboration. It is a very significant and powerful tool for geologists that can be used to improve the process of geological mapping [6]. Many imagery data sources are used in RS to resolve many problems, and the data are chosen based on the topics and scales of the study area. Landsat and ASTER images are the most popular remote sensing data sources used in geology and mining [7]. The challenges and constraints involved in geological field mapping and mineral exploration might potentially be solved with the use of remote sensing satellite photography [8,9]. Several studies have demonstrated the tremendous applications of remote sensing data in geological studies, to cite the examples provided in [10,11,12,13,14].
The objectives of this study are to identify lithology and distinguish between minerals by using a mineral index and mapping the volcanic surface of the Saka site located in the Oriental region of Morocco. The modeling and mapping of surface land properties in several sites in the area (particularly Guercif province) uses field-collected rocks to identify targets in both Landsat OLI-8 and ASTER images using RS-based techniques and different geospatial tools.
Geological mapping often makes use of indirect evidence that may be seen at the surface to interpret aerial imagery [6]. To improve and understand the geology of this area on a regional scale, remote sensing data have been analyzed. Using Landsat Oli-8 imagery so significantly enhances the final outcomes when creating regional-scale geological maps. In the last ten years, many research projects have employed Landsat Oli-8 data for geological mapping and rock unit classification. In this study, we employed Landsat Oli-8 RS-based data due to the particular properties of their bands combined with some other traditional and advanced image processing approaches to extract geological information and lithological units. In order to achieve the purpose of geological mapping and the identification of the exposed rock units on the basis of satellite imagery of this region, several image processing algorithms are used for Landsat Oli-8 and ASTER bands, including colored composition (CC), band ratio (BR), minimum noise fraction (MNF), principal component analysis (PCA), and spectral angle mapper (SAM). Due to the differences in colors based on the values in the single channels, the color composite makes it easier to comprehend multichannel image data [15]. Based on the chosen spectral properties, the false-color composite image enables lithological identification and mineral discrimination [16]. Band ratios are simple arithmetic combinations of diverse bands that allow the intensity and distribution of emissions or absorption of electromagnetic rays in a target to be explored in a semi-quantitative way [17]. A reliable mapping and estimation of the geological resources of the Guercif Basin are essential for the monitoring and control of mineral deposits. The classical method of achieving this objective depends on in-situ or field surveys, which have a significant degree of limitations. For this reason, geospatial technology can play an increased role in this context. It should be highlighted that there is no sufficient and detailed geological map of the study area. Therefore, the novelty of this paper is to systematically investigate the use of remote sensing and GIS to obtain a detailed map of the lithological facies with a good resolution, as opposed to the existing geological map with a low spatial resolution (1/500,000). Keeping in mind that the study area is heavily explored in terms of geological rock and mineral deposits as it is characterized by many rock quarries and mineral deposits. Due to the important roles of these geological rocks and mineral resources in many domains such as in industry, cosmetics, railways (Basalt), and ornamental rock business. The approaches developed here are crucial in this area.

2. Materials and Methods
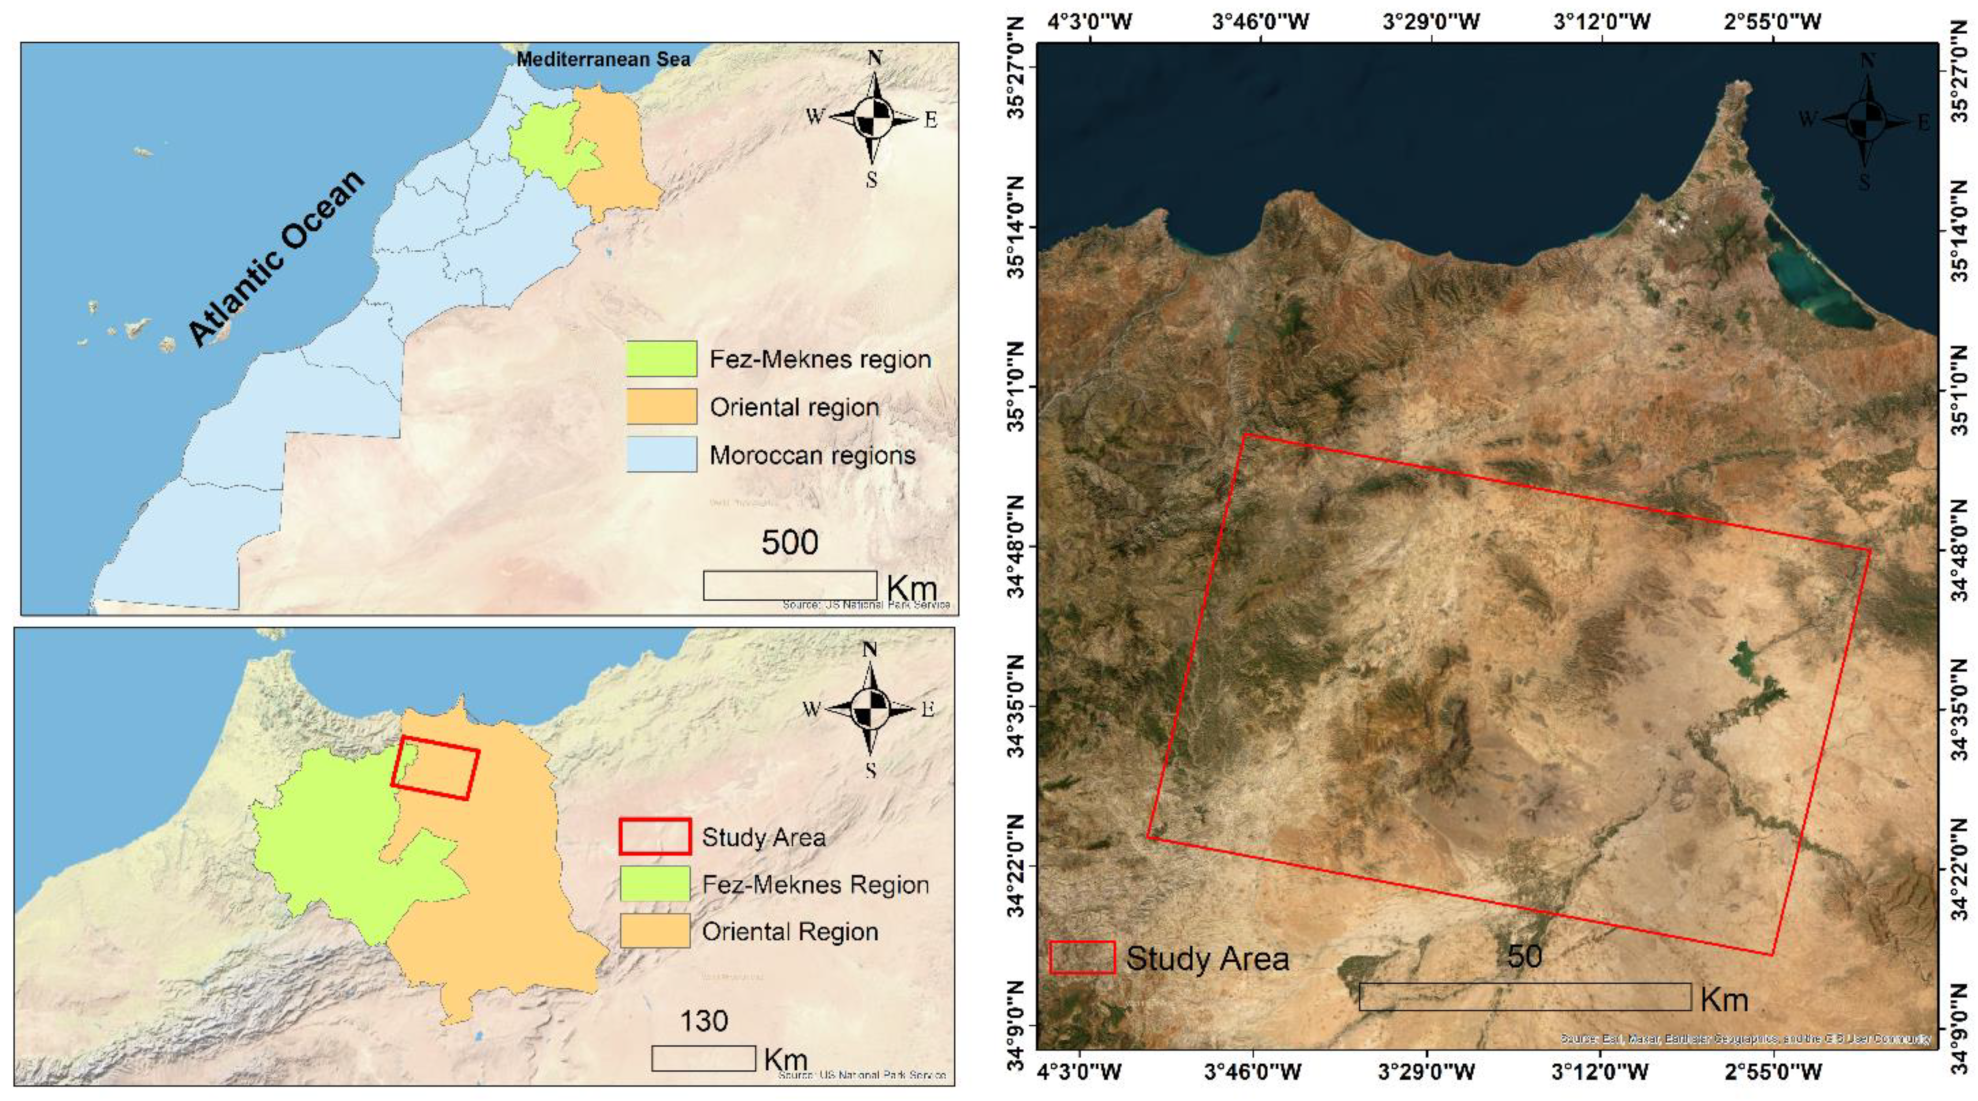
2.1. Study Area

The study area is situated in the Oriental part of Morocco and includes the Guercif province (Figure 1). The Guercif was recently created in 2009 and is bordered by Boulemane province from the south, Nador and Driouach provinces from the north, Taza province from the west, and Taourirt province to the east [18]. It is composed of 10 communes covering 7310 km2, and according to the 2014 general population and habitat census, the province’s population was estimated at 216,717 [19]. The study area is characterized by an alternation between two types of climate, a Mediterranean climate in the north where the average rainfall is 400 mm, and a continental climate in the south with an annual average rainfall of 100 mm [18]. From the hydrology point of view, the Guercif province is drained by the Mellelou and Moulouya rivers. The main activity in the region is agriculture, in which the most common sector of exploitation is olive farming. Barley, wheat farming, cattle breeding, and vegetables accompany olive agriculture.

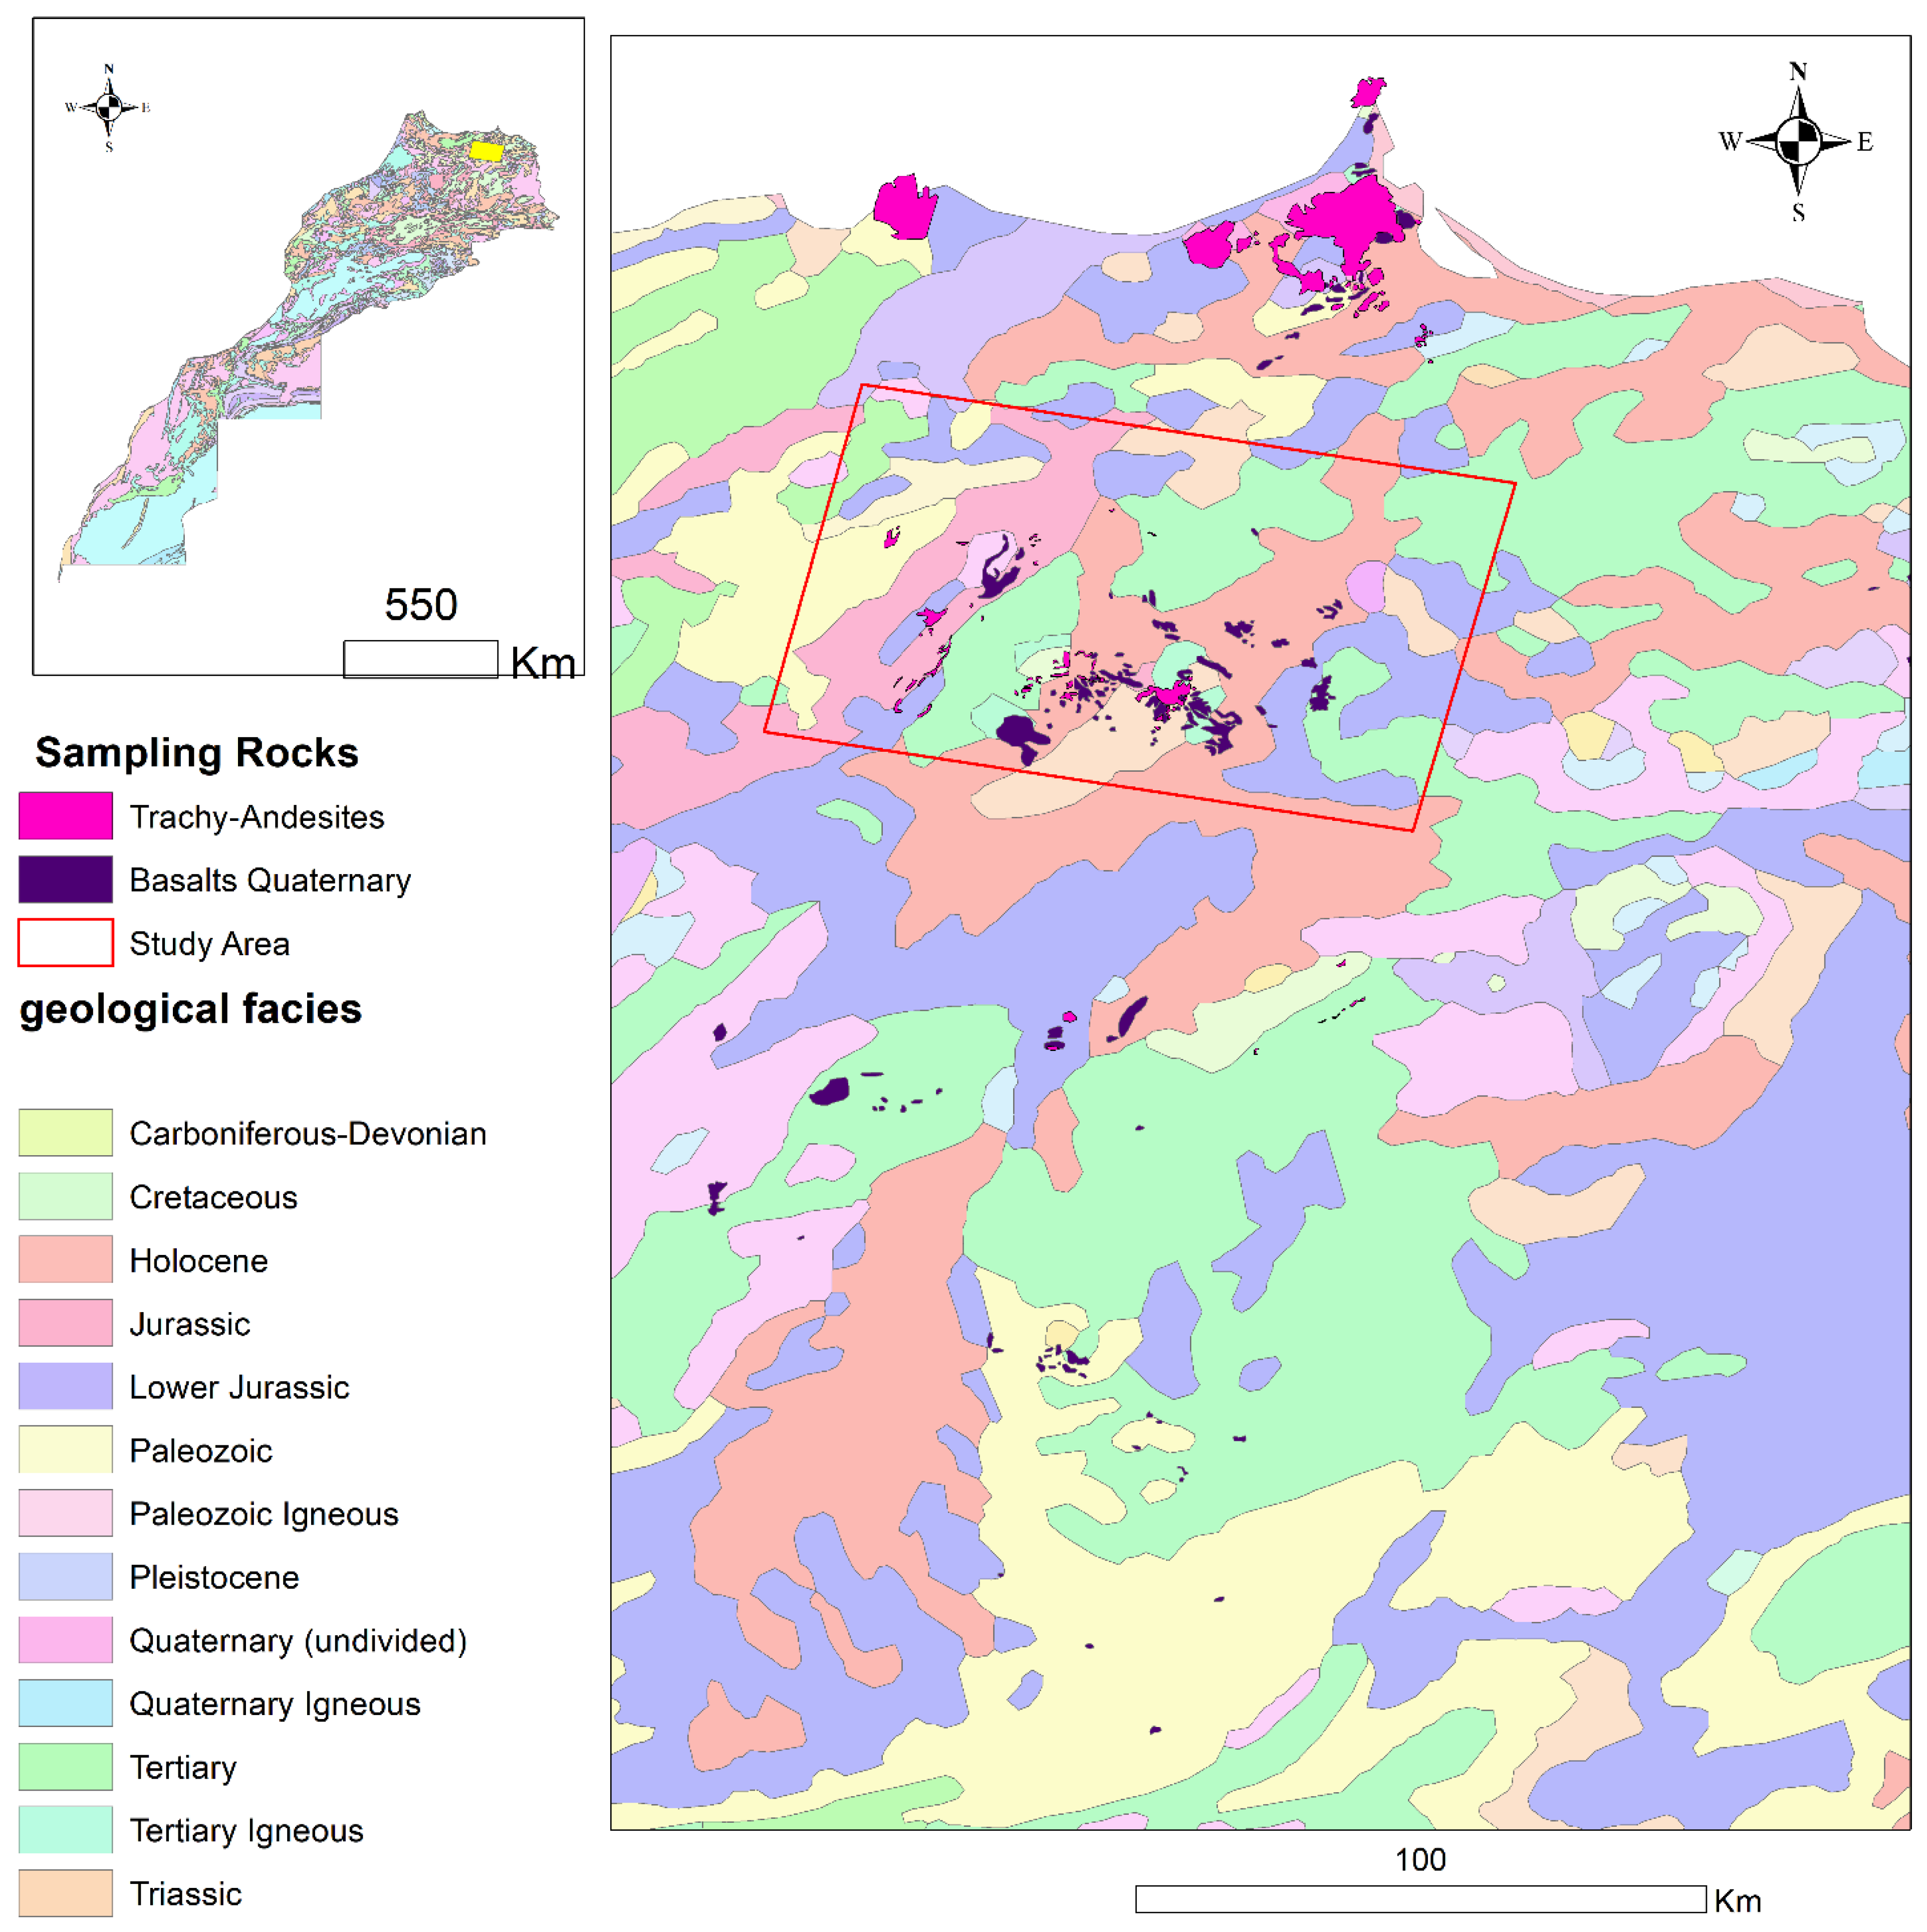
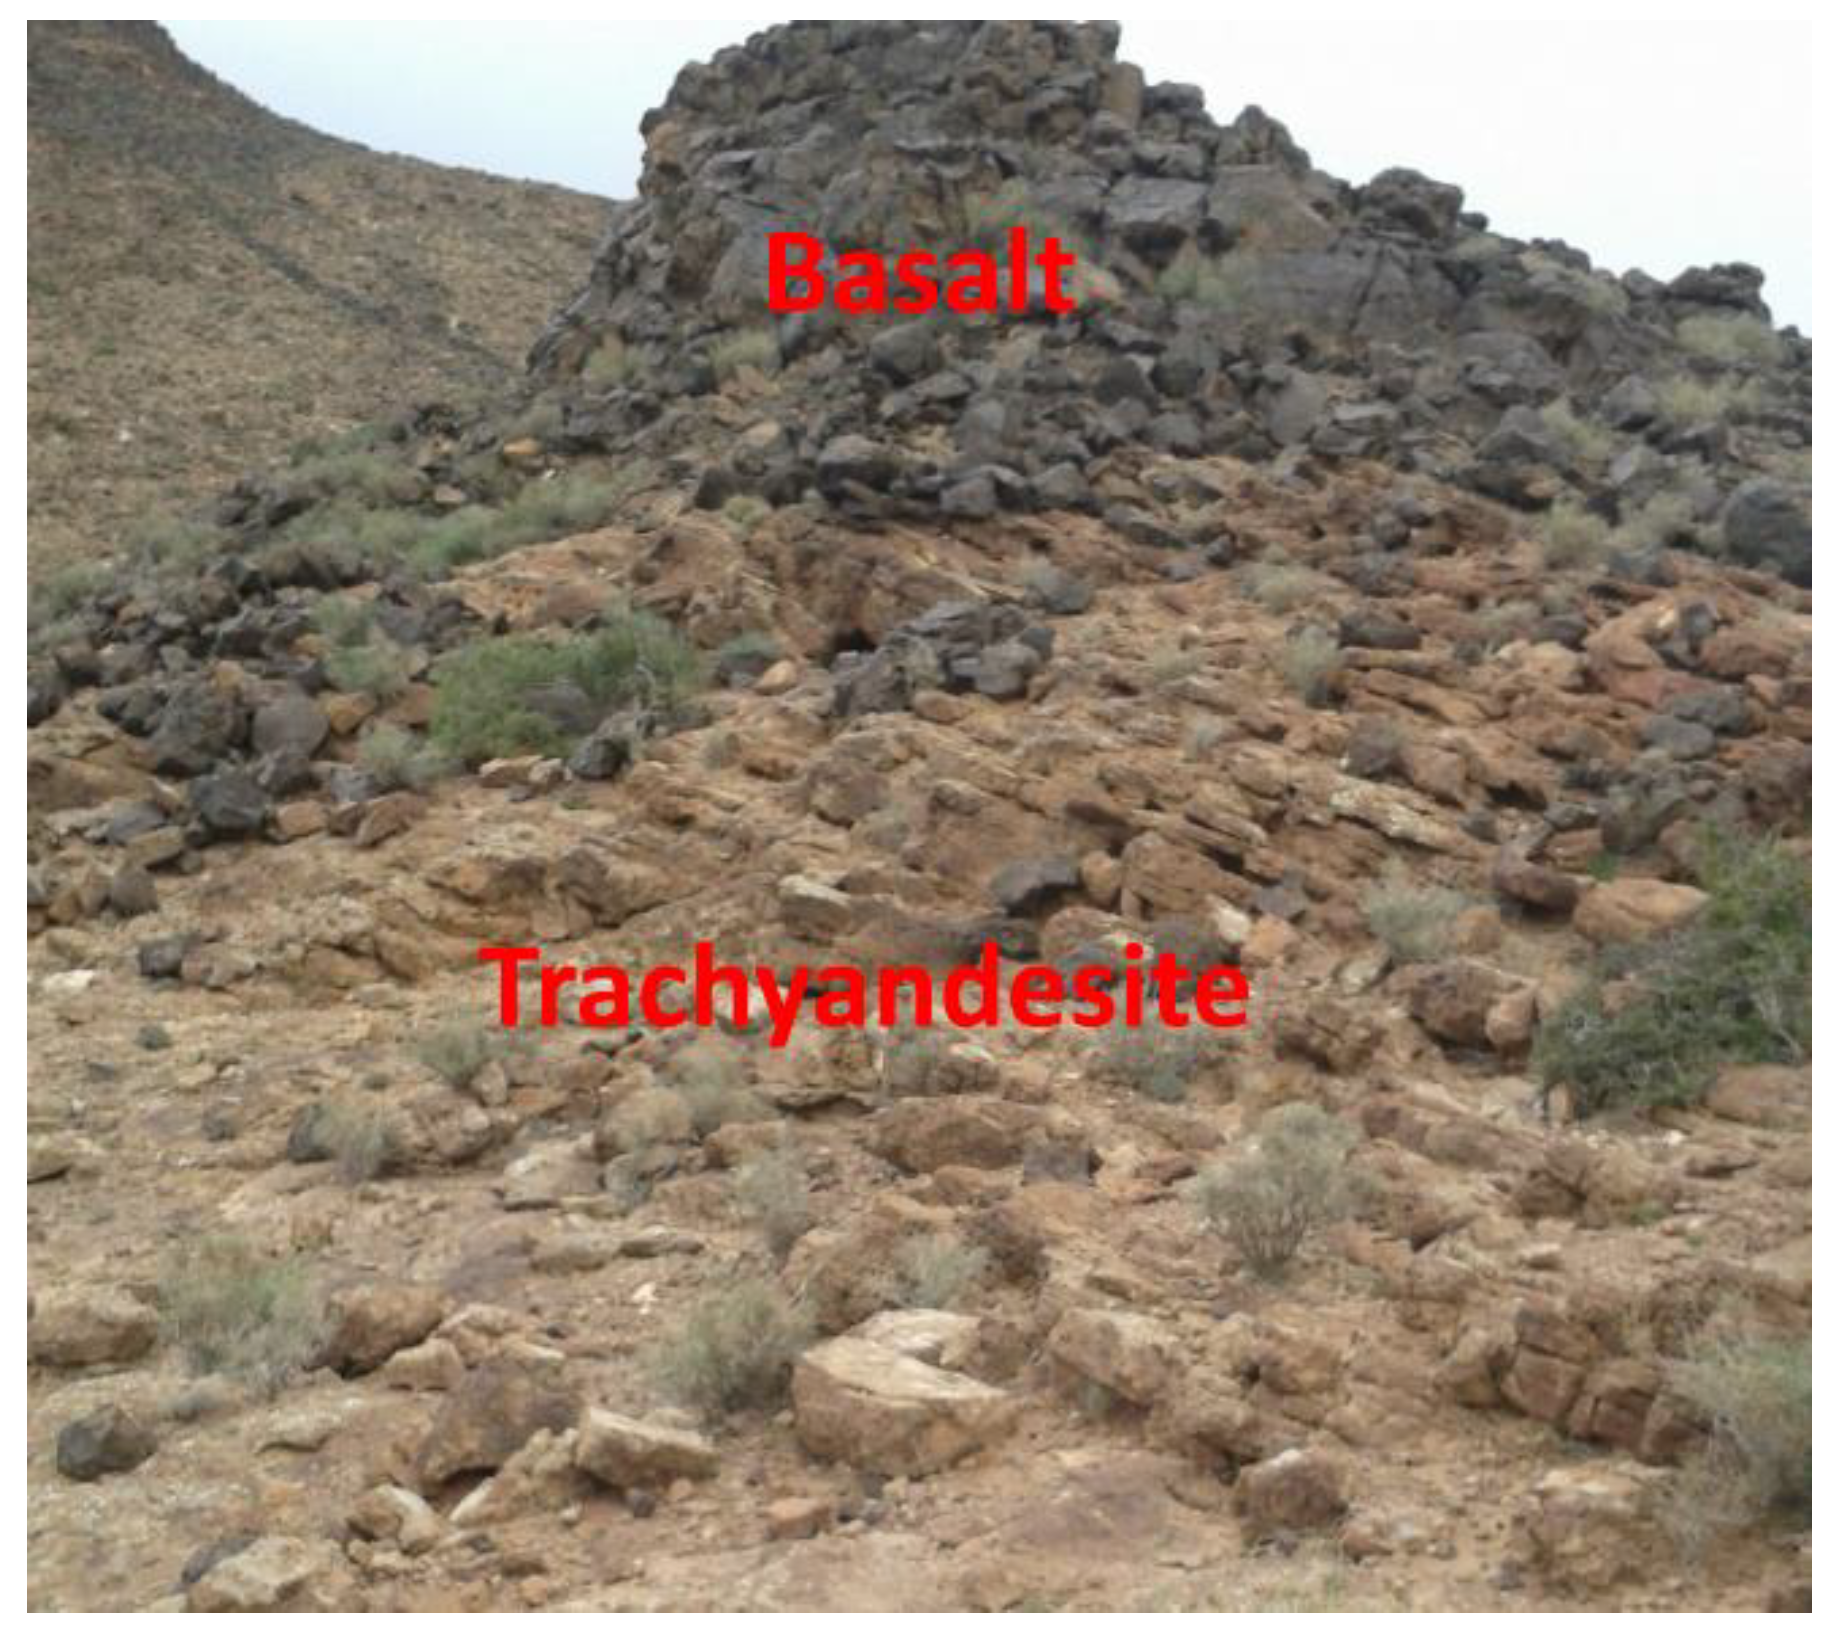
2.2. Geological Context

The city of Guercif is bounded by the Middle Atlas from the south and the Rif from the north, the selected area is the Saka which is located in the north part of Guercif and has some parts included in the Rifain domain [18]. The digitalized geological map of Morocco (Figure 2) was downloaded free of charge from the website [20]. The Rif is a recent mountain range that was formed in the Tertiary period and more specifically, it belongs to the Rif-Tellian chain of North Africa, one of the Alpine chains formed by the collision of Africa and Eurasia [21]. This chain is made up of allochthonous units carried on the margin of the African plate. The Guercif basin is framed by a set of geological structures: (1) In the north, the Rifain domain is represented by the Pre-Rif nappes and the South Rifain Front in a north-east direction. (2) To the north and north-east, the Terni Masgout-Beni Bou Yahya-Beni Snassene massif corresponds to the indigenous foreland: it is a set of raised Jurassic plateaus that overhang the quaternary tertiary basins of north-eastern Morocco. (3) In the east, The Horsts chain is represented by the Jebel Zengal, it is a structure of Horsts and Grabens with Jurassic limestone formations extending from the region of Taourirt to the Mountains of Tlemcen in Algeria [22]. The structures correspond mainly to accidents of direction (E-NE; W-SW) cutting the massif in Horsts and Grabens [22].
The high plateaus are materialized by raised causses with carbonate formations from the Jurassic it is the reliefs of the Gada of Debdou and the plateaus of Rekkame. This limestone slab is slightly inclined towards the southwest, and it dominates the eastern basin of Guercif named the plain of Tafrata or the plain of Maarouf.
The Northern Middle Atlas, this chain corresponds to a set of NE-SW oriented wrinkles and Basins; the wrinkles often overlap with the NW. The Jurassic series has greater strengths than those found in the eastern Meseta and the Saliferous Triassic frequently injects the structures. In addition, well-preserved Ash and Basaltic flows in the Berkine area are evidence of very recent volcanic activity.
The Neogene Basin of Guercif is typically characterized by sedimentation of Tertiary and Quaternary age.
According to Hernandez [22], the volcanoes of Morocco’s eastern Rif are located in Basins that date back to the Miocene epoch and are tangential to the Betic-Rifian orogen. Two periods of activity can be distinguished: (1) Upper Tortonian age to terminal Messinian, represented by the volcanoes of Ras Tarf, Gourougou, Caps Three Forks, and Guilliz, and are of Calco-alkaline or Shoshonitic nature. (2) Plio-quaternary, reduced in the north but taking a crucial extension in the plain of Guilliz. The Middle Atlas and the Oujda plain which are mostly Basaltic and Alkaline are connected to this volcanism.

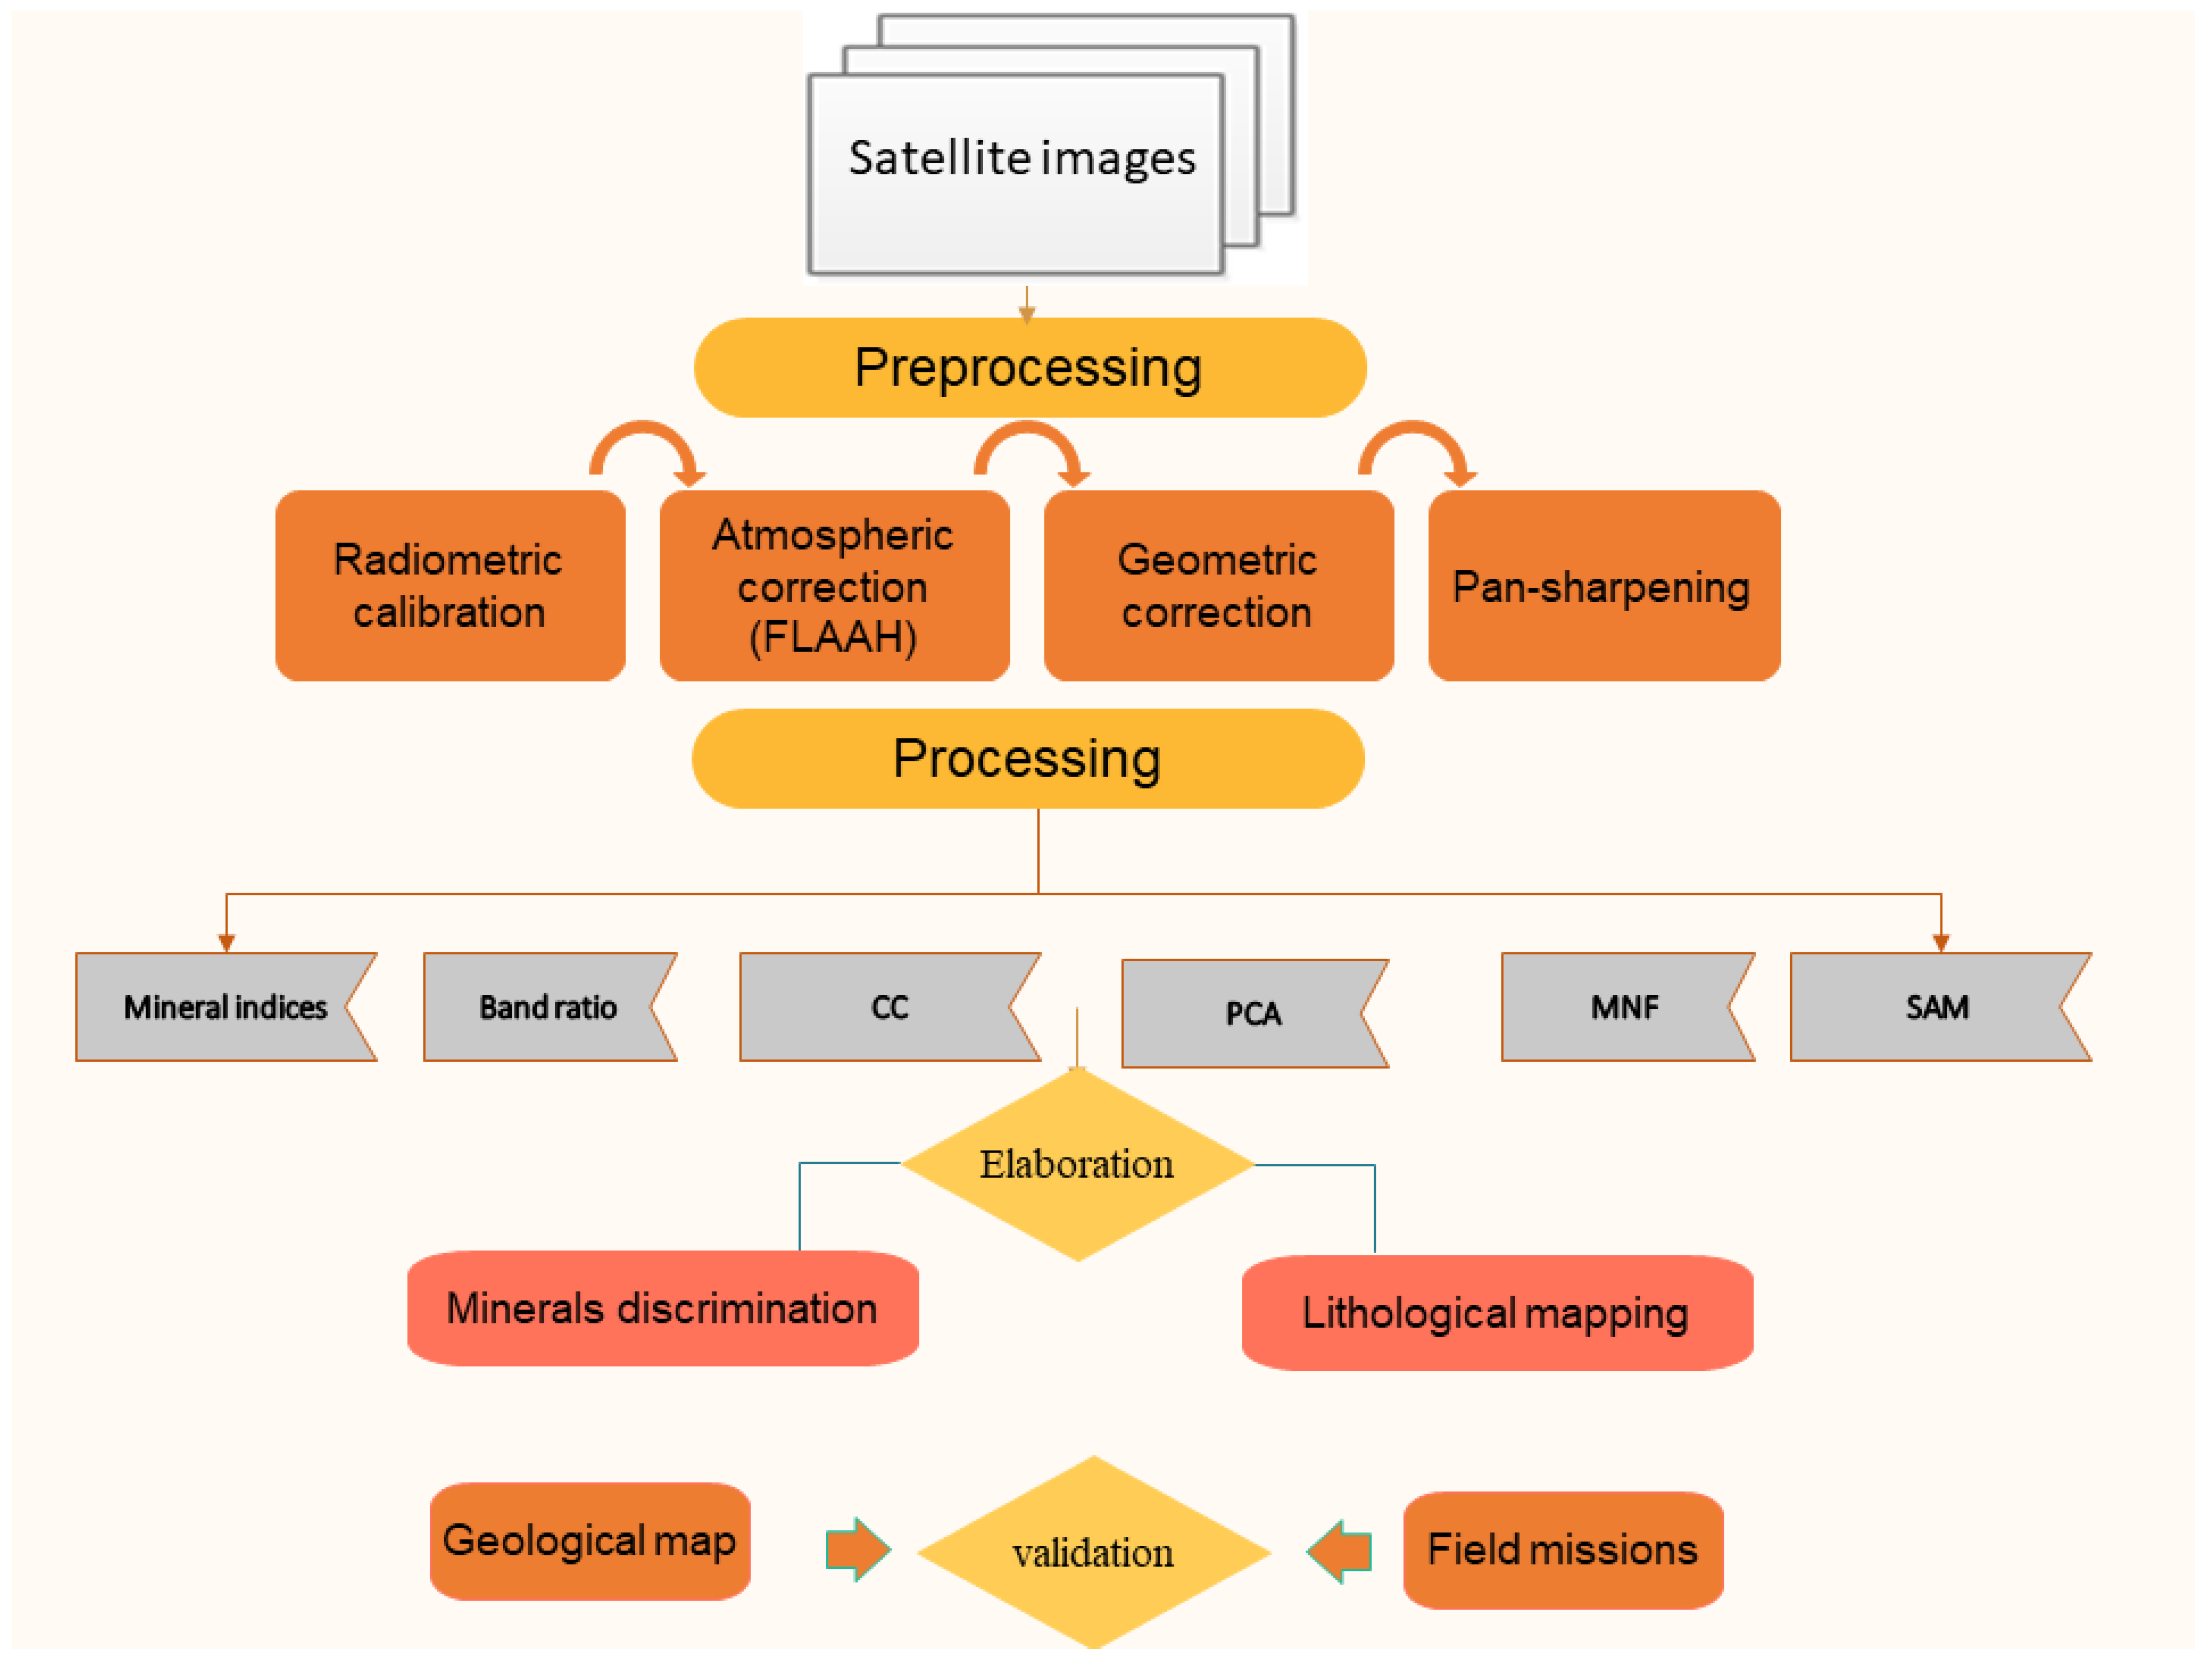
2.3. Data and Methodology

The geological mapping was performed using two satellite imagery and Landsat 8 Oli ASTER images data (Table S1) [23,24,25]. Based on satellite bands, many methods and processing were used in this research to identify lithological facies and to discriminate minerals indices. Table 1 represents the details of the data used. The applied methodology is shown in Figure 3.

2.4. Satellite Images Preprocessing

2.4.1. Pre-Processing

(a)
Geometric correction
Geometric correction aims to correct the inconsistency between the actual coordinates of the location on the ground or on the base image and the coordinates of the location of the raw image data. It is characterized by several types of corrections: Field data, system, and accuracy. It is used to remove geometric distortions and to pre-process remote sensing data [26]. This correction is used to extract accurate information on the area of polygons, distance, and direction [27].
(b)
Radiometric correction
The radiometric correction is based on the conversion of digital data values into physical units, such as reflectance, for analysis. Indeed, the data from the sensors of satellite images are influenced by several factors, such as differences in the manufacture of sensors, electrical noise, scattering and atmospheric absorption, and differences in the gain and linear response of each detector [28].
(c)
Atmospheric correction
The atmospheric correction, performed using the FLAASH (Fast Line-of-sight Atmospheric Analysis of Spectral Hypercube) algorithm, is necessary for the pre-processing of satellite images. It is applied to Landsat-8 images with atmospheric and tropospheric aerosol models of mid-latitudes [29]. It is considered as an imaging spectrometer rescaled in reflectance units for raw radiance data from atmospheric correction [30] and used to isolate the characteristics of the observation, which are intrinsic to the surface, from those caused by the atmosphere [31].
(d)
Pan-sharpening technique
The process of combining the spatial elements of a high-resolution panchromatic (pan) image with the spectral data of a low-resolution multispectral (MS) image to create a high-resolution MS image is known as pan-sharpening [32].

2.4.2. Image Processing Algorithms

Satellite image processing is performed using many methods to extract the spectral properties of minerals discrimination and rock units. Five major processing methods have been applied to the Landsat-8 OLI and ASTER images including (1) color composite (CC) which allowed us to produce color images using a combination of three bands (R: red, G: green, and B: bleu), for more details about the most CC used in geology see (Table S2). (2) The ratio or band ratio (BR) is a method used to show the area of alteration, mineral index, and lithological mapping (Table S3) [33]. (3) The principal component analysis (PCA), (4) Minimum Noise Fraction (MNF) transformation is an effective technique to reduce a large multiband data set into a reduced number of components that contain the majority of the information (spectral variance) in the data set [34]. It is based on a noise covariance matrix, decorrelates and rescales the noise in the data. PCA is similar to MNF transformation and is a standard method of obtaining noise-reduced data [35] and (5) Spectral Angle Mapper (SAM), is a classification method that evolves the similarity of spectra to remove the influence of shading to emphasize the reflectance of the target [36,37].

3. Results and Discussion

3.1. Color Composition(CC)

Multispectral images are generated from monochromatic bands by the application of a layer-stacking process [38,39,40,41]. CC allows the production of color images using the spectral signature of the targets [42]. They are commonly deployed to highlight different surface types in multispectral images or to make evident some crucial environmental phenomena, such as sandstorms, forest fires, and sea ice The CC simplifies it to describe and understand a multiband image by using different colors as indicators of the values of single-channel [43]. The primary advantage of true color images is that it is easy to recognize units in areas where the geologic composition is known and they increase the interpreter’s capacity to identify rock units where a geologic section is unknown [44]. Figure 4 shows the different CC used in geology to identify the targets dominated in the area ((1) Basalt, (2) sedimentary rocks, (3) Trachy-andesite, (4) water, and (5) vegetation) (Figure S1).

3.2. Band Ratio Method (BR)

Band ratio is a method widely used in geological facies and mineralogical mapping [45]. Multispectral transformative processing methods include band ratios as a means of transforming the brightness data collected by a satellite’s sensor into geologically relevant metrics. This method is used to optimize spectral deviations between bands and reduce the effect of shading caused by topography. It is based on the concept of reflectance and consists of dividing the digital number in a band by the digital number of the corresponding pixel in another band.
From the previous studies, there are many band ratios utilized in Landsat 8 Oli and ASTER imagery for geology mapping, especially for lithological identification and mineral discrimination. These bands are determined and used based on laboratory spectra mineral discrimination [43]. The different band ratios used in this study are shown in Figures S2 and S3. Band ratio 7/6 allows the identification of the muscovite mineral, which is constituted of Trachy-andesite and Basalt rocks, which dominate in this study area. Band ratio 2/3 is used to observe lithium discrimination that is present in the rock.

3.3. Principal Component Analysis (PCA)

PCA is the transformation of image data into a set of uncorrelated variables using statistical methods. The result of PCA is a set of images in which each band is uncorrelated with the other bands and presents unique information. Since multispectral data from different sensor channels often contain similar information, image transformations are used to reduce this data redundancy. The resulting “neo” bands are called components and allow us to reduce the information from five or six channels into only three components while keeping more than 90% of the original information. This is an efficient technique for enhancing a multispectral image for geological interpretation. Figure S4a,c shows the PCA results of 3-2-1 in CC for Landsat 8 Oli and ASTER, respectively. The statistical results of PCA for both data images are given in the following Table 1 and Table 2.

3.3.1. Correlation Analysis

Given that the correlation factor is applied as a preliminary evaluation of the presented band source of the image we can make suggestions on possible reflectance processes that may control the origin of the lithological facies. Table 1 and Table 2 show the PCA correlation of Landsat and ASTER bands, respectively. All bands have a strong positive correlation which is higher than 0.85.

3.3.2. PCA Statistics

PCA is a statistical technique multivariate employed to reduce data redundancy of information by transforming the original data onto new principal component axes, producing an uncorrelated image with much higher contrast than the original bands [46]. Table 3 and Table 4 illustrate the Standard deviation, Eigenvectors matrix, and Eigenvalues of PCA for all data used. Most of the data variability (maximum information) is represented in the PC1 and its values for Landsat and ASTER images are 94.62 % (Table 3) and 97.33 (Table 4), respectively. PC2 and PC3 contain the second and the third highest variability. Therefore, it is more convenient to use the first three PC bands as RGB for lithological mapping (Figure S4).
Regarding the Eigenvector Matrix, For Landsat 8 selected bands (1, 2, 3), the PC3 has a strong positive contribution of band 4 (0.87) which corresponds to the absorption band and the PC2 has a strong negative contribution of band 7 (−0.65) (Table 3) which represents the reflection band. For the ASTER image, the Eigenvector Matrix results show a strong positive contribution in band 7 for the PC3 (0.53) and a strong negative contribution in band 3 for the PC2 (−0.49) (Table 4).

3.4. Minimum Noise Fraction (MNF)

The MNF shows the variation within bands in an image and highlights the location of spectral anomalies; this analysis is very significant in mining exploration because spectral anomalies are generally indicative of alterations. The MNF transformation is used to determine the image’s inherent dimensionality and isolate noise and reduce computational requirements for further processing [43]. This approach, which is comparable to PCA, is used to transform the principal components into a predetermined number of spectral bands. This way the first MNF bands carry signals, but the remaining bands include only noise.
Displaying PC3 inverted, PC2, and PC1 in RGB (Figure S4a) for the Landsat image illustrates an outcrop of the Basalt rocks in light green (1), blue enhances the signature of sedimentary rocks (2), and orange and pink colors correspond to Trachy-andesite rocks (3). Water is marked as chartreuse green (4) and the vegetation is displayed as a yellow color (5). On the other hand, the lithological facies for the ASTER image are expressed with yellow and green colors for the basalt rocks (1), cobalt blue and red colors correspond to the sedimentary rocks, pink color represents the Trachy-andesite rocks (3), water is displayed as marine blue (4), and vegetation is displayed as a blue-green color (5).
The results of the MNF composition performed on the two Landsat images (Figure S4b) and ASTER (Figure S4d) show several colors. For the Landsat image, the light blue color (1) corresponds to Basalt rocks, the dark blue color (2) corresponds to sedimentary rocks, and the light pink color (3) corresponds to Trachy-andesite. Water appears as a dark green color (4) and vegetation as a red color (5). For the ASTER image, the Basalt rocks are displayed as light blue color (1), the sedimentary rocks as blue and light red colors (2), and the dark red color (3) corresponds to Trachy-andesite; water is displayed as dark blue color (4) and the vegetation as pink and purple colors (5). Figure 4 shows the dominant igneous rocks in the study area.

3.5. Spectral Angle Mapper (SAM)

The SAM is a classification method used for spectral analysis [47] that allows us to evolve the similarity of the spectra in order to remove the influence of shading to accentuate the reflectance characteristics of the target [37]. It is based on physics that uses an angle to make pixels out of the reference spectral [36]. The SAM’s classification goal is to compare the angle between the spectral vector of the final member and each pixel vector [48]. In this study, the available geological map and the sampled rocks were used to validate the classified map elaborated by the Spectral Angle Mapper from Landsat 8 Oli and ASTER data (Figure 5). After the processing, we found that the SAM map of the ASTER image gave more details and good accuracy (Table S4), so we recommend using the SAM method as a support for satellite image classification.

3.6. Minerals Index Calculation

Several indices are used to discriminate between rock minerals, including Quartz Index (QI2), Silicate Index (SI2), Carbonate Index (CI), Mafic Index (MI), corrected Mafic Index, and Ultramafic Index (UMI). Comparing the reference spectral signature rocks in ENVI software with the spectral signature of rocks in the study area, we noted many similarities.
The Quartz Index shows the Quartz mineral in the rocks.
Q I 2 = B 11 B 10 + B 12 * B 13 B 12
Silica’s number gives an idea of the acidity of the rock. Therefore, the rocks that contain a higher amount of Silicate are acidic in nature. The SI is calculated using the following equations:
I 1 = B 13 B 12
S I 2 = B 14 B 12
The Carbonate Index allows us to make sure that the rocks are rich in Carbonates and Calcium.
C I = B 13 B 14
The corrected Mafic Index is calculated by the following equation:
M I c = MI C I 3 = B 12 B 13 / B 13 B 14 3
The Mafic Index is used to estimate the distribution of SiO2 that exists in mafic and ultramafic rocks by using the following ratio:
M I = B 12 B 13
According to Figure 6B, the red circle corresponds to the mafic minerals and the green square indicates the existence of felsic minerals (Figure 6B).
The ultramafic index is estimated using the following ratio:
U M I = B 12 + B 14 / B 13 2
Figure 6C shows the Basalt and Hawaiite rocks rich in mafic minerals (dark color) that are identified by the red circles.
From Figure 6D–F, it is remarked that the CC allows for the distinction between the mafic and felsic minerals. The mafic minerals (purple color) are more concentrated in the Basalt rock which is identified by the red circle color and the other color corresponds to the Felsic minerals.

3.7. Supervised Classification

Supervised classification is directed and not automatic classification. This type of classification is based on the identification of the different lithological facies by choosing the classification training option to direct the software. The applied classification method in this part is successful in all likelihood, thanks to its positive results which are close to the geological map of study and the best map is one elaborated from ASTER data (Figure 7b). The supervised classification results carried out on the ASTER and Landsat 8 Oli images show several colors (Figure 7). The quaternary facies are identified by a whitish color, quaternary Basalt is represented as a blue color, the yellowish color corresponds to the volcanism of the upper Miocene, the Jurassic to the light blue color and the light pink color corresponds to the Trach-andesite.
The previous studies and research objectives will allow us to select the most crucial CC. BR, rations, PCA, MNF, and classification methods allowed for the realization of a lithological and mineralogical mapping. The PCA and MNF maps (Figure S4) have more characteristics and provide better results than rationing bands (Figures S2 and S3). Therefore, the MNF map (Figure S4d) was selected to obtain a better-supervised classification. Thus, a minerals discrimination map (Figure 6), showing potential exploration mineral deposits in the study area, was obtained. The validity of the models was tested by comparing the field data (Figure 8) and the geological map (1/500,000) of the studied field. The processing of satellite images allows for the individualization of the different minerals located on the surface. According to El Atilla [49], the ASTER image plays a crucial role in lithological discrimination. The Landsat-8 image was used to detect and map the hydrothermal alteration areas. As a result, the study area is dominated by Basaltic rocks, followed by Trachy andesites then Hawaites which are confirmed by elaborated maps, especially those that were generated using ASTER data. These rocks are encased by quaternary sedimentary rocks and an abundance of Quartz, Feldspar, Pyroxene, and Amphibole minerals. The analysis of the digitalized map (Figure 9) and elaborated map (Figure 8) shows a strong similarity in terms of geological facies. In addition, according to the study by El Kati et al. [50], the Gurecif basin is characterized by Miocene-Pliocene volcanic activity, which resulted from two activity periods during the Tortonian and upper Messinian age, and another during the Plio-quaternary age [51,52]. Although, there are some rocks, which do not display in the geological map and in elaborated satellite images due to their lower spatial distribution. For this reason, it is recommended that collected rocks from the field should be added to complete this study. (Figure 8).

4. Conclusions

Remote sensing is used to study diverse earth science applications, especially geologic problems such as lithological and structural mapping. Remote sensing has a great interest in reducing the cost of field mapping, accessing the difficulty of reaching certain areas, and identifying areas of intense mineralization and alteration. The data collected by the classical method are based on in-situ measurement and field surveys and have a significant degree of limitations affecting the objectives of this study. On the other hand, RS provides an interesting opportunity to reduce the cost of field mapping and resolve access field difficulties. Satellite image processing and field data allowed us to map the lithological facies and mineralization deposits of the study area. Indeed, the PCA, MNF, band ratios, and minerals index showed relevant results in the discrimination of geological features. In this project, the advantages of RS allowed us to compare and test the effectiveness between different spatial data sets, such as the Landsat 8-OLIand ASTER images applied in this study. Results from RS techniques such as the color compositions, band ratios (B12/B13) (B11/B12) (B14/B13), PCA (PC3-PC2-PC3), MNF (MNF 3, MNF2, MNF1), and comparing the geological map with the satellite images allowed for better observation and interpretation of the lithological units; allowing us to observe the distribution of the alteration area and zone with high mineral potential in the region. For geology, the bands (R-G-B) used in the color combination on Landsat 8 Oli include 6-5-7; 10-11-7, and 5-7-3 for iron oxides and clay minerals, and silicate detection and hydrothermally altered rocks, respectively. For the ASTER image, the bands (R-G-B), used in the color combination to determine the gossan areas, alteration zones, and host rocks, enhance hydrothermal Gossans, and identify and enhance geological structures 6-2-1; 6-3-1 and 7-4-2, respectively. This combination of bands is particularly valuable in recognizing lithological features, geological formations, and faults. A better combination of the colors composite was created using PC1, PC2, and PC3, which showed a better result for the mapping of the geological units in the study area. In addition, the best maps were elaborated using supervised classification created by the spectral angle mapper (SAM) method and MNF results (MNF3, MNF2, MNF1/RGB) for the ASTER data. Based on the field missions where sample rocks collected are used as a reference, the overall classification accuracy of ASTER and Landsat 8-oli images are 0.83 and 0.72, respectively.
Ultimately, lithology mapping and mineral discrimination using satellite imaging provide a high degree of accuracy (high spatial resolution) compared to the region’s current geological map, which is scaled at 1/500,000. (Low spatial resolution). Despite all the advantages that were mentioned above, RS methods are not able to detect smaller objects, which is why they need to be enhanced.

Supplementary Materials

The following supporting information can be downloaded at: https://0-www-mdpi-com.brum.beds.ac.uk/article/10.3390/su142215349/s1, Figure S1: False color composite (a. Landsat oli-8 and b. ASTER); Figure S2: Landsat 8 Oli bands ration used in geology; Figure S3: ASTER bands ration used in geology; Figure S4: PCA Composite bands 3, 2, 1 (a. Landsat 8 Oli and c. ASTER) and MNF Composite bands 3, 2, 1 (b. Landsat 8 Oli and d. ASTER); Table S1: Summary of selected satellite sensors; Table S2: Details of the most color composite used in geology; Table S3: Details band ratios usefulness in geological studies; Table S4: Accuracy assessment for SAM for SAM classification of ASTER image. Refs [23,24,25,26,39,40,41,42,43] are citied in supplementary materials.

Author Contributions

Conceptualization, A.E. (Abdallah Elaaraj), H.T., A.L. and A.A.; methodology, A.E. (Abdallah Elaaraj), H.T., F.M., A.A., A.E. (Ali Essahlaoui), S.H., Y.E.Y. and H.G.; software, A.E. (Abdallah Elaaraj), H.T., A.A. and A.E. (Ali Essahlaoui); validation, A.E. (Abdallah Elaaraj), H.T. and A.L.; formal analysis, A.E. (Abdallah Elaaraj), H.T., A.L., A.A. and Q.B.P.; investigation, A.E. (Abdallah Elaaraj); resources, A.E. (Abdallah Elaaraj), data curation, A.E. (Abdallah Elaaraj); writing—original draft preparation, A.E. (Abdallah Elaaraj) and A.A.; writing—review and editing, A.E. (Abdallah Elaaraj), H.T., A.L., M.M., A.V., N.E., S.H., Q.B.P., Y.E.Y. and H.G.; visualization, A.E. (Abdallah Elaaraj); supervision, H.T. and A.L.; project administration, A.E. (Abdallah Elaaraj), H.T. and A.L.; funding acquisition, H.T. and A.L. All authors have read and agreed to the published version of the manuscript.

Funding

This research received no external funding.

Informed Consent Statement

Not applicable.

Data Availability Statement

Not applicable.

Conflicts of Interest

The authors declare no conflict of interest.

References

  1. El Yousfi, Y.; Himi, M.; El Ouarghi, H.; Elgettafi, M.; Benyoussef, S.; Gueddari, H.; Aqnouy, M.; Salhi, A.; Alitane, A. Hydrogeochemical and Statistical Approach to Characterize Groundwater Salinity in the Ghiss-Nekkor Coastal Aquifers in the Al Hoceima Province, Morocco. Groundw. Sustain. Dev. 2022, 19, 100818. [Google Scholar] [CrossRef]
  2. Hinton, J.C. GIS and Remote Sensing Integration for Environmental Applications. Int. J. Geogr. Inf. Syst. 1996, 10, 877–890. [Google Scholar] [CrossRef]
  3. Albert, D.P.; Gesler, W.M.; Levergood, B. Spatial Analysis, GIS, and Remote Sensing Applications in the Health Sciences; Ann Arbor Press Chelsea: Chelsea, MI, USA, 2000. [Google Scholar]
  4. Sarkar, S.; Kanungo, D.P. An Integrated Approach for Landslide Susceptibility Mapping Using Remote Sensing and GIS. Photogramm. Eng. Remote Sens. 2004, 70, 617–625. [Google Scholar] [CrossRef]
  5. Alitane, A.; Essahlaoui, A.; El Hafyani, M.; El Hmaidi, A.; El Ouali, A.; Kassou, A.; El Yousfi, Y.; van Griensven, A.; Chawanda, C.J.; Van Rompaey, A. Water Erosion Monitoring and Prediction in Response to the Effects of Climate Change Using RUSLE and SWAT Equations: Case of R’Dom Watershed in Morocco. Land 2022, 11, 93. [Google Scholar] [CrossRef]
  6. Pour, A.B.; Hashim, M. Hydrothermal Alteration Mapping from Landsat-8 Data, Sar Cheshmeh Copper Mining District, South-Eastern Islamic Republic of Iran. J. Taibah Univ. Sci. 2015, 9, 155–166. [Google Scholar] [CrossRef] [Green Version]
  7. Omali, T.U. Utilization of Remote Sensing and GIS in Geology and Mining. Int. J. Sci. Res. Multidiscip. Stud. 2021, 7, 17–24. [Google Scholar]
  8. Cracknell, M.J.; Reading, A.M. Geological Mapping Using Remote Sensing Data: A Comparison of Five Machine Learning Algorithms, Their Response to Variations in the Spatial Distribution of Training Data and the Use of Explicit Spatial Information. Comput. Geosci. 2014, 63, 22–33. [Google Scholar] [CrossRef] [Green Version]
  9. Gomez, C.; Delacourt, C.; Allemand, P.; Ledru, P.; Wackerle, R. Using ASTER Remote Sensing Data Set for Geological Mapping, in Namibia. Phys. Chem. Earth Parts A/B/C 2005, 30, 97–108. [Google Scholar] [CrossRef]
  10. El Janati, M.; Soulaimani, A.; Admou, H.; Youbi, N.; Hafid, A.; Hefferan, K.P. Application of ASTER Remote Sensing Data to Geological Mapping of Basement Domains in Arid Regions: A Case Study from the Central Anti-Atlas, Iguerda Inlier, Morocco. Arab. J. Geosci. 2014, 7, 2407–2422. [Google Scholar] [CrossRef]
  11. Massironi, M.; Bertoldi, L.; Calafa, P.; Visonà, D.; Bistacchi, A.; Giardino, C.; Schiavo, A. Interpretation and Processing of ASTER Data for Geological Mapping and Granitoids Detection in the Saghro Massif (Eastern Anti-Atlas, Morocco). Geosphere 2008, 4, 736–759. [Google Scholar] [CrossRef] [Green Version]
  12. Van der Werff, H.; Van der Meer, F. Sentinel-2A MSI and Landsat 8 OLI Provide Data Continuity for Geological Remote Sensing. Remote Sens. 2016, 8, 883. [Google Scholar] [CrossRef]
  13. Bachri, I.; Hakdaoui, M.; Raji, M.; Teodoro, A.C.; Benbouziane, A. Machine Learning Algorithms for Automatic Lithological Mapping Using Remote Sensing Data: A Case Study from Souk Arbaa Sahel, Sidi Ifni Inlier, Western Anti-Atlas, Morocco. ISPRS Int. J. Geo-Inf. 2019, 8, 248. [Google Scholar] [CrossRef] [Green Version]
  14. Abrams, M.; Yamaguchi, Y. Twenty Years of ASTER Contributions to Lithologic Mapping and Mineral Exploration. Remote Sens. 2019, 11, 1394. [Google Scholar] [CrossRef] [Green Version]
  15. Pohl, C.; van Genderen, J. Remote Sensing Image Fusion: An Update in the Context of Digital Earth. Int. J. Digit. Earth 2014, 7, 158–172. [Google Scholar] [CrossRef]
  16. Salem, S.M.; El Sharkawi, M.; El-Alfy, Z.; Soliman, N.M.; Ahmed, S.E. Exploration of Gold Occurrences in Alteration Zones at Dungash District, Southeastern Desert of Egypt Using ASTER Data and Geochemical Analyses. J. Afr. Earth Sci. 2016, 117, 389–400. [Google Scholar] [CrossRef]
  17. Morel, A.; Gentili, B. A Simple Band Ratio Technique to Quantify the Colored Dissolved and Detrital Organic Material from Ocean Color Remotely Sensed Data. Remote Sens. Environ. 2009, 113, 998–1011. [Google Scholar] [CrossRef]
  18. Benali, T.; Khabbach, A.; Ennabili, A.; Hammani, K. Ethnopharmacological Prospecting of Medicinal Plants from the Province of Guercif (NE of Morocco). Moroc. J. Biol. 2017, 14, 1–14. [Google Scholar]
  19. Hamdach, Y. Rainfall Trend Analysis in Context of Climate Change in Guercif City, Morocco. Eur. Sci. J. ESJ 2019, 15, 69. [Google Scholar] [CrossRef]
  20. Géologie_MAROC. Available online: https://www.mediafire.com/file/gjm3cgi02dzw15k/G%25C3%25A9ologie_MAROC.rar/file (accessed on 29 September 2022).
  21. Boufkri, H.; El Azzab, D.; Miftah, A.; Mohammed, C. Identifications and Geodynamic Implications of Magnetic Structures of the Oujda-Debdou-Guercif Zone (North-Eastern of Morocco): Analysis and Processing of Aeromagnetic Data. Arab. J. Geosci. 2021, 14, 1–17. [Google Scholar] [CrossRef]
  22. Hernandez, J.; Bellon, H. Chronologie K-Ar Du Volcanisme Miocène Du Rif Oriental (Maroc): Implications Tectoniques et Magmatologiques. Rev. Géol. Dyn. Géographie Phys. 1985, 26, 85–94. [Google Scholar]
  23. Korhonen, L.; Packalen, P.; Rautiainen, M. Comparison of Sentinel-2 and Landsat 8 in the Estimation of Boreal Forest Canopy Cover and Leaf Area Index. Remote Sens. Environ. 2017, 195, 259–274. [Google Scholar] [CrossRef]
  24. Roy, D.P.; Wulder, M.A.; Loveland, T.R.; Woodcock, C.E.; Allen, R.G.; Anderson, M.C.; Helder, D.; Irons, J.R.; Johnson, D.M.; Kennedy, R. Landsat-8: Science and Product Vision for Terrestrial Global Change Research. Remote Sens. Environ. 2014, 145, 154–172. [Google Scholar] [CrossRef] [Green Version]
  25. Rogan, J.; Chen, D. Remote Sensing Technology for Mapping and Monitoring Land-Cover and Land-Use Change. Prog. Plan. 2004, 61, 301–325. [Google Scholar] [CrossRef]
  26. Adiri, Z.; El Harti, A.; Jellouli, A.; Maacha, L.; Bachaoui, E.M. Lithological Mapping Using Landsat 8 OLI and Terra ASTER Multispectral Data in the Bas Drâa Inlier, Moroccan Anti Atlas. J. Appl. Remote Sens. 2016, 10, 016005. [Google Scholar] [CrossRef]
  27. Baboo, S.S.; Devi, M.R. Geometric Correction in Recent High Resolution Satellite Imagery: A Case Study in Coimbatore, Tamil Nadu. Int. J. Comput. Appl. 2011, 14, 32–37. [Google Scholar] [CrossRef]
  28. Dave, C.P.; Joshi, R.; Srivastava, S.S. A Survey on Geometric Correction of Satellite Imagery. Int. J. Comput. Appl. 2015, 116, 24–27. [Google Scholar]
  29. Begeman, C.; Helder, D.; Leigh, L.; Pinkert, C. Relative Radiometric Correction of Pushbroom Satellites Using the Yaw Maneuver. Remote Sens. 2022, 14, 2820. [Google Scholar] [CrossRef]
  30. Cooley, T.; Anderson, G.P.; Felde, G.W.; Hoke, M.L.; Ratkowski, A.J.; Chetwynd, J.H.; Gardner, J.A.; Adler-Golden, S.M.; Matthew, M.W.; Berk, A. FLAASH, a MODTRAN4-Based Atmospheric Correction Algorithm, Its Application and Validation. In Proceedings of the IEEE International Geoscience and Remote Sensing Symposium, Toronto, ON, Canada, 24–28 June 2002; Volume 3, pp. 1414–1418. [Google Scholar]
  31. Iwasaki, A.; Tonooka, H. Validation of a Crosstalk Correction Algorithm for ASTER/SWIR. IEEE Trans. Geosci. Remote Sens. 2005, 43, 2747–2751. [Google Scholar] [CrossRef]
  32. Palluconi, F.; Hoover, G.; Alley, R.; Jentoft-Nilsen, M.; Thompson, T. An Atmospheric Correction Method for ASTER Thermal Radiometry over Land. Algorithm Theor. Basis Doc. 1999, 36, 1199–1211. [Google Scholar]
  33. Deur, M.; Gašparović, M.; Balenović, I. An Evaluation of Pixel- and Object-Based Tree Species Classification in Mixed Deciduous Forests Using Pansharpened Very High Spatial Resolution Satellite Imagery. Remote Sens. 2021, 13, 1868. [Google Scholar] [CrossRef]
  34. Al Hakim, A.Y.; Sulistijo, B. Integrated Exploration Method to Determine Cu Prospect in Seweden District, Blitar, East Java. Procedia Earth Planet. Sci. 2013, 6, 64–69. [Google Scholar] [CrossRef] [Green Version]
  35. Green, A.A.; Berman, M.; Switzer, P.; Craig, M.D. A Transformation for Ordering Multispectral Data in Terms of Image Quality with Implications for Noise Removal. IEEE Trans. Geosci. Remote Sens. 1988, 26, 65–74. [Google Scholar] [CrossRef] [Green Version]
  36. Harris, J.R.; Rogge, D.; Hitchcock, R.; Ijewliw, O.; Wright, D. Mapping Lithology in Canada’s Arctic: Application of Hyperspectral Data Using the Minimum Noise Fraction Transformation and Matched Filtering. Can. J. Earth Sci. 2005, 42, 2173–2193. [Google Scholar] [CrossRef]
  37. Kruse, F.A.; Lefkoff, A.B.; Boardman, J.W.; Heidebrecht, K.B.; Shapiro, A.T.; Barloon, P.J.; Goetz, A.F.H. The Spectral Image Processing System (SIPS)—Interactive Visualization and Analysis of Imaging Spectrometer Data. Remote Sens. Environ. 1993, 44, 145–163. [Google Scholar] [CrossRef]
  38. Kruse, F.A.; Lefkoff, A.B.; Boardman, J.W.; Heidebrecht, K.B.; Shapiro, A.T.; Barloon, P.J.; Goetz, A.F.H. The Spectral Image Processing System (SIPS): Software for Integrated Analysis of AVIRIS Data. In JPL, Summaries of the Third Annual JPL Airborne Geoscience Workshop; AVIRIS Workshop: Pasadena, CA, USA, 1992; Volume 1. [Google Scholar]
  39. Abdulmalik, N.; Garba, I.; Abubakar, I.Y.; Muhyideen, H.; Agunleti, Y.S.; Magaji, S.S.; Aliyu, A.E.; Umaru, A.O. Application of landsat-8 operational land imager and shuttle radar topography mission-digital elevation model in the study of ikara and its environs, northwestern Nigeria. Fudma J. Sci. 2021, 5, 259–273. [Google Scholar] [CrossRef]
  40. Ali, A.S.; Pour, A.B. Lithological Mapping and Hydrothermal Alteration Using Landsat 8 Data: A Case Study in Ariab Mining District, Red Sea Hills, Sudan. Int. J. Basic Appl. Sci. 2014, 3, 199. [Google Scholar] [CrossRef]
  41. Cardoso-Fernandes, J.; Teodoro, A.C.; Lima, A. Remote Sensing Data in Lithium (Li) Exploration: A New Approach for the Detection of Li-Bearing Pegmatites. Int. J. Appl. Earth Obs. Geoinf. 2019, 76, 10–25. [Google Scholar] [CrossRef]
  42. Banerjee, K.; Jain, M.K.; Panda, S.; Jeyaseelan, A.T. Landsat 8 OLI Data for Identification of Hydrothermal Alteration Zone in Singhbhum Shear Zone Using Successive Band Depth Difference Technique—A New Image Processing Approach. Curr. Sci. 2019, 116, 1639–1647. [Google Scholar] [CrossRef]
  43. Traore, M.; Wambo, J.D.T.; Ndepete, C.P.; Tekin, S.; Pour, A.B.; Muslim, A.M. Lithological and Alteration Mineral Mapping for Alluvial Gold Exploration in the South East of Birao Area, Central African Republic Using Landsat-8 Operational Land Imager (OLI) Data. J. Afr. Earth Sci. 2020, 170, 103933. [Google Scholar] [CrossRef]
  44. Ovalle, A.P.A. Elaboration of an Unsupervised and Supervised Classification to Generate the Vegetal Covers of a LANDSAT 7-ETM Satellite Image Using the R and PCI Geomatics Programs in Order to Compare the Results Obtained. Ph.D. Thesis, Universidad Militar Nueva Granada, Bogota, Colombia, 2017. [Google Scholar]
  45. Zeng, Y.; Zhang, J.; Wang, G.; Li, Y. RapidEye Satellite Image Quality Analysis and Solutions for Its True Color Composition. In Proceedings of the 2011 International Workshop on Multi-Platform/Multi-Sensor Remote Sensing and Mapping, Xiamen, China, 10–12 January 2011; pp. 1–4. [Google Scholar]
  46. Loughlin, W.P. Principal Component Analysis for Alteration Mapping. Photogramm. Eng. Remote Sens. 1991, 57, 1163–1169. [Google Scholar]
  47. Mohajane, M.; Essahlaoui, A.; Oudija, F.; El Hafyani, M.; Cláudia Teodoro, A. Mapping Forest Species in the Central Middle Atlas of Morocco (Azrou Forest) through Remote Sensing Techniques. ISPRS Int. J. Geo-Inf. 2017, 6, 275. [Google Scholar] [CrossRef] [Green Version]
  48. Kuching, S. The Performance of Maximum Likelihood, Spectral Angle Mapper, Neural Network and Decision Tree Classifiers in Hyperspectral Image Analysis. J. Comput. Sci. 2007, 3, 419–423. [Google Scholar]
  49. El Atillah, A.; ZINE, E.M.Z.; Souhassou, M. Utilisation de l’image Multi Spectrale Pour l’exploration et La Recherche Des Ressources Minérales: État Des Connaissances et Proposition d’un Modèle de Traitement. Eur. Sci. J. 2018, 14, 350. [Google Scholar]
  50. El Kati, I.; Benammi, M.; Tabyaoui, H.; Ouabid, M.; Benammi, M. Structural Style and Deformation Mechanism of Neogene Series of the Guercif Basin (NE-Morocco). J. Iber. Geol. 2022, 48, 281–296. [Google Scholar] [CrossRef]
  51. El Azzouzi, M.; Bellon, H.; Coutelle, A.; Réhault, J.-P. Miocene Magmatism and Tectonics within the Peri-Alboran Orogen (Western Mediterranean). J. Geodyn. 2014, 77, 171–185. [Google Scholar] [CrossRef]
  52. Hernandez, J. Le Volcanisme Miocene Du Rif Oriental (Maroc); Académie de Paris Univ. Pierre et Marie Curie U.E.R. des Sciences de la Terre: Paris, France, 1983. [Google Scholar]
Figure 1. Location of the study area.
Sustainability 14 15349 g001
Figure 2. Geological map of the study area.
Sustainability 14 15349 g002
Figure 3. Flow chart of the used methodology.
Sustainability 14 15349 g003
Figure 4. Outcrop of igneous rocks.
Sustainability 14 15349 g004
Figure 5. Spectral Angle Mapper classification ((a) Landsat and (b) ASTER).
Sustainability 14 15349 g005
Figure 6. Mineral indices results.
Sustainability 14 15349 g006
Figure 7. Likelihood supervised classification ((a) Landsat 8 Oli and (b) ASTER).
Sustainability 14 15349 g007
Figure 8. Spectral Angle Mapper classification map.
Sustainability 14 15349 g008
Figure 9. Digitalized geological map.
Sustainability 14 15349 g009
Table 1. Landsat 8 Oli PCA correlation.
CorrelationBand 2Band 3Band 4Band 5Band 6Band 7
PC 110.970.910.890.900.96
PC 20.9710.940.950.960.87
PC 30.910.9410.950.930.81
PC 40.890.950.9510.990.75
PC 50.900.960.930.9910.77
PC 60.960.870.810.750.771
Table 2. ASTER PCA correlation.
CorrelationBand 1Band 2Band 3Band 4Band 5Band 6Band 7Band 8Band 9
PC110.990.980.930.940.940.920.920.91
PC20.9910.990.950.960.960.940.940.94
PC30.980.9910.960.970.970.940.950.95
PC40.930.950.9610.990.990.980.980.99
PC50.940.960.970.9910.990.970.980.98
PC60.940.960.970.990.9910.970.970.98
PC70.920.940.940.980.970.9710.990.98
PC80.920.940.950.980.980.970.9910.99
PC90.910.940.950.990.980.980.980.991
Table 3. Standard deviation, Eigenvectors Matrix, and Eigenvalues for Landsat 8 PCA results.
EigenvectorVisibleNIRSWIR-1SWIR-2
Band 2Band 3Band 4Band 5Band 6Band 7Eigen Value %
StdDev1532.942055.772412.673108.762672.431266.22
PC 10.270.370.430.570.490.2094.62
PC 2−0.48−0.24−0.100.440.29−0.653.45
PC 3−0.17−0.220.87−0.08−0.36−0.151.45
PC 40.05−0.78−0.060.350.010.510.34
PC 5−0.20−0.200.18−0.590.730.130.11
PC 6−0.790.32−0.030.11−0.120.490.03
Table 4. Standard deviation, Eigenvectors Matrix, and Eigenvalues for ASTER PCA result.
EigenvectorVNIR (Visible and Near Infrared)SWIR (Short-Wave Infrared)
Band 1Band 2Band 3Band 4Band 5Band 6Band 7Band 8Band 9Eigen Value %
StdDev0.110.150.180.200.200.200.190.170.16
PC 1−0.21−0.28−0.34−0.39−0.38−0.38−0.36−0.32−0.3197.33
PC 2−0.45−0.48−0.490.170.07−0.020.350.290.291.59
PC 30.210.180.12−0.26−0.44−0.480.530.340.070.50
PC 40.100.06−0.29−0.550.230.450.380.04−0.450.18
PC 50.530.14−0.560.330.32−0.38−0.03−0.01−0.150.14
PC 6−0.27−0.060.240.47−0.01−0.150.40−0.25−0.630.11
PC 7−0.26−0.010.28−0.340.70−0.48−0.070.13−0.010.07
PC 80.13−0.110.02−0.130.12−0.070.39−0.780.430.04
PC 90.50−0.790.30−0.020.040.03−0.020.13−0.120.04
Publisher’s Note: MDPI stays neutral with regard to jurisdictional claims in published maps and institutional affiliations.

