Article

Tilt Angle and Orientation Assessment of Photovoltaic Thermal (PVT) System for Sub-Saharan Tropical Regions: Case Study Douala, Cameroon

by
Aloys Martial Ekoe A Akata
1,2,3,*,
Donatien Njomo
2,
Basant Agrawal
3,
Auguste Mackpayen
4 and
Abdel-Hamid Mahamat Ali
5
1
Energy Systems Technology Laboratory (ESTL), University of Douala, Douala P.O. Box 24157, Cameroon
2
Environmental Energy Technologies Laboratory (EETL), University of Yaoundé I, Yaoundé P.O. Box 812, Cameroon
3
Department of Mechanical Engineering, Shri Govindram Seksaria Institute of Technology and Science, Indore 452 003, India
4
Department of Mechanical Engineering, University of Bangui, Bangui P.O. Box 1450, Central African Republic
5
Higher National Petroleum Institute of Mao, N’Djamena 4377, Chad
*
Author to whom correspondence should be addressed.
Sustainability 2022, 14(23), 15591; https://0-doi-org.brum.beds.ac.uk/10.3390/su142315591
Submission received: 16 September 2022 / Revised: 11 October 2022 / Accepted: 12 October 2022 / Published: 23 November 2022
(This article belongs to the Special Issue Sustainable Energy Saving Building Envelopes)

Abstract

:
Photovoltaic systems when integrated into a building structure can satisfy the world’s energy requirements at a competitive cost by providing onsite electrical and thermal energies for domestic appliances. The energy yield of the photovoltaic system is affected by the intensity of the solar radiation, wind speed, tilt angle, orientation, geographical location, etc. This paper presents an optimisation model of the tilt angle and orientation of a photovoltaic thermal system. A methodology has been developed to optimize the tilted angle of the roof for higher exergy output taking into account the intensity of solar radiation, wind speed, geographical location, cost of cleaning dust, etc. For a system installed in the city of Douala, Cameroon, it is recommended that the PV should be inclined at an angle between 10° and 20° south-facing for economical output. The cost per unit of electricity between the tilt inclination angles from 0° to 20° with south orientation is USD 0.04 per kWh. The cost of electricity loss due to a 20° tilt inclination angle can be compensated with the labour cost and work required for cleaning the photovoltaic thermal (PVT) system of the horizontal roof. The system installed over an effective area of 8 m2 is capable of producing annual net exergy of 2195.81 kWh/year at an efficiency of 11.8%.

1. Introduction

Sub-Saharan Africa (SSA) is located within 35° south to 25° north of latitudes and 18° west to 53° east of longitudes, covers an area of around 23,000,000 km2 and contains 48 countries. The annual global horizontal solar irradiation in SSA is 1534–2556 kWh/m2 with a total average daily global horizontal solar irradiation ranging from 4.2 to 7.0 kWh/m2. More than 85% of the continent’s landscape receives a global solar horizontal irradiation of 2000 kWh/m2. The average ambient air temperature over the year is about 28 °C. There is a high variation of ambient air temperature, relative humidity and wind speed. These variations of ambient air temperature and air relative humidity are not favourable in regard to thermal comfort in houses, if appropriate building design, materials and constructions are not used. World Bank data report that the population of Sub-Sahara Africa has grown from 186 million to 856 million people from 1950–2010, representing a rate of about 11 million people a year for the past 60 years. At the end of 2018, the SSA population was about 1.078 billion inhabitants. In 2060, the population of SSA could be as large as 2.7 billion people [1]. Population growth tends to increase the absolute energy use of the population. Around 63% of the SSA population lives in rural areas, one of the lowest shares of any world region, which has important implications for the approach to solving energy challenges. Access to minimum electricity energy in the region is crucial for economic and social development. The available data show that the electricity demand in SSA (currently 488 kWh/year average electricity consumption per capita) grows quickly and a large portion remains latent due to low access levels [2].
The lowering costs of solar equipment can significantly increase photovoltaic installations in Africa. It is expected that the African continent’s annual photovoltaic (PV) market will expand from 17 GW at present to 70 GW of solar PV capacity in 2030 with an overall reduction of the price of PV modules from approx. USD 2 per watt at present to less than USD 1.30 per watt in 2030. Another challenge is to perform an effective grid operation. In response to this cost reduction, many solar photovoltaic projects were added, about 800 MW of solar PV in 2014 and 750 MW in 2015, doubling its cumulative capacity according to IRENA. With recent substantial cost reductions, solar PV offers a rapid, cost-effective way to provide utility-scale electricity for the grid and modern energy services to the approximately 600 million Africans who lack electricity access [3].
Cameroon is a sub-Saharan African country bordered by Nigeria to the west, Chad to the northeast, Equatorial Guinea, Gabon and the Republic of Congo to the south and Central Africa to the east. It currently has a population of over 27 million, with a population growth rate of 2.6 percent. Like many other countries in the Sub-Saharan African region, Cameroon has many potential sources of renewable energy that are not fully exploited. Cameroon’s solar potential is quite enormous. Average daily solar radiation ranges from about 4.5 kWh/m2/day in the south to about 5.7 kWh/m2/day in the north. However, solar energy is not sufficiently well exploited. The government of Cameroon has the ambition to increase investments in photovoltaic electricity. Many solar projects have been implemented to increase the rate of access to electricity, and public lighting as the Cameroon 2025 Photovoltaic Power Project PV. This project targets off-grid rural villages as well as underserved urban populations. The program plans to develop more than 500 MW of installed PV capacity throughout the country for a production of 750 GWh (about 1500 MWh/year for an installed capacity of 1 MW). However, the industry is facing a problem due to the lack of local technicians. Allowing for the fact that, the popularity of solar technologies grows, particularly PV systems, the aim of the study is to prevent their indiscriminate use in the construction sector and to encourage the use of photovoltaic electricity.

1.1. Tilt Angle and Orientation

Photovoltaic solar panels are installed differently throughout the world based on their geographic locations. Panels need to be directed according to the position of the sun, especially when the photovoltaic collector is made of polycrystalline, monocrystalline or amorphous solar cells. The ideal situation is when the sun rays are hitting the panels at a perfectly perpendicular angle. This maximizes the amount of energy output produced by the PV panels. Two factors that such an angle is controlled by are the azimuth angle (orientation of the panel toward north, south, east and west) and the tilt angle of the panels from the horizontal surface. The importance of these angles in solar energy application is shown by Mukisa et al. [4] who investigated the influence of solar photovoltaic modules’ tilt angle on energy yield in low latitude equatorial regions. They found that the annual optimal tilt angle is the best installation option for pitched rooftops for all azimuth angles. Hartner et al. [5] presented a theoretical explanation demonstrating that the annual maximum output of a PV system is not always the optimal solution. Zheng [6] proposed that the tilt angle can be obtained by increasing latitude to 10 degrees for winter and reducing latitude to 10 degrees for summer if optimum daily solar irradiation is required. Corrada et al. [7] demonstrated that using the optimum tilt angle can reduce the cost and the number of solar panels in a residential solar cooling system. A new automated method for identifying PV system location, tilt and azimuth was presented by Haghdadi et al. [8]. They identified the longitude of a PV system’s location by finding the difference between solar noon and local noon. The results indicate good accuracy for the detection of location, tilt and azimuth. The knowledge of the optimal orientation and tilt angle allows for knowing the maximum exergy output of the photovoltaic system. The evaluation of the energy output of photovoltaic systems that are integrated/non-integrated on the rooftop of the building has been carried out by many studies [9]. Elhassan et al. [10] carry out an experimental setup to determine optimum tilt angles for building-integrated photovoltaic designs and applications in Kuala Lumpur, Malaysia. Four PV modules were inclined north, south, east and west. For this location, the optimum tilt angle was found to be nearly equal to the latitude of the location. Bojić et al. [11] determined the optimum tilt angles at which electrical energy generation becomes maximum for PV systems that are located in four towns in Reunion Island, France using the Hooke Jeeves algorithm. The discrepancy between latitude and optimum tilt angles shows the need for determining optimum tilt angles for every location. Siraki et al. [12] proposed a modified anisotropic sky model in which many parameters such as the effects of the surrounding buildings and obstacles in urban locations, latitude, weather conditions, and optimum azimuth are taken into account to determine the optimum angle of five different locations. It has been found that for small latitudes, the optimum tilt angle is close to the location latitude. These studies show the evidence that optimum tilt angle for maximum solar radiation capturing needs to be determined accurately for any location. Lehloka et al. [13] investigated empirical validation of the optimum tilt for PV modules in the Highveld of South Africa. They used three fixed-axis PV modules installed at optimum tilt angles of latitude −10°, latitude, and latitude +10° for their study. They recommended that PV modules should be mounted at latitude minus 10° for the summertime period in the Highveld region of South Africa. Kokouvi [14] analysed the effect of orientation and tilt angles of solar collectors on their performance in West and Central Africa. He concluded that the usual recommendation of orientation to the equator and tilt to latitude should not be understood as a requirement. Ashetehe et al. [15] used isotropic and anisotropic diffuse solar radiation models to develop a model in order to determine the seasonal and annual optimal tilt angle of the photovoltaic module at any location in Ethiopia. The study showed that 5.11% to 6.275% (isotropic) and 5.72% to 6.346% (anisotropic models) solar radiation energy is lost when using the yearly average fixed optimal tilt angle as compared with the monthly optimal tilt angle. Obiwulu et al. [16] used an experimental approach to estimate the optimal monthly and yearly mean tilt angle in Lagos and 37 metropolitan cities in Nigeria. Six modules were mounted at different tilt angles with two modules north-facing, three south-facing, and one positioned horizontally to determine the orientation and tilt angle performance. The results were considerably appreciable concerning the magnitude of the values found in the literature, as well as the corresponding latitudes and global solar radiation recorded in those locations. In most studies, the energy yield of the PV system is a parameter used to determine the tilt angle and orientation of the PV system in the sub-Saharan tropical region. This study takes into account the exergy analysis and the labour cost and work required to clean the PVT system due to dust accumulation from the Saharan tropical wind.
Each day the sun travels in a circular path across the sky, reaching its highest point at noon. It is important to know the position of the sun at any time in order to have accurate incoming beam radiation falling on any surface of the Earth. The position of the sun can be geometrically described in terms of several angles. Some of these angles and a set of consistent sign conventions are as follows.
The declination can be obtained with the help of Cooper’s equation [17]:
δ = 23.45 π 180 sin [ 2 π ( 284 + n 365.25 ) ]
where n is the day of the year starting from 1 January ( n = 1 ) to 31 December ( n = 365 ).
The hour angle and the average number of sunshine hours of the day over the year can be obtained with the help of the sunrise hour angle as:
N = 1 365 i = 1 365 N i N i = 2 ω s , i ω s , i = cos 1 [ tan ( ϕ ) tan ( δ i ) ] ω = ( S T 12 ) × 15 °
where ST is solar time. The zenith angle defined as the angle between the sun’s rays and a line perpendicular to the horizontal plane can be determined using the expression:
cos ( θ z ) = cos ( ϕ ) cos ( δ ) cos ( ω ) + sin ( δ ) sin ( ϕ )
Thus, the solar incident angle defined as the angle between beam radiation on a surface and the normal to that surface is obtained with the expression:
cos ( θ i ) = [ cos ( ϕ ) cos ( β ) + sin ( ϕ ) sin ( β ) cos ( γ ) ] cos ( δ ) cos ( ω ) + cos ( δ ) sin ( ω ) sin ( β ) sin ( γ ) + sin ( γ ) [ sin ( ϕ ) cos ( β ) cos ( ϕ ) sin ( β ) cos ( γ ) ]
Many solar energy applications have been invented for heat and power generation. The fundamental input to these applications is solar radiation data. To design, and study, the performance and the optimization of any solar thermal and PV panel technologies, it is very important and necessary to have ready availability of reliable data. Unfortunately, for many developing countries, measured solar radiation data are unavailable. Thus, it is necessary to develop accurate methods and models to estimate solar radiation on the basis of the available meteorological data. Mulcué-Nieto proposed a methodology to estimate the solar irradiation on tilted surfaces for latitudes between 40° N and 40° S using the monthly average daily values on a horizontal surface as input data [18]. The total incident solar radiation on an inclined surface is the sum of three components: beam radiation I b ( β ) on a tilted surface, radiation reflected by the ground (surrounding area) I r ( β ) and sky diffuse radiation I d ( β ) on a tilted surface. The literature shows that there is an agreement in terms of beam and reflected radiation. The differences are in the determination of incident diffuse radiation on tilted surfaces [19,20]. There are isotropic and anisotropic models used to obtain the diffuse radiation component. The isotropic model is mostly used to estimate the amount of incident diffuse radiation on a tilted surface [17]. Following this model, the incident total solar radiation on a tilted surface can be obtained using the Liu and Jordan formula:
I t ( β ) = I b ( β ) + I r ( β ) + I d ( β ) I b ( β ) = cos ( θ i ) cos ( θ z ) I b ( β = 0 ) I r ( β ) = ρ [ 1 cos ( β ) 2 ] [ I b ( β = 0 ) + I d ( β = 0 ) ] I d ( β ) = [ 1 + cos ( β ) 2 ] I d ( β = 0 )

1.2. Net Exergy of the System

Exergy is the energy that is available to be used. It is the maximum useful work possible during a process that brings the system into equilibrium with a thermal reservoir. Exergy is always destroyed when a process is irreversible. Exergy analysis is used to optimize applications with physical restrictions, such as the analysis of the system using solar energy technologies. In thermodynamics, exergy is a quantity that measures the quality of an energy. It is the maximum amount of useful energy or mechanical work that can best be extracted from a system from its initial to final state under the restrictions given by the Second Law [21]. This concept is used in many studies to determine the overall performance of the system under consideration. Vats et al. [22,23] evaluated an exergy performance of a building-integrated semitransparent photovoltaic thermal (BISPVT) system and found for an effective area of 5.44 m2 that the overall annual thermal energy gain is 2497 kWh and electrical gain is 810 kWh. Yildiz et al. [24] presented an exergy analysis for the whole process of space heating for a better understanding and design of energy flows in buildings. Razmara et al. [25] developed a model predictive control (MPC) technique using the exergy model for a building in order to minimize exergy destruction in a Heating, Ventilation and Air-Conditioning (HVAC) system. Gholampour et al. [26] performed a detailed experimental and theoretical study of the PV/thermal flat transpired plate collectors based on exergy analysis in order to develop a predictive and validated model. Good agreement was obtained between measured and simulated values. Friesenhan et al. [27] compared three different technologies in terms of both energetic/exergetic efficiency analysis and environmental impact in order to state the best technology records performance. Exergy analysis can be generalized. The environment needs to be set properly. From the instantaneous quantity of heat Q ˙ u produced by the PVT system, instantaneous thermal exergy [28] is:
E ˙ t h e x = Q ˙ u [ 1 T a i r ( x = 0 ) T a i r ( x = d ) ]
The net exergy gain by the system can now be given by adding the electrical output as:
E ˙ e x = E e l + Q ˙ u [ 1 T a i r ( x = 0 ) T a i r ( x = d ) ]
and the net exergy efficiency can be obtained with the help of the expression:
η e x = E ˙ e x A R I P V T I t ( β )
The photovoltaic thermal (PVT) systems when integrated into the roof structure of the building, partially or fully, are called roof-integrated photovoltaic thermal (PVT) systems. Ekoe et al. [29] reviews the various options for integrating PV systems into building structures in the tropical region, especially in The Republic of Cameroon, and concluded that roof-integrated systems are more suitable than the façade integrated systems. In this paper, the roof-integrated photovoltaic thermal system (PVT) is optimized on the basis of exergy output considering the labour cost for cleaning the dust.

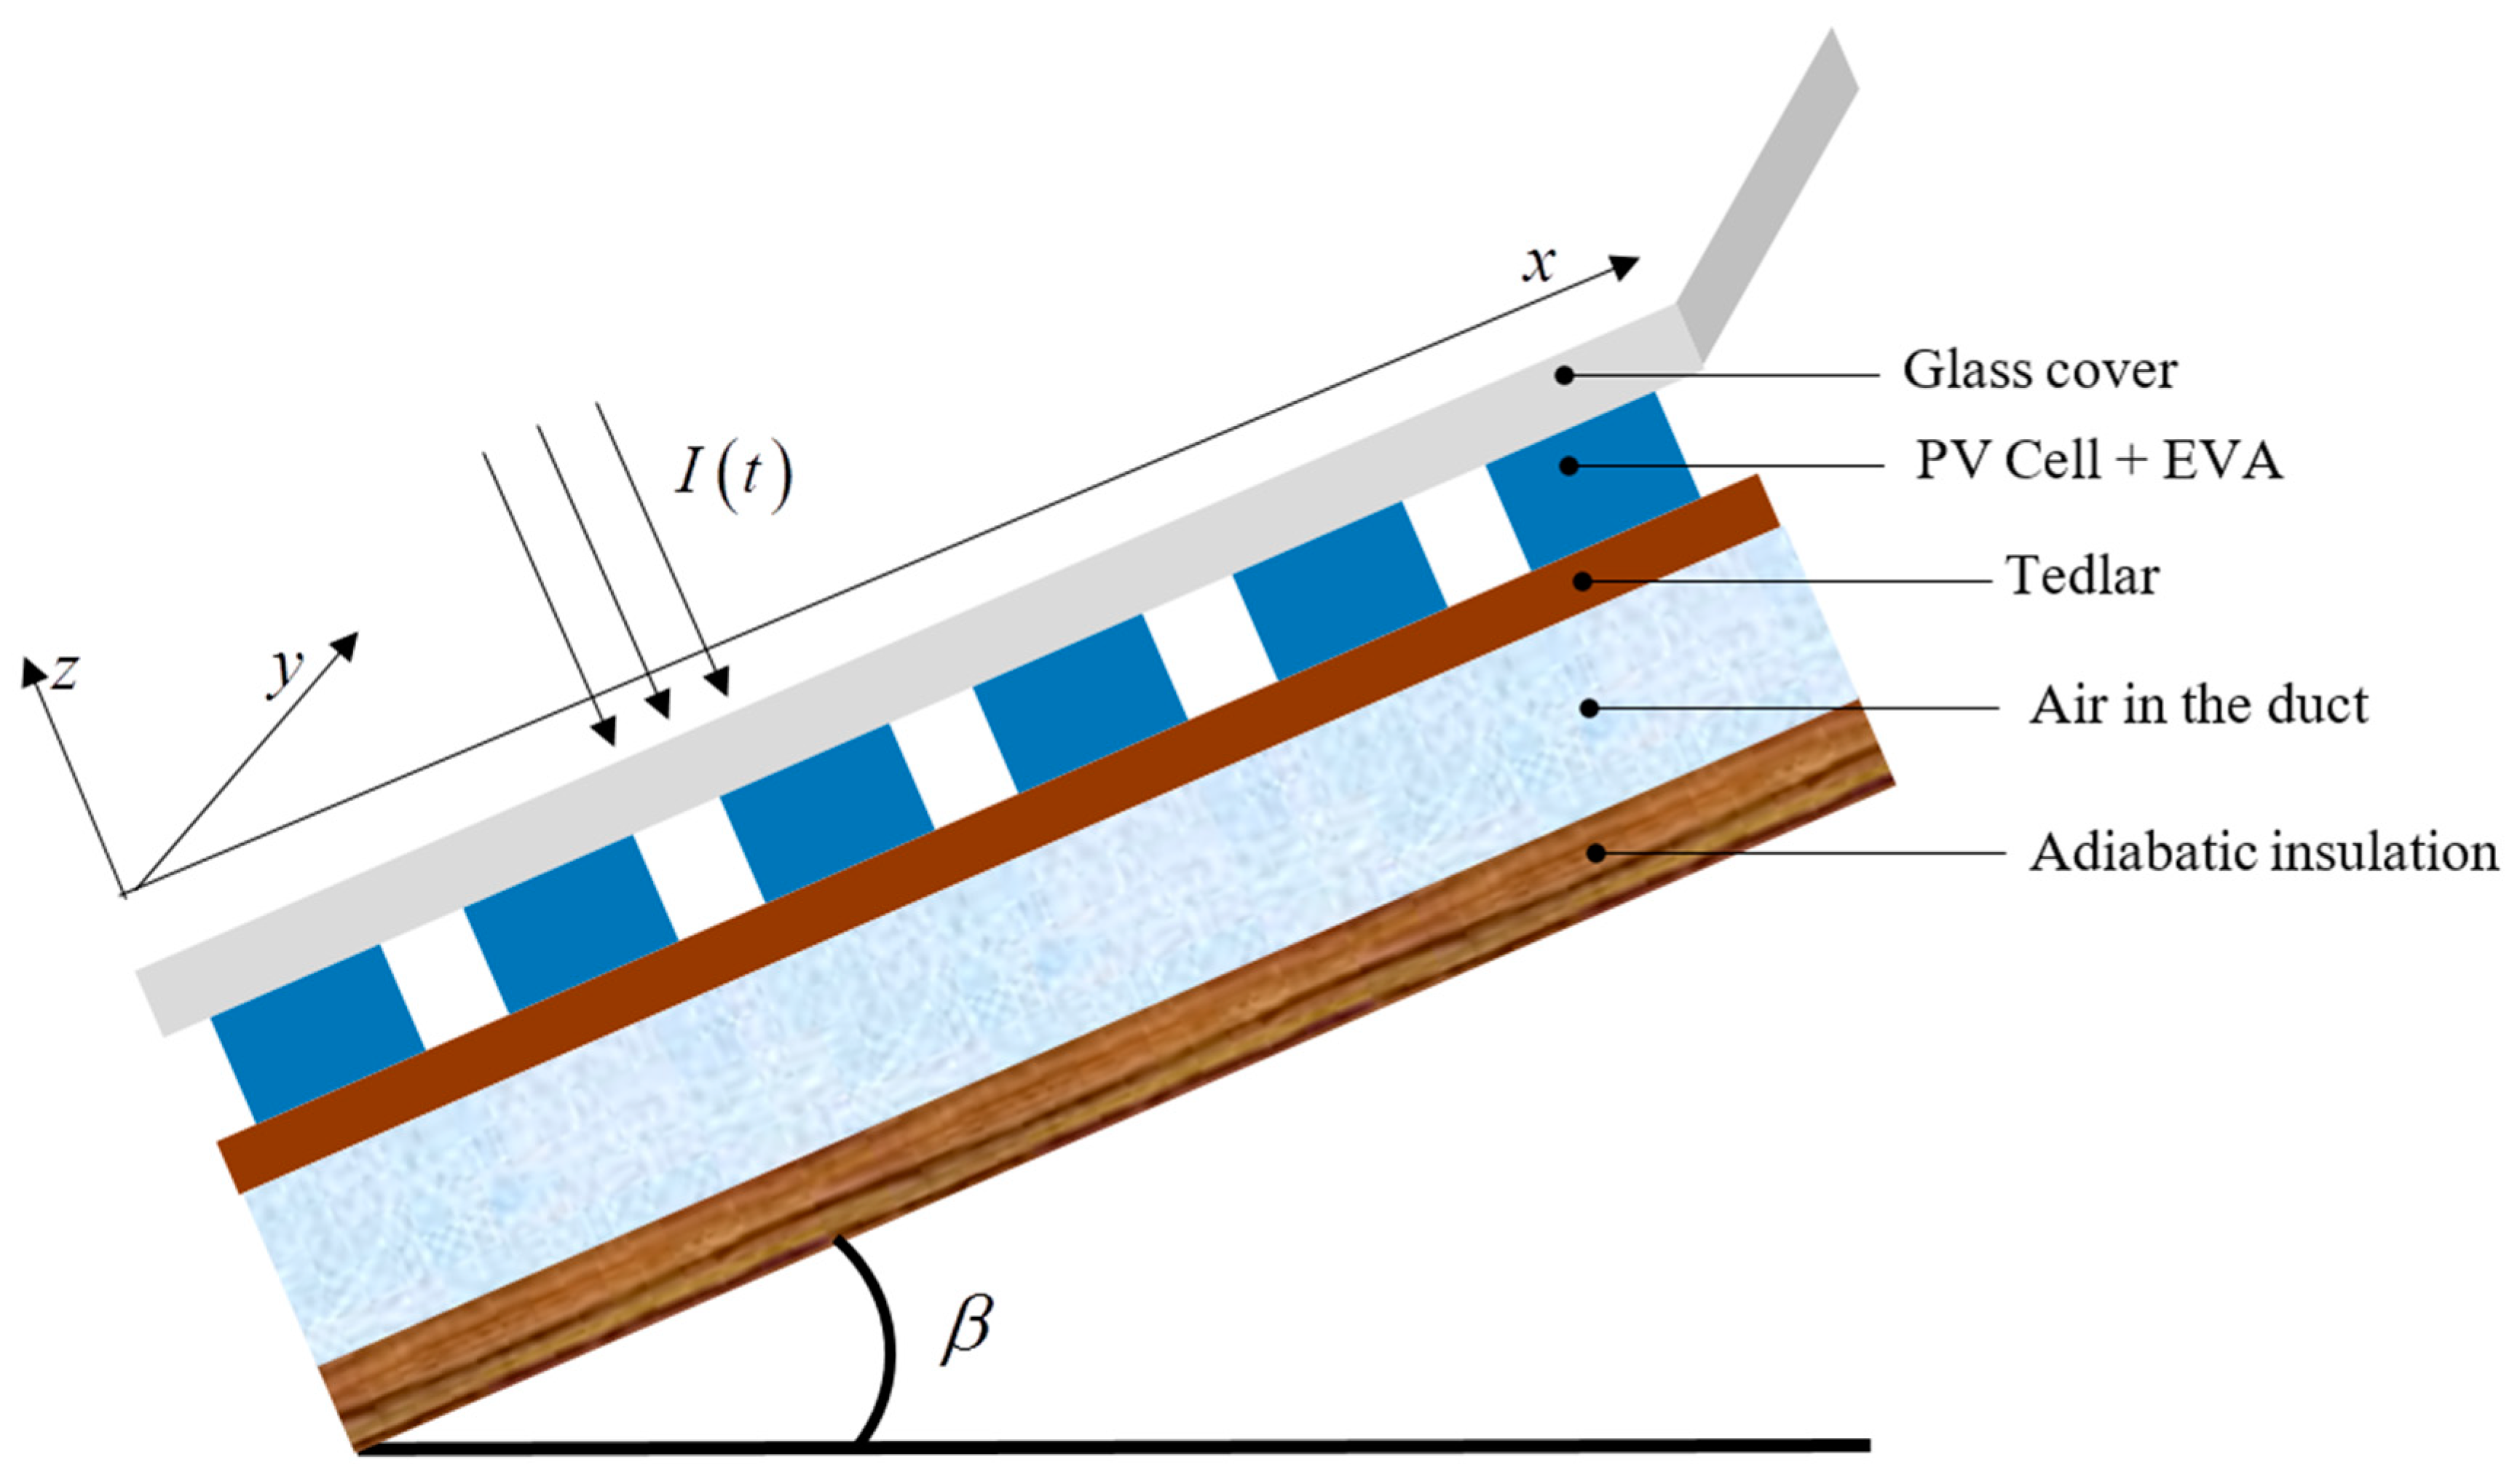
1.3. Mathematical Modelling of PVT System

The following assumptions have been made to write the energy balance equation of the PVT system shown in Figure 1:
i.
One-dimensional heat conduction is considered,
ii.
The system is in a quasi-steady state,
iii.
The glass cover and the photovoltaic module are at a uniform temperature,
iv.
Air properties are constant with time and temperature.

1.4. Temperature of PVT Components

The energy balance for the different components of the photovoltaic thermal system is as follows:
Glass cover of PV module
( α g τ g ) I t ( β ) h a ( T g T a ) U c , g ( T g T c ) = 0
Solar cell
( τ e ) e f f I t ( β ) ( U c , a + U c , b s ) T c + U c , a T a + U c , b s T b s = 0
and the solar cell temperature is obtained with the expression (Appendix A):
T c = U c , b s U c , a + U c , b s T b s + ( τ e ) e f f I t ( β ) + U c , a T a U c , a + U c , b s
Back sheet of PV module:
U c , b s ( T c T b s ) h a i r ( T b s T a i r ) = 0
and the temperature of the back sheet of the PV module is obtained with the expression:
T b s = h a i r ( U c , b s + h a i r ) U c , b s 2 U c , a + U c , b s T a i r + U c , b s [ ( τ e ) e f f I t ( β ) + U c , a T a ] ( U c , b s + h a i r ) ( U c , a + U c , b s ) U c , b s 2
Air flowing in the duct of the PVT module:
m ˙ a i r C a i r d T a i r d x h a i r b ( T b s T a i r ) = 0
The temperature of the air flowing in the duct can be obtained with the help of Equation (14) and the boundary condition T a i r ( x = 0 ) = T a i r , i n = T a , T a i r ( x = d ) = T a i r , o u t . (The expressions for F and G are given in Appendix A.)
T a i r ( x ) = T a i r , i n exp ( F x ) + G F [ 1 exp ( F x ) ]
and the average air temperature of the air flowing in the duct can be obtained as:
T ¯ a i r = 1 d 0 d T a i r ( x ) d x = 1 F d   ( T a i r , i n G F ) [ 1 exp ( F x ) ] + G F

1.5. Energy Output

1.5.1. Electrical energy

The actual electrical efficiency is given by:
η e l = η r e f [ 1 ϕ r e f ( T c T r e f ) ]
η r e f , ϕ r e f and T r e f are usually given by the photovoltaic module manufacturers. Thus the electrical energy output of the PVT system is:
E e l = A R I P V T η e l I t ( β )

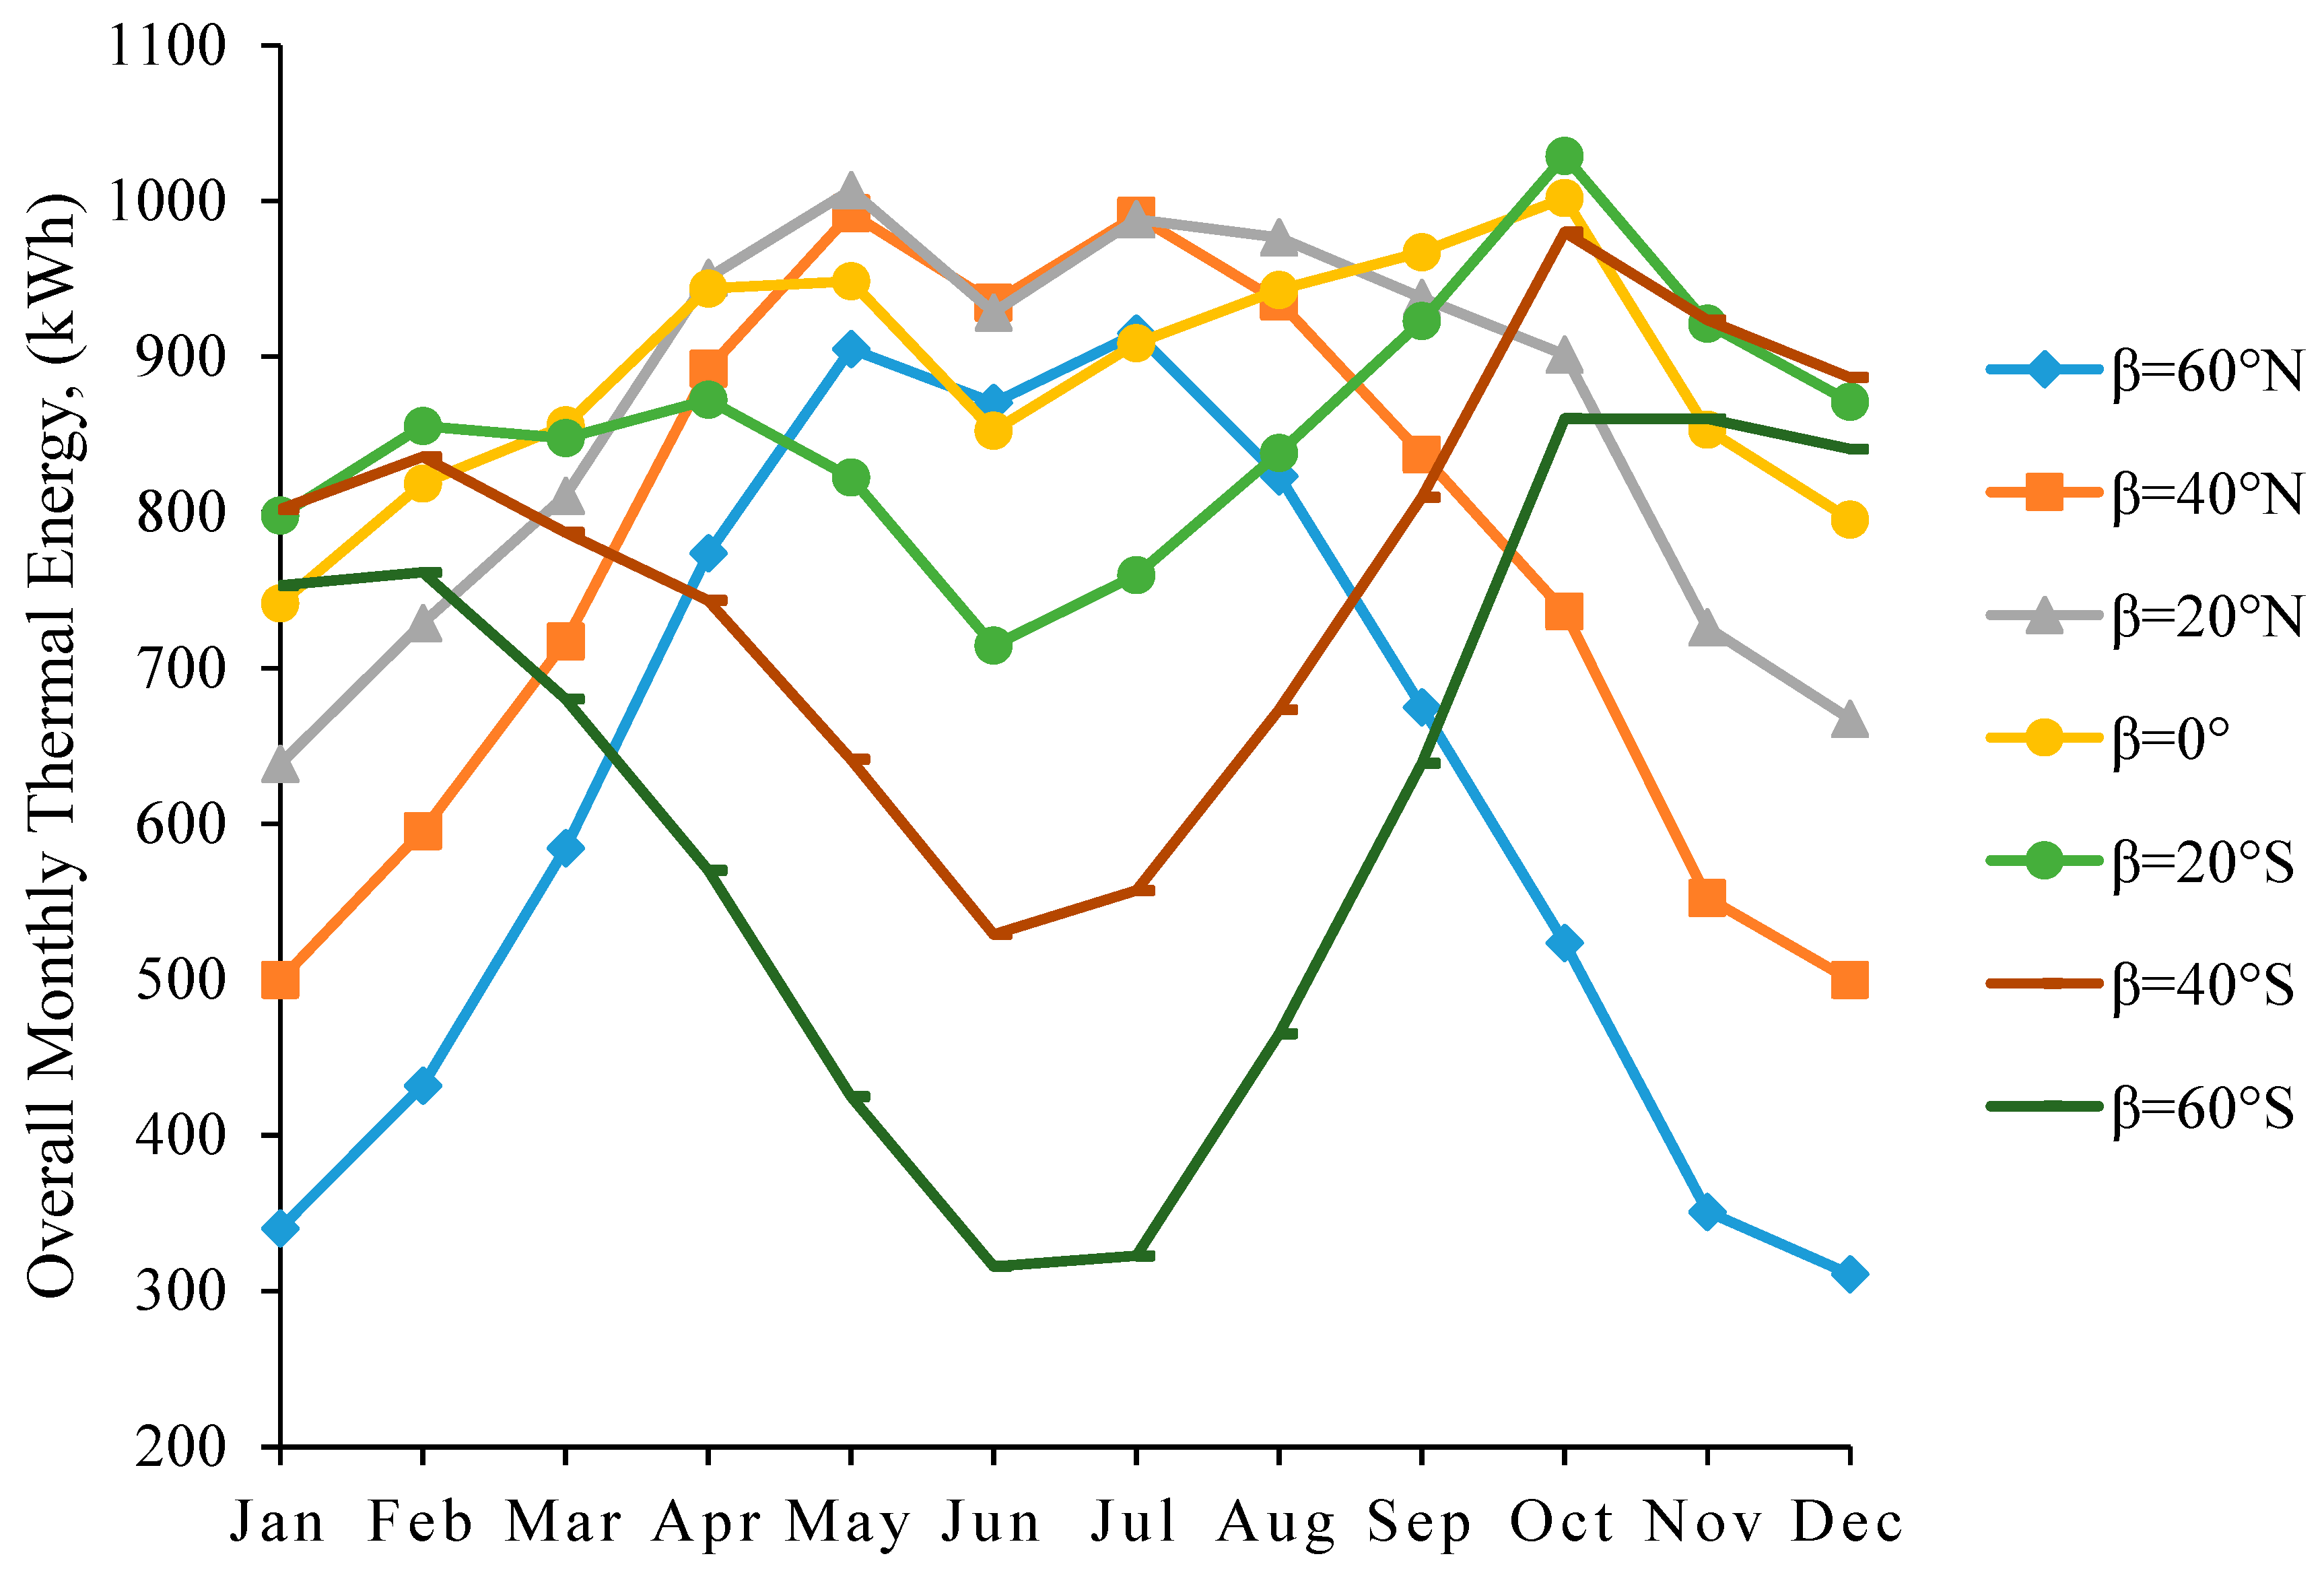
1.5.2. Thermal Energy

The overall thermal output of the PVT system can be obtained by adding the converted electrical output to the thermal gain of the systems. Therefore:
Q ˙ t h = E e l C f + Q ˙ u
where the expression of the thermal gain is given by:
Q ˙ u = n p n s m a i r C a i r [ T a i r ( x = d ) T a i r ( x = 0 ) ]

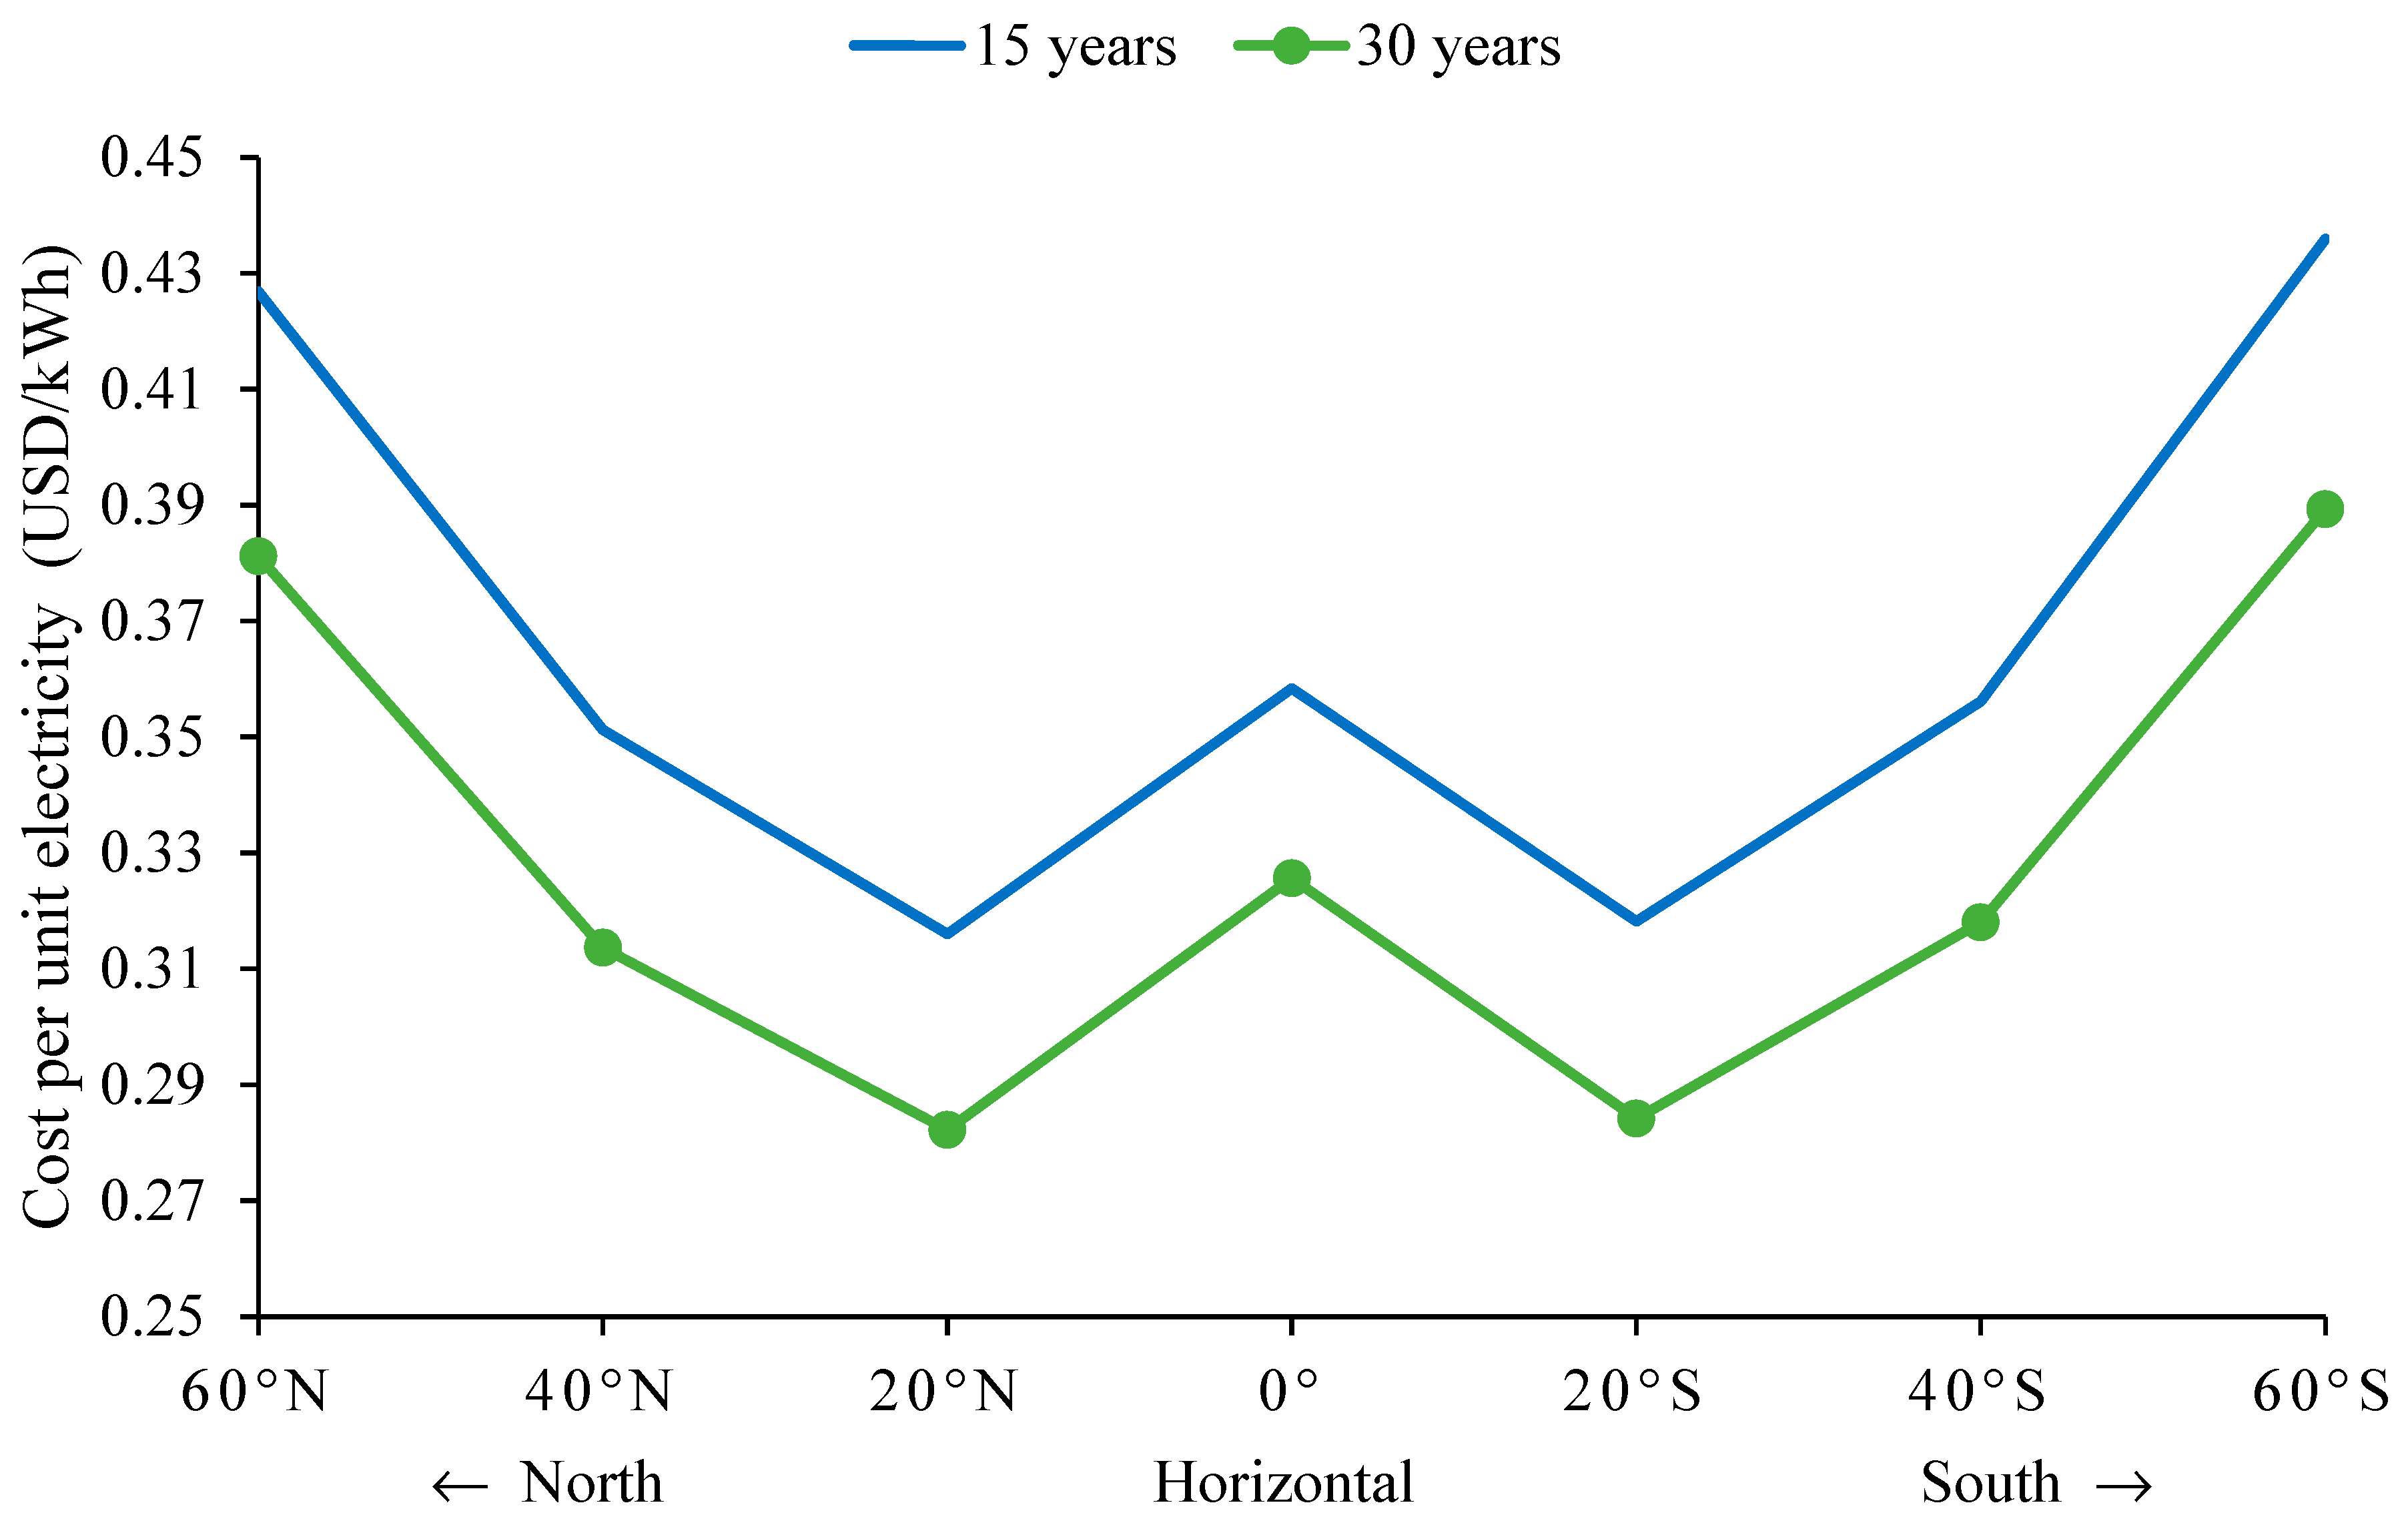
1.6. The Cost Per Unit of Electricity

The cost per unit electricity CUElec of the roof-integrated photovoltaic thermal system (PVT) can be evaluated as the ratio of the annualized uniform cost to the electrical energy consumed by the load. In terms of the present value, it can be expressed as:
C U E l e c = A U c os t E e l
where the annualized uniform cost AUcost can be given as:
A U c os t = L C C × i ( i + 1 ) n ( i + 1 ) n 1
and the expression of life cycle cost LCC is
L C C = P I + P M R + P R P S = P I + R [ ( i + 1 ) n 1 i ( i + 1 ) n ] + R 5 ( i + 1 ) 5 + R 10 ( i + 1 ) 10 + R 15 ( i + 1 ) 15 + + R n ( i + 1 ) n S ( i + 1 ) n
where R is the replacement cost and S is the salvage value of the system.

1.7. Problem Identification

In the present study, a photovoltaic thermal system integrated on the rooftop of a household in the city of Douala, Cameroon, SSA is under consideration. Figure 2a shows the pictorial view of the building with a PVT system covering an effective area of 4 × 2 m2. The city is situated at 4.051° N and 9.70° E having an elevation of 19 m above sea level. It has a tropical monsoonal climate with relatively consistent temperatures (23–27 °C) throughout the course of the year. The average annual relative humidity is 83% and experiences annual precipitation of around 3600 mm.
The solar cells are made up of monocrystalline technology and connected in series, making the installed capacity of the PV array 5 kWp. Toughened glass with a thickness of 0.0032 m, absorptivity of 0.1, and transmissivity of 0.85 is used at the top of the PV whereas Tedlar with a conductivity of 0.38 W/mK is used at the back of the PV, making an opaque type PVT system. A duct of depth 4 m is made below the Tedlar of the PV array. A 5V DC fan is used to flow the air through the duct at the rate of 1 kg/s. Figure 2b shows the cross-sectional view of the PVT system arrangement and Table 1 shows the detailed design parameters. The probability of adoption of such a PVT system by the household shall be higher because it replaces the construction of the traditional roof and thereby reduces the payback period, around 5 years when no incentives are provided by the government. The electrical output is higher than the traditional because of the lower temperature of the PV solar cells [9]. They have better resistance under tropical cyclones and do not easily topple or damage. The probability of theft is also reduced to a great extent. Neither the roof nor the PVT system has any tracking system. For ease of cleaning and higher exergy output through the PVT, an analysis is performed using the mathematical model when the PVT faces either north or south and its surface is inclined at an angle ranging from 0° to 60° from the horizontal.

2. Methodology

The solar radiation and weather data used in this study are collected from the SoDa Service [30]. Using the Copernicus Atmosphere Monitoring Service (CAMS) radiation, SoDa Services provides time series of Global, Direct, and Diffuse Irradiations on horizontal surfaces for geographical regions between −66° to 66° latitudes and longitudes. Data are available with a time step ranging from 15 min to 1 month.
I.
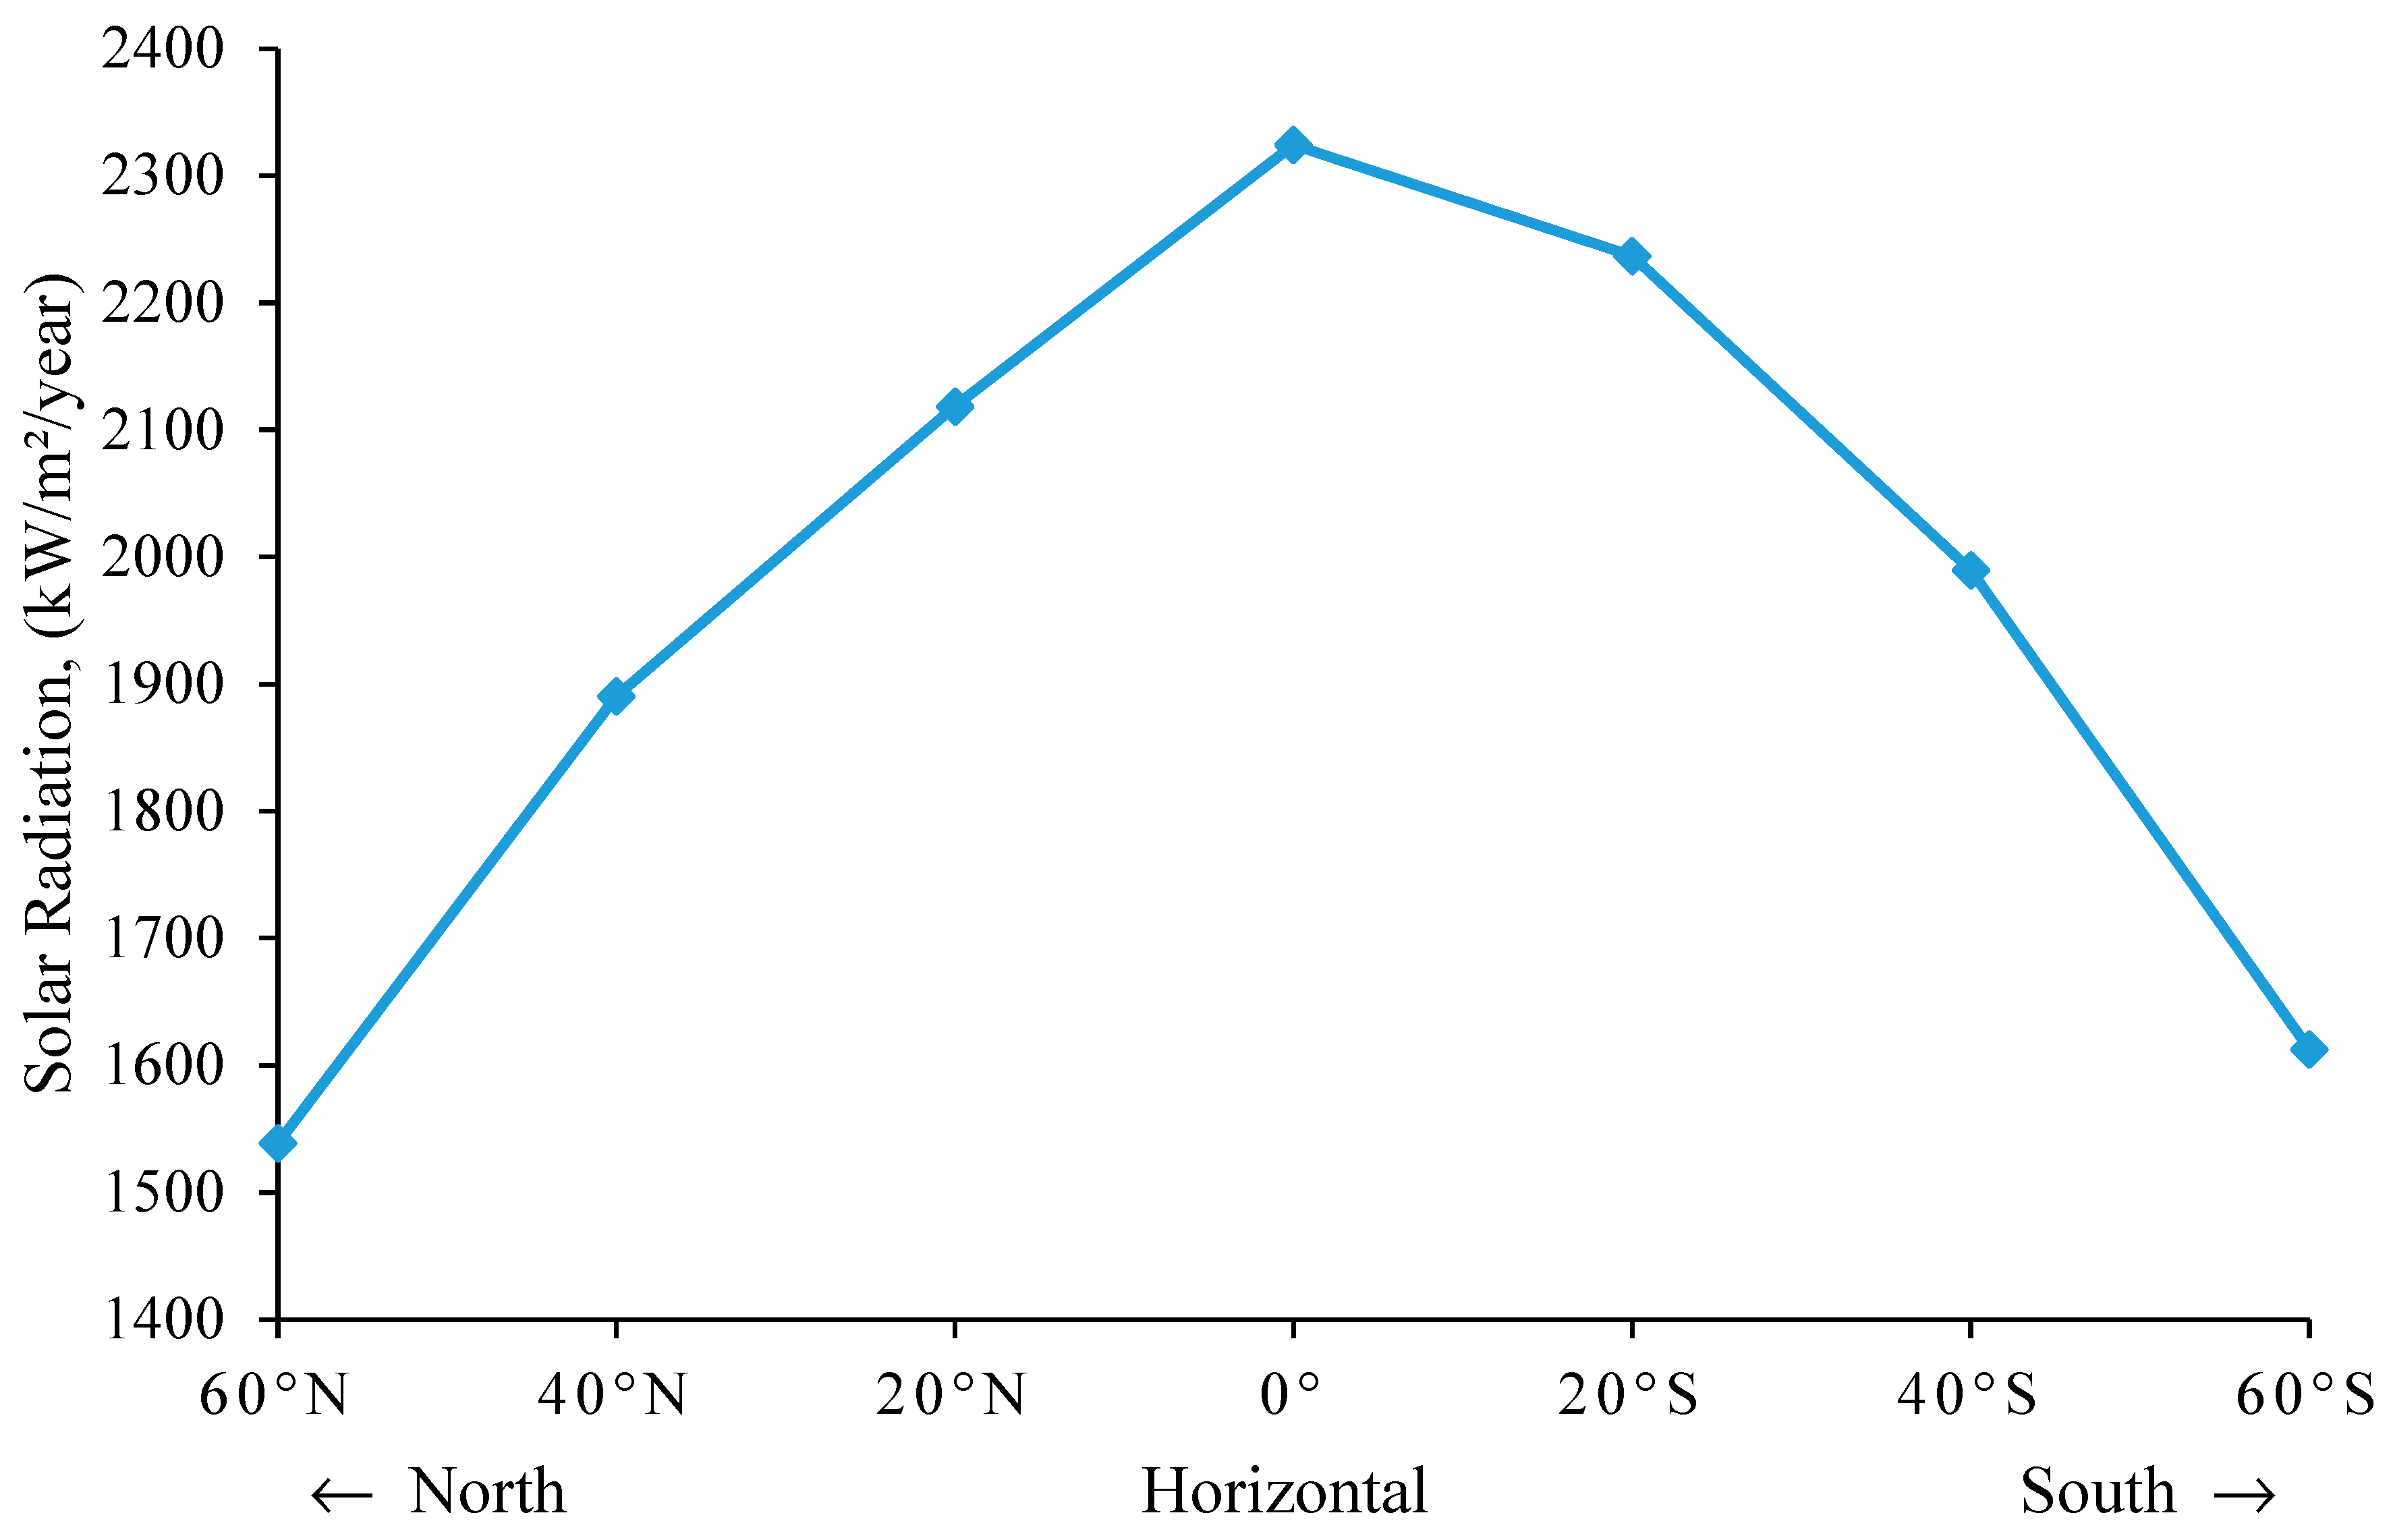
First, the availability of the solar intensity on the inclined surfaces of the PVT is determined using the Liu and Jordan formula given in Equation (5). The orientation of the PVT is either north or south and inclined at an angle of 0–60° from horizontal.
II.
The outlet air temperature of the air flowing at the back sheet of the PV module is calculated with Equation (15) replacing the x parameter with the length of the duct. Then the average temperature of the air flowing in the duct, the temperature of the back sheet of the PV module and the cell temperature of PV panels are calculated using, respectively, Equations (13) and (11).
III.
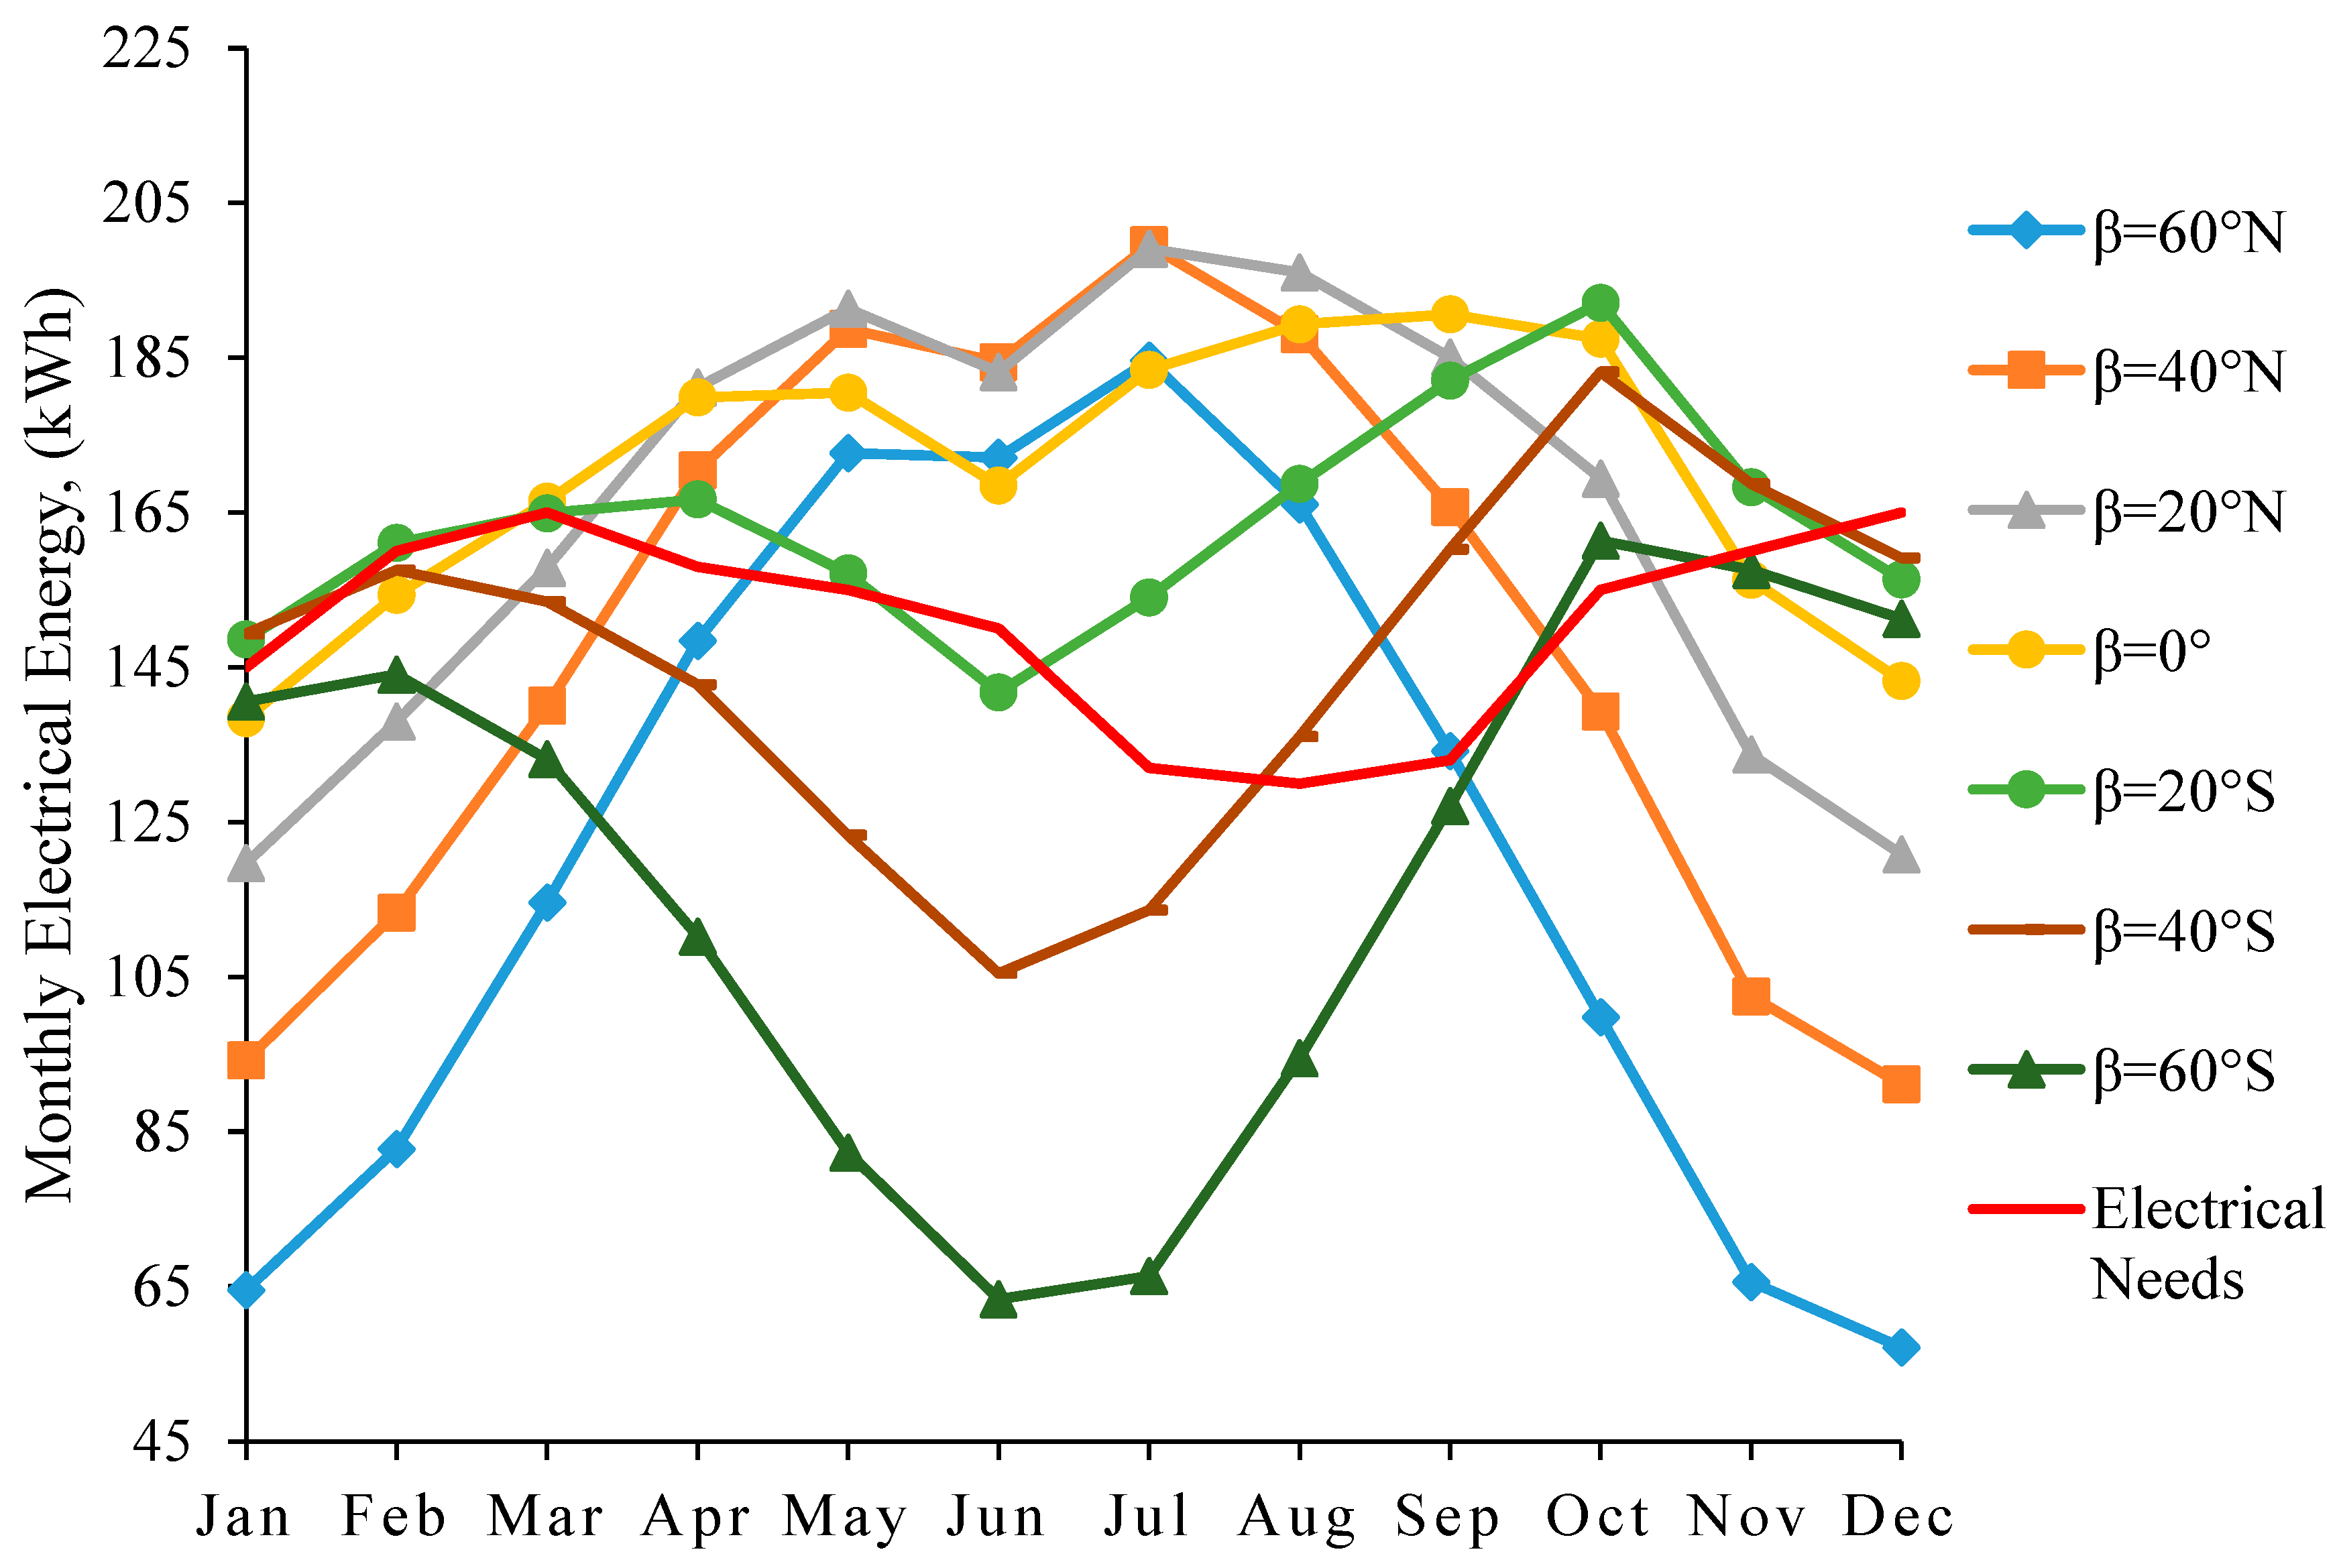
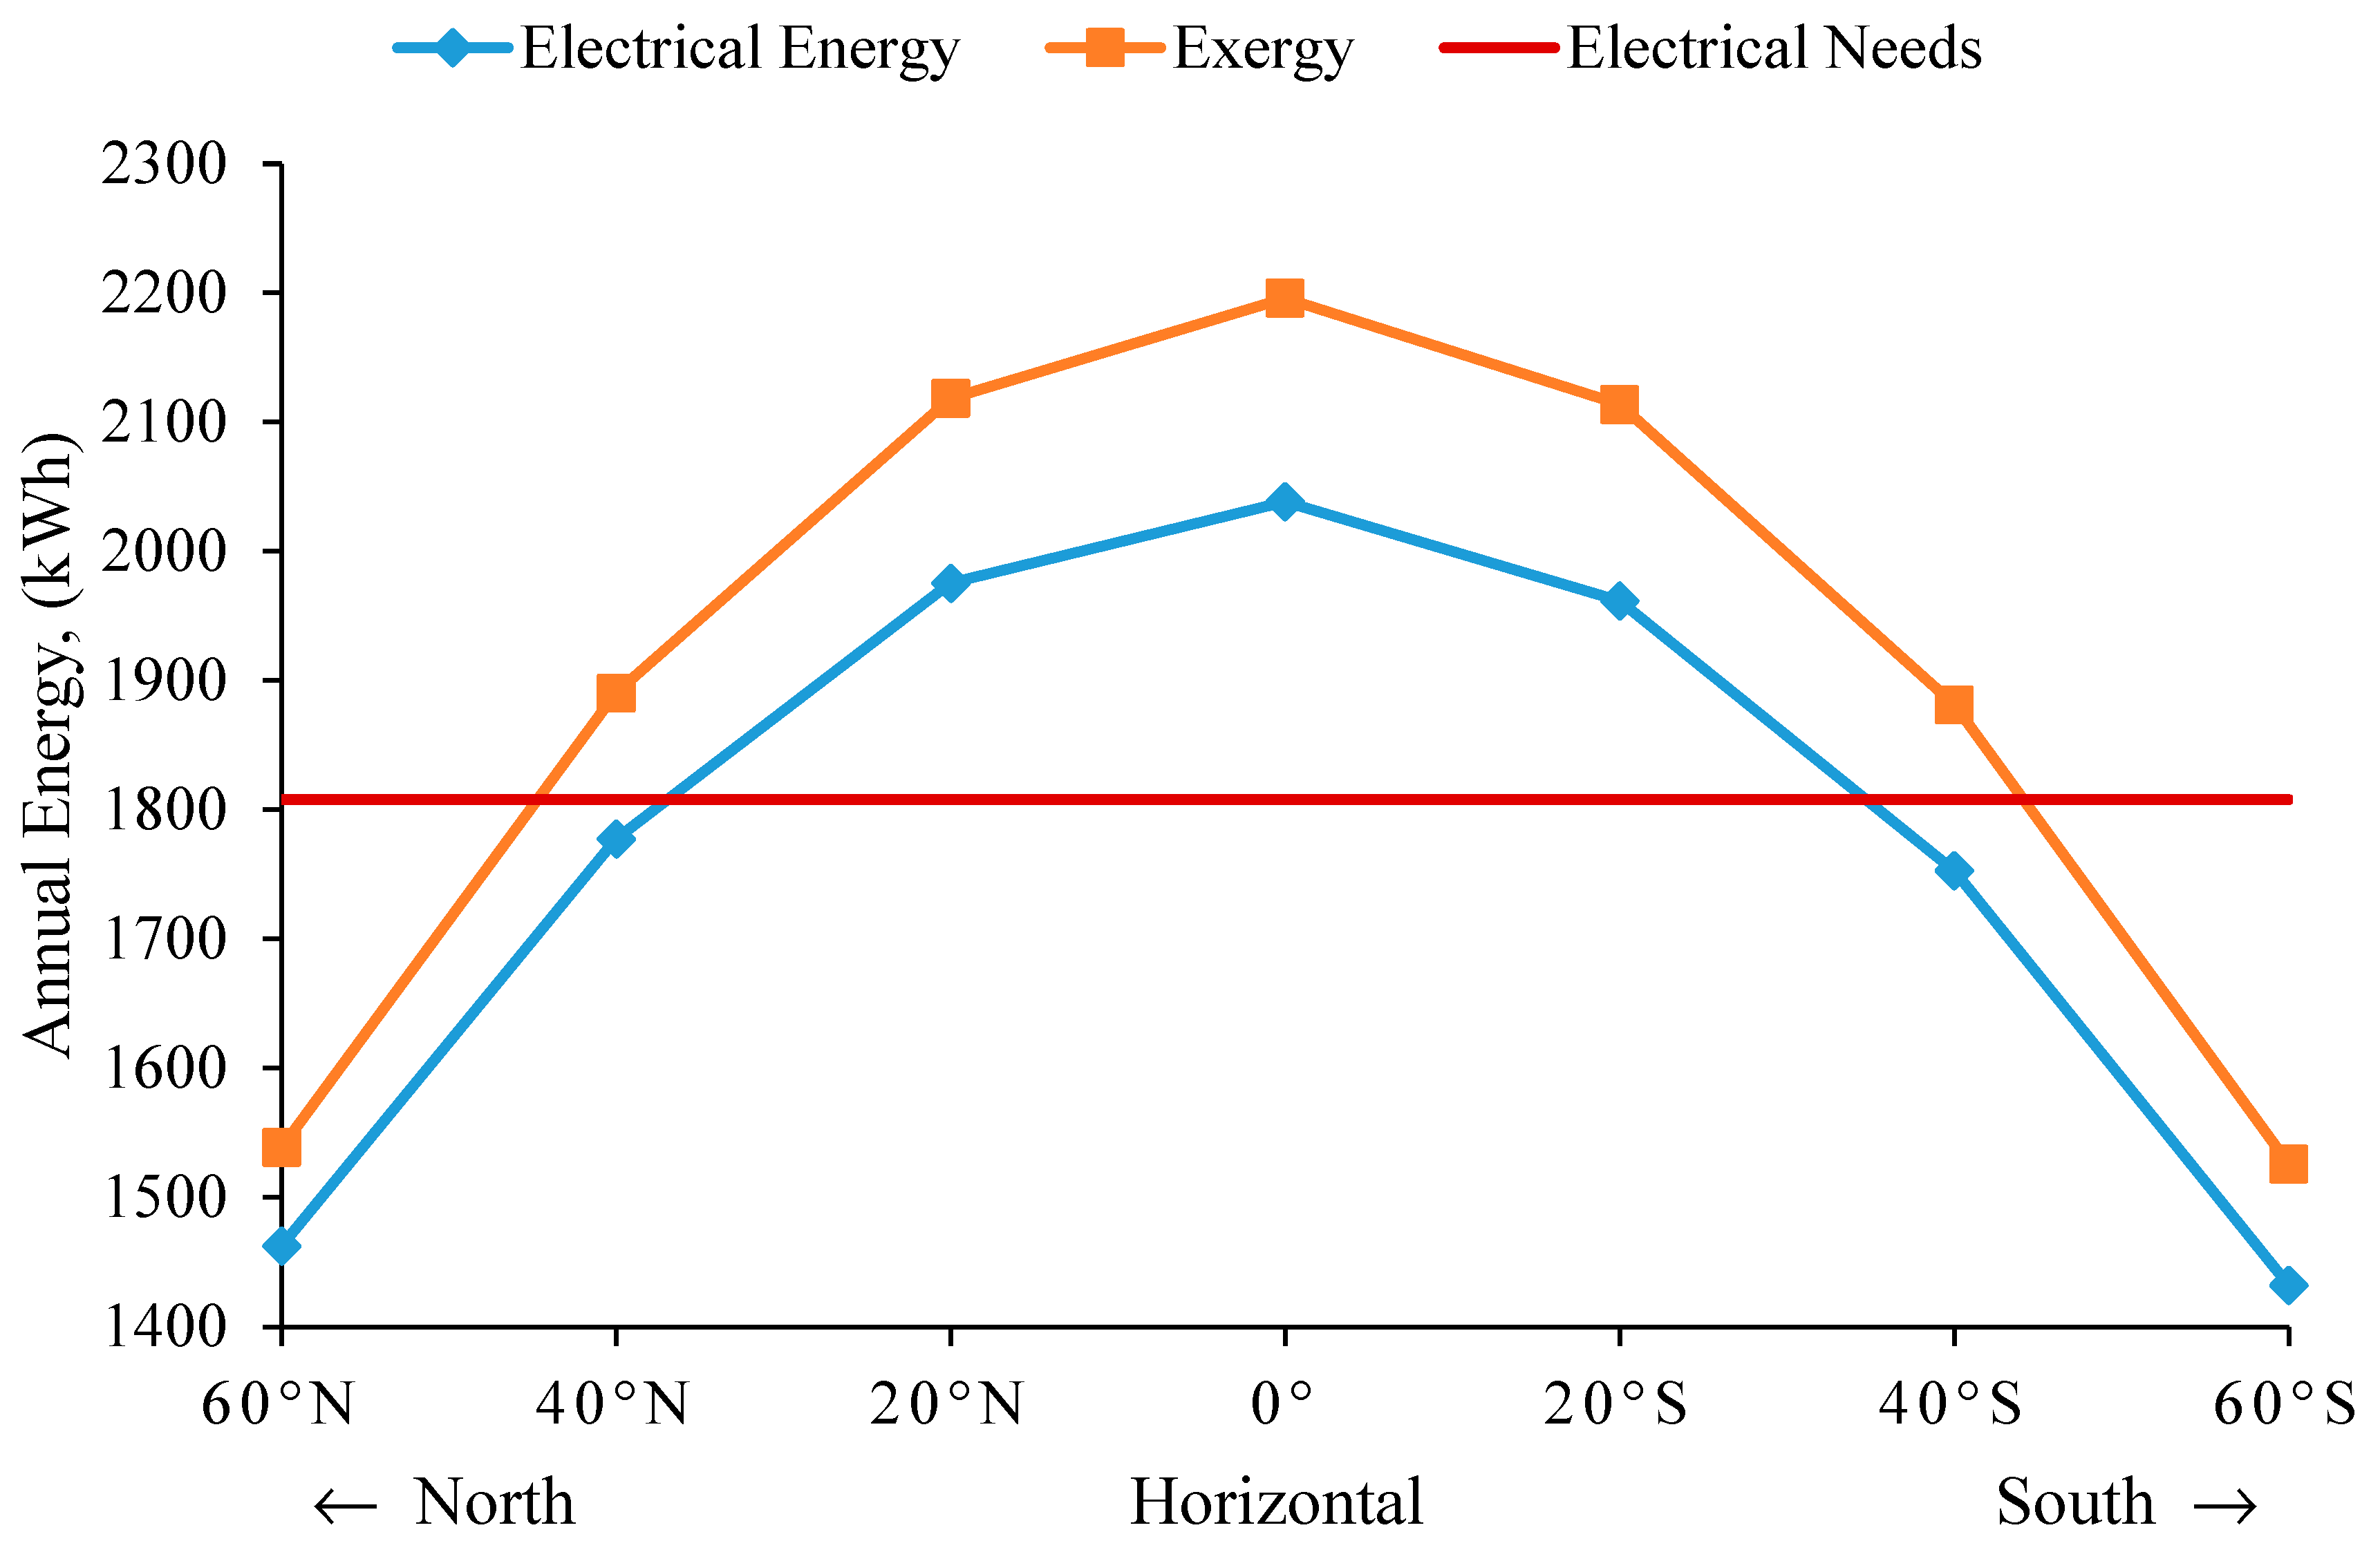
The electrical energy is calculated by substituting the solar cell efficiency given by Equation (17) in Equation (18) and the overall thermal output of the system is obtained using Equation (19) by replacing the thermal gain given by Equation (20).
IV.
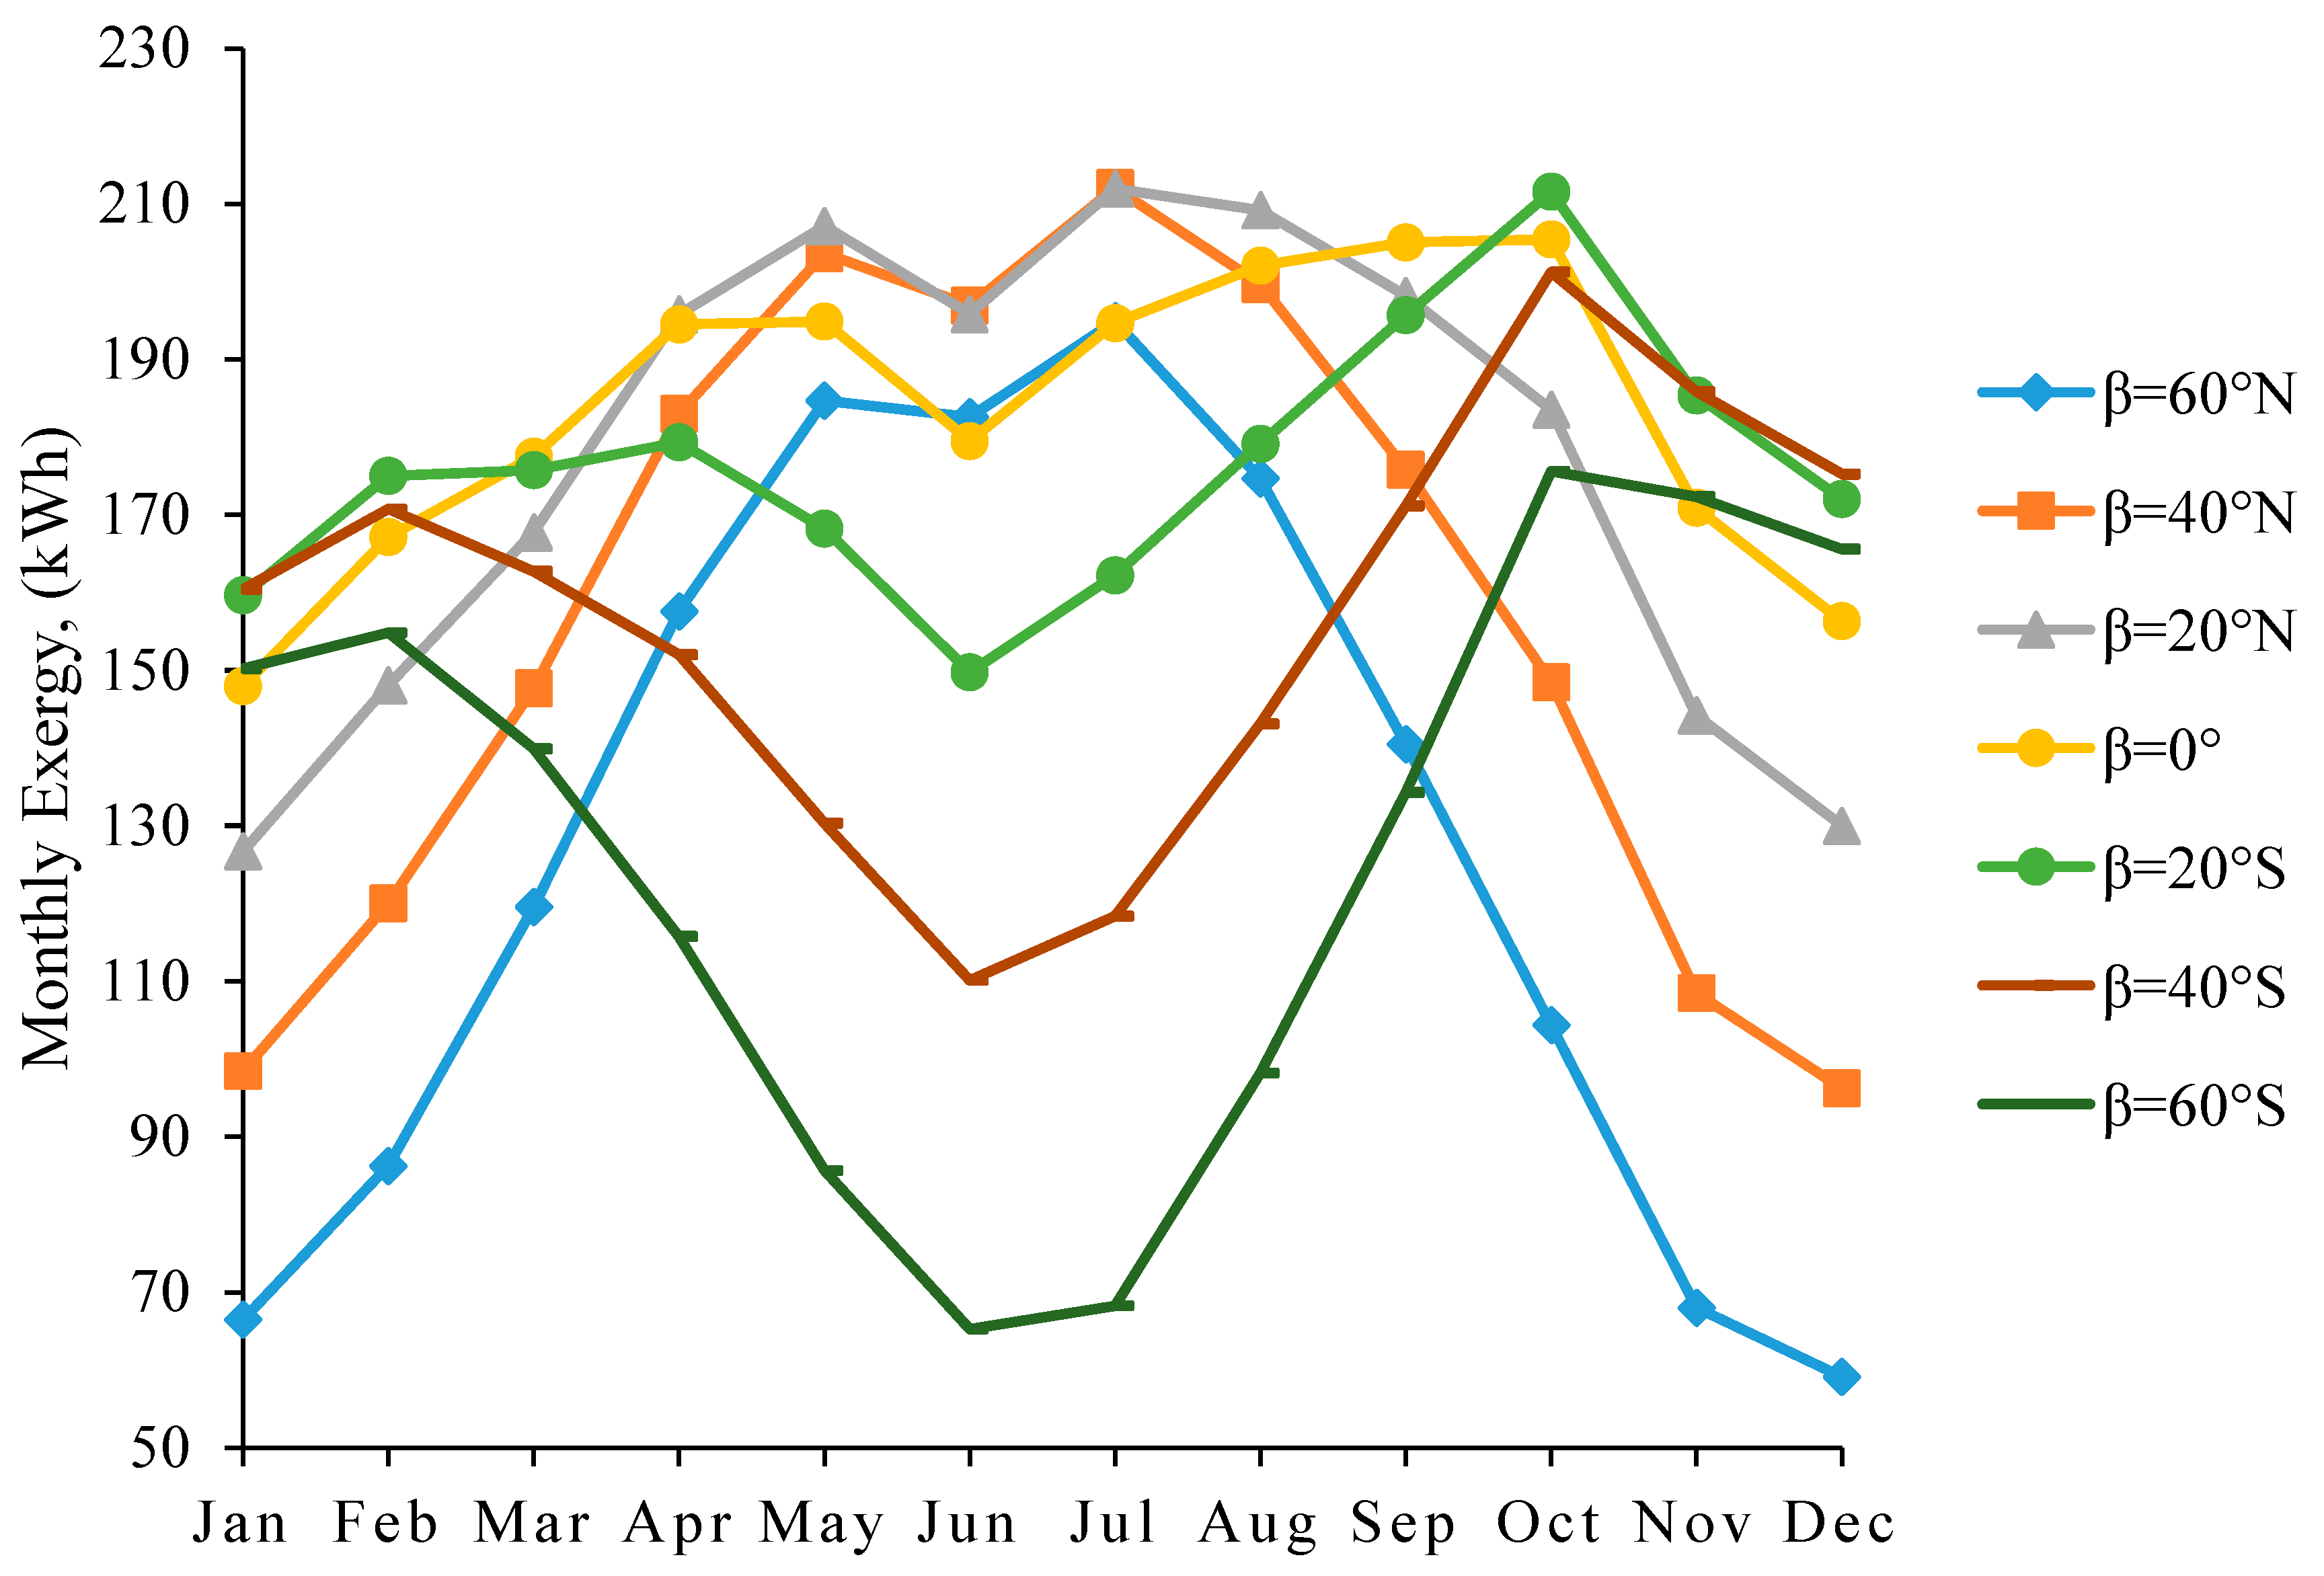
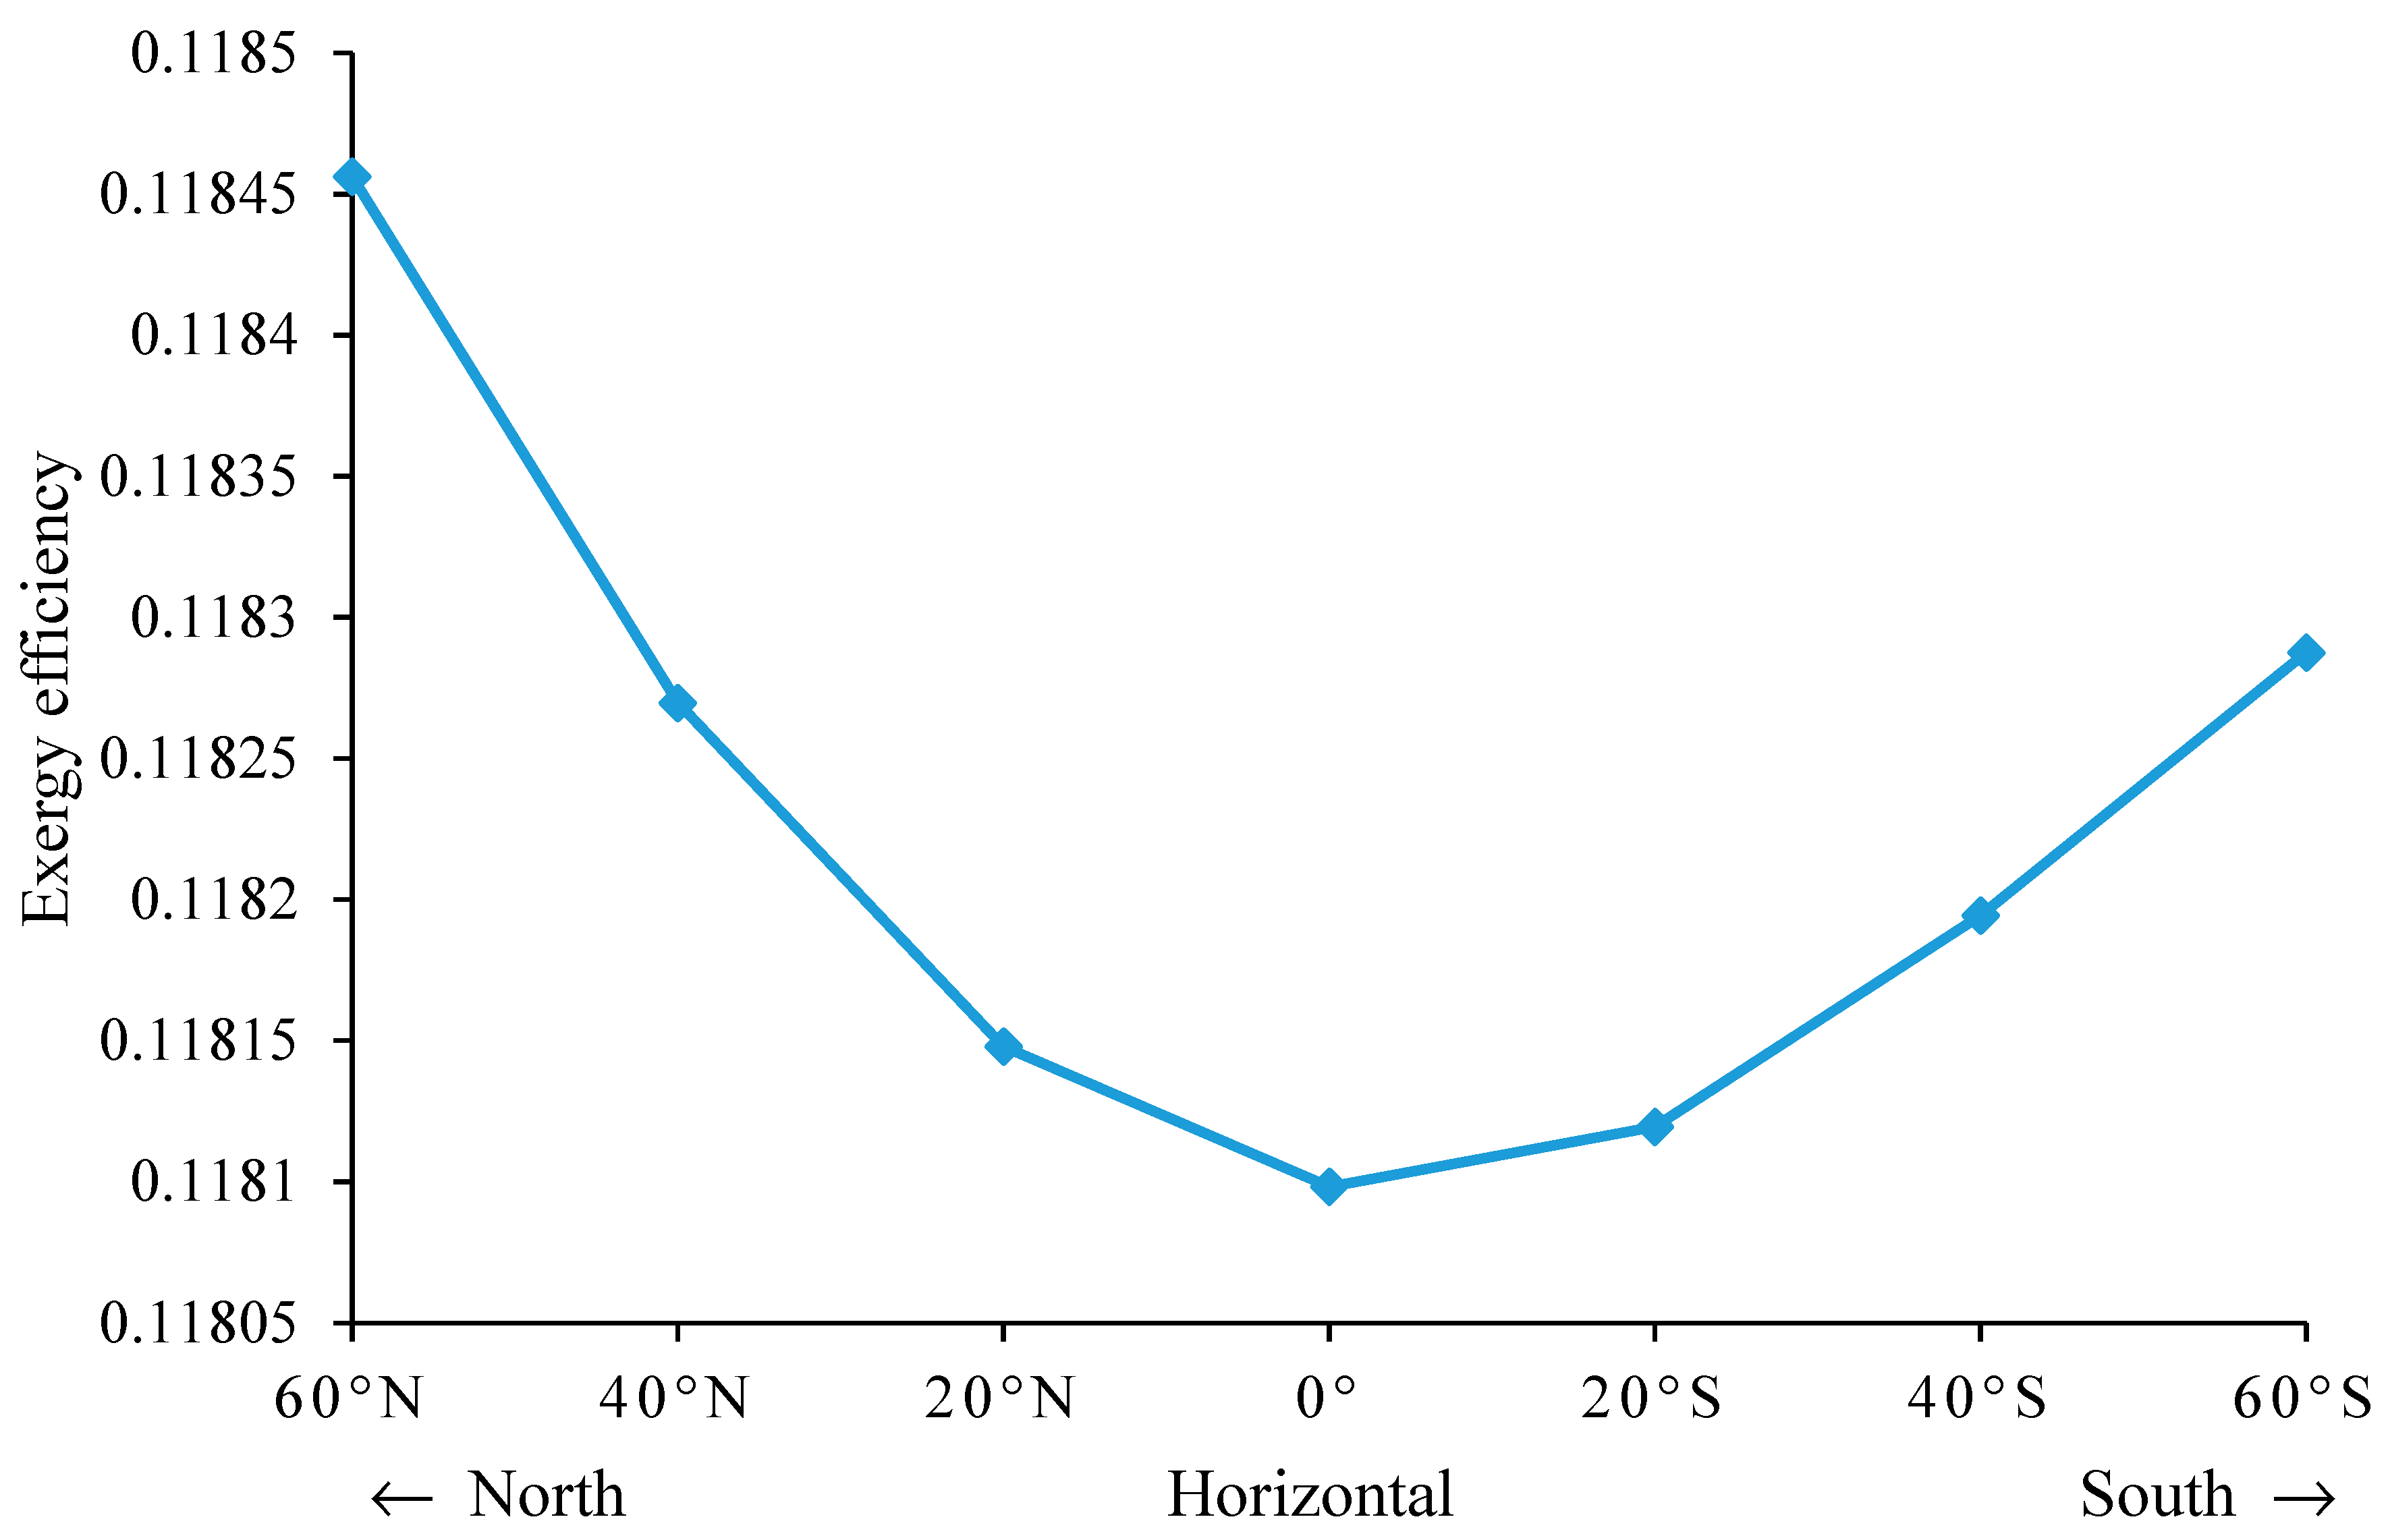
The net exergy gain and its efficiency are obtained, respectively, from Equations (7) and (8).

3. Results and Discussions

The amount of total solar radiation received by photovoltaic panels over the year for different tilt inclinations of the PV panel, between 60° from the horizontal toward the north orientation and 60° from the horizontal toward the south orientation is shown in Figure 3.
It is observed that the amount of solar radiation on the horizontal surface available for conversion into useful energy is 2324 kW/m2/year and is the maximum. The availability of radiation decrease from the angle of inclination of the surface in both north and south orientation, following a parabolic path which can be represented by a polynomial equation as:
I t ( β ) = 1.1205 β 5 20.161 β 4 + 126.23 β 3 396.57 β 2 + 915.64 β + 913.95
The amount of solar radiation available on the surface facing north orientation and inclined at an angle of 20°, 40° and 60° is 2118.36 kW/m2/year, 1890.43 kW/m2/year and 1538.82 kW/m2/year, respectively. Similarly, the amount of solar radiation available on the surface facing south orientation and inclined at an angle of 20°, 40° and 60° is 2236.77 kW/m2/year, 1989.63 kW/m2/year and 1612.55 kW/m2/year, respectively. Increasing the tilt inclination angle by 20° for the north and south orientation leads to an amount of solar radiation loss of 8.84% and 3.75%, respectively. At the inclination of 40° for the north and south orientation, the loss of the amount of annual solar radiation received is higher, respectively in the range of 18.66% and 14.38%. The loss is lower in the south orientation than that of the north orientation because the place under consideration is situated slightly in the northern hemisphere of the earth.
Figure 4 shows the variation of electrical energy output from the PVT system during a year for different inclinations and orientations (β) of the PVT surface. It is observed from this figure that the variation of electrical energy output with north orientation differs from south orientation at the same tilt inclination angle of the PV panel. Electrical energy increases for the north orientation and decreases for the south orientation and vice versa. This variation is more in the months of March to October. The maximum amount of monthly electrical energy is produced at the different tilt inclination angles for each month. The maximum monthly electrical energy of the PVT system is 199 kWh obtained at the tilt surface inclination angle of 20° in the month of July with north orientation. Over the year, the optimum monthly electrical output is required to cover the electrical needs of the house. Taking into account this parameter, the tilt inclination angle of the photovoltaic panel should be at 20° close to south for the month of January to February, 0° toward south for the month of March to April, 20° with north orientation for the month of May to August, 0° south oriented for the month of September, and 20° closed to south orientation for the month of October to December. The electrical consumption of the residential house is high in the summer season with a peak value of 165 kWh in the month of March. In tropical regions, the ambient temperature is high at this during this season and electrical energy is more required for cooling purposes. The PV panel tilt inclination angle between 0° and 20° south oriented is suitable for the optimisation of electrical output to cover the electrical needs over the year.
Figure 5 shows the variation of thermal energy output from the PVT system during a year for different inclinations and orientations of the PVT surface. It is observed that the variation of the overall thermal energy produced by the PVT system is the variation of electrical energy. This energy can be used in the months of November to December which is the cold season (winter) of the country. The overall thermal energy output of this period is 921.25 kWh and 871 kWh, respectively, and can raise the indoor air temperature of the residential home from 1.5 °C to 2 °C.
The variation of exergy output from the PVT system during a year for different inclinations and orientations of the PVT surface is shown in Figure 6. It is observed from this figure that the amount of net exergy produced by the PVT is largely a function of the angle at which the sun’s rays strike this surface at a constant mass flow rate of air flowing at the back sheet of the PV panel with a constant velocity. The optimum tilt inclination angle is different for each month. For the north and south orientations, the exergy production presents two maximums between January to June and June to December for each tilt inclination. The exergy efficiency of the PVT system over the year is presented in Figure 7. It is observed that the net exergy gain is produced with a marginal efficiency variation, from 11.81% to 11.84% over the year when the tilt inclination angle is increased which is south/north orientation.
The best view of the amount of net exergy gain of the PVT system can be obtained annually. Figure 8 shows the annual net exergy production. It is observed that the maximum production of the amount of annual exergy gain of the system is 2195.82 kWh/year obtained when the PV panel are at the horizontal plane followed by the tilt inclination angle of 20° with south/north orientation (1961 kWh /1975 kWh).
However, flat roofs where PV panels are integrated should produce more energy but should not be suitable in tropical regions where rainfall is fairly high during the rainy season and there is high air dust density in the dry season. The dust accumulation on photovoltaic panels is made up of 0.28% particles 10 μm in diameter to 0.13% particles 50 μm in diameter due to the gravity effect [31]. This can cause a major loss of PV performance in a range of 7% of efficiency loss per month and 12.46% of power loss after 21 days. The biggest disadvantage of the flat roof is its lack thereof water drainage compares to any kind of pitched roof. Therefore, water has a tendency to puddle and remain on the roof. This could lead to the roofing material breaking down or to eventual leaks. In addition, horizontal roof presents a lack of roofing material options. The majority of flat roofs are made up of materials such as rubber, ethylene propylene diene terpolymer (EPDM), thermoplastic polyolefin (TPO), or bitumen. Most of them are relatively inexpensive materials and easy to install; they have a limited lifespan of 10 to 15 years. The properly tilted roof offers a much longer lifespan than a flat roof, with materials that are more durable and weather resistant. The internal accommodation is more naturally efficiently insulated and does not suffer from the extremes of temperature that tend to afflict rooms under flat roofs.
In addition, the horizontal roof is more difficult to clean and requires more time and high labour for its cleanness depending on the area of the roof, the material construction used and the design of the roof. The cleaning time of a PV roof is around 12 h to 29 h according to the design of the system. The roof must be tilted in such a way as to allow maximum exergy production, easily cleanness and minimum wind effect. By increasing the tilt angle to 20°, the amount of average exergy loss is in the range of 3.8 kWh/year/degree for south and north orientation. The loss of average net exergy gain is more after 20° in the range of 7.7 kWh/year/degree for each orientation to 11.2 kWh/year/degree for a roof inclination of 60°.
The cost of cleaning solar panel on the roof depend on a number of factors, including where the system is installed, house height, roof slant, and what type of solar setup is installed. For a 2 kW solar PV system with 10 panels, it is expected to pay between USD 150–USD 350. Cleaning a 20-panel 3 kW solar system will cost on average, USD 500–USD 750. The cleaning cost of a solar roof per panel is around USD 15–USD 35. Some business companies charge a flat fee. In the sub-Saharan tropical region, rooftop solar panels can be cleaned every three months due to dust accumulation.
Figure 9 shows the cost per unit of electricity with tilt inclination angle. It is observed that the cost per unit of electricity between the tilt inclination angles from 0° to 20° with south/north orientation is USD 0.04 per kWh. The cost of electricity loss due to 20° tilt inclination angle can be compensated with the labour cost and work required for cleaning the PVT system of the horizontal roof.
For better exergy production of PV projects in the city of Douala, Cameroon, it is recommended to have tilt inclination angle of PV panels between 10° and 20° south oriented for better average energy production considering the energy needs taking into account the labour cost and work required for cleaning.

4. Conclusions

Solar energy, particularly photovoltaic energy is one of the most important renewable energy sources and can satisfy the world’s energy requirements. Photovoltaic solar panels are installed differently throughout the world based on their geographic locations. Panels need to be directed according to the position of the sun. The ideal situation is when the sun rays are hitting the panels at a perfectly perpendicular angle. In this paper, the roof-integrated photovoltaic thermal system (PVT) has been modelled on the climatic condition of the tropical SSA region, particularly in the region of Douala, Cameroon. The exergy analysis of the system with a variable tilted surface has been performed to predict the optimum tilted angle of the roof for solar energy residential projects, considering the minimum electrical need in the residential sector for domestic purposes. The study shows that the horizontal orientation of PV panels allows for obtaining the maximum electrical output to cover the electrical needs over the year. Taking into account the labour cost and work required for cleaning the PVT system because of the dust accumulation due to the tropical Saharan wind, the tilt inclination angle of PV panels between 10° and 20° facing south orientation is recommended for better amount of energy production of PV projects in the city of Douala, Cameroon. The cost of electricity loss due to the 20° tilt inclination angle facing the south orientation is compensated by the labour cost and work required for cleaning the PVT system of the horizontal roof.

Author Contributions

Investigation, A.M.; Methodology, A.-H.M.A.; Supervision, D.N.; Visualization, B.A.; Writing—original draft, A.M.E.A.A.; Writing—review and editing, A.M.E.A.A. All authors have read and agreed to the published version of the manuscript.

Funding

This research received no external funding.

Institutional Review Board Statement

Not applicable.

Informed Consent Statement

Not applicable.

Data Availability Statement

Not applicable.

Acknowledgments

The research was conducted and supported by the authors.

Conflicts of Interest

The authors declare no conflict of interest.

Nomenclature

AArea, (m2)
bLength of PVT system, (m)
CSpecific heat of air at constant pressure, (J/kg K)
CfThe conversion factor of the thermal power plant
dWidth of PVT system, (m)
EEnergy, (W)
hConvective heat transfer coefficient, (W/m2 K)
ISolar radiation, (W/m2)
mAir mass flow rate in duct, (kg/s)
NSunshine hour
nNumber of the day/Number of PV module
QThermal energy, (W)
TTemperature, (°C)
UOverall heat transfer coefficient, (W/m2 K)
vAir speed in the duck, (m/s)
xHorizontal axis, (m)
Greek symbols
αAbsorptivity
τTransmissivity
γAzimuth angle, (°)
βTilted angle, (°)/Packing factor
ωsSunrise/Sunset hour angle, (°)
ɸLatitude angle, (°)
θiAngle of incidence, (°)
θzZenith angle, (°)
δDaclination angle, (°)
ρReflection coefficient of the ground
ηEfficiency
λThermal conductivity, (W/m2K)
Subscripts
aAmbient air
airAir flowing in the duct
bBeam
bsBack sheet of PV module
cCell
dDiffuse
elElectrical
exExergy
gGlass
pParallel
rReflected
refReference
PVTRoof Integrated Photovoltaic System Thermal
SSeries
tTotal
thThermal
uNet useful

Appendix A

U c , g = λ g e g U c , a = ( λ g e g + 1 h a ) 1 U c , b s = ( λ b s e b s ) 1 ( τ e ) e f f = τ g [ α c β c + α T ( 1 β c ) η c α c β c ] F = h a i r b m ˙ a i r C a i r [ 1 h a i r ( U c , b s + h a i r ) U c , b s 2 U c , a + U c , b s ] G = h a i r b m ˙ a i r C a i r U c , b s [ ( τ e ) e f f I t ( β ) + U c , a T a ] ( U c , b s + h a i r ) ( U c , a + U c , b s ) U c , b s 2

References

  1. Bakilana, A. 7 Facts about Population in Sub-Saharan Africa. Available online: https://blogs.worldbank.org/africacan/7-facts-about-population-in-sub-saharan-africa (accessed on 24 March 2021).
  2. Avila, N.; Carvallo, J.P.; Shaw, B.; Kammen, D.M. The Energy Challenge in Sub-Saharan Africa: A Guide for Advocates and Policy Makers. Part 1: Generating Energy for Sustainable and Equitable Development. 2017. Available online: https://www.oxfamamerica.org/static/media/files/oxfam-RAEL-energySSA-pt1.pdf (accessed on 1 September 2022).
  3. Detollenaere, A.; Masson, G.; Liesen, A.; Wedepohl, D. Africa Market Report; German Solar Association (BSW-Solar): Berlin, Germany; Becquerel Institute: Brussels, Belgium, 2020. [Google Scholar]
  4. Mukisa, N.; Zamora, R. Optimal tilt angle for solar photovoltaic modules on pitched rooftops: A case of low latitude equatorial region. Sustain. Energy Technol. Assess. 2022, 50, 101821. [Google Scholar] [CrossRef]
  5. Hartner, M.; Ortner, A.; Hiesl, A.; Haas, R. East to west—The optimal tilt angle and orientation of photovoltaic panels from an electricity system perspective. Appl. Energy 2015, 160, 94–107. [Google Scholar] [CrossRef]
  6. Zheng, H.; Outline, C. Solar Energy Desalination Technology, 1st ed.; Elsevier Ltd: Amsterdam, The Netherlands, 2017. [Google Scholar] [CrossRef]
  7. Corrada, P.; Bell, J.; Guan, L.; Motta, N. Optimizing Solar Collector Tilt Angle to Improve Energy Harvesting in a Solar Cooling System. Energy Procedia 2014, 48, 806–812. [Google Scholar] [CrossRef]
  8. Haghdadi, N.; Copper, J.; Bruce, A.; MacGill, I. A method to estimate the location and orientation of distributed photovoltaic systems from their generation output data. Renew. Energy 2017, 108, 390–400. [Google Scholar] [CrossRef]
  9. Agrawal, B.; Tiwari, G.N. Building Integrated Photovoltaic Thermal Systems for Sustainable Developments, 1st ed.; The Royal Society of Chemistry: London, UK, 2011. [Google Scholar]
  10. Elhassan, Z.A.M.; Zain, M.F.M.; Sopian, K.; Awadalla, A. Output Energy of Photovoltaic Module Directed at Optimum Slope Angle in Kuala Lumpur, Malaysia. Res. J. Appl. Sci. 2011, 6, 104–109. [Google Scholar] [CrossRef]
  11. Bojić, M.; Bigot, D.; Miranville, F.; Parvedy-Patou, A.; Radulović, J. Optimizing performances of photovoltaics in Reunion Island-tilt angle. Prog. Photovolt. Res. Appl. 2012, 20, 923–935. [Google Scholar] [CrossRef]
  12. Siraki, A.G.; Pillay, P. Study of optimum tilt angles for solar panels in different latitudes for urban applications. Sol. Energy 2012, 86, 1920–1928. [Google Scholar] [CrossRef]
  13. Lehloka, M.C.; Swart, A.J.; Hertzog, P.E. Validating the optimum tilt angle for PV modules in the Highveld of South Africa for the Summer season, 3C Tecnología. Glosas de innovación aplicadas a la pyme. Edición Espec. 2020, 137–157. [Google Scholar] [CrossRef]
  14. Kokouvi, E.N. Effect of orientation and tilt angles of solar collectors on their performance: Analysis of the relevance of general recommendations in the West and Central African context. Sci. Afr. 2022, 15, 2276–2468. [Google Scholar] [CrossRef]
  15. Ashetehe, A.A.; Gessesse, B.B.; Shewarega, F. Development of Optimal Tilt Angle Models of a Photovoltaic Module for Maximum Power Production: Ethiopia. Int. J. Photoenergy 2022, 2022, 8729570. [Google Scholar] [CrossRef]
  16. Obiwulu, A.U.; Erusiafe, N.; Olopade, M.A.; Nwokolo, S.C. Modeling and estimation of the optimal tilt angle, maximum incident solar radiation, and global radiation index of the photovoltaic system. Heliyon 2022, 8, e09598. [Google Scholar] [CrossRef]
  17. Duffie, J.A.; Beckman, W.A. Solar Engineering of Thermal Processes, 4th ed.; John Wiley & Sons, Inc.: Hoboken, NJ, USA, 2013. [Google Scholar]
  18. Mulcué-Nieto, L.F.; Mora-López, L. Methodology to establish the permitted maximum losses due to shading and orientation in photovoltaic applications in buildings. Appl. Energy 2015, 137, 37–45. [Google Scholar] [CrossRef]
  19. Jakhrani, A.Q.; Othman, A.; Rigit, A.R.H.; Samo, S.R.; Ahmed, S. Estimation of Incident Solar Radiation on Tilted Surface by Different Empirical Models. Int. J. Sci. Res. Publ. 2012, 2, 15–20. [Google Scholar]
  20. Lubitz, W.D. Effect of manual tilt adjustments on incident irradiance on fixed and tracking solar panels. Appl. Energy 2011, 88, 1710–1719. [Google Scholar] [CrossRef]
  21. Grubbström, R.W. An attempt to introduce dynamics into generalised exergy considerations. Appl. Energy 2007, 84, 701–718. [Google Scholar] [CrossRef]
  22. Vats, K.; Tiwari, G. Performance evaluation of a building integrated semitransparent photovoltaic thermal system for roof and façade. Energy Build. 2012, 45, 211–218. [Google Scholar] [CrossRef]
  23. Vats, K.; Tiwari, G. Energy and exergy analysis of a building integrated semitransparent photovoltaic thermal (BISPVT) system. Appl. Energy 2012, 96, 409–416. [Google Scholar] [CrossRef]
  24. Yildiz, A.; Güngör, A. Energy and exergy analyses of space heating in buildings. Appl. Energy 2009, 86, 1939–1948. [Google Scholar] [CrossRef]
  25. Razmara, M.; Maasoumy, M.; Shahbakhti, M.; Robinett, R. Optimal exergy control of building HVAC system. Appl. Energy 2015, 156, 555–565. [Google Scholar] [CrossRef]
  26. Gholampour, M.; Ameri, M. Energy and exergy analyses of Photovoltaic/Thermal flat transpired collectors: Experimental and theoretical study. Appl. Energy 2016, 164, 837–856. [Google Scholar] [CrossRef]
  27. Friesenhan, C.; Agirre, I.; Eltrop, L.; Arias, P.L. Streamlined life cycle analysis for assessing energy and exergy performance as well as impact on the climate for landfill gas utilization technologies. Appl. Energy 2017, 185, 805–813. [Google Scholar] [CrossRef]
  28. Agrawal, B.; Tiwari, G. Optimizing the energy and exergy of building integrated photovoltaic thermal (BIPVT) systems under cold climatic conditions. Appl. Energy 2010, 87, 417–426. [Google Scholar] [CrossRef]
  29. Akata, A.M.; Njomo, D.; Agrawal, B. Assessment of Building Integrated Photovoltaic (BIPV) for sustainable energy performance in tropical regions of Cameroon. Renew. Sustain. Energy Rev. 2017, 80, 1138–1152. [Google Scholar] [CrossRef]
  30. Solar Radiation Service, Solar Energy Services for Professionals. 2017. Available online: http://www.soda-pro.com/ (accessed on 13 May 2020).
  31. Lu, H.; Lu, L.; Wang, Y. Numerical investigation of dust pollution on a solar photovoltaic (PV) system mounted on an isolated building. Appl. Energy 2016, 180, 27–36. [Google Scholar] [CrossRef]
Figure 1. Cross-sectional view of PVT system.
Sustainability 14 15591 g001
Figure 2. Pictorial view of a residential building with PVT system: (a) pictorial view, (b) cross-sectional view of nomenclature.
Sustainability 14 15591 g002
Figure 3. Variation of total solar radiation on an inclined surface with the inclination of PV panels.
Sustainability 14 15591 g003
Figure 4. Monthly electrical energy output of PVT system.
Sustainability 14 15591 g004
Figure 5. Monthly overall thermal energy output of PVT system.
Sustainability 14 15591 g005
Figure 6. Monthly net exergy gain over the year.
Sustainability 14 15591 g006
Figure 7. Exergy efficiency over the year.
Sustainability 14 15591 g007
Figure 8. Annual energy output of PVT system.
Sustainability 14 15591 g008
Figure 9. Variation of annual cost per unit electricity with tilt inclination angle.
Sustainability 14 15591 g009
Table 1. Design parameters of PVT system.
ParametersValueParametersValue
αc0.7B2 m
αT0.7Cair1005 J/kgK
βc0.9Cf0.38
ηc0.16ebs0.003 m
ηref0.12eg0.0032 m
ɸref0.0045λbs0.38 W/m2K
ρg0.4λg0.8 W/m2K
τg0.85mair1 kg/s
D4 mvair4 m/s
Publisher’s Note: MDPI stays neutral with regard to jurisdictional claims in published maps and institutional affiliations.

