
High-Resolution Regional Climate Modeling and Projection of Heatwave Events over the Yangtze River Basin


State Key Laboratory of Earth Surface Processes and Resource Ecology, Faculty of Geographical Science, Beijing Normal University, Beijing 100875, China
*
Author to whom correspondence should be addressed.
Sustainability 2022, 14(3), 1141; https://0-doi-org.brum.beds.ac.uk/10.3390/su14031141
Submission received: 28 December 2021
/
Revised: 14 January 2022
/
Accepted: 17 January 2022
/
Published: 20 January 2022
(This article belongs to the Special Issue Sustainability with Changing Climate and Extremes)
Abstract
:Heatwave events (HWEs) have strong impacts on human health, ecosystems, and sustainable social development. Using a gridded observation dataset and a high-resolution regional climate model (RCM), this study analyzed the characteristics of HWEs over the Yangtze River Basin (YRB) in eastern China during the historical period and projected the changes in HWEs over the YRB in the future. The daily maximum temperature (Tmax), long-lived (≥6 days) HWEs, and total (≥3 days) HWEs in the YRB all showed an obvious upward trend from 1981 to 2018, while the increase in short-lived (≥3 days and <6 days) HWEs was relatively moderate overall. The RCM of the Weather Research and Forecasting (WRF) model can simulate the characteristics of Tmax and HWEs in the historical period very well, and the projection results showed that Tmax, total HWEs, and long-lived HWEs will all increase obviously in both the SSP245 and SSP585 scenarios. Short-lived HWEs will also increase rapidly under SSP585, but they will rise slowly overall under SSP245. The changes in HWEs had distinct regional differences, and the intensity and coverage area of HWEs were greater under SSP585 overall. In the future, the increase in HWEs over the YRB region is likely to be associated with the enhancement of the western-Pacific subtropical high (WPSH) and South-Asian high (SAH), and this enhancement was also greater under SSP585. The results from the high-resolution simulation of the RCM can provide an important reference for disaster prevention and mitigation in the future.
1. Introduction
The Intergovernmental Panel on Climate Change (IPCC) in its 6th Assessment Report (AR6) reported that the global mean surface temperature in the first two decades of the 21st century (2001–2020) was 0.99 °C higher than in 1850–1900 [1]. Under the background of global warming, the occurrence of extreme weather and climate events, such as heatwave events (HWE), have increased significantly, which has led to a large impact on the social economy, natural ecosystems, and human health [2,3,4,5]. For example, during summer 2003, long-lasting HWEs occurred in Europe, which resulted in more than 4000 deaths in 18 countries and an estimated USD 13 billion in property damage [6,7]. Unusually, HWEs also persisted in the Yangtze River Basin (YRB) of eastern China during summer 2013, resulting in persistent drought that affected over nine provinces with a population of more than half a billion [5,8]. More importantly, the results of a number of numerical simulations suggest that HWEs in eastern China will still increase significantly in the future in the context of global warming [5,9,10].
Reliable weather and climate forecasts of HWEs are essential for risk mitigation and early-warning systems [11]. Most global climate models (GCMs), with resolutions from 100 km to 200 km, are generally good in capturing large-scale circulation [12,13,14], but they are not efficient enough to represent the fine-scale processes of the atmosphere, as well as the terrain and land-use distribution, which makes it difficult to accurately characterize regional HWEs [15,16,17,18]. Regional climate models (RCMs), with refined grid spacing and solid-model physics, can address the abovementioned problems associated with GCMs very well [19,20,21]. Several studies have indicated that RCMs are believed to provide more added value in their simulations with respect to GCMs [22,23,24,25]. Based on the above facts, it is important and meaningful to use RCMs to study the mechanisms and variation of HWEs in a certain area [26,27,28].
The YRB is one of the core regions for the occurrence of HWEs in China [29]. A large number of studies have focused on how HWEs in this region are generated from the perspective of large-scale circulation anomalies [29,30], variability in the sea-surface temperature (SST) [31], and anomalous boundary characteristics in observational diagnostics [32]. Li, Xiao, and Zhao [30] suggested that the occurrence of HWEs is strongly associated with the joint effects of the western-Pacific subtropical high (WPSH) and the South-Asian high (SAH). In addition, Teng and Branstator [33] pointed out that the East-Asian jet stream (EAJS) can act as a waveguide to adjust the intensity and position of the WPSH through quasi-zonal teleconnections, which further influence the HWEs in the YRB region. It is also indicated that the strong SST anomaly over the mid-North Atlantic connects to the WPSH and East-Asian upper-level westerlies via the teleconnection wave train and can further contribute to the variability of HWEs over the YRB region [34]. However, previous studies on HWEs over the YRB region have mostly focused on large-scale circulation characteristics and have lacked descriptions of small-scale information, such as the spatial distribution of HWEs and their regional differences in future climate scenarios. Considering the large population, rich production, and large economic volume in the YRB, it is necessary to conduct a high-resolution simulation study of HWEs in this region to provide a reference for sustainable development, disaster prevention, and early warning systems. Therefore, in this study, we attempted to answer three key questions: (1) What are the temporal and spatial characteristics of HWEs in the YRB during the historical period? (2) Do high-resolution RCMs have the ability to simulate the characteristics of HWEs very well? (3) How will HWEs change in the future?
The rest of the article is structured as follows. The following section describes the data, methods, and experimental design for the simulation of HWEs over the YRB region. Section 3 presents the analytical results. Finally, the discussion and conclusion are presented in Section 4 and Section 5, respectively.
2. Materials and Methods
2.1. Model and Experimental Design
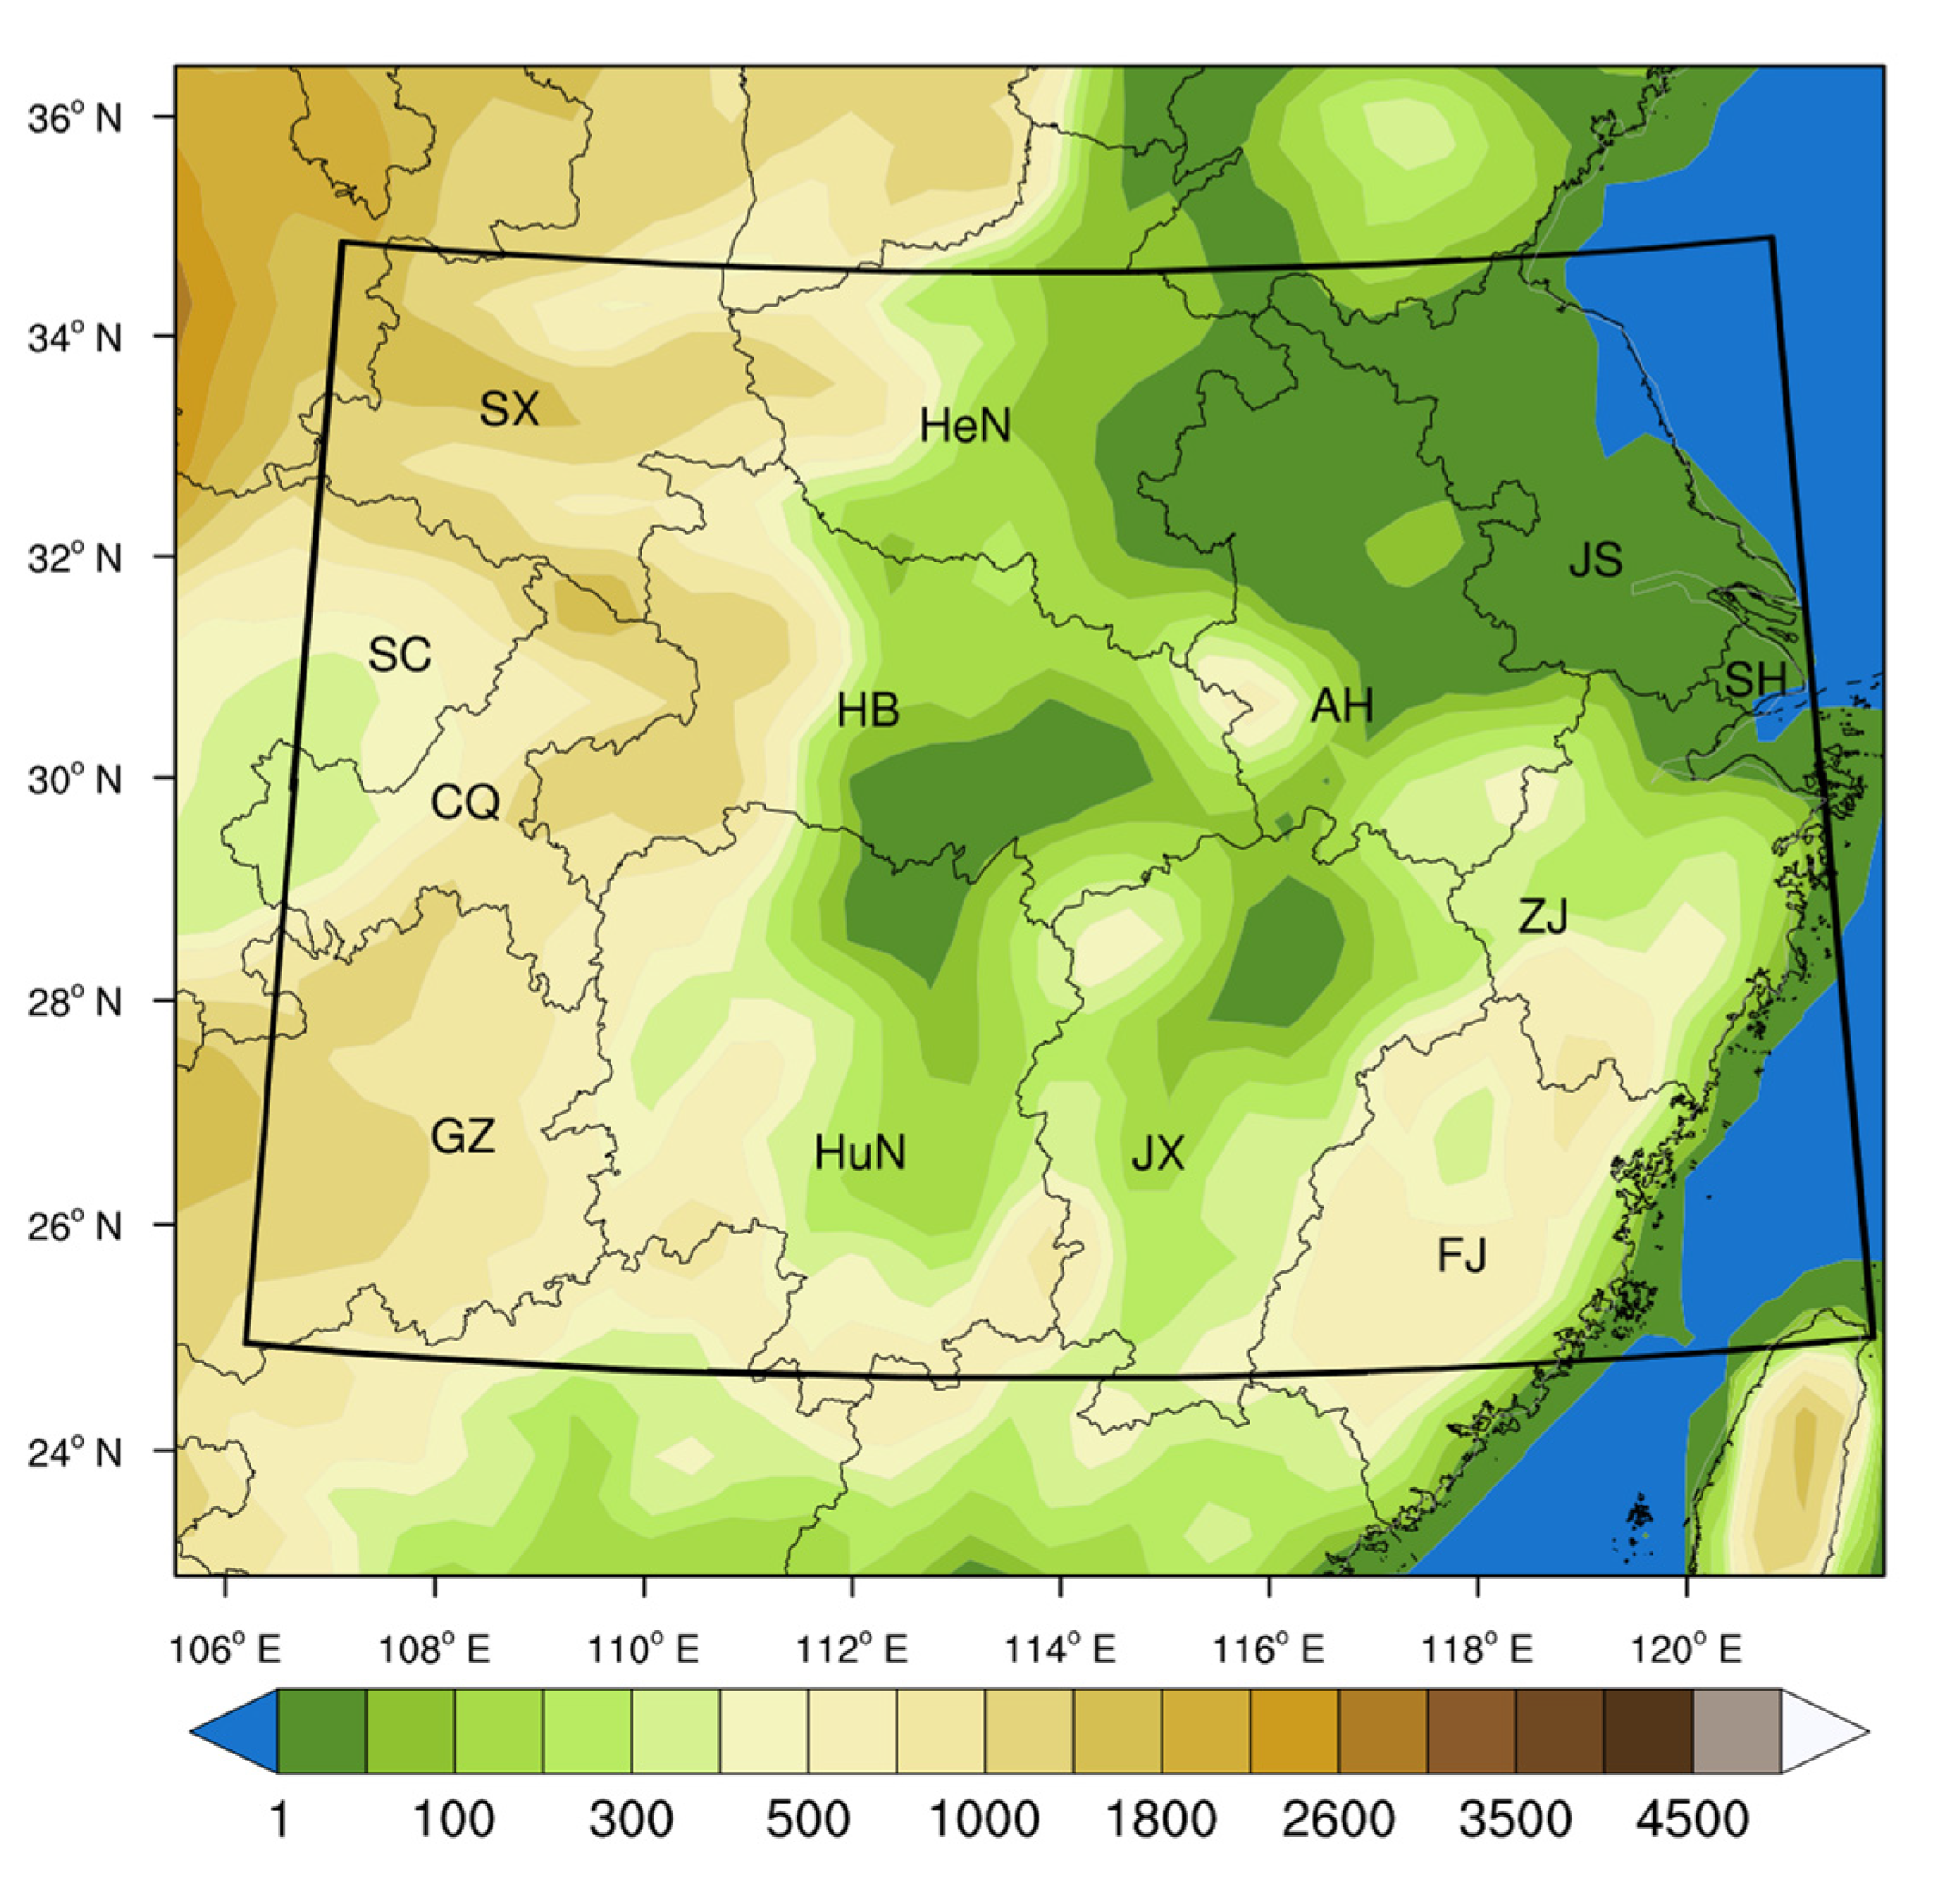
The Weather Research and Forecasting (WRF) model version 4.0 [35] was employed in this study. The simulation domain is centered at 30° N, 113.70° E, with a horizontal resolution of 40 km, which is more refined than the first phase of the Coordinated Regional Climate Downscaling Experiment (CORDEX-I). Figure 1 shows the simulation domain and the terrain height within it, and the domain covers all of the YRB region.
Most existing literature has used a particular GCM as the initial conditions and boundary conditions (ICs and BCs) for the RCM, which causes the simulation results of the RCM to have a large uncertainty because dynamic downscaling simulations are often degraded by biases in large-scale forcing [36]. Based on this, a bias-corrected GCM dataset [36] based on 18 models from the Coupled Model Intercomparison Project Phase 6 (CMIP6) was used as the ICs and BCs to drive the WRF model in this study. Previous studies have showed that this dataset is of better quality than individual CMIP6 models [36]. The simulation was divided into two periods. One is the reference period from 1995 to 2014, and the selection of this period was recommended by CMIP6. The other is the future period from 2015 to 2054. The simulation in the future period includes two scenarios: SSP245 and SSP585. SSP245 represents a moderate socioeconomic-development path with medium-low radiation forcing, while SSP585 represents the combined scenario of a high energy-intensive, socioeconomic developmental path with strong radiative forcing. The model starts to integrate one year in advance, and the first year of simulation was used as a spin-up time and was not involved in the analysis.
2.2. Definition of HWEs
For the definition of HWE, the China Meteorological Administration (CMA) usually defines HWE as a daily maximum surface air temperature at 2 m (Tmax) greater than 35 °C and a duration of more than three days [41,42]. Based on this, in this study, if the Tmax at a certain grid point meets the above conditions, it is considered that a HWE has occurred at that grid point. Furthermore, for the entire YRB region, if the number of grid points that meet the above conditions exceeds one-eighth of the total number of grid points, it is considered that the entire YRB region experienced a HWE. If a HWE occurs, HWDs are the total participating days of the HWE. Similar definition methods have also been used in previous studies on regional HWEs [30,41]. Furthermore, to distinguish HWEs of different intensities, we defined HWEs with a duration of 3–5 days as short-lived HWEs and HWEs with a duration of more than 5 days as long-lived HWEs.
2.3. Gridded Observation Dataset
A set of gridded observations, CN05.1 (CN051) [43], were used to analyze the characteristics of historical HWEs in the YRB and to verify the reliability of WRF for the simulation of HWEs in this region. This dataset was produced by the National Climate Center of CMA from over 2400 weather stations in China and has been widely used as a reference for the validation of models [44,45]. It provides Tmax, daily minimum and mean surface air temperature at 2 m, and daily total precipitation from 1961 to 2018. Previous studies have indicated that the Tmax over the YRB region exhibits an obvious shift at approximately 1980 and then increased significantly [46]. Therefore, in terms of historical periods, this study mainly focused on the characteristics of HWEs from 1981 to 2018.
2.4. Methods
2.4.1. Regression Analysis
In order to explore the linear trends of Tmax and HWEs, linear regression was carried out. It has been a common method to determine the long-term linear trend of a certain meteorological variable [47,48]:
where and are the variables for years and , respectively. The represents the linear trend of the variable. A positive (negative) value indicates an increasing (decreasing) trend of the variable.
In addition, linear regression was also used to study the relationship between geopotential height () and HWEs ():
where represents the regression coefficient (RC) and is the intercept. A positive RC indicates that as the predictor variable increases, the response variable also increases and vice versa. The absolute value of RC can indicate the relationship strength. The larger the number, the stronger the relationship. The results of the linear regression were tested for significance using the t-test at the 90% confidence level.
2.4.2. Evaluation of the Model Performance
The correlation coefficient (R) was used to indicate the strength and direction of the relationship between the WRF model () and observation () during the 1995–2014 reference period:
where represents the number of years, and and are the mean values of and , respectively. The value of R ranges from −1 to 1, and the − and + signs indicate negative and positive linear correlations, respectively. When the R value is positive, a larger absolute R value indicates that the model is closer to the observation. Significance levels of the R are estimated according to the two-tailed Student t-test.
3. Results
3.1. Characteristics of HWEs in the Historical Period
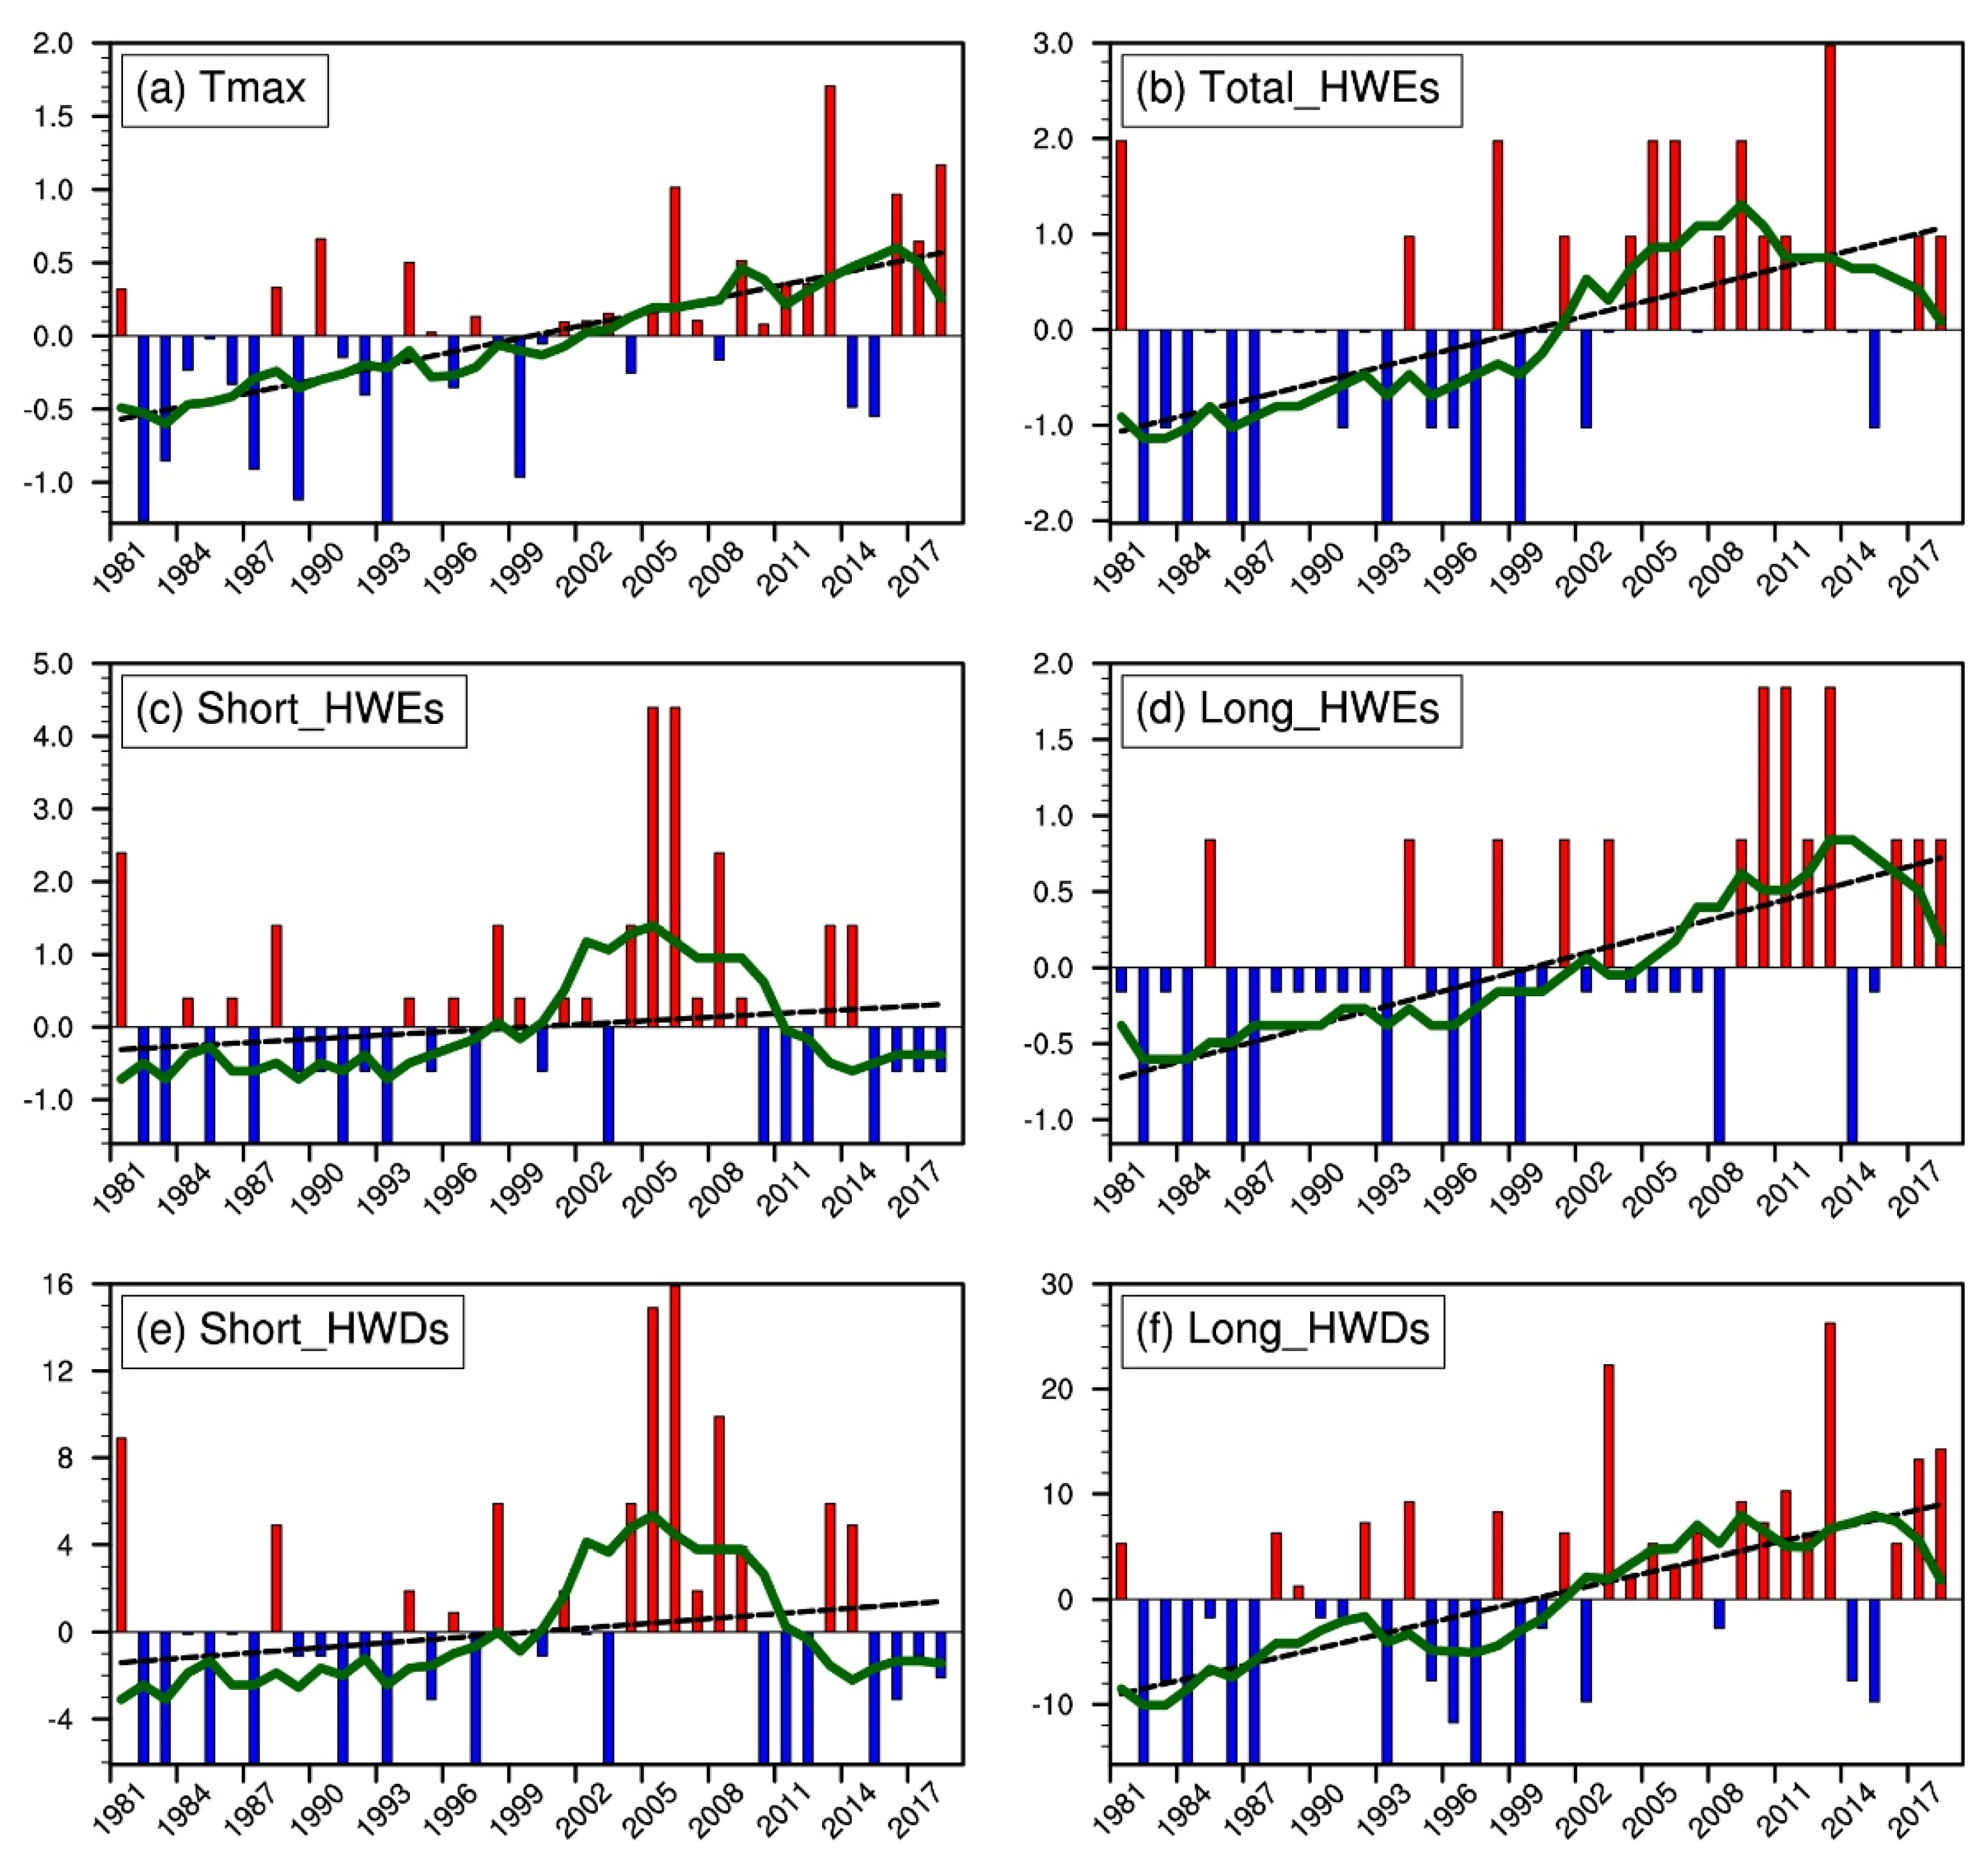
Because Tmax is an essential indicator for HWEs, we first gave attention to its changes. The summer mean Tmax over the YRB increased slowly, and it exhibited an obvious interdecadal shift at approximately 2000, which became a positive anomaly (Figure 2a). Correspondingly, the total number of HWEs also showed a slow rise and shifts in 2000 (Figure 2b). It is also worth mentioning that the YRB experienced persistent HWEs in 2013, and the Tmax of many weather stations set a new record. Interestingly, although the total number of HWEs is increasing; the short-lived HWEs have not risen so much, except for more occurrences in approximately 2005; and there was no obvious upward trend in other years (Figure 2c). However, it should be mentioned that the number of long-lived HWEs increased obviously during the study period, which is the main reason for the increase in the total number of HWEs (Figure 2d). Similar characteristics can be found for the variation in HWDs between the two classes of HWEs (Figure 2e,f). Therefore, HWEs with long durations were the main type of HWEs from 1981 to 2018, and they dominated the increase in total HWEs in the YRB region.
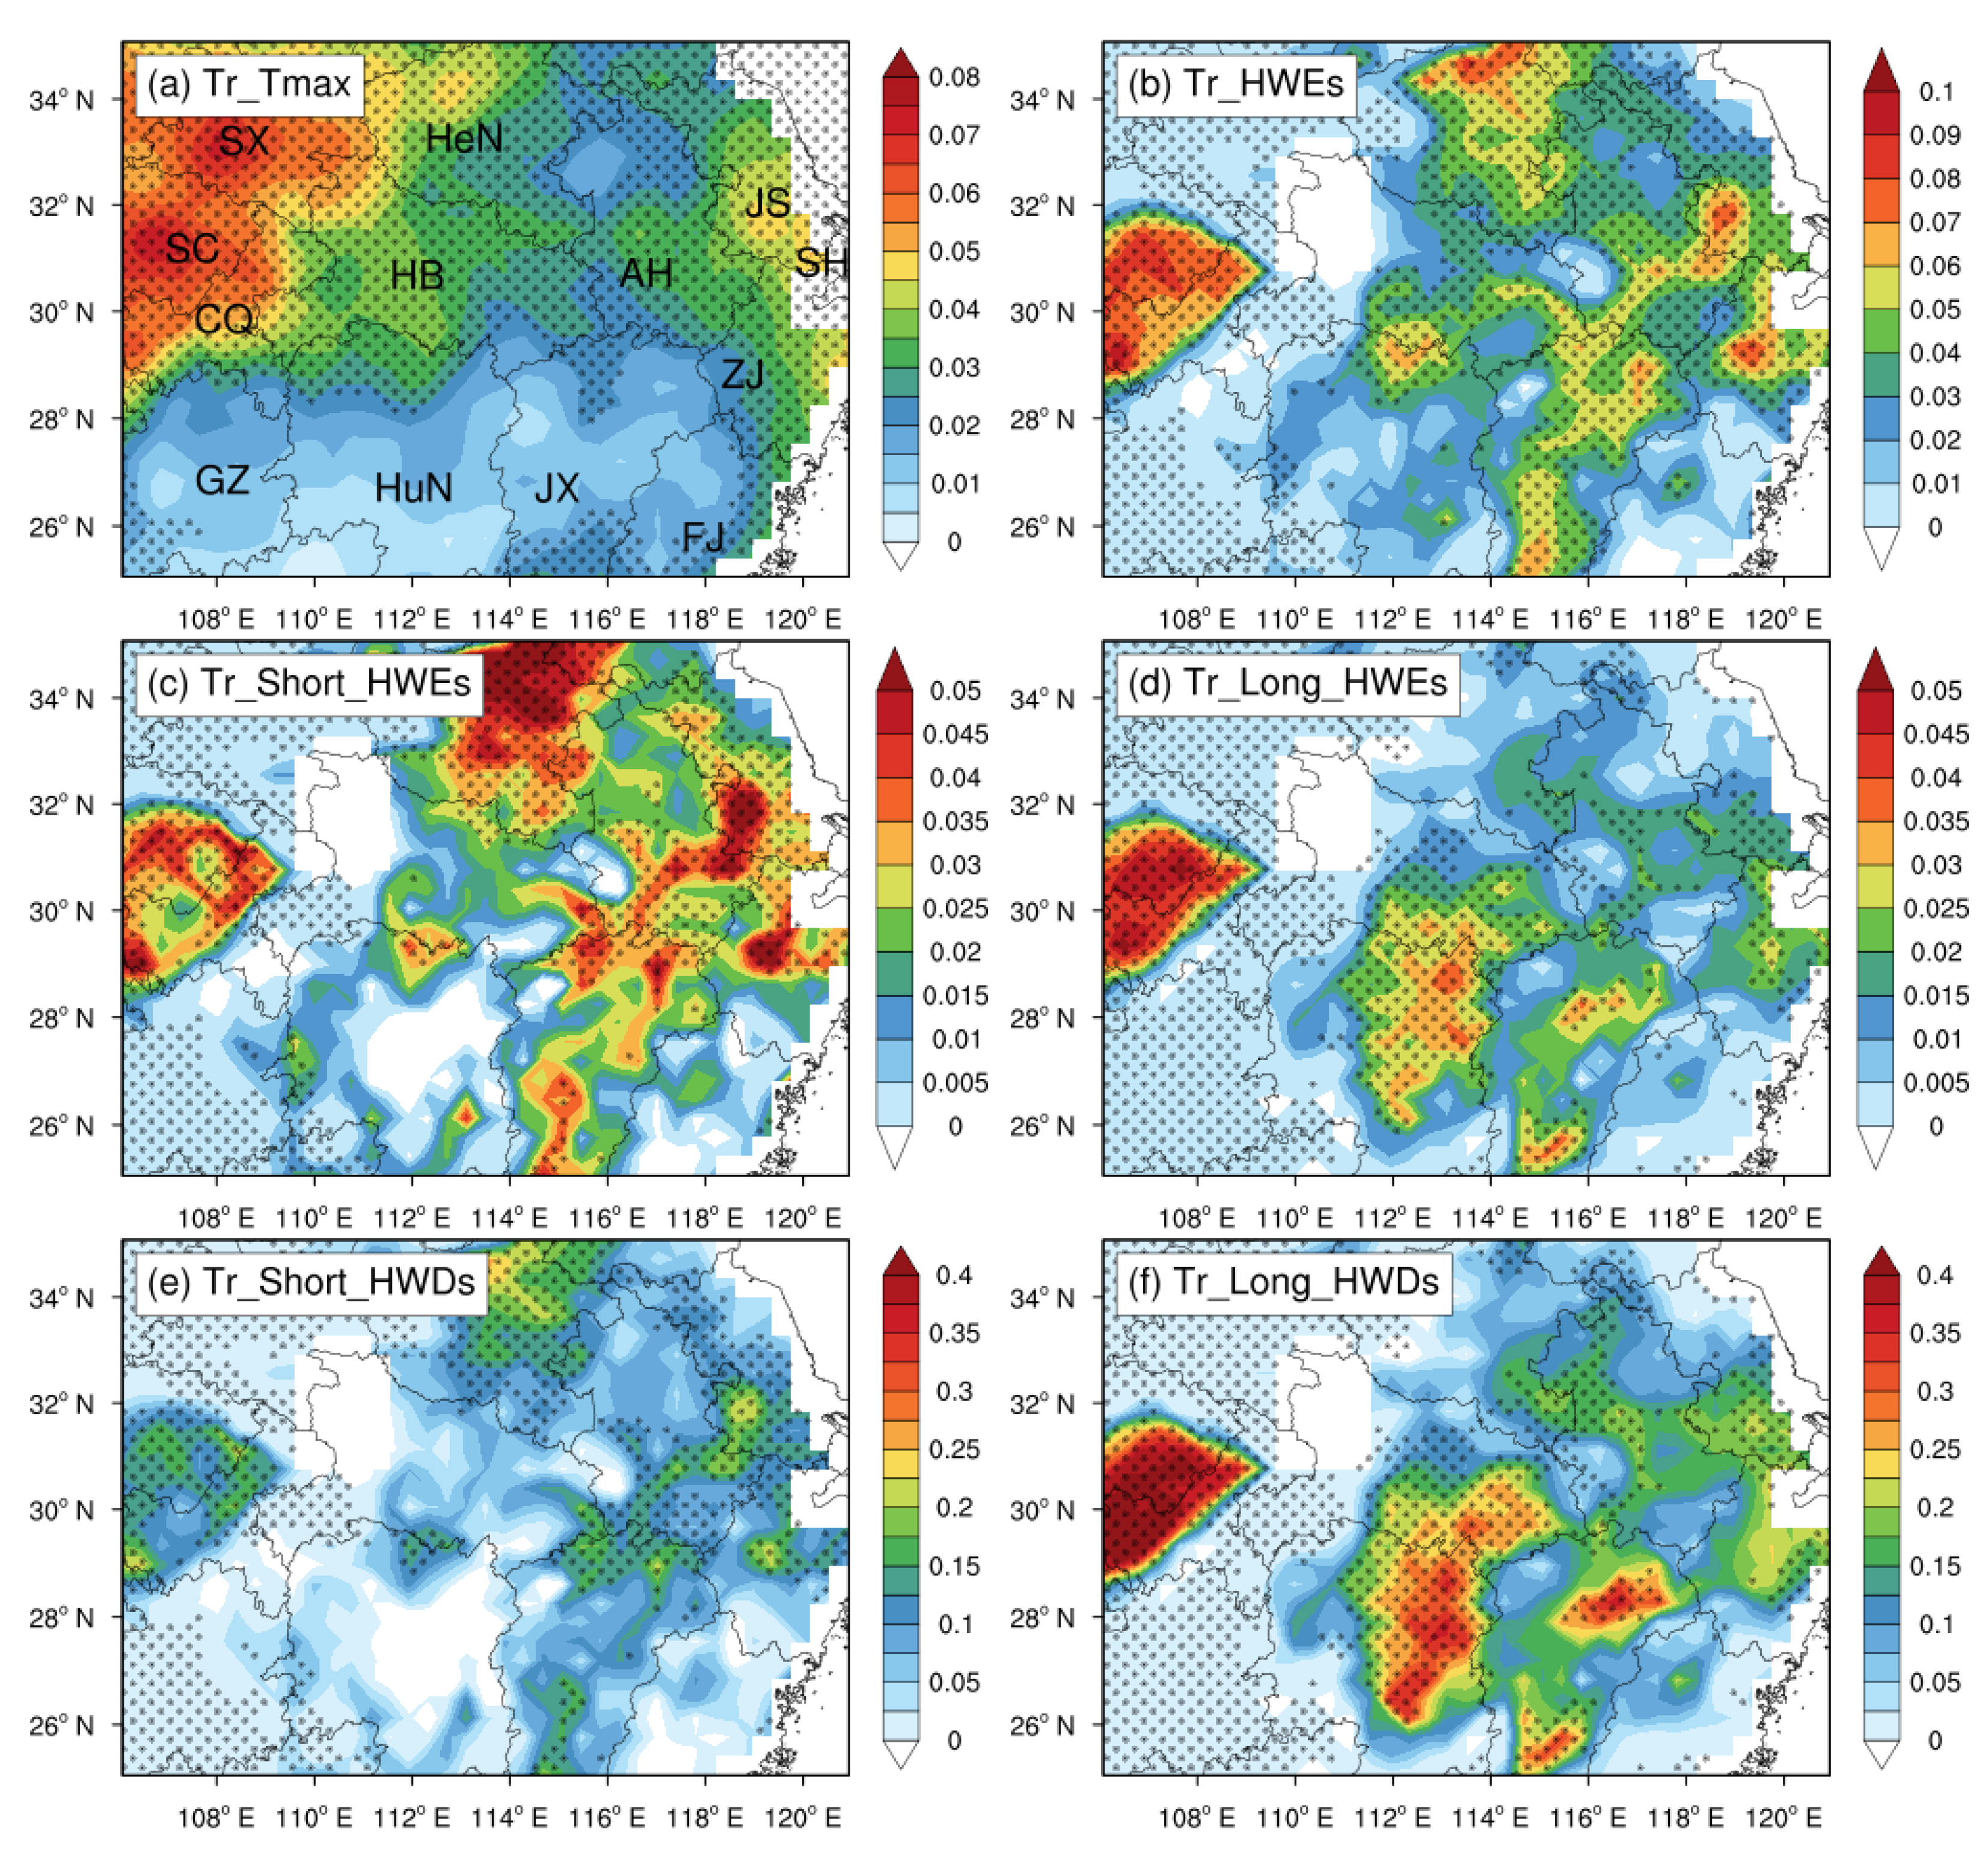
The above results are based on regional averages. In order to clearly understand the characteristics of HWEs in different areas, we further analyzed the spatial distribution of the long-term trends in Tmax and the number of HWEs. The region with the greatest increasing trend of Tmax was located in the western YRB, including Shaanxi, Sichuan, and Chongqing provinces (Figure 3a). In addition, the trends were also obvious in eastern coastal areas (Jiangsu and Shanghai). For the trends of total HWEs, the western YRB also had the greatest value, followed by northern and eastern areas (Figure 3b). It should be mentioned that the increasing trend of total HWEs in the western and southern YRB was mainly caused by the rise of long-lived HWEs (Figure 3d,f), while the increase in HWEs in the northern and eastern YRB was mainly caused by the rise of short-lived HWEs (Figure 3c,e). Therefore, the increasement in the local short-lived HWEs was still not negligible.
3.2. Projection of HWEs
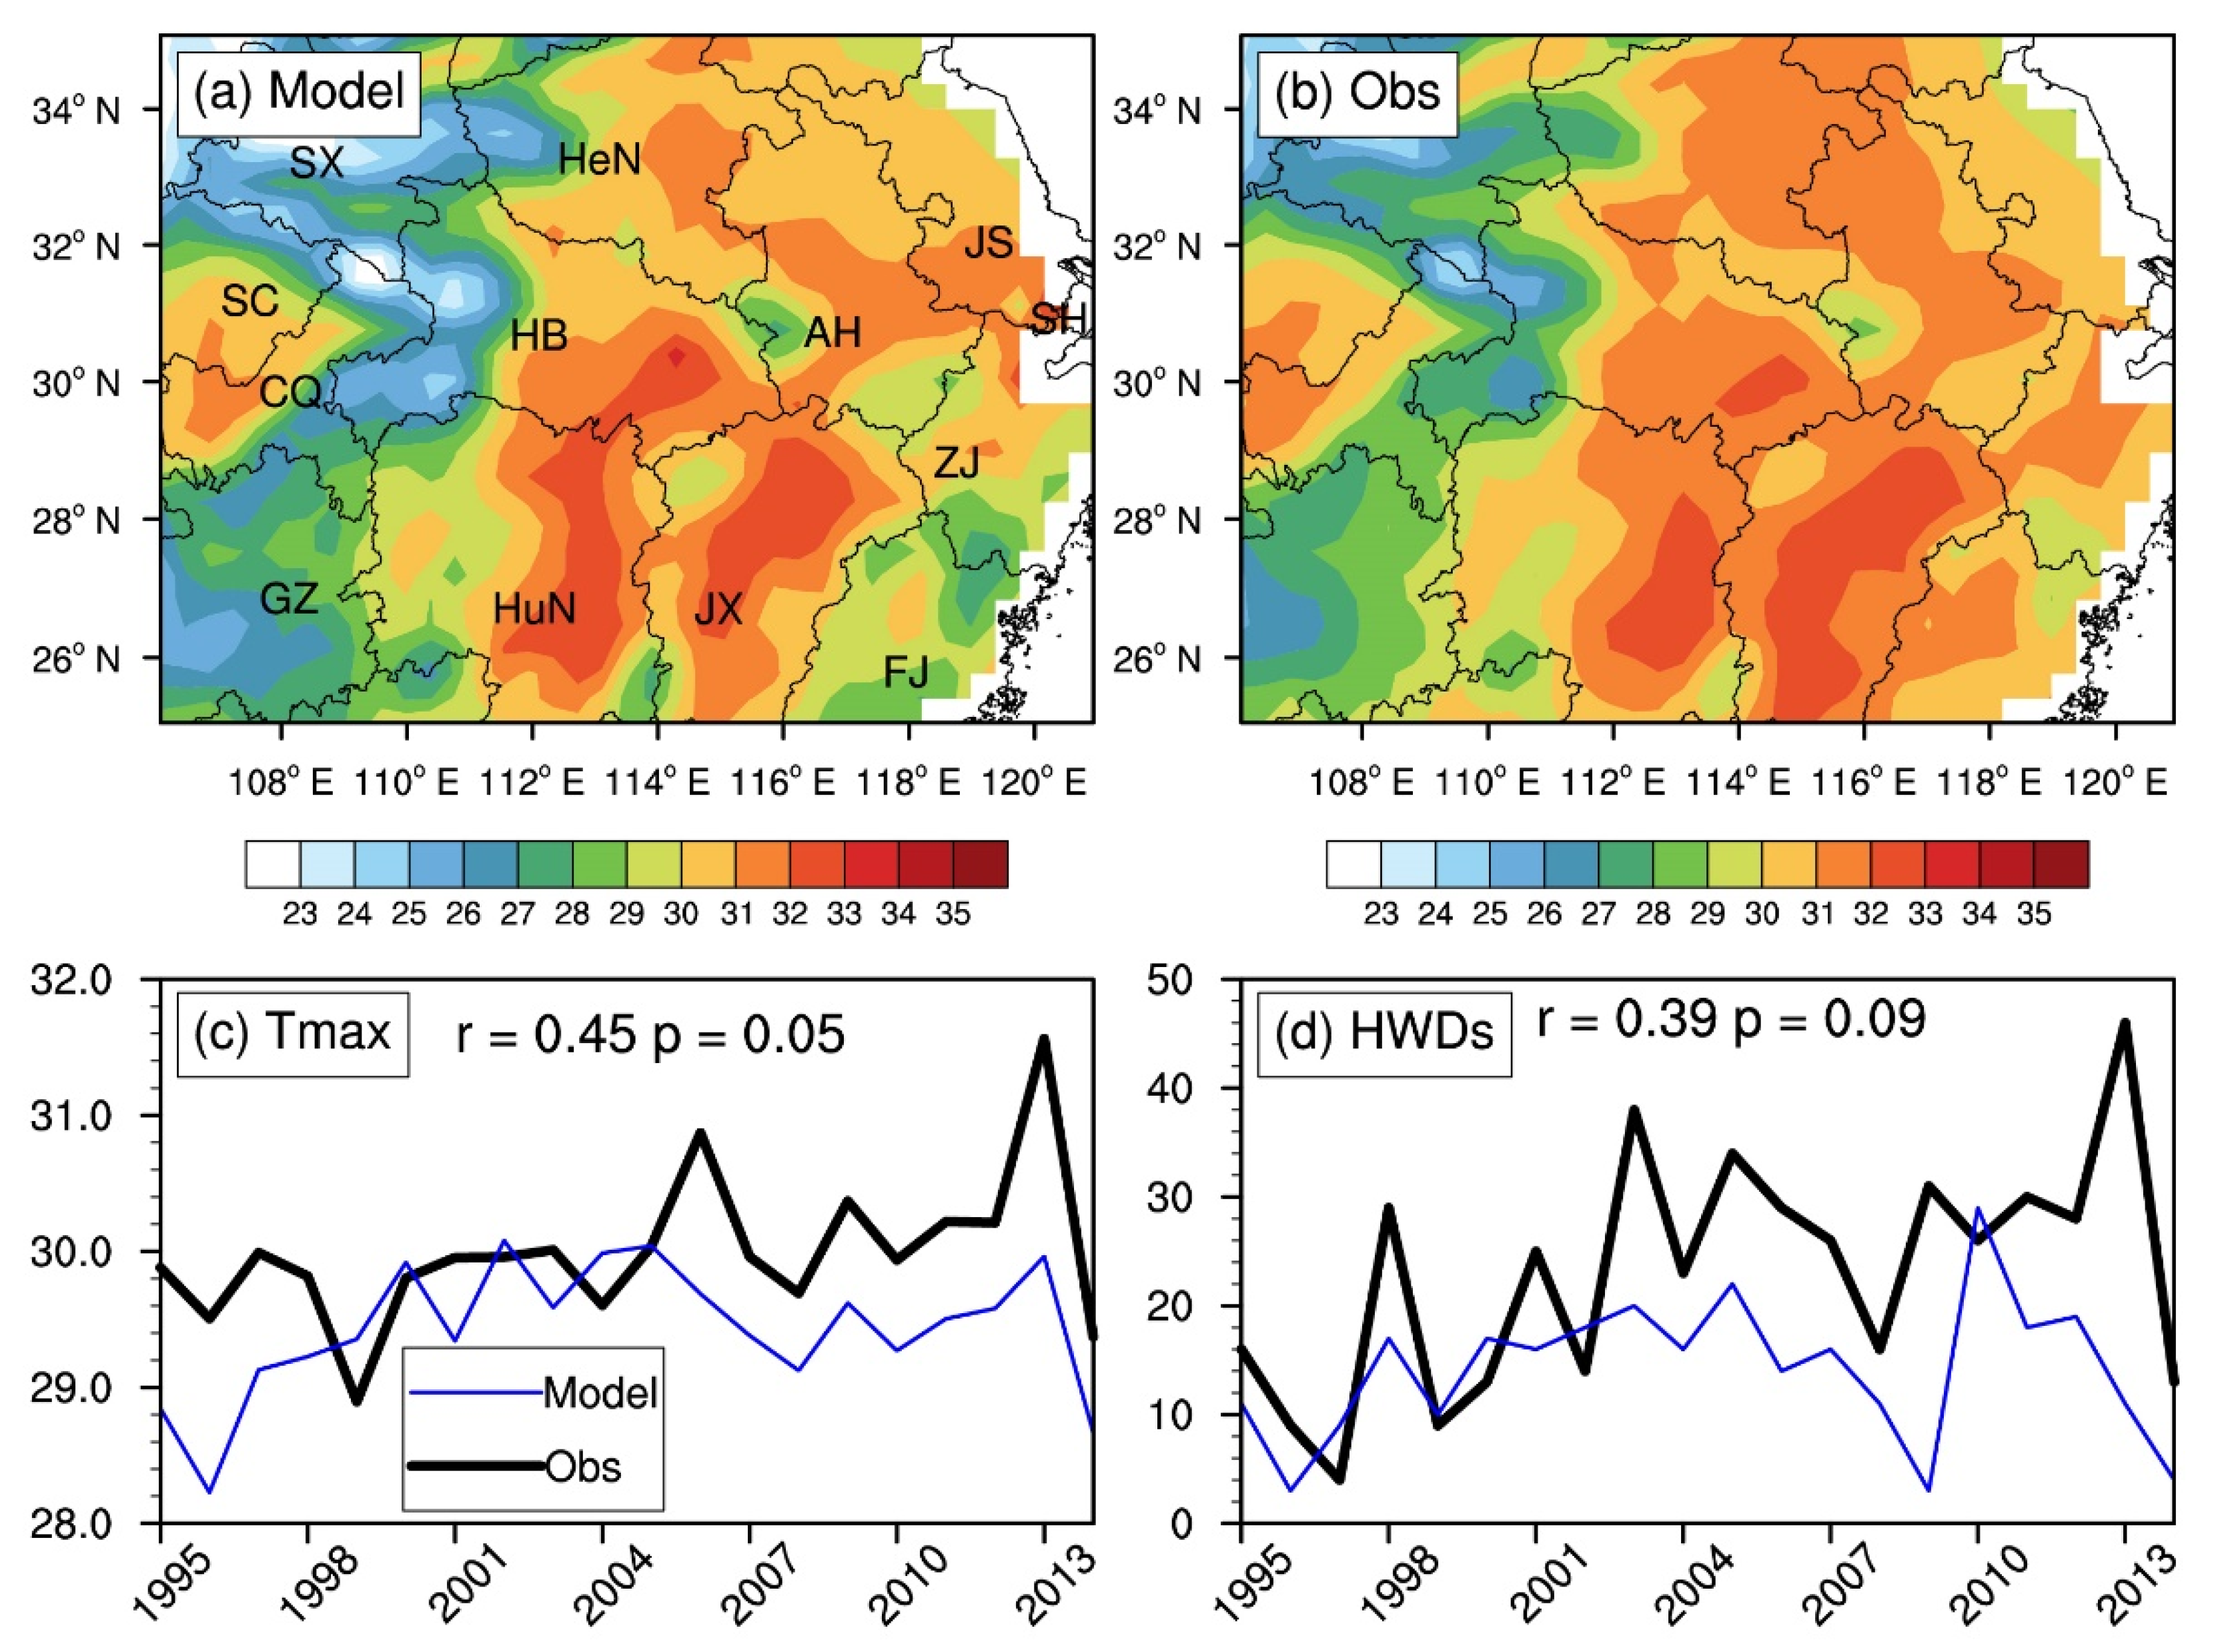
Before using the RCM to make projections of HWEs in the YRB region, we first analyzed the simulation results in reference periods to verify the model’s ability to simulate HWEs. Because Tmax is the most important indicator for HWEs, we mainly focused on the prediction skill of Tmax. The model can simulate the spatial distribution of the average daily Tmax in summer very well (Figure 4a,b), although there is a certain cold bias in the northern YRB region. From the perspective of time evolution, the model can also simulate the interannual variation in the regional average Tmax very well (Figure 4c). The R between the model and observations reached 0.45, exceeding the 95% confidence level. In addition, the model also has a certain ability to simulate the number of HWDs in different years. The R reached 0.39 and passed the 90% confidence level (Figure 4d). Therefore, the model has a certain ability to simulate the HWEs in the YRB region, which indicates that it can be used to predict the future variation in HWEs in this region.
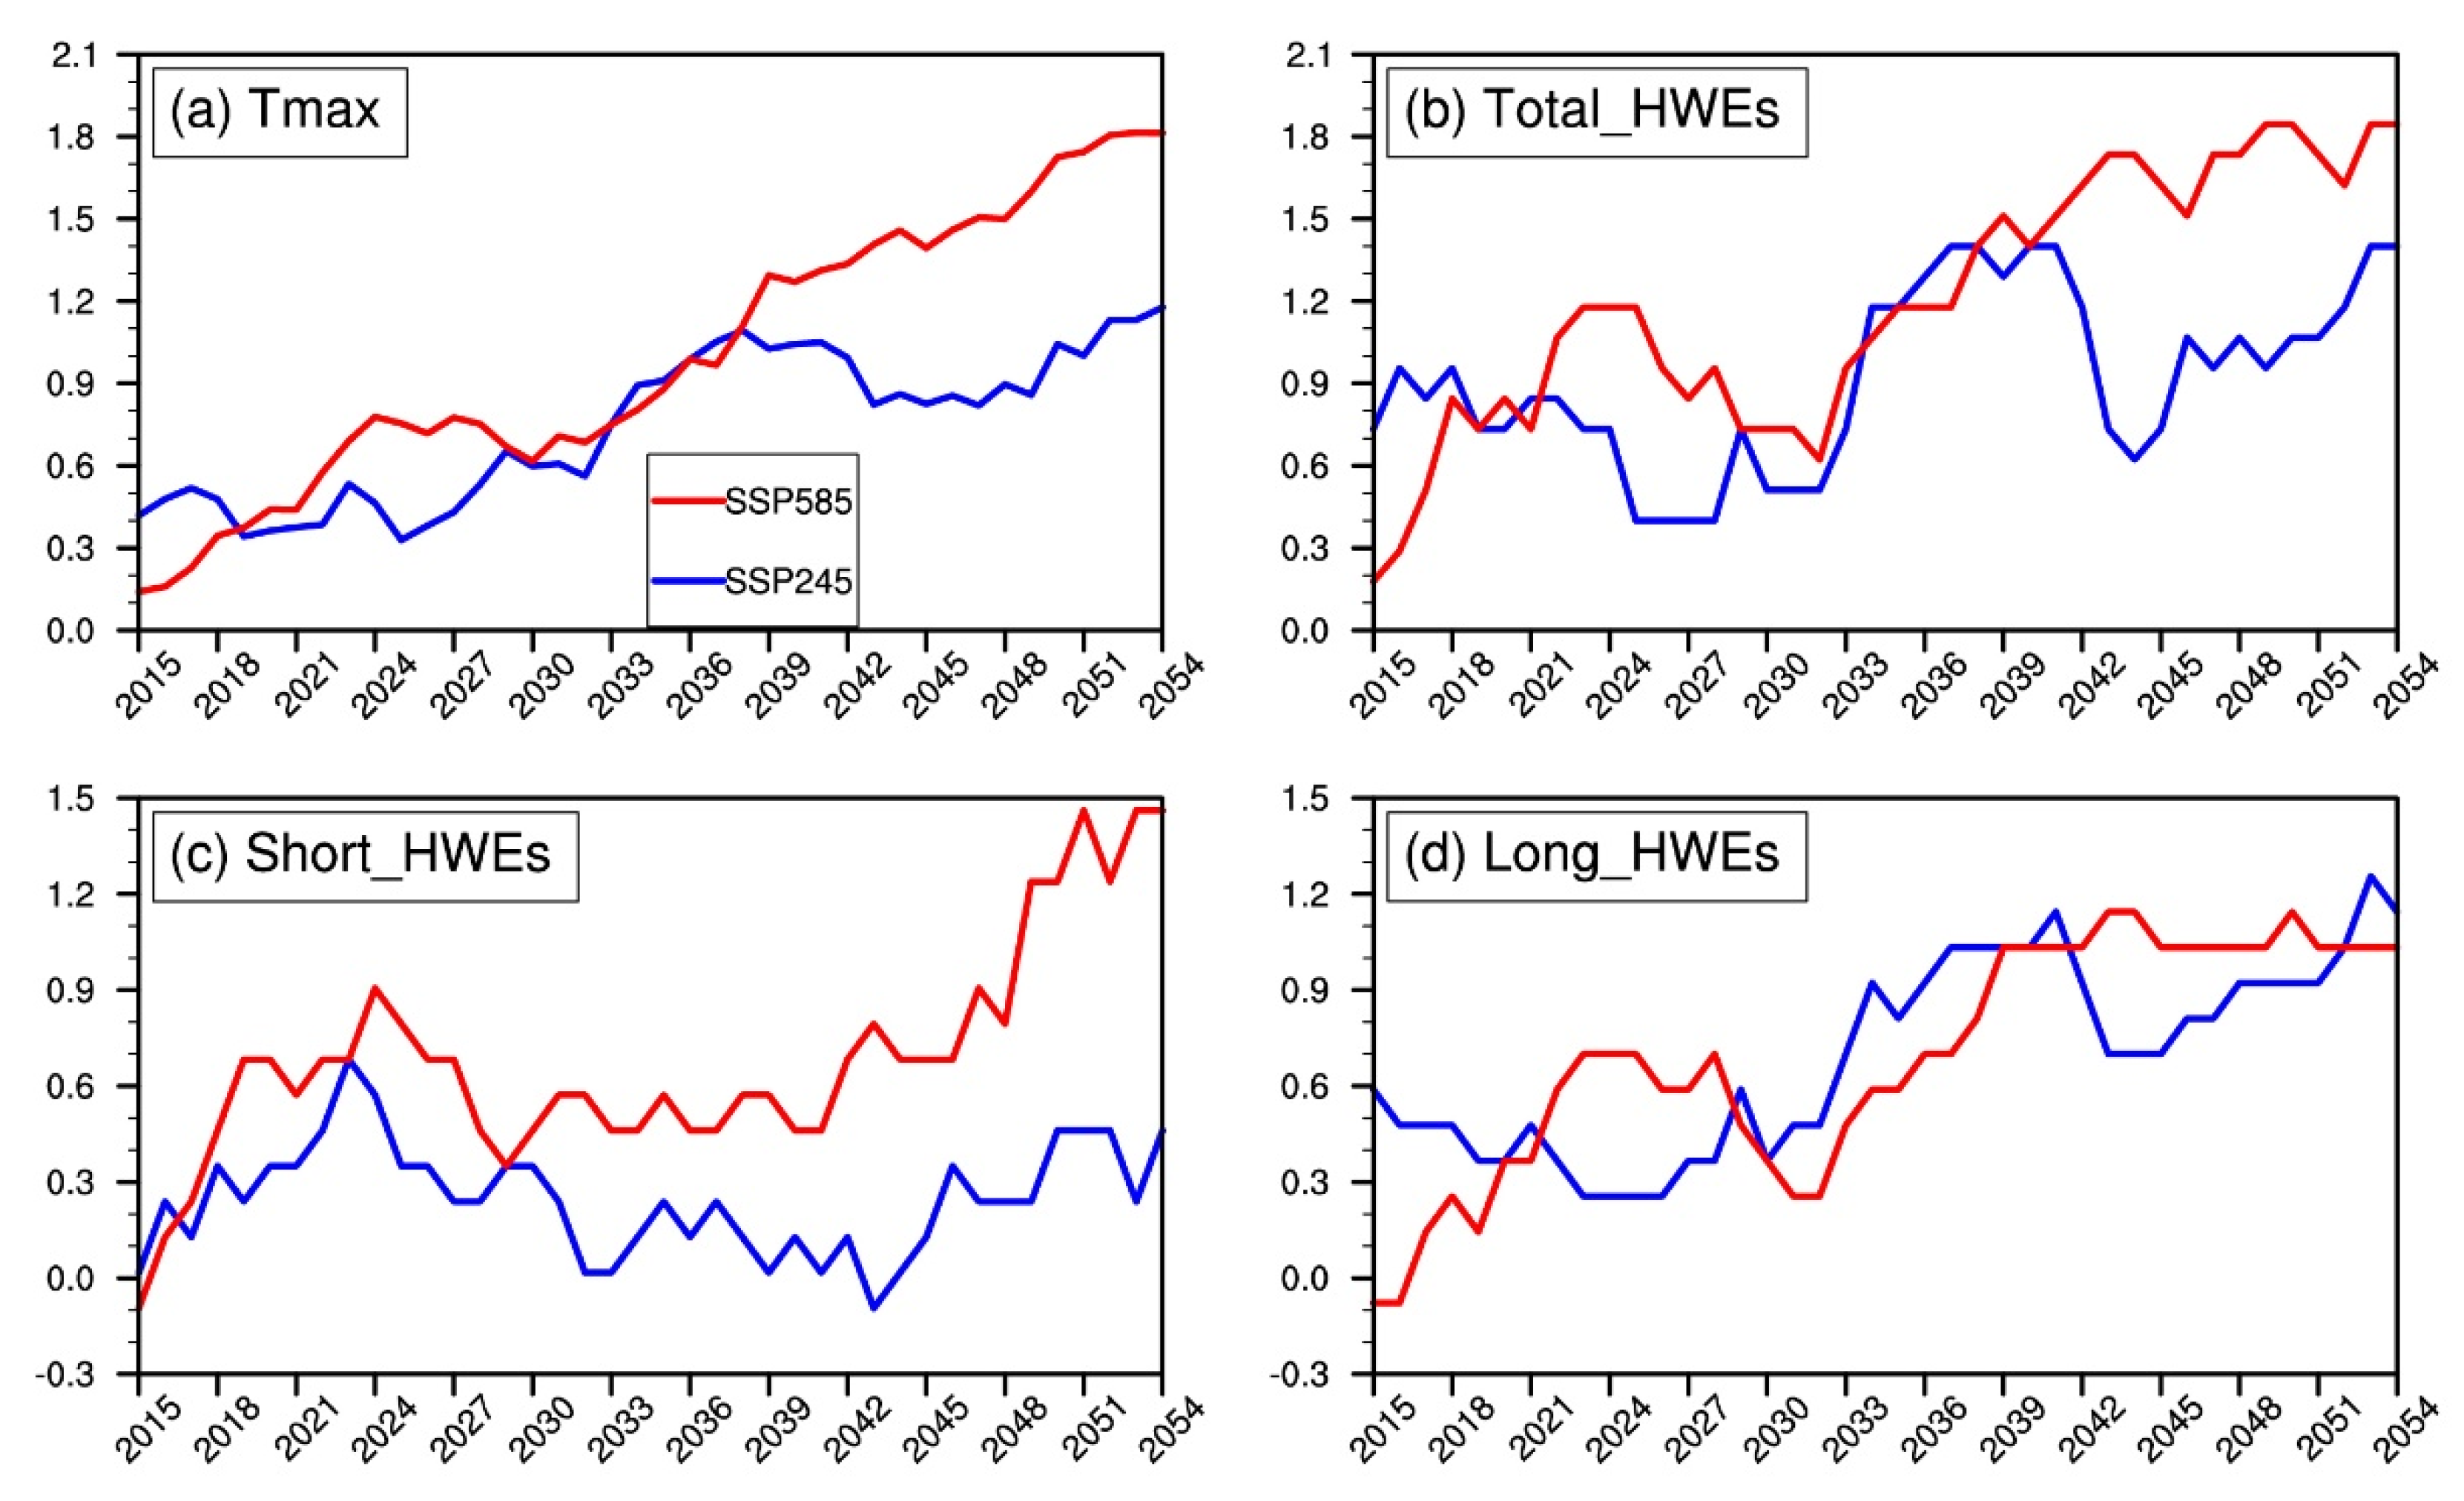
In the future, the average Tmax in summer over the YRB will rise obviously (Figure 5a). The upward trend of SSP585 will be greater than that of SSP245. Relative to the average of 1995–2014 reference period, the temperature of SSP585 will rise by more than 1.8 °C in the middle of the century. The total number of HWEs will also rise under the impact of increasing temperatures, especially in the SSP585 scenario, which will increase by 1.8 events per year by mid-century (Figure 5b). It should be mentioned that there is a great difference in the changes of the short-lived HWEs under the two scenarios (Figure 5c). For SSP245, short-lived HWEs first increase and then decrease, with a relatively flat trend. However, for SSP585, although there is also a slight downward trend after 2024, the overall upward trend of short-lived HWEs is particularly obvious, which will increase by 1.5 events per year in the middle of the century. As for the long-lived HWEs, they will increase obviously in both future scenarios (Figure 5d), which may cause large challenges for future disaster prevention and mitigation work. It can also be found that after 2030, the increase in total HWEs under the SSP245 scenario is mainly caused by the rise in long-lived HWEs. In addition, the spatial coverages of each HWE will also increase in the future (Figure S1 in Supplementary Material). More areas will be affected by HWEs under SSP585. The above results show that adopting a moderate economic-development path can effectively alleviate the impact of HWEs in the future.
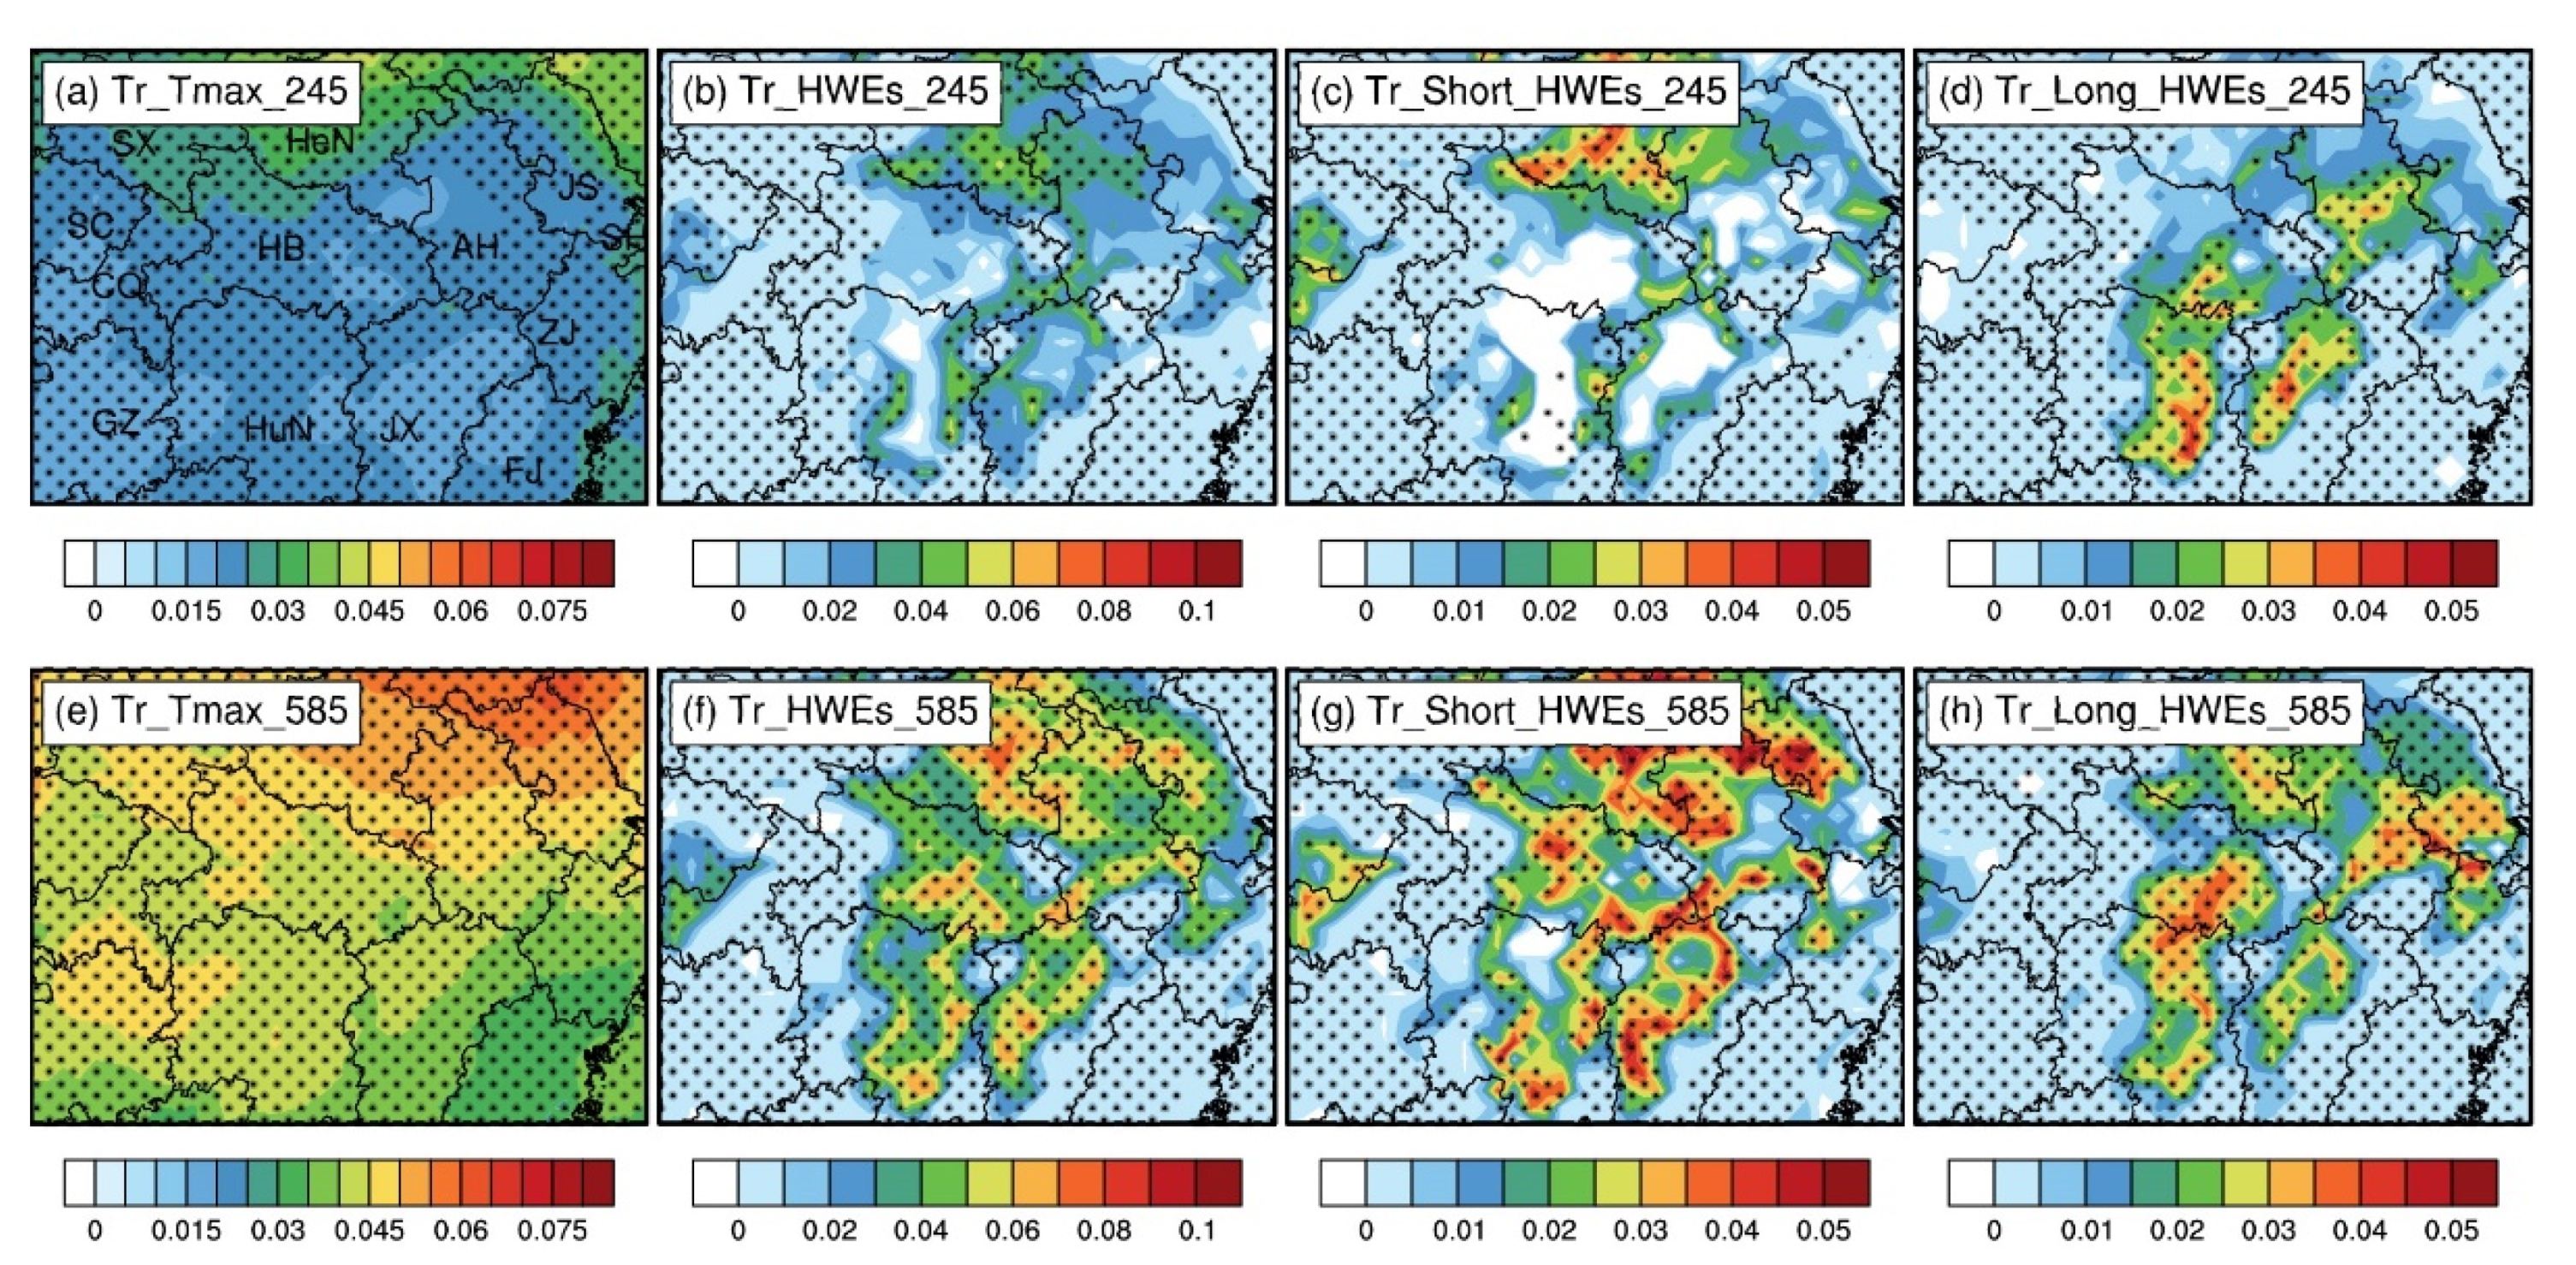
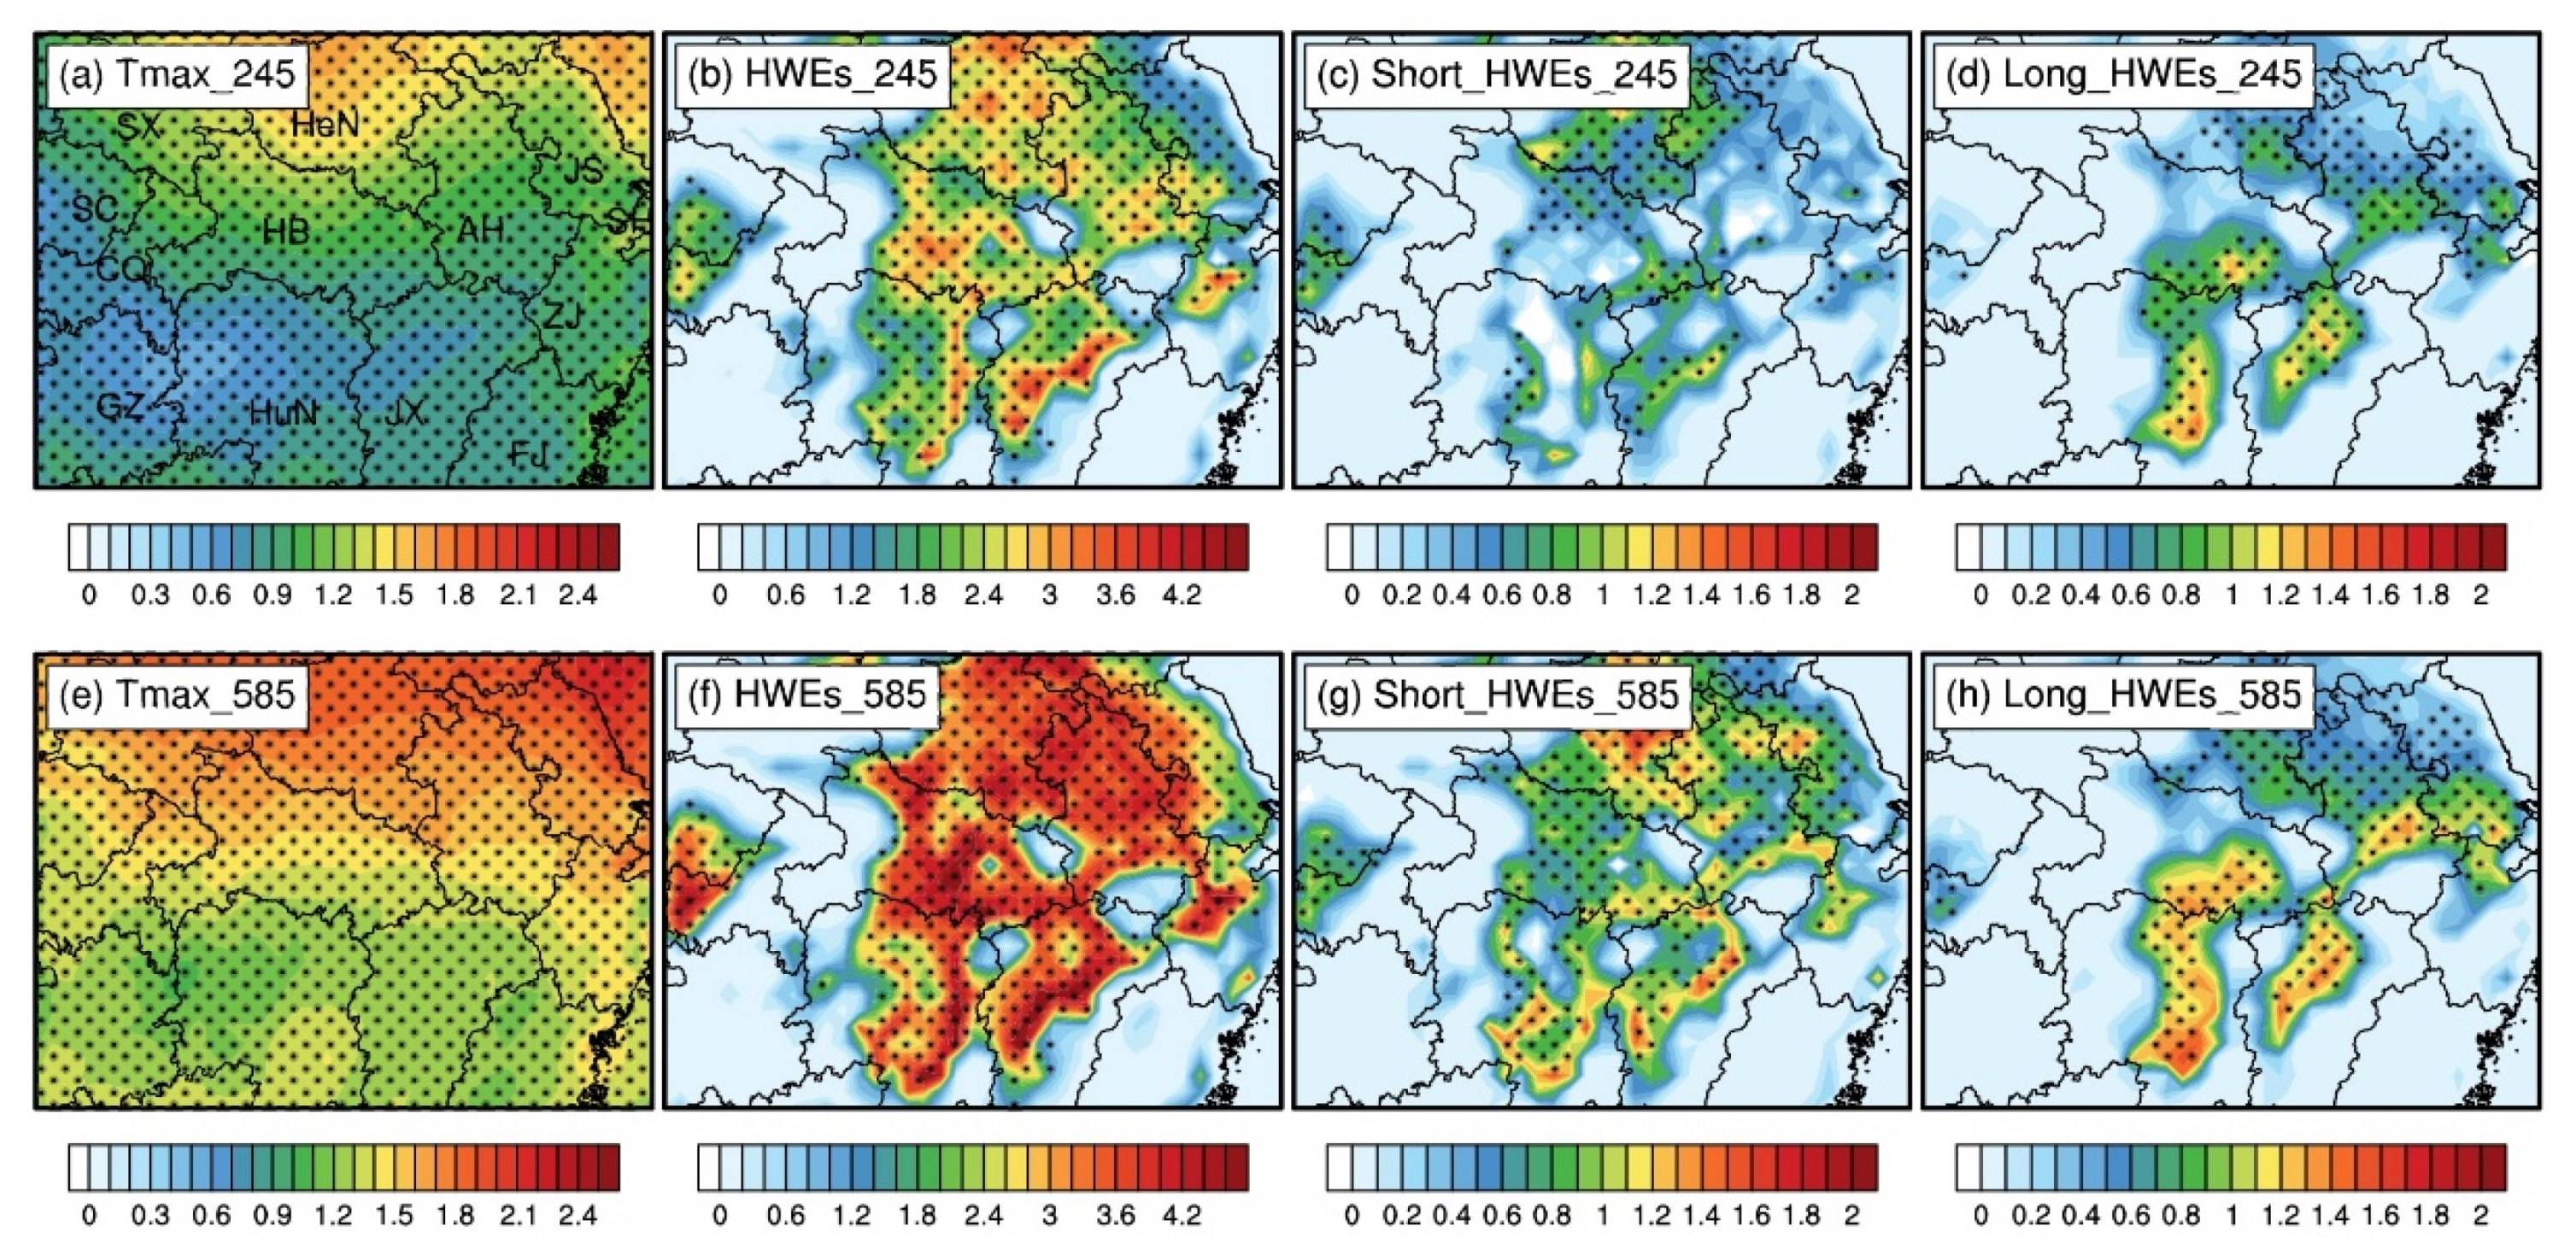
To thoroughly understand the regional differences in the changes in HWEs, we then analyzed the trends in spatial distribution. For Tmax, the northern region warms faster than the southern region, and the warming trend in SSP585 is greater, with the maximum value located in the northeastern part of the YRB (Figure 6a,e). Correspondingly, the occurrence of HWEs in the YRB also increases consistently across the region, with a greater increase in SSP585, especially in the central and eastern regions, including Henan, Hubei, Hunan, Jiangxi, Jiangsu, and Anhui provinces (Figure 6b,f). It is noteworthy that for short-lived HWEs, the rising trend in the northern region (including Henan and northern Anhui) is evident in the SSP245 scenario, and it is the main reason for the rising number of total HWEs in this region in the future. In contrast, for the southern region (including Jiangxi and Hubei), the number of short-lived HWEs is likely to decrease in the future (Figure 6c). It should be mentioned that the future trend of short-lived HWEs in the southern region is consistent with the historical period. At the same time, there will be a significant increase in long-lived HWEs in this region in the future (Figure 6d). For SSP585, both short-lived HWEs and long-lived HWEs will increase significantly in the central and eastern regions (Figure 6g,h), which once again proves the importance of controlling greenhouse-gas emissions. Furthermore, we also analyzed the differences in climatology of Tmax and HWEs from 2035 to 2054 relative to the 1995 to 2014 reference period (Figure 7). Under SSP245, it can also be found that the Tmax will rise more obviously in the northern YRB, and the numbers of HWEs will increase more significantly in the northern and southern YRB, with the northern region dominated by the rise of short-lived HWEs, while the southern region is dominated by the increase in long-lived HWEs. The changes in SSP585 will be more obvious, and it should be mentioned that short-lived HWEs will also rise in the southern YRB under SSP585.
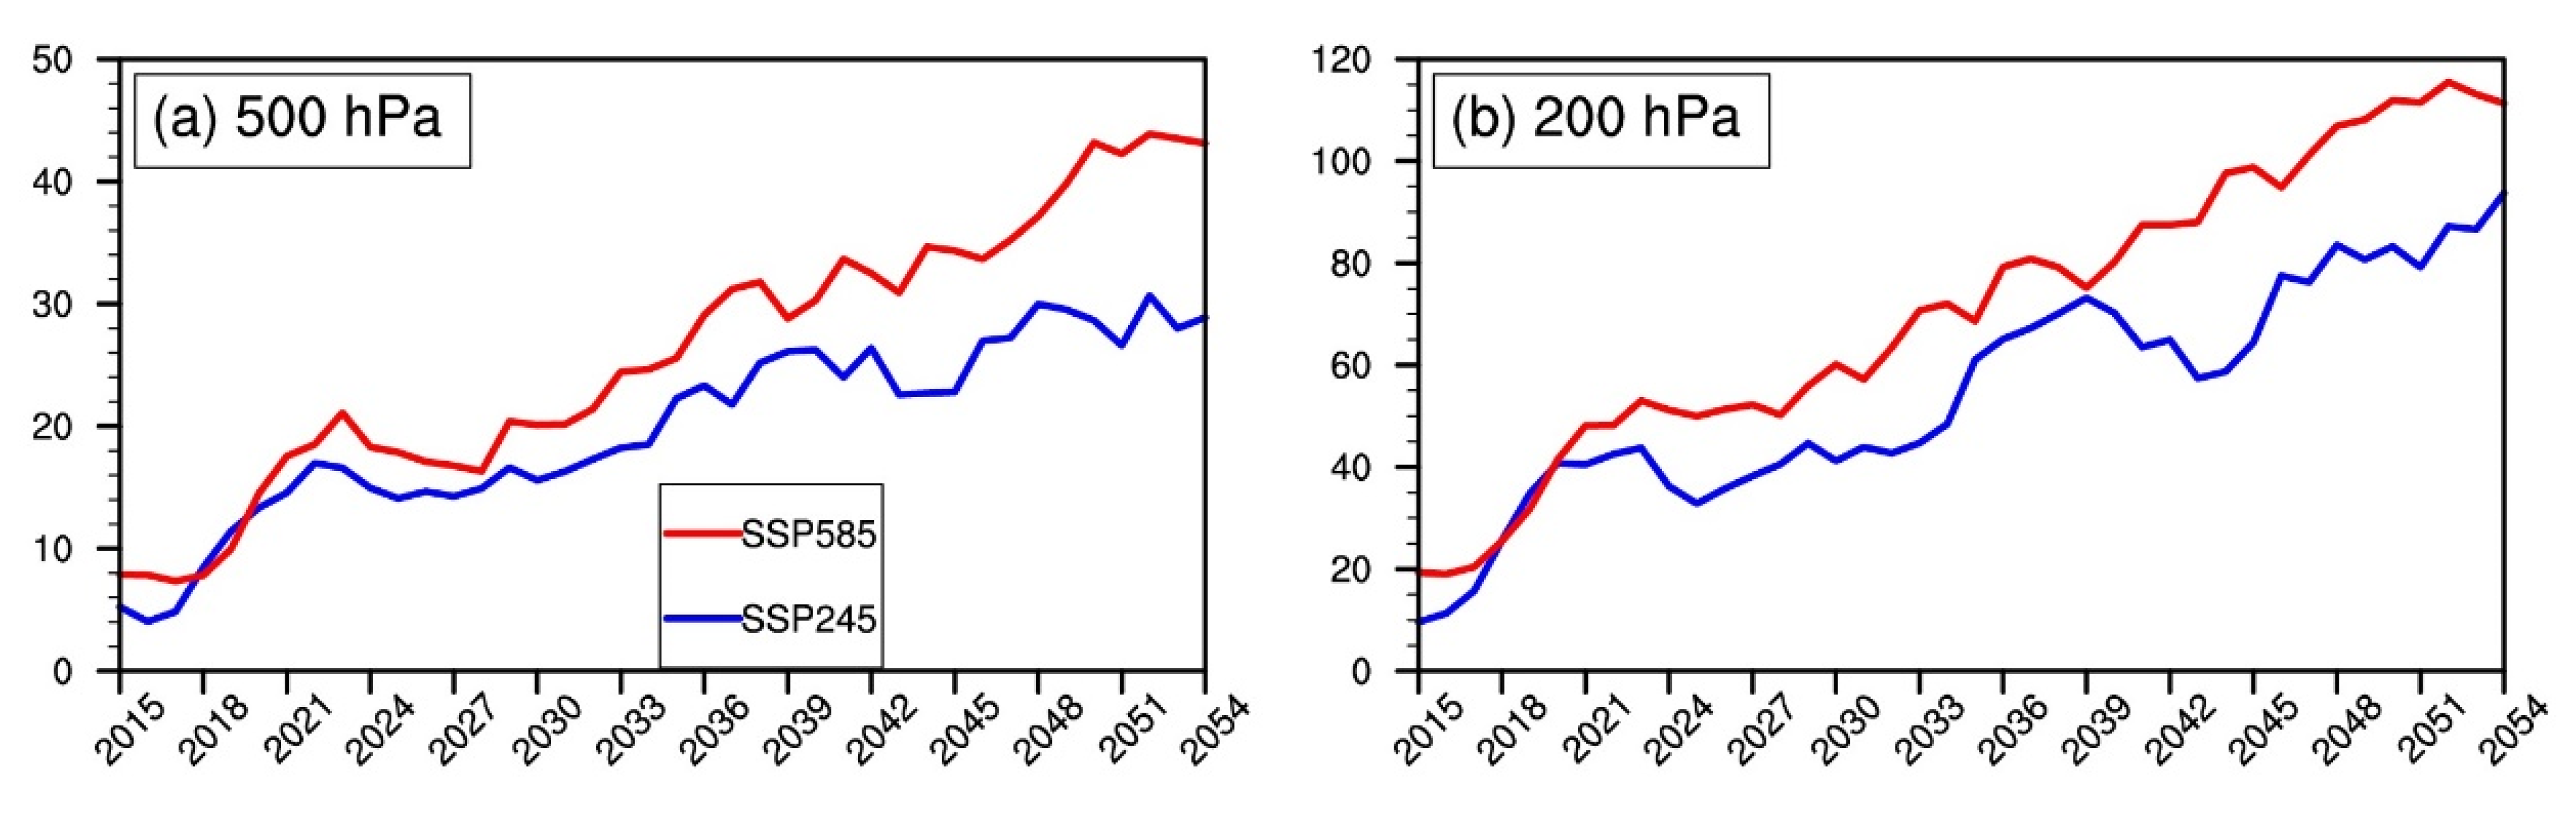
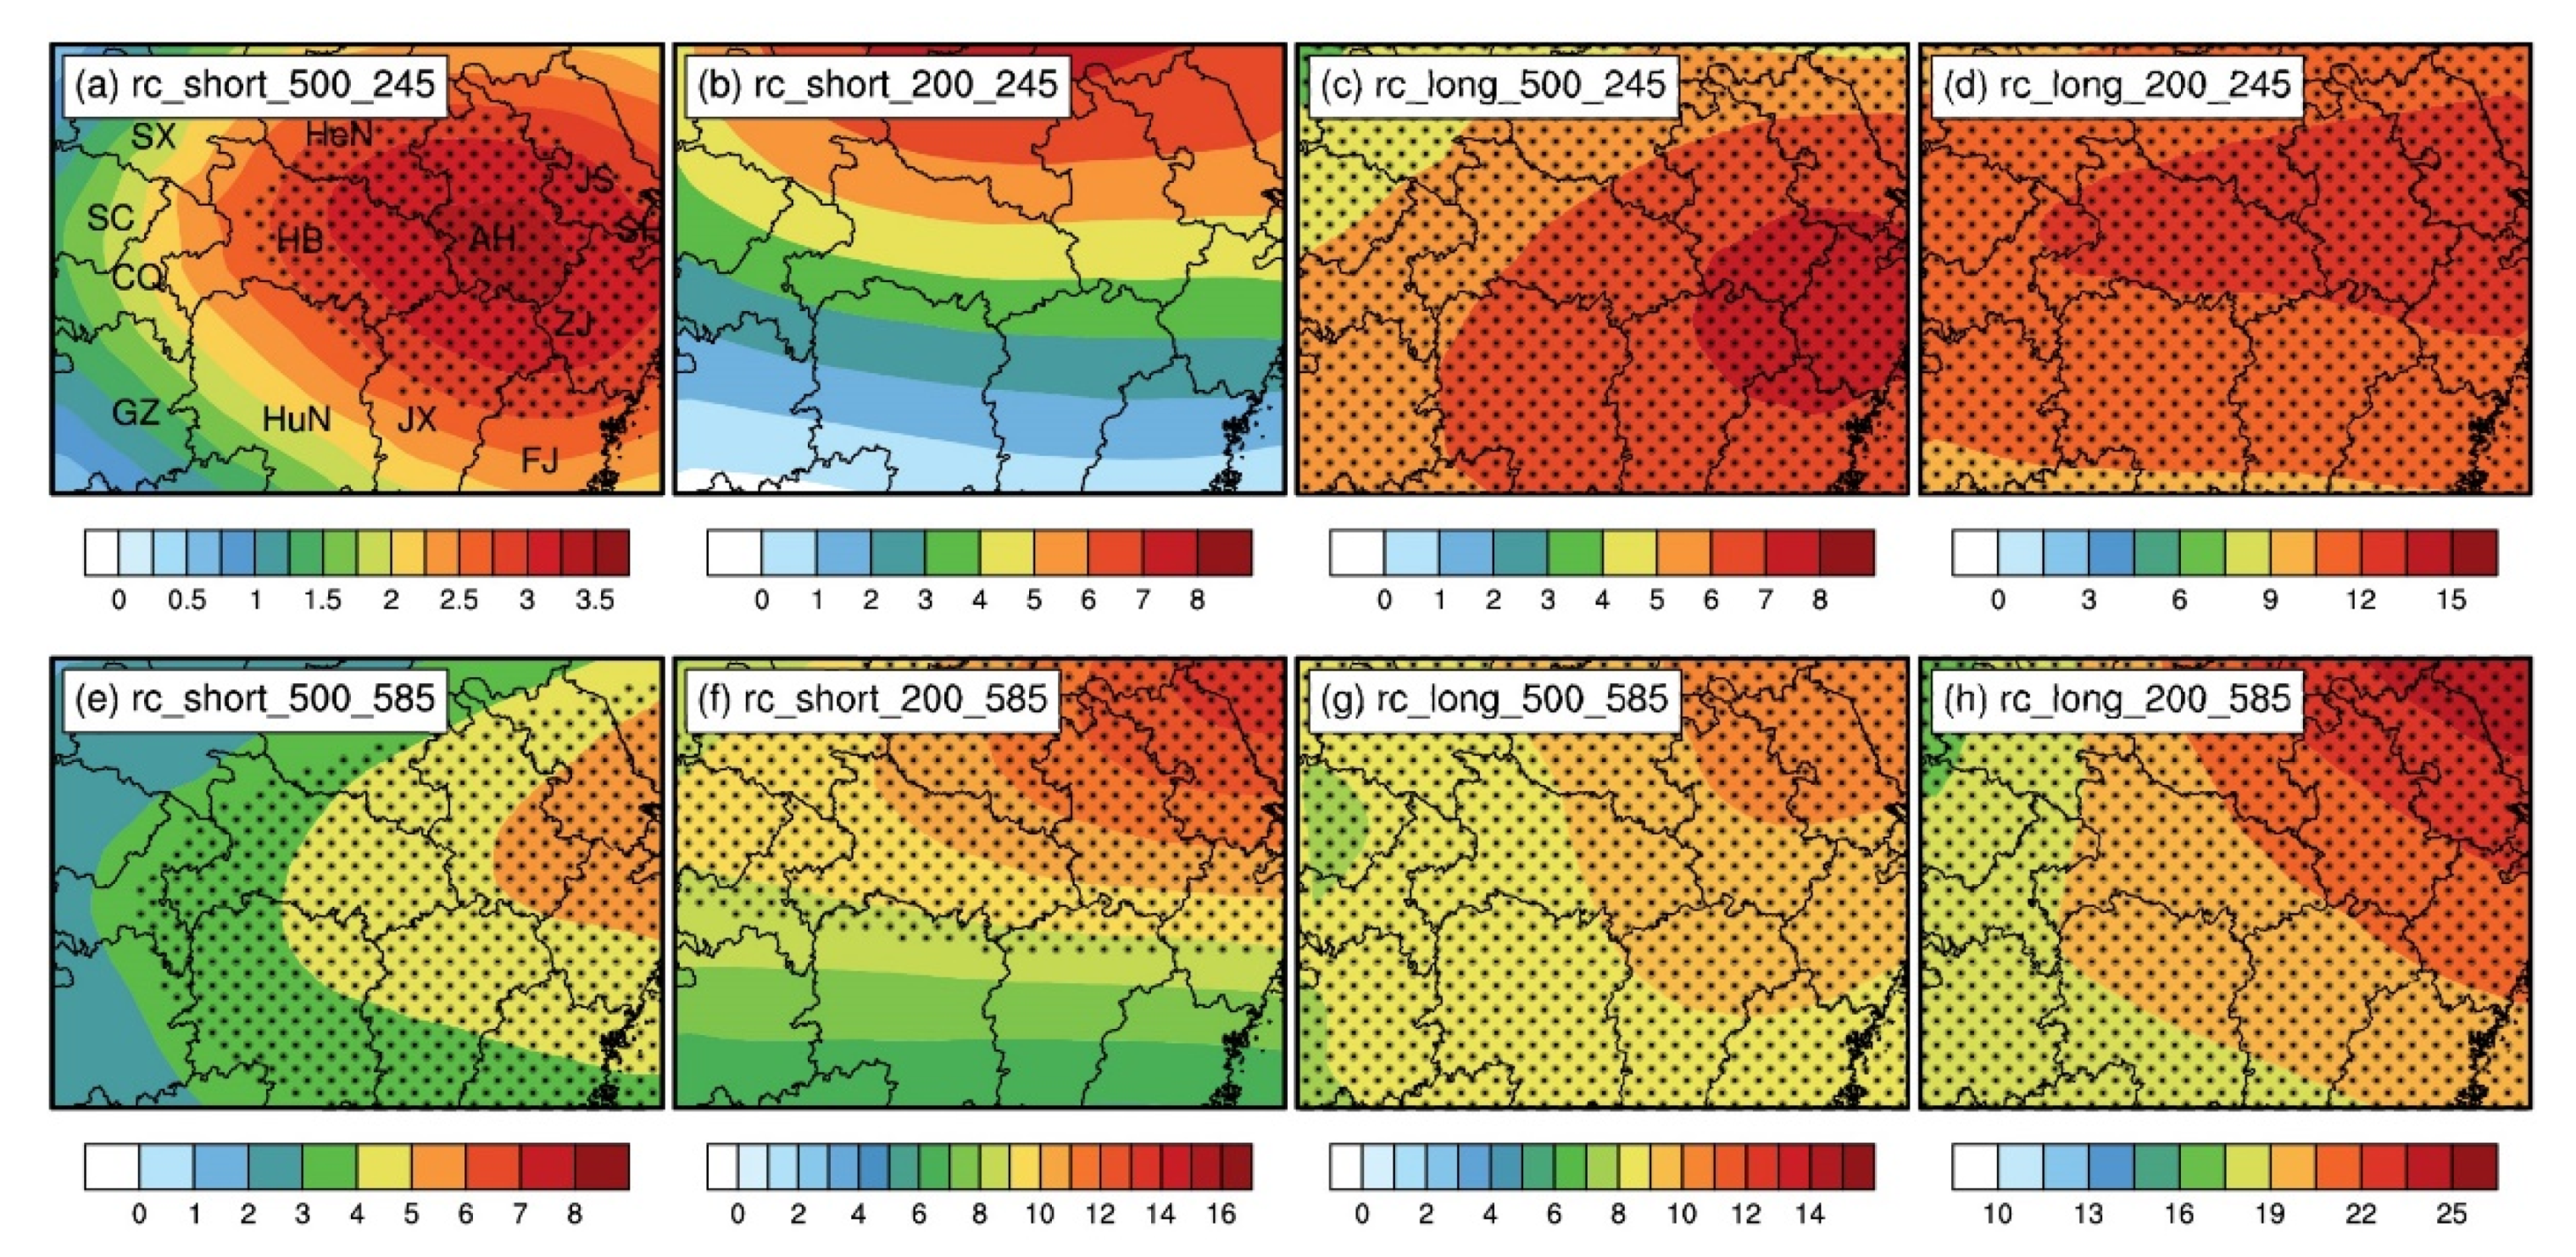
The above results indicate that the temperature in the YRB region will be higher, and HWEs will be more frequent in the future compared to the reference period. Previous studies have proven that the WPSH and SAH play an important role in increasing Tmax and HWEs. Therefore, it is important to understand the changes in geopotential height in the YRB region in the future. Since geopotential heights at 500 hPa and 200 hPa levels have a good indication for these two systems, we mainly focused on analyzing the changes in geopotential heights at these two levels. The geopotential heights of these two levels in the YRB will increase in the future relative to the reference period, and the increasing trend will be more obvious under the SSP585 scenario (Figure 8). The results may indicate that the WPSH and SAH will both intensify in the future. To obtain a deep understanding of the relationship between the enhancement of these two systems and the HWEs, Figure 9 shows the regressions of geopotential height anomalies against the time series of HWEs. Under SSP245, the increase in short-lived HWEs is mainly related to the strengthening of the WPSH, and the impact of the SAH was not significant. The increase in long-lived HWEs is related to the combined effect of the WPSH and SAH. These results are consistent with the conclusions of previous studies based on the analysis of HWEs in historical periods [30]. The main physical process is that when the SAH intensifies, an anomalous anticyclone occurs at the 200 hPa level over the YRB, and a downward advection of vorticity by anomalous sinking motions exists. Consequently, the negative vorticity anomaly is formed at 500 hPa, which can lead to a strong westward extension of the WPSH and the occurrence of long-lived HWEs [49]. However, under the SSP585 scenario, the SAH will increase more obviously, which will result in a wider and stronger influence of the WPSH, and both short-lived HWEs and long-lived HWEs will be affected. The above results once again emphasize the importance of controlling greenhouse-gas emissions.
4. Discussion
This work carried out high-resolution simulations on HWEs in both reference and future periods over the YRB region. Different from the GCM with coarser resolution, the high-resolution simulation from the RCM provides more details on the spatial and temporal variations in HWEs in the YRB. The results also provide valuable information to policy-makers in different regions and help to achieve regional sustainable development.
However, our research still has some limitations. First, due to the limitation of computing resources, our simulation area was relatively small, which made it impossible for us to analyze the changes in SST and large-scale atmospheric circulation in the future. Previous studies have indicated that SST and global atmospheric teleconnection also have an important impact on regional HWEs [11,29,31]. For example, the strong SST anomaly can connect the WPSH via the teleconnection wave train and can further contribute to Tmax variability [34]. Based on this fact, our future work will also focus on the simulation results of some GCMs. Although these models cannot provide the small-scale information as RCMs, they can provide more large-scale signals. Therefore, it is meaningful to use the optimal GCMs to explore the relationship between the large-scale factors and the short-lived and long-lived HWEs over the YRB region. Second, the land-use distribution does not change during our simulation, which makes the model unable to reflect the information of human activities in time. In the near future, we will also use the WRF model to study the contribution of land-use changes to the variations in short-lived HWEs and long-lived HWEs in the YRB region.
5. Conclusions
In the context of global warming, HWEs are becoming increasingly frequent, and obvious differences exist between different regions. The YRB region, an important economic center of China, is one of the regions where HWEs are more frequent and severe. Coarse-resolution models (such as GCMs) cannot resolve the detailed characteristics of HWEs. Based on this, we used a high-resolution RCM (WRF) and observation dataset (CN051) to analyze the characteristics of HWEs in the historical period and project the changes in HWEs in the YRB in the future. The main findings are as follows.
- (1).
- During the 1981–2018 historical period, the Tmax, long-lived HWEs, and total HWEs in the YRB area all showed an obvious upward trend, and the turning point occurred in approximately 2000. Although the upward trend of short-lived HWEs was relatively small overall, there was a significant increase in certain regions, such as Henan, Sichuan, and the eastern coastal region. At the same time, the high incidence of long-lived HWEs was mainly concentrated in Hubei, Hunan, and eastern Sichuan provinces.
- (2).
- Through the high-resolution simulation during the reference period, it was found that the WRF model can simulate the daily Tmax very well, which provides reliability for the projections. The projection results show that Tmax, long-lived HWEs, and total HWEs will increase obviously in both scenarios, and the upward trend of SSP585 is even greater. Short-lived HWEs will also increase under the SSP585 scenario, but they are relatively stable overall under SSP245. For SSP245, in the northern region, the daily Tmax will rise faster, and short-lived HWEs will increase, while the long-lived HWEs will rise significantly in the southern YRB. However, both short-lived and long-lived HWEs will increase in each subregion of the YRB under the SSP585 scenario.
- (3).
- In both future scenarios, the geopotential heights at 500 hPa and 200 hPa over the YRB will increase, which may imply that both the WPSH and SAH will be enhanced, and this is more pronounced in the SSP585 scenario. Changes in the WPSH and SAH have an important impact on the HWEs of the YRB. The long-lived HWEs are caused by the joint effect of the WPSH and SAH, and this joint effect will also affect the short-lived HWEs under the SSP585 scenario. As mentioned in the fourth part, the detailed physical mechanism of the impact of geopotential height on HWEs still needs further study in the future.
Supplementary Materials
The following supporting information can be downloaded at: https://0-www-mdpi-com.brum.beds.ac.uk/article/10.3390/su14031141/s1, Figure S1: The anomalies of the number of grids covered by (a) total HWEs (grids), (b) short-lived HWEs (grids), and (c) long-lived HWEs (grids) relative to the 1995–2014 reference period over the YRB region. The time series are smoothed with a 9-year running mean filter.
Author Contributions
Conceptualization, X.Y.; visualization, Z.G.; writing—original draft, Z.G.; writing—review and editing, X.Y. All authors have read and agreed to the published version of the manuscript.
Funding
This research was funded by the National Key Research and Development Program of China, with grant numbers 2019YFA0606904 and 2018YFC509003.
Institutional Review Board Statement
Not applicable.
Informed Consent Statement
Not applicable.
Data Availability Statement
The coupled Model Intercomparison Project Phase 6 (CMIP6) dataset is available at https://www.scidb.cn/en/detail?dataSetId=791587189614968832&dataSetType=personal (accessed on 27 December 2021).
Acknowledgments
The authors appreciate Sichang Liu, Zhongfeng Xu, and Na Li at the Institute of Atmospheric Physics, Chinese Academy of Sciences (IAP, CAS), for their helpful discussions. The authors also thank Duoying Ji and Yan Guo in Beijing Normal University for both fruitful discussions and helping with computing issues. This research was supported by the Super Computing Center of Beijing Normal University, and the user name was gaozhibo.
Conflicts of Interest
The authors declare no conflict of interest.
References
- Masson-Delmotte, V.; Zhai, P.; Pirani, A.; Connors, S.L.; Péan, C.; Berger, S.; Caud, N.; Chen, Y.; Goldfarb, L.; Gomis, M.I.; et al. (Eds.) IPCC Climate Change 2021: The Physical Science Basis. Contribution of Working Group I to the Sixth Assessment Report of the Intergovernmental Panel on Climate Change; Cambridge University Press: Cambridge, UK, 2021. [Google Scholar]
- Zhang, G.; Zeng, G.; Yang, X.; Jiang, Z. Future changes in extreme high temperature over China at 1.5 °C–5 °C global warming based on CMIP6 simulations. Adv. Atmos. Sci. 2021, 38, 253–267. [Google Scholar] [CrossRef]
- King, M.J.; Reeder, M.J. Extreme heat events from an object viewpoint with application to south-east Australia. Int. J. Climatol. 2021, 41, 2693–2709. [Google Scholar] [CrossRef]
- Li, D.; Zhou, T.; Zou, L.; Zhang, W.; Zhang, L. Extreme high-temperature events over East Asia in 1.5 °C and 2 °C warmer futures: Analysis of NCAR CESM low-warming experiments. Geophys. Res. Lett. 2018, 45, 1541–1550. [Google Scholar] [CrossRef] [Green Version]
- Sun, Y.; Zhang, X.; Zwiers, F.W.; Song, L.; Wan, H.; Hu, T.; Yin, H.; Ren, G. Rapid increase in the risk of extreme summer heat in Eastern China. Nat. Clim. Change 2014, 4, 1082–1085. [Google Scholar] [CrossRef]
- Kinter, J.L.; Fennessy, M.J. Climatic feedbacks during the 2003 European heat wave. J. Clim. 2011, 24, 5953–5967. [Google Scholar]
- Joughin, I.; Abdalati, W.; Fahnestock, M. Large fluctuations in speed on Greenland’s Jakobshavn Isbrae glacier. Nature 2004, 432, 608–610. [Google Scholar] [CrossRef]
- Wang, J.; Yan, Z.; Quan, X.-W.; Feng, J. Urban warming in the 2013 summer heat wave in eastern China. Clim. Dyn. 2016, 48, 3015–3033. [Google Scholar] [CrossRef]
- Kong, Q.; Guerreiro, S.B.; Blenkinsop, S.; Li, X.-F.; Fowler, H.J. Increases in summertime concurrent drought and heatwave in Eastern China. Weather Clim. Extremes 2020, 28, 100242. [Google Scholar] [CrossRef]
- Chen, H.; Sun, J. Projected changes in climate extremes in China in a 1.5 °C warmer world. Int. J. Clim. 2018, 38, 3607–3617. [Google Scholar] [CrossRef]
- Yang, J.; Zhu, T.; Gao, M.; Lin, H.; Wang, B.; Bao, Q. Late-July barrier for subseasonal forecast of summer daily maximum temperature over Yangtze River Basin. Geophys. Res. Lett. 2018, 45, 12610–12615. [Google Scholar] [CrossRef] [Green Version]
- Torres-Alavez, J.A.; Giorgi, F.; Kucharski, F.; Coppola, E.; Castro-García, L. ENSO teleconnections in an ensemble of CORDEX-CORE regional simulations. Clim. Dyn. 2021, 57, 1445–1461. [Google Scholar] [CrossRef]
- Lin, L.; Gettelman, A.; Xu, Y.; Wu, C.; Wang, Z.; Rosenbloom, N.; Bates, S.C.; Dong, W. CAM6 simulation of mean and extreme precipitation over Asia: Sensitivity to upgraded physical parameterizations and higher horizontal resolution. Geosci. Model Dev. 2019, 12, 3773–3793. [Google Scholar] [CrossRef] [Green Version]
- Anand, A.; Bhowmick, M.; Mishra, S.K.; Sahany, S.; Reddy Telukuntla, C.V. Response of Indian monsoon to increase of resolution in NCAR-CAM5. Atmos. Res. 2019, 221, 12–26. [Google Scholar] [CrossRef]
- Yan, Y.; Tang, J.; Wang, S.; Niu, X.; Le, W. Uncertainty of land surface model and land use data on WRF model simulations over China. Clim. Dyn. 2021, 57, 1833–1851. [Google Scholar] [CrossRef]
- Gao, Z.; Zhu, J.; Guo, Y.; Yan, X.; Wang, X.; Li, H.; Li, S. Comparison of different land-surface perturbation methods in short-range ensemble forecasts. Atmos. Ocean. Sci. Lett. 2021, 14, 100045. [Google Scholar] [CrossRef]
- Kong, X.; Wang, A.; Bi, X.; Li, X.; Zhang, H. Effects of horizontal resolution on hourly precipitation in AGCM simulations. J. Hydrometeorol. 2020, 21, 643–670. [Google Scholar] [CrossRef]
- Liang, X.-Z.; Sun, C.; Zheng, X.; Dai, Y.; Xu, M.; Choi, H.I.; Ling, T.; Qiao, F.; Kong, X.; Bi, X.; et al. CWRF performance at downscaling China climate characteristics. Clim. Dyn. 2018, 52, 2159–2184. [Google Scholar] [CrossRef]
- Zhu, X.; Wei, Z.; Dong, W.; Ji, Z.; Wen, X.; Zheng, Z.; Yan, D.; Chen, D. Dynamical downscaling simulation and projection for mean and extreme temperature and precipitation over central Asia. Clim. Dyn. 2020, 54, 3279–3306. [Google Scholar] [CrossRef] [Green Version]
- Tian, L.; Jin, J.; Wu, P.; Niu, G.-y.; Zhao, C. High-resolution simulations of mean and extreme precipitation with WRF for the soil-erosive Loess Plateau. Clim. Dyn. 2020, 54, 3489–3506. [Google Scholar] [CrossRef]
- Cardoso, R.M.; Soares, P.M.M.; Miranda, P.M.A.; Belo-Pereira, M. WRF high resolution simulation of Iberian mean and extreme precipitation climate. Int. J. Clim. 2013, 33, 2591–2608. [Google Scholar] [CrossRef]
- Yun, Y.; Liu, C.; Luo, Y.; Gao, W. Warm-season mesoscale convective systems over eastern China: Convection-permitting climate model simulation and observation. Clim. Dyn. 2021, 57, 3599–3617. [Google Scholar] [CrossRef]
- Gao, Z.; Zhu, J.; Guo, Y.; Luo, N.; Fu, Y.; Wang, T. Impact of land surface processes on a record-Breaking rainfall event on May 06–07, 2017, in Guangzhou, China. J. Geophys. Res. Atmos. 2021, 126, e2020JD032997. [Google Scholar] [CrossRef]
- Yun, Y.; Liu, C.; Luo, Y.; Liang, X.; Huang, L.; Chen, F.; Rasmmusen, R. Convection-permitting regional climate simulation of warm-season precipitation over Eastern China. Clim. Dyn. 2019, 54, 1469–1489. [Google Scholar] [CrossRef] [Green Version]
- Guo, Z.; Fang, J.; Sun, X.; Yang, Y.; Tang, J. Sensitivity of summer precipitation simulation to microphysics parameterization over Eastern China: Convection-permitting regional climate simulation. J. Geophys. Res. Atmos. 2019, 124, 9183–9204. [Google Scholar] [CrossRef]
- Kong, X.; Wang, A.; Bi, X.; Wang, D. Assessment of temperature extremes in China using RegCM4 and WRF. Adv. Atmos. Sci. 2019, 36, 363–377. [Google Scholar] [CrossRef]
- Fita, L.; Polcher, J.; Giannaros, T.M.; Lorenz, T.; Milovac, J.; Sofiadis, G.; Katragkou, E.; Bastin, S. CORDEX-WRF v1.3: Development of a module for the weather research and forecasting (WRF) model to support the CORDEX community. Geosci. Model Dev. 2019, 12, 1029–1066. [Google Scholar] [CrossRef] [Green Version]
- Yu, E.; Sun, J.; Chen, H.; Xiang, W. Evaluation of a high-resolution historical simulation over China: Climatology and extremes. Clim. Dyn. 2014, 45, 2013–2031. [Google Scholar] [CrossRef]
- Qi, X.; Yang, J.; Gao, M.; Yang, H.; Liu, H. Roles of the tropical/extratropical intraseasonal oscillations on generating the heat wave over Yangtze River valley: A numerical study. J. Geophys. Res. Atmos. 2019, 124, 3110–3123. [Google Scholar] [CrossRef] [Green Version]
- Li, N.; Xiao, Z.; Zhao, L. A recent increase in long-lived heatwaves in China under the joint influence of South Asia and Western North Pacific subtropical highs. J. Clim. 2021, 34, 7167–7179. [Google Scholar] [CrossRef]
- Yang, K.; Zhang, J.; Wu, L.; Wei, J. Prediction of summer hot extremes over the middle and lower reaches of the Yangtze River valley. Clim. Dyn. 2018, 52, 2943–2957. [Google Scholar] [CrossRef]
- Gao, M.; Wang, B.; Yang, J.; Dong, W. Are peak summer sultry heat wave days over the Yangtze–Huaihe River Basin predictable? J. Clim. 2018, 31, 2185–2196. [Google Scholar] [CrossRef]
- Teng, H.; Branstator, G. Tropospheric waveguide teleconnections and their seasonality. J. Atmos. Sci. 2017, 74, 1513–1532. [Google Scholar]
- Sun, J. Record-breaking SST over mid-North Atlantic and extreme high temperature over the Jianghuai–Jiangnan region of China in 2013. Chin. Sci. Bull. 2014, 59, 3465–3470. [Google Scholar] [CrossRef]
- Skamarock, C.; Klemp, B.; Dudhia, J.; Gill, O.; Liu, Z.; Berner, J.; Wang, W.; Powers, G.; Duda, G.; Barker, D.M.; et al. A Description of the Advanced Research WRF Model Version 4.1 (No. NCAR/TN-556+STR); University Corporation for Atmospheric Research: Boulder, CO, USA, 2019. [Google Scholar]
- Xu, Z.; Han, Y.; Tam, C.-Y.; Yang, Z.-L.; Fu, C. Bias-corrected CMIP6 global dataset for dynamical downscaling of the historical and future climate (1979–2100). Sci. Data 2021, 8, 293. [Google Scholar] [CrossRef] [PubMed]
- Hong, S.Y.; Lim, J.J. The WRF single-moment 6-class microphysics scheme (WSM6). Asia-Pac. J. Atmos. Sci. 2006, 42, 129–151. [Google Scholar]
- Kain, J.S. The Kain–Fritsch convective parameterization: An update. J. Appl. Meteorol. 2004, 43, 170–181. [Google Scholar] [CrossRef] [Green Version]
- Niu, G.-Y.; Yang, Z.-L.; Mitchell, K.E.; Chen, F.; Ek, M.B.; Barlage, M.; Kumar, A.; Manning, K.; Niyogi, D.; Rosero, E.; et al. The community Noah land surface model with multiparameterization options (Noah-MP): 1. Model description and evaluation with local-scale measurements. J. Geophys. Res. 2011, 116, D12109. [Google Scholar] [CrossRef] [Green Version]
- Collins, W.; Rasch, P.; Boville, B.; McCaa, J.; Williamson, D.; Kiehl, J.; Briegleb, B.; Bitz, C.; Lin, S.-J.; Zhang, M.; et al. Description of the NCAR Community Atmosphere Model (CAM 3.0) (No. NCAR/TN-464+STR); University Corporation for Atmospheric Research: Boulder, CO, USA, 2004. [Google Scholar]
- Wang, P.; Tang, J.; Sun, X.; Wang, S.; Wu, J.; Dong, X.; Fang, J. Heat waves in China: Definitions, leading patterns, and connections to large-scale atmospheric circulation and SSTs. J. Geophys. Res. Atmos. 2017, 122, 10679–10699. [Google Scholar] [CrossRef]
- Liu, L.; Sun, L.; Liao, Y.; Zhu, Y.; Zou, X.; Wang, Y.; Yan, J. Development and application of national prediction system for extreme high temperature. Meteorol. Mon. 2008, 10. [Google Scholar]
- Wu, J.; Gao, X. A gridded daily observation dataset over China region and comparison with the other datasets. Chin. J. Geophys. 2013, 56, 1102–1111. [Google Scholar]
- Gao, X.-J.; Shi, Y.; Giorgi, F. Comparison of convective parameterizations in RegCM4 experiments over China with CLM as the land surface model. Atmos. Ocean. Sci. Lett. 2016, 9, 246–254. [Google Scholar] [CrossRef] [Green Version]
- Yu, E.; Wang, H.; Gao, Y.; Sun, J. Impacts of cumulus convective parameterization schemes on summer monsoon precipitation simulation over China. Acta Meteorol. Sin. 2011, 25, 581–592. [Google Scholar] [CrossRef]
- Yuan, Z.; Yin, J.; Wei, M.; Yuan, Y. Spatio-temporal variations in the temperature and precipitation extremes in Yangtze River Basin, China during 1961–2020. Atmosphere 2021, 12, 1423. [Google Scholar] [CrossRef]
- Song, S.; Yan, X. Changes in the frequency of extreme cooling events in winter over China and their relationship with Arctic oscillation. Sustainability 2021, 13, 11491. [Google Scholar] [CrossRef]
- Huang, Y.; Zhang, X.; Zhang, D.; Zhang, L.; Zhang, W.; Ren, C.; Pan, T.; Chu, Z.; Chen, Y. Spatial-temporal characteristics of Arctic summer climate comfort level in the context of regional tourism resources from 1979 to 2019. Sustainability 2021, 13, 13056. [Google Scholar] [CrossRef]
- Wei, W.; Zhang, R.; Wen, M.; Yang, S.; Li, W. Dynamic effect of the South Asian high on the interannual zonal extension of the western North Pacific subtropical high. Int. J. Clim. 2019, 39, 5367–5379. [Google Scholar] [CrossRef]
Figure 1.
The topography (m; shading) of the simulation domain. The black quadrilateral represents the YRB region, and the meanings of the abbreviations in the figure are as follows: SX, Shaanxi Province; HeN, Henan Province; AH, Anhui Province; JS, Jiangsu Province; SC, Sichuan Province; CQ, Chongqing Province; HB, Hubei Province; ZJ, Zhejiang Province; SH, Shanghai City; GZ, Guizhou Province; HuN, Hunan Province; JX, Jiangxi Province; and FJ, Fujian Province.

Figure 2.
(a) Anomalies of mean daily maximum tempeature at 2 m (°C) and anomalies in the number of (b) total HWEs (events), (c) short-lived HWEs (events), (d) long-lived HWEs (events), (e) short-lived HWDs (days), and (f) long-lived HWDs (days) during summer over the YRB region. The black dashed lines denote the linear trends, and the green solid lines represent the nine-year running average.

Figure 3.
Spatial distribution of the linear trend of summer mean (a) daily maximum temperature (°C/a), (b) total HWEs (events/a), (c) short-lived HWEs (events/a), (d) long-lived HWEs (events/a), (e) short-lived HWDs (days/a), and (f) long-lived HWDs (days/a) over the YRB region from 1981 to 2018. The dots indicate that the 90% confidence level was exceeded.

Figure 4.
Spatial distributions of the average Tmax (ºC) in summer from 1995 to 2014 for (a) model and (b) observation, (c) time series of the spatially averaged daily Tmax (°C) in the YRB during summer, and (d) time series of the total HWDs (days) in the YRB during summer.
Figure 4.
Spatial distributions of the average Tmax (ºC) in summer from 1995 to 2014 for (a) model and (b) observation, (c) time series of the spatially averaged daily Tmax (°C) in the YRB during summer, and (d) time series of the total HWDs (days) in the YRB during summer.

Figure 5.
The anomalies in (a) Tmax (°C), (b) total HWEs (events), (c) short-lived HWEs (events), and (d) long-lived HWEs (events) relative to the 1995–2014 reference period averaged over the YRB region. The time series were smoothed with a 9-year running mean filter.
Figure 5.
The anomalies in (a) Tmax (°C), (b) total HWEs (events), (c) short-lived HWEs (events), and (d) long-lived HWEs (events) relative to the 1995–2014 reference period averaged over the YRB region. The time series were smoothed with a 9-year running mean filter.

Figure 6.
Spatial distribution of the trend of summer mean (a), (e) daily maximum temperature (°C/a), (b), (f) total HWEs (events/a), (c), (g) short-lived HWEs (events/a), and (d), (h) long-lived HWEs (events/a) over the YRB region from 2015–2054 under (a–d) SSP245 and (e–h) SSP585. The dots indicate that the 90% confidence level is exceeded.

Figure 7.
The changes in (a), (c) Tmax (°C); (b), (f) HWEs (events); (c), (g) short-lived HWEs (events); and (d), (h) long-lived HWEs (events) for (a–d) SSP245 and (e–h) SSP585 over the 2035–2055 period relative to the 1995–2014 reference period. The dots indicate that the 90% confidence level is exceeded.

Figure 8.
The anomalies of geopotential height (gpm) of (a) 500 hPa and (b) 200 hPa relative to the 1995–2014 reference period averaged over the YRB region. The time series are smoothed with a 5-year running mean filter.
Figure 8.
The anomalies of geopotential height (gpm) of (a) 500 hPa and (b) 200 hPa relative to the 1995–2014 reference period averaged over the YRB region. The time series are smoothed with a 5-year running mean filter.

Figure 9.
Regressions of geopotential height anomalies (gpm) of (a,c,e,g) 500 hPa and (b,d,f,h) 200 hPa against the time series of (a,b,e,f) short-lived HWEs and (c,d,g,h) long-lived HWEs. Time series of short-lived HWEs and long-lived HWEs were standardized before the calculation. The dots indicate that the 90% confidence level is exceeded.

Publisher’s Note: MDPI stays neutral with regard to jurisdictional claims in published maps and institutional affiliations. |
© 2022 by the authors. Licensee MDPI, Basel, Switzerland. This article is an open access article distributed under the terms and conditions of the Creative Commons Attribution (CC BY) license (https://creativecommons.org/licenses/by/4.0/).
Share and Cite
MDPI and ACS Style
Gao, Z.; Yan, X. High-Resolution Regional Climate Modeling and Projection of Heatwave Events over the Yangtze River Basin. Sustainability 2022, 14, 1141. https://0-doi-org.brum.beds.ac.uk/10.3390/su14031141
AMA Style
Gao Z, Yan X. High-Resolution Regional Climate Modeling and Projection of Heatwave Events over the Yangtze River Basin. Sustainability. 2022; 14(3):1141. https://0-doi-org.brum.beds.ac.uk/10.3390/su14031141
Chicago/Turabian StyleGao, Zhibo, and Xiaodong Yan. 2022. "High-Resolution Regional Climate Modeling and Projection of Heatwave Events over the Yangtze River Basin" Sustainability 14, no. 3: 1141. https://0-doi-org.brum.beds.ac.uk/10.3390/su14031141
Note that from the first issue of 2016, this journal uses article numbers instead of page numbers. See further details here.