1. Introduction
Today, the world is attempting to contain the COVID-19 outbreak. Individuals’ day-to-day functioning has been impacted by the epidemic. Additionally, individuals, organizations, and enterprises are looking for novel ways to conduct operations remotely. This necessitates the development of new technologies that assist them in successfully sustaining their technique. The case study in this research is a contact center firm. The company’s bots and Interactive Voice Responses (IVRs) are meant to help companies improve customer loyalty and satisfaction while simultaneously cutting contact center operational expenses. Customer experience has become more crucial than ever for almost all companies as a result of new technology and a changing environment. Nowadays, chatbots, interactive voice response systems, and mobile assistants are commonly used to increase the customer experience across virtually all industries, including healthcare, banking, government, and insurance. All of these bots and IVRs require a certain level of technology to operate normally. At this level, speech recognition (SR) is crucial for converting speech to text, allowing a bot, interactive voice response system, or mobile assistant to comprehend what the user says along this journey. Choosing the right supplier of SR technology is critical since it enables the organization to enhance the customer experience by delivering an easy-to-manage and build conversational system. Another purpose for having the best SR technology is to let consumers to operate products with minimal effort. Not just for individual users, it simplifies the process of trancribing massive obligations incurred in sectors such as healthcare, insurance, and banking. Additionally, true SR technology is critical for organizations’ automation, which includes transforming complex IVR menus into customer-friendly systems, enhancing security, providing an alternative to touchtone menus for customers who prefer not to use touchtone menus, and lowering operational costs. The technology’s popularity has risen dramatically in recent years as a result of market requirements and opportunities. Choosing the appropriate provider of SR technology on a global scale has become a difficult process, since there are numerous vendors and numerous aims to accomplish. This study examined four suppliers on the basis of four primary criteria and twelve sub-criteria. These providers were chosen as the most sought-after suppliers of SR technology on the market. The criteria for choosing the best supplier from a group of four are based on the most critical aspects of all supplier’s products, the opinions of authorized people, and customer feedback. The essential characteristics addressed are quality, price, maintenance, and adaptability. The quality of SR technology is defined by the system’s accuracy in translating speech to text. A better level of precision translates into more precise automation for IVRs, medical assistants, and so on. For instance, if a speech recognition engine incorrectly recognizes a phrase, subsequent components may incorrectly recognize the user intent. It results in a negative customer experience and increased process costs due to a lack of automation. As a result, accuracy is used to quantify quality. Additionally, unit price and other costs are critical criterion for picking a supplier, as one of the constant constraints on businesses is budget. Additionally, maintenance is critical for developing long-term customer service systems. As a result, all system components must be maintained optimally and correctly. Finally, flexibility is critical, because even if a voice recognition system is the highest quality, the cheapest, or the easiest to maintain, it is not acceptable for a business if the provider does not support adequate integration or installation solutions. This investigation makes use of many criteria with finite options. Each selection includes qualitative and quantitative data, as well as details about the criterion and sub-criteria. Given these characteristics of the problem, VIKOR is chosen as the Multi Criteria Decision Making (MCDM) approach; however, to account for the effect of data uncertainty, this research incorporates intuitionistic fuzzy (IF) into VIKOR. Based on the research conducted by Kabak and Çınar [
1] in their book “Yönetimde çok kriterli karar verme yöntemleri,” VIKOR enables the management of numerous qualitative and quantitative factors in order to arrive at the optimal solution. VIKOR was chosen as the MCDM approach because it includes both positive and negative criteria for maximizing social benefit while minimizing individual regret. The IF approach assists in mitigating the influence of ambiguity in concepts that rely on decision makers’ judgment, whereas VIKOR ranks the possible outcomes and selects the closest to optimal outcome. Additionally, because of its parametric character and susceptibility to uncertainty, we use q-ROF TOPSIS as a secondary approach. Finally, we compare the two strategies’ outcomes and demonstrate their respective benefits. The contributions of this study are as follows:
- ➢
qualitative criteria for IT vendor selection are utilized in conjunction with quantitative criteria to evaluate speech recognition software; and
- ➢
the suggested technique quantifies verbal expressions and reduces ambiguity in decision making.
Although the necessity for automation is a very common topic because to COVID-19 and technology, the amount of study conducted across multiple disciplines is quite limited. Generally, IT research in the literature focuses exclusively on the solution’s unique criteria. Additionally, these criterion are predominantly quantitative data in the literature. For instance, the most often used criterion in the literature for comparing voice recognition providers is the word-of-error rate. However, there are numerous criteria for selecting the most suited source as a voice recognition supplier. Not only should the best provider be the highest quality or the cheapest, but it should also be the most adaptable and simple to use. Due to the uncertainty, qualitative data is critical as a criterion. As a result of this predicament, numerous supporter selection studies use not only quantitative but also qualitative data. On the other hand, there is a void in the literature for supplier selection problems in the IT industry using these criteria, despite the fact that research in the supplier selection field continues to grow at a rapid pace.
Numerous qualitative and quantitative criteria are evaluated in this study in order to eliminate uncertainty and provide a fresh perspective on the problem of supplier selection in the information technology industry.
The remainder of the investigation is as follows.
Section 2 reviews the literature. The challenge addressed by this study is defined in
Section 3 of the structural problem.
Section 4 discusses the IF-VIKOR and q-ROF TOPSIS methodologies.
Section 5 presents a case study of supplier selection and resolves it using two ways.
Section 6 discusses the case study’s findings, while
Section 7 outlines many conclusions and future research directions.
2. Literature Review
Supplier selection has been a significant study issue for a long period of time, and several studies have presented various strategies for selecting the best supplier depending on research topics and data types in the past [
2,
3,
4]. Although the majority of studies employed AHP, ANP, TOPSIS, and their combinations with the fuzzy set to choose the best supplier, VIKOR, DEMATEL, and ANOVA were also used often. VIKOR has been employed in over 750 supply chain management (SCM) studies over the last two decades, and there are over 500 researches on the intuitionistic fuzzy approach to SCM challenges [
5,
6]. According to research, VIKOR is typically used in conjunction with fuzzy AHP, fuzzy ANP linguistic information, fuzzy DEMATEL, ELECTRE, and BWM, and other fuzzy techniques, whereas intuitionistic fuzzy is typically used in conjunction with MULTIMOORA, AHP, PROMETHEE, UTASTAR, ELECTRE, and ANP.
Qun et al. [
7] solved a green supplier selection issue by integrating VIKOR and BWM in an interval type-2 fuzzy environment. They profited from the VIKOR approach for making multi-criteria decisions as well as the best-worst method for removing subjectivity. Awashi et al. [
8] solved a multi-tier supplier selection issue by combining VIKOR and fuzzy AHP techniques. The study defines the weights of criteria using fuzzy AHP and evaluates vendors using fuzzy VIKOR. Rouyendegh et al. [
9] examined the performance of suppliers using a hybrid AHP-IFT model. When using AHP as an MCDM approach, they rank decision makers (DMs) using intuitionistic fuzzy numbers. Rouyendegh et al. [
10] suggested an intuitionistic and fuzzy TOPSIS technique for solving the green supplier selection problem. IF is used in this study to reduce subjectivity in data collection from DMs. Pınar and Boran [
11] suggested a strategy for green supplier selection based on a q-rung orthopair fuzzy TOPSIS. Chen and Wang [
12] confirmed fuzzy VIKOR using a systematic and reasonable method for identifying partner problems in information systems and information technology projects. Rouyendegh [
13] validated a hybrid technique for supplier selection issues involving uncertainty and subjectivity by combining ANP and IF sets. Çalı and Balaman [
14] recommended integrating VIKOR and ELECTRE 1 in order to utilize supplier assessment in an unclear area. Kumar et al. [
15] examine how integrated AHP, TOPSIS, and Taguchi loss functions can be used to solve the supplier selection problem for India’s heavy locomotive manufacturer. The problem specifies quality, lead, and cost as requirements. Baset et al. [
16] proposed using a hybrid Neutrosophic ANP and VIKOR to choose a suitable provider in an uncertain environment and with limited knowledge. ANP is used to calculate the weights of the main and sub-criteria, and then VIKOR is used to select the optimum solution. Kamalakannan et al. [
17] suggested that a TOPSIS approach be used to solve the supplier selection problem, taking into consideration not only profit but also green management. Memari et al. [
18] describe a sustainable supplier selection problem with multi-criteria problem is solved using intuitionistic fuzzy TOPSIS technique. There are nine primary, and thirty sub-criteria are evaluated in the problem.
The study examines supplier outranking using a Multi Criteria Group Decision Making environment. The following table summarizes the results of a literature review conducted in order to rate voice recognition products. The overview of the literature review on supplier selection is shown in
Table 1, along with the MCDM techniques utilized in each research. In
Table 2, WER (word-error-rate) denotes the product’s accuracy level, process performance denotes the product’s real-time factor (speed), file format denotes the variety of file formats supported by the product, and multi-language denotes the variety of languages supported.
Technical comparisons of SR technology suppliers have historically emphasized quantitative criteria in the literature. Kim et al. 2019 rank five speech-to-text engine providers according to their accuracy, word-error rates, and performance. The research uses a variety of audio kinds to conduct evaluations in a variety of audio formats. Herchonvicz et al. [
21] investigated several measuring methodologies for ranking engines according to their performance. Different accents within a same language are also discussed in the research. Mahmoudi et al. [
25] introduced fuzzy TOPSIS and OPA in a large-scale MCDM with missing data for project selection. The literature indicates that research is mostly focused on developing new algorithms or approaches to improve accuracy or on deploying voice recognition solutions to various industries. While there is research comparing the accuracy of different speech recognition engines, there is a lack of research comparing them using different criteria. The clustering requirements are defined using Principal Component Analysis, the clustering alternatives are determined using the K-Algorithm, and the clusters are ranked using fuzzy TOPSIS and OPA.
In light of the review, VIKOR is advantageous because it enables the ranking of all alternatives closest to the ideal based on the greatest group benefit and the least individual regret using not only positive but also negative criteria that incorporate intuitionistic fuzzy logic to eliminate uncertainty. Additionally, q-ROF TOPSIS approaches enable decision-makers to express themselves more freely than most other ways for dealing with uncertainty.
3. Structuring the Problem
In this section, an MCDM technique is used to pick a provider for a voice recognition engine. Additionally, the IF set is utilized to generate a decision matrix in order to mitigate the influence of DMs’ subjective judgment. The problem is stated in this study as selecting the best voice recognition supplier for a business’s IVR and Virtual Assistant solutions. Speech recognition positions are available in this solution for converting speech to text in order to automate the procedure and improve the client experience. Thanks to speech recognition, the system can comprehend what the user has said and assist in defining the next stage in the dialog flow. For instance, when customers contact the company’s customer service, the IVR prompts the user, “What transaction do you wish to initiate?” The consumer then responds, “I want to pay off my credit card debt.” As a result, the customer support system may direct the user to the appropriate menu without involving any human resources. In this case, speech recognition is the engine that interprets what the user says and communicates it to the other components.
There are numerous factors for selecting the best supplier for these solutions, and numerous limits obstruct all of them. As a result, it transforms into a multi-criteria decision-making problem with restricted alternatives and several objectives.
3.1. Current State
According to the analysis of the literature, as indicated in
Table 1, scientific measuring techniques and algorithms are typically employed to rank speech recognition engines. The primary limitation of these techniques is that they can only take into account quantitative data. As a result, this study sought to overcome this restriction by including qualitative factors into the problem. Additionally, as indicated before in the introductory part, the product is a core technology, which means it continually improves with the advancement of machine learning technologies.
3.2. Suggested Improvements
Due to the gap identified in the literature analysis, this study applies the MCDM technique to the quantifiable and unmeasurable factors of the supplier selection problem for SR goods. It is supplied to account for unquantifiable characteristics, so that purchasers may be certain they did not simply address a few. As a result, this paper proposes a hybrid technique for addressing restrictions inherent in the current state of the supplier selection problem for products in the information technology industry. The literature is combed in order to choose the best appropriate MCDM approach. The supplier selection challenge is represented in
Table 2 based on a survey of the literature. The table defines the most often used criteria and approaches. The methods outlined below is advised in light of studies. After defining the problem in the preceding section, the primary criteria are created using a combination of a literature assessment of SR performance and evaluations and general supplier selection research. The purpose of merging this research is to provide a novel way to evaluating speech recognition services that takes into account existing research limits on handling. The most often used primary criteria in the literature are quality (accuracy rate), cost, maintenance, and adaptability, which are listed in
Table 2. After determining the primary criteria, as seen in
Figure 1, sub-criteria for these primary criteria are developed. The accuracy sub-criteria are specified as word-error rate and technical leadership. The word-error-rate is included as a sub-criterion since it is the most widely used and quantifiable metric for determining the effectiveness of speech recognition (ref. if any). Technological leadership is included as a sub-criterion since speech recognition is a critical technology that should be constantly improved with the addition of new AI and machine learning technologies. Similarly, cost sub-criteria include recognition cost (the price of a product) and hardware expenses. Because the cost of SR technology may be classified into two categories based on unit cost and hardware cost, they are included as sub-criteria under the cost in this study. These two charges are substantial since they have a direct impact on the total cost. Following that, sub-criteria for maintenance include support activities, workflow tools, the number of supported format types, and the capacity to handle all accents. Workflow tool is picked as a sub-criterion due to its ability to facilitate product integration, development, and testing. Collaboration is facilitated by sharing workflow tools with the consumer. Support activities are critical while selecting an SR supplier due to the product’s maintenance in the event of an issue. Solving problems at the appropriate time is critical for enterprises to provide positive customer experiences. The number of supported formats is one of the indicators of a product’s adaptability, as various AI and conversational products may demand a different sort of output or input. The ability to handle all dialects is critical when picking a provider, as it avoids additional expenditures and a lack of quality when separate language models are necessary for different accents. When transcribing a call from a financial company’s contact center, for example, your representative may talk in American English while the consumer speaks in Indian English. Finally, for the flexibility criteria, numerous languages, experienced industries, integration capabilities, and ease of deployment were chosen as sub-criteria. Multiple language support and industry experience are viewed as critical features of a product by all suppliers, and hence are included as sub-criteria. Integration capabilities enables enterprises who utilize the SR product to lower their integration costs, while quick deployment enables these organizations to reduce their maintenance costs.
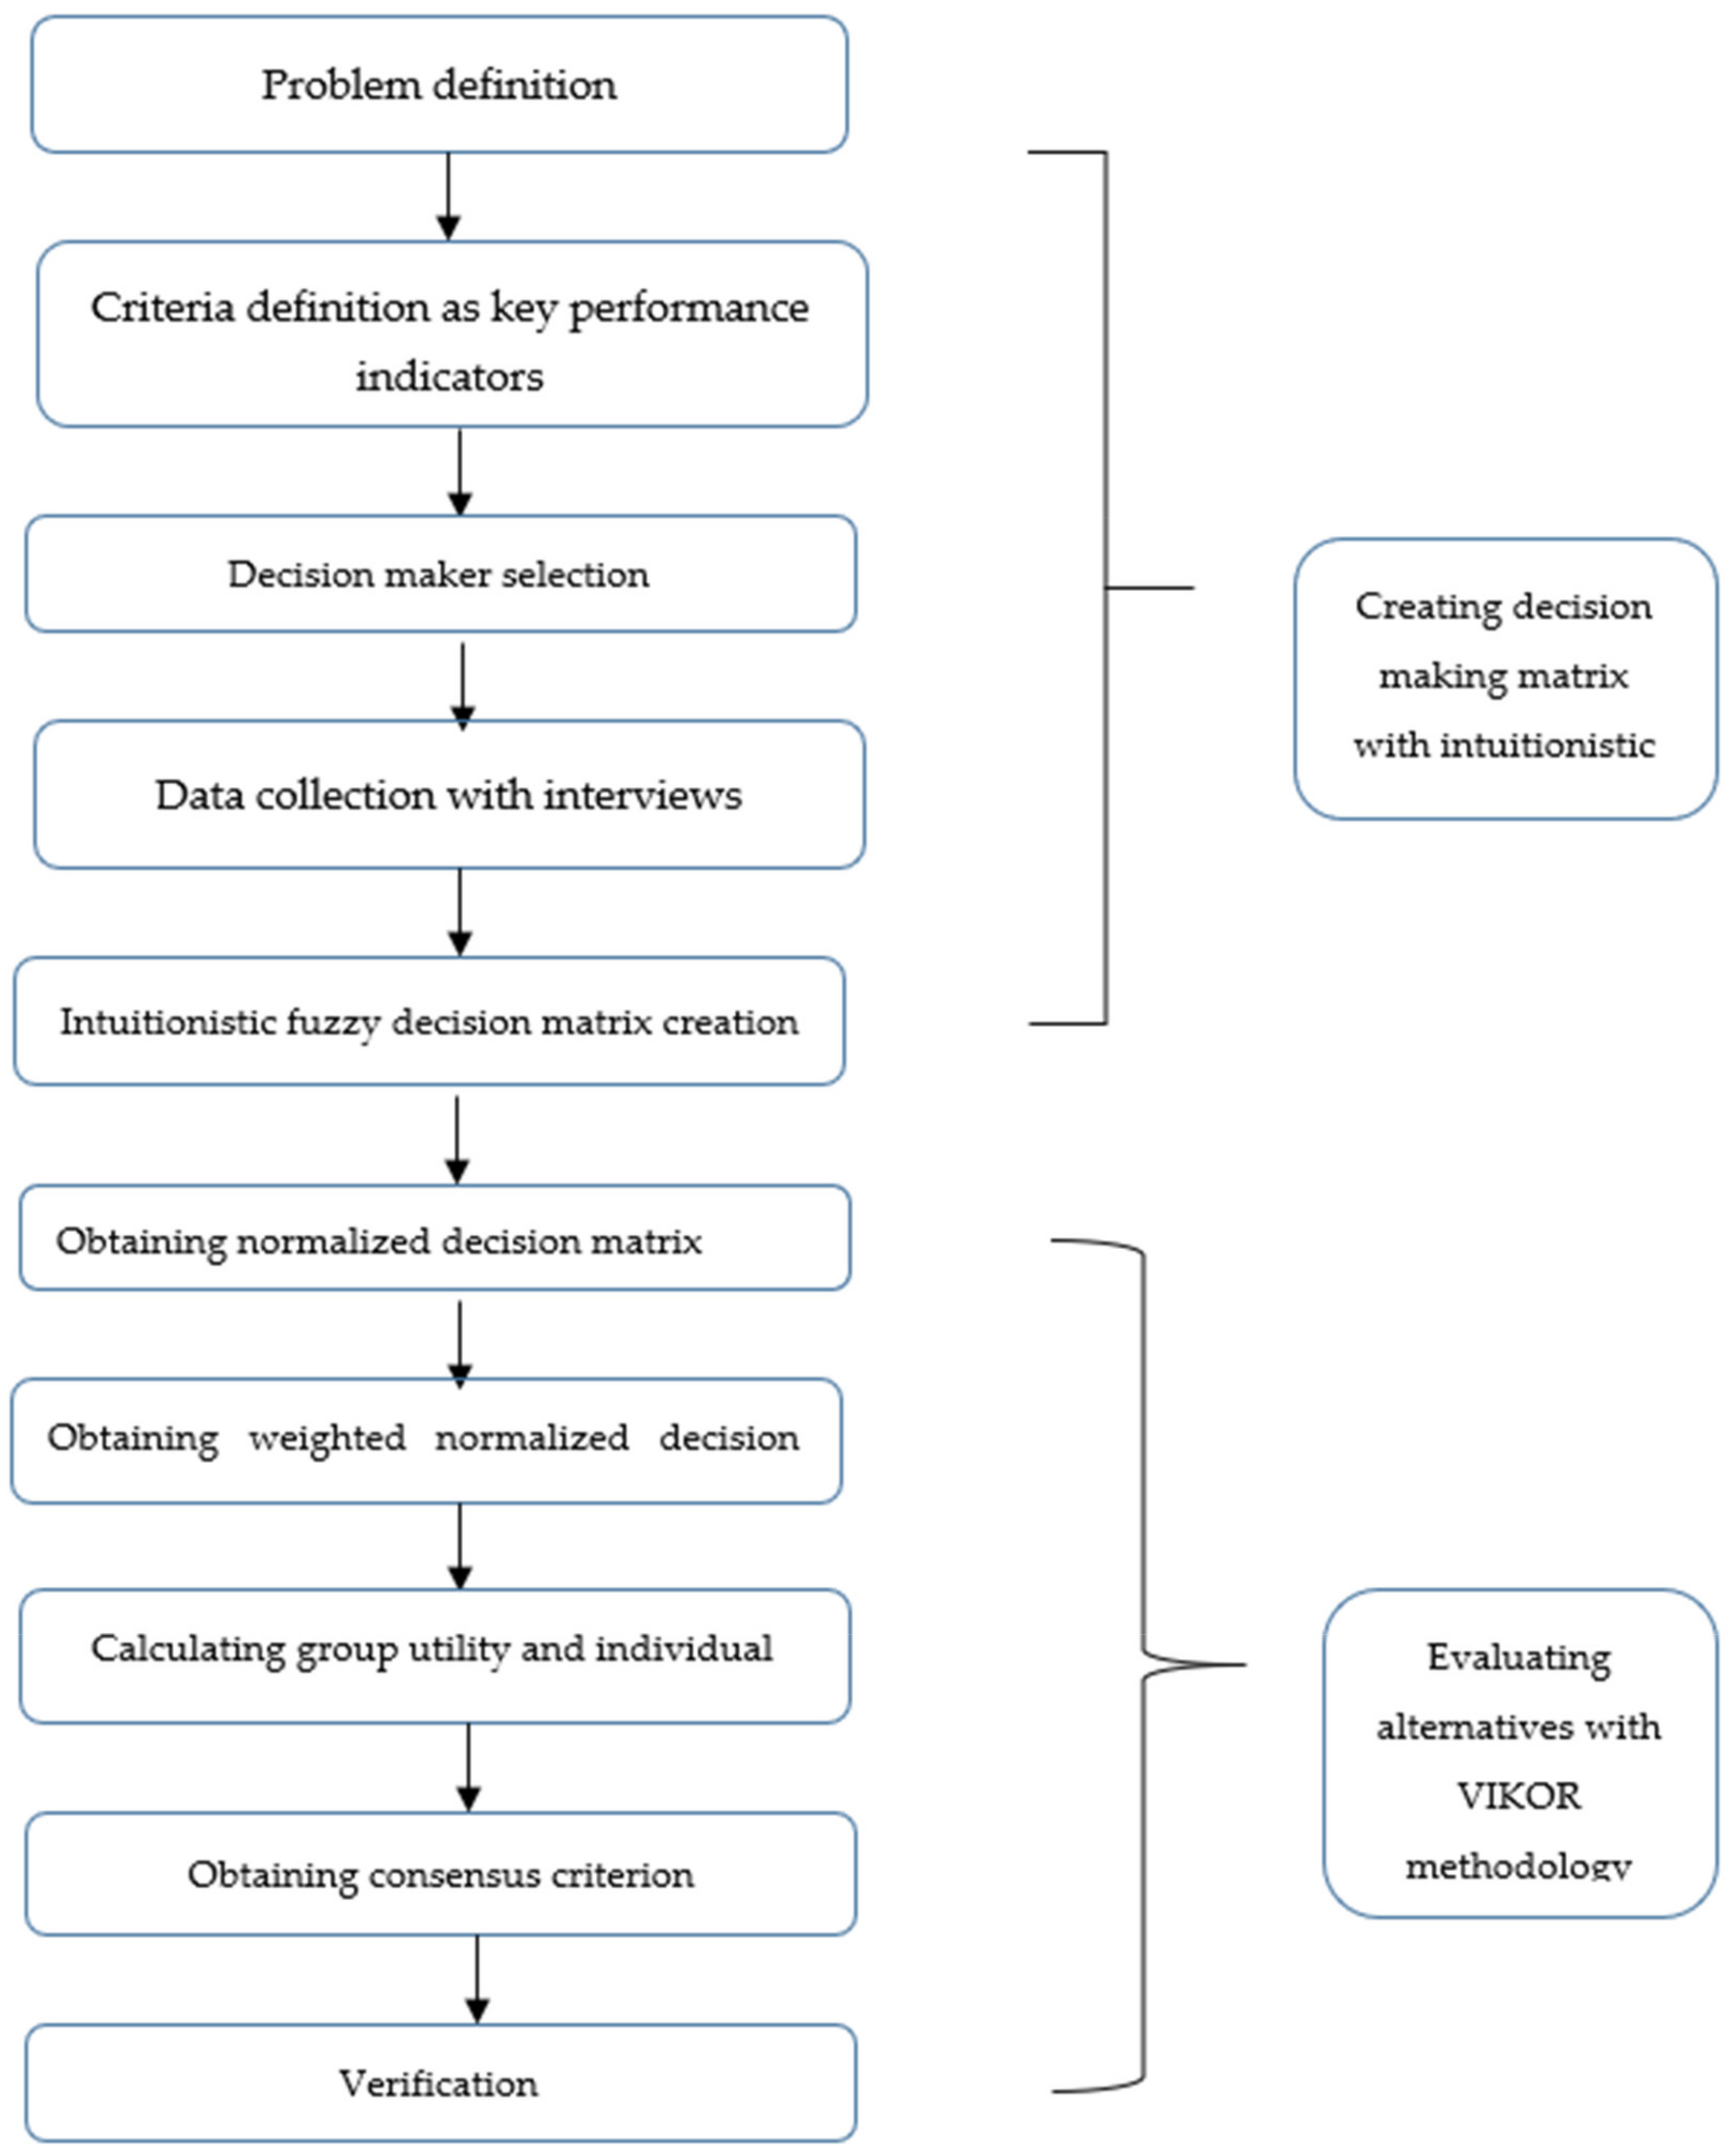
Because the problem in this research contains more than one criterion with finite options, MCDM approaches can be used to solve it. VIKOR is used as the MDCM approach in our study, and owing to the presence of both quantitative and qualitative data, intuitionistic fuzzy logic is incorporated into the process to reduce ambiguity. In summary,
Figure 2 depicts a systematic technique.
4. Constructing the Decision Model
There are quantifiable and unquantifiable factors in this study, and data is collected from DMs, therefore subjectivity should be excluded while generating the decision matrix. Comparisons with other types of MCDM approaches might be conducted to bolster the study’s credibility. The study’s appeal can be enhanced by combining the results of all compared techniques into a single figure. VIKOR and q-ROF are used in an uncertain environment to cover all of these data. To deal with ambiguity, an intuitive fuzzy technique is adopted. Following the creation of a decision matrix, the alternatives are rated using the VIKOR method. Additionally, a model based on the q-ROF TOPSIS is used to evaluate the performance of the approaches.
4.1. Intuitionistic Fuzzy Sets
Fuzzy sets provide ranking membership with grading scores from 0 to 1. Based on the study of [
9], basic concepts of IF set is defined as A= {(r,
(r),
⋮ r∈R}, while
(r) is membership degree of function,
(r) is not membership.
In fuzzy set, summation of these functions should be greater than or equal to 0 and less than or equal to 1. Also,
(r) is the intuitionistic fuzzy index—belonging to
A.
where
(r) is the uncertainty of r to A for every r ∈ R
(r) defines the degree of uncertainty. Having more knowledge of r, the number should be smaller.
4.2. q-Rung Orthopair Fuzzy Sets
After IF sets, Yager [
11] introduced Pythagorean fuzzy sets, membership and non-membership degrees (
a,
b) such that
a,
b ∈ [0, 1] as follows:
He proposed a q-ROF subset A of X, is given as below:
where
is membership degree and
is non-membership degree of
to the set A with the condition given below:
The degree of hesitancy in q-ROF sets is indicated with
and defined as
Therefore, q-rung orthopair fuzzy set (q-ROFs) is a generalized version of IF (q = 1) and Pythagorean fuzzy (q = 2) sets.
4.3. IF-VIKOR
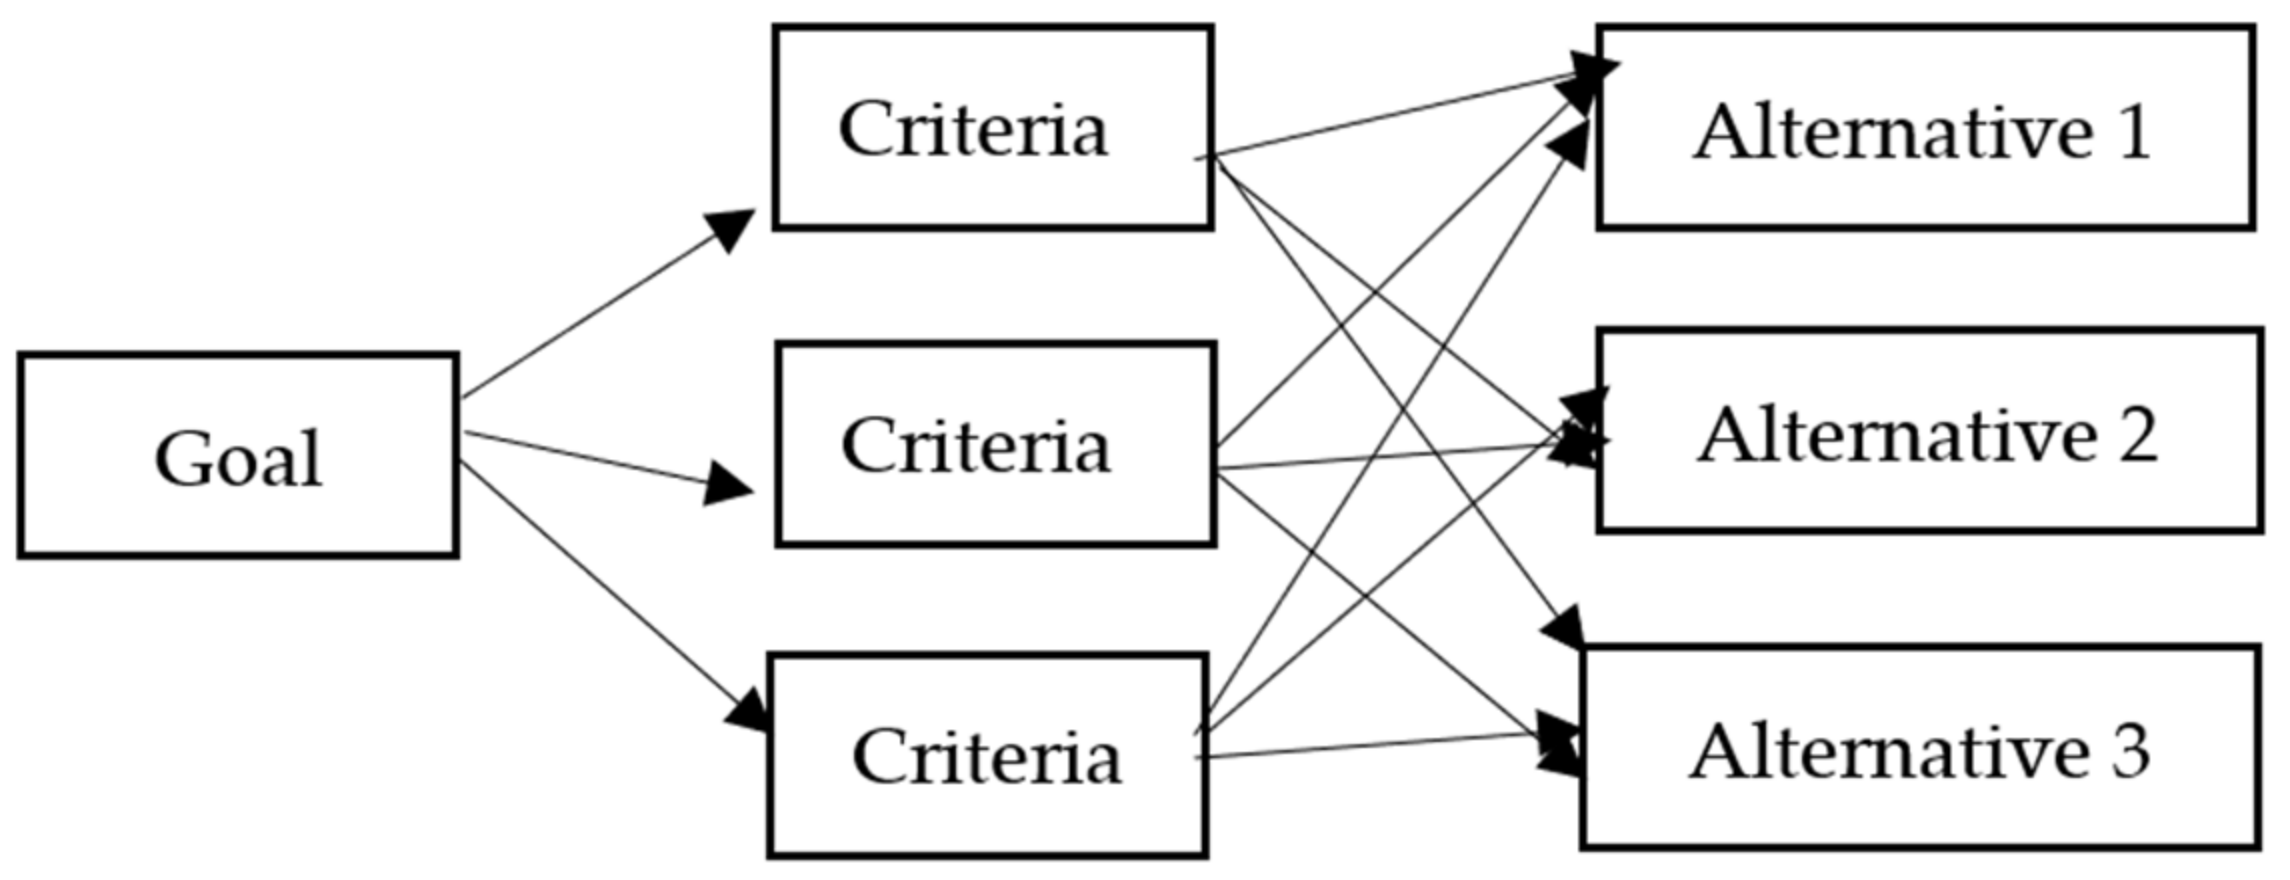
Step 1. To use VIKOR methodology at first it is necessary to identify goal, criteria and alternatives. As discussed before, the goal is to identify the best supplier of IT product and the criteria for the selection were elucidated in
Section 3. The alternative here represents the available suppliers;
Figure 3 depicts a First step of VIKOR:
Step 2. To obtain a decision matrix using IF method for each alternative based on the defined criteria and sub-criteria. In the
Step 3. The decision matrix obtained in step two is normalized with the following equations of intuitionistic fuzzy methodology. Normalization is necessary to avoid the effect of different unit related to various criteria and sub-criteria.
Step 4. The decision matrix is weighted reflecting the effect levels of the criteria on the decision.
refers to elements of weigthed normalized decision matrix as ith alternative and jth criteria.
Step 5. Individual regret and group utilities are calculated. Group utility (
Si) refers to the total weighted normalized value to be obtained if the alternative is selected which means best situation, while individual regret (
Ri) indicates the largest record that will occur based on a criterion if the alternative is not selected which means worst.
Step 6. Ranking indexes (
Qi) are computed. The consensus criterion is calculated to ensure that group utility and individual regret criteria are combined in order to decide between alternatives.
Step 7. the best alternatives are ranked. For verification, it is examined if the results meet the conditions below or not.
First condition: Advantage Acceptance
Suppose that the alternative with the lowest Qi value has the Q (a’) value, the second-best alternative (Q (a”)) and DQ value is defined as equal to 1/(m − 1).
Second condition: Stability Acceptance
The choice with the best Qi value should also be the best alternative from the point of group benefit and/or individual regret criteria.
When both conditions are fulfilled, the Qi value is determined as the best alternative with compromise solution. Only if Condition 1 is satisfied, two alternatives with the best consensus criterion value will be determined as the best solution. If Condition 1 is not verified, all alternatives up to the next alternative are determined as compromise solutions until mth confirms the condition based on the following expression which is met the requirement.
4.4. q-ROF TOPSIS Method
Let
be a set of alternatives and
be a set of criteria, the modified q-ROF TOPSIS method [
21] steps are given below:
Step 1. Aggregate the DMs ratings and obtain a decision matrix.
First, DMs evaluate the vendors with the linguistic terms. These terms are then converted to q-ROFNs. Suppose
is a group of q-ROF numbers which are aggregated with DM weights (
) with the help of q-ROFWA operator below [
21]
q-ROF decision matrix is as follows:
where , .
Step 2. Calculate the weights for the criteria.
To determine the evaluation criteria’s significance degrees (
Wj), all language words scored by DMs are translated to q-ROFNs using Equation (17):
Step 3. Create a decision matrix that is weighted.
The aggregated weighted q-ROF decision matrix is created using the methods presented in Equation (18): [
26]:
is an element of the matrix where .
Step 4. Determine the Positive and Negative Ideal Solutions:
q-ROF Positive Ideal Solution (q-ROFPIS,
A*) maximizes the benefit and minimizes the cost, contrarily, q-ROF Negative Ideal Solution (q-ROFNIS,
) minimizes the benefit and maximizes the cost. So, let
, be benefit and cost criteria respectively.
A* (q-ROFPIS) and
(q-ROFNIS) is obtained with the below formula:
where,
Step 5. calculate the separation measures and calculate the relative closeness.
In order to determine the separation between ratings of vendors, a q-ROF distance measure as proposed by Pınar and Boran [
11] is used. The separation measures,
Si* and
, are determined by Equations (24) and (25) respectively.
where
p = 1, 2, …, n and
After separation measures are determined, the relative closeness coefficient (
) is calculated with Equation (25):
Step 6. Compare the available vendors and choose the best one.
Descending order of ’s gives the ranking of alternatives.
5. Case Study
A case study is offered to demonstrate the feasibility of combining the IF and VIKOR techniques. As a buyer in this case study, a call center organization has a supplier selection challenge. Alternatives are chosen based on candidates speaking the same language, proposing similar answers, and possessing a comparable level of accuracy.
5.1. Application of IF and VIKOR Method
Three DMs who work at the buyer company as a software developer, product owner, and researcher are chosen for our case study and are denoted in the following sections as D, PO, and R. Additionally, DMs are weighted in the case study for their expertise in the purchasing department based on their skills and experiences. The ordered weights of DMs are 0.35, 0.4, and 0.25. Job descriptions and opinion of the decision makers are considered while determining weight of them. The Product Owner carries the most weight, as s/he is the one who is most knowledgeable about the solutions. Following that, developer has the second highest weight due to its superior knowledge of maintenance, adaptability, and security. Finally, due to his or her knowledge of speech recognition technology, the researcher is chosen as the decision-maker with the lowest weight. These DMs assessed four suppliers using the given criteria and sub-criteria. The linguistic terms are listed in
Table 3, and the linguistic weights assigned to each criterion are listed in
Table 4.
The evaluation results based on the linguistic terms are shown in
Table 5 and
Table 6.
In first step, IF decision matrix is determined by SIFWA operator and results are shown in
Table 7. Following formula is used.
is calculated based on Equation (10) which is explained previous section.
In the formula i represent alternatives, j represents criteria, and k represents DMs.
In second step, normalized decision matrix and criteria weights are calculated and figured in
Table 8.
Normalized decision matrix is obtained by Equation (27).
Also, IF best and worst ideal solutions are obtained as shown in
Table 8. In case study, while unit price and hardware & software cost criteria are considered as cost, the others are benefit.
Fj* (0.9,0.07) (0.87,0.07) (0.9,0.1) (0.85,0.06) (0.6,0.2) (0.74,0.1) (0.88,0.06) (0.87,0.07) (0.9,0.1) (0.88,0.08) (0.84,0.06) (0.9,0.07)
Fj- (0.55,0.41) (0.62,0.26) (0.32,0.57) (0.75,0.12) (0.32,0.57) (0.45,0.46) (0.61,0.3) (0.28,0.56) (0.44,0.52) (0.69,0.17) (0.62,0.26) (0.52,0.42)
Next, IFE value for all sub-criteria are determined according to objective weighting approach. Results are as shown in
Table 9.
Then, weight is calculated by following equation.
W =
ɵ+(1−θ)
, θ is decided as 0.5 in the study for simplicity. The effect of changing the value of θ is analyzed in the sensitivity analysis
Section 5.2, shown at
Table 10.
Group utility and individual regret is calculated by following equation. Si, Ri and Qi are calculated based on the Equations (12)–(14), shown at
Table 11 and
Table 12.
Condition 1: Acceptable advantage
Alternative 2 has the best Qi value with 0 and alternative 3 is the second-best. Therefore,
DQ = 1/(4 − 1) = 0.33 and Q3 − Q2 = 0.28 − 0 = 0.28, 0.42 < 0.33 so it does not provide acceptable advantage condition.
When looking at the third-best which is alternative 1, Q1 − Q2 = 0.57 − 0 = 0.57 so it provides the condition.
Condition 2: Sustainability acceptance in result
Alternative 2 has the best individual regret value, too.
As a result, alternative 2 is obtained as the best alternative in this study with providing two acceptable conditions of VIKOR method.
5.2. Sensitivity Analysis for IF-VIKOR Method
Because the study considers both collective utility and individual regret to be equally important, is defined as 0.5. A ratio greater than 0.5 indicates that collective utility is more important, whereas a value less than 0.5 indicates that individual regret is more essential. Although the value is frequently expressed as 0.5 in the literature, it may also be expressed as 0.25 or 0.75. As a result, this section of the study examines the effects of various parameter values.
For θ is equal to 0;
Q3 − Q2 = 0.271584 − 0 = 0.272, which is smaller than DQ. So, Q1−Q2 = 0.872−0 = 0.872, which is greater than DQ. Therefore, solution is defined as alternative 2 and alternative 1. It means that the DMs can select any one of them. Moreover, still alternative 2 is best for individual regret and sustainable acceptance requirement is met, too.
For θ is equal to 0.25;
Q3 − Q2 = 0.28 − 0 = 0.28 and 0.28 < 0.33, so continue to next step that is Q1−Q2. The difference is equal to 0.72 that means it met the condition. Therefore, DMs can select either alternative 2 or alternative 1.
For θ is equal to 0.75;
Q3 − Q2 = 0.29 − 0 = 0.29 and 0.29 < 0.33, so continue to next step that is Q1−Q2. The difference is equal to 0.42 that means it met the condition. Therefore, DMs can select either alternative 2 or alternative 1.
For θ is equal to 1;
Q1 − Q2 = 0.27 − 0 = 0.27, which is smaller than DQ. In second step Q3−Q2 = 0.3 which is again smaller than 0.33. So, move to the third step i.e., Q4 − Q2 = 1, the value of which is greater than DQ. Therefore, with this value DMs cans select alternative 2 or alternative 4.
As a result, calculations show that alternative 2 is best for all values of the parameter θ, but second option is changed when θ is equal to 1. It means, if only group utility is considered as important, then alternatives can change.
5.3. Application of q-ROF TOPSIS Method
Our second method q-ROF TOPSIS is applied to the same problem, with the DMs weights assumed to be [0.35, 0.4, 0.25] as in IF-VIKOR method. In q-ROF TOPSIS nine-level scale is used for linguistic terms of criteria (
Table 13) and alternatives (
Table 14).
Step 1. Aggregate the DMs ratings.
DMs evaluations in linguistic terms are converted to q-ROFNs with the help of
Table 14. The ratings of the alternatives in q-ROFNs are shown in
Table 15.
These q-ROFNs are aggregated with DM weights with q-ROFWA operator given in Equation (16). We get an aggregated q-ROF decision matrix, as below.
Step 2. Calculate the importance weights of the criteria.
DMs ratings in linguistic terms for criteria weights are converted into q-ROFNs and aggregated with the help of Equation (17). 12 Criteria weights are calculated as [w1 = 0.108, w2 = 0.097, w3 = 0.057, w4 = 0.059, w5 = 0.093, w6 = 0.086, w7 = 0.085, w8 = 0.078, w9 = 0.071, w10 = 0.084, w11 = 0.097, w12 = 0.084]
Step 3. Set up a weighted decision matrix.
Weighted aggregated q-ROF decision matrix is determined as below:
Step 4. Determine the Positive and Negative Ideal Solutions:
All criteria other than C3 (Unit price dollar/min) and C4 (Hardware & software cost) are benefit criteria. This stage involves determining the intuitionistic fuzzy positive ideal solution IFPIS and the intuitionistic fuzzy negative ideal solution IFNIS. Assume that J1 and J2 are benefit and cost criteria, respectively. So, with the help of Equations (19)–(23) the q-ROFPIS (A*) and the q-ROFNIS (
) were calculated as follows:
Step 5. Determine the separation measures.
The separation measures, S
i* and
, are determined by Equation (24) with the help of the distance measure proposed by Pinar and Boran [
11] and given as
Table 16:
5.4. Sensitivity Analyses in q-ROF TOPSIS
A sensitivity analysis is performed to see the effects of parameter
q in q-ROF TOPSIS. For q = (2, 3, 4, 5, 6, 7, 8, 9, 10) the values of closeness coefficient for vendors are presented in
Table 17. It can be easily seen that the increase in q values does not change the rank of the alternatives. We take p = 1 and q = 3 which are the most stable parameters for this method [
11].
As seen in
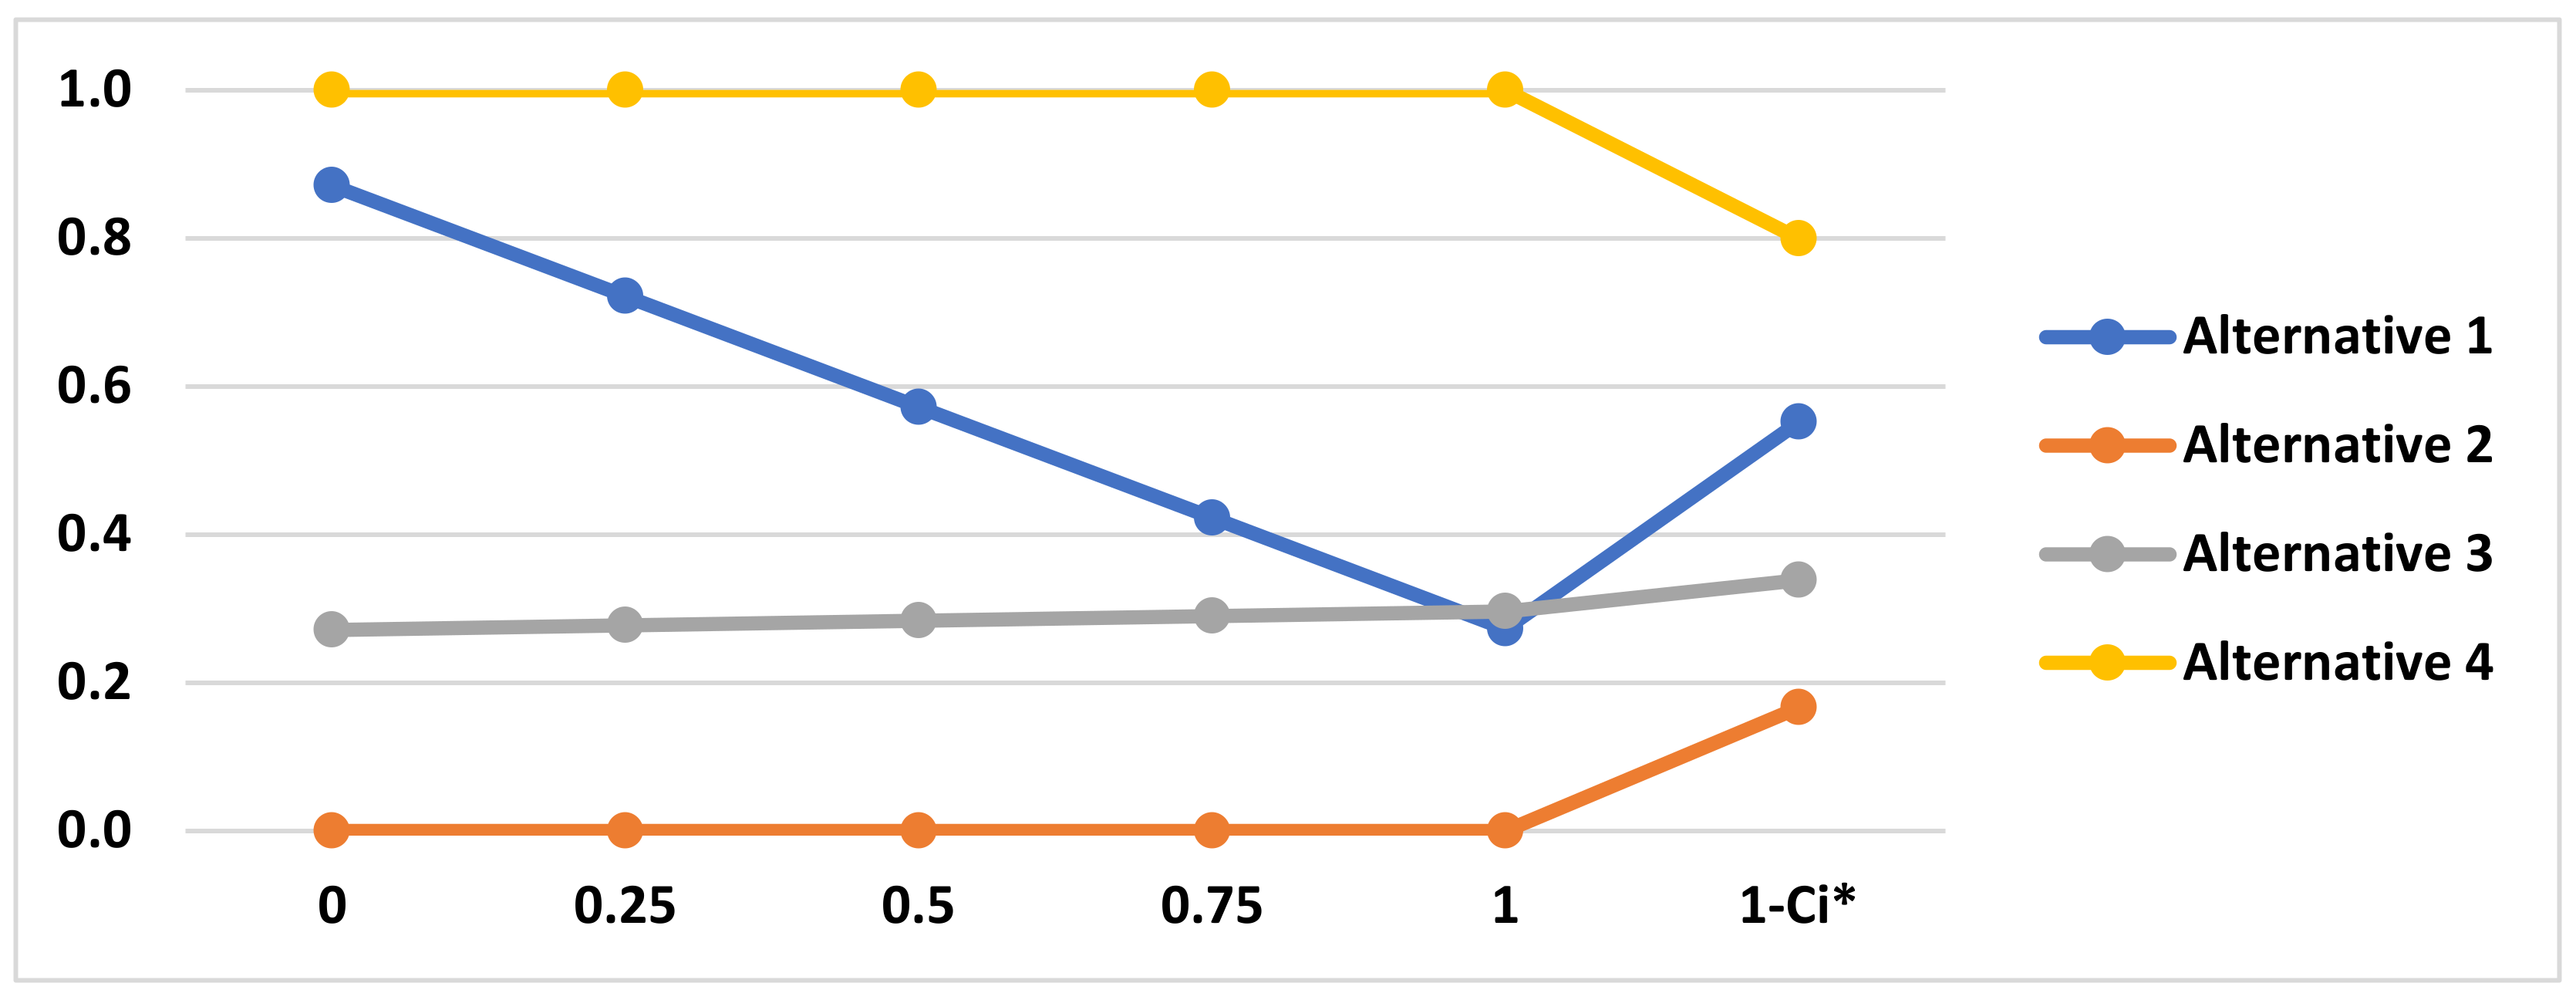
Figure 4, the outcomes of both approaches are consistent, with the exception of =1 in the IF-VIKOR method, which favors Alternative 1 over Alternative 3. When we compare the two approaches, we see that whereas IF-VIKOR produces varied rankings due to its structure containing group utility and regret parameters, the q-ROF TOPSIS ranking results remain constant regardless of the q parameter’s value. A nine-level scale facilitates the conversion of language concepts to q-ROF values, therefore quantifying verbal assessment and decreasing uncertainty. IF-VIKOR also generates extreme values of 0 and 1, but q-ROF TOPSIS produces moderate values.
6. Results and Discussion
In this study, we use two different methodologies, IF-VIKOR and q-ROF TOPSIS for speech recognition software supplier selection. We compare these methods in
Figure 4 and the results are given in
Table 18. To make the results q-ROF TOPSIS compatible with IF-VIKOR methods’, Ci* values are normalized as 1-Ci*.
7. Conclusions
Organizations should automate their operations in today’s market, since competitiveness is more difficult than ever. Automation procedures may be implemented effectively and simply with the help of modern technologies such as machine learning and artificial intelligence. Remote communication between consumers and suppliers, in particular, is critical in light of unpredictable disruptive occurrences such as Covid-19. Additionally, selecting the best supplier has been a major concern for companies and researchers for years. While selecting a supplier for important processes typically requires passing many criteria, many reputable suppliers may meet multiple criteria to differing degrees in today’s reality. At this stage, the problem transforms into one of MCDM in an uncertain environment. When studying such a challenge, a company in the customer interaction industry is chosen. The firm develops products such as bots and interactive voice response systems and requires Speech Recognition technology for its mobile applications, which it does not control. The problem is described as supplier selection in this study, and the four most often used primary criteria and twelve sub-criteria are chosen. The DMs rated four suppliers in issue structuring based on their experiences and certain test findings. A hybrid IF-VIKOR and q-ROF TOPSIS technique is used in the decision model. IF enables the evaluation of four possibilities in a fuzzy environment and the ranking of the alternatives according to the decision makers’ preferences. As a result, subjectivity and ambiguity are eliminated. Following that, VIKOR evaluates the options using group utility and individual regret levels. After analyzing the issue description, a case study is conducted. As a consequence of the IF-VIKOR approach used in this section, Alternative 2 is determined to be the most suited option, with the highest Qi value and least individual regret. It provides a method for vendors to assess while taking into account the pros and downsides of many criteria. As a second technique, the identical problem is solved using the q-ROF TOPSIS method. The rankings of alternatives produced by q-ROF TOPSIS are similarly consistent with those produced by IF-VIKOR, since it produces steady and moderate results, whereas IF-VIKOR produces extreme outcomes. As the purpose of this study is to fill a vacuum in the literature about the evaluation of voice recognition technologies using both quantifiable and non-quantifiable criteria, both techniques support both of these criteria kinds. A nine-level scale, particularly in q-ROF TOPSIS, is used to transform linguistic concepts to q-ROF numbers, quantifies verbal utterances, and reduces ambiguity.
Other Fuzzy MCDM methodologies may be applied to the selection of IT suppliers in the future. Additionally, precise security requirements might be included in the problem definition, since information security becomes increasingly critical as big data and cloud applications become more prevalent.
8. Discussions and Future Research
The study attempted to bridge a gap in the literature by analyzing multiple types of criteria simultaneously. After a variety of approaches is applied, alternative 2 is determined to be the best choice. According to the majority of decision makers, the outcome is appropriate for reality because the alternative has the highest quality level and technological leadership. In the future, the problem could be expanded to include primary security criteria, as security is becoming increasingly important as personal information becomes more easily accessible. Securing personal information is a critical and challenging issue for all suppliers. Additionally, protecting the solution from cyber-attacks is a critical security problem to provide uninterrupted service. Additionally, limitations can be expanded in future study to bring them closer to real-world issues.


