
Development of a Multicriteria Scheme for the Identification of Strategic Areas for SUDS Implementation: A Case Study from Gijón, Spain

 , ,
, ,  , ,
, ,  , and
, and
Abstract
:1. Introduction
2. Materials and Methods
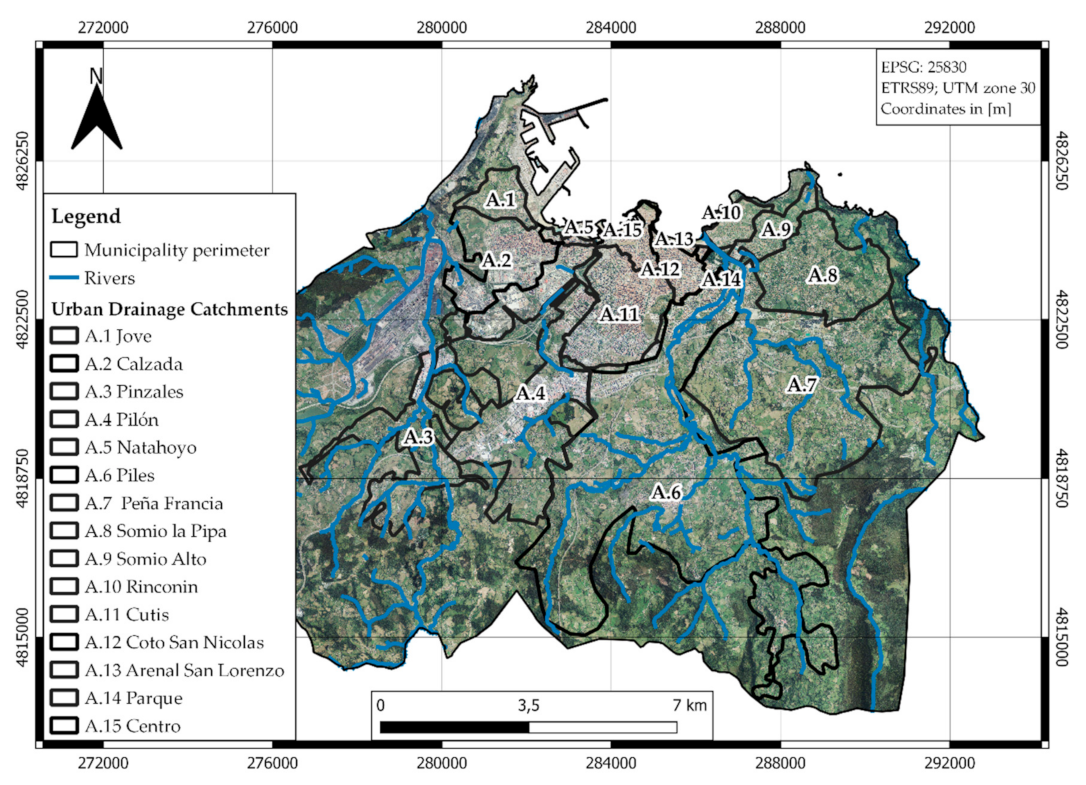
2.1. Study Area
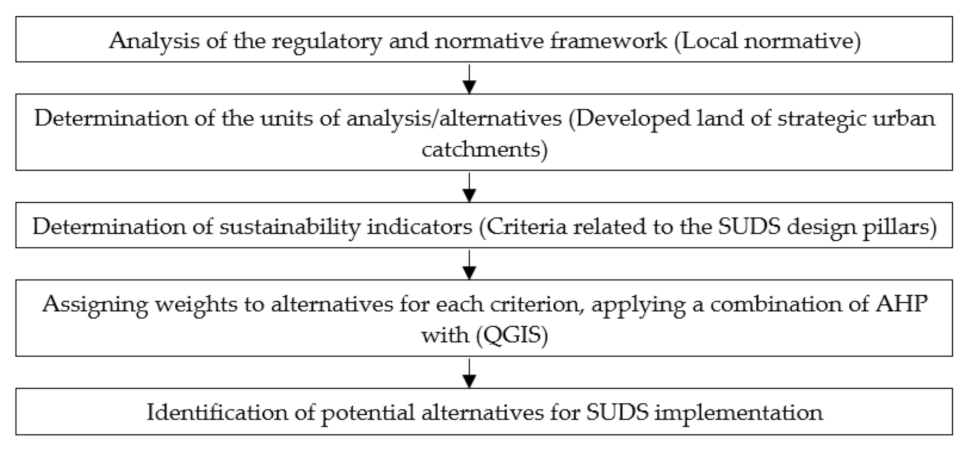
2.2. Methodology
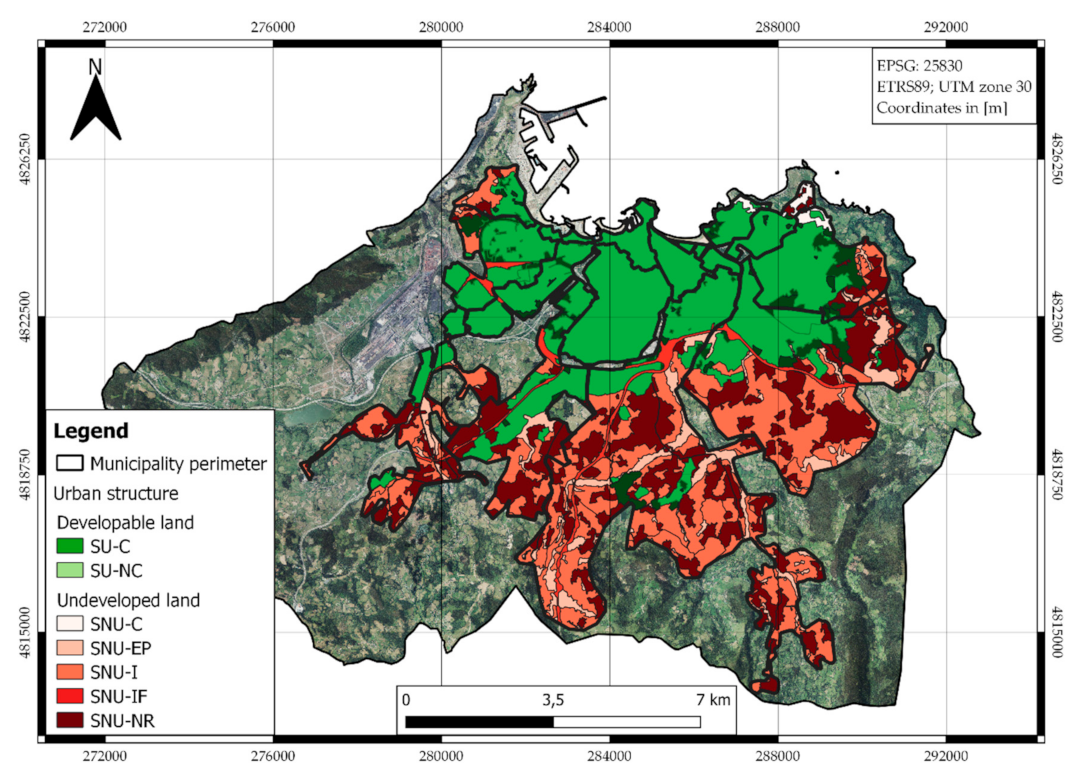
2.2.1. Analysis of the Local Normative and Assessment of the Alternatives
- Special protection land (SNU-EP): land with important ecological and environmental values that must be preserved from development;
- Land of interest (SNU-I): land that includes agricultural, livestock and forestry activities, as well as the facilities associated with these activities;
- Coastal land (SNU-C): corresponds to that delimited by the Special Territorial Plan for Undeveloped Coastal Land;
- Infrastructure land (SNU-IF): land occupied by basic or transport infrastructures, in addition to those destined for public or social interest facilities;
- Rural core land (SNU-NR): non-developable spaces in the rural area of the municipality.

2.2.2. Assessing Criteria
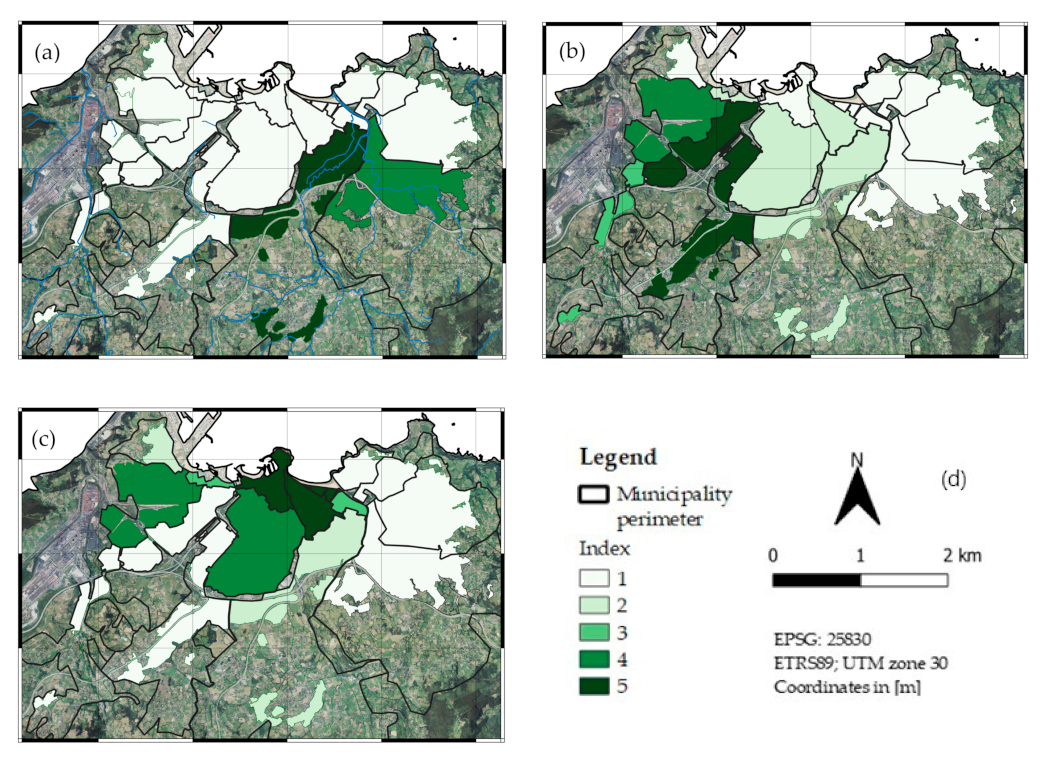
- WQN1: This criterion refers to the vulnerability of the different alternatives to river and coastal flooding. It helps in the measurement of problems associated with stormwater management in coastal and river environments, which is the case for the studied area. The analysis of these problems was carried out using open access data from the Spanish National Geographic Information Centre of the Ministry of Transport, Mobility and Urban Agenda [83]. The cartography included in this service contains the areas defined as flood zones associated to return periods in vector format (shapefile). Spatial data related to the high probability scenario, with a return period of 10 years, have been used as a usual return period for SUDS’ practices and urban drainage [74,84]. Moreover, the overflow surface area of the receiving bodies and the percentage of flooding surface were calculated for each alternative. The following rating points were assigned depending on the different levels of risks: (1) no risk, (2) low (3) medium, (4) high, (5) very high;
- WQN2: the second criterion proposed was the estimated installed capacity of the municipality’s sewerage system for receiving runoff volumes. The data required for this analysis were also provided by EMASA. These data contain information on the typology, materials, diameters and length of the pipes, level and date of installation. In addition, information is provided about the wells, sinks and sewers across the municipality. The density of the drainage elements per surface area and their capacity were estimated with the aim to assess the capacity of the sewerage network for each alternative. On the one hand, the volume of the reception pipes in each alternative were estimated, considering the total length of their connection lines and drains with their diameters. Furthermore, the density of the sumps, wells, and manholes per km2, responsible for collecting the volumes of surface runoff, was also calculated. Then, applying the AHP method, the relevance of each alternative was computed from this information. The rating points applied to the capacity of the sewerage system are listed as follows: (1) very high, (2) high, (3) medium, (4) low, (5) very low;
- WQN3: the inflow or treatment volume and the capacity criteria is the result of the application of the Water Quality Captured Volume (WQVC) methodology [85]. Using this method, the actual runoff factor of each alternative was obtained from its percentage of effective impervious area and a coefficient corresponding to the drainage time (WQVC) [86]. The percentage of impervious area for each alternative has been estimated from a complete classification of land uses. This categorization was developed through a manual process of verification and editing of the polygons corresponding to each land use by means of satellite images. A drainage time of 40 h was selected to provide an effective pollutant removal, which is the value generally used for the brim-full basin and to obtain the standard water quality [87]. Nevertheless, this drainage time can be reduced for some SUDS such as those in which the removal of pollutants is mainly achieved through filtration. Then, it was decided to set the same value for the whole case study in order to be on the safe side. Once the runoff depth had been determined, it was multiplied by the upstream tributary catchment area and by a factor to account for the additional 20% of required storage for sediment accumulation [88]. Then, the following scoring system was applied based on the runoff depth and the influent volume: (1) very low, (2) low, (3) medium, (4) high and (5) very high;
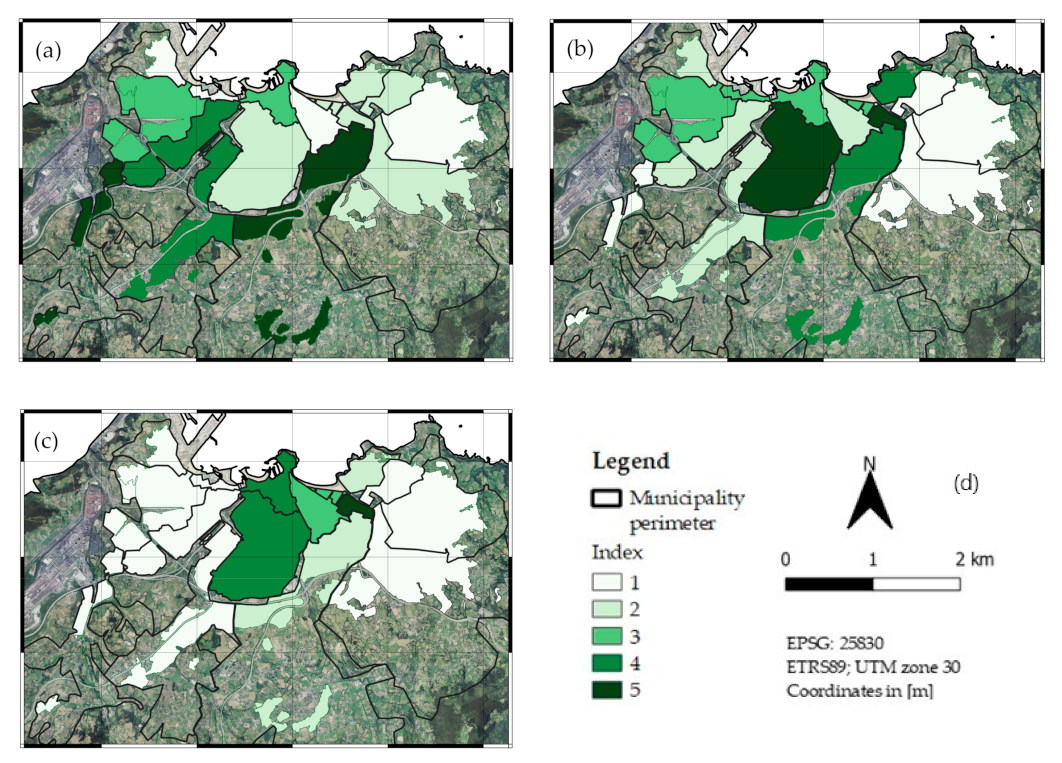
- WQL1: The analysis of the criteria related with the qualitative status of Gijón’s water bodies was carried out using different sources, prioritizing the results provided by the Cantabrian Hydrographic Confederation (CHC) in its program of monitoring for the Piles river basin. The analysis of the water quality on the San Lorenzo beach and the lower course of the river Piles, carried out by EMASA and the Department of Environment of Gijón City Council in October 2019 [89,90,91], were also considered and incorporated in the analyses. It is important to mention that no data are available on the water quality status of the other significant watercourse in the study area; such is the case of the Pinzales river. However, this river runs for most of its course outside the domain of the case study and, except for intense rainfall episodes, its average flow is not significant in comparison with the rivers belonging to the Piles basin [92]. Therefore, the general approach to this criterion was to compare the quality condition of these water bodies and to associate them to the area of each alternative. The following quality determinants for this analysis were involved in the water bodies assessment: Ammonium, Biochemical Oxygen Demand (BOD), Chemical Oxygen Demand (COD), Total Phosphorus, Nitrates, Suspended Solids, Total Coliforms, Enterococci and Escherichia coli. As a consequence, the following rating points were assigned based on Tsuzuki (2014) [93]: (1) no data are available for this alternative, (2) low, (3) medium, (4) high (5) very high;
- WQL2: This criterion helps in the estimation of the level of contribution to the alteration of the physical–chemical characteristics of the surface runoff volumes from each land use to the study area. A classification was elaborated following the nomenclature of the European CORINE (Coordination of Information of the Environment) Land Cover project, using open access data from the Ministry for Ecological Transition and the Demographic Challenge [83]. The main sources of water quality degradation in urban areas include various activities, which are considered by the municipality of Gijon, such as residential, industrial, abandoned mining areas, commercial and recreational activities [94,95,96]. The land uses that have been studied in this phase are listed below according to their degree of impact on water quality: industrial, mining, continuous urban fabric, discontinuous urban fabric, commercial and recreational facilities. The percentage of surface area of these land uses has been determined for each of the 15 alternatives. The following scoring system was proposed based on the sources of discharge to surface runoff: (1) non-significant, (2) low, (3) medium, (4) high and (5) very high;
- WQL3: This criterion assesses the relationship between land uses and water quality. Another main cause of diffuse pollution in urban areas is population growth and migration. There is a correlation between population density and diffuse pollution, usually depicted as an additional person in a given area representing an extra demand for productive resources, and thus additional waste, added to that caused by the maintenance of the life process [97]. Therefore, the higher the population density, the greater the diffuse pollution [98]. The number of people per square kilometer was determined for each of the 15 alternatives in order to analyze this criterion. The following rating points were given based on the diffuse pollution associated to the population density: (1) very low, (2) low, (3) medium, (4) high and (5) very high;
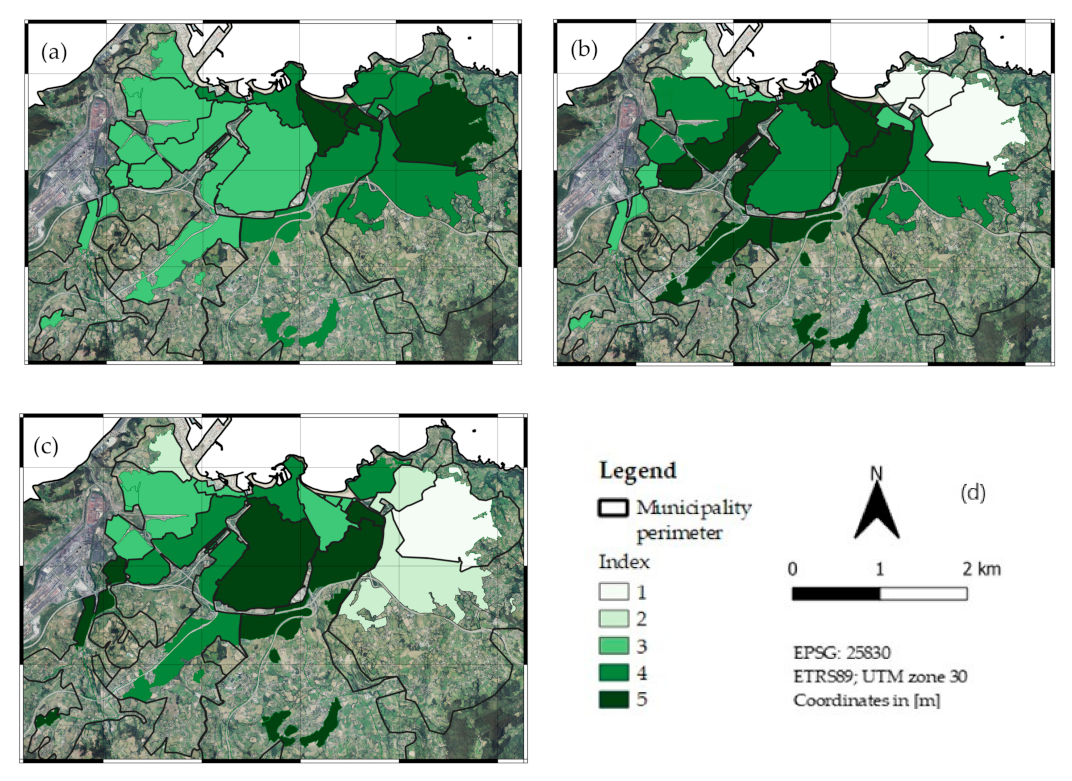
- AB1: This criterion refers to those areas that show greater deterioration and would potentially undergo urban redevelopment or new urbanization processes in the near future. The implementation of SUDS in those areas that pose a significant amenity and biodiversity deficit will produce a higher social and environmental impact. In addition, those areas that are included in new processes of urbanization present higher viability for implementation. The analysis of the urban structure of the municipality carried out, based on the general urban development plan, has been key to identify those areas that are going to be associated with urban redevelopment [76]. Therefore, the following rating points were proposed: (1) very low, (2) low, (3) medium, (4) high and (5) very high;
- AB2: This criterion is based on the percentage of public green spaces present on each alternative. SUDS implementation in those alternatives with a higher percentage of green spaces would improve the efficiency of the spatial distribution of the urban area and incentivize their implementation. The spatial data from the Electronic Cadastral Office of the Ministry of Finance [99], was fundamental to identify green areas under the public domain (e.g., parks, squares, roads). Moreover, a manual process of verification and editing of the Spatial Data Infrastructure offered by the Gijón City Council [100] was key to complete the analyses. Finally, the renaturation of watercourses was considered from an environmental standpoint, and green and blue green corridors were identified. The rating system used in this case was as follows: (1) very low, (2) low, (3) medium, (4) high and (5) very high;
- AB3: this criterion shows the percentage of public spaces for each alternative. Public spaces have been identified and classified using the open access data of the Electronic Cadastral Office of the Ministry of Finance [99]. This classification has been carried out taking into account the areas where the implementation of SUDS could be viable. Such areas were divided into the following options: communication routes (i.e., roads, pedestrian paths, cycle paths, service roads and planned new roads), green areas, green-blue corridors and parking lots. It was necessary to carry out a manual process of verification and editing of the polygons corresponding to each typology studied from satellite images in order to classify these public spaces, the reason being that the imported initial data were incomplete. Then, the rating system used in this case was: (1) very low, (2) low, (3) medium, (4) high and (5) very high.
2.2.3. Multi-Criteria Analysis
3. Results and Discussion
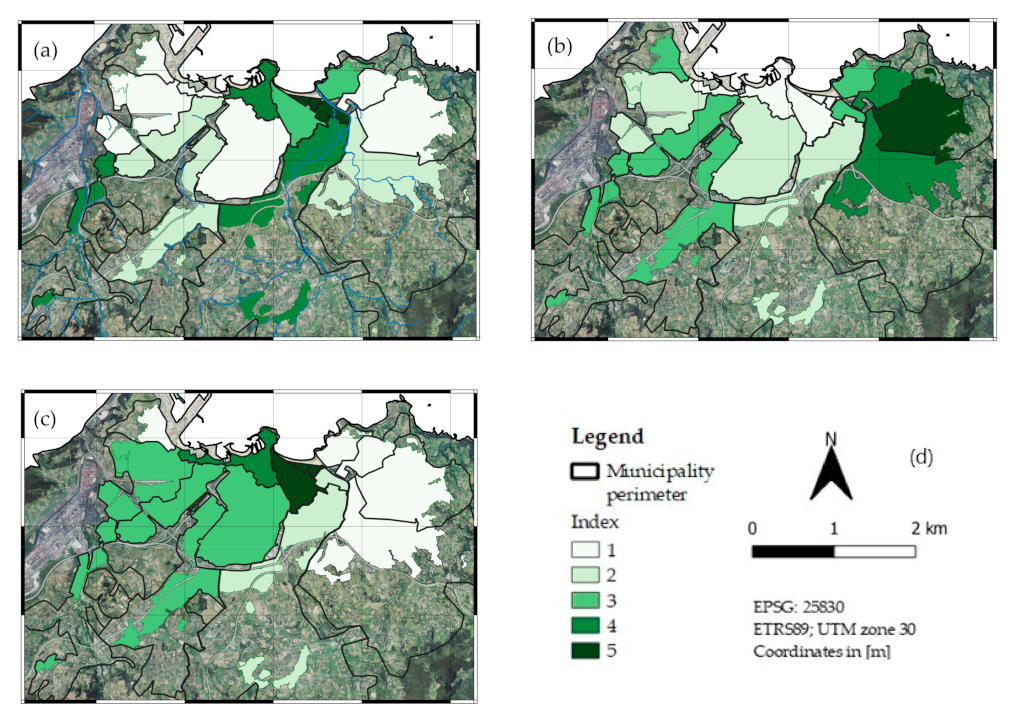
3.1. Water Quantity
3.2. Water Quality
3.3. Amenity and Biodiversity
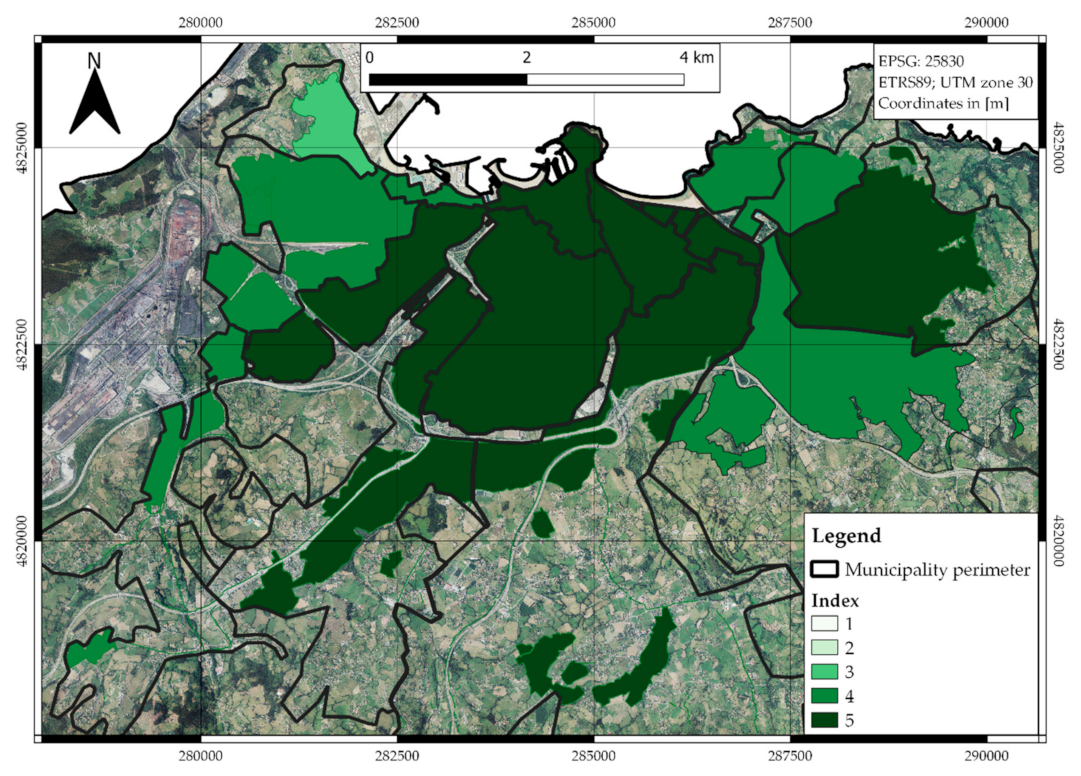
3.4. Priority Areas for SUDS
4. Conclusions
Author Contributions
Funding
Acknowledgments
Conflicts of Interest
References
- United Nations. World Urbanization Prospects 2018; United Nations: New York, NY, USA, 2018; ISBN 9789211483185. [Google Scholar]
- Ministerio de Fomento Áreas Urbanas en España. Constitución, Cuarenta años de las ciudades españolas. Minist. Fom. 2018, 1, 1–42. [Google Scholar]
- Goerlich Gisbert, F.J.; Reig Martínez, E.; Albert Pérez, C.; Robledo Domínguez, J.C. Las Áreas Urbanas Funcionales en España. Economía y Calidad de Vida; FBBVA: Bilbao, Spain, 2020; pp. 1–394. ISBN 9788492937806. [Google Scholar]
- Meng, L.; Wang, L.; Hou, Y.; Yan, G. A research on low modulus distributed fiber optical sensor for pavement material strain monitoring. Sensors 2017, 17, 2386. [Google Scholar] [CrossRef] [PubMed] [Green Version]
- The City of Edmonton. Low Impact Development Best Management Practices Design Guide Edition 1.1; The City of Edmonton: Edmonton, AB, Canada, 2014; ISBN 978-1-61779-267-0. [Google Scholar]
- Roodsari, B.K.; Chandler, D.G. Distribution of surface imperviousness in small urban catchments predicts runoff peak flows and stream flashiness. Hydrol. Process. 2017, 31, 2990–3002. [Google Scholar] [CrossRef]
- Battiata, J. The Importance of Imperviousness. Watershed Prot. Tech. 1996, 1, 100–111. [Google Scholar]
- Brabec, E.; Schulte, S.; Richards, P.L. Impervious Surfaces and Water Quality: A Review of Current Literature and Its Implications for Watershed Planning. J. Plan. Lit. 2002, 16, 499–514. [Google Scholar] [CrossRef]
- Lee, J.H.; Bang, K.W.; Ketchum, J.H.; Choe, J.S.; Yu, M.J. First flush analysis of urban storm runoff. Sci. Total Environ. 2002, 293, 163–175. [Google Scholar] [CrossRef]
- Al Mamoon, A.; Jahan, S.; He, X.; Joergensen, N.E.; Rahman, A. First flush analysis using a rainfall simulator on a micro catchment in an arid climate. Sci. Total Environ. 2019, 693, 133552. [Google Scholar] [CrossRef]
- Lehmann, J.; Coumou, D.; Frieler, K. Increased record-breaking precipitation events under global warming. Clim. Change 2015, 132, 501–515, Erratum in Clim. Change 2015, 132, 517–518. [Google Scholar] [CrossRef]
- State Meteorological Agency (AEMET). AEMET Status Report of the Climate in Spain (2019); State Meteorological Agency (AEMET): Madrid, Spain, 2019; Volume 1, p. 88. [Google Scholar]
- Willems, P.; Vrac, M. Statistical precipitation downscaling for small-scale hydrological impact investigations of climate change. J. Hydrol. 2011, 402, 193–205. [Google Scholar] [CrossRef]
- Beceiro, P.; Brito, R.S.; Galvão, A. The contribution of NBS to urban resilience in stormwater management and control: A framework with stakeholder validation. Sustainability 2020, 12, 2537. [Google Scholar] [CrossRef] [Green Version]
- Herslund, L.; Mguni, P. Examining urban water management practices—Challenges and possibilities for transitions to sustainable urban water management in Sub-Saharan cities. Sustain. Cities Soc. 2019, 48, 101573. [Google Scholar] [CrossRef]
- Zhou, Q. A review of sustainable urban drainage systems considering the climate change and urbanization impacts. Water 2014, 6, 976–992. [Google Scholar] [CrossRef]
- Bian, G.D.; Du, J.K.; Song, M.M.; Xu, Y.P.; Xie, S.P.; Zheng, W.L.; Xu, C.Y. A procedure for quantifying runoff response to spatial and temporal changes of impervious surface in Qinhuai River basin of southeastern China. Catena 2017, 157, 268–278. [Google Scholar] [CrossRef]
- Franco-Torres, M.; Rogers, B.C.; Harder, R. Articulating the new urban water paradigm. Crit. Rev. Environ. Sci. Technol. 2021, 51, 2777–2823. [Google Scholar] [CrossRef]
- Al Mamun, A.; Shams, S.; Nuruzzaman, M. Review on uncertainty of the first-flush phenomenon in diffuse pollution control. Appl. Water Sci. 2020, 10, 1–10. [Google Scholar] [CrossRef] [Green Version]
- Pérez, F.P.; Gutiérrez, J.F.P. Agua y medio ambiente. Obs. Medioambient. 2006, 9, 9–25. [Google Scholar] [CrossRef]
- AEAS. Informe sobre Aguas Residuales en España; Asociación Española de Abastecimientos de Agua y Saneamiento: Madrid, Spain, 2017; pp. 1–22. [Google Scholar]
- EU. Council Directive 91/271/EEC Concerning Urban Waste Water Treatment; EC: Brussels, Belgium, 1991; Volume 28. [Google Scholar]
- Court of Justice of the European Union. Judgment in Case C-205/17; Court of Justice of the European Union: Luxembourg, 2018. [Google Scholar]
- The World Bank Group. Guide to Climate Change Adaptation in Cities; World Bank: Washington, DC, USA, 2011. [Google Scholar]
- Ingram, J.; Hamilton, C. Planning for Climate Change: Guide—A Strategic, Values-Based Approach for Urban Planners; UN-HABITAT: Nairobi, Kenya, 2014; ISBN 9789211324006. [Google Scholar]
- United Nations. Transforming Our World: The 2030 Agenda for Sustainable Development; United Nations: New York, NY, USA, 2015. [Google Scholar]
- United Nations. The Millennium Development Goals Report; UN: New York, NY, USA, 2015; Volume 124. [Google Scholar]
- United Nations. Sendai Framework for Disaster Risk Reduction 2015–2030; UN: New York, NY, USA, 2015; Volume 144. [Google Scholar]
- Ministerio de Fomento. Agenda Urbana Española; Government of Spain: Madrid, Spain, 2019.
- Palazzo, E. From water sensitive to floodable: Defining adaptive urban design for water resilient cities. J. Urban Des. 2019, 24, 137–157. [Google Scholar] [CrossRef]
- Teshome, M. A Review of Recent Studies on Urban Stormwater Drainage System for Urban Flood Management. Preprints 2020, 100, 295. [Google Scholar] [CrossRef]
- Government of South Australia Institutionalising. Water Sensitive Urban Design Technical Manual; GSA: Adelaide, Australia, 2009.
- Mysiak, J.; Henrikson, H.J.; Sullivan, C.; Bromley, J.; Pahl-Wostl, C. The Adaptive Water Resource Management Handbook; Routledge: London, UK, 2013; ISBN 9781134039500. [Google Scholar]
- Global Water Partnership Policy Brief. Integrated Urban Water Management (IUWM): Toward Diversification and Sustainability; GWP: Stockholm, Sweden, 2013; pp. 1–4. [Google Scholar]
- Bahri, A. Integrated Urban Water Management by Akiça Bahri; GWP: Stockholm, Sweden, 2015; ISBN 9789185321872. [Google Scholar]
- Choi, L.; Mcilrath, B. Policy Frameworks for Water Sensitive Urban Design in 5 Australian Cities; Monash University: Clayton, Australia, 2017. [Google Scholar]
- Wong, T.H.F. An Overview of Water Sensitive Urban Design Practices in Australia. Water Pract. Technol. 2006, 1. [Google Scholar] [CrossRef]
- Furlong, C.; Dobbie, M.; Morison, P.; Dodson, J.; Pendergast, M. Infrastructure and urban planning context for achieving the visions of integrated urban water management and water sensitive urban design. In Approaches to Water Sensitive Urban Design: Potential, Design, Ecological Health, Urban Greening, Economics, Policies, and Community Perceptions; Elsevier: Amsterdam, The Netherlands, 2018; pp. 329–350. ISBN 9780128128435. [Google Scholar]
- Zevenbergen, C.; Fu, D.; Pathirana, A. Transitioning to Sponge Cities: Challenges and Opportunities to Address Urban Water Problems. Water 2018, 10, 1230. [Google Scholar] [CrossRef] [Green Version]
- Fletcher, T.D.; Shuster, W.; Hunt, W.F.; Ashley, R.; Butler, D.; Arthur, S.; Trowsdale, S.; Barraud, S.; Semadeni-Davies, A.; Bertrand-Krajewski, J.L.; et al. SUDS, LID, BMPs, WSUD and more—The evolution and application of terminology surrounding urban drainage. Urban Water J. 2015, 12, 525–542. [Google Scholar] [CrossRef]
- Brown, R.R.; Keath, N.; Wong, T.H.F. Urban water management in cities: Historical, current and future regimes. Water Sci. Technol. 2009, 59, 847–855. [Google Scholar] [CrossRef] [PubMed]
- European Commission. Nature-Based Solutions and Re-Naturing Cities. Final Report of the Horizon 2020 Expert Group on Nature-Based Solutions and Re-Naturing Cities; EC: Luxembourg, 2015; ISBN 9789279460517. [Google Scholar]
- Davis, M.; Naumann, S. Making the Case for Sustainable Urban Drainage Systems as a Nature-Based Solution to Urban Flooding; Springer: New York, NY, USA, 2017; ISBN 9783319537504. [Google Scholar]
- UE. DIRECTIVE 2000/60/EC; EEA: Copenhagen, Denmark, 2000. [Google Scholar]
- European Commission. EU Biodiversity Strategy for 2030; European Union: Luxembourg, 2021; ISBN 978-92-76-36456-6. [Google Scholar]
- European Commission. The European Green Deal; EC: Brussels, Belgium, 2019. [Google Scholar]
- Cotterill, S.; Bracken, L.J. Assessing the effectiveness of sustainable drainage systems (SuDS): Interventions, impacts and challenges. Water 2020, 12, 3160. [Google Scholar] [CrossRef]
- Melville-Shreeve, P.; Cotterill, S.; Grant, L.; Arahuetes, A.; Stovin, V.; Farmani, R.; Butler, D. State of SuDS delivery in the United Kingdom. Water Environ. J. 2018, 32, 9–16. [Google Scholar] [CrossRef]
- Jato-Espino, D.; Sañudo-Fontaneda, L.A.; Andrés-Valeri, V.C. Green Infrastructure: Cost-Effective Nature-Based Solutions for Safeguarding the Environment and Protecting Human Health and Well-Being. In Handbook of Environmental Materials Management; Springer: Cham, Switzerland, 2019; pp. 1525–1550. [Google Scholar] [CrossRef]
- Gimenez-Maranges, M.; Breuste, J.; Hof, A. Sustainable Drainage Systems for transitioning to sustainable urban flood management in the European Union: A review. J. Clean. Prod. 2020, 255, 120191. [Google Scholar] [CrossRef]
- Andrés-Doménech, I.; Anta, J.; Perales-Momparler, S.; Rodriguez-Hernandez, J. Sustainable urban drainage systems in spain: A diagnosis. Sustainability 2021, 13, 2791. [Google Scholar] [CrossRef]
- Potter, K.; Vilcan, T. Managing urban flood resilience through the English planning system: Insights from the ‘SuDS-face. Philos. Trans. R. Soc. A Math. Phys. Eng. Sci. 2020, 378. [Google Scholar] [CrossRef] [Green Version]
- Abellán García, A.I.; Cruz Pérez, N.; Santamarta, J.C. Sustainable urban drainage systems in spain: Analysis of the research on SUDS based on climatology. Sustainability 2021, 13, 7258. [Google Scholar] [CrossRef]
- Sheoran, S.K.; Parmar, V. Identification of alternative landfill site using QGIS in a densely populated metropolitan area. Quaest. Geogr. 2020, 39, 47–56. [Google Scholar] [CrossRef]
- Ferrans, P.; Torres, M.N.; Temprano, J.; Rodríguez Sánchez, J.P. Sustainable Urban Drainage System (SUDS) modeling supporting decision-making: A systematic quantitative review. Sci. Total Environ. 2022, 806, 150447. [Google Scholar] [CrossRef]
- Li, N.; Qin, C.; Du, P. Multicriteria Decision Analysis Applied to Sponge City Construction in China: A Case Study. Integr. Environ. Assess. Manag. 2019, 15, 703–713. [Google Scholar] [CrossRef] [PubMed]
- Yang, W.; Zhang, J. Assessing the performance of gray and green strategies for sustainable urban drainage system development: A multi-criteria decision-making analysis. J. Clean. Prod. 2021, 293, 126191. [Google Scholar] [CrossRef]
- Dang, V.T.; Wang, J.; Van-Thac Dang, W. An integrated fuzzy AHP and fuzzy TOPSIS approach to assess sustainable urban development in an emerging economy. Int. J. Environ. Res. Public Health 2019, 16, 2902. [Google Scholar] [CrossRef] [Green Version]
- El Hattab, M.H.; Theodoropoulos, G.; Rong, X.; Mijic, A. Applying the systems approach to decompose the SuDS decision-making process for appropriate hydrologic model selection. Water 2020, 12, 632. [Google Scholar] [CrossRef] [Green Version]
- Saadat Foomani, M.; Malekmohammadi, B. Site selection of sustainable urban drainage systems using fuzzy logic and multi-criteria decision-making. Water Environ. J. 2020, 34, 584–599. [Google Scholar] [CrossRef]
- de Oliveira Campos, P.C.; da Silva Rocha Paz, T.; Lenz, L.; Qiu, Y.; Alves, C.N.; Simoni, A.P.R.; Amorim, J.C.C.; Lima, G.B.A.; Rangel, M.P.; Paz, I. Multi-criteria decision method for sustainable watercourse management in Urban Areas. Sustainability 2020, 12, 6493. [Google Scholar] [CrossRef]
- Mahdi Zarghami, F.S. Multicriteria Analysis Applications to Water and Environment Management; Springer: New York, NY, USA, 2021; ISBN 9783642179365. [Google Scholar]
- Kangas, D. Evaluating Stormwater Management Techniques for Dense Urban Areas Using Multi-Criteria Decision Analysis. Master’s Thesis, Chalmers University of Technology, Gothenburg, Sweden, 2016. [Google Scholar]
- Ahammed, F.; Hewa, G.A.; Argue, J.R. Applying multi-criteria decision analysis to select WSUD and LID technologies. Water Sci. Technol. Water Supply 2012, 12, 844–853. [Google Scholar] [CrossRef]
- Ceballos, B.; Lamata, M.T.; Pelta, D.A. A comparative analysis of multi-criteria decision-making methods. Prog. Artif. Intell. 2016, 5, 315–322. [Google Scholar] [CrossRef]
- Gudiyangada Nachappa, T.; Tavakkoli Piralilou, S.; Gholamnia, K.; Ghorbanzadeh, O.; Rahmati, O.; Blaschke, T. Flood susceptibility mapping with machine learning, multi-criteria decision analysis and ensemble using Dempster Shafer Theory. J. Hydrol. 2020, 590, 125275. [Google Scholar] [CrossRef]
- Shahabi, H.; Hashim, M.; Ahmad, B. Bin Remote sensing and GIS-based landslide susceptibility mapping using frequency ratio, logistic regression, and fuzzy logic methods at the central Zab basin, Iran. Environ. Earth Sci. 2015, 73, 8647–8668. [Google Scholar] [CrossRef]
- Radočaj, D.; Jurišić, M.; Gašparović, M.; Plaščak, I. Optimal soybean (Glycine max L.) land suitability using gis-based multicriteria analysis and sentinel-2 multitemporal images. Remote Sens. 2020, 12, 1463. [Google Scholar] [CrossRef]
- Kaykhosravi, S.; Abogadil, K.; Khan, U.T.; Jadidi, M.A. The low-impact Development Demand Index: A new approach to identifying locations for LID. Water 2019, 11, 2341. [Google Scholar] [CrossRef] [Green Version]
- Hussain, M.; Ajmal, M.M.; Khan, M.; Saber, H. Competitive priorities and knowledge management: An empirical investigation of manufacturing companies in UAE. J. Manuf. Technol. Manag. 2015, 26, 791–806. [Google Scholar] [CrossRef]
- Bernasconi, M.; Choirat, C.; Seri, R. The analytic hierarchy process and the theory of measurement. Manag. Sci. 2010, 56, 699–711. [Google Scholar] [CrossRef] [Green Version]
- Kuller, M.; Bach, P.M.; Ramirez-lovering, D.; Deletic, A. Environmental Modelling & Software Framing water sensitive urban design as part of the urban form: A critical review of tools for best planning practice. Environ. Model. Softw. 2017, 96, 265–282. [Google Scholar] [CrossRef]
- Loc, H.H.; Huong, L.N.Q.; Huong, Q.; Tue, N.N.; Kusakabe, T.; Shimizu, Y. Feasibility Assessment of Sustainable Urban Drainage Systems (SUDS) in Ho Chi Minh city using an Analytic Hierarchy Process (AHP) Approach. In Proceedings of the World Engineering Conference and Convention, Kyoto, Japan, 29 November–2 December 2015. [Google Scholar]
- Kellagher, R.; Martin, P.; Jefferies, C.; Bray, R.; Shaffer, P.; Wallingford, H.R.; Woods-Ballard, B. The SUDS Manual; Construction Industry Research and Information Association (CIRIA): London, UK, 2015; ISBN 9780860176978. [Google Scholar]
- Ministerio para la Transición Ecológica y el Reto Demográfico AEMET. Available online: http://www.aemet.es/es/eltiempo/observacion/ultimosdatos?k=ast&l=1207U (accessed on 25 December 2021).
- UTE Ordenación Urbana de Gijón. Revisión del Plan General de Ordenación del Concejo de Gijón, 1st ed.; Ayuntamiento de Gijón: Gijón, Spain, 2018. [Google Scholar]
- Barboza, E.P.; Cirach, M.; Khomenko, S.; Iungman, T.; Mueller, N.; Barrera-Gómez, J.; Rojas-Rueda, D.; Kondo, M.; Nieuwenhuijsen, M. Green space and mortality in European cities: A health impact assessment study. Lancet Planet. Health 2021, 5, e718–e730. [Google Scholar] [CrossRef]
- Lancet, T.; Health, P. ISGlobal Publishes Ranking of European Cities with Highest Mortality due to Lack of Green Space; Lancet Planetary Health: London, UK, 2021. [Google Scholar]
- Pellicer Corellano, F.; Barrao Simorte, S.; López-Álvarez, M. Estrategia integrada para la recuperación de tramos fluviales urbanos. El caso del río Piles en Gijón compatible con usos deportivos. Geographicalia 2021, 213–242. [Google Scholar] [CrossRef]
- Blanco, H. Ema: 50 años; 2a; EMASA: Gijon, Spain, 2015; ISBN 9788460842620. [Google Scholar]
- Empresa Municipal de Aguas S.A. (EMA). Memoria de Responsabilidad Corporativa; Empresa Municipal de Aguas S.A. (EMA): Gijón, Spain, 2019. [Google Scholar]
- Gobierno del Principado de Asturias SITPA-IDEAS. Available online: https://ideas.asturias.es/centro-de-descargas (accessed on 16 September 2021).
- Ministerio de Transportes Movilidad y Agenda CNIG (ING). Available online: https://centrodedescargas.cnig.es/CentroDescargas/index.jsp (accessed on 16 September 2021).
- Ortiz, A.; Velasco, M.J.; Esbri, O.; Medina, V.; Russo, B. The economic impact of climate change on urban drainage master planning in Barcelona. Sustainability 2021, 13, 71. [Google Scholar] [CrossRef]
- Urban Drainage and Flood Control District (UDFCD). Chapter 3: Calculating the WQCV and Volume Reduction. In Urban Storm Drainage Criteria Manual; UDFCD: Denver, CO, USA, 2010; Volume 3, pp. 3–30. ISBN 9781887201667. [Google Scholar]
- City of Colorado Springs. Chapter 3: Calculating the WQCV and Runoff Reduction. In Drainage Criteria Manual; The Colorado Springs City Council: Colorado Springs, CO, USA, 2014; Volume 2, pp. 3–29. [Google Scholar]
- City of Fort Collins. Chapter 7: Water Quality. In Fort Collins Stormwater Criteria Manual; The Fort Collins City Council: Fort Collins, CO, USA, 2018; Volume 3, pp. 1–12. [Google Scholar]
- UDFCD. Chapter 2: BMP Selection. In Urban Storm Drainage Criteria Manual; UDFCD: Denver, CO, USA, 2010; Volume 3, pp. 2–18. ISBN 9781887201667. [Google Scholar]
- European Medicines Agency. Informe Preliminar Diagnóstico y Plan de Actuaciones río Piles; EMA: Amsterdam, The Netherlands, 2019. [Google Scholar]
- CHC. Muestreo de las Aguas en la Cuenca del río Piles. 2019. Available online: https://www.chcantabrico.es/documents/20143/521742/20191219_informe_muestreo_aguas_cuenca_rio_piles.pdf/971e7b7a-d292-d0af-d040-44b68a73d614 (accessed on 15 December 2021).
- Real Grupo de Cultura Covandonga. Análisis del Informe Presentado por la Concejalía de Medio Ambiente sobre el río Piles; RGCC: Gijon, Spain, 2020. [Google Scholar]
- Confederación Hidrográfica del Cantábrico (CHC). Available online: https://www.chcantabrico.es/las-cuencas-cantabricas/marco-fisico/hidrologia/rios/piles (accessed on 15 December 2021).
- Tsuzuki, Y. Pollutant Discharge and Water Quality in Urbanisation; Springer Nature: London, UK, 2014; ISBN 978-3-319-04755-3. [Google Scholar]
- Azyana, Y.; Nik Norulaini, N.A.; Nurul Jannah, H. Land use and catchment size/scale on the water quality deterioration of Kinta River, Perak, Malaysia. Malays. J. Sci. 2012, 31, 121–131. [Google Scholar] [CrossRef] [Green Version]
- Camara, M.; Jamil, N.R.; Abdullah, A.F. Bin Impact of land uses on water quality in Malaysia: A review. Ecol. Process. 2019, 8. [Google Scholar] [CrossRef]
- Wang, M.; Markert, B.; Chen, W.; Peng, C.; Ouyang, Z. Identification of heavy metal pollutants using multivariate analysis and effects of land uses on their accumulation in urban soils in Beijing, China. Environ. Monit. Assess. 2012, 184, 5889–5897. [Google Scholar] [CrossRef] [PubMed]
- Novotny, V. Water Quality: Diffuse Pollution and Watershed Management, 2nd ed.; Wiley: Hoboken, NJ, USA, 2002; ISBN 978-0-471-39633-8. [Google Scholar]
- Yuan, D.; Lin, B.; Falconer, R.A.; Tao, J. Development of an integrated model for assessing the impact of diffuse and point source pollution on coastal waters. Environ. Model. Softw. 2007, 22, 871–879. [Google Scholar] [CrossRef]
- Ministerio de Hacienda y Función Pública Sede Electrónica del Catastro. Available online: https://www.sedecatastro.gob.es/Accesos/SECAccDescargaDatos.aspx (accessed on 25 October 2021).
- Ayuntamiento de Gijón IDE Gijón. Available online: http://ide.gijon.es/descargas.html (accessed on 14 December 2021).
- Chen, C.F. Applying the analytical hierarchy process (AHP) approach to convention site selection. J. Travel Res. 2006, 45, 167–174. [Google Scholar] [CrossRef]
- Ariza, S.L.J.; Martínez, J.A.; Muñoz, A.F.; Quijano, J.P.; Rodríguez, J.P.; Camacho, L.A.; Díaz-Granados, M. A multicriteria planning framework to locate and select sustainable urban drainage systems (SUDS) in consolidated urban areas. Sustainability 2019, 11, 2312. [Google Scholar] [CrossRef] [Green Version]
- Xiong, H.; Sun, Y.; Ren, X. Comprehensive assessment of water sensitive urban design practices based on multi-criteria decision analysis via a case study of the University of Melbourne, Australia. Water 2020, 12, 2885. [Google Scholar] [CrossRef]
- Wang, M.; Sweetapple, C.; Fu, G.; Farmani, R.; Butler, D. A framework to support decision making in the selection of sustainable drainage system design alternatives. J. Environ. Manag. 2017, 201, 145–152. [Google Scholar] [CrossRef]


| Design Pillar | ID | Criteria | Variable/Units |
|---|---|---|---|
| Water Quantity | WQN1 | Flooding risk | Percentage of area vulnerable to river and coastal flooding (% Af) |
| WQN2 | Treatment volume | Water Quality Capture Volume (WQCV) (m3) | |
| WQN3 | Capacity sewerage system | Capacity and density of sewerage system elements (N°el/km2, Vol/km2) | |
| Water Quality | WQL1 | Qualitative analysis of water bodies | Concentration of pollutants in watercourses (BOD, COD, …) |
| WQL2 | Land uses | Percentage of area of land uses susceptible to be a potential source of pollutants (% LUSP) | |
| WQL3 | Population density | Number of inhabitants per surface area (hab/km2) | |
| Amenity-Biodiversity | AB1 | Urban redevelopment or a new urbanization | Percentage of area to undergo new urban development (% ANUD) |
| AB2 | Green areas | Percentage of public green spaces (% AGA) | |
| AB3 | Public areas | Percentage of public spaces (% APS) |
| Alternatives | Alternative Weights Water Quantity Indicators | |||||||
|---|---|---|---|---|---|---|---|---|
| Id. | Name | Area (km2) | WQN1 | CR | WQN2 | CR | WQN3 | CR |
| A.1 | Jove | 0.734 | 0.016 | 0.089 | 0.078 | 0.073 | 0.017 | 0.051 |
| A.2 | Calzada | 3.527 | 0.016 | 0.027 | 0.048 | |||
| A.3 | Pinzales | 1.012 | 0.093 | 0.064 | 0.069 | |||
| A.4 | Pilon | 5.325 | 0.037 | 0.054 | 0.067 | |||
| A.5 | Natahoyo | 0.258 | 0.016 | 0.018 | 0.123 | |||
| A.6 | Piles | 4.093 | 0.097 | 0.038 | 0.025 | |||
| A.7 | Peña Francia | 4.411 | 0.038 | 0.151 | 0.012 | |||
| A.8 | Somio la Pipa | 4.012 | 0.018 | 0.192 | 0.012 | |||
| A.9 | Somio Alto | 1.039 | 0.016 | 0.151 | 0.017 | |||
| A.10 | Rinconin | 0.836 | 0.052 | 0.109 | 0.017 | |||
| A.11 | Cutis | 4.687 | 0.016 | 0.027 | 0.091 | |||
| A.12 | Coto San Nicolas | 1.208 | 0.071 | 0.013 | 0.172 | |||
| A.13 | Arenal San Lorenzo | 0.161 | 0.168 | 0.013 | 0.172 | |||
| A.14 | Parque | 0.343 | 0.219 | 0.055 | 0.035 | |||
| A.15 | Centro | 1.023 | 0.128 | 0.013 | 0.123 | |||
| Alternatives | Alternative Weight Water Quality Indicators | |||||||
|---|---|---|---|---|---|---|---|---|
| Id. | Name | Area (km2) | WQL1 | CR | WQL2 | CR | WQL3 | CR |
| A.1 | Jove | 0.734 | 0.034 | 0.002 | 0.022 | 0.018 | 0.034 | 0.042 |
| A.2 | Calzada | 3.527 | 0.034 | 0.171 | 0.098 | |||
| A.3 | Pinzales | 1.012 | 0.034 | 0.091 | 0.013 | |||
| A.4 | Pilon | 5.325 | 0.034 | 0.271 | 0.023 | |||
| A.5 | Natahoyo | 0.258 | 0.034 | 0.061 | 0.069 | |||
| A.6 | Piles | 4.093 | 0.327 | 0.061 | 0.034 | |||
| A.7 | Peña Francia | 4.411 | 0.229 | 0.036 | 0.015 | |||
| A.8 | Somio la Pipa | 4.012 | 0.034 | 0.035 | 0.022 | |||
| A.9 | Somio Alto | 1.039 | 0.034 | 0.022 | 0.022 | |||
| A.10 | Rinconin | 0.836 | 0.034 | 0.022 | 0.022 | |||
| A.11 | Cutis | 4.687 | 0.034 | 0.061 | 0.098 | |||
| A.12 | Coto San Nicolas | 1.208 | 0.034 | 0.061 | 0.141 | |||
| A.13 | Arenal San Lorenzo | 0.161 | 0.034 | 0.036 | 0.198 | |||
| A.14 | Parque | 0.343 | 0.034 | 0.015 | 0.069 | |||
| A.15 | Centro | 1.023 | 0.034 | 0.036 | 0.141 | |||
| Alternatives | Alternative Weight Amenity and Biodiversity Indicators | |||||||
|---|---|---|---|---|---|---|---|---|
| Id. | Name | Area (km2) | AB1 | CR | AB2 | CR | AB3 | CR |
| A.1 | Jove | 0.734 | 0.026 | 0.013 | 0.029 | 0.089 | 0.031 | 0.060 |
| A.2 | Calzada | 3.527 | 0.078 | 0.043 | 0.043 | |||
| A.3 | Pinzales | 1.012 | 0.171 | 0.020 | 0.013 | |||
| A.4 | Pilon | 5.325 | 0.127 | 0.029 | 0.022 | |||
| A.5 | Natahoyo | 0.258 | 0.026 | 0.062 | 0.063 | |||
| A.6 | Piles | 4.093 | 0.172 | 0.117 | 0.063 | |||
| A.7 | Peña Francia | 4.411 | 0.045 | 0.019 | 0.021 | |||
| A.8 | Somio la Pipa | 4.012 | 0.045 | 0.018 | 0.017 | |||
| A.9 | Somio Alto | 1.039 | 0.026 | 0.013 | 0.015 | |||
| A.10 | Rinconin | 0.836 | 0.045 | 0.117 | 0.063 | |||
| A.11 | Cutis | 4.687 | 0.045 | 0.161 | 0.136 | |||
| A.12 | Coto San Nicolas | 1.208 | 0.026 | 0.029 | 0.093 | |||
| A.13 | Arenal San Lorenzo | 0.161 | 0.045 | 0.043 | 0.093 | |||
| A.14 | Parque | 0.343 | 0.045 | 0.215 | 0.193 | |||
| A.15 | Centro | 1.023 | 0.078 | 0.086 | 0.136 | |||
Publisher’s Note: MDPI stays neutral with regard to jurisdictional claims in published maps and institutional affiliations. |
© 2022 by the authors. Licensee MDPI, Basel, Switzerland. This article is an open access article distributed under the terms and conditions of the Creative Commons Attribution (CC BY) license (https://creativecommons.org/licenses/by/4.0/).
Share and Cite
Suárez-Inclán, A.M.; Allende-Prieto, C.; Roces-García, J.; Rodríguez-Sánchez, J.P.; Sañudo-Fontaneda, L.A.; Rey-Mahía, C.; Álvarez-Rabanal, F.P. Development of a Multicriteria Scheme for the Identification of Strategic Areas for SUDS Implementation: A Case Study from Gijón, Spain. Sustainability 2022, 14, 2877. https://0-doi-org.brum.beds.ac.uk/10.3390/su14052877
Suárez-Inclán AM, Allende-Prieto C, Roces-García J, Rodríguez-Sánchez JP, Sañudo-Fontaneda LA, Rey-Mahía C, Álvarez-Rabanal FP. Development of a Multicriteria Scheme for the Identification of Strategic Areas for SUDS Implementation: A Case Study from Gijón, Spain. Sustainability. 2022; 14(5):2877. https://0-doi-org.brum.beds.ac.uk/10.3390/su14052877
Chicago/Turabian StyleSuárez-Inclán, Antonio Menéndez, Cristina Allende-Prieto, Jorge Roces-García, Juan P. Rodríguez-Sánchez, Luis A. Sañudo-Fontaneda, Carlos Rey-Mahía, and Felipe P. Álvarez-Rabanal. 2022. "Development of a Multicriteria Scheme for the Identification of Strategic Areas for SUDS Implementation: A Case Study from Gijón, Spain" Sustainability 14, no. 5: 2877. https://0-doi-org.brum.beds.ac.uk/10.3390/su14052877