Article

A SUDS Planning Decision Support Tool to Maximize Ecosystem Services

by
Juliana Uribe-Aguado
1,*,
Sara L. Jiménez-Ariza
1,
María N. Torres
2,
Natalia A. Bernal
1,
Mónica M. Giraldo-González
1 and
Juan P. Rodríguez
1
1
Environmental Engineering Research Center (CIIA), Department of Civil and Environmental Engineering, Universidad de los Andes, Bogota 111711, Colombia
2
Department of Civil, Structural, and Environmental Engineering, University at Buffalo (SUNY), Buffalo, NY 14260, USA
*
Author to whom correspondence should be addressed.
Sustainability 2022, 14(8), 4560; https://0-doi-org.brum.beds.ac.uk/10.3390/su14084560
Submission received: 28 February 2022 / Revised: 26 March 2022 / Accepted: 7 April 2022 / Published: 11 April 2022

Abstract

:
In the past years, alternative drainage approaches have emerged, such as Sustainable Urban Drainage Systems (SUDS), to prevent run-off and flooding impacts on the most vulnerable zones of the cities. These systems not only provide the benefit of water regulation but also promote other types of ecosystem services. Several studies have developed optimization tools to assist SUDS selection, location, and design. However, they do not consider a comprehensive set of ecosystem services (e.g., provision, regulation, cultural, and support services). This research proposes a flexible and adaptable methodology to incorporate SUDS in different stages of urban projects using a multi-objective optimization technique to minimize run-off, maximize ecosystem services and minimize cost. The methodology comprises four phases: (1) the preliminary analysis of ecosystem services potentially generated by each SUDS type, (2) the priority and opportunity index quantification, (3) the physical feasibility analysis, and (4) the multi-objective optimization tool implementation. The methodology was successfully applied to three different urban areas of Bogotá city (Colombia). Results evidence that the interaction of the budget constraints and the available area restrict the potential benefits of SUDS implementation. These results are helpful to support different urban planning stages.

1. Introduction

The rapid urbanization process, the development of informal settlements in risk zones, and the inadequacy of drainage systems will spur the severity of damages caused by extreme events [1,2]. Frequently, the vulnerable areas of the cities suffer the most drastic environmental, social, and economic consequences of disruptive run-off and flooding events [3]. To prevent these impacts, in the last 30–40 years, alternative approaches such as Sustainable Urban Drainage Systems (SUDS) (also called in the literature: Low Impact Development (LID), Water Sensitive Urban Design (WSUD), Best Management Practices (BMP), and Innovative Storm-water Management) have emerged. According to Fletcher et al. [4], SUDS are one of the Green Infrastructure (GI) techniques used to drain stormwater sustainably. Examples of SUDS are green roofs, permeable pavements, filter strips, vegetated swales, infiltration trenches, soakaways, rain gardens, detention, and retention basins, and constructed wetlands [5,6].
SUDS emulate and restore the pre-development hydrological processes by implementing run-off management systems following a holistic philosophy that gives equal importance to four water management pillars: quality, quantity, amenity, and biodiversity [5]. According to these pillars and the definition of ecosystem services (“aspects of ecosystems utilized to produce human well-being” [7]), the implementation of SUDS not only provides the benefit of water regulation but also promotes other types of services [8]. SUDS implementation relates to the generation of provision, regulation, cultural, and support services [9,10,11,12,13,14,15,16,17]. For example, the implementation of tree boxes in the urban context promotes the provision of freshwater by the run-off infiltration and aquifer recharge, the microclimate regulation service by the reduction of the heat island effect, and increases the aesthetic value by the improvement of the urban landscape [13,17]. Another example is the wet ponds, which enhance the educational values and provides regulation services due to the presence of pollutant capturing vegetation [14,17].
The multiple functionalities offered by SUDS positioned them as a key element for spatial planning and territorial development [18,19]. In this way, SUDS implementation can be useful to promote ecosystem services, societal health, and wellbeing, support the development of a green economy, and the sustainable management of water [20]. However, the quantification of ecosystem services is a complex process that involves a large number of variables, showing the importance of easy-to-use models and tools for ecosystem services integration into the decision-making process [21,22]. These tools allow, among others, (i) the analysis of urban ecosystems and their spatial distribution, (ii) the assessment of the beneficiaries’ distribution and the demand for ecosystem services, and (iii) the definition of the planning management tools of the city that determine who is benefited from these services [23,24,25].
Common approaches to assessing ecosystem services (e.g., Environmental impact assessment (EIA) and cost-benefit analysis (CBA)) have several flexibility limitations to include people’s perceptions and consider ecological and social evaluation. These limitations positioned Multi-Criteria Decision Analysis (MCDA) methodologies as promising tools to transform ecosystem services assessment to a more holistic approach [26].
MCDA is defined as a process to integrate multiple criteria into a decision process to select the best alternatives [27]. One of the principal steps of the MCDA methods is the weighting assignation criteria that measure the preferences of alternatives [28]. Three categories of weighting methods have been defined: subjective, objective, or combined. In subjective methods, the weights are determined by the preferences of experts or decision-makers (e.g., Analytic Hierarchy Process (AHP), Analytic Network Process (ANP), and Delphi methods) [28,29]. In objective methods, weights are assigned based on information gathered through mathematical models or information without consideration of stakeholders’ preferences (e.g., Technique for Order Preference by Similarity to Ideal Solution (TOPSIS), entropy, and multi-objective optimization) [28,29]. Finally, integrated methods combine the subjective weights based on expert opinion with the relevant information granted by the mathematical models [29].
MCDA has been widely used for ecosystem services assessment during the urban planning process [30,31]. Various studies have focused on the GI distribution according to ecosystem services potential and physical and social characteristics of particular case studies [32,33,34,35,36,37]. These studies developed decision-support tools, spatial models, and ecosystem services assessments to guide the urban planning process at a fixed scale (municipal or local). Other studies have focused on defining a methodology framework to determine the location of SUDS in an urban context [38,39,40,41,42,43,44,45,46]. For example, Jiménez-Ariza et al. [40] proposed a multiscale and multicriteria SUDS planning framework by integrating strategic and priority urban drainage sub-catchments using MCDA entropy and Criteria Importance Through Inter-criteria Correlation (CRITIC) methods for the development of the social and environmental index. Menéndez Suárez-Inclán [45] developed a methodology to identify strategic areas for SUDS implementation by the combination of Geographic Information Systems (GIS) software and the MCDA Analytical Hierarchical Process (AHP). These studies offered decision-support tools potentially replicable in another context, however, fewer studies had analyzed the feasibility (e.g., environmental, social, and economic) of SUDS implementation simultaneously for different stages of urban projects (e.g., developed project, planning phase, urban renewal planning).
To advance the field of SUDS decision support tools and integrate other types of criteria during feasibility analysis, other authors focused on using optimization tools to assist SUDS selection location and design [47,48,49,50,51,52,53,54,55,56]. For example, Torres et al. [57] developed a two-stage stochastic mixed-integer linear program (TS-MILP) to select the best SUDS type and location. The objective of this optimization model was to minimize the use of potable water for irrigation and reduce the water run-off at a minimum cost. In another approach, McClymont et al. [3] applied a Standard Evolution Strategy with a cross-over operator to optimize SUDS encompassing the amenity and biodiversity pillars of SUDS through a quality-of-life index. The objectives were to maximize flood and water quality resilience while minimizing SUDS capital costs. To the best of our knowledge [58,59], optimization-based methodologies developed for SUDS selection currently do not consider a comprehensive set of ecosystem services that include provision, regulation, and socio-cultural categories from the Millennium Assessment (MA) [60] classification.
Given the gaps previously identified, i.e., (i) the lack of studies in which a SUDS selection methodology is simultaneously applied to different stages of urban projects and (ii) the limited analysis of the ecosystem services categories in multi-objective optimization tools, this work aims to complement the preliminary selection criteria developed by Jiménez -Ariza et al. [40] by the adaptation of the optimization model proposed by Torres et al. [57] to propose a flexible and adaptable methodology to incorporate SUDS in different stages of urban projects.
Previous studies used more than one MCDA method in order to complement the strengths and weaknesses of each other and select the best alternative [61,62,63]. In this work, the feasibility analysis of SUDS selection is amplified to a more holistic view, considering case-specific characteristics of the project (e.g., available budget, benefits generation, run-off reduction) as the main variables during multi-objective optimization analysis. In addition, the ecosystem services assessment developed during the feasibility analysis is integrated into the multi-objective optimization process as an objective function to consider a comprehensive set of benefits (e.g., provision, regulation, and socio-cultural services) during SUDS selection. This adaptation of methodologies will allow the possibility of more sound decisions to select the best SUDS type.
The adaptability is related to the vast array of data that can be used as input (which largely depends on the data availability of the case study). The flexibility refers to its capacity to be altered for application to a diversity of urban spaces (e.g., recreational, industrial, residential) and urban planning stages. An optimization-based methodology that considers eight (8) ecosystem services of MA classification is presented. Three different urban areas of Bogotá city (Colombia) were used for demonstration: Ciudad Verde macro-development zone, Lagos de Torca expansion zone, and El Reencuentro renewal zone.
The three cases studies were strategically selected based on their contrasting urban stages, which influence the determinants in the implementation of SUDS. Ciudad Verde is a developed project that is already urbanized and consolidated in which SUDS implementation was not considered in the planning phase. In this context, the methodology allows the identification of potential SUDS implementation in a post-development stage to solve the problems in water management by integrating the prevalent dynamic of the area to answer the inhabitant’s needs. Conversely, Lagos de Torca is in the planning phase with 34 urban development plans. The methodology was implemented during the first phases of the planning process to support the project design by the identification of ecosystem services potential generation by SUDS. In this context, SUDS implementation can support the water policies for better ecosystem restoration in the zone. El Reencuentro is also in the planning phase; however, it corresponds to an already urbanized area. SUDS implementation in this case study could support the sustainable transformation of public space. The manuscript is divided into five sections: Section 2 details the methodology, Section 3 describes the case studies, Section 4 summarizes the main results for each case study, and Section 5 presents the discussion.

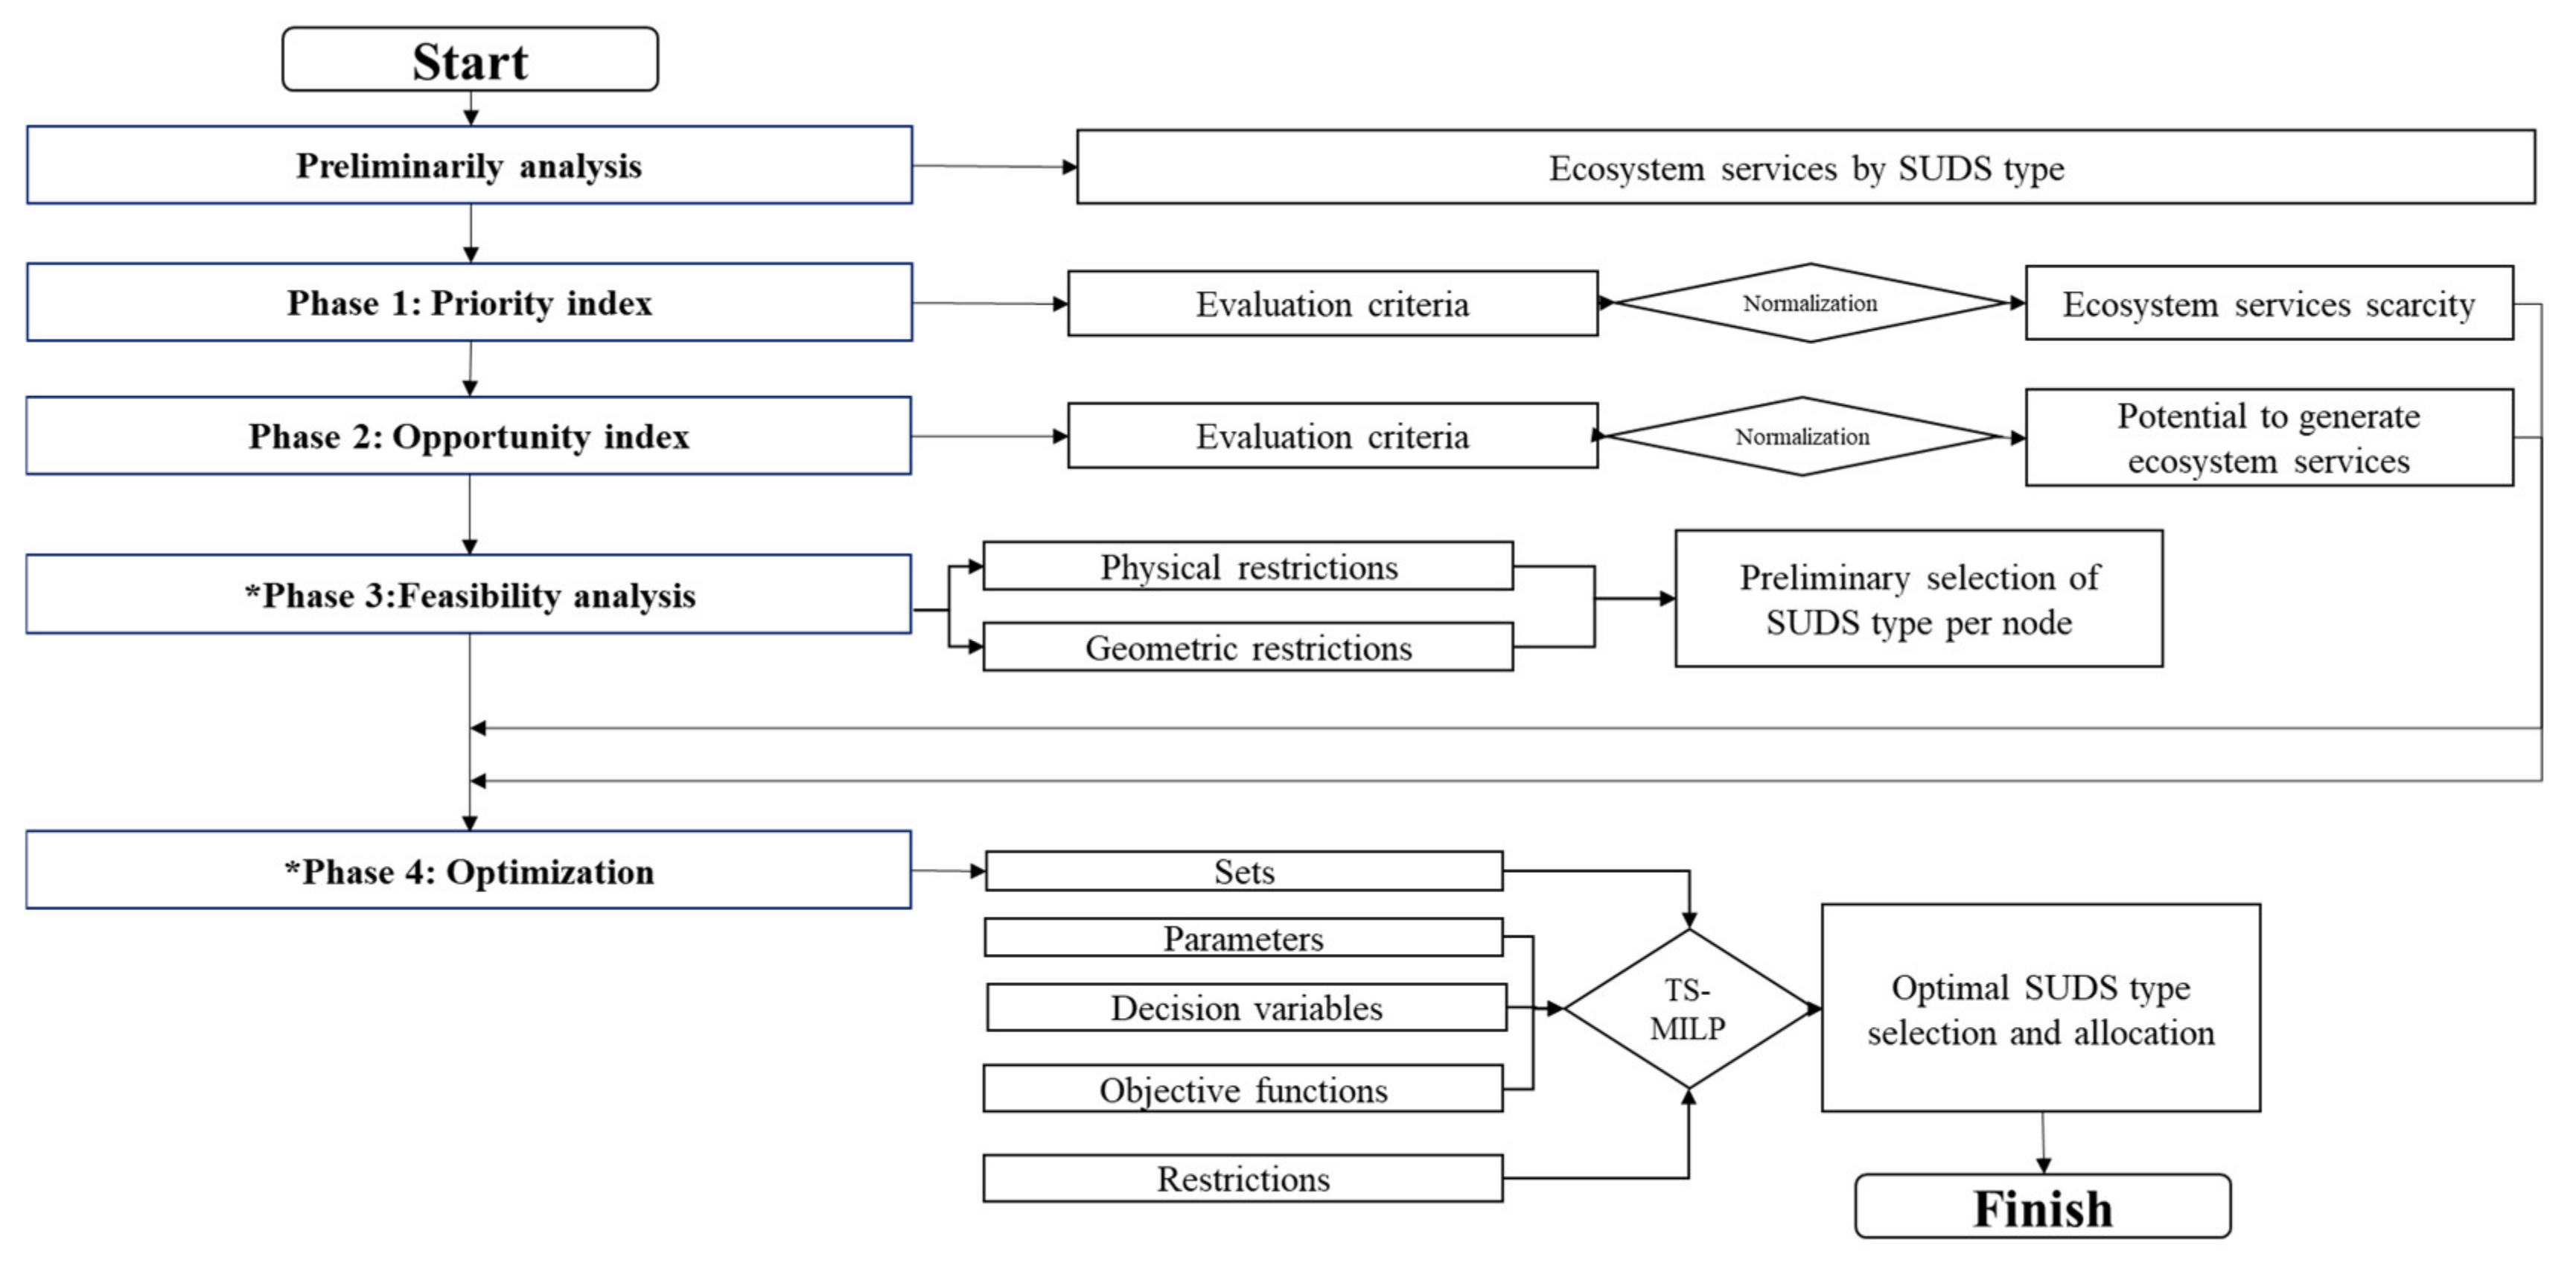
2. Materials and Methods

Figure 1 summarizes the preliminary step and the four stages of the methodology. Section 2.1 (corresponding to the Preliminary analysis in Figure 1) provides an analysis of the ecosystem services potentially generated by each SUDS type. The process continues with the priority index quantification (Phase 1 in Figure 1), which aims to recognize the areas with a lack of ecosystem services. Next, Phase 2 evaluates the opportunity index to identify the areas with a higher potential to generate ecosystem services by comparing the public space zones available for intervention. Phase 3 corresponds to the evaluation of the physical and geometric restrictions to identify feasible SUDS types. Finally, Phase 4 is the multi-objective optimization tool for selecting the best water management strategy to minimize run-off, maximize benefits (ecosystem services), and minimize construction costs.

2.1. Preliminary Analysis

To build a comprehensive list of ecosystem services delivered by SUDS, different references [9,10,11,12,13,14,15,16,17] were analyzed to identify ecosystem services potential generation in 13 types of SUDS, classified according to their function: detention based (tree boxes, green roofs, dry extended retention basin, grassed swales, and bioretention zones), retention based (contracted wetlands, wet ponds, and storage tanks), infiltration based (infiltration basin, permeable pavement, and infiltration ponds), and filtration based (sand filters and infiltration trenches). Four categories of ecosystem services were considered to build a comparative matrix to identify the most relevant in each SUDS type by assigning a score of 0 (zero potential of ecosystem service generation), 1 (low potential of ecosystem service generation), 2 (potential of ecosystem service generation with design adjustment or additional practices), 3 (moderated potential of ecosystem service generation), or 4 (high potential of ecosystem service generation).
The results of the classification process can be found in Supplementary Materials File S1. Following the analysis, the selected ecosystem services—considering the MA [60] classification—are freshwater provision, water regulation, water quality regulation, air quality regulation, microclimate regulation, global climate regulation, aesthetic value, and educational value.

2.2. Phase 1—Priority Index

The quantification of the priority index aims to recognize the areas with a lack of ecosystem services by comparing their physical and social characteristics. These areas can be established by physical limits or by the use of the division zones defined in the planning tools of the project. In any case, it should be considered that the size of the areas (e.g., property units, street blocks, neighborhoods) also defines the spatial resolution of the results. The smaller the areas, the more detailed the analysis. The output of this methodological phase is the identification of areas with high demands for ecosystem services that can be promoted by SUDS.
According to the identification of ecosystem services provided by SUDS (see Section 2.1), a physical spatially quantifiable variable is assigned as an evaluation criterion to analyze the status of each ecosystem service in the area. To calculate the evaluation criteria, it is necessary to analyze the line base conditions before the project development. For this purpose, spatial information about the socio-economic status (e.g., population density, percentage of household, and vulnerable population), land use categories distribution, public space characteristics (e.g., roads, sidewalks, parks), and risk assessment information (i.e., flooding risk) is required. The evaluation criteria vary according to the available information in each project. In Ciudad Verde, this information was obtained by a citizens survey, land use maps [64], Google Earth images (2019), and the orthophoto of Bogotá city (2017) [65]. In Lagos de Torca, the main source of information is the urban development plans [66,67] and in El Reencuentro the information was obtained through the socio-economic baseline analysis [68]. In Lagos de Torca and El Reencuentro, the flood risk analysis was made according to the city flood risk map [69] and in Ciudad Verde by the national government information [70].
The measurement of the corresponding spatial characteristics of evaluation criteria (i.e., area, distance, length) brings the first approximation to population requirements or problems derived from the poor provision of ecosystem services. For example, for the status of freshwater provision service, the evaluation criteria are green areas because these areas imply a need for seasonal vegetation irrigation. Another example is the air quality regulation service, where the evaluation criterion, is the area of high traffic roads because the population who live near this infrastructure has higher exposure to air pollution (e.g., PM2.5, PM10, and NOX) and respiratory diseases [71]. The complete list of ecosystem services and their corresponding evaluation criterion are summarized in Table 1.
Once these evaluation criteria are quantified, the priority index is calculated to compare the ecosystem services status among the areas. As shown in Equations (1)–(4), the minimum value of the evaluation criterion category is subtracted from each evaluation criterion. This value is normalized by the difference between the maximum and minimum values in each area. Then, the evaluation criteria are aggregated by ecosystem service assuming all the ecosystem services are equally important to calculate the priority index. Finally, the score obtained by the priority index in each area is reclassified as a percentile (1.0, 0.8, 0.6, 0.4, 0.2, 0) to make objective comparisons between them (i.e., areas with a percentile of 1.0 have a relative lack of ecosystem services).
N c i = C i min C max C min C
A c i = N c i + N . c i + 1 + N c i n   n  
N p , N r ,   o r   N c = A c i + A . c i + 1 + A c i n   n  
P I = N p + N r + N c 3
  • C i : evaluation criterion per service.
  • max C : maximum value for evaluation criterion
  • min C : minimum value for evaluation criterion
  • N c i : normalized evaluated criterion
  • A c i : aggregated benefit value
  • n : number of criteria per ecosystem service category
  • N p : normalized provisioning service
  • N r : normalized regulating service
  • N c : normalized socio-cultural service
  • P I : priority index.

2.3. Phase 2—Opportunity Index

The second phase consists in quantifying the opportunity index for the ecosystem services identified in Section 2.1. For this purpose, the intervention zones of the case study (e.g., parks, sidewalks, street isolators, river buffer connection zones, environmental control zones) are evaluated to identify their potential to generate ecosystem services. The output of this methodological phase is the identification of the intervention zones with the highest potential to promote ecosystems services by SUDS implementation.
In this case, the evaluation criteria are associated with the presence or absence of urban assets that contribute to the generation of ecosystem services (see Table 2). These criteria are defined according to the data availability in each project (same data requirements of priority index). For example, for the provision service, the evaluation criterion is the run-off quality quantified according to the distance to principal roads that estimate potential water contamination. Zones with abundant high-quality water provide the opportunity of using the resource for different uses (e.g., infiltration and irrigation). The evaluation criteria of the potential for regulation services are the infiltration rate and the available green area; a high score in these criteria indicates larger potential run-off volume management. Finally, socio-cultural services such as the aesthetic value are evaluated by the available vegetation area and/or the types of public space (e.g., parks and sidewalks). The educational value is evaluated by the potential for passive (e.g., looking at the SUDS structure) or active (e.g., educational activities) interaction with SUDS considering the pedestrian traffic or the presence of key infrastructure [72] (see Table 2).
Similar to the priority index, in the opportunity index each criterion is normalized and then aggregated by the ecosystem service (Equations (1)–(4)). The opportunity index score obtained the opportunity index in each intervention zone is reclassified as a percentile to compare the potential to provide ecosystem services (i.e., zones with a percentile of 1.0 had a high potential to provide ecosystem services).

2.4. Phase 3—Feasibility Analysis

The physical conditions (i.e., water table distance, infiltration rate, and slope) and the preliminary designs of the project have to be defined to identify the intervention areas. This information was provided by technical feasibility studies on Lagos de Torca [73], previous local SUDS projects [74], and the urban development plans of each project [64,65,73].
Using a Geographic Information System (GIS) physical and geometric restrictions (see Table 3) are analyzed and feasible SUDS types are identified [40]. Depending on the spatial resolution and accuracy of the data, the methods to determine SUDS suitability in an area can be strict (a single unfilled criterion makes the whole area unfeasible), or less restrictive (using methodologies to relax the nullifying criteria) [75,76].

2.5. Phase 4—Optimization

A multi-objective optimization model was built using the python language and solved using the Gurobi Optimizer [77]. The model is a modification of the Two Stage Mixed Integer Linear Program (TS-MILP) developed by Torres et al. [35] for rainwater harvesting and run-off management. In the original model, the objectives are the reduction of runoff and the reuse of the intercepted water for irrigation purposes. The model selects the best location and typologies to match the stormwater offer with the demand. Since in this adaptation the irrigation demanding areas are not considered, there is no set of demanding nodes. In this version, all potential locations for SUDS are classified as “offering nodes” N , and a new set for ecosystem services B is added. Additionally, the set of time steps S and the set of typologies T are maintained from the original model.
The parameters required to model the flow of water among nodes are eliminated, while the SUDS storage dimensioning and costs parameters (generic depth α t and the unitary costs ς t for each typology t T ) and the inventory parameters (potential evapotranspiration ε t for each typology t T and infiltration δ n for each node n N ) are kept. The feasibility analysis (see Section 2.4) dictates the boundaries (minimum μ o t and maximum τ o t   areas) for SUDS implementation. A priority-coefficient parameter ( γ b n   for   each   benefit   b B   and   node   n N ) and an ecosystem service provision parameter ( θ b t   for   each   benefit   b B   and   typology   t T ) are included to account for the ecosystem services needs of each site and the potential services provision of each SUDS typology, respectively (see Section 2.2 and Section 2.3).
The variable run-off volume stored in the SUDS ( β n s ) is calculated using the rational method, for each node n N and time step s S . This means that previous to the optimization process, the drainage area to each potential SUDS site has to be delineated (commonly from a Digital Surface Model) and a run-off coefficient determined (frequently from a land-use classification or an impervious cover shapefile). If the project is in its planning stages, the potential run-off generation is calculated based on the analysis of the projected land use. The variable x n t is a binary variable that takes the value of 1 if the typology t is selected for node n N and 0 otherwise; while y n t is a variable that represents the area of the typology t     T to be installed in the node n N .
The three objective functions defined in this model are run-off minimization, ecosystem services generation maximization, and cost minimization, following the ranking provided by the stakeholders. The model, often called the ϵ constraint model [78], handles the objectives following a pre-defined lexicographic order. The first objective is the sum of the run-off contributions from all the sites including areas with and without assigned SUDS (see Equation (5)). The second objective is the multiplication of the priority index (a larger index value corresponds to sites most needed for the ecosystem service), the SUDS area (a larger area provides a larger benefit), and the ecosystem service provision parameter (see Equation (6)). The third and last objective is the minimization of the unitary cost of the SUDS multiplied by its area (see Equation (7)).
min n N s S   r n s
  • r n s :   r u n o f f   v o l u m e   g e n e r a t e d   i n   n o d e   n N   a n d   t i m e   s t e p   s S
max n N b B t T   γ b n θ b t y n t
  • γ b n : p r i o r i t y   c o e f f i c i e n t   o f   b e n e f i t   b B   a n d   n o d e   n N
  • θ b t : e c o s y s t e m   s e r v i c e   p r o v i s i o n   o f   b e n e f i t   b B   a n d   t y p o l o g y   t T
  • y n t : a r e a   p e r   S U D S   t y p e   n N   and   typology   t T
min n N t T ς t y n t
  • ς t : cost per type of SUDS
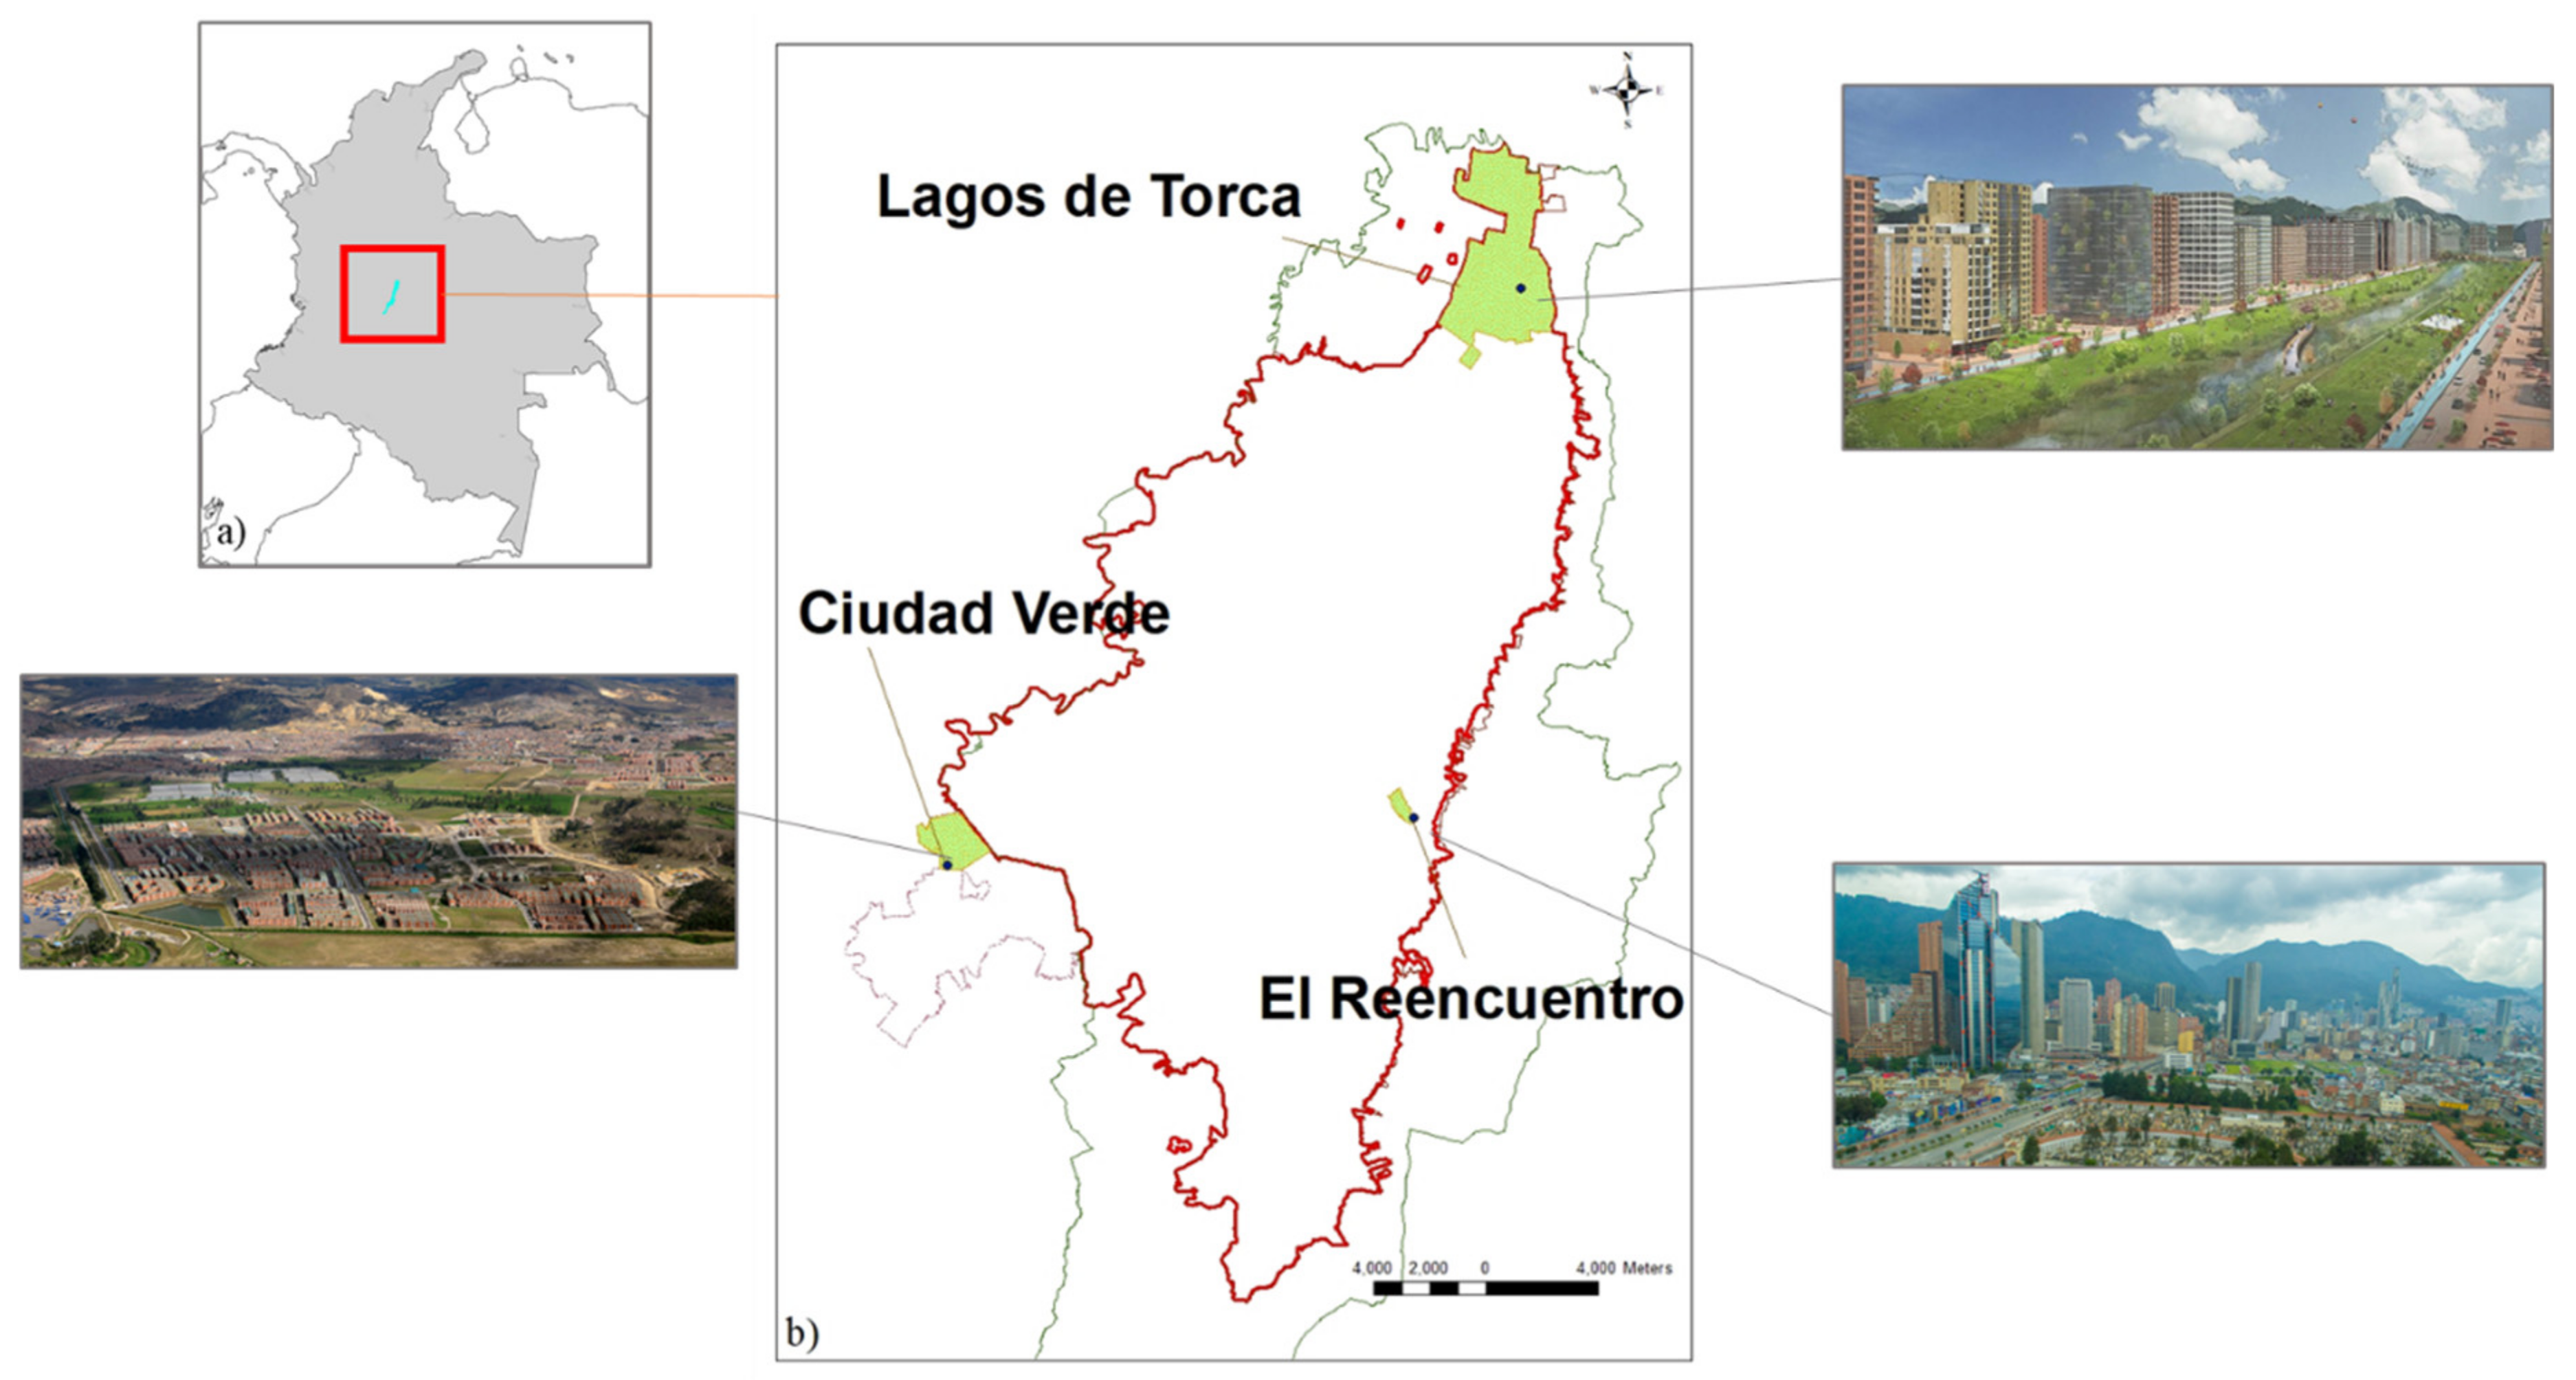
  • y n t :   a r e a   p e r   S U D S   t y p e   a n d   t y p o l o g y   t T
Four budget scenarios were defined as percentages of the total budget assigned for public space interventions on each project. The criteria to define the percentages were based on the feasibility of public space inversion according to the project profiles. Scenario A represents the selection without budget restriction, scenario B is 5% of the total budget, scenario C is 10%, and scenario D is 20%. For more details on the optimization model, refer to Torres et al. [35].

3. Case Study

Bogotá is located on the eastern plateau of the Andes mountains (2600 m. a. s. l). With approximately 1600 km2 it is the largest city in Colombia and is considered a sprawling city [79,80]. The urbanization process of the city started in the twentieth century (the 1950s) with the boundary’s expansion to the north, west, and south. In the 1970s, this growth promotes developers to create important commercial and housing investment projects that influenced the socio-economical population distribution in the territory [80].
The investment projects generated a socio-spatial segregation of the population, which resulted in high-income citizens living in the northeast part of the city and lower-income citizens in the south and peripheries. This pattern obeys a long process of migration to Bogotá and its highlands [80]. In the last 30 years, the city grew from less than five million inhabitants to seven million. The last census data (2018) reports a total of 7,181.469 habitants in the city area with a population increment of 6.5% in the period 2005–2018 [81].
In the three cases studies, the implementation of SUDS has a specific objective. In Ciudad Verde, SUDS could solve problems in water management by integrating the prevalent dynamic of the area to fulfill the inhabitant’s needs. Conversely, in Lagos de Torca these systems could improve the ecosystem restoration and in El Reencuentro could support the sustainable transformation of public space.

3.1. Ciudad Verde

This project is situated in Soacha, located in the southwest part of Bogotá (see Figure 2). By 2010, when it was proposed, the project objectives were to introduce Leadership Energy & Environmental Design (LEED) principles for the construction of 51,616-unit urban houses and the development of amenities to improve the citizens’ quality of life. The project comprises 3.19 km2, it has a construction index of 2400 dwellings per ha, and an average of 3.6 inhabitants per housing unit. Although for 2019, 40,535 housing units were already built, only 14% of the planned amenities were in place. This construction dynamic has led to a failure in the provision of essential services. In addition, an analysis of urban ecology shows that green areas were not large enough or functional diverse according to the population density requirements. The latter increases the potential risk of changing vegetated surfaces by impervious surfaces due to failures in maintenance and management [82].

3.2. Lagos de Torca

The high-scale urban expansion project Lagos de Torca is in the north area of the city of Bogotá (see Figure 2). Its eastern limit is a forest protection zone, the western limit is a rural area, and the southern limits are the main urban roads of the zone. The main drivers of this project are the restoration of the Torca-Guaymaral wetland, the development of a 1.5 km2 metropolitan park, the enhancement of social cohesion between habitats, and the construction of 125,000 unit-housings.
The extension of the project is about 18 km2 divided into thirty-four (34) urban development plans (The urban development plans called in Spanish Plan parcial, are used to articulate the objectives of territorial distribution with land use management policies. These plans, include technical, juridical, and economic requirements, as well as urban designs for the development of a project [86]). These plans consider the restoration of the ecology corridors of the territory, and the expansion and adaptation of the principal infrastructure (e.g., roads, hospitals, transport facilities, and other urban amenities). Given the current phase of each plan, two urban development plans in the adoption phase were analyzed (i.e., El Bosque and Tibabita) given the information available.

3.3. El Reencuentro

El Reencuentro is an urban renewal area in the eastern center of the city (see Figure 2), between three (3) urban localities. It is located at a strategic point connected to important urban facilities and infrastructure. For this analysis, an area of 0.51 km2 was selected in which two urban development plans are development process (named Calle 26 and Calle 24) [87].
The case study area contains nodal points, which involve cultural, historical, recreational, and transport infrastructure. The aim of the urban planning projects in the study is to give a different meaning to the territory, enhance the quality of public spaces, integrate the physical and social public space, improve the environmental quality of the zone, and consolidate the system for equitable mobility.

4. Results

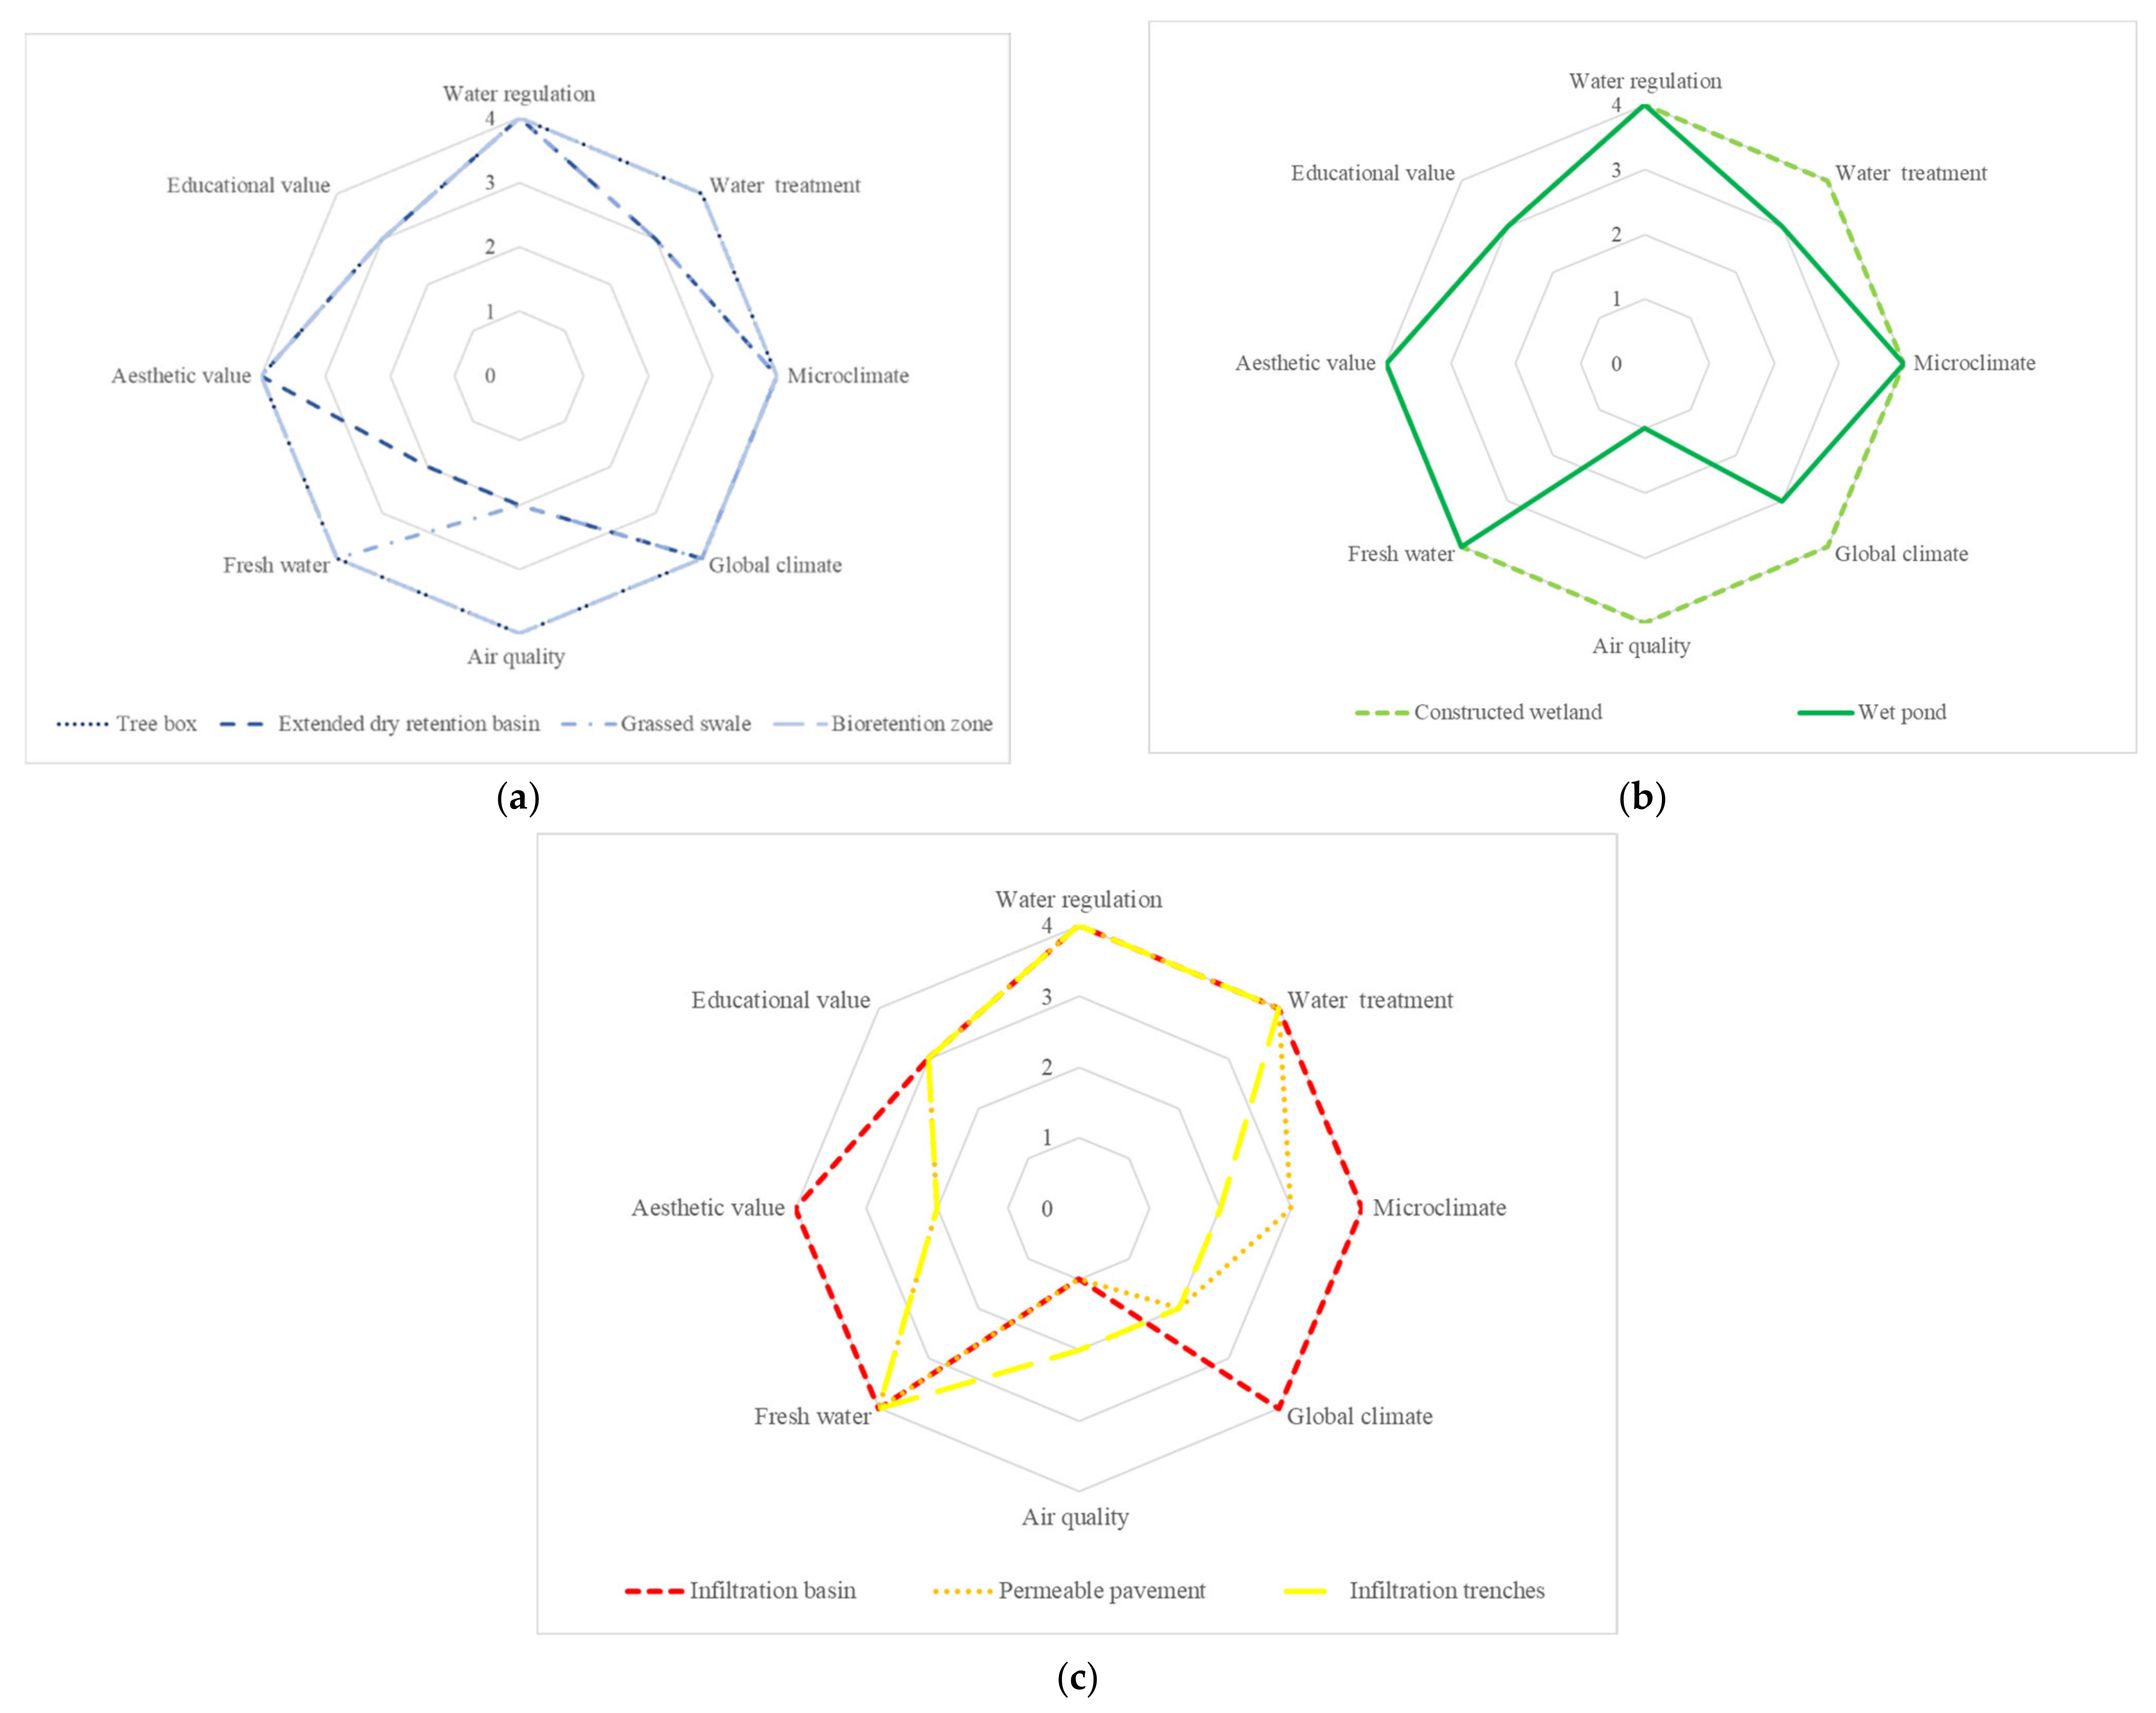
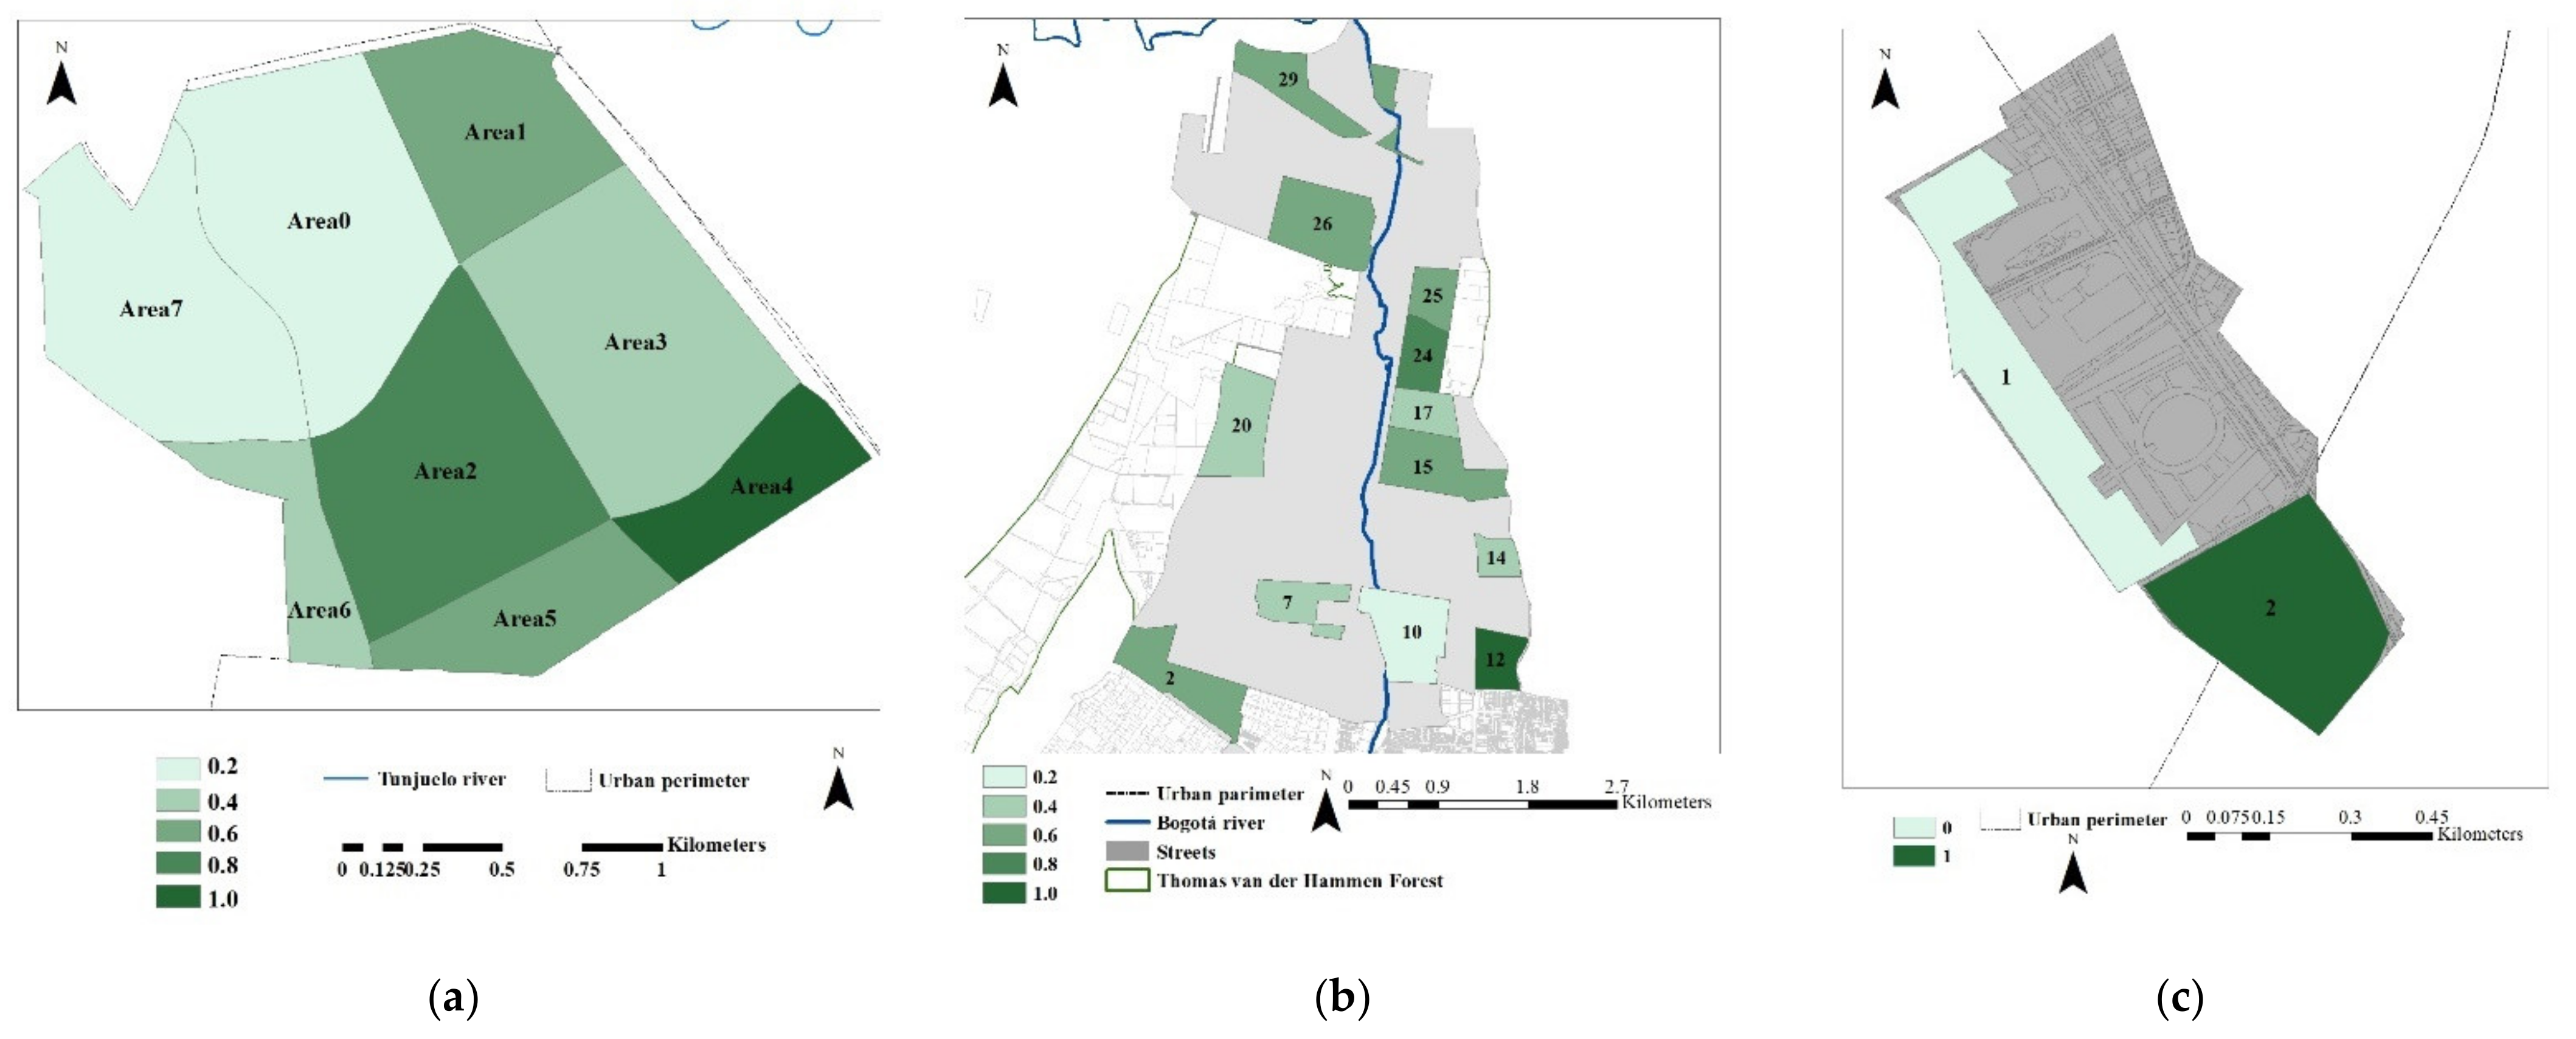
4.1. Preliminary Analysis

Figure 3 presents the graphical relationship between the ecosystem services and the nine (9) SUDS types selected in this study (i.e., grassed swales, bioretention zone, tree boxes, extended dry retention basin, infiltration trenches, permeable pavement, wet pond, constructed wetland, and infiltration basins) (see Supplementary Materials File S1). From this analysis, can be identified the systems that promote a specific service and the intensity of the relation. For example, constructed wetlands (retention SUDS type) and bioretention zones (detention SUDS type) are related to the generation of almost all the services (score 4), and infiltration trenches (infiltration SUDS type) are closely related to water management services promoting water regulation, water treatment, and freshwater provision.

4.2. Priority Index

Figure 4 illustrates the seven areas studied in Ciudad Verde. The priority index shows that area 7 has the lowest priority (percentile 0.2) (lighter green in Figure 4a). This area has a smaller proportion of principal roads, impervious areas, and the highest proportion of parks and green areas compared to the other areas. These characteristics decrease the demand for regulation services (e.g., microclimate regulation, global climate regulation, and air quality regulation), socio-cultural services, and increase the requirements of provision services. On the other hand, area 4 has the highest priority index (percentile 1.0), which is explained by its high proportion of principal highways, impervious areas, and less percentage of parks and green areas, affecting the requirements of regulation services.
Figure 4b presents the priority index for Lagos de Torca. The area with the highest priority index (percentile 1.0) was Tibabita (Figure 4b area 12). This area has the highest proportion of roads and a lower proportion of green areas that affect the air quality and global climate regulations services. In addition, this area has the lowest proportion of green area per citizen and a high distance to the principal wetland of the zone, affecting the generation of socio-cultural services. On the other hand, El Rosario (Figure 4b area 10) had the lowest priority (percentile 0.2) because of the higher potential of socio-cultural services related to the high proportion of green area per citizen that improve the aesthetic value of the area.
Figure 4c shows the results of the priority index in the urban planning projects of El Reencuentro. This analysis provides evidence that the urban planning project Calle 26 (Figure 4c area 2) has a higher priority (percentile 1.0) compared to the urban planning project Calle 24 (Figure 4c area 1). These results are attributed to the high presence of green areas, which required more water for irrigation affecting the provision of services, and the high distance to key infrastructure (such as El Renacimiento park) which implies a scarcity in provisioning and socio-cultural services.
Detailed priority index results obtained by ecosystem service in each case study can be consulted in Supplementary Materials File S2.

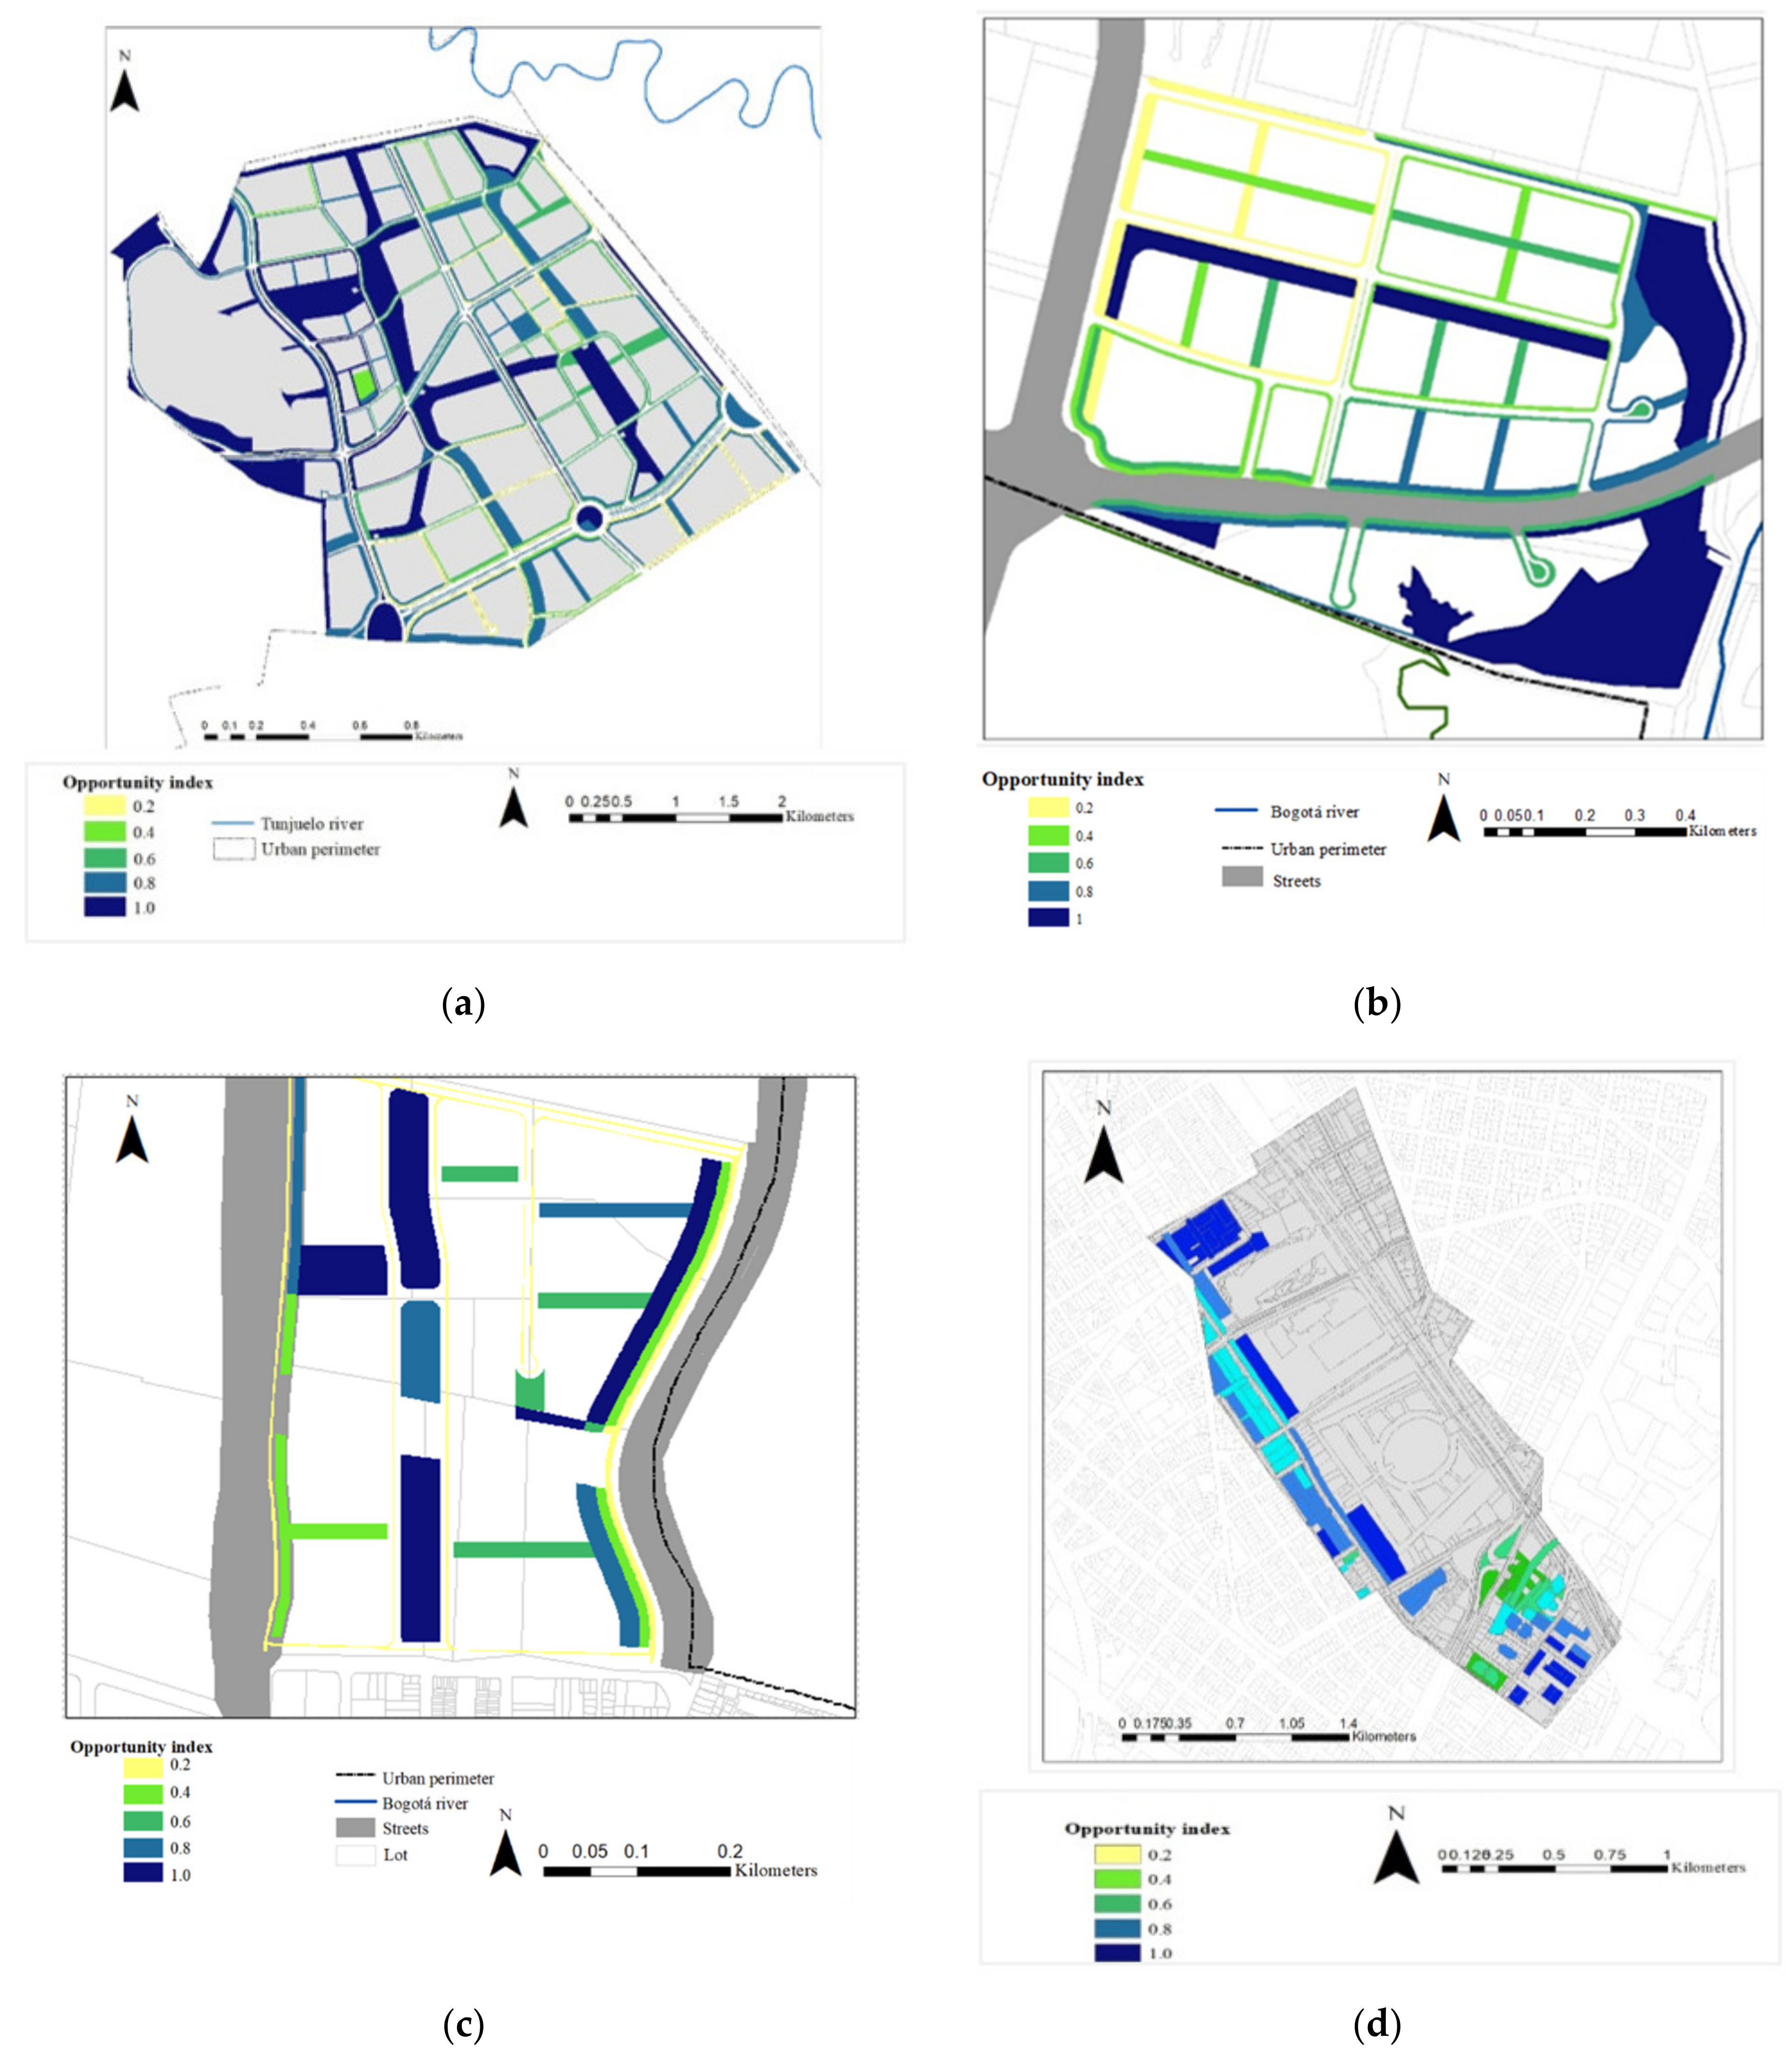
4.3. Opportunity Index

The opportunity index allowed the quantification of the potential to provide ecosystem services in comparison to the zones of intervention in the public space. Figure 5a shows the results of this index for Ciudad Verde. The intervention zones identified with the highest potential to provide ecosystem services are Areas 0, 2, 3, 5, 6, and 7 refer to Figure 4a) due to the high proportion of green areas and low proportion of highways. Additionally, the opportunity index evidenced that just 32 polygons of the urban assets have a high opportunity index (percentile 1.0), and among them: 62.5% are parks, 15.6% are streets isolators, 9.4% are river buffer protection zones, 9.4% are environmental control zones and the 3.1% are sidewalks. Furthermore, the urban assets with the highest potential to provide ecosystem services are located in area 7.
In Lagos de Torca, just two of the 34 urban development plans are formally accepted for implementation (refer to Figure 4b area 12 (Tibabita) and area 26 (El Bosque)). Figure 5b,c present the opportunity zones for El Bosque and Tibabita, respectively. The zone with the highest potential provision of ecosystem services in El Bosque is Parque Guaymaral (percentile 1.0). This zone has a higher potential to generate high-quality run-off since it has a larger available green area and less distance to activity nodes that promote water regulating and socio-cultural services. Among the public space areas with a percentile near 1.0, 16.7% are environmental control zones, 50% are parks, and 33.3% are ecologic connectivity zones. In the case of Tibabita, the areas with the highest potential for ecosystem services generation were the parks in the center of the zone across the case study (calle 39 and 37) mainly because of their large areas (8023.4 m2 and 7512.4 m2, respectively) in comparison with the other zones that promote regulating and socio-cultural services. Just four (4) public spaces areas provide a high opportunity index (percentile 1.0) 25% are environmental control zones and 75% are parks.
Figure 5d presents the results of the opportunity index for El Reencuentro showing that most zones with a higher potential to generate ecosystem services are located on the Calle 24 (refer to area 1 Figure 4c) urban planning project, where a higher potential for regulating and socio-cultural services is available. Furthermore, the public space areas with an opportunity index percentile near 1.0 are pedestrian traffic recovery zones 9.1%, median 27.3%, parks 9.1%, and squares 54.5%.
Detailed opportunity index results obtained by ecosystem service in each case study can be found in Supplementary Materials File S3.

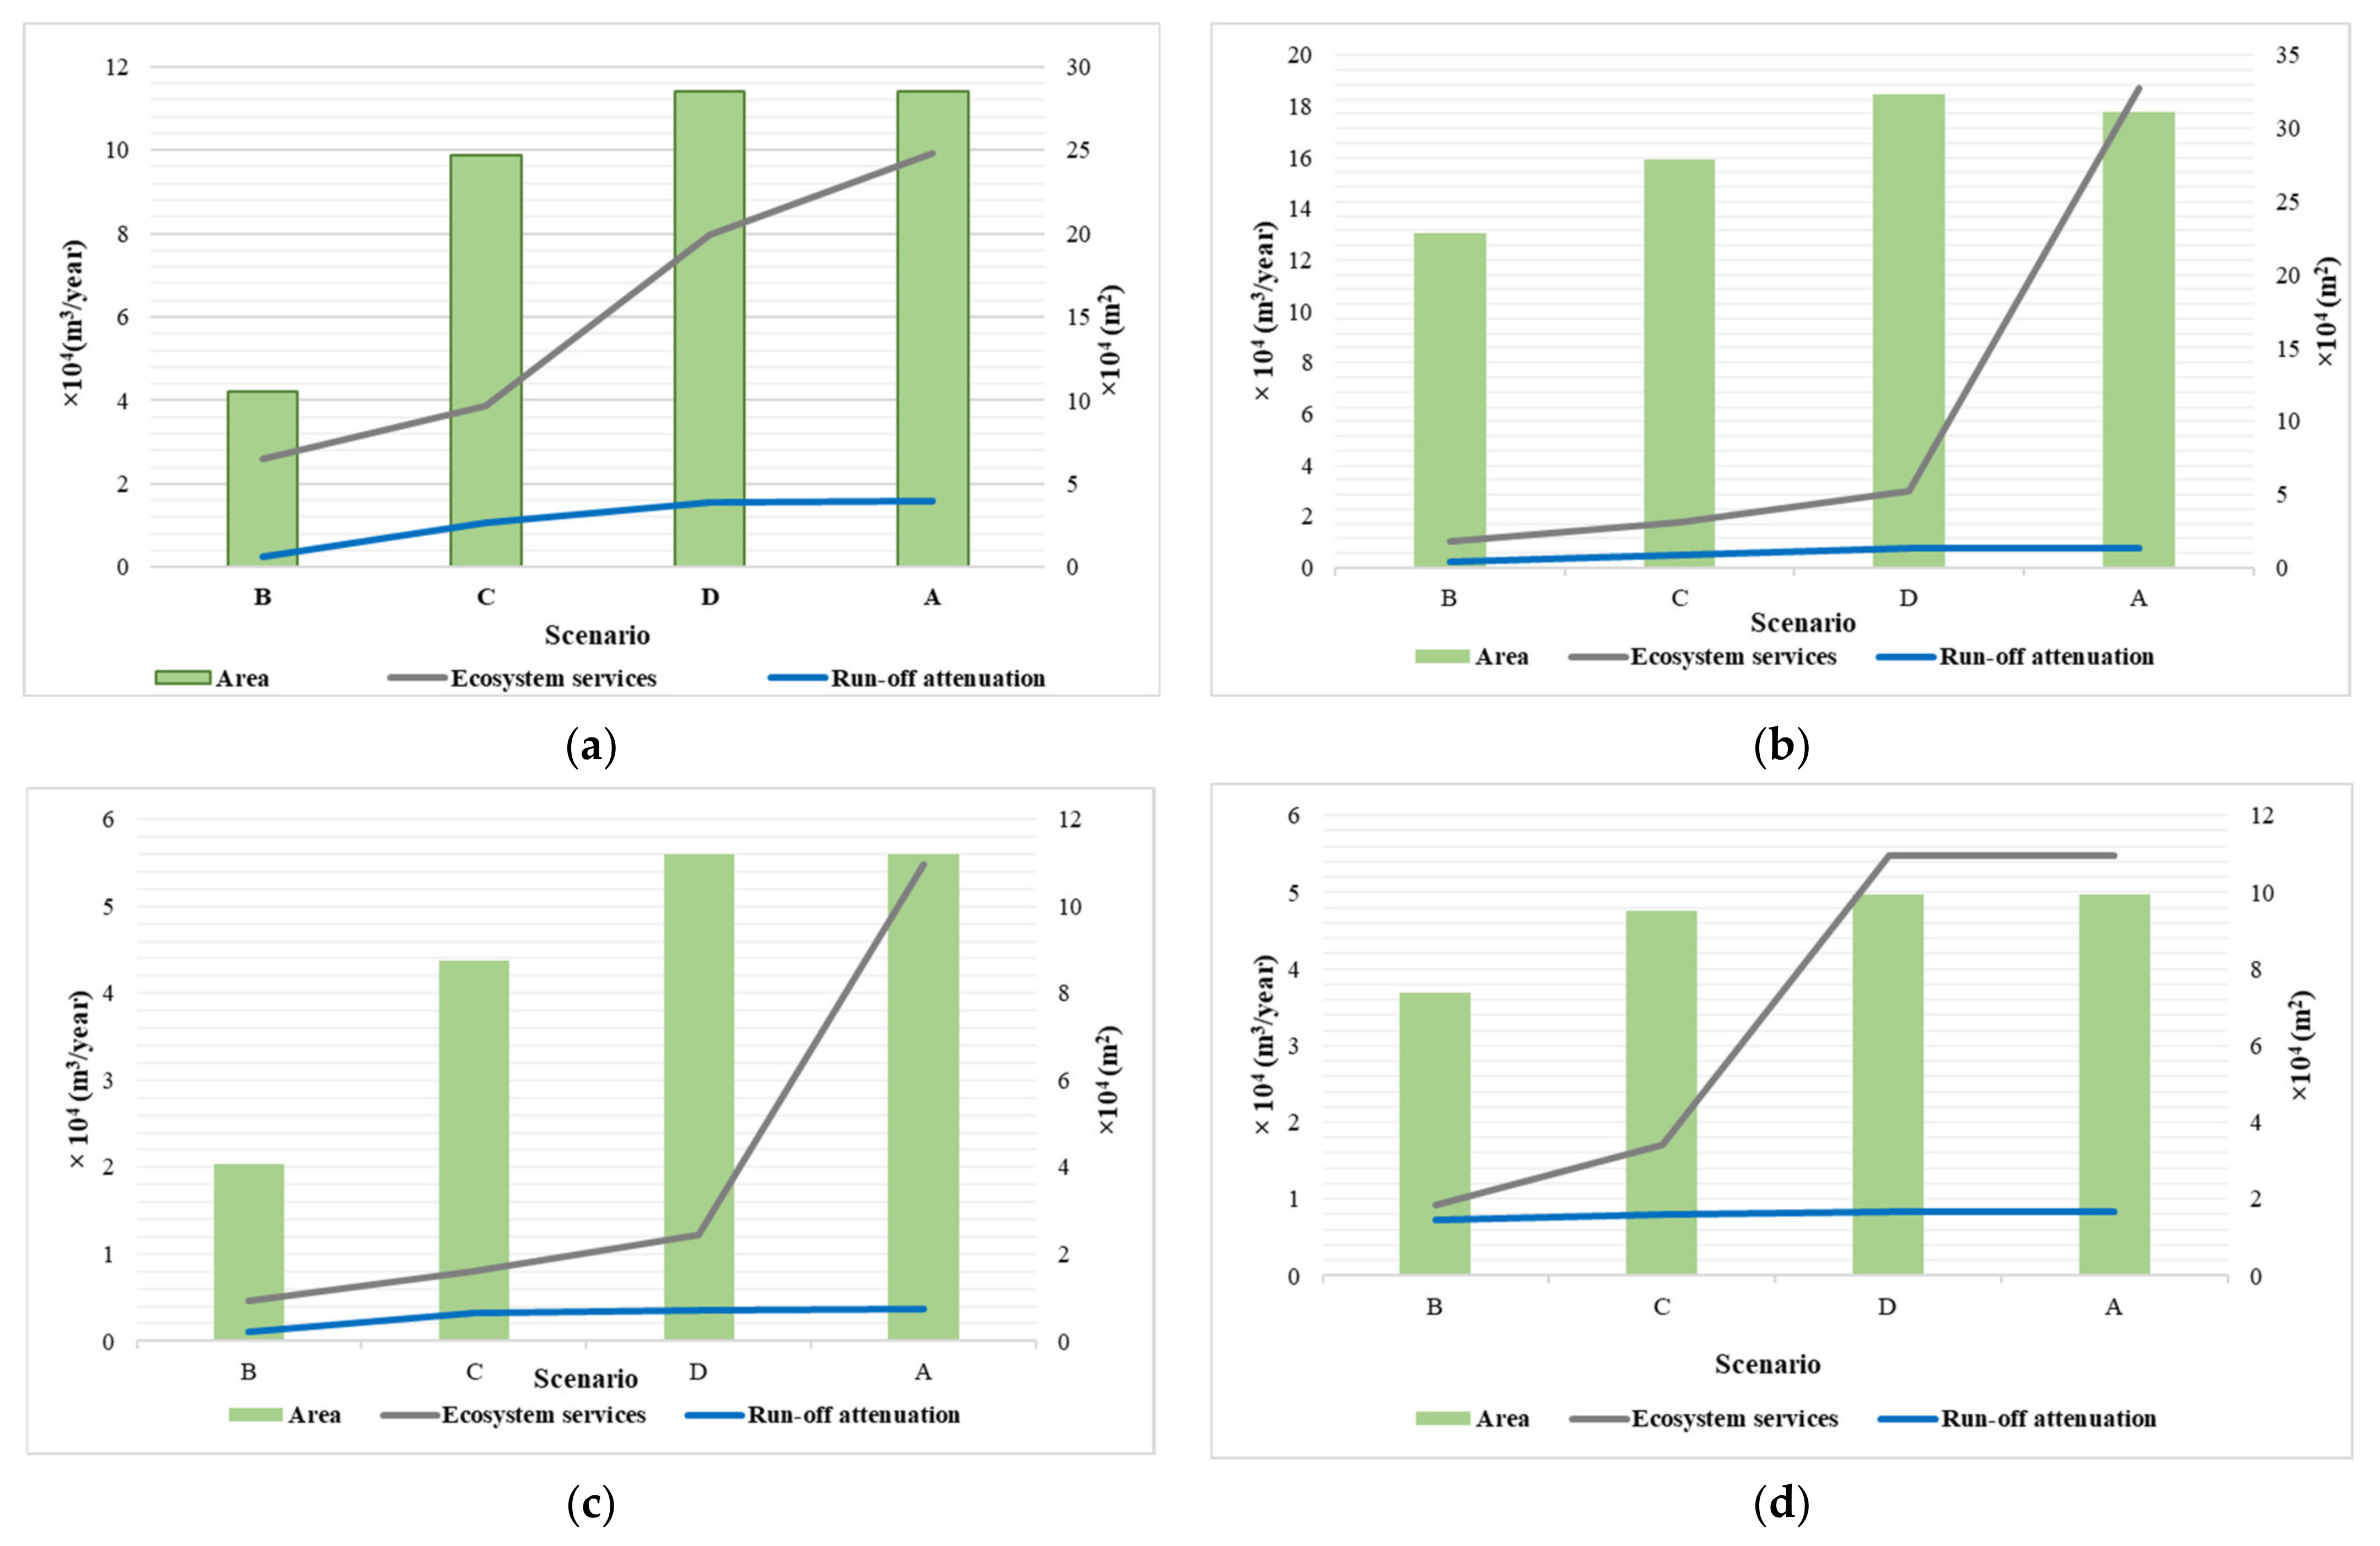
4.4. Feasibility Analysis and Optimization

Four budget scenarios were defined as percentages of the total budget assigned for public space interventions on each project. Scenario A represents the selection without budget restriction, scenario B is 5% of the total budget, scenario C is 10%, and scenario D is 20% (see Table 4). Table 5 presents the main results associated with the budget scenarios, run-off attenuation, area available for SUDS implementation, and ecosystem benefits generation in each case study. The case study with the highest budget in the urban planning project Calle 26 in El Reencuentro (see Table 4). However, due to the physical restrictions of this area, the budget does not have an impact on the type of SUDS selected (just feasible tree boxes). The budget, however, does, impacts the available area for SUDS implementation affecting the potential run-off attenuation. For example, in scenario A (not budget restrictions) this available area can be potentially 100% in El Reencuentro in comparison with the other case studies.
All the case studies reflect an increment in the ecosystem services generation with an increasing budget, area for SUDS implementation, and run-off attenuation. The case study with the highest potential to generate ecosystem services is El Bosque. This result can be related to the presence of Parque Guaymaral as the main green area of the zone promoting regulation services.
The best scenario in each case study was selected based on the inflection point between the percentage of run-off attenuation and the optimized cost of SUDS implementation in each scenario (see Supplementary Materials File S4). Detailed analyses of the optimization results for each case study are described in Supplementary Materials File S4. In Ciudad Verde, scenario C was the best choice for run-off management. This scenario achieved a 68.22% of run-off volume reduction (10,781.01 m3/year) at a total optimized cost of $763,165 USD. The types of SUDS included in this scenario promote detention (grassed swales and dry extended retention basin) and retention (wet pond) of run-off (see Figure 6a). In El Bosque, the optimization model indicates scenario D is the best choice for SUDS configuration with a run-off volume reduction of 12,410 m3/year (81.5%) at a total optimized cost of $775,971 USD. In Tibabita, scenario C is the best option with 6428.47 m3/year (83.4%) at a total optimized cost of $468,978 USD. In the case of El Bosque, this selection promotes the detention (grassed swales and bioretention zones) and retention (wet ponds) functions (see Figure 6b,c). While in the Tibabita plan, the most effective processes to manage stormwater were infiltration (infiltration basin) and retention (wet pond). Finally, for El Reencuentro the C option was selected from the optimized scenarios. In that case, the run-off volume reduction was (15,937 m3/year—94.0%) with an optimized cost of $371,682.41 USD. Figure 6c illustrates the optimization process results in each scenario. In this option, the main processes promoted by the SUDS are detention (tree boxes, bioretention zones, and grassed swales) and infiltration (infiltration basin).

5. Discussion

In this study, there are no significant differences in terms of spatial resolution or accuracy of the information used in the case studies, making the results obtained comparable. Results evidence that benefits generation by SUDS implementation (run-off and ecosystem services generation) is restricted by the interaction among two main characteristics of each case study: the budget restrictions and the area available. These characteristics define the types of SUDS selected in each scenario and case study. For example, in scenarios, B and C of Ciudad Verde, the same types of SUDS were selected (wet ponds, grassed swales, and extended dry detention basins). However, in scenario C the budget restriction gives more space to wet ponds and grassed swales than extended dry detention basins in comparison to scenario B. These changes in the area increase the ecosystem services generation by 32.3% and the run-off attenuation by 52.3%. Moreover, when the budget is not a predominant restriction (scenarios D and A), the area available for SUDS implementation is just limited by the geometric and physical characteristics of the case study, and the benefit generation is associated with the types of SUDS selected. In this way, the comparison among scenarios A and D of Ciudad Verde reflects an increment of 19.7% in ecosystem services’ generation and 1% in run-off attenuation attributable to the change in the types of SUDS selected in the same area.
The influence of these variables had the same pattern in all case studies highlighting the importance of the case study characteristics in the urban development plan. This influence has been previously studied by Gomes et al. [88] at a basing scale, concluding that this process has to be oriented by the watershed characteristics to achieve better efficiency in run-off control. However, to make a comparative analysis among projects in other contexts is important to consider the differences in the spatial resolution of data and the availability of the information to define the evaluation criteria.
Ecosystem services generation does not present the same pattern in all case studies. In the Ciudad Verde and Lagos de Torca ecosystem services generation had a continuous slope that tends to increase according to the budget scenario (see Figure 6a–c). This result suggests that the available budget and area for SUDS implementation are not enough to achieve the potential generation of ecosystem services in these projects. In El Reencuentro, this pattern is not reflected because of the physical characteristics of the case study that restrict the type of SUDS selected in the south zone (tree boxes without infiltration process).
The results also evidence the influence of the maximization of benefits on the types of SUDS selected. For example, Ciudad Verde is the case study with the highest scarcity of ecosystem services (mainly regulation services). In this way, the results of the scenarios without budget or area restriction (A) tend to promote SUDS types that increase these regulation services with a score higher or equal to three (3) (i.e., tree boxes, infiltration basins, bioretention zones, etc.). Another example is the El Bosque project, in which ecosystem services scarcity is related to the provision of services, and the SUDS types selected promote this service (i.e., wet ponds and bioretention zone). The same pattern was observed in the other projects.
This study analyzed the benefits generation using the MA [60] ecosystem services framework and hence is subject to the limitation inherent to the framework. The new IPBES framework nature’s contribution to people (NCP) approach introduces the role of culture as a transversal edge of analysis of the services or disservices provided by nature and transforms the generalizing perspective of the MA into a context-specific perspective [89]. While the MA cultural ecosystem services are considered an isolated category, in the NCP approach culture has a protagonist role by shaping the perception of nature and permeating the three main NCP categories (i.e., material, non-material and regulation services) [89,90]. Furthermore, the main criticism of the MA is related to the use of this approach to evaluate and evaluate the stock-and-flow of the relationship between people and nature, leaving behind the influence of social sciences [90]. Therefore, using the MA approach in this study restricts the analysis of the role of culture on the perception of the benefits of SUDS implementation.
Regarding the socio-cultural priority index proposed, it can be affected by the heterogeneity of social structure reflected in differences in socio-cultural behaviors. These changes are not perceived by the priority index because there is a weak relationship between the evaluation criteria proposed and the socio-economic context. In addition, the proposed methodology does not integrate the local resistance to the traditional patterns of water management in the urban planning process that affect the implementation of different types of SUDS. This limitation is particularly important in the case study El Reencuentro because, usually renewal project zones are surrounded by social and economic problems such as loss of social cohesion, evaluation of policy development, affection for vulnerable groups, and impacts on the living environment. Such problems, affect the viability of all types of sustainable development highlighting the importance of defining a clear scope of socio-economic objectives in parallel with the sustainable vision of the projected interventions [91].
On the other hand, the availability of the input data determines the adaptability of the methodology. The implementation of the methodology in the three (3) case studies of this research required the use of information that was provided by private or public institutions developers of the projects. Commonly, the information on land use distribution, socio-economical distribution, and preliminarily project designs are part of prefeasibility phase of the planning process. In this way, is necessary that the context of replication of this methodology involve the presence of several stakeholders and developers allowed to share this information. Additionally, some improvements can be done during the prefeasibility analysis (phase 3) of the methodology by the development of infiltration and water table in situ tests to adapt these physical characteristics to the scale of the project for more accurate results.
The literature strongly recommends the implementation of SUDS linked together to form SUDS management trains to improve the efficiency of management of pollution, flow rates, and volume [17,39,92]. However, fewer studies analyzed the implementation of SUDS from a “train” perspective, and those who consider multiple structures tend to select them according to their individual efficiency or stakeholders’ recommendations [93]. From this perspective, the results reported in this study had to be considered as a starting point to identify the feasibility of the structures in each case study.
Similarly, the results reported in Table 5 are considered as a reference magnitude of the aggregated ecosystem services generation, but this quantity is not related to a specific unit for analysis. This limitation affects the use of this quantity for future economic valuation of the services.
In this way, this methodology is a tool that supports the decision of urban planners during the first phase of analysis but requires validation by technical experts. Additionally, the selection of SUDS trains to achieve the local goals of the projects (e.g., water quality, air quality regulation, run-off management) can require additional assessment.
In order to amplify the influence of this methodology on the decision planning process, future work will be required for the integration of qualitative socio-cultural tools to measure the stakeholder’s appreciation of ecosystem services (phase 1). To achieve this socio-economic integration is necessary to extend the SUDS definition to the umbrella concept of Nature-based Solutions (NBS) defined by the European Commission as “solutions that are inspired and supported by nature, which are cost-effective, simultaneously provide environmental, social and economic benefits and help build resilience” [94]. This new perspective creates multifunctional solutions that generate different types of co-benefits (e.g., social engagement, air quality improvements) and recognized the resilience capacity of ecosystems to support perturbations [95]. In addition, it is essential to implement standard environmental, social, and economic monitoring processes to quantify the flux of ecosystem services to evaluate the benefits provided by NBS implementation.

6. Conclusions

This research developed a flexible and adaptable methodology for SUDS selection and location using a multi-objective optimization technique to minimize run-off, maximize ecosystem services and minimize cost. The methodology proves to be adaptable to diverse planning project stages (e.g., developed project, planning phase, and renewal project) and to be flexible to different types of urban projects with particular restrictions (e.g., available urban space and soil types): Ciudad Verde, Lagos de Torca, and El Reencuentro.
The results of this research highlight the importance of evaluation criteria to identify urban zones with the scarcity of ecosystem services potentially compensable by SUDS implementation. These results are helpful to support the early stages of urban planning tools by allowing the identification of existing and future needs that should be addressed in the planning process, supporting the selection of alternative solutions, and aiding the design of planning tools (i.e., standards, policy objectives, or regulations) to maximize ecosystem services.
Future work includes stakeholders’ appreciation of ecosystem services delivered by SUDS considering the integration of a qualitative or quantitative approach into the preliminary analysis. Besides this, it is also important to include a “train” perspective during the optimization phase for the analysis of the integration of multiple structures and their impact on benefiting generation efficiency (e.g., ecosystem services, run-off attenuation). Finally, the methodology can be improved by carrying out an economic valuation of benefits either using ecosystem service measurements or by using literature transfer of benefits.

Supplementary Materials

The following supporting information can be downloaded at: https://0-www-mdpi-com.brum.beds.ac.uk/article/10.3390/su14084560/s1, File S1: Preliminary ecosystem services analysis. File S2: Priority index analysis per service. File S3: Opportunity index analysis per service. File S4: Optimization analysis.

Author Contributions

Conceptualization, J.U.-A., S.L.J.-A., M.N.T., N.A.B., M.M.G.-G. and J.P.R.; formal análisis, S.L.J.-A., M.N.T., N.A.B. and M.M.G.-G., funding acquisition; J.P.R.; investigation, J.U.-A., S.L.J.-A., M.N.T., N.A.B. and M.M.G.-G.; methodology, S.L.J.-A., M.N.T., N.A.B. and M.M.G.-G.; project administration, J.P.R.; resources, J.P.R.; software, M.N.T.; supervision, J.P.R.; validation, J.U.-A.; visualization, J.U.-A.; writing—original draft preparation, J.U.-A.; writing—review and editing, J.U.-A., S.L.J.-A., M.N.T., N.A.B., M.M.G.-G., J.P.R. All authors have read and agreed to the published version of the manuscript.

Funding

This research was supported by the European Union-funded project euPOLIS "Integrated NBS-based Urban Planning Methodology for Enhancing the Health and Well-being of Citizens: the euPOLIS Approach" under the Horizon 2020 program H2020-EU.3.5.2., grant agreement No 869448 and the UK Government’s Foreign, Commonwealth and Development Office (FCDO) and the Department for Business, Energy and Industrial Strategy (BEIS) through the UK’s International Climate Finance (UK PACT programme) by funding the project "Systemic perspectives on low-carbon cities in Colombia - An integrated urban modeling approach for policy and regulatory analysis”.

Institutional Review Board Statement

Not applicable.

Informed Consent Statement

Not applicable.

Conflicts of Interest

The authors declare no conflict of interest.

References

  1. Mahmood, I.M.; Elagib, N.A.; Horn, F.; Saad, S.A.G. Lessons learned from Khartoum flash flood impacts: An integrated assessment. Sci. Total Environ. 2017, 601–602, 1031–1045. [Google Scholar] [CrossRef] [PubMed]
  2. Mawlong, B.L. Climate Change and Developing Countries, 8th ed.; Cambridge Scholars Publishing: Cambridge, UK, 2018. [Google Scholar]
  3. McClymont, K.; Cunha, D.G.F.; Maidment, C.; Ashagre, B.; Vasconcelos, A.F.; de Macedo, M.B.; dos Santos, M.F.N.; Júnior, M.N.G.; Mendiondo, E.M.; Barbassa, A.P.; et al. Towards urban resilience through Sustainable Drainage Systems: A multi-objective optimisation problem. J. Environ. Manag. 2020, 275, 111173. [Google Scholar] [CrossRef] [PubMed]
  4. Fletcher, T.D.; Shuster, W.; Hunt, W.F.; Ashley, R.; Butler, D.; Arthur, S.; Trowsdale, S.; Barraud, S.; Semadeni-Davies, A.; Bertrand-Krajewski, J.-L.; et al. SUDS, LID, BMPs, WSUD and more—The evolution and application of terminology surrounding urban drainage. Urban Water J. 2015, 12, 525–542. [Google Scholar] [CrossRef]
  5. Andrés-Doménech, I.; Anta, J.; Perales-Momparler, S.; Rodriguez-Hernandez, J. Sustainable Urban Drainage Systems in Spain: A Diagnosis. Sustainability 2021, 13, 2791. [Google Scholar] [CrossRef]
  6. Gimenez-Maranges, M.; Breuste, J.; Hof, A. Sustainable Drainage Systems for transitioning to sustainable urban flood management in the European Union: A review. J. Clean. Prod. 2020, 255, 120191. [Google Scholar] [CrossRef]
  7. Fisher, B.; Turner, R.K.; Morling, P. Defining and classifying ecosystem services for decision making. Ecol. Econ. 2009, 68, 643–653. [Google Scholar] [CrossRef] [Green Version]
  8. Mak, C.; Scholz, M.; James, P. Sustainable drainage system site assessment method using urban ecosystem services. Urban Ecosyst. 2016, 20, 293–307. [Google Scholar] [CrossRef] [Green Version]
  9. Charlesworth, S.M.; Fontaneda, L.A.S.; Mays, L.W. Back to the Future? History and Contemporary Application of Sustainable Drainage Techniques. In Sustainable Surface Water Management: A Handbook for SuDS; John Wiley & Sons: Hoboken, NJ, USA, 2016; pp. 11–30. [Google Scholar] [CrossRef]
  10. City of Edmonton. Low Impact Development—Best Management Practices Design Guide; City of Edmonton: Edmonton, AB, Canada, 2014. [Google Scholar]
  11. Department of Water; Goverment of Western Australia. Stormwater Management Manual for Western Australia; Department of Water: Perth, Australia, 2004.
  12. Dylewski, K.; Brown, J.; LeBleu, C.; Brantley, E.F. Low Impact Development Handbook for the State of Alabama; Alabama Department of Environmental Management: Montgomery, AL, USA, 2014.
  13. Phadke, U.; Vyakarnam, S. The Scale-Up Manual: Handbook for Innovators, Entrepreneurs, Teams and Firms; World Scientific: Singapore, 2018. [Google Scholar] [CrossRef]
  14. Philadelphia Water Department. The Philadelphia Stormwater Management Guidance Manual. Available online: https://www.pwdplanreview.org/manual/introduction (accessed on 15 December 2021).
  15. Melbourne Water. WSUD Engineering Procedures: Stormwater; CSIRO Publishing: Clayton, Australia, 2005. [Google Scholar]
  16. Urban Drainage and Flood Control District (Colorado). Urban Storm Drainage Criteria Manual; Urban Drainage and Flood Control District: Denver, CO, USA, 2010; Volume 3. [Google Scholar]
  17. Woods Ballard, B.; Willson, S.; Illman, S.; Scott, T.; Ashley, R.; Kellagher, R. The SuDS Manual; CIRIA: London, UK, 2015. [Google Scholar]
  18. Fluhrer, T.; Chapa, F.; Hack, J. A Methodology for Assessing the Implementation Potential for Retrofitted and Multifunctional Urban Green Infrastructure in Public Areas of the Global South. Sustainability 2021, 13, 384. [Google Scholar] [CrossRef]
  19. Roshni, J.; Wade, R.; Jefferies, C. Smart SUDS: Recognising the multiple-benefit potential of sustainable surface water management systems. Water Sci. Technol. 2015, 71, 245–251. [Google Scholar]
  20. Wang, J.; Pauleit, S.; Banzhaf, E. An Integrated Indicator Framework for the Assessment of Multifunctional Green Infrastructure—Exemplified in a European City. Remote Sens. 2019, 11, 1869. [Google Scholar] [CrossRef] [Green Version]
  21. Ruckelshaus, M.; McKenzie, E.; Tallis, H.; Guerry, A.; Daily, G.; Kareiva, P.; Polasky, S.; Ricketts, T.; Bhagabati, N.; Wood, S.A.; et al. Notes from the field: Lessons learned from using ecosystem service approaches to inform real-world decisions. Ecol. Econ. 2015, 115, 11–21. [Google Scholar] [CrossRef] [Green Version]
  22. Sutherland, I.J.; Villamagna, A.M.; Dallaire, C.O.; Bennett, E.M.; Chin, A.T.; Yeung, A.C.; Lamothe, K.A.; Tomscha, S.A.; Cormier, R. Undervalued and under pressure: A plea for greater attention toward regulating ecosystem services. Ecol. Indic. 2018, 94, 23–32. [Google Scholar] [CrossRef]
  23. Cortinovis, C.; Geneletti, D. A framework to explore the effects of urban planning decisions on regulating ecosystem services in cities. Ecosyst. Serv. 2019, 38, 100946. [Google Scholar] [CrossRef]
  24. Meerow, S.; Newell, J.P. Spatial planning for multifunctional green infrastructure: Growing resilience in Detroit. Landsc. Urban Plan. 2017, 159, 62–75. [Google Scholar] [CrossRef]
  25. Cortinovis, C.; Geneletti, D. Ecosystem services in urban plans: What is there, and what is still needed for better decisions. Land Use Policy 2018, 70, 298–312. [Google Scholar] [CrossRef]
  26. Langemeyer, J.; Gómez-Baggethun, E.; Haase, D.; Scheuer, S.; Elmqvist, T. Bridging the gap between ecosystem service assessments and land-use planning through Multi-Criteria Decision Analysis (MCDA). Environ. Sci. Policy 2016, 62, 45–56. [Google Scholar] [CrossRef]
  27. Arai, K.; Kapoor, S.; Bhatia, R. Intelligent Computing. In Proceedings of the 2020 Computing Conference, London, UK, 16–17 July 2020; Springer Nature: Berlin/Heidelberg, Germany, 2020; Volume 2. [Google Scholar]
  28. Zardari, N.H.; Ahmed, K.; Shirazi, S.M.; Bin Yusop, Z. Weighting Methods and Their Effects on Multi-Criteria Decision Making Model Outcomes in Water Resources Management; Springer: Berlin/Heidelberg, Germany, 2014. [Google Scholar]
  29. Odu, G. Weighting methods for multi-criteria decision making technique. J. Appl. Sci. Environ. Manag. 2019, 23, 1449–1457. [Google Scholar] [CrossRef] [Green Version]
  30. Grêt-Regamey, A.; Altwegg, J.; Sirén, E.A.; van Strien, M.J.; Weibel, B.; Grêt-Regamey, A.; Altwegg, J.; Sirén, E.A.; van Strien, M.J.; Weibel, B.; et al. Integrating ecosystem services into spatial planning—A spatial decision support tool. Landsc. Urban Plan. 2017, 165, 206–219. [Google Scholar] [CrossRef] [Green Version]
  31. Dell’Ovo, M.; Corsi, S. Urban Ecosystem Services to support the design process in urban environment. A case study of the Municipality of Milan. Aestimum 2021, 2021, 219–239. [Google Scholar] [CrossRef]
  32. García, A.M.; Santé, I.; Loureiro, X.; Miranda, D. Green infrastructure spatial planning considering ecosystem services assessment and trade-off analysis. Application at landscape scale in Galicia region (NW Spain). Ecosyst. Serv. 2020, 43, 101115. [Google Scholar] [CrossRef]
  33. Langemeyer, J.; Wedgwood, D.; McPhearson, T.; Baró, F.; Madsen, A.L.; Barton, D.N. Creating urban green infrastructure where it is needed—A spatial ecosystem service-based decision analysis of green roofs in Barcelona. Sci. Total Environ. 2019, 707, 135487. [Google Scholar] [CrossRef] [PubMed]
  34. Ronchi, S.; Arcidiacono, A.; Pogliani, L. Integrating green infrastructure into spatial planning regulations to improve the performance of urban ecosystems. Insights from an Italian case study. Sustain. Cities Soc. 2019, 53, 101907. [Google Scholar] [CrossRef]
  35. Torres, M.; Fontecha, J.; Walteros, J.; Zhu, Z.; Ahmed, Z.; Rodríguez, J.; Rabideau, A. City-scale optimal location planning of Green Infrastructure using piece-wise linear interpolation and exact optimization methods. J. Hydrol. 2021, 601, 126540. [Google Scholar] [CrossRef]
  36. Jayasooriya, V.M.; Muthukumaran, S.; Ng, A.W.M.; Perera, B.J.C. Multi Criteria Decision Making in Selecting Stormwater Management Green Infrastructure for Industrial areas Part 2: A Case Study with TOPSIS. Water Resour. Manag. 2018, 32, 4297–4312. [Google Scholar] [CrossRef]
  37. Jayasooriya, V.M.; Ng, A.W.M.; Muthukumaran, S.; Perera, B.J.C. Multi Criteria Decision Making in Selecting Stormwater Management Green Infrastructure for Industrial Areas Part 1: Stakeholder Preference Elicitation. Water Resour. Manag. 2018, 33, 627–639. [Google Scholar] [CrossRef]
  38. Bach, P.M.; McCarthy, D.; Urich, C.; Sitzenfrei, R.; Kleidorfer, M.; Rauch, W.; Deletic, A. A planning algorithm for quantifying decentralised water management opportunities in urban environments. Water Sci. Technol. 2013, 68, 1857–1865. [Google Scholar] [CrossRef]
  39. Bastien, N.; Arthur, S.; Wallis, S.; Scholz, M. The best management of SuDS treatment trains: A holistic approach. Water Sci. Technol. 2010, 61, 263–272. [Google Scholar] [CrossRef]
  40. Ariza, S.L.J.; Martínez, J.A.; Muñoz, A.F.; Quijano, J.P.; Rodríguez, J.P.; Camacho, L.A.; Díaz-Granados, M. A Multicriteria Planning Framework to Locate and Select Sustainable Urban Drainage Systems (SUDS) in Consolidated Urban Areas. Sustainability 2019, 11, 2312. [Google Scholar] [CrossRef] [Green Version]
  41. Kong, F.; Ban, Y.; Yin, H.; James, P.; Dronova, I. Modeling stormwater management at the city district level in response to changes in land use and low impact development. Environ. Model. Softw. 2017, 95, 132–142. [Google Scholar] [CrossRef]
  42. Ncube, S.; Arthur, S. Influence of Blue-Green and Grey Infrastructure Combinations on Natural and Human-Derived Capital in Urban Drainage Planning. Sustainability 2021, 13, 2571. [Google Scholar] [CrossRef]
  43. Scholz, M.; Uzomah, V. Rapid decision support tool based on novel ecosystem service variables for retrofitting of permeable pavement systems in the presence of trees. Sci. Total Environ. 2013, 458–460, 486–498. [Google Scholar] [CrossRef]
  44. Yang, W.; Zhang, J. Assessing the performance of gray and green strategies for sustainable urban drainage system development: A multi-criteria decision-making analysis. J. Clean. Prod. 2021, 293, 126191. [Google Scholar] [CrossRef]
  45. Menéndez Suárez-Inclán, A.; Allende-Prieto, C.; Roces-García, J.; Rodríguez-Sánchez, J.P.; Sañudo-Fontaneda, L.A.; Rey-Mahía, C.; Álvarez-Rabanal, F.P. Development of a Multicriteria Scheme for the Identification of Strategic Areas for SUDS Implementation: A Case Study from Gijón, Spain. Sustainability 2022, 14, 2877. [Google Scholar] [CrossRef]
  46. Joshi, P.; Leitão, J.P.; Maurer, M.; Bach, P.M. Not all SuDS are created equal: Impact of different approaches on combined sewer overflows. Water Res. 2021, 191, 116780. [Google Scholar] [CrossRef]
  47. Chang, N.-B.; Rivera, B.J.; Wanielista, M.P. Optimal design for water conservation and energy savings using green roofs in a green building under mixed uncertainties. J. Clean. Prod. 2011, 19, 1180–1188. [Google Scholar] [CrossRef]
  48. Jia, H.; Lu, Y.; Yu, S.L.; Chen, Y. Planning of LID–BMPs for urban runoff control: The case of Beijing Olympic Village. Sep. Purif. Technol. 2012, 84, 112–119. [Google Scholar] [CrossRef]
  49. Lee, J.G.; Selvakumar, A.; Alvi, K.; Riverson, J.; Zhen, J.X.; Shoemaker, L.; Lai, F.-H. A watershed-scale design optimization model for stormwater best management practices. Environ. Model. Softw. 2012, 37, 6–18. [Google Scholar] [CrossRef]
  50. Yang, G.; Best, E.P. Spatial optimization of watershed management practices for nitrogen load reduction using a modeling-optimization framework. J. Environ. Manag. 2015, 161, 252–260. [Google Scholar] [CrossRef]
  51. Sebti, A.; Fuamba, M.; Bennis, S. Optimization Model for BMP Selection and Placement in a Combined Sewer. J. Water Resour. Plan. Manag. 2016, 142, 04015068. [Google Scholar] [CrossRef]
  52. Chen, P.-Y.; Tung, C.-P.; Li, Y.-H. Low Impact Development Planning and Adaptation Decision-Making under Climate Change for a Community against Pluvial Flooding. Water 2017, 9, 756. [Google Scholar] [CrossRef] [Green Version]
  53. Raei, E.; Alizadeh, M.R.; Nikoo, M.R.; Adamowski, J. Multi-objective decision-making for green infrastructure planning (LID-BMPs) in urban storm water management under uncertainty. J. Hydrol. 2019, 579, 124091. [Google Scholar] [CrossRef]
  54. Ghodsi, S.H.; Zahmatkesh, Z.; Goharian, E.; Kerachian, R.; Zhu, Z. Optimal design of low impact development practices in response to climate change. J. Hydrol. 2019, 580, 124266. [Google Scholar] [CrossRef]
  55. Xu, H.; Ma, C.; Xu, K.; Lian, J.; Long, Y. Staged optimization of urban drainage systems considering climate change and hydrological model uncertainty. J. Hydrol. 2020, 587, 124959. [Google Scholar] [CrossRef]
  56. Zubelzu, S.; Rodríguez-Sinobas, L.; Sordo-Ward, A.; Pérez-Durán, A.; Cisneros-Almazán, R. Multi-Objective Approach for Determining Optimal Sustainable Urban Drainage Systems Combination at City Scale. The Case of San Luis Potosí (México). Water 2020, 12, 835. [Google Scholar] [CrossRef] [Green Version]
  57. Torres, M.N.; Fontecha, J.E.; Zhu, Z.; Walteros, J.L.; Rodríguez, J.P. A participatory approach based on stochastic optimization for the spatial allocation of Sustainable Urban Drainage Systems for rainwater harvesting. Environ. Model. Softw. 2019, 123, 104532. [Google Scholar] [CrossRef]
  58. Alves, A.; Vojinovic, Z.; Kapelan, Z.; Sanchez, A.; Gersonius, B. Exploring trade-offs among the multiple benefits of green-blue-grey infrastructure for urban flood mitigation. Sci. Total Environ. 2020, 703, 134980. [Google Scholar] [CrossRef] [PubMed]
  59. Vincent, S.U.; Radhakrishnan, M.; Hayde, L.; Pathirana, A. Enhancing the Economic Value of Large Investments in Sustainable Drainage Systems (SuDS) through Inclusion of Ecosystems Services Benefits. Water 2017, 9, 841. [Google Scholar] [CrossRef] [Green Version]
  60. Alcamo, J.; Bennett, E.M.; Millennium Ecosystem Assessment (Eds.) Ecosystems and Human Well-Being: A Framework for Assessment; Island Press: Washington, DC, USA, 2003. [Google Scholar]
  61. Kuller, M.; Bach, P.M.; Roberts, S.; Browne, D.; Deletic, A. A planning-support tool for spatial suitability assessment of green urban stormwater infrastructure. Sci. Total Environ. 2019, 686, 856–868. [Google Scholar] [CrossRef] [PubMed]
  62. Aceves, M.C.; Fuamba, M. Methodology for Selecting Best Management Practices Integrating Multiple Stakeholders and Criteria. Part 1: Methodology. Water 2016, 8, 55. [Google Scholar] [CrossRef] [Green Version]
  63. Ellis, J.B.; Lundy, L.; Revitt, D.M.; London, B. An Integrated Decision Support Approach to the Selection of Sustainable Urban Drainage Systems (SUDS); Urban Pollution Research Centre, Middlesex University: London, UK, 2011; 18p. [Google Scholar]
  64. Constructora Amarilo, S.A. Plano Usos del Suelo Cuidad Verde; Technical Report; Amarilo: Soacha, Columbia, 2019. [Google Scholar]
  65. IDECA. Ortoimagen. Bogotá D.C. 2017. Available online: https://www.ideca.gov.co/recursos/mapas/ortoimagen-bogota-dc-2017 (accessed on 7 February 2022).
  66. Secretaria Distrital de Planeación. Decreto 653 de 2019—Plan Parcial El Bosque No. 26—Lagos de Torca; Secretaria Distrital de Planeación: Bogotá, Colombia, 2019; 329p.
  67. Secretaría Distrital de Planeación. Plan Parcial Tibabita No. 12 Lagos de Torca 2021. Available online: http://www.sdp.gov.co/gestion-territorial/planes-parciales-de-desarrollo/planes/tibabita-no-12-lagos-de-torca (accessed on 7 February 2022).
  68. Empresa de Desarrollo y Renovación Urbana de Bogotá (ERU). Caracterización Socioeconómica- Pieza El Reencuentro Diagnóstico Socio Económico Basado en Fuentes Secundarias; ERU: Bogotá, Columbia, 2021.
  69. Instituto Distrital de Gestión de Riesgo y Cambio Climático I. Geoportal Capas Normativas 2019. Available online: https://www.arcgis.com/apps/webappviewer/index.html?id=fa4b277533584c3a95a9208b4d542e19 (accessed on 7 February 2022).
  70. Instituto Geografico Agustin Codazzi (Igac). 0001_IGAC/MAPA_IGAC_URBANO_2018 (MapServer). Available online: http://webcache.googleusercontent.com/search?q=cache:bYGsmfkLuxcJ:186.154.153.197:6080/arcgis/rest/services/0001_IGAC/MAPA_IGAC_URBANO_2018/MapServer%3Ff%3Dkmz+&cd=1&hl=es&ct=clnk&gl=co (accessed on 28 February 2022).
  71. Carey, I.M.; Atkinson, R.W.; Kent, A.J.; van Staa, T.; Cook, D.; Anderson, H.R. Mortality Associations with Long-Term Exposure to Outdoor Air Pollution in a National English Cohort. Am. J. Respir. Crit. Care Med. 2013, 187, 1226–1233. [Google Scholar] [CrossRef] [PubMed] [Green Version]
  72. Garcia-Cuerva, L.; Berglund, E.Z.; Rivers, L. An integrated approach to place Green Infrastructure strategies in marginalized communities and evaluate stormwater mitigation. J. Hydrol. 2018, 559, 648–660. [Google Scholar] [CrossRef]
  73. Concol Consultores S.A.S.; WSP Ingenieria Colombia S.A.S. Actualización De Los Estudios Conceptuales Del Contrato Eab-Esp 1-02-25500-0626-2009, Incluyendo La Topografía Detalle Necesaria Para El Ajuste Al Plan Vial Arterial Vigente, Que Sirvan De Base Para Definir Las Alternativas Técnicas Y Económicas Para El Desarrollo De La Ciudad Lagos De Torca; Producto 5 Estudio Ambiental Actualización Del Plan De Manejo Del Humedal Torca-Guaymaral; Fideicomiso Lagos de Torca: Bogotá, Colombia, 2020. [Google Scholar]
  74. Universidad de los Andes; Centro de Investigaciones en Ingeneria Ambiental (CIIA). Investigación de las Tipologías y/o Tecnologías de Sistemas Urbanos de Drenaje Sostenible (SUDS) que más se Adapten a las Condiciones de la Ciudad de Bogotá D.C.; Producto 3—Guía técnica de diseño y construcción de SUDS; Universidad de los Andes: Bogotá, Colombia, 2017. [Google Scholar]
  75. ArcGIS A. Superposición Ponderada—Ayuda/ArcGIS Desktop. ArcGIS Deskt. 2018. Available online: https://desktop.arcgis.com/es/arcmap/latest/tools/spatial-analyst-toolbox/weighted-overlay.htm (accessed on 13 January 2022).
  76. Mejia, L.E.; Mancipe, N.A.; Torres, M.N. Adaptación de Una Metodología para la Asignación de SUDS en Áreas Urbanas Privadas: Caso de Estudio Campus de la Universidad Nacional, Sede Bogota; Universidad Nacional: Bogotá, Colombia, 2022. [Google Scholar]
  77. Gurobi Optimization L. Gurobi—The Fastest Solver. 2017. Available online: https://www.gurobi.com/ (accessed on 13 January 2022).
  78. Marler, R.T.; Arora, J.S. Survey of multi-objective optimization methods for engineering. Struct. Multidiscip. Optim. 2004, 26, 369–395. [Google Scholar] [CrossRef]
  79. Sowell, D. Bogotá. Obo. 2021. Available online: https://www.oxfordbibliographies.com/view/document/obo-9780199766581/obo-9780199766581-0172.xml (accessed on 15 December 2021).
  80. Aponte, E.; Rubiera, F.; Blaszczyszyn, M. Looking at The Center of The Bogotá City. Rev. Econ. Adm. 2009, 6, 128–148. [Google Scholar]
  81. Departamento Adiministrativo de Planeación. DANE Revela Informe Completo del Censo de Población—Carta Administrativa—Función Pública. 2020. Available online: https://www.funcionpublica.gov.co/web/carta-administrativa/-/dane-revela-informe-completo-del-censo-de-poblacion (accessed on 15 December 2021).
  82. Universidad de los Andes (UK PACT). Ciudades con Bajas Emisiones de Carbono en Colombia. 2021. Available online: https://electricayelectronica.uniandes.edu.co/es/ciudades-con-bajas-emisiones-de-carbono-en-colombia (accessed on 15 December 2021).
  83. Amarilo. Lagos de Torca: Un Proyecto con Conciencia. Amarilo. 2021. Available online: https://amarilo.com.co/blog/verde/ciudad-lagos-de-torca-un-proyecto-con-conciencia/ (accessed on 28 February 2022).
  84. Empresa de Desarrollo y Renovación Urbana de Bogotá (ERU). Fotografía-El Reencuentro (Bogotá). 2020. Available online: https://eupolis-project.eu/city-of-bogota/ (accessed on 28 February 2022).
  85. Galeria de Ventas Ciudad Verde. Ciudad Verde Fotografía. 2019. Available online: https://ciudadverde.com.co/ (accessed on 28 February 2022).
  86. Secretaría Distrital de Planeación S. Generalidades. 2021. Available online: https://www.sdp.gov.co/gestion-territorial/planes-parciales-de-desarrollo/generalidades (accessed on 1 February 2022).
  87. Secretaria Distrital de Planeación. Plan Parcial de Renovación Urbana “Estación Metro Calle 26”. 2021. Available online: https://www.sdp.gov.co/gestion-territorial/planes-parciales-de-renovacion-urbana/planes/plan-parcial-de-renovacion-urbana-estacion-metro-calle-26 (accessed on 8 February 2022).
  88. Gomes, M.; Moura, O.; Aline, V. City Growth and Urban Drainage Alternatives: Sustainability Challenge. J. Urban Plan. Dev. 2014, 141, 04014026. [Google Scholar]
  89. Díaz, S.; Demissew, S.; Carabias, J.; Joly, C.; Lonsdale, M.; Ash, N.; Larigauderie, A.; Adhikari, J.R.; Arico, S.; Báldi, A.; et al. The IPBES Conceptual Framework—Connecting nature and people. Curr. Opin. Environ. Sustain. 2014, 14, 1–16. [Google Scholar] [CrossRef] [Green Version]
  90. Díaz, S.; Pascual, U.; Stenseke, M.; Martín-López, B.; Watson, R.T.; Molnár, Z.; Hill, R.; Chan, K.M.A.; Baste, I.A.; Brauman, K.A.; et al. Assessing nature’s contributions to people. Science 2018, 359, 270–272. [Google Scholar] [CrossRef] [Green Version]
  91. Juan, Y.; Roper, K.O.; Castro-Lacouture, D.; Kim, J.H. Optimal decision making on urban renewal projects. Manag. Decis. 2010, 48, 207–224. [Google Scholar] [CrossRef]
  92. Bastien, N.; Arthur, S.; Wallis, S.G.; Scholz, M. Towards the Best Management of SuDS Treatment Trains. In Proceedings of the 13th International Diffuse Pollution Conference (IWA DIPCON 2009), Seoul, Korea, 12–15 October 2009. [Google Scholar]
  93. Ferrans, P.; Torres, M.N.; Temprano, J.; Sánchez, J.P.R. Sustainable Urban Drainage System (SUDS) modeling supporting decision-making: A systematic quantitative review. Sci. Total Environ. 2021, 806, 150447. [Google Scholar] [CrossRef]
  94. European Commission. The EU and Nature-Based Solutions. 2017. Available online: https://ec.europa.eu/info/research-and-innovation/research-area/environment/nature-based-solutions_en (accessed on 2 February 2022).
  95. Martín, E.G.; Costa, M.M.; Máñez, K.S. An operationalized classification of Nature Based Solutions for water-related hazards: From theory to practice. Ecol. Econ. 2019, 167, 106460. [Google Scholar] [CrossRef]
Figure 1. Methodology flowchart. * Based on Jimenez-Ariza et al. [40] (Phase 3) and Torres et al. [57] (Phase 4).
Sustainability 14 04560 g001
Figure 2. (a) City of Bogotá location on the national territory, (b) location of the three projects under study shaded in green and labeled. Pictures references [83,84,85].
Sustainability 14 04560 g002
Figure 3. Score matrix Benefit-SUDS types (a) detention SUDS, (b) retention SUDS, and (c) infiltration and filtration SUDS types. Score 0 zero potential of ecosystem service generation, score 1 low potential of ecosystem service generation, score 2 potential of ecosystem service generation with design adjustment or additional practices, score 3 moderated potential of ecosystem service generation, and score 4 high potential of ecosystem service generation.
Sustainability 14 04560 g003
Figure 4. Priority index in (a) Ciudad Verde, (b) Lagos de Torca, and (c) El Reencuentro.
Sustainability 14 04560 g004
Figure 5. Opportunity index in (a) Ciudad Verde, (b) Lagos de Torca El Bosque, (c) Lagos de Torca Tibabita, and (d) El Reencuentro.
Sustainability 14 04560 g005
Figure 6. Results optimization analysis (a) Ciudad Verde- Best choice scenario C, (b) El Bosque- Best choice scenario C, (c) Tibabita- Best choice scenario C, and (d) El Reencuentro- Best choice scenario B.
Sustainability 14 04560 g006
Table 1. Priority index evaluation criteria.
Ecosystem ServicesEvaluation Criteria
ProvisionFresh waterIrrigation waterGreen areas
RegulationWater regulationRun-off problemsImpervious areas
Pipe overflow
Flooding hazard
Water treatmentRun-off water qualityPopulation density
Land uses
Microclimate regulationSurfacesImpervious surface
Commercial land use
Global climate regulationCarbon sequestrationTree presence
Green areas
Air quality regulationAir qualityHigh traffic road
PopulationVulnerable population
Socio-CulturalAesthetic valuePublic spaceGreen areas
PopulationSocio- economic status
Educational valuePopulationPopulation density
Table 2. Opportunity index evaluation criteria.
Ecosystem ServicesEvaluation Criteria
ProvisionFresh waterAvailable waterRun-off quality
RegulationWater regulationPeak discharge reductionInfiltration rate
Available area for intervention
Water treatmentImprovements on run-off water qualityAvailable green area
Microclimate regulationMicroclimate creationAvailable green area
Global climate regulationCarbon sequestrationAvailable green area
Air quality regulationAir contaminant capturingAvailable green area
Socio-CulturalAesthetic valueEnhancing amenityAvailable green area
Public space type
Educational valuePublic (users)Key infrastructure
Pedestrian traffic
Table 3. Physical and geometric restriction per SUDS type a.
SUDS TypePhysical RestrictionsGeometric Restrictions
Slope (%)Water Table Distance (m)Infiltration Rate (mm/h)Area (m2)Wide (m)Length (m)
MaxMinMinMinMinMinMin
Gassed swales1011.513150.530
Infiltration trenches5137150.530
Permeable pavement50.5313111
Wet ponds15-1.3-150820
Bioretention zones10-1.8710.61.2
Tree boxes10-172.21.51.5
Constructed wetlands1511.3-10001856
Infiltration basins301.2134559
Extended dry retention basin151374559
a Based on Jimenez Ariza et al., 2019 [40].
Table 4. Budget by scenarios in each case study.
AspectSc.Ciudad Verde Lagos de Torca
(El Bosque)
Lagos de Torca
(Tibabita)
El Reencuentro (Calle 24) El Reencuentro (Calle 26)
Budget by scenario (USD 1)A-----
B$393,405$209,185$239,597$205,628$ 10,346,264
C$786,810$418,371$479,195$411,254$ 20,692,529
D$1,573,620$836,742$958,390$822,509$ 41,385,059
Total budget (USD 1)-$ 7,868,100 2$ 4,183,711 3$ 4,791,953 3$ 4,112,547 4$189, 945,452 5
1 Based on the average representative market rate (in Spanish TRM) of 2019: $3281.09COP/USD-National Republic Bank of Colombia. 2 Budget assigned by the Soacha municipality for public infrastructure. 3 Budget assigned to adequacy zones for environmental control and parks. 4 Pre-estimated urban costs of urban planning project (Calle 24): sidewalk+ isolator and public space interventions. 5 Pre-estimated direct cost of urban planning project (Calle 26).
Table 5. Budget by scenario, run-off attenuation and area for SUDS implementation.
AspectSc.Ciudad Verde Lagos de Torca
(El Bosque)
Lagos de Torca
(Tibabita)
El Reencuentro (Calle 24) El Reencuentro (Calle 26)
Budget optimized value by scenario (USD)A$6,600,313$7,183,294$3,710,985$1,645,068
B$372,322$188,267$232,702$193,464
C$763,165$390,141$468,978$371,682
D$1,561,588$775,971$ 942,696$793,655
Run-off attenuation (m3/year)A15,79713,589731816,512
B25154576225514,607
C10,7819134642815,937
D15,63912,410710916,508
Total run-off potential (m3/year)-15,81315,220770816,961
Area for SUDS (m2)A285,379177,59455,93649,727
B105,029130,61620,31236,888
C246,655159,01143,82947,633
D285,379184,59855,93649,727
Total area for SUDS implementation (m2)-330,515348,499130,13249,727
Benefits generation- ecosystem services (-)A99,202327,112109,717109,533
B26,13218,1109,33618,523
C38,61230,89516,03134,071
D79,68452.61124,442109,533
Publisher’s Note: MDPI stays neutral with regard to jurisdictional claims in published maps and institutional affiliations.

