1. Introduction
The main objective of urban planning and design should be to contribute significantly to improving people’s well-being and health [
1,
2,
3]. Thus, the design of urban spaces needs to be approached from a holistic and integral perspective. But in actual practice of urban planning a difficult balance is often found between socio-economic and socio-ecologic concerns, visual aesthetics, safety and transport mobility [
4] and other dimensions, such as acoustics.
In addition, there is a prevailing tendency to consider the urban environment mainly from a negative perspective, because cities are seen as settings which may give rise to psychological ill health and social disruption due to social, economic, environmental and spatial factors [
5,
6]. Consequently, urban settings are seen as more stressful and less attractive than natural ones.
Through the design of urban open public spaces, a positive perspective can be brought to the urban environment. Within the scope of this article, urban open public spaces are defined as “the sum of the areas of the built-up areas of cities devoted to streets and boulevards—including walkways, sidewalks, and bicycle lanes—and the areas devoted to public parks, squares, recreational green areas, public playgrounds and open areas of public facilities” [
7]. The present study focused on open spaces whose primary function was to provide a leisure area, such as squares, parks or gardens.
The capability of a place to improve people’s wellbeing deals with the restorative environment concept, i.e., environments enhancing or facilitating psychological restoration, and thus contributing human health and well-being [
8].
The most influential initiatives on this matter are Attention Restoration Theory (ART) developed by Kaplan and Kaplan [
9] and the Stress Recovery Theory (SRT), postulated by Ulrich et al. [
10,
11]. ART states that natural environments can restore the cognitive resources that people use in their daily activities. In this theory, the restorative potential of environments, known as restorativeness, is defined by four fundamental dimensions: (a) “being away”, which refers to a series of perceived characteristics that allow individuals to distance themselves physically or psychologically from that which requires their directed attention; (b) “extent”, which refers to the environmental qualities that invite exploration beyond what is immediately perceived; (c) “fascination”, the perceived characteristics that attract people’s attention; and (d) “compatibility”, which refers to the perception that the environment is consonant with the goals of the person experiencing it. Meanwhile, SRT theory postulates that despite its adaptive value, the stress response undermines psychological energy and leads to a negative emotional state. In contrast, a positive affective response to open natural settings enables the individual to recover from fatigue and its negative emotional outcomes.
Although the study of restorative environments has attracted considerable research interest in recent years, most surveys have focused primarily on natural settings (outside urban areas) such as parks and forests [
9,
11,
12,
13]. However, the restorative experience does not occur solely in natural environments, and not all such environments contribute to restoration [
14]. Recent studies have explored the restorative capacity of urban environments [
14,
15,
16]. One of them, which defines a psychological restoration scale referring to self-reported emotional status, showed that participants’ psychological state improved after spending half an hour in one of two selected urban squares [
15]. Visitors showed better cognitive performance, reduced negative affect variables (tension-anxiety, anger-hostility, fatigue and stress) and reported increased happiness.
Research on restorative environments has focused primarily on the visual dimension of nature, as reflected in the terms used in ART theory (contemplation, scene, views, green elements), and the dimensions defining them (extent, being away, fascination and compatibility). However, perception is a holistic process that integrates information from several senses, other than sight.
In this respect, the soundscape quality is one of the key factors for environmental perception in urban public open spaces [
17], in terms of pleasant or preferable sounds [
2,
18,
19] or acoustic comfort [
13,
17].
In relation to the quality of acoustic environments, Directive 2002/49/EC (END: Environmental Noise Directive) [
20] highlights the need to preserve ‘environmental acoustic quality where it is good’, as well as to safeguard quiet areas, using noise indicators. The Good Practice Guide on Quiet Areas [
21] recognises that it is not an adequate definition and suggests using the designation ‘calm area’ or ‘tranquil area’ as an area where noise is absent or at least not dominant. The ‘Guidelines for the identification, selection, analysis and management of quiet urban areas’ [
22] define a quiet area as: ‘an urban area whose current or future use and function require a specific acoustic environment, which contributes to the well-being of the population’. This approach clearly incorporates the health benefits that the quiet area should provide into the definition.
The analysis of the users’ experience of acoustic dimension of spaces is assessed using the soundscape approach. This approach has been developed within the framework of several European actions and projects, many of which formed part of the COST-Action TD 0804 on “Soundscape of European Cities and Landscapes”. The key principles of soundscape are defined in ISO 12913 standard, which provides theoretical and methodological frameworks for defining, analysing and assessing soundscape, and data analysis [
23,
24,
25]. According to this standard, soundscape is an “acoustic environment as perceived or experienced and/or understood by a person or people, in context”.
The soundscape approach analyses the sound environment from a holistic perspective that transcends the restrictive noise control approach. Its main characteristics are: (1) transdisciplinarity; (2) multidimensional analysis; (3) multi-agent (4) sound as a resource; (5) emphasis on subjective data; and (6) evaluation based on triangulation (different methods) [
1,
2,
26]. In essence, the soundscape approach is a flexible framework which in recent years has witnessed an increase in studies analysing the acoustic environment from a positive perspective, focusing on its quality and its beneficial effects on people [
27].
Applying soundscape approach to urban planning and design, interventions should aim to reduce noise levels [
26] and introduce more positive sounds, such as those people and nature (water, fountains, birds…), in order to make the sound atmosphere comfortable and congruent with the context in which it is perceived [
2]. To asses this, an understanding of the full—physical, cultural and emotional—context is required, since how people react to or handle sounds depends on the “acoustic colouration” of the environment as regards geography, climate, wind, water, people, buildings and animals [
28].
Consequently, soundscape should be considered part of urban design [
29,
30], mainly in urban open public spaces [
19], incorporating specific urban furniture [
18] to improve people’s perceptions of urban places and their environmental experiences. Soundscape has also become a major tool in facilitating people’s involvement in decision-making processes regarding acoustic environments in collaboration with “local experts” [
18]. Accordingly, planning and design perspectives require mixed objective-subjective criteria. They are likely to be used at an early design stage to characterise current perception, identify potential critical issues and to monitor the improvements achieved after the implementation of the interventions proposed [
2].
The study presented here contributes to the incorporation of ART theory into soundscape studies, analysing the change of people’s self-reported emotional status as a scale to quantify psychological restoration. One of the first references on this approach is Payne ([
31] 2008), who used a soundscape scale with two adjectives grouped in the “pleasantness” dimension, which refer to the known positive perception of “nature” and to the restorative capacity of soundscapes [
32]. In other laboratory research, ref. [
13] reported how typical urban soundscapes with natural elements in densely populated Chinese cities had significant effects on individuals’ restorative experiences; natural sounds will boost the restoration of the individual’s attention, whereas traffic and machine sounds will have a negative effect [
13]. Soundscape studies have highlighted the benefits of acoustic environments for well-being [
33], mainly focusing on human [
2] or natural sounds [
33,
34].
Other authors have reported indirect results about soundscape contributions to the restorative capacity of urban areas. A survey conducted in Sheffield showed that the soundscape of urban parks played a significant role in their restorative experience [
35]. Research conducted by [
6] assessed how differences in approach towards built vs. natural environments affected psychological and physiological restoration in three different urban places. In Rotterdam, where 16 urban parks were evaluated, restorative levels were mainly due to park size and average acoustic level [
36]. In Milan, it was confirmed that the perceived environmental quality of five urban parks depended on the type of soundscape [
37].
The literature shows that psychological restoration in natural settings has received considerable research attention in recent years. However, due to the global trend towards urbanisation, there is a need to extend these studies to urban settings. The dimension of sound also needs to be integrated into landscape, which is the reason for proposing the use of a soundscape approach, which should have similar relevance as visual aesthetics in urban planning. This flexible and holistic framework can help urban design and planning transform urban areas into restorative environments, improving the wellbeing and health of people living in them [
1,
2].
Accordingly, the aim of this study was to analyse the effect of the renovation of a small noisy urban square on its acoustic environment and perception (soundscape), and the final psychological impact of new soundscape design on users’ wellbeing (comfort) and (emotional) health.
The urban sustainable design process for this renovation included acoustic criteria and human auditory perception from the outset (soundscape approach). Moreover, it involved a multidisciplinary team of acoustics and psychosocial experts, together with municipal architects. The target site was a small open square in Bilbao addressed within the LIFE [
22].
The study hypothesis was that the renovation, guided by the soundscape approach, leading to a change in the acoustic environment to transform the noisy square into a comfortable urban place with a pleasant soundscape. In addition, the authors hoped that improving the acoustic environment and soundscape would have a positive psychological impact on emotional states, thereby reducing negative emotions, while improving positive ones.
2. Materials and Methods
The method developed to analyse acoustic comfort in urban open spaces, implemented in the case study reported here, consists of an assessment procedure that includes soundscape-related end-user questionnaires, sound measurements and audio recordings. The procedure combines measurement of several acoustic variables (noise levels, presence of sound events and dominant sources of noise), more general variables (landscape, uses, cleanliness, safety and accessibility) and psychosocial variables regarding perceptions of the soundscape and other dimensions of the space.
This method is described in detail below, and then the assessment procedure, participant sample and results of a case study are reported.
2.1. Sound Environment Assessment
Sound environments were assessed by quantifying acoustic levels, conducting measurements for a total of 1 h and 30 min in the morning and evening. All acoustic level measurements were collected at a height of 2 m, and an acoustics expert identified each sound event that occurred and recorded the sound source. The measurements taken in each place were then post-processed to obtain the following indicators for each 10-min period: LAeq, 10 min, LAmin, 1 s, LAmax, 1 s, LA10, LA50, LA90 and number of total events [
38].
Events were identified after post-processing using a method based on the principle of dynamic thresholds, whereby the instantaneous level LAeq,1 s was compared with the energy means for LAeq, 5 s, downstream (5 s earlier) and LAeq, 5 s, upstream (5 s later). Hence, a sound event was detected when the acoustic level variation involved a difference when both downstream and upstream energy means exceeded the threshold. For a sound event to be perceived, it should theoretically be greater than 10 dB of continuous sound. Considering the acoustic levels and their variation in these particular acoustic environments, it was concluded that a dynamic threshold of 6.5 dB would enable detection of a number of events similar to the perception of the sound environment experienced by the technician taking the measurement [
39].
2.2. Urban Comfort Questionnaire: Soundscape and Other Issues
The second element of the method was to assess user’s perceptions of the public space analysed and its soundscape on site, together with an evaluation of the sound environment. To this end, a questionnaire was drafted based on ISO soundscape guidelines [
23,
24] and the Environmental Experience Model [
27], which included the developments introduced by various researchers. This questionnaire collected data on around 60 variables. Particularly relevant according to the goal of the present study were those in the soundscape and emotional state scales. Since the soundscape concept concerns the perception of sound environments by communities, public participation in the soundscape assessment process is imperative [
18].
The soundscape scale was designed using a semantic differential (SD) containing 13 pairs of bipolar adjectives, such as unpleasant-pleasant, noisy-calm, stressful-relaxing, artificial-natural, monotonous-lively (vibrant), informative-uninformative and inappropriate-appropriate to surroundings, rated using a 5-point ordinal scale.
The emotional state scale included four basic emotions, two of which were positive—happiness (high arousal) and calm (low arousal)—and two negatives—anger (high arousal) and sadness (low arousal). It also incorporated an item for perceived stress. These five items were assessed at two times in each of the two intervention phases: at the beginning of the interview (referring to emotional state in the preceding days), and at the end of the interview (referring to present emotional state) [see Section “Data collection”]. The authors consider that the differences in the scale between both moments indicate the emotional impact of environmental experiences in the settings analysed.
In addition, other aspects that could influence the relationship between sound environment, soundscape and its emotional impact were considered. These included sociodemographic variables, residential factors and landscape (LSC). A semantic differential (SD) scale was also used for LSC assessment, with 3 items related to pleasantness, quietness and beautifulness.
2.3. Case Study
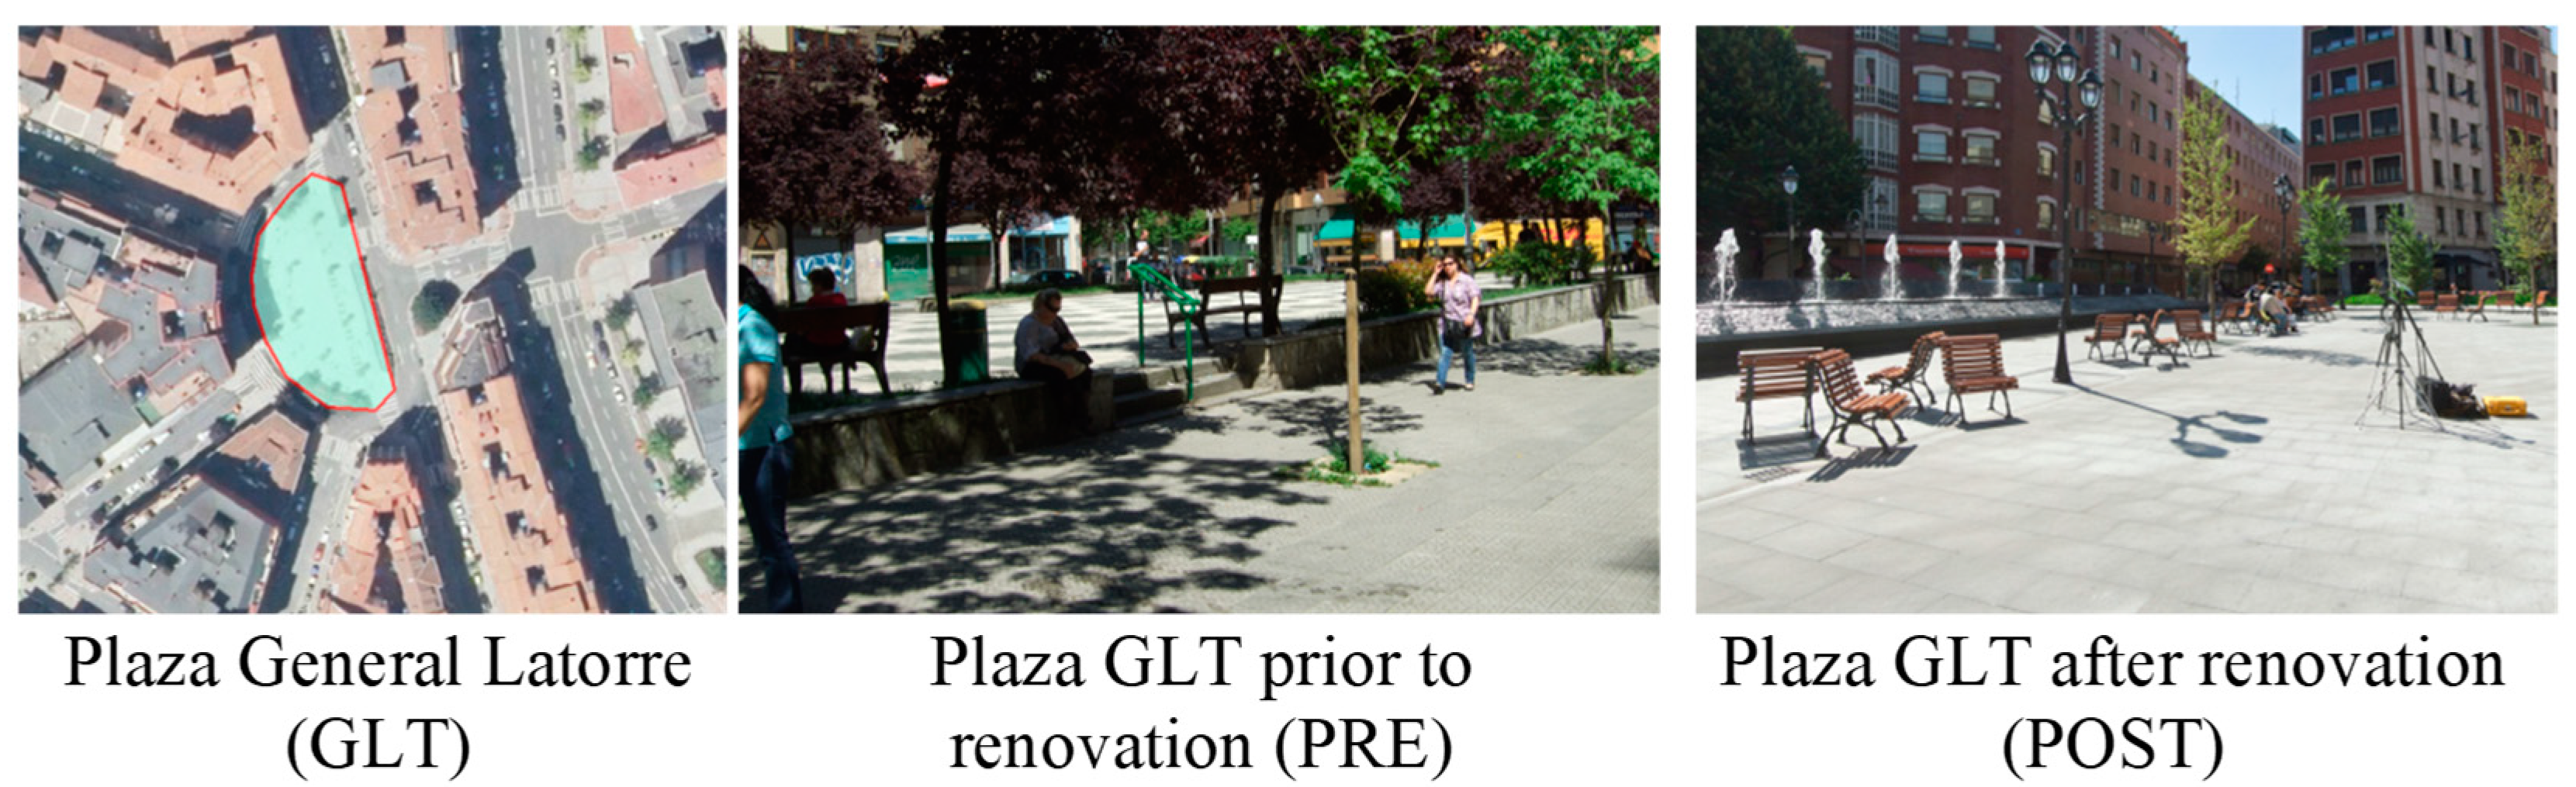
The earlier method was applied to a case study comprising an urban space—Plaza General Latorre (GLT)—located in Bilbao (northern Spain). This square underwent a renovation guided by a soundscape approach in order to transform it into the city’s first Sound Island. The square was assessed prior to renovation in 2012 (PRE) and afterwards in 2014 (POST) (see
Figure 1).
Plaza GLT is completely surrounded by roads. Prior to the intervention, it was often used by local residents to cross the street and for social interaction between older adults. Soundscape was dominated by traffic noise and negative sound events were associated with interrupted traffic flow in the area, the sound of car horns and cars starting and stopping.
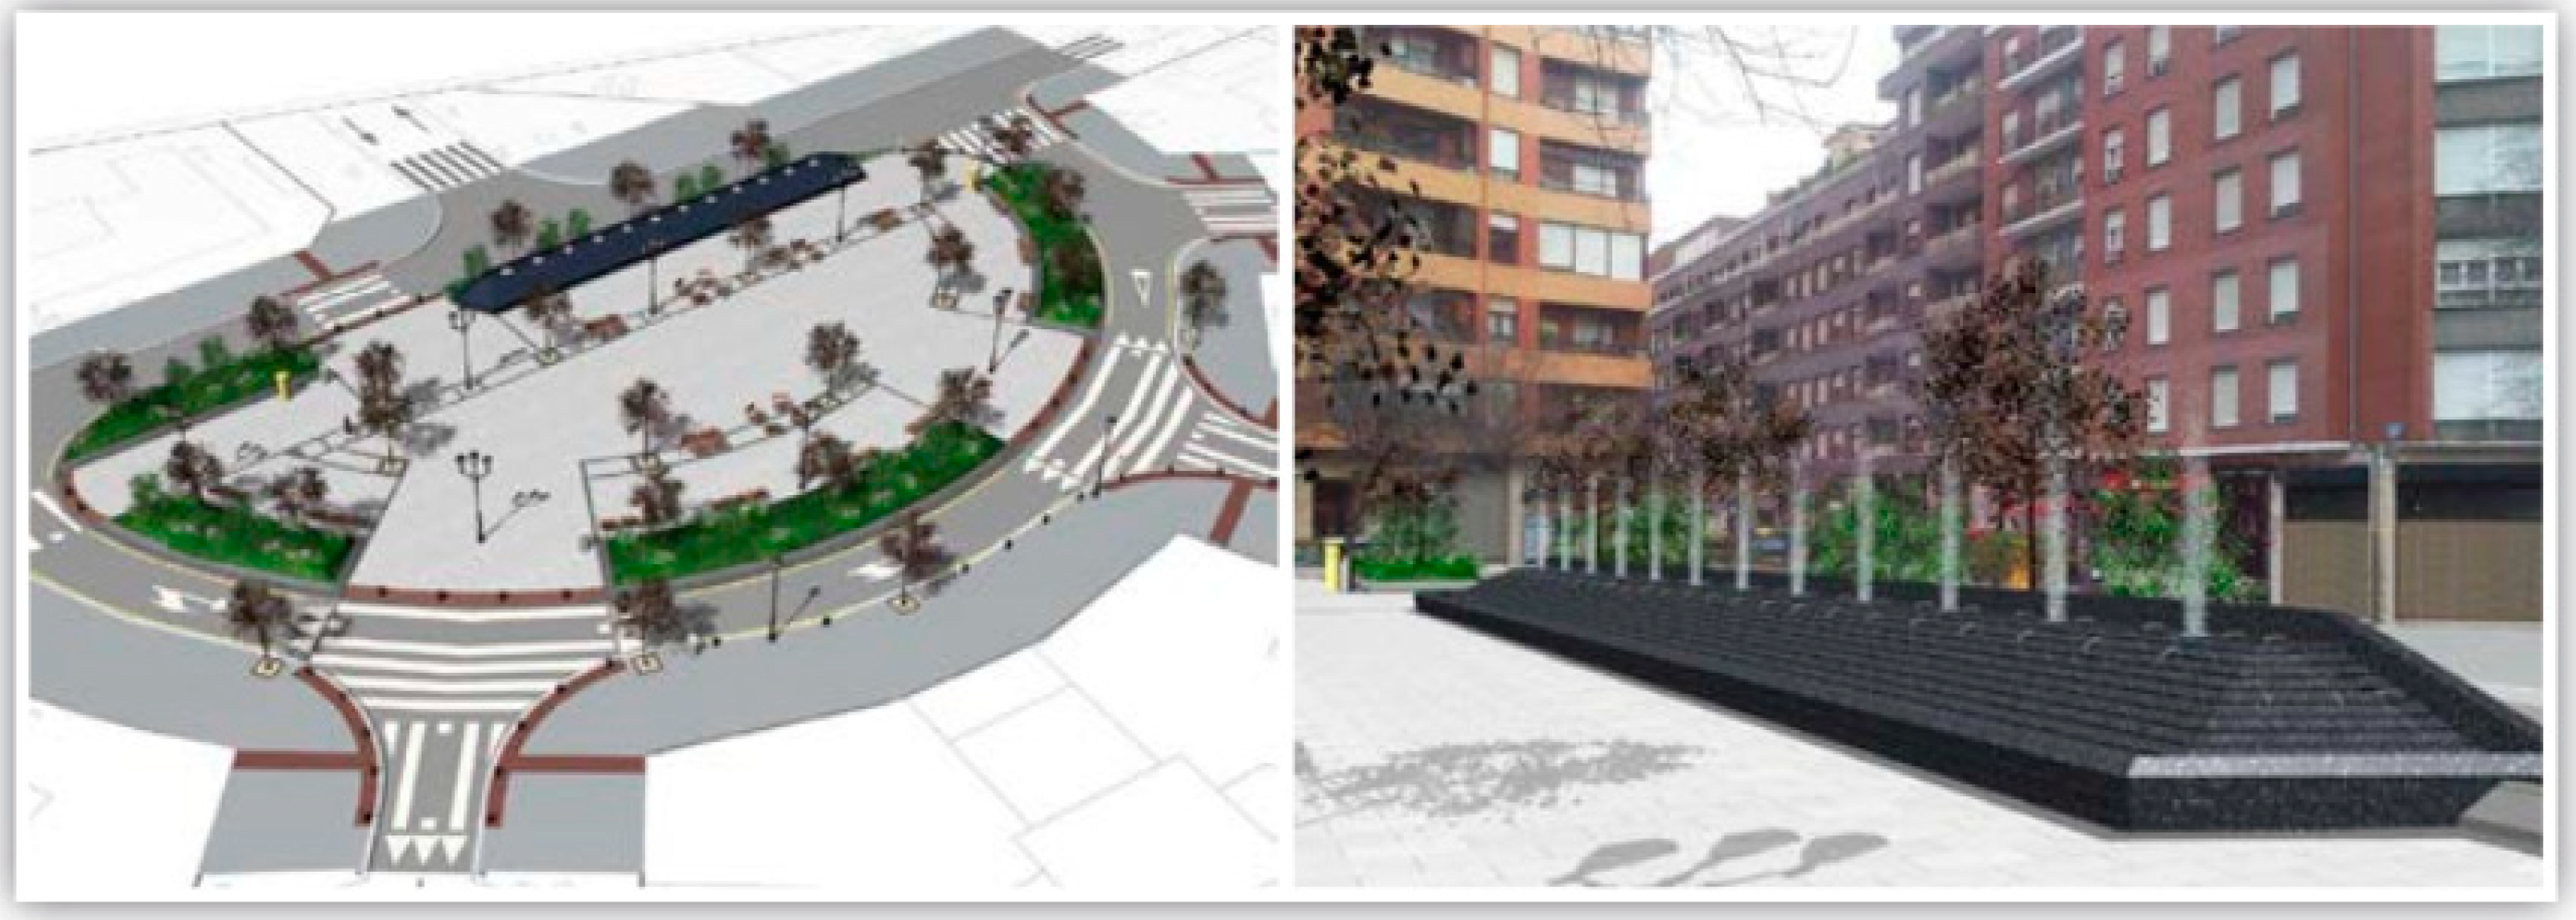
Urban Renovation: The Variable of Sound as an Urban Design Criterion
To meet the challenge of creating a comfortable place in Plaza GLT, an interactive process was established involving social and acoustics experts and municipal authorities responsible for designing the space. A participatory process was also implemented to identify the opinion of local residents. The starting point was a series of technical proposals arising from the outcomes of an acoustic and social study conducted prior to the intervention. They were analysed and adapted by the local town planning department to render them compatible with other urban variables, such as accessibility and safety.
The key objectives of the Plaza GLT renovation project (see
Figure 2) resulting from this interactive process were: (1) increasing pedestrian access; (2) improving the quality of building materials and services offered in the square; (3) increasing the size of rest areas (by almost two-fold) and green zones (by 60%) in the square.
Two sets of actions were identified to improve acoustic comfort. The first one aimed at reducing the level of ambient noise from its main source (road traffic), which was achieved by using low noise surfacing on the roads surrounding the square, removing parking spaces and reducing traffic speed around the square by adding raised pedestrian crossings. The second set aimed at protecting users of this space from noise and creating a more pleasant soundscape. This was accomplished by laying out flower beds around the central area and placing a fountain. This water fountain was a key element in modifying the square’s sound environment. It hindered the propagation of traffic noise from an adjacent street and generated natural sound events through its 12 vertical jets (
Figure 2). The fountain has become one of the distinguishing features of the square, bringing it to life.
In sum, the physical changes implemented in Plaza GLT have increased users’ sense of safety and the use of this square for recreation and relaxation purposes, bearing in mind that its primary use before renovation was as a transit area. These modifications have also encouraged greater use by children, providing the environment with a new sound source that is generally perceived as pleasant. These results point to an improvement in the comfort of this urban open public space.
2.4. Data Collection
A single acoustic measurement point located in the centre of the square was chosen to gather data about sound environments. According to [
22], Plaza GLT is just a non-divisible homogeneous unit of analysis, due to its small size (<1000 m
2) with similar physical, acoustic and use characteristics (people and activities).
Between 4 and 6 measurements per day, of 30 min each, were taken at this site at times when the square was most used (morning from 11 am to 1 pm, and evening from 5 pm to 7:30 pm). The start and end times of such measurement periods will be shown in the next Results section.
Although the acoustic measurements were carried out at a specific spot, the surveys were conducted in the places where people stayed (benches, transit areas…), so the perception of the users in the different areas was collected. The places where users were interviewed were close to the acoustic measurement point, but at a certain distance to avoid interferences. Adding more assessment points would have made it difficult to carry out interviews with users while simultaneously measuring noise or would have compromised the validity of the results.
In accordance with the method described earlier, the space was assessed by means of end user questionnaires and sound measurements. Since a pre- and post-intervention design was used in this study, data were collected at two different stages (see
Table 1) separated by an interval of 2 years: in May 2012, before renovation (T1), and in May 2014, after renovation (T2).
Thus, two measurements were taken for all the variables, except for emotional state and perceived stress, for which four determinations were gathered, since data on emotional state were collected prior to and after the environmental experience at pre- and post-intervention stages (before and after it), as shown in the box below.
The information collection campaign was carried out over a day (morning and evening), focusing on the most heavily attended hours. Two interviewers conducted the surveys, and the psychosocial study manager backed them up by giving support and resolving any issues that might arise.
To ensure that the square was busy, days with a similarly good weather forecast were selected for both testing sessions, held in the late spring. As the main interest was to know the effect of the square on regular users, the surveys were conducted on weekdays: Thursday 10 May 2012 and Tuesday 27 May 2014.
2.5. Sample
A sample of 101 participants—44 prior to urban renovation (PRE) and 57 after renovation (POST)—was used to assess perception. They were regular users of Plaza GLT who were contacted by interviewers when the soundscape study was conducted.
Subjects agreed to voluntarily participate in the study by responding to the questionnaire, having received information on personal data protection and statistical confidentiality in accordance with the prevailing regulations. Participants were informed during the data collection process by the person conducting the survey and by explanatory notes in the questionnaire itself. Consent was regarded as implicit as soon as the interviewee agreed to participate by replying to the questionnaire.
A specific ethical approval was not required for this study, considering the requirements established in the national legislation for this type of study. In that sense, the study does cover the requirement of the Spanish legislation (Organic Law 3/2018, of December 5, on the Protection of Personal Data and guarantee of digital rights) despite of the fact of the previous date of gathering of the raw data.
3. Results
The results are divided below into four sections. The first outlines the sociodemographic characteristics of the sample, while the second describes the acoustic or sound environment pre- and post-intervention. The third focuses on the square’s landscape and soundscape in both scenarios, and in the fourth, the psychological impact of the environmental experience in Plaza GLT pre- and post-intervention on emotional state and perceived stress are analysed.
Other results on the effects of contextual factors (acoustic and non-acoustic) on the soundscape of this plaza were previously presented together with those of eight other urban spaces [
39].
3.1. Sociodemographic Characteristics of the Sample
Some sociodemographic differences were observed between participants before (Npre = 44) and after (Npost = 57) the intervention. Women accounted for 50% and 64.9%, respectively, in the pre and post intervention phases. The mean age was 47.82 years (sd = 14.26) and 48.60 years (sd = 20.90) for each one of them. In terms of educational level, most participants had completed secondary (38.6% and 35.1% in pre- and post-phase) or university (40.9% and 33.3%, respectively) education. In relation to employment, employed users represented 45.5% in pre and 33.3% in post intervention, while unemployed people represented 25.0% and 14.0%, respectively. There were more retired people (18.2% vs. 26.3%) and students (6.8% compared to 12.3%) in the post- phase than in the pre-intervention phase. Moreover, all of pre-phase participants resided in Bilbao, while only 91.1% did so in the post-intervention survey.
Anyhow, none of these differences were statistically significant: p = 0.833 for age, p = 0.132 for sex, p = 0.258 for educational level, p = 0.237 for employment situation and p = 0.116 for place of residence.
3.2. Sound Environment
Table 2 shows the mean values of the acoustic parameters measured before (PRE in 2012) and after (POST in 2014) the intervention. These values were analyzed to describe the effect of context on urban soundscapes [
39]. The values of the indicators are the arithmetic mean for each 10-min measurement period. In the case of L
Aeq,t these are the arithmetic means of the energy averages calculated.
Prior to the intervention, the sound environment in Plaza GLT had a measured noise level of 62.4 dBA (LAeq, 10min), with a mean of 3.9 sound events for every half hour of measurement, all of them related to traffic noise, the major source of sound in the square.
Renovation of the urban square implies an increase on the average LAeq,10min levels due to the incorporation of water noise fountain in the square, which had a measured sound level of 64.9 dBA (LAeq, 10min) post-intervention (POST T2, 2014). Therefore, the composition of the acoustic environment did change, as it is now dominated by the fountain (the sound of both water falling onto the bed of stones and the water jets), which has made it livelier. There has also been a slight increase in perceived sound events, from 3.9 mainly negative pre-intervention events, to 4.8 mainly positive ones post-intervention.
3.3. Landscape and Soundscape
Table 3 shows a comparative evaluation of participants’ global perception in the square before (PRE or T1) and after (POST or T2) renovation. Respondents gave higher scores to the three landscape conditions (LSC) assessed (pleasantness, quietness and beautifulness) after the urban intervention (mean values above 4 out of 5 points) than before (mean values between 2.41 and 3.73). In all cases, scores were statistically significant (
p < 0.001) but also presented a very large effect size (d > 0.80).
Table 4 shows the results of a similar comparative evaluation for the soundscape (SSC) dimensions assessed. As with the LSC results, statistically significant differences were found, whereby the total score was higher (MT2 = 4.54 vs. MT1 = 3.35; F = 145.87;
p < 0.001; d = 2.65), as were scores for eleven of the thirteen SSC dimensions (seven of which presented a very large effect size). Only two dimensions remained the same after the intervention (strange-common and unknown-familiar), not surprisingly since pre- and post-intervention data were collected from participants who were local residents.
3.4. Emotional State
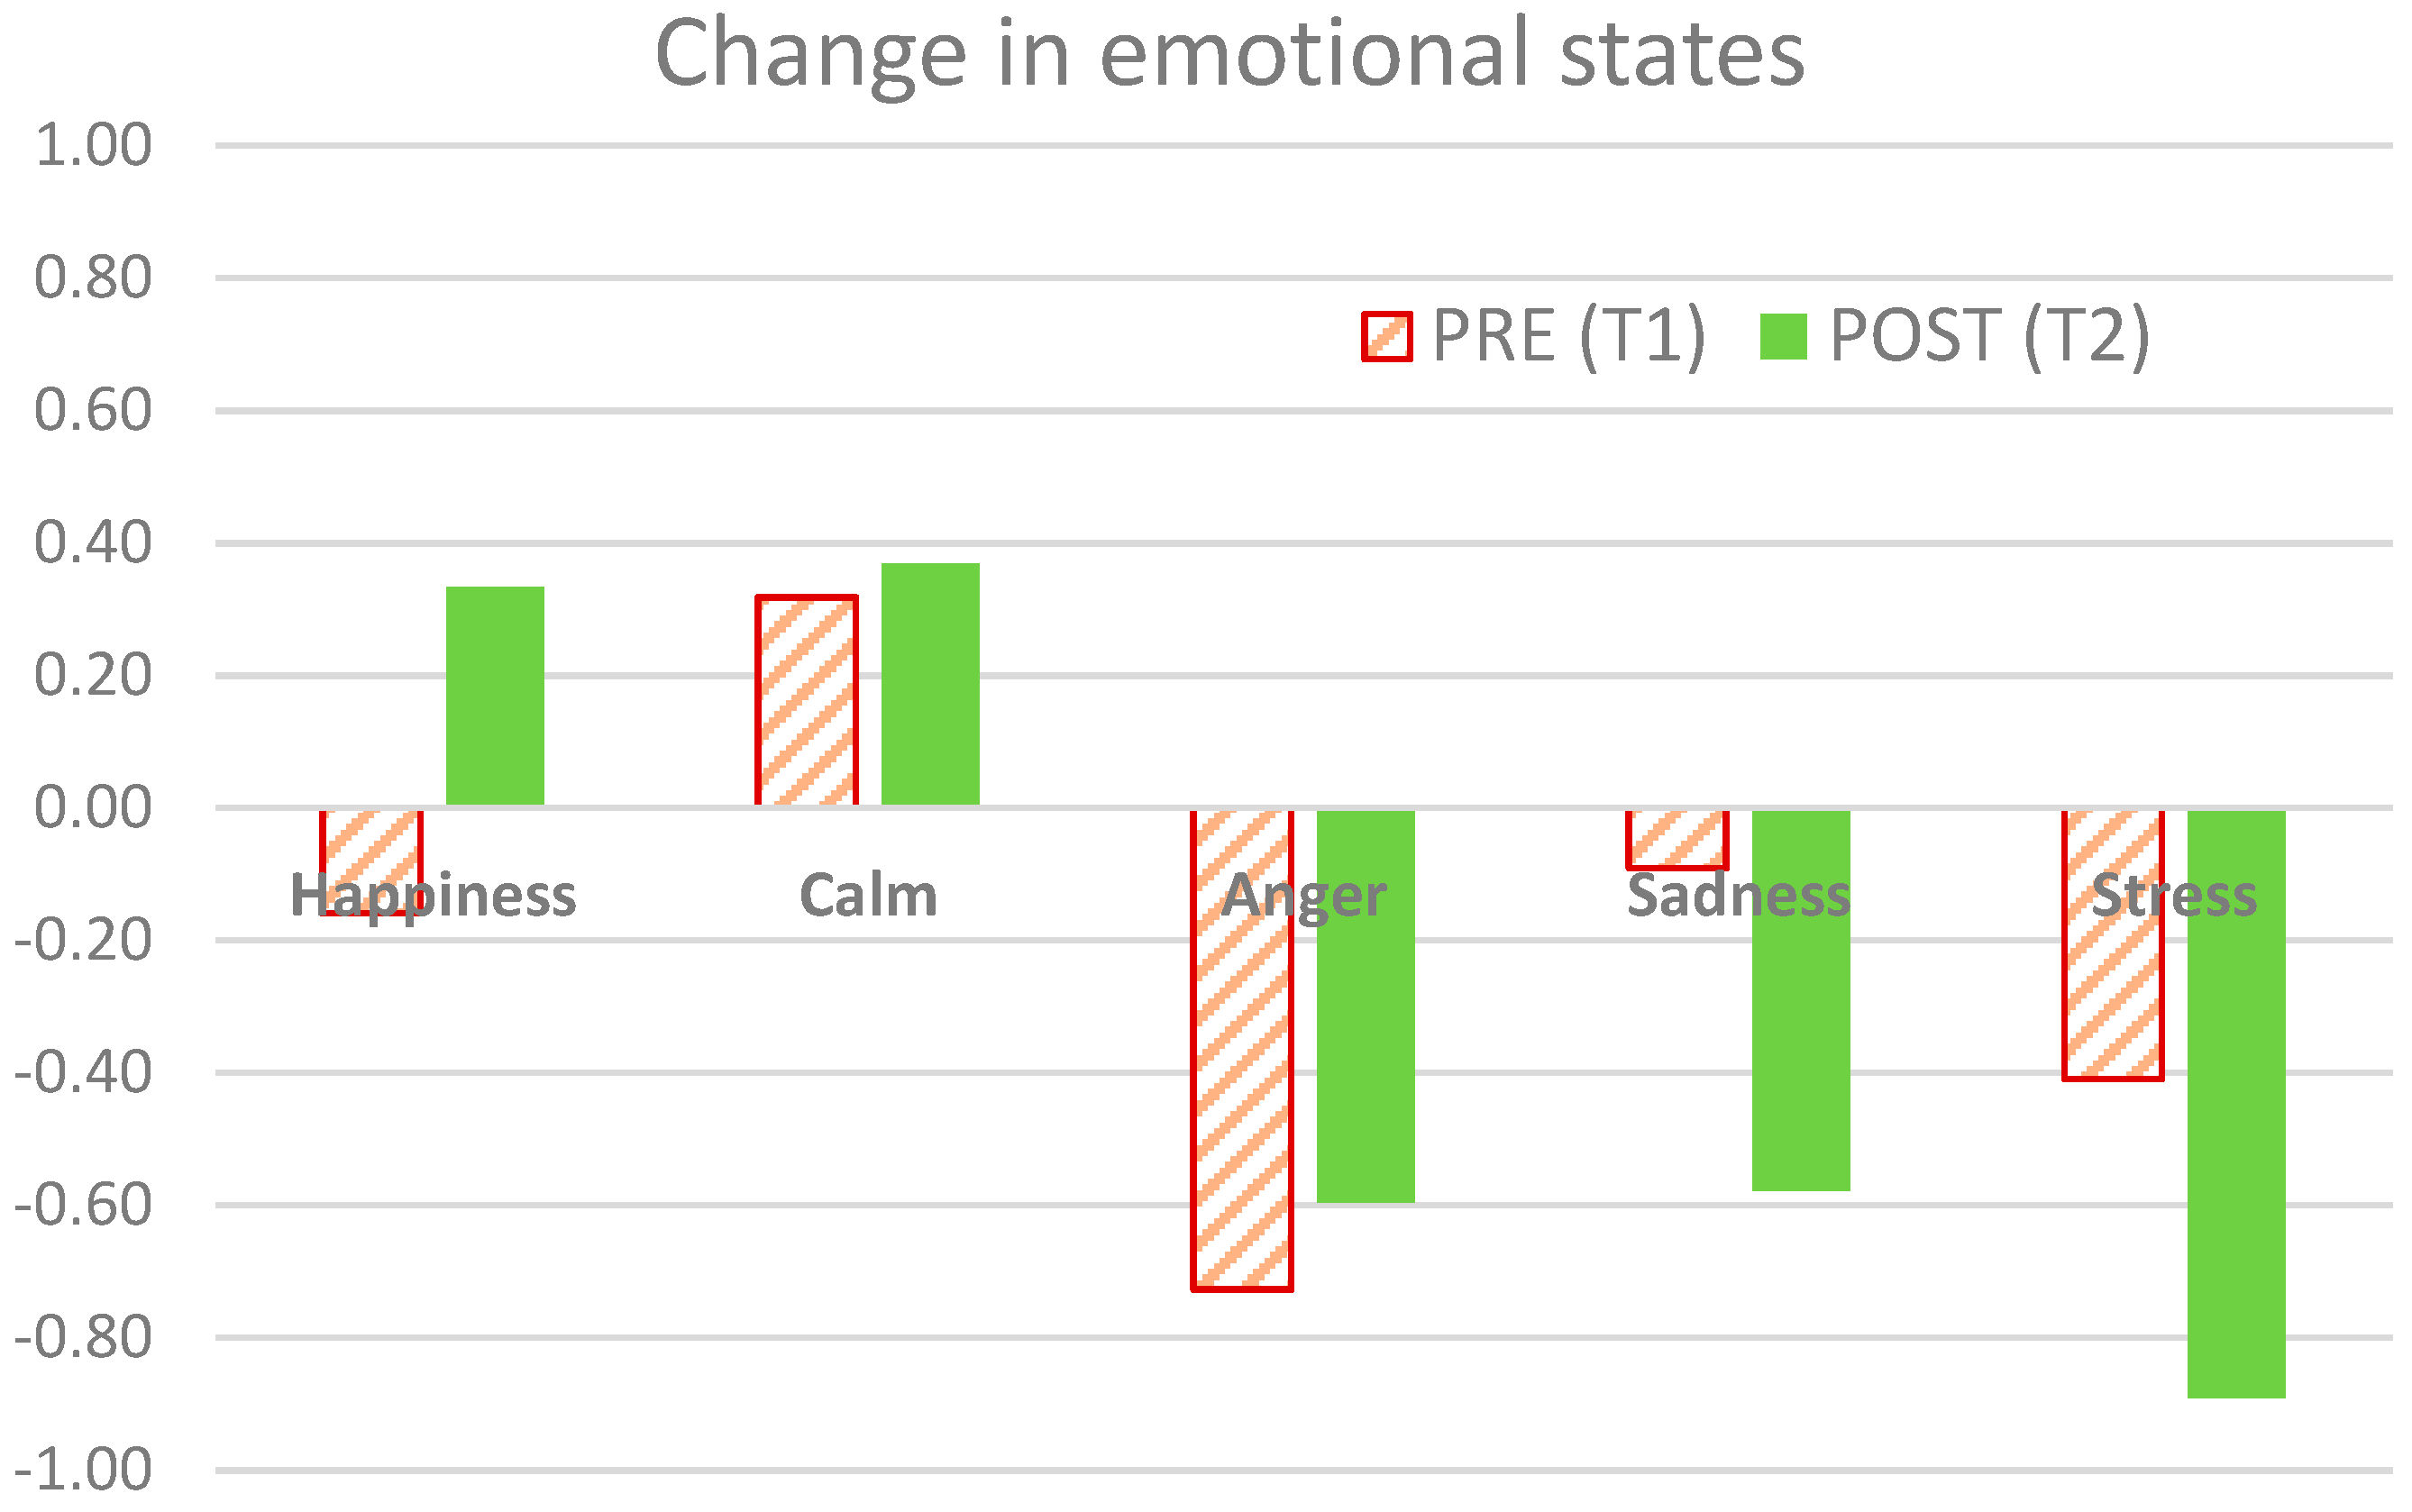
Table 5 shows the differences in participants’ emotional state before the environmental experience (LB1), after the experience (LB2) and between both (Dif. = LB2 − LB1). “Happiness” can be used to illustrate interpretation of the results.
Looking at participants’ perceptions of happiness on entering the square (LB1) before (group T1) and after renovation (group T2), it can be seen that happiness scores were higher in the latter that in the former group (MLB1-T2 = 3.98 vs. MLB1-T1 = 3.35; F = 6.28; p = 0.014; d = 0.51), a result that was repeated in assessments after the experience (MLB2-T2 = 4.32 vs. MLB2-T1=3.32), although in this case the differences were greater both in terms of statistical significance (F = 31.42; p < 0.001) and effect size (d = 1.14). In other words, participants in group T2 were happier on entering the square than those in group T1, and they also reported greater happiness after the environmental experience.
To counteract the effect of the baseline emotion with which participants commenced the experience, changes in the emotion following the experience were calculated (Dif. Score in
Table 5) as the key indicator of the effect of the improved urban design (
Figure 3). Thus, the T1 group was found to report lower perception of happiness after the experience (MDif-T1 = −0.16), whereas the T2 group perceived increased happiness (MDif-T1 = 0.33), and this difference was statistically significant (F = 6.02;
p = 0.007) and presented a medium large effect size (d = 0.56).
As regards the other emotions, it was found that in both groups the sense of calm increased after the experience, with no statistically significant differences between groups in this respect (p = 0.836). Concerning negative emotions, scores for all three decreased after the environmental experience; in the case of anger, this was higher in the T1 than the T2 group, but the difference did not reach statistical significance (p = 0.601). There was a greater reduction in sadness and stress after renovation (T2) than before (T1), and in both cases, these differences were close to statistical significance (p = 0.079 and p = 0.058, respectively).
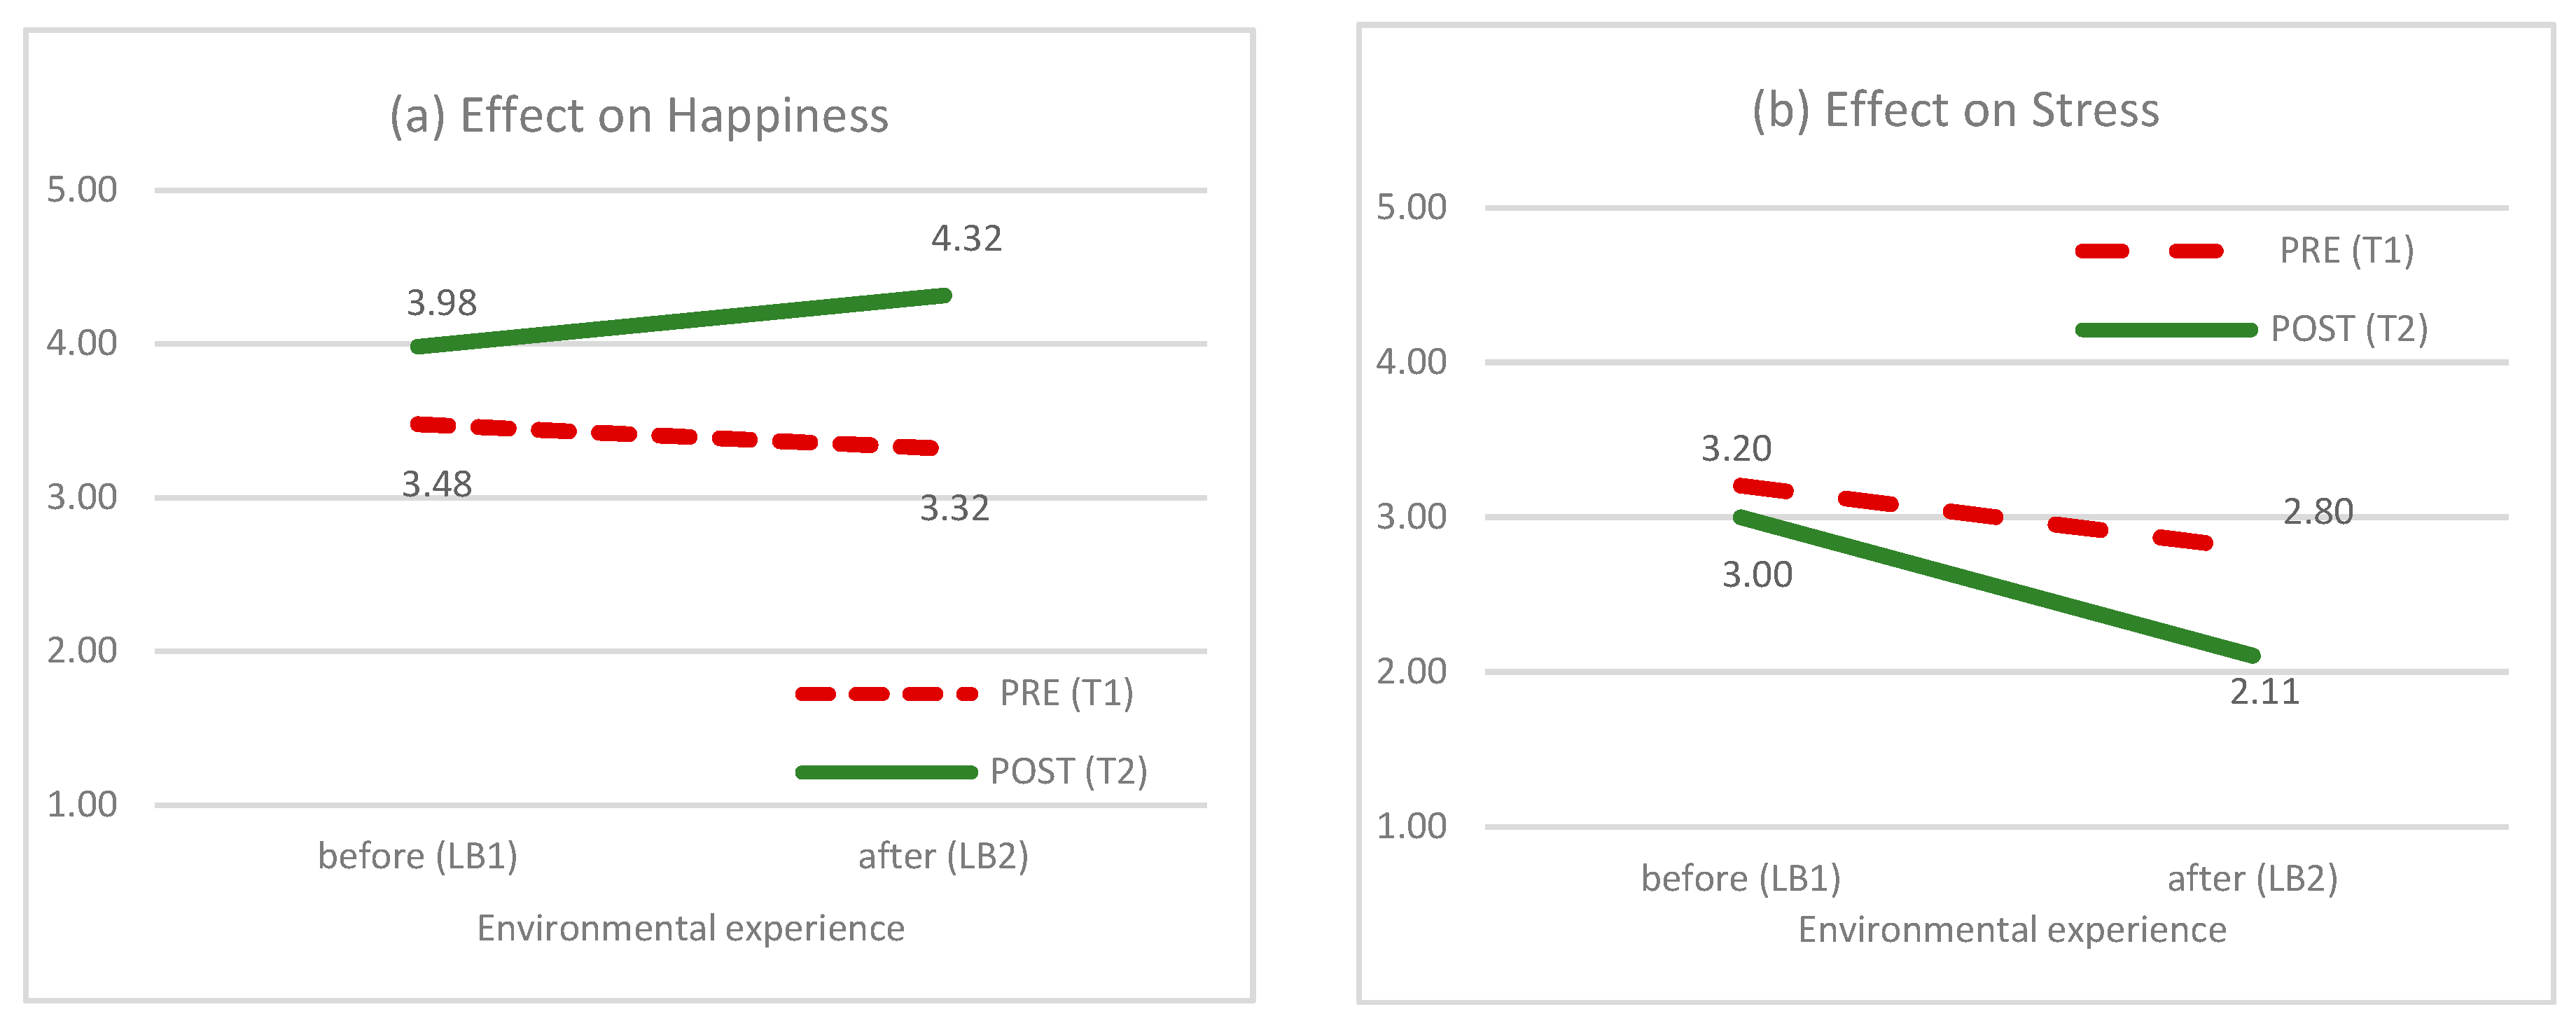
The diagram in
Figure 4 shows the scores for perceptions of happiness and stress in both groups before and after the environmental experience, when the soundscape had been substantially changed following renovation. An interaction of effects is shown in the case of happiness (declining in the T1 group but increasing in the T2 group), whereas stress decreased in both groups, albeit with a steeper slope in the T2 group.
4. Discussion and Conclusions
The main conclusion of this study is that it is possible to turn a noisy square into an urban restorative environment following a soundscape approach and sustainable urban design from the start, through collaborative work with a transdisciplinary team.
The main results of this process are listed below:
Firstly, the integral renovation changed the acoustic environment of Plaza GLT in Bilbao. This change was mainly qualitative. In fact, the average sound levels pre and post intervention were slightly increased. However, this slight increase is not associated with an increase on previously existing noise sources (road traffic noise), but with a greater presence of positive sound sources (water and social sources). So, it can be concluded that the intervention changed the quality of the sound atmosphere or “acoustic colouration”, as Schulte-Fortkamp and Pamela [
18] noted.
Based on these results, it can be said that urban interventions modified the sound atmosphere in the area. From a soundscape dominated by urban traffic to an environment with pleasant sound sources. It should be highlighted the relative importance of the sound created by the fountain: The acoustic design of the fountain contributes to a background sound related with the water running through stones adding sound events related with the water streams [
1,
2,
19,
26].
Secondly, in our study, the qualitative change in sound atmosphere was associated with a substantial improvement in the soundscape, increasing users’ pleasantness with the acoustic environment of the square (acoustic comfort). After intervention, the sound atmosphere was also perceived as being quieter, more relaxing, natural, clear, and also livelier and funnier. Noise reduction is not enough to improve acoustic comfort in urban places. In fact, in our study, the sound level was not reduced, although the number of events varied slightly.
Thirdly, the improvement in acoustic comfort is related to a substantial improvement in the landscape, increasing users’ comfort in the square (place comfort). A “comfortable place” is understood as one that can create a pleasant environmental experience for users carrying out individual or social activities [
40].
In that regard, urban renovations should consider other issues, such as landscape, thermal comfort, safety, cleanliness, maintenance and accessibility. In this study, the perception of some of these aspects also improved. We also noted that the use and quality of the space increased, as the average time spent in the square doubled from 15 min before urban renovation to over 30 min. Furthermore, one of the reasons citizens reported for visiting the square was the chance to enjoy nature (in an urban context), associated with relaxation and recreation.
Another key variable in creating comfortable areas is the congruence between soundscape and landscape [
2,
26]. Audio-visual interactions play a significant role when humans perceive the environment [
4,
41]. In our study, urban renovation improved this congruence from an average of 3.14 (pre-intervention scenario) to 4.18 (post-intervention scenario).
Fourthly, the increase of acoustic and place comfort after urban renovation yielded a significant improvement in its restorative capacity, as users’ environmental experience after the intervention showed a reduction in negative emotions (sadness) and perceived stress, and an increase in positive feelings (happiness). This endorses that holistic urban planning and renovation can play a key role to improve wellbeing and health, creating restorative urban places [
15,
40] reported that emotional restoration was also associated with urban and acoustic comfort. Thus, the higher the comfort level, the better the emotional state.
To sum up, some suggestions for a soundscape approach used in urban planning and design include:
A. Considering sound as a resource, not just as waste to be managed. Apply a soundscape approach in urban design to integrate the positive dimension of sound as a variable that contributes to the holistic environmental experience in public places. To attain this, besides reducing noise from unpleasant sources, it is necessary to introduce pleasant sounds (natural and human) into urban areas, mainly in urban open spaces [
19]. Access to hearing children playing or birds singing sounds might evoke positive feelings, memories, or cognitive improvements [
35]. When environmental noise cannot be reduced, a camouflaging strategy (loudspeakers or sound art installations, e.g., “audio islands”) could be used to play appropriate sounds, such as birds singing in an urban park [
18].
B. Integrating sound dimensions into landscape (congruence). The multisensorial character of human perception is well-known. Many studies have reported a strong effect of images on auditory judgement. For instance, the visual scenes that contain vegetation and natural elements seem to have a positive effect on the appreciation of the sound environment [
4]. Consequently, the congruence between soundscape and landscape is very important [
4,
27,
42].
C. Transdisciplinary team: the holistic approach involves defining an urban design process that is customised and has a collaborative process between different disciplines [
1,
2,
4,
43]. Some of the potential co-benefits on emotional health found in this study are due to the fact that the renovation of Plaza GLT was the result of a collaborative design from the initial phases of the project involving urban design, social and acoustics experts.
D. Perception, a key factor in urban comfort. Human and social sciences may play a key role in holistic soundscape studies because soundscape is a construct of human perception [
2,
23,
24,
25,
43]. The soundscape approach may also contribute to making governance more participative and improve end users’ sense of belonging with interventions and public places. Therefore, soundscape has become a major tool to facilitate people’s involvement in decision-making processes [
18,
29,
30]. The best way to accurately assess the comfort of a particular place is to ask its users (“local experts”) about the pleasantness they experience in the existing soundscape and place. As [
43] noted, there must be an opportunity for people to choose their own sonic environment; it would be unwise to impose general sound aesthetic.
This work has confirmed the conclusions of other recent studies, namely that comfortable areas could play an important role in offsetting high density urban development by ensuring access to relative quietness and its associated health benefits [
15,
33]. This is particularly relevant taking into account the current global trend towards urbanisation [
44]. Because that, the living environment in urban areas is gaining more attention as is its resilience against global warming and pandemics [
45].
However, this study has some limitations, making it difficult to directly generalise its conclusions. The results provided can support hypotheses raised and confirmed in other studies. The opportunity to investigate data collected in real urban interventions is scarce and, therefore, it is important that researchers share data and conclusions to demonstrate the benefits of applying the soundscape approach to urban planning. The specific conditions in this study include: characteristics of the space (small urban square, in a city with a mild climate); usage characteristics (visited by local residents, a space previously used mainly for walking and social interaction among the elderly); urban intervention conducted (comprehensive renovation to increase the pedestrian area, add green elements and improve accessibility). In this sense, it would be interesting to develop and apply a methodology for analysing data from different studies to increase understanding of the effects of different physical contexts, user types and uses of the space before and after urban intervention, and urban renovation type.
Another limitation of the study refers to analysing the health effects, which focused on well-being and emotional health-related variables but was not complemented by physiological or epidemiological health data.
In light of the literature and the results presented in this paper, the urban planning and design should tend towards the re-naturalisation and re-humanisation of urban spaces. In other words, nature-based solutions (NBS) as a key variable to adapt urban spaces to climate change, but also to improve biodiversity as a source for pleasant soundscapes that contribute to providing nature in urban areas [
2].
To promote healthy smart cities, the authors think it is necessary to look deeper into the contribution of soundscape in the restorative capacity of urban areas and its influence in citizens’ comfort, wellbeing and health. One relevant line would be by incorporating more detailed studies on the capacity of greenery (NBS) to reduce noise impact, considering not only the effect of the presence of green elements [
4] but the potential increase of biodiversity they can provide [
2,
35].
Future research may include transdisciplinary experiences, such as health science and city planning, in order to develop instruments to measure the impact of physical qualities of the urban environment (urban nature) on people’s physical and mental health [
46] and to upscale the type of interventions to a spatial dimension that can contribute to a more general improvement in comfort, for example, in the sense that [
16] put forward in their recent book on Restorative Urbanism.


 ,
, 


