
A Contribution to Sustainable Product Development Using the Example of Battery Electric Vehicles


1
Department of Electrical Engineering, Ravensburg-Weingarten University (RWU), 88250 Weingarten, Germany
2
Department of Mechanical Engineering, Ravensburg-Weingarten University (RWU), 88250 Weingarten, Germany
*
Author to whom correspondence should be addressed.
†
Current address: Doggenriedstraße, Ravensburg-Weingarten University (RWU), 88250 Weingarten, Germany.
Sustainability 2022, 14(7), 3729; https://0-doi-org.brum.beds.ac.uk/10.3390/su14073729
Submission received: 16 February 2022
/
Revised: 8 March 2022
/
Accepted: 18 March 2022
/
Published: 22 March 2022
(This article belongs to the Special Issue Design, Development and Material Choice in Automotive Technology; Lectures Design Systems)
Abstract
:Currently, a consensus in the scientific community can be observed that it is necessary to reduce the carbon footprint and the use of fossil resources in order to ensure the ongoing well-being of humanity and our planet. Battery electric vehicles (BEVs) can contribute to this reduction, as they can use energy from sustainable sources as well as store it in order to enable individual mobility. Still, as long as sustainable energy is not available in abundance and a share of our energy still is generated using fossil sources, it is important to consider the energy consumption of these BEVs in greater detail. BEVs may actually consume more energy than necessary due to an architecture borrowed from non-BEVs, due to their drive-train topology, due to many individual product development issues and last but not least because they are not operated at their highest efficiency. This paper addresses the evaluation of a specific sustainable product development process for BEVs. The study is based on detailed energy consumption simulations of smaller BEVs with different drive train technologies. A general consideration of sustainability and utility based on the design choices, as well as of societal consequences, leads to requirements and challenges for sustainable product development. A digital product development process is described, which addresses these challenges.
1. Introduction
Today, no serious researcher opposes the insight that humanity and the flora and fauna of the world are endangered by excessive carbon dioxide emissions. It is of existential importance to reduce these emissions as well as other greenhouse and toxic emissions. Additionally, as the availability of fossil energy carriers is limited, it is also essential to reduce their consumption. The reduction of those emissions is one major aspect of sustainability. A first definition of the main objective of sustainability was given by the World Commission on Environment and Development; it is to “meet the needs of the present generation without compromising the ability of future generations to meet their own needs” [1]. Current definitions of sustainability include social, economic and technological dimensions in addition to the environmental dimension and focus on nine main sub-dimensions (materials, energy, water, biodiversity, emissions, waste, product and services, compliance and transport) of the environmental dimension [2]. Sustainable product development has to strongly consider the needs of the next generation, but needs to combine this with present customer needs such as usability or economic production. This paper explores analysis processes, the combination of sustainability and usability, societal consequences and a product development process for sustainable battery electric vehicles (BEVs).
The most important aspect of the analysis process is a holistic evaluation. Current studies frequently calculate the CO potential of electro-mobility based on the current vehicle fleet; however, this vehicle fleet includes ≈40% Sports Utility Vehicles (SUVs) with relatively high energy consumption and therefore distorts the potential considerably. Analyses concerning the potential of electro-mobility need to be based on realistic data; for a full assessment of the potential one should be able to select them from an attractive set of possibilities; this is done in Section 2 of the paper in order to elaborate the full potential of electro-mobility and to clarify the possibilities in connection with certain car concepts and topological options. Modern cars are complex systems, and it is consequently extremely difficult to optimize certain characteristics. The combination of sustainability and usability and the in-depth consideration of the societal consequences of certain car concepts and mobility options will inevitably lead to a multi-objective goal system for future BEVs. This and other challenges such as dynamically changing environmental conditions require a digital process that allows revisiting all evaluations and decisions. The whole development process and methods need to be rethought. The main drivers might be sustainability and usability, but main other objectives have to be met as well. This process and the underlying methods as well as the requirements for a realization are also an important focus of this paper. To conclude, the central motivation of the research described in this paper are deficiencies in the present situation. Currently, BEVs are developed at nearly all car companies, but very often they are based on rather conventional car concepts and the actual energy consumption is typical consumer usage is considerably higher than necessary; therefore the sustainability is less than optimum. The paper is addressing this challenge and has the following objectives:
- to clarify the analysis possibilities and limitations.
- to indicate the potential of innovative vehicles concepts.
- to clarify the importance of a utility consideration.
- to clarify the importance of certain conditions generated by the society.
- to clarify the enablers for and requirements from sustainable product development processes.
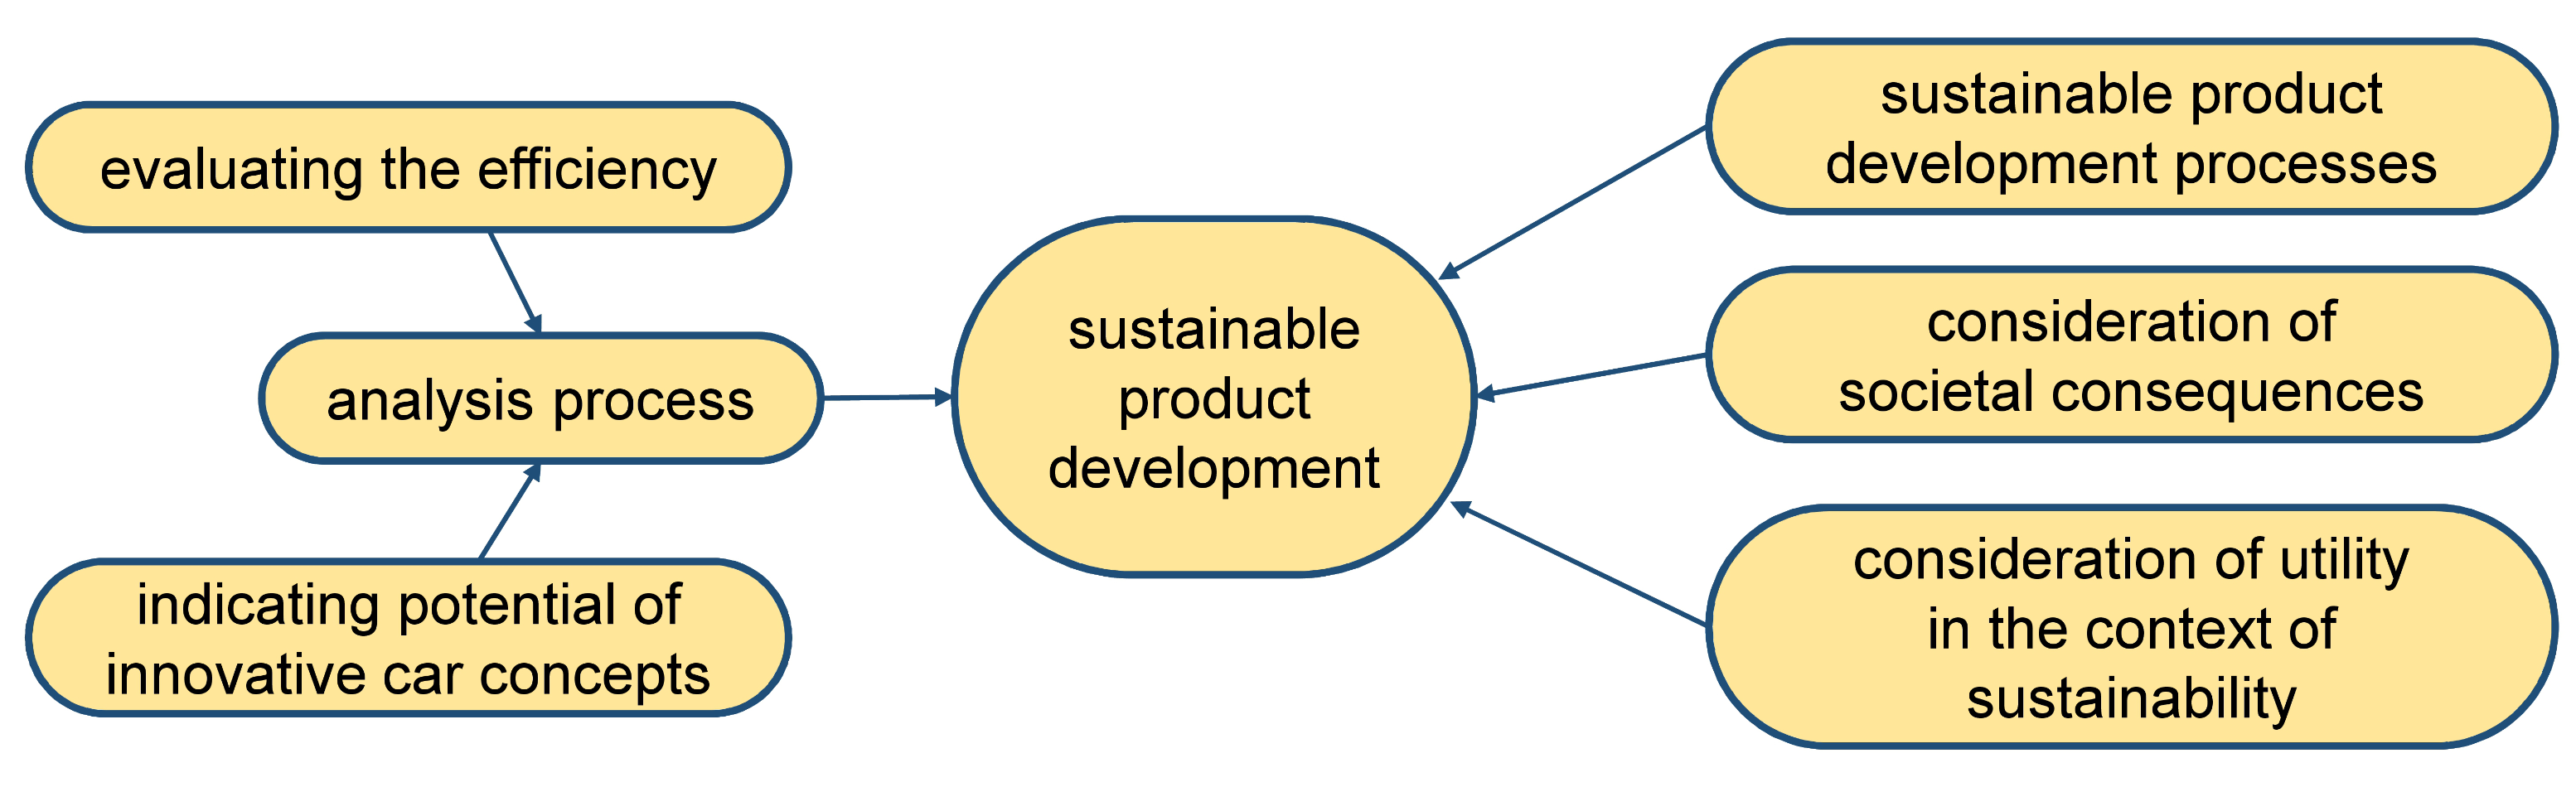
The resulting research framework is shown in Figure 1.
The scientific contributions of the paper are the outcomes of the discussion following the mentioned objectives. For an effective sustainable product development of BEVs it is necessary to perform detailed analyses and to consider several technological and societal aspects already in the development process. The central research question can consequently be formulated as: Which analyses are sensible and necessary?; Which additional important aspects have to be considered?; What kind of processes enable sustainable product development processes?
For the sake of an organized discussion, the article is organized as follows. Section 2 explains current approaches to analyze the overall efficiency and carbon footprint of BEVs. The general concept of sustainability and the importance of usability in product development are elucidated in Section 3. The main societal consequences are discussed in Section 4. Section 5 presents a concept for a development method for sustainable vehicles. Finally, conclusions are drawn, and an outlook is given in Section 6. It is important to note that no distinct literature review section is present, but that literature is reviewed together with the respective discussion for each sub-topic.
2. Exemplary Analysis Process Concerning Overall Efficiency and Carbon Footprint of Battery Electric Vehicles
This chapter presents an analysis of the overall efficiency and carbon footprint of BEVs. The study takes sustainability aspects into account and therefore offers a new, innovative approach to evaluation. This approach is intended to promote the development of new and sustainable mobility solutions also under socio-technical influences.
Table 1 shows the common scopes of life cycle assessments for vehicles. Comprehensive approaches take into account the production as well as the recycling of vehicles in “cradle to grave” studies. The present study considers the entire chain, however, without taking recycling into account. This step in particular is the subject of research for BEVs and is today very difficult to evaluate and therefore should not be the focus of this paper. The paper focuses on the development of vehicles and the resulting effect on the vehicle and energy production, as well as the energy consumed in the use phase.
2.1. State of the Art, Significance and Aim of the Study
Many studies from academia, non-profit research organizations, state governments, and independent consulting firms conclude that BEVs can reduce the carbon footprint of today’s individual mobility, although many of the studies arrive at different potential savings due to regional differences, see [3,4,5,6,7,8]. In 2018, the transport sector was responsible for 29% of the total greenhouse gas emissions in the EU [9].
Due to the sector’s carbon footprint, the effort is high to justify the potential of e-mobility in order to achieve fast market penetration. This is done to comply with the EU climate law of the European Parliament of April 20, 2021, after which the EU must become climate neutral by 2050.
The increased relevance of CO emissions for car manufacturers is also shown by the final report of the IKA of RWTH Aachen University, in particular with regard to business aspects. Accordingly, legislation, technology and vehicle concepts must go hand in hand under economically stable conditions. The aspect of sustainability, which places particular emphasis on market acceptance and higher acquisition costs, is also addressed. In the future, the life cycle assessment of different drive concepts could provide an objective sustainability evaluation [10].
In this context, today’s studies evaluating potential CO savings (as presented in the first paragraph) are mostly based on existing vehicle concepts. This is problematic because many manufacturers are initially focusing their electrification strategy on heavy premium vehicles (e.g., Mercedes EQC and EQS, Audi e-tron, VW ID4, Škoda Enyaq, Hyundai Ioniq 5, Polestar 2, Tesla Model S, and Model X), because the profit margins that can be achieved there are higher than for small vehicles (e.g., VW e-up, Renault Zoe, Smart EQ forfour). The share of SUVs among BEVs sold in 2021 was 40.4%. By contrast, the smallest segment “basic” with 11.4% and the small car segment with 16.1% together only represented 27.5% of the sales in 2021 [11].
From the point of view of product development of future vehicles, it is important to achieve a stable and independent system of objectives as a basis of sustainability evaluation. In this context, the risk is present that the sold BEVs are used in order to evaluate how sustainable BEVs can be. In this case, if mainly SUVs are sold as BEVs, this object system will lead to results that do not reflect the potential of this technology, because the energy consumption of the SUV-BEVs will be rather high, mainly due to the high frontal area and curb mass. It is consequently crucial to evaluate the technology potential independently of the vehicle fleet sold. For an evaluation of the potential of the technology, it is inevitable to define comparable vehicles and to compare the real-life energy consumption. Energy-saving concepts usually entail disadvantages for the user (e.g., less storage space, less drive power, limited maximum speed), which should be critically evaluated in conclusion and socio-technical aspects, which in turn will iteratively influence the object and target system.
In 2021, a BEV produces 66–69% less life-cycle greenhouse gas emissions (LCGHG) than a gasoline-powered passenger car. At the beginning of life, directly after vehicle production, battery manufacture, in particular, leads to an LCGHG-disadvantage for BEV vehicles compared to gasoline-powered vehicles. The largest share of LCGHG for BEV with approx. 50% is accounted for electricity production and thus energy consumption while driving [8].
In summary, for BEVs to be produced and operated as sustainably as possible, the emissions generated during battery manufacture and the energy consumption during operation must be reduced in particular. The scientific question to be answered by the following study is therefore:
What potentialities do sustainable BEVs in particular offer for further reducing LCGHG during operation and in battery manufacture?
To answer the above question, three small vehicles are compared in this study. Two of these vehicles are already available as BEVs. The battery size and the powertrain configuration of the vehicles are varied so that the potential of the individual measures can be worked out with regard to the above-mentioned question. Taking into account the generally low daily driving distance of 23.8 to 39 km and an average stage length of around 13.7 km in Europe, the smallest battery size enables a 100 km drive (WLTC based). In addition, 250 km and 500 km range are simulated as mid and high range vehicles [12,13].
Finally, a critical assessment is made of whether the LCGHG savings achieved and the necessary restrictions in range, power and top speed are in a justified relationship. Finally, this study compares the calculated LCGHG potential of the three small vehicles with an average BEV and an average gasoline-powered vehicle from [8] containing a high SUV share. A socio-technical discussion of the results follows the study presented in Section 2.
2.2. Calculation Basis
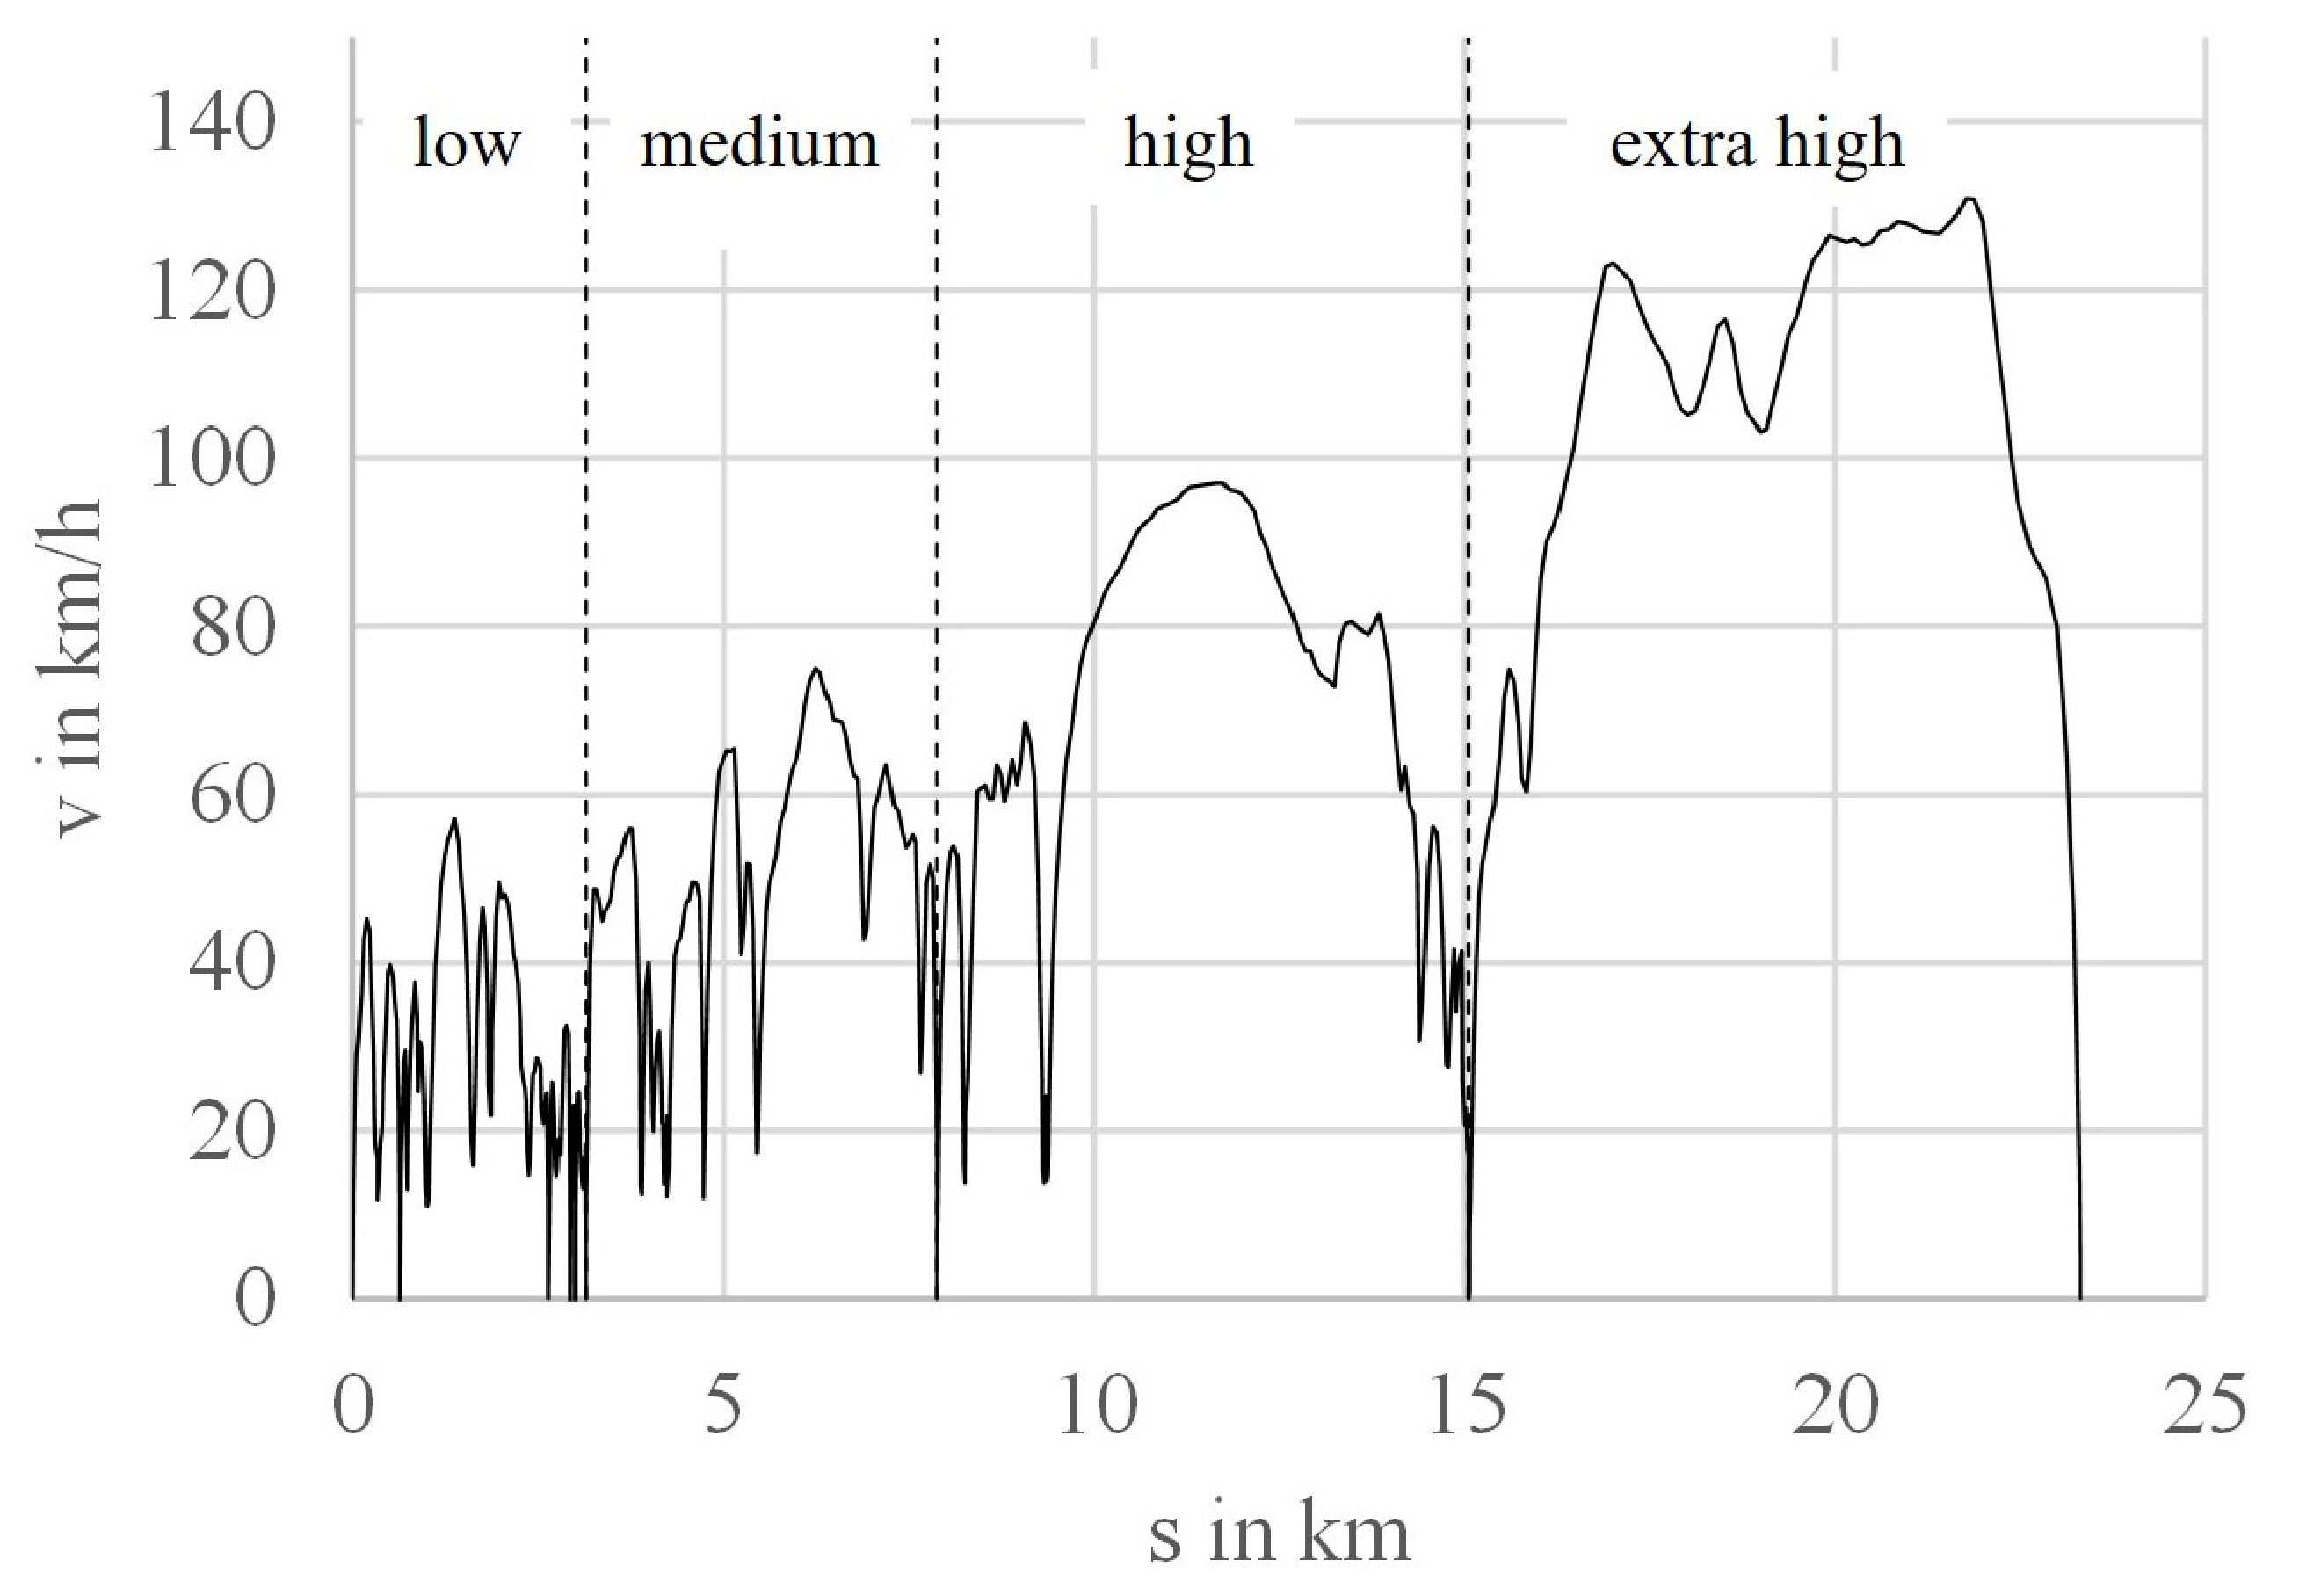
In the EU, the Worldwide Harmonized Light Duty Test Cycle (WLTC) is used to determine consumption, emissions and range on the basis of an objective and reproducible procedure, see Figure 2. It is intended to reflect real-world behavior in road traffic as accurately as possible. The cycle is divided into low, medium, high and extra high sections with different maximum speeds. The sections represent different driving scenarios such as city traffic, extra-urban driving and highway driving [5].
As shown in [4,5], the published WLTC consumption data is not suitable for an evaluation of the absolute real-driving energy consumption of BEVs although the indicated WLTC consumption includes charging losses. The consumption data specified by the manufacturers can deviate strongly from the real consumption data which is dependent on the driven route, the driver’s behavior, traffic and other factors like the ambient temperature. For a relative evaluation of the consumption, and an objective comparison, a WLTC measurement and a subsequent consumption calculation is nevertheless permissible. For this reason, a change in consumption based on WLTC is used in the following on the basis of measurements taken with a reference BEV (VW e-up).
The WLTC itself distinguishes between two possible classes 3a and 3b for vehicles with a power-to-weight ratio greater than 32 W/kg. Class 3a applies to vehicles with a maximum speed of <120 km/h and contains a slightly different medium and high range compared to the class 3b represented in Figure 2 which applies to vehicles with a maximum speed of ≥120 km/h [14].
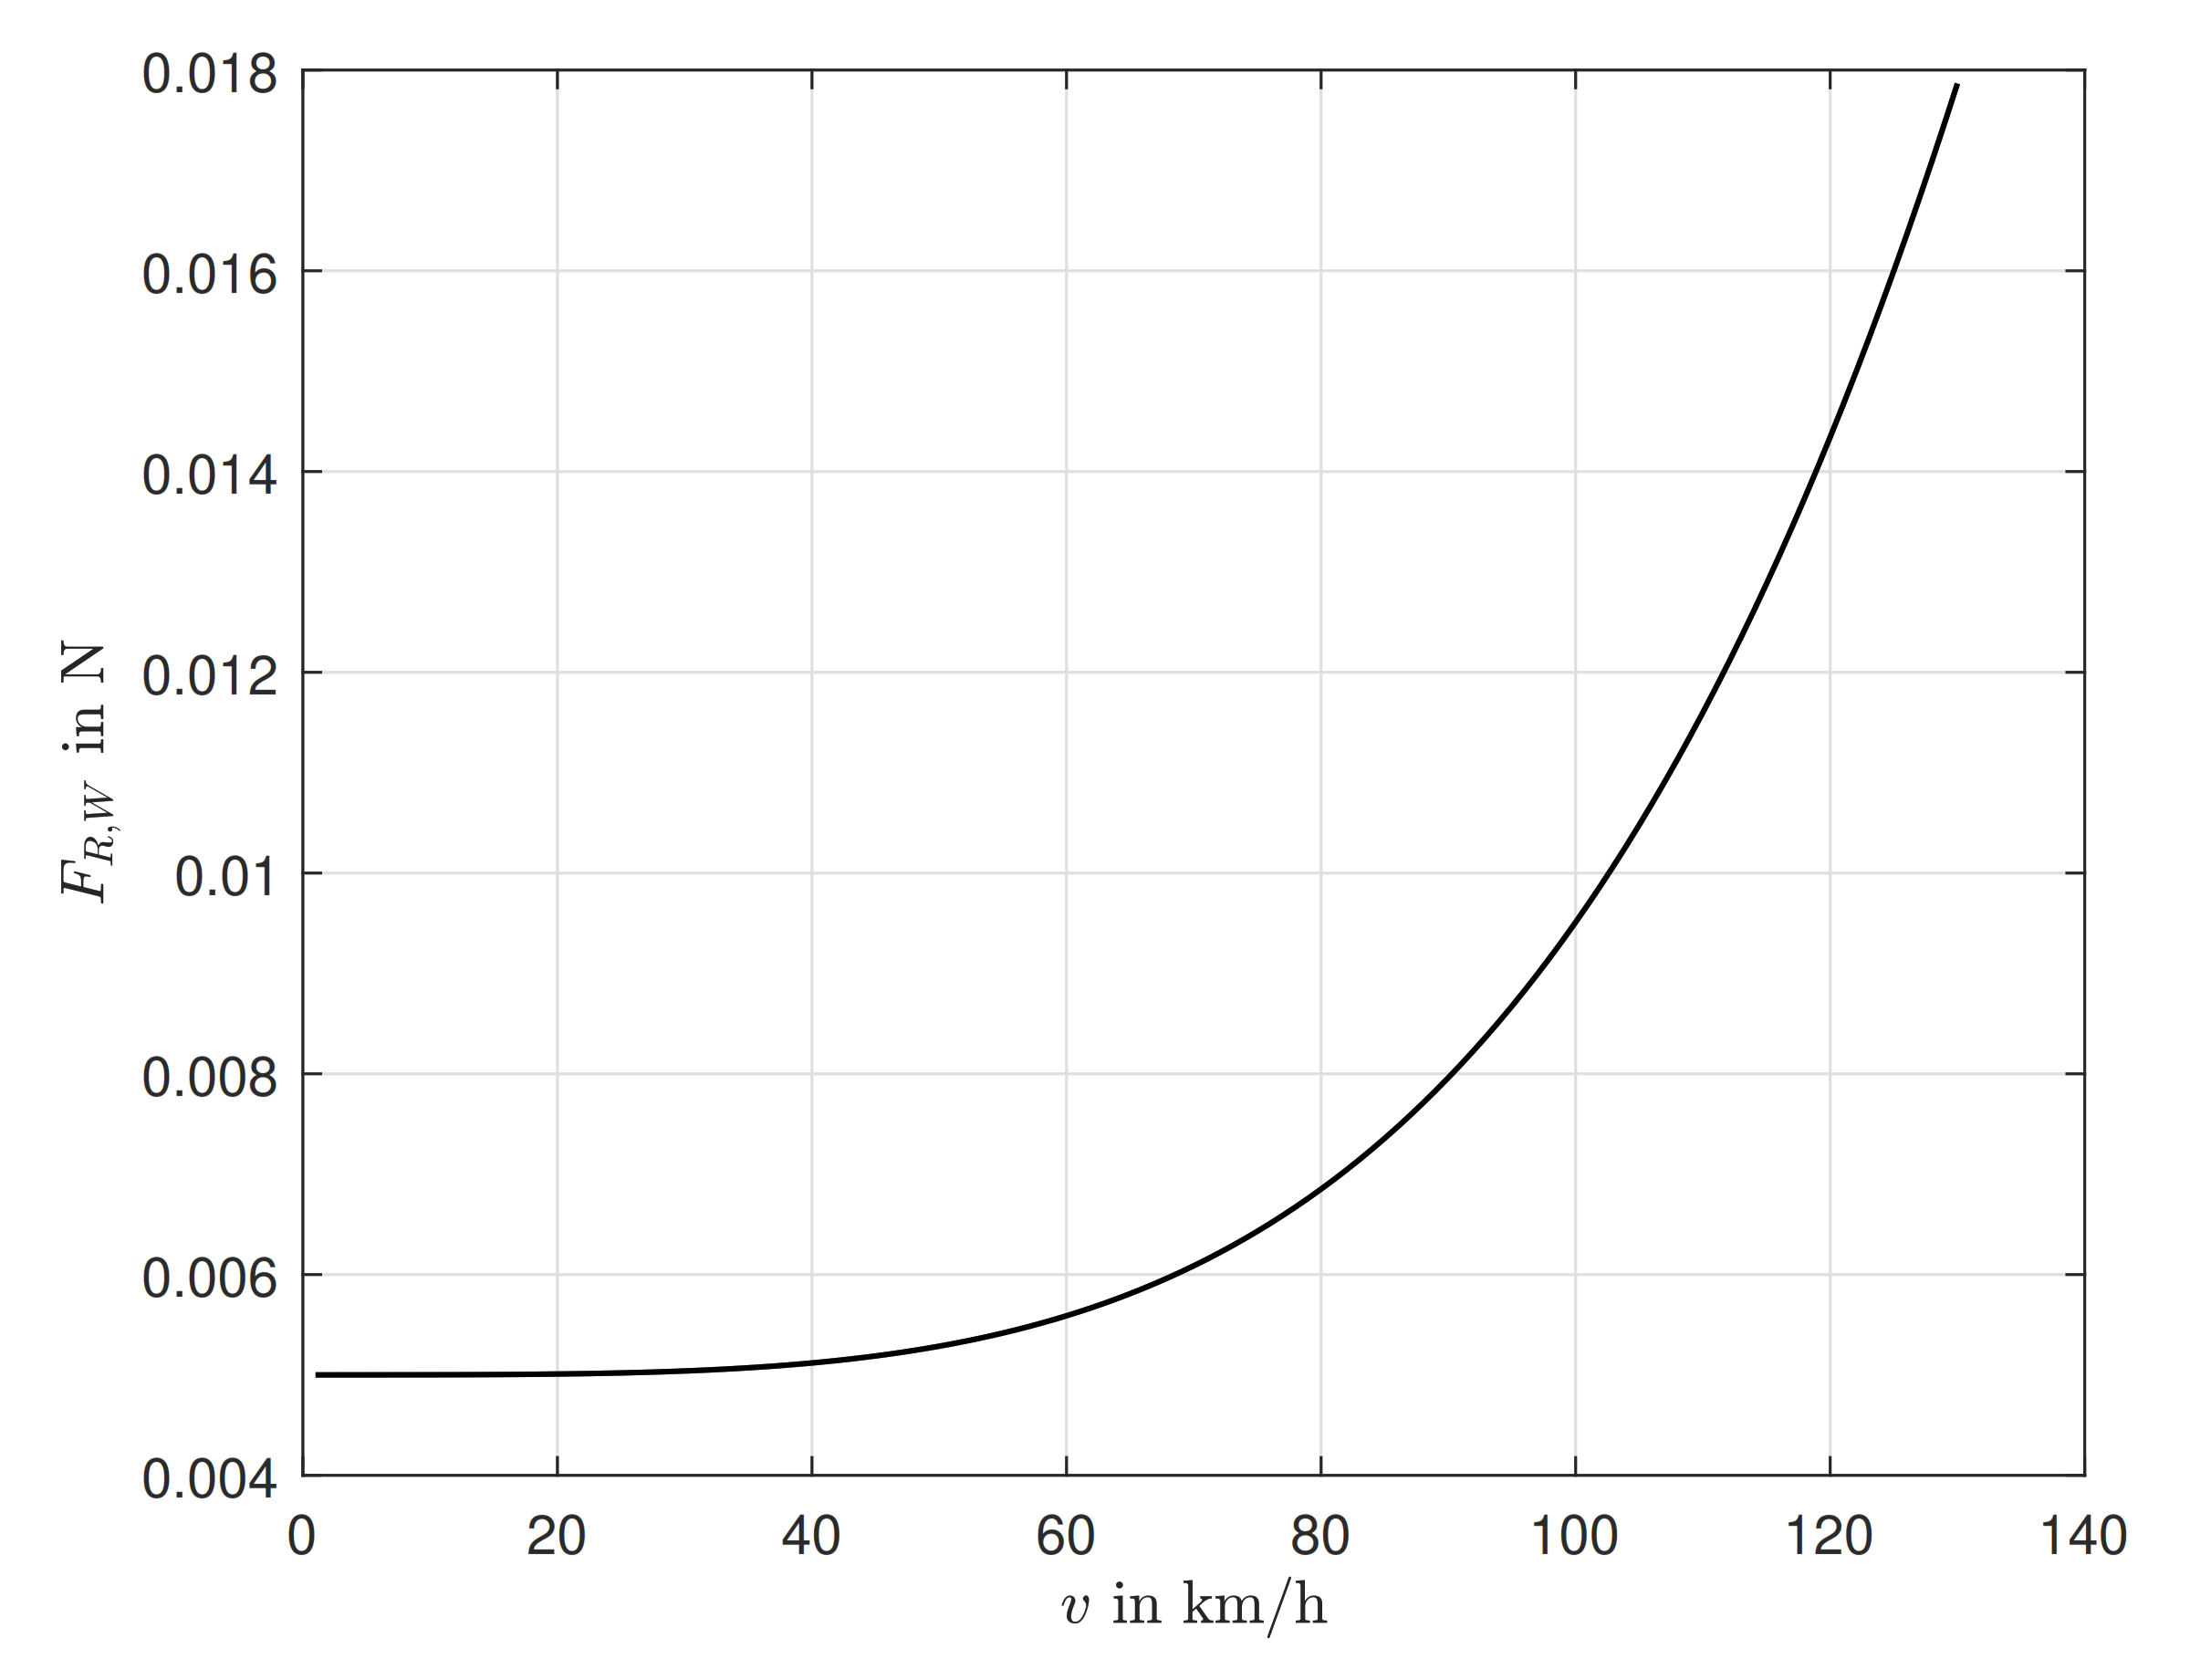
The overall driving resistance of a vehicle is calculated in this study for all simulations according to Equation (1) including the wheel resistance , the air drag and the inertial resistance . The downforce of the vehicle is dependent on the vehicle mass m and the gravity constant m/s². The wheel resistance itself depends on the rolling resistance coefficient, which is modeled by Equation (2). is dependent on the projected cross-sectional area A, the air drag coefficient , the air density kg/m³ and the vehicle speed v. The inertial resistance includes the translational mass m as well as the rotational mass with the help of the factor and is additionally depending on the vehicle acceleration a.
Equation (2) shows the calculation of the rolling resistance coefficient according to [15] as a function of the factors , and .
Table 2 shows the used data for a radial (R) tire with a velocity limit of 180 km/h (S).
Figure 3 shows the resulting according to the data from Table 2 and Equation (1) as a function of vehicle speed. This data is used for all vehicles and simulations of this study.
The wheel-sided power demand is calculated for each velocity with Equation (3).
The mechanical power of the electric motor is calculated using the electric motor efficiency as well as the drivetrain efficiency , see Equation (4). The electric motor efficiency also includes the efficiency of the power electronics. The drivetrain efficiency includes mechanical losses in the gearbox and the axle.
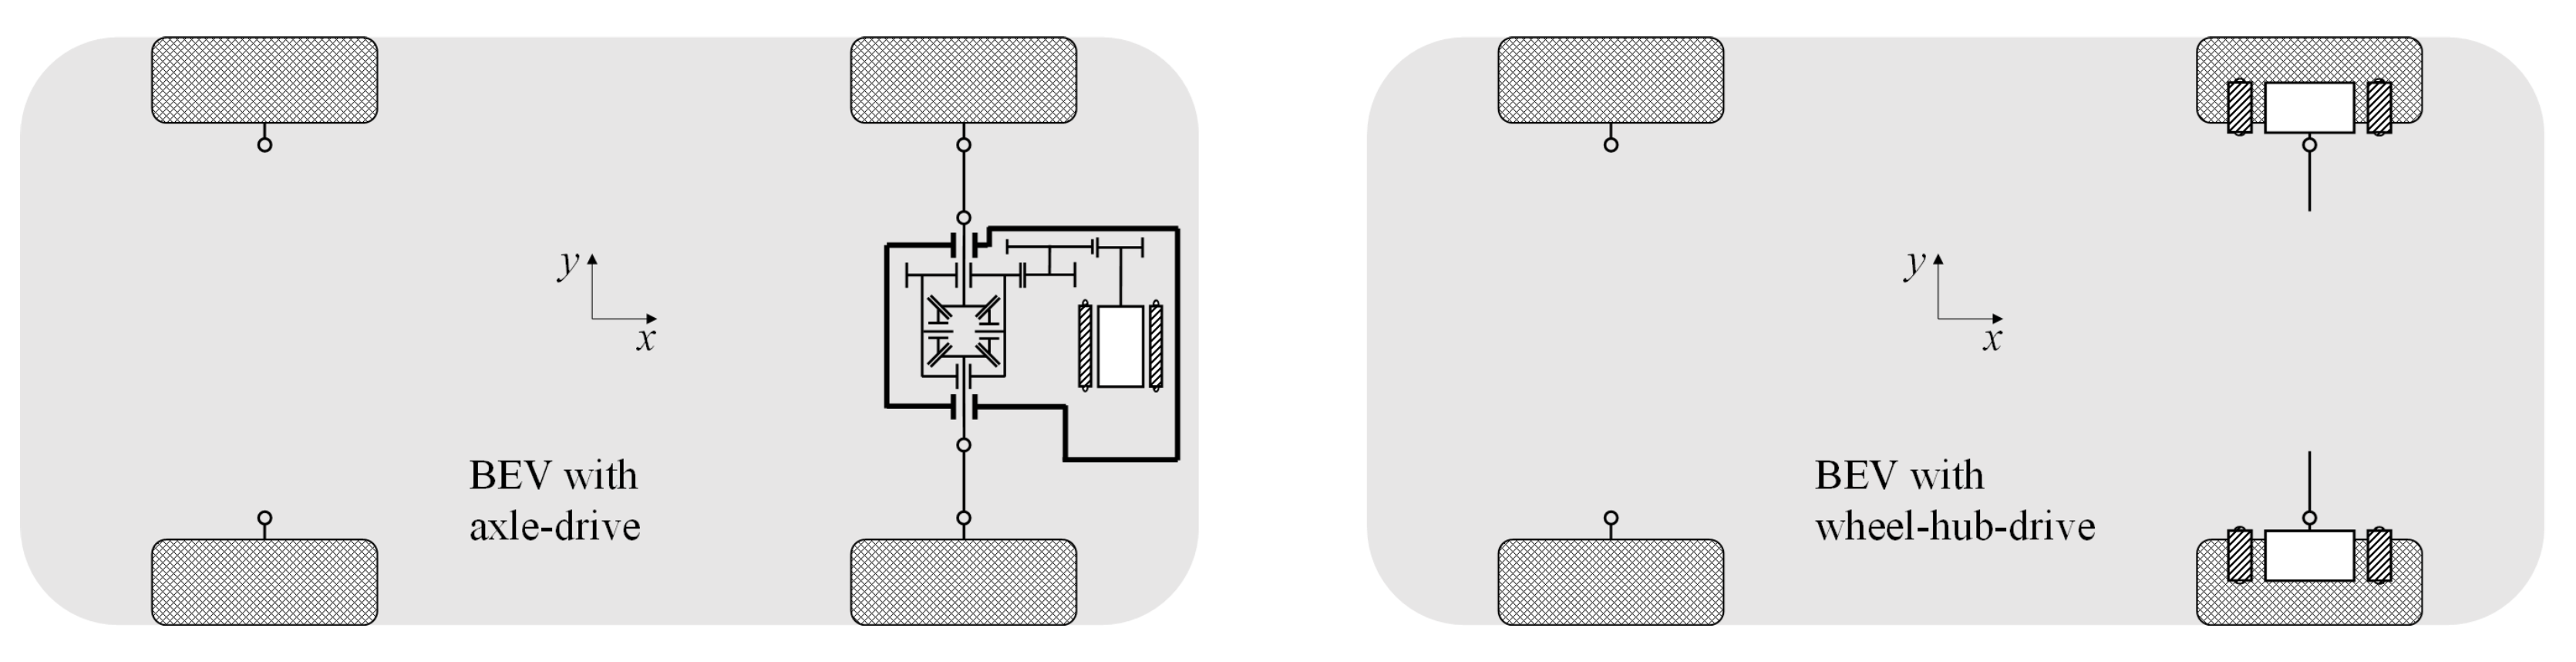
The powertrain configuration of the vehicles considered in this study is varied. Two variants are considered, an axle-drive (AD) and a wheel-hub-drive (WHD). Both are shown schematically in Figure 4. It can be seen that in the wheel-hub variant, the drivetrain losses can be neglected since this drive variant does not require a transmission.
The WHD is realized by two electric motors on the front axle, thus enabling the advantage of torque vectoring. In return, the unsprung masses are increased compared with the AD. Both aspects do not flow into the WLTC simulations, because road unevenness or gradients, as well as cornering, are not provided for in this cycle.
2.3. Used Data Basis
This chapter describes the database from available sources, which are used to calculate the LCGHG in the WLTC simulations. Each of the three simulated vehicles has the same engines installed, one with an axle drive that is installed in the VW e-up and one with a wheel hub drive. All vehicles are designed in such a way that they can be driven at top speeds of 90 km/h or 130 km/h. The parameters air drag coefficient, projected cross-sectional area, curb weight and dynamic rolling radius correspond to the original parameters, which are shown in Table 3, of the individual vehicles, which are shown in Figure 5. In addition, the maximum ranges that the respective vehicle can achieve are set to 100, 250 and 500 km. This creates 12 different vehicle variants for each vehicle. For each vehicle variant, the WLTC was simulated in MATLAB. The formulas explained in Section 2.2 were used as the basis for the simulation. Additionally, a WLTC measurement of the VW e-up was firstly used to determine the powertrain efficiency map and secondly to show that the simulation returns plausible values.The determined battery weights, battery net capacities and energy consumption were then used to calculate the overall LCGHG of each vehicle variant.
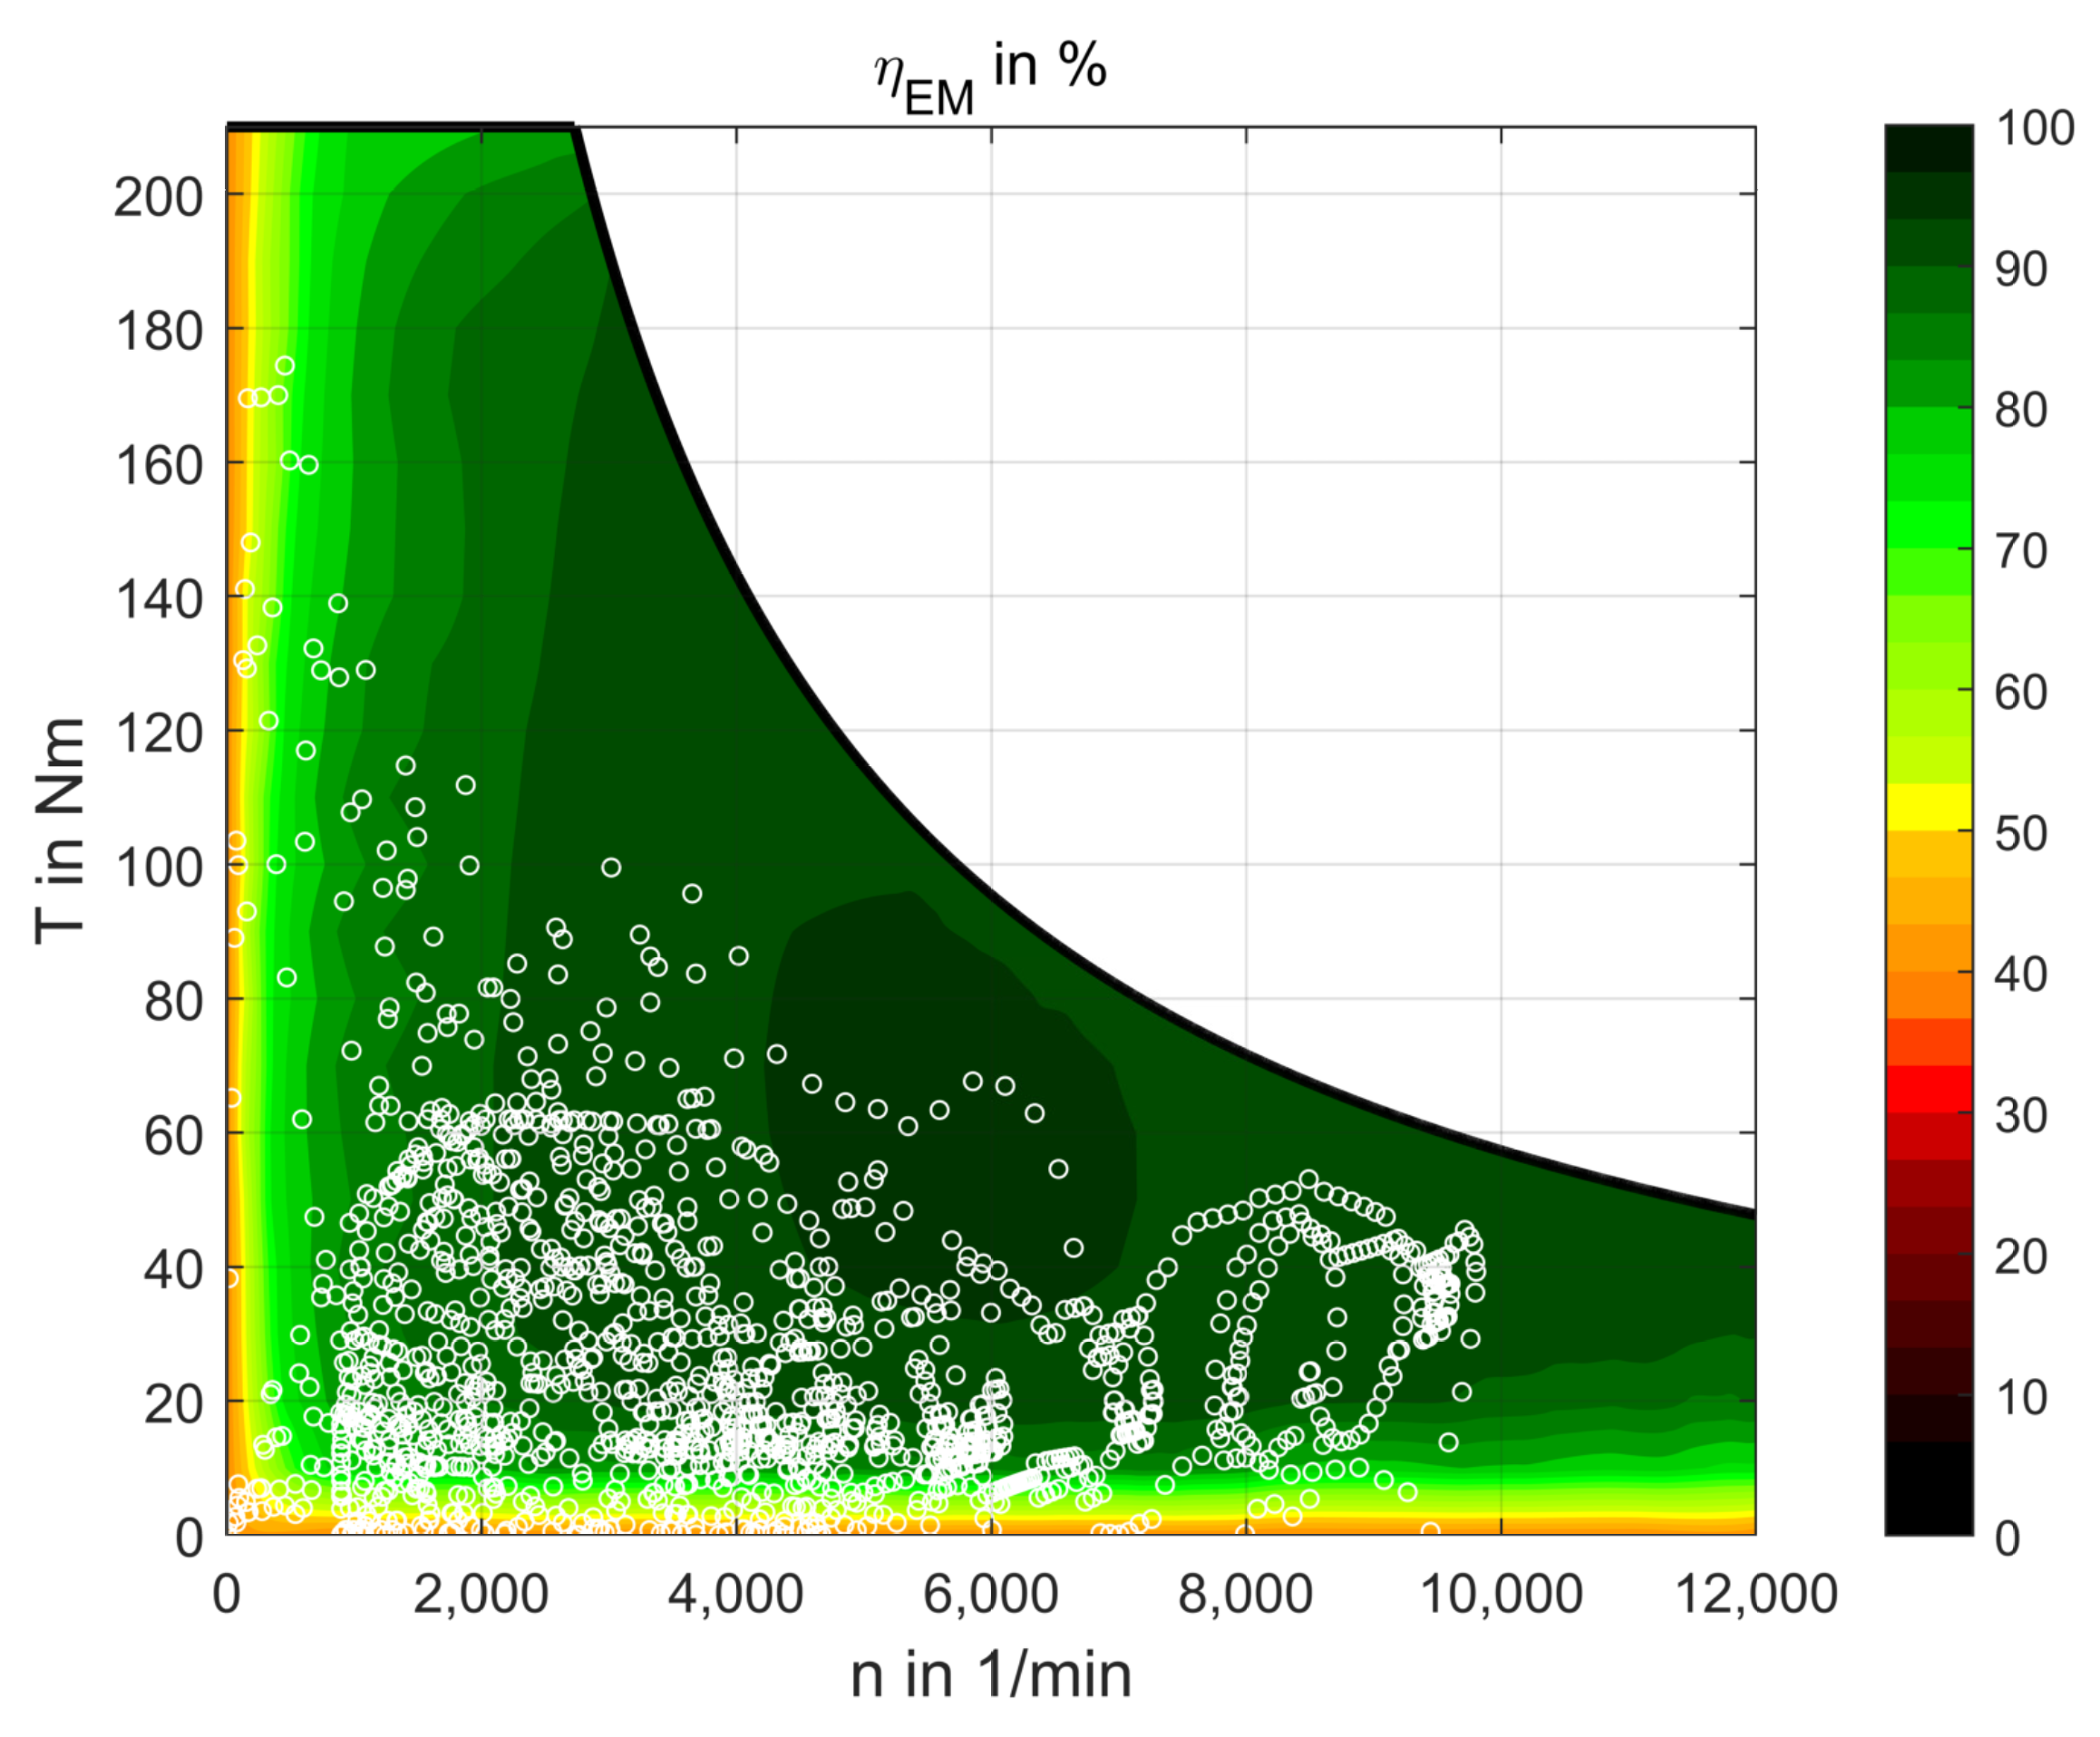
Figure 6 shows the efficiency map of the VW e-up electric motor from an official VW publication [21]. The electric motor has a maximal power of 60 kW and a maximum torque of 210 Nm. The published efficiency map is digitized and in Figure 6 exemplary operating points of the WLTC simulation with the VW e-up are drawn in white. Many operating points are found at low torques. Operating points at high torque and efficiency are found rarer.
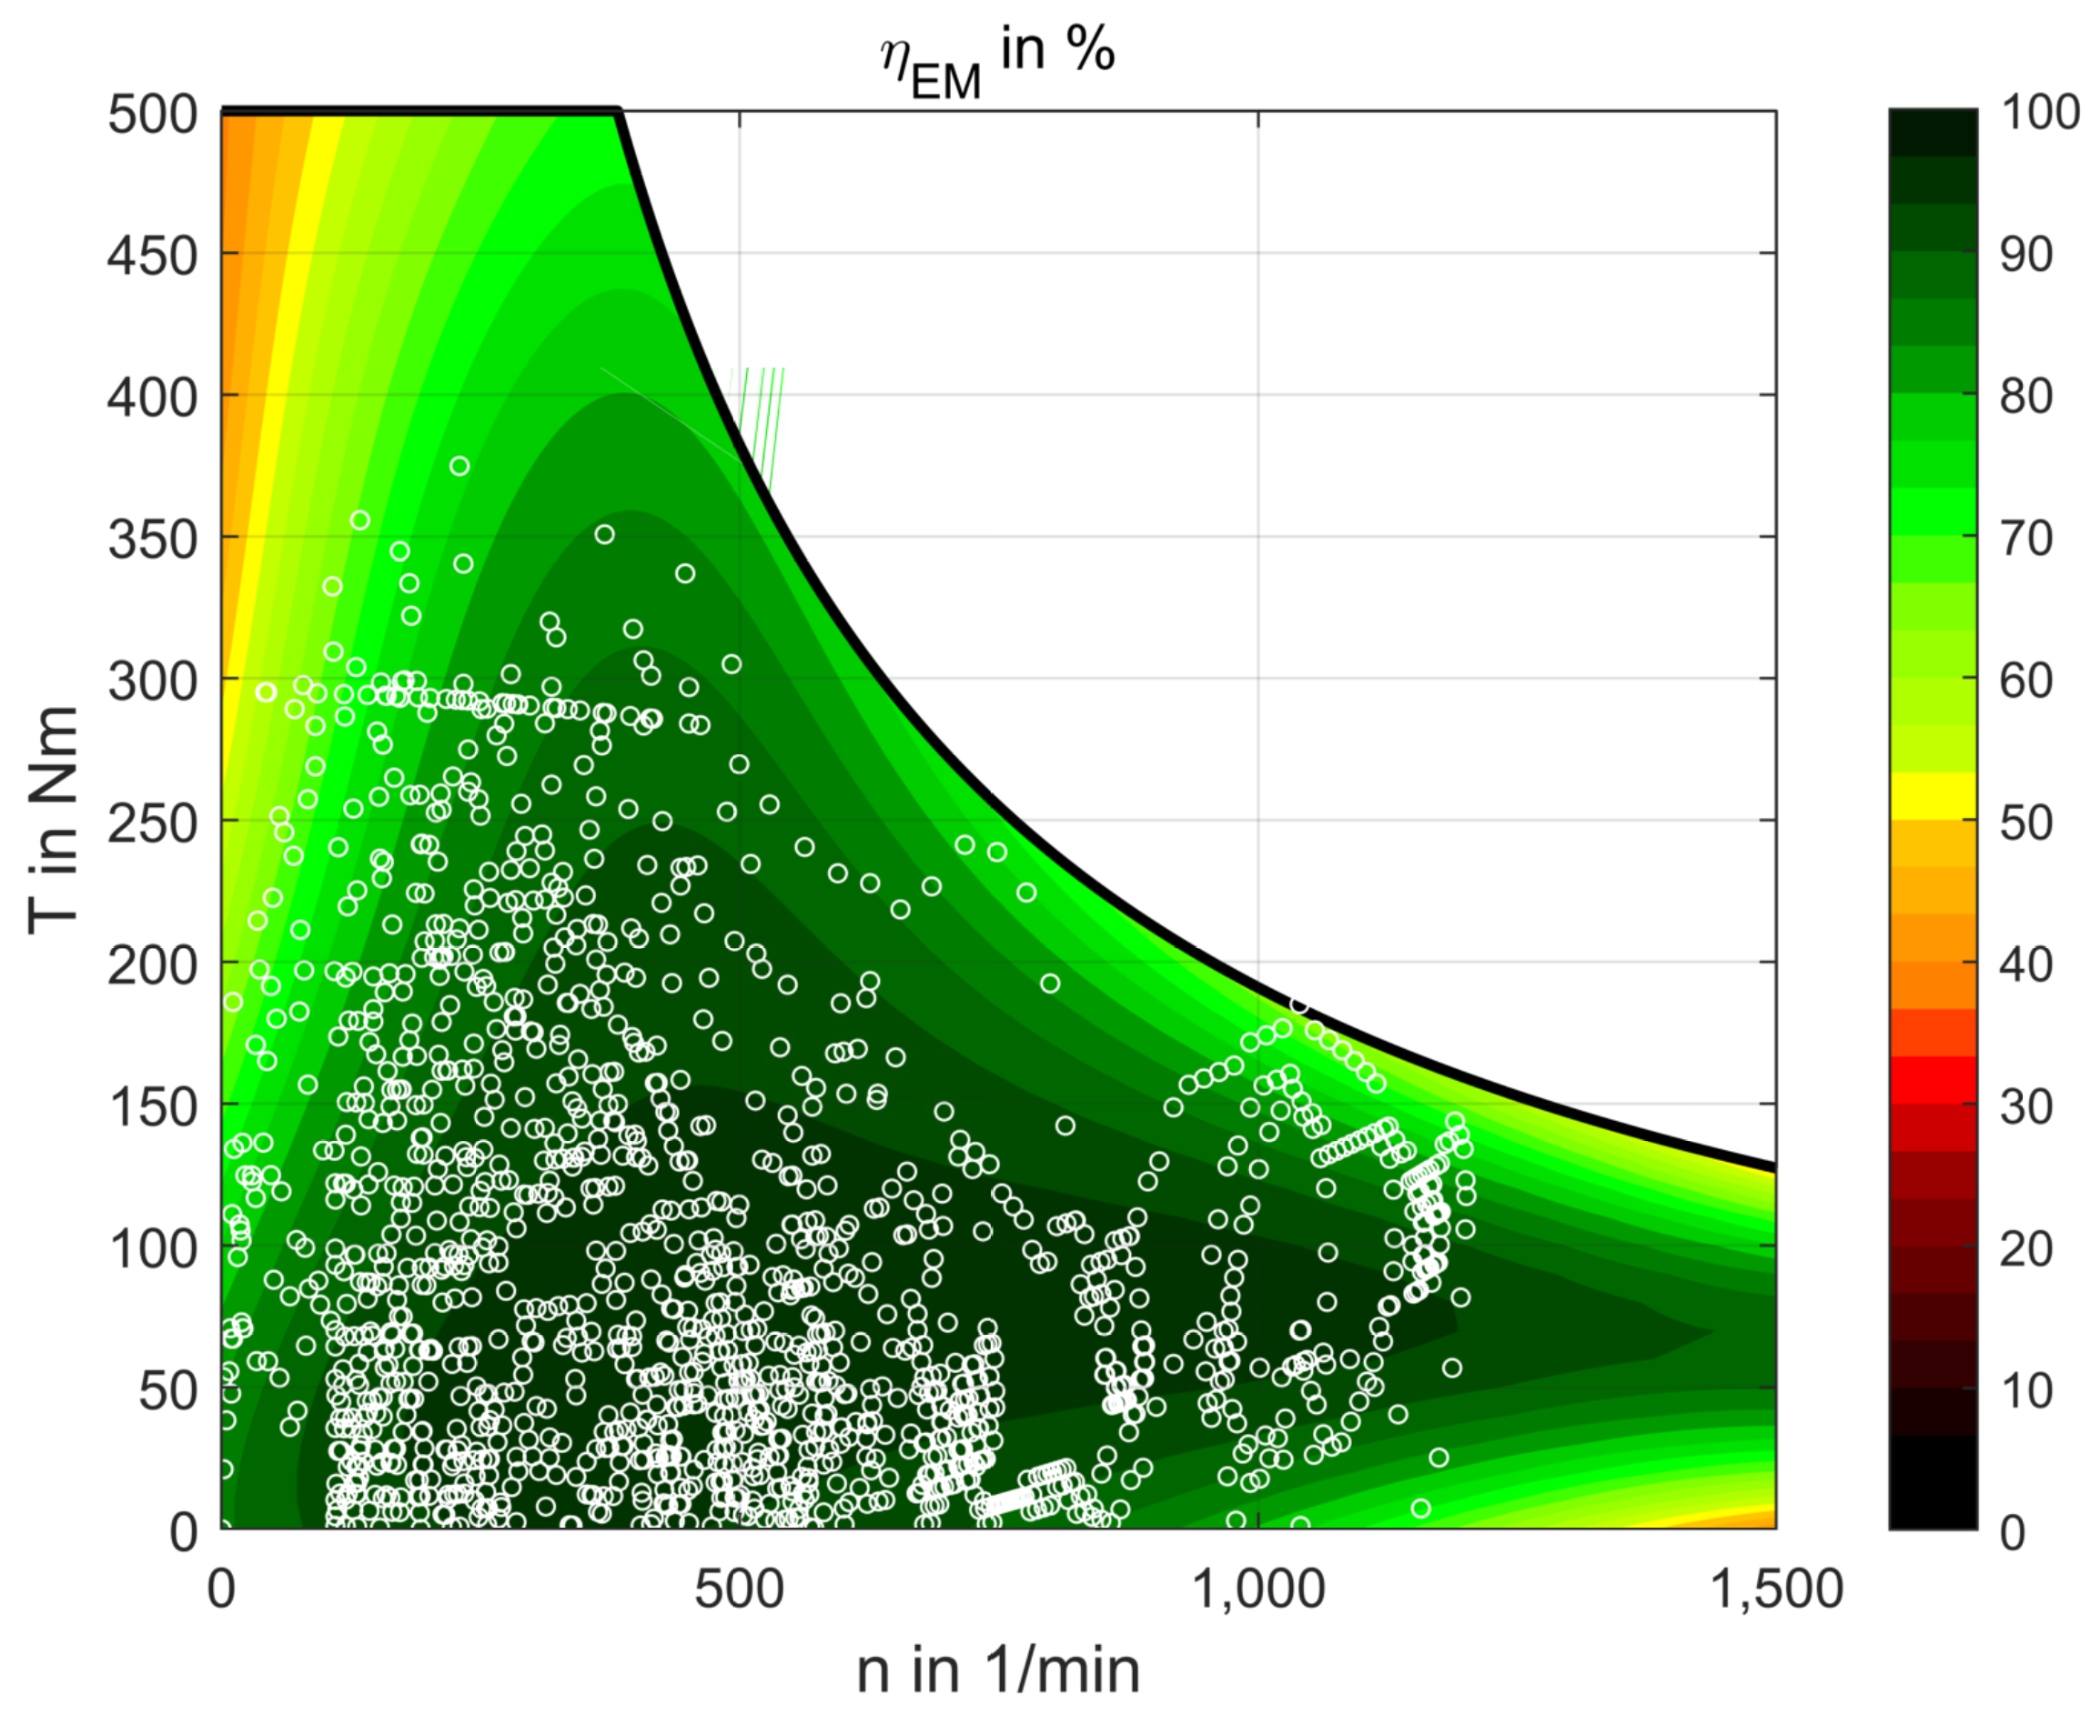
Figure 7 shows the efficiency map of a torque motor published by [22]. This motor is used for the wheel-hub-drive configuration simulated. The motor has a maximum power of 20 kW and a torque of 500 Nm. The maximum speed is 1500 rpm, which is low in comparison to the 12,000 rpm from the original VW e-up electric motor. The wheel-hub-drive configuration supports an overall maximum power of 40 kW using two wheel-hub motors. The maximum power is 20 kW lower compared to the original VW e-up maximum power.
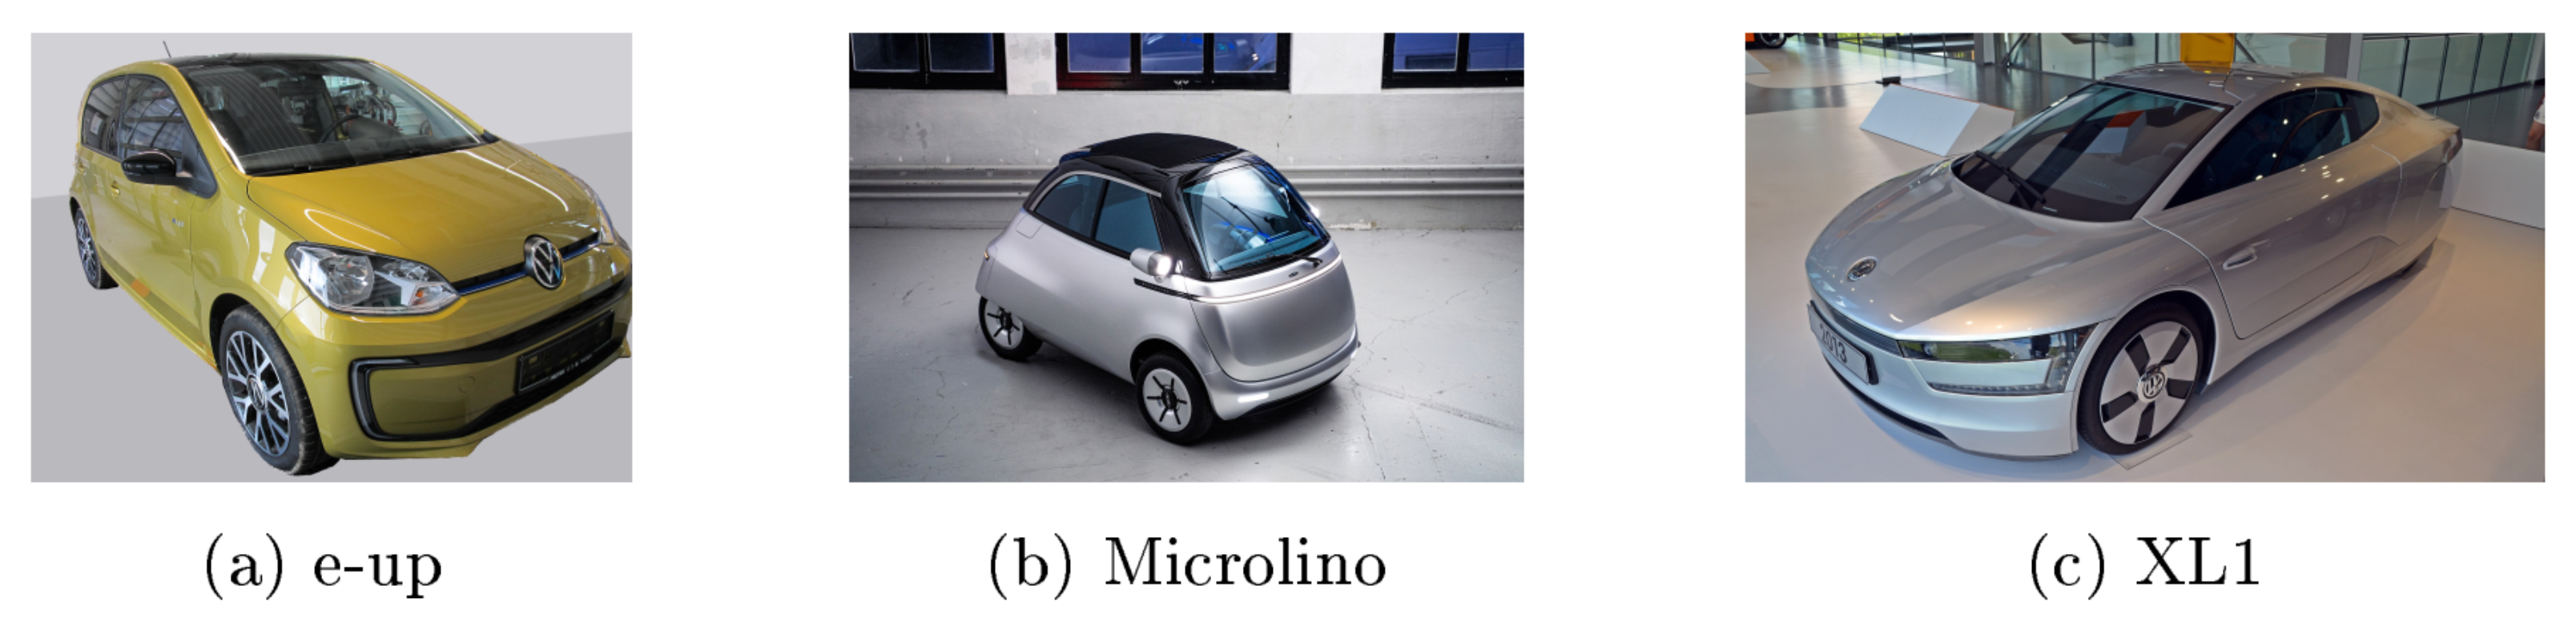
Table 3 shows the vehicle data of the three simulated vehicles, which are shown in Figure 5. The VW e-up is a small BEV with 4 seats and represents a compromise between a family-friendly and a small city suitable vehicle. The maximum speed is 130 km/h. The Microlino is designed as a 2-seater city vehicle. The vehicle, therefore, has a maximum speed limited to 90 km/h. The VW XL1 was designed as a 1-liter car. The vehicle has a 0.8 L combustion engine with 35 kW maximum power and a 20 kW electric motor power. It is very slim and wind-cheating. The maximum speed is 160 km/h.
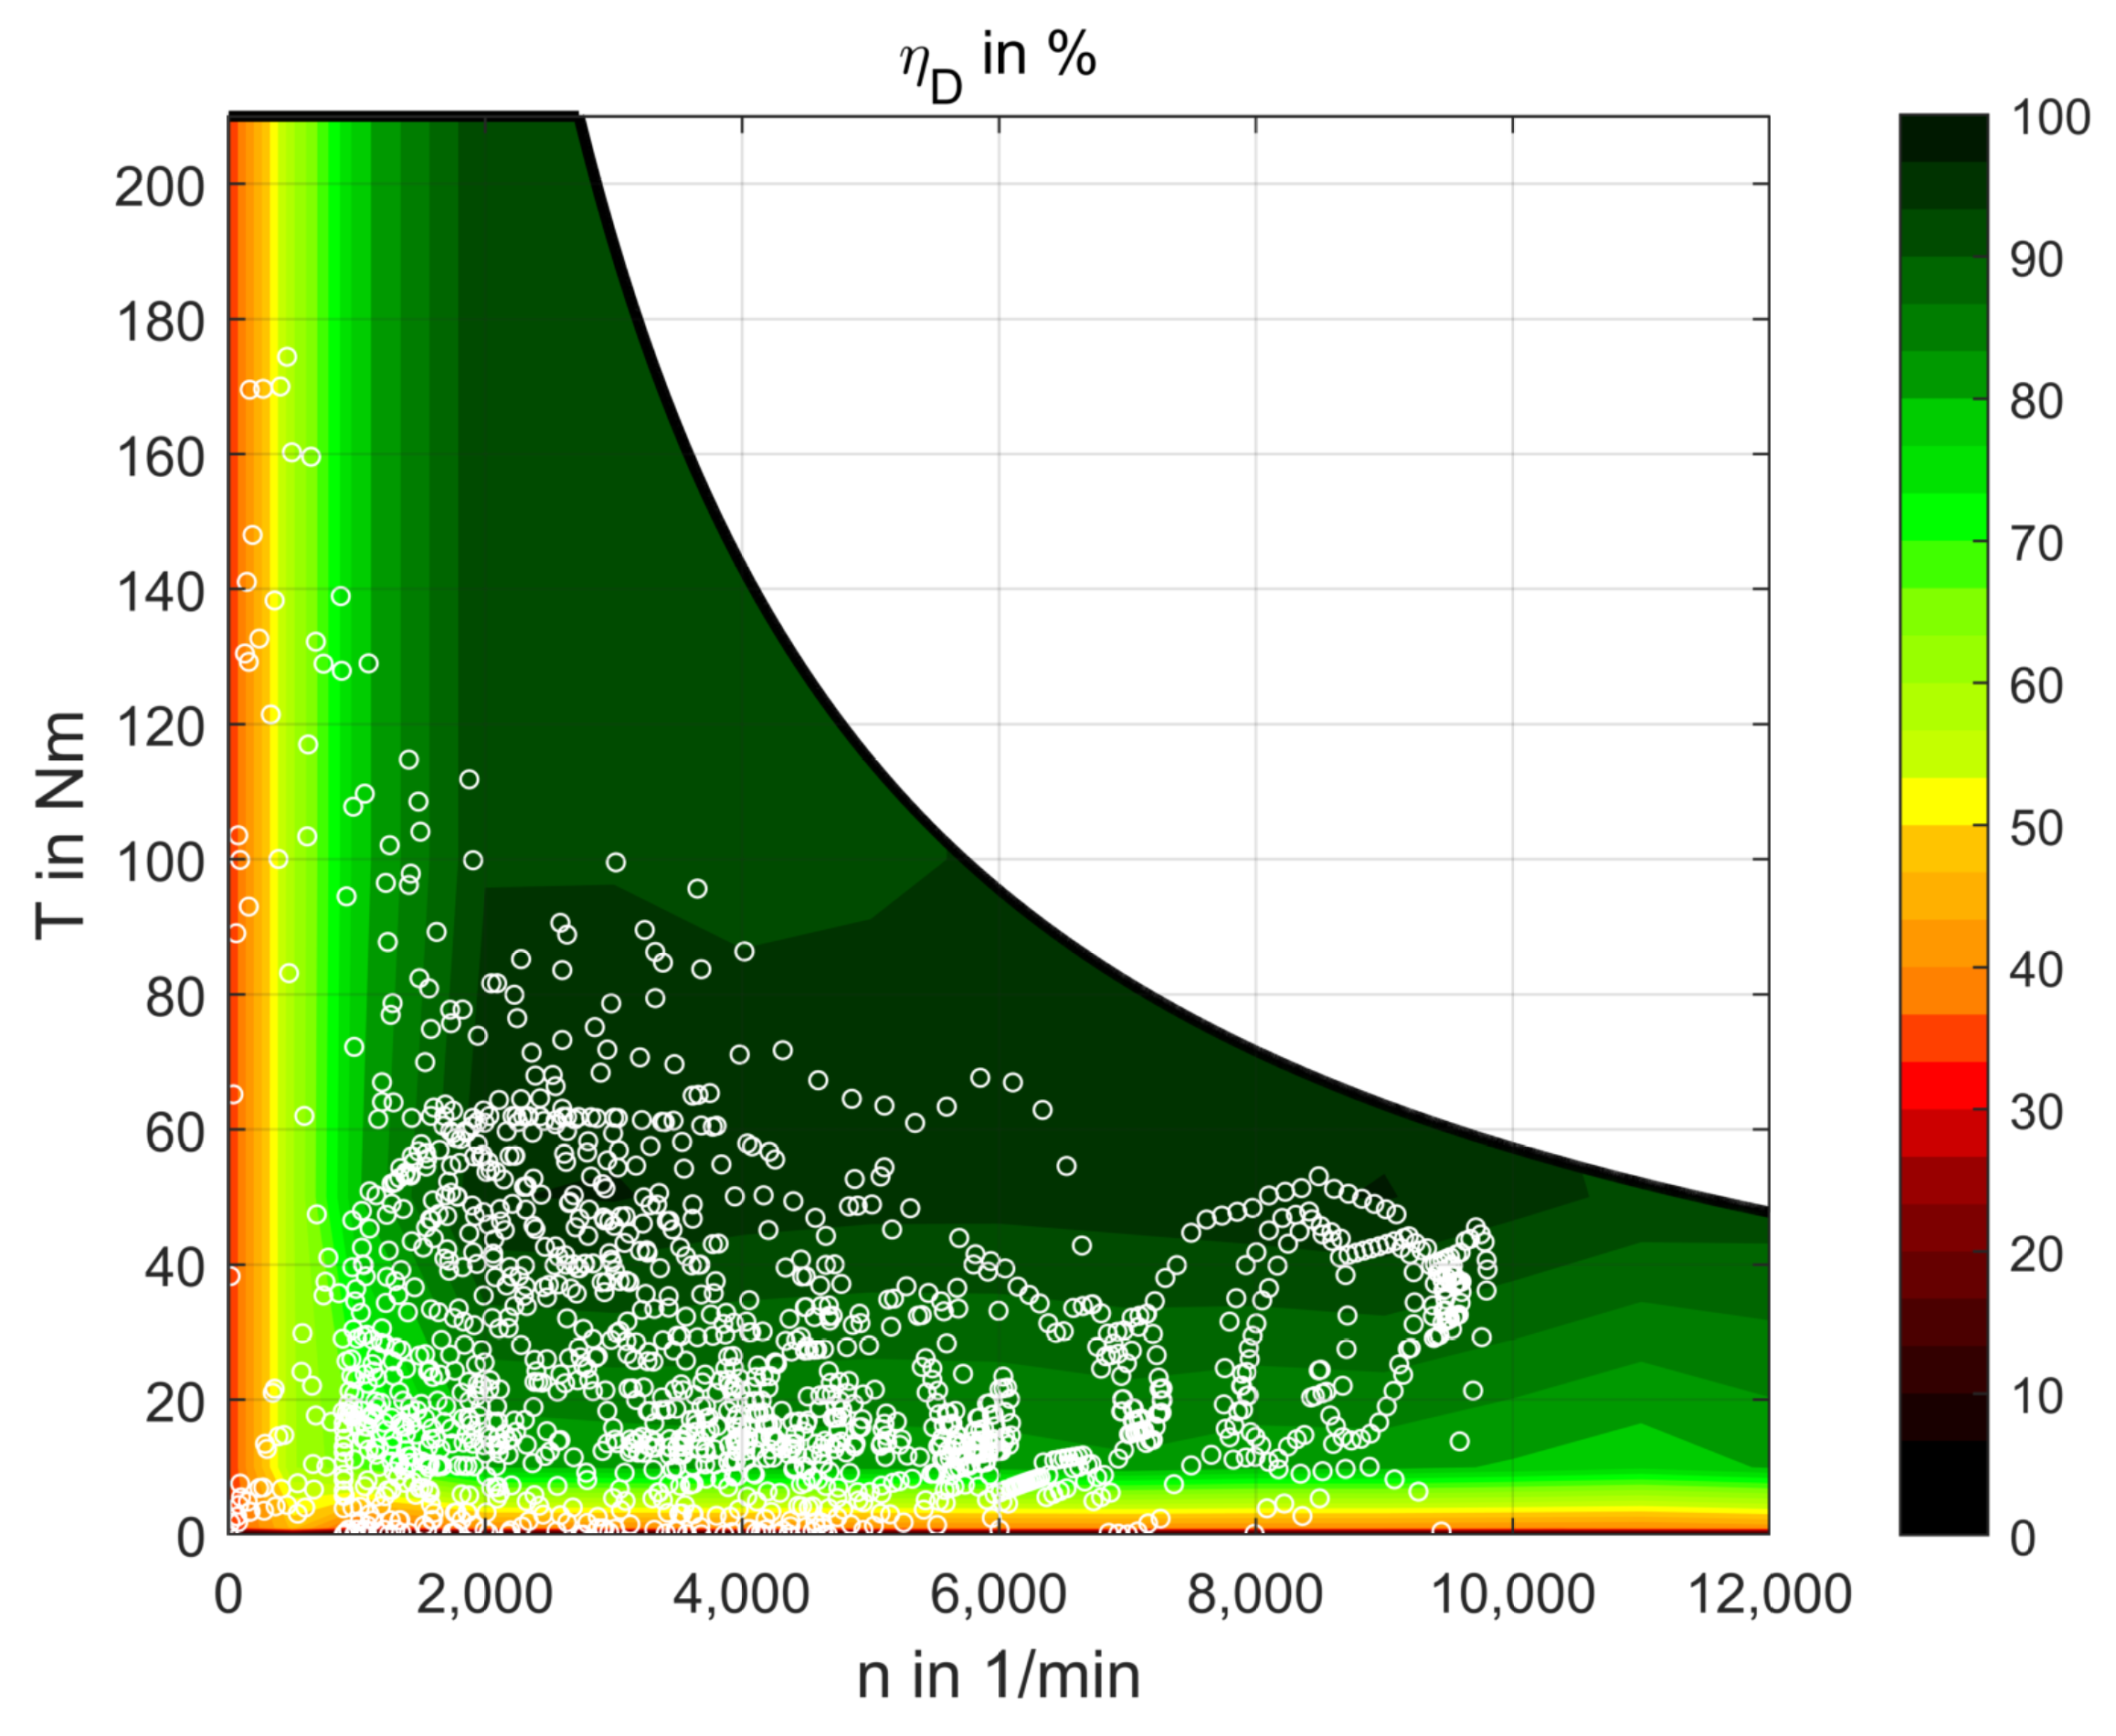
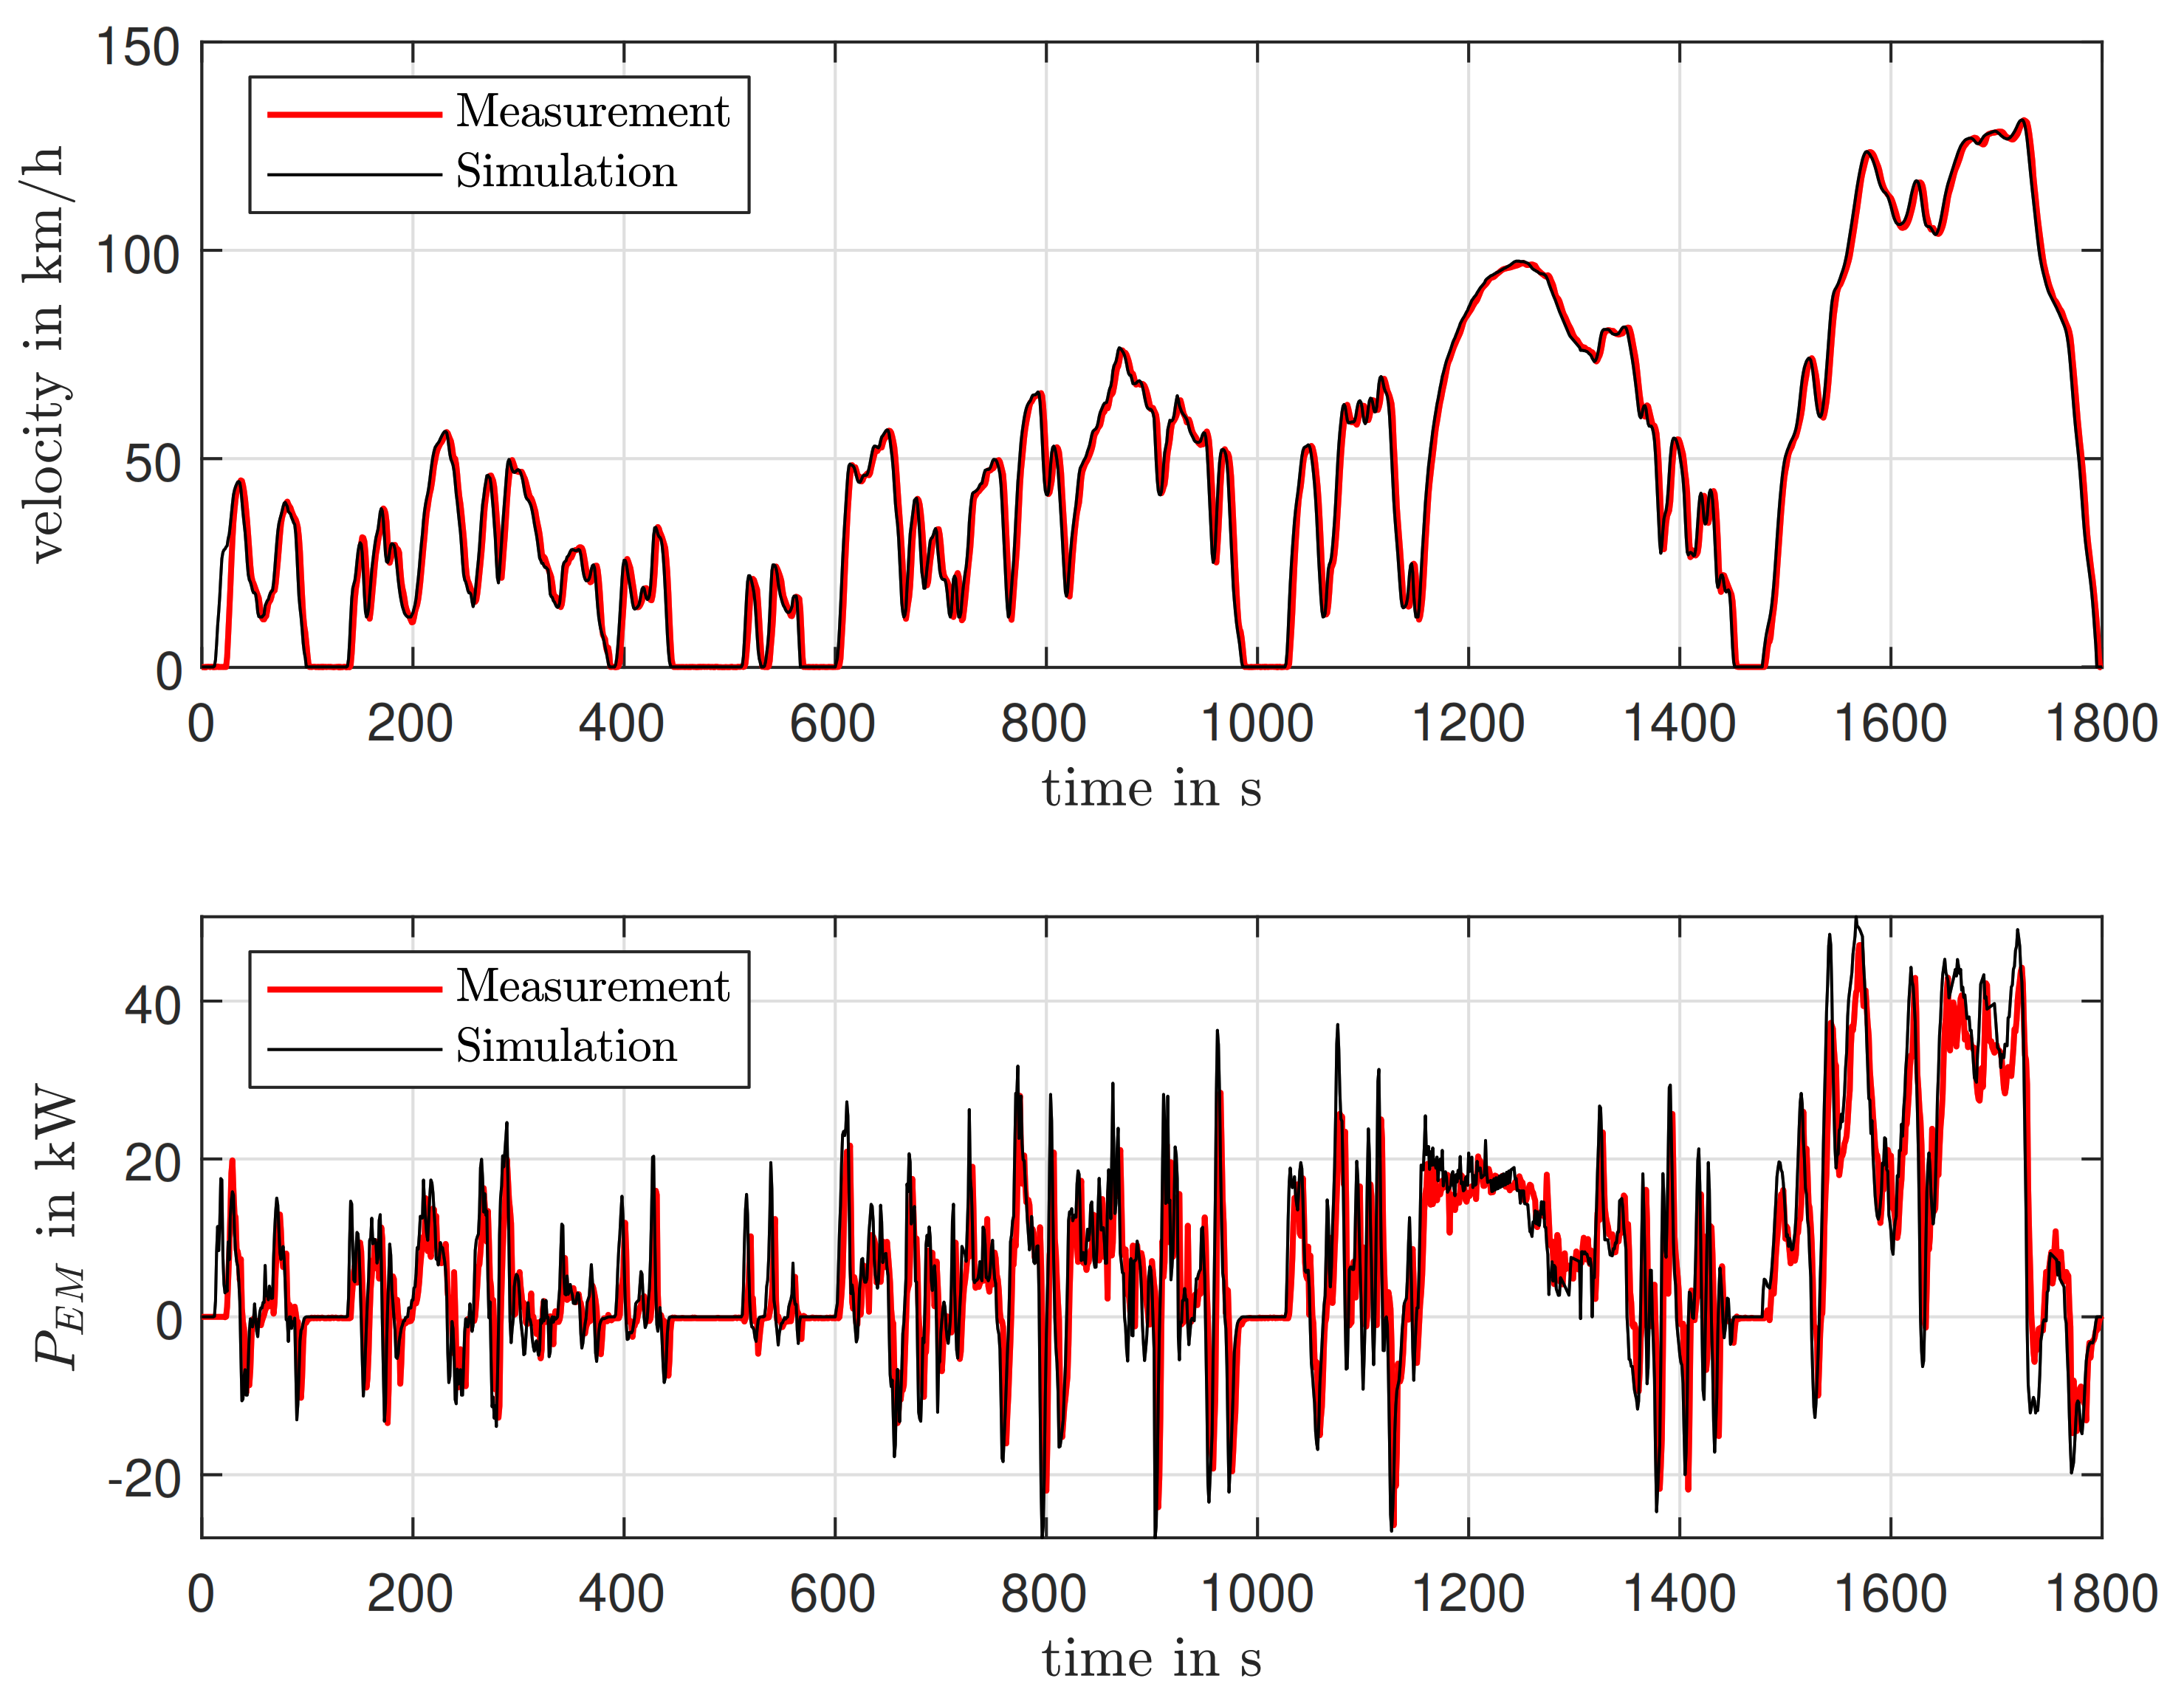
For the simulations in this study, the WLTC simulation model has been verified with WLTC measurements of the VW e-up (detailed description of the measurements in [4]). With the help of the parameters used from Table 3, the required power demand at the wheel for the WLTC is determined, see Equation (3). Using the required wheel power, the efficiency map of the drivetrain, see Figure 8, can be computed via the use of an evolutionary optimizer so that the objective function from Equation (5) is minimized. This function sets the median of the deviation of the calculated (see Equation (4)) and measured electric motor power and the deviation of the energy consumption from the measurement as well as from the simulation into the ratio of the cross-correlation of the measured and simulated electric motor power signals over time. A small cross-correlation results in a large objective function. Additionally, large deviations in the energy consumption or the motor power lead to a large objective function.
After optimization, the objective function has the value 0.606. The difference in energy consumption is 0.4 kWh, the median of the motor power deviation is 0.176 kW. Figure 8 is the result of this optimization. It shows the drivetrain efficiency map depending on the input speed and torque. The WLTC operating points resulting from the mechanical motor input power are entered in white in this plot, as already known from the previous efficiency maps.
Figure 9 shows the vehicle speed versus time as well as the engine power versus time. The average deviation between measurement and simulation is small for both quantities. At the beginning of the measurement, a deviation in the speed profile occurs, which is also noticeable in the power chart. Further deviations can be seen for motor power peaks between simulation and measurement. The quasi-static simulation cannot reproduce dynamic effects that occur, for example in power electronics or temperature increase in electric components, which can lead to deviations here.
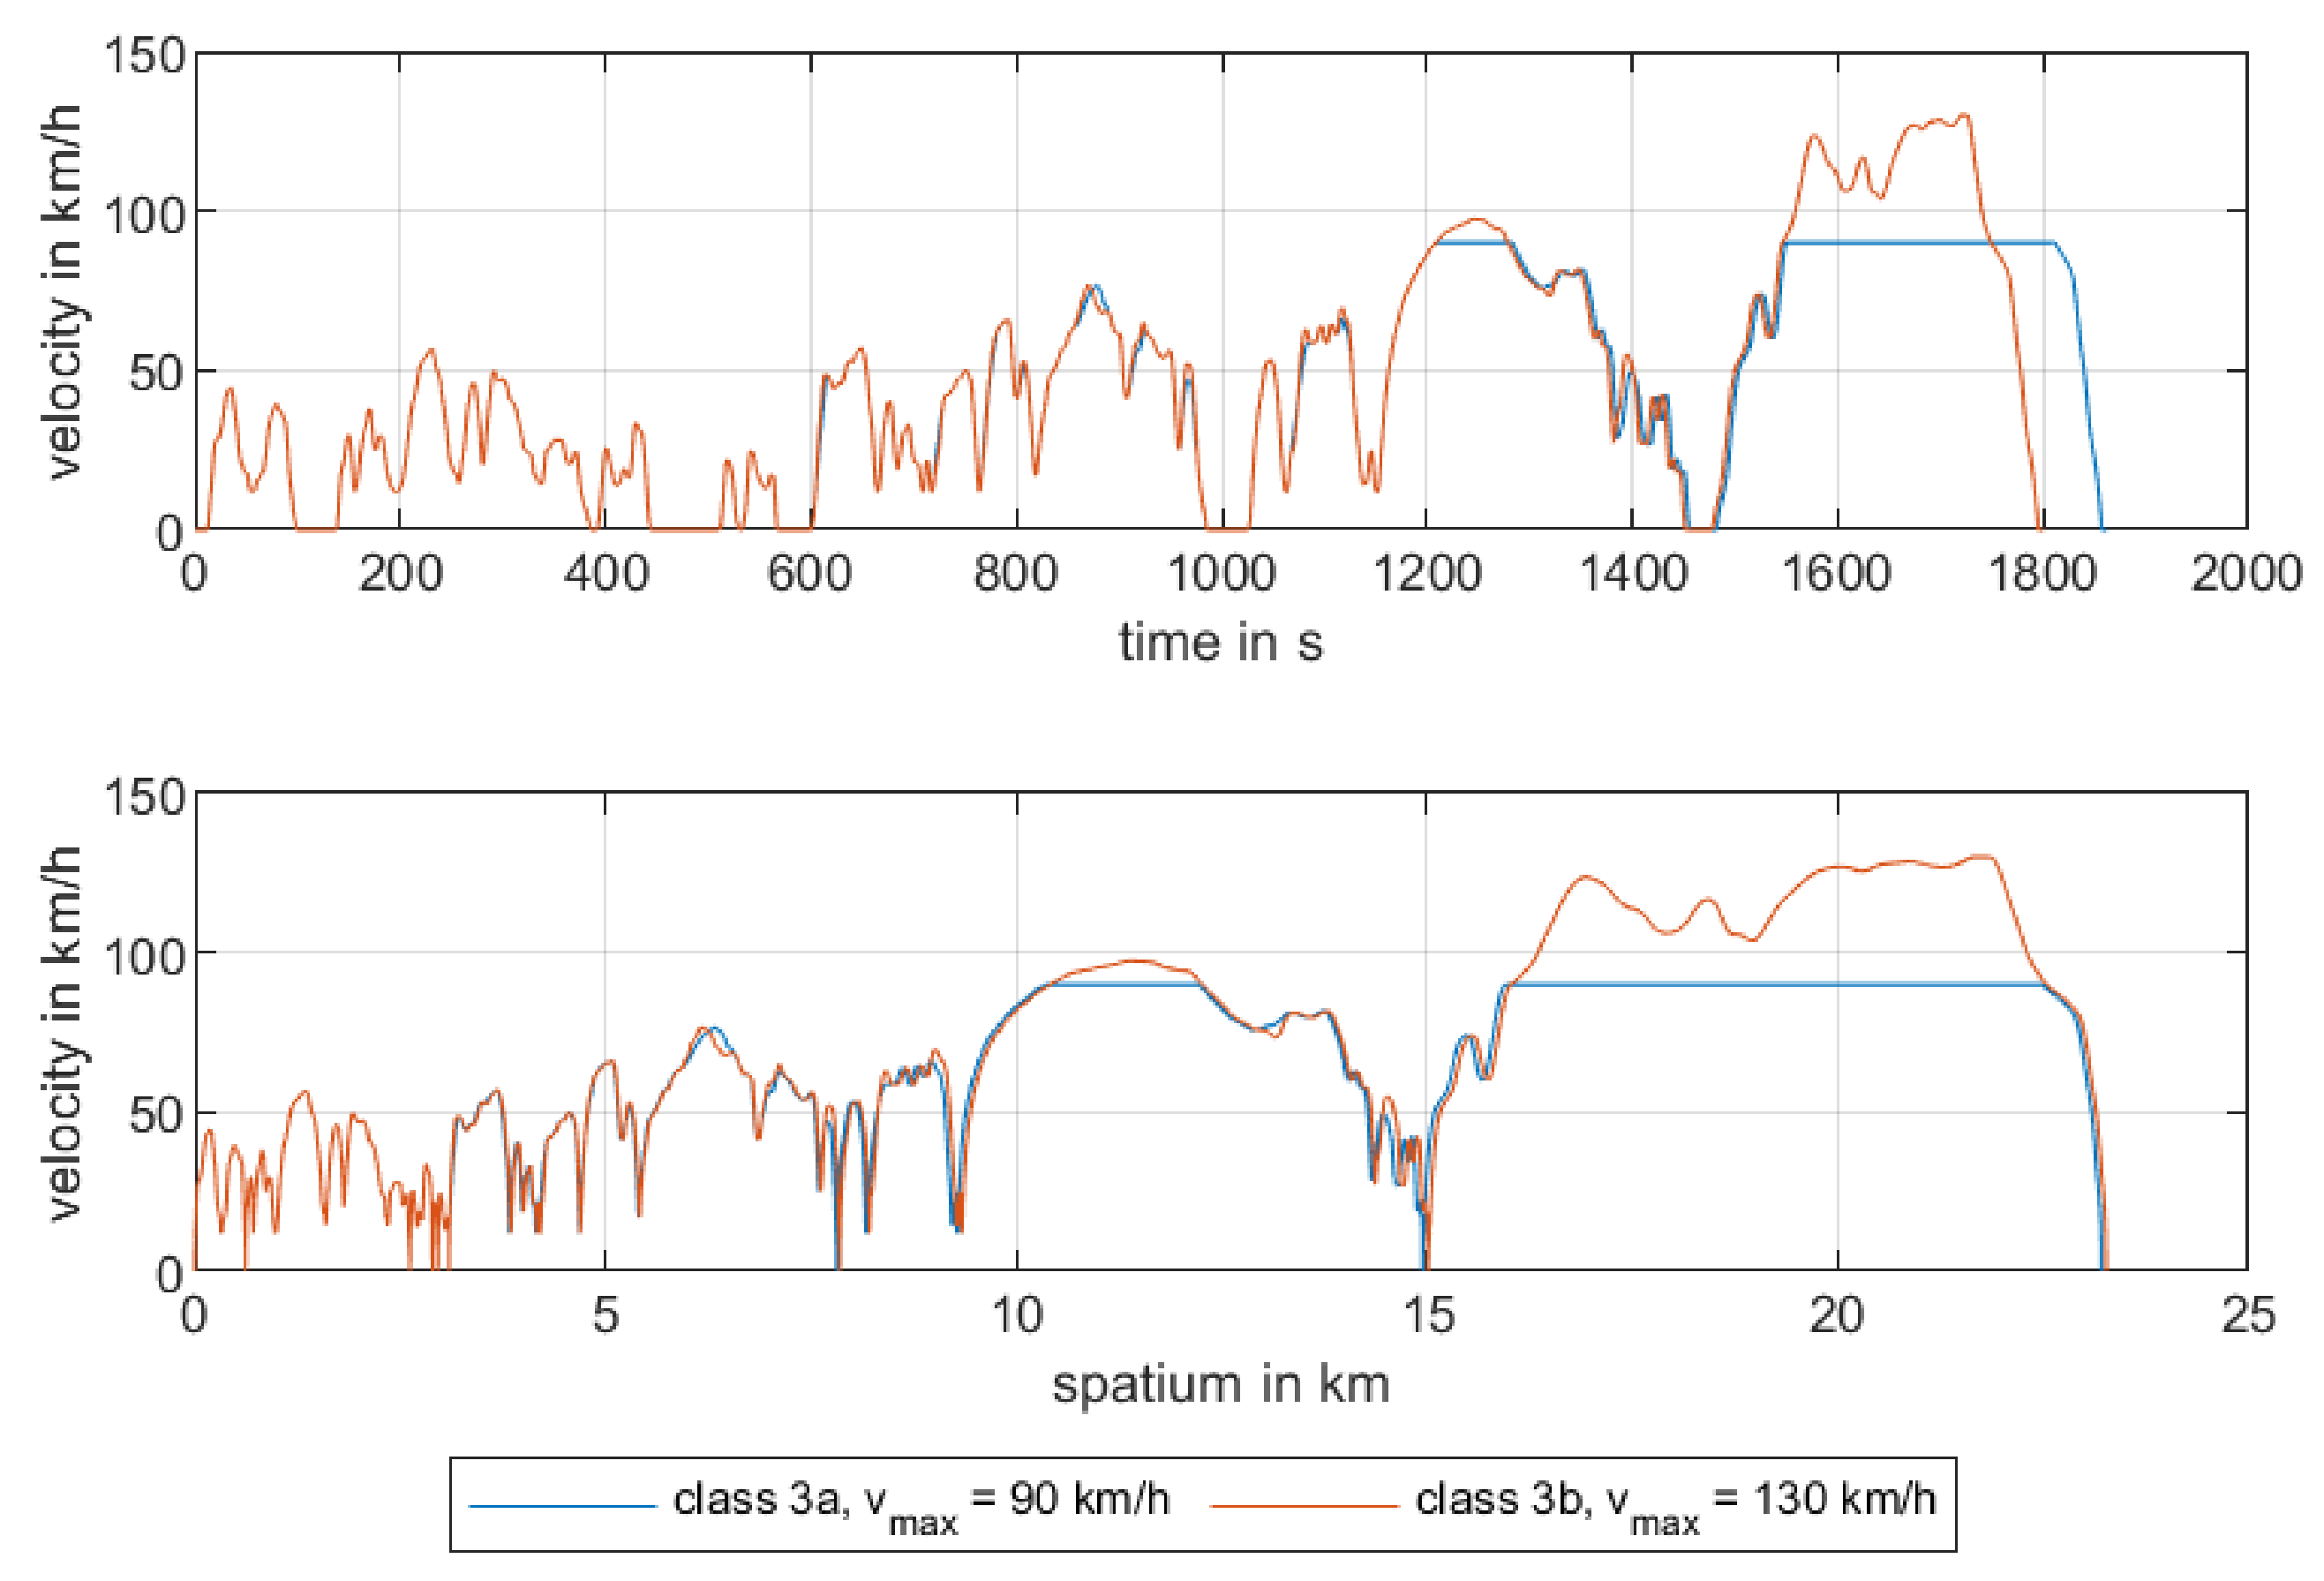
Vehicles that cannot drive at the maximum speed required by the corresponding WLTC class must pass adapted drive-cycles for their class. Here, the top speed is limited to 130 and 90 km/h respectively. In order to achieve the range required in the cycle for the respective class, the vehicle traveling at reduced speed must maintain this speed for an additional period. Figure 10 shows the adapted WLTC for class 3b vehicles with a top speed of 130 km/h and a top speed of 90 km/h for class 3a vehicles [14].
The calculation of the LCGHG is explained in the following. The data basis and the resulting calculation model are verified with the help of relevant literature [8,23].
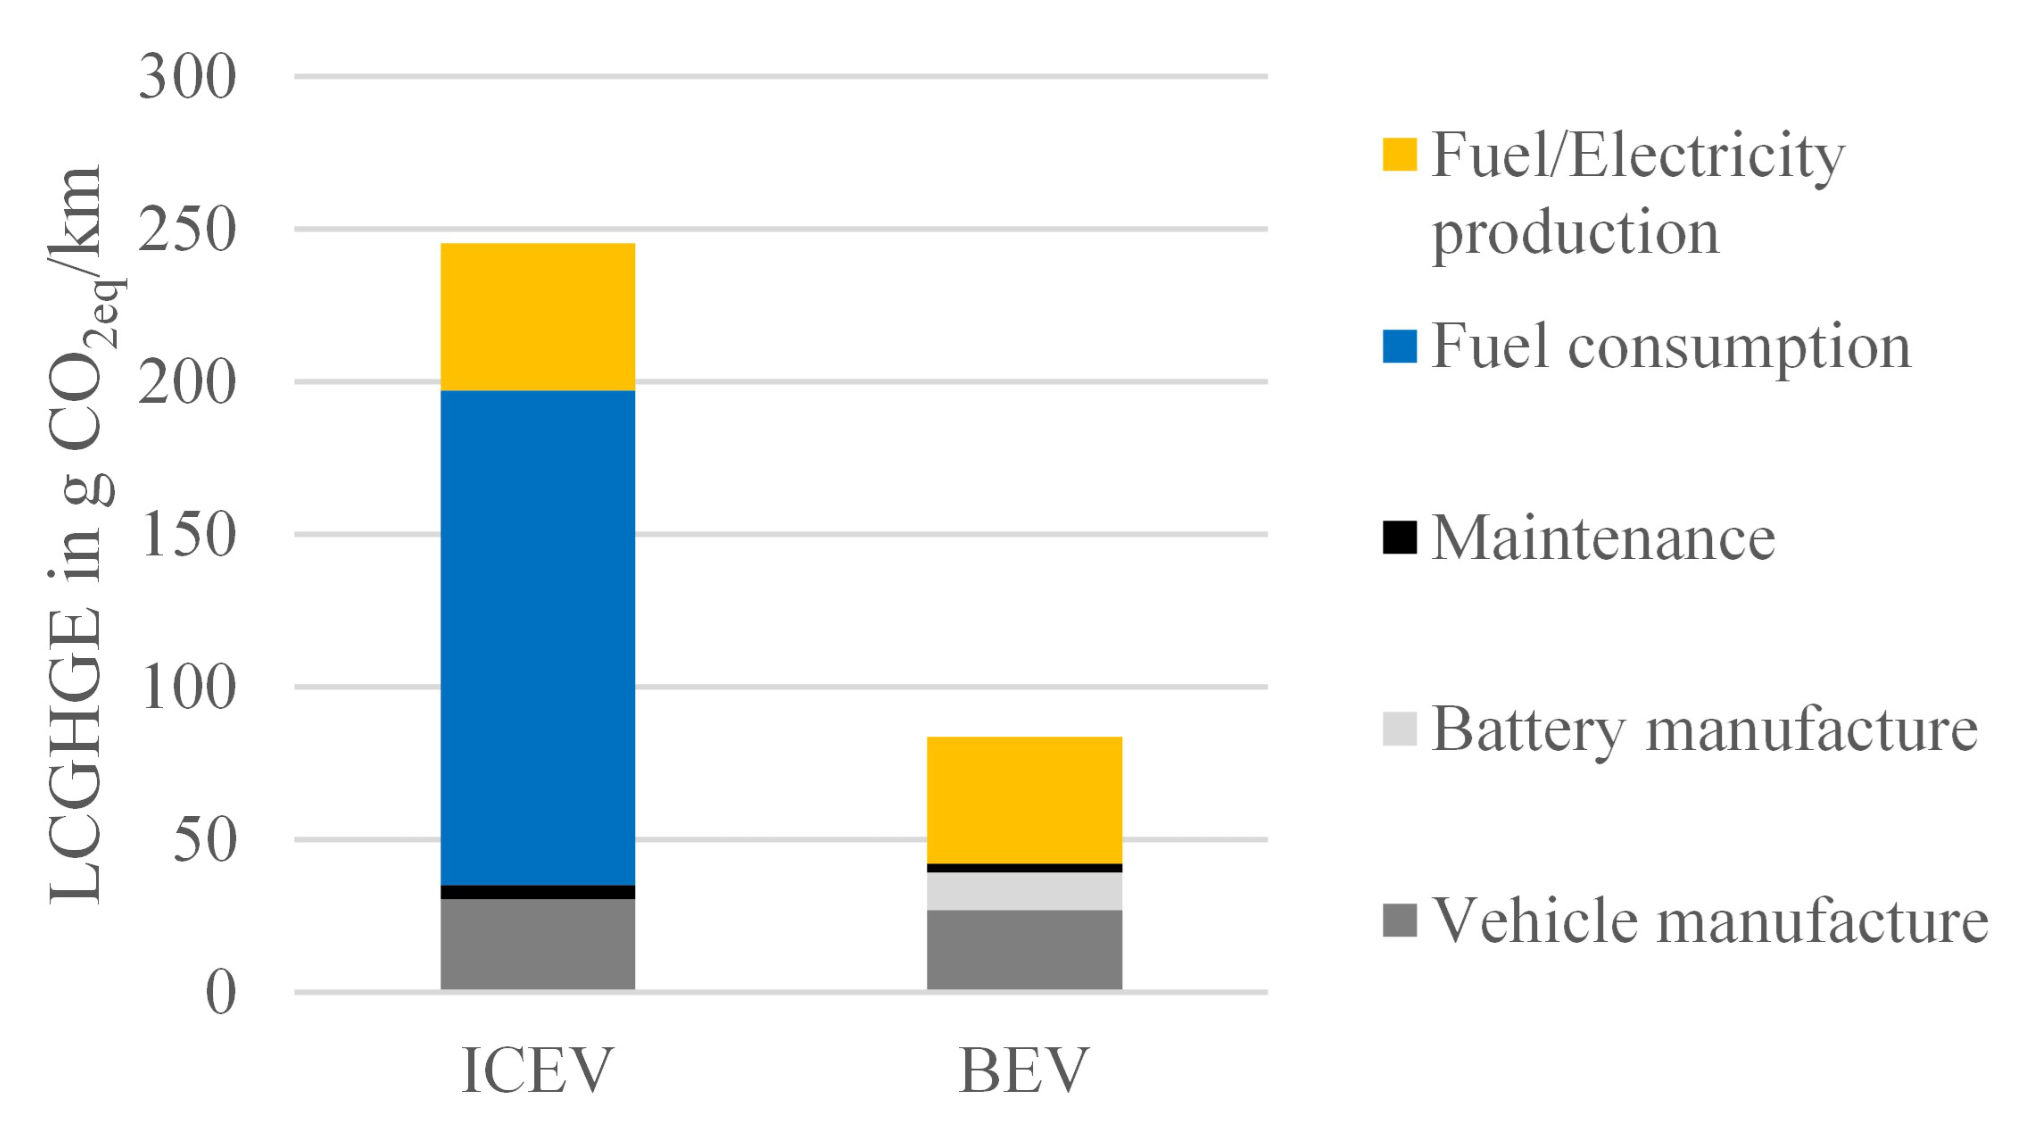
Figure 11 shows the LCGHG of an average internal combustion engine-driven vehicle (ICEV) and an average BEV from 2021 in the EU. The LCGHG data given in . The biggest LCGHG drivers are vehicle, battery and energy production. The emissions for vehicle service are relatively low for both vehicles. In the case of ICEVs, fuel consumption and fuel production account for a large share of LCGHG.
According to [23], the LCGHG for an average European BEV in 2016 is 5.12 . According to the German Federal Motor Transport Authority (“Kraftfahrtbundestamt”), the average mass of passenger cars is 1497 kg for this year. Assuming a total life-cycle mileage of 200,000 km, this results in a value of 25.6 . A linear scaling with the average vehicle mass in 2021 of 1642 kg results in a value of 28.08 . This approach assumes a constant material composition. In addition, LCGHG savings in production are not taken into account. It is assumed that this approach is justifiable for the mentioned five-year period. Figure 11 shows a value of about 27 for the BEV, which verifies the presented value with a small deviation. The following calculation model is used in this study to calculate the arising greenhouse gas emissions (GHG) of the vehicle production depending on the vehicle weight m and the battery weight :
Battery production in Europe is estimated at 60 as proposed in [8] and affirmed by studies in [23]. This results in Equation (7) where is the battery net capacity and is the GHG of the battery production.
The equation to calculate the GHG for energy production takes data from the German Federal Environment Agency (“Umweltbundesamt”) of the year 2021 into account. is the energy consumption simulated in the WLTC with a “best case” charging efficiency of 87.1% included, see [4].
Equation (9) shows how the overall LCGHG are calculated.
2.4. Results
The results of this study assume some boundary conditions. These are explained in the following at first. The results are then presented and interpreted.
The following variables are to be varied in this study. The simulated vehicles have WLTC ranges of 100 km, 250 km or 500 km. This affects the battery capacity and thus the total weight of the vehicle. The battery weight is calculated with the help of the battery capacity using Equation (10). The equation is based on published data from [24,25].
The drivetrain configuration is either an AD or a WHD. The maximum speed is varied without that the gear ratio of 8.163 is changed for the axle-drive configuration. The maximum speed limit affects the WLTC (see also Figure 10) and thus the energy consumption as well as the battery weight. All three simulated vehicles are simulated as BEV, also the hybrid vehicle VW XL1 is assumed to be a pure BEV vehicle. All vehicles must be able to pass the given WLTC with the requirements for acceleration and top speed with the given maximal motor power. The mass of the missing internal combustion engine of the VW XL1 vehicle is corrected with 80 kg.
Summary of the variation in the simulated data:
- vehicles: VW e-up, Micro Mobility Systems Microlino and VW XL1
- vehicle type: all vehicles are simulated as BEV
- WLTC-range: 100 km, 250 km or 500 km
- drivetrain configuration: AD or WHD
- top speed: 130 km/h or 90 km/h
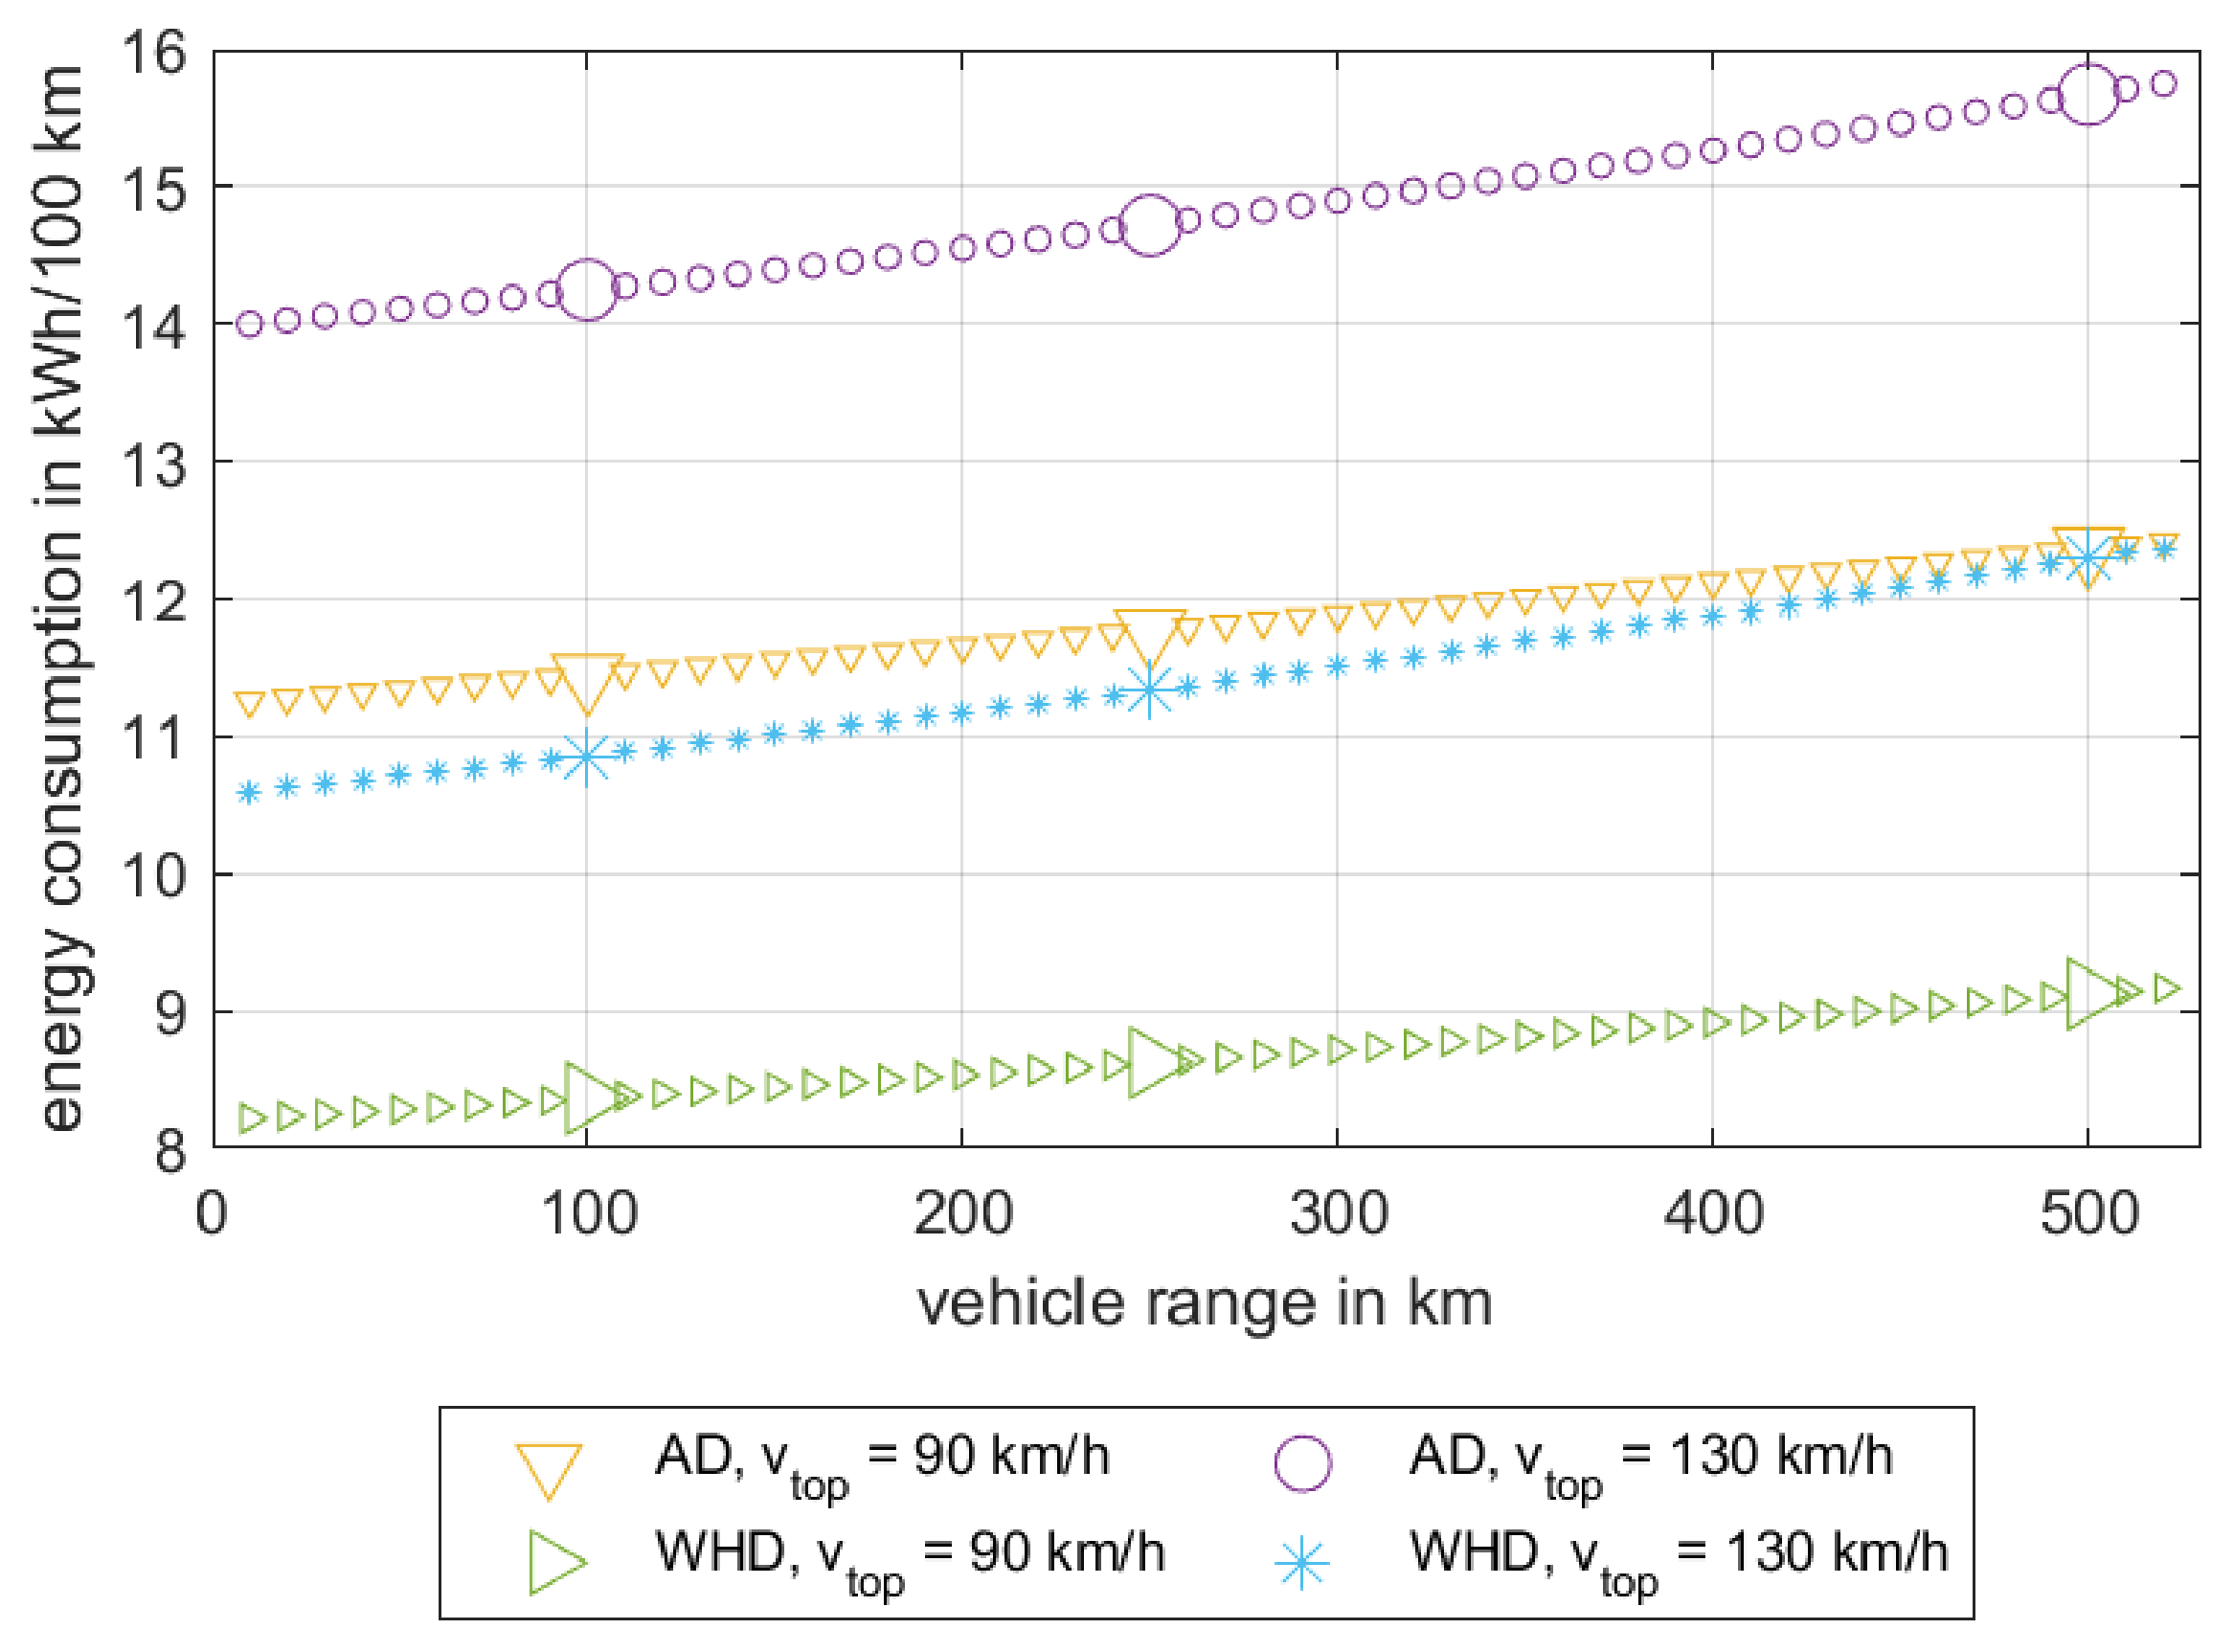
Figure 12 compares the energy consumption in kWh/100 km for a VW e-up depending on the achievable range for the two predefined top speeds and the two specified drives. In this figure, as in the following Figure 13 and Figure 14, the markers represent the results at 100, 250 and 500 km. The smaller markers show the results in 10 km steps for clarification, but these are not considered in the final analysis.
It can be seen that the energy consumption increases quasi-linearly with the possible range of the vehicle, independent of the drive and top speed. With both drives, consumption per 100 km at a top speed of 90 km/h is lower than at a top speed of 130 km/h. In the standard e-up, the WHD consumes less than the AD at both top speeds considered. The consumption of an axle drive with a maximum speed of 130 km/h is almost twice as high as that of a wheel hub drive with a maximum speed of 90 km/h. With an e-up that has a wheel hub drive installed and that can drive up to 130 km/h, consumption values are similar to those of an e-up that is limited to a top speed of 90 km/h and has an AD installed.
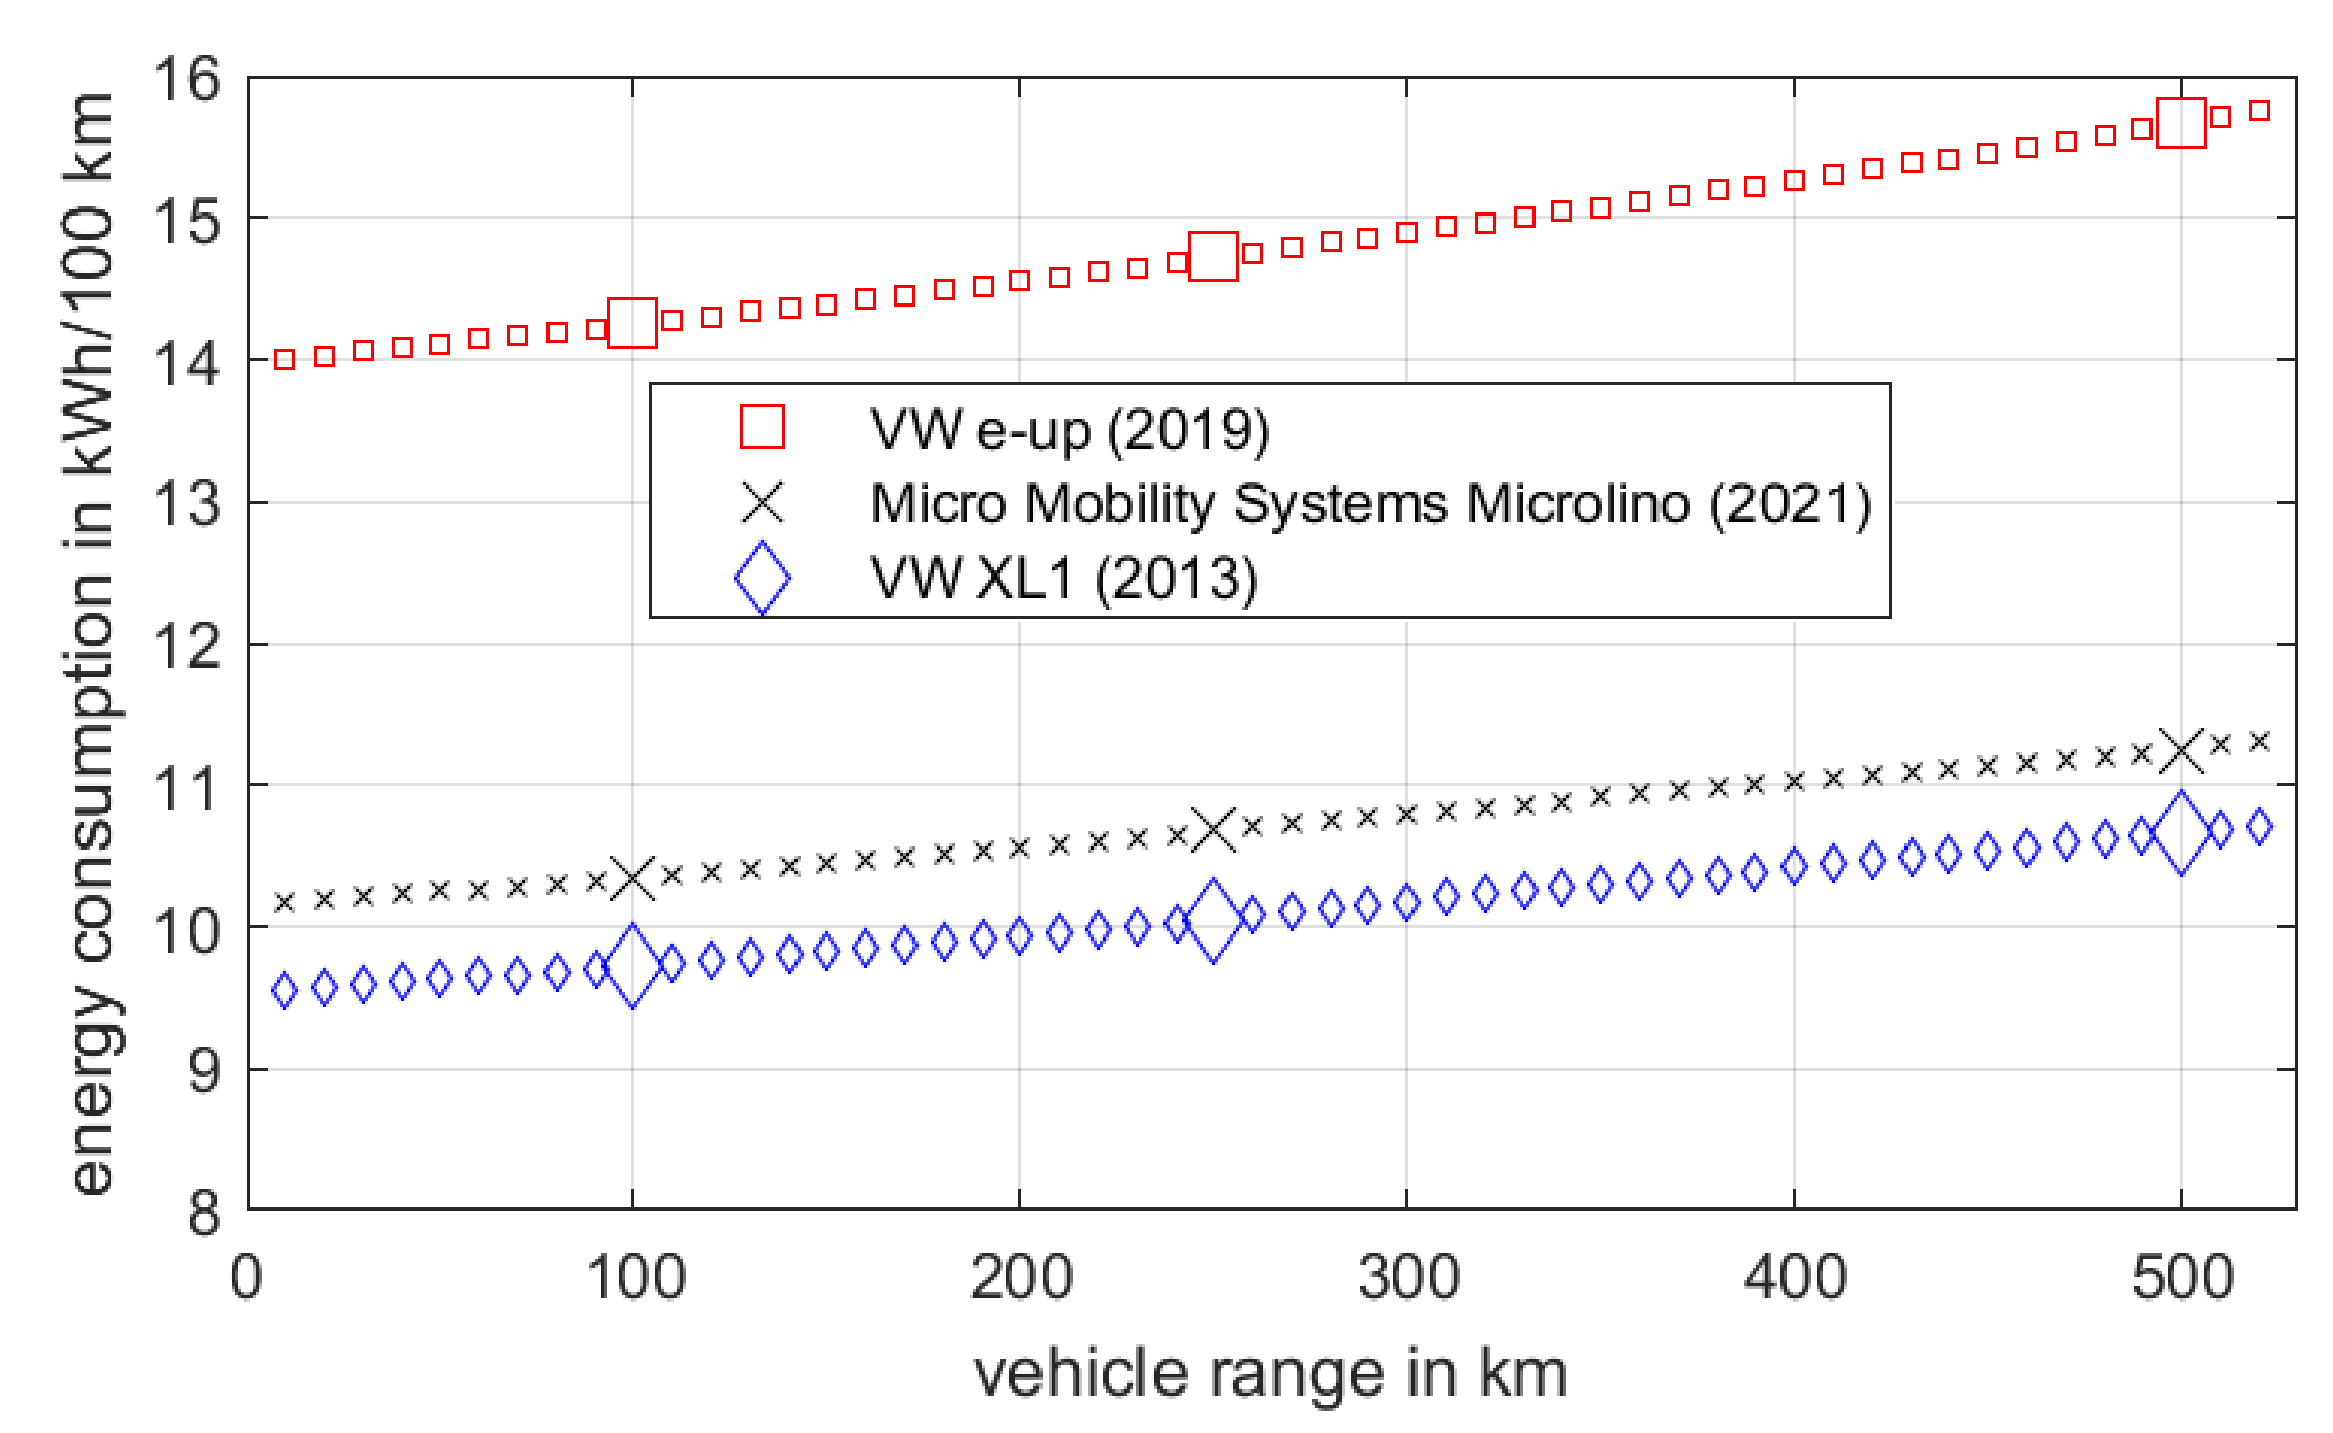
Figure 13 compares the energy consumption of the three vehicles considered with different maximum ranges when using an AD and a top speed of 130 km/h. The energy consumption has already been shown in Figure 12 for the e-up. With the other two vehicles, the increase in consumption is also quasi-linear with an increasing range. However, consumption per 100 km is lower for both vehicles, the Microlino and the XL1. Comparing the consumption of the three vehicles at a maximum range of 500 km, shows that the energy consumption of an e-up is 15.7 kWh/100 km, which is nearly 1.4 times as high as the consumption of a Microlino, which consumes 11.2 kWh/100 km and even nearly 1.5 times as high as the XL1, which requires 10.7 kWh/100 km.
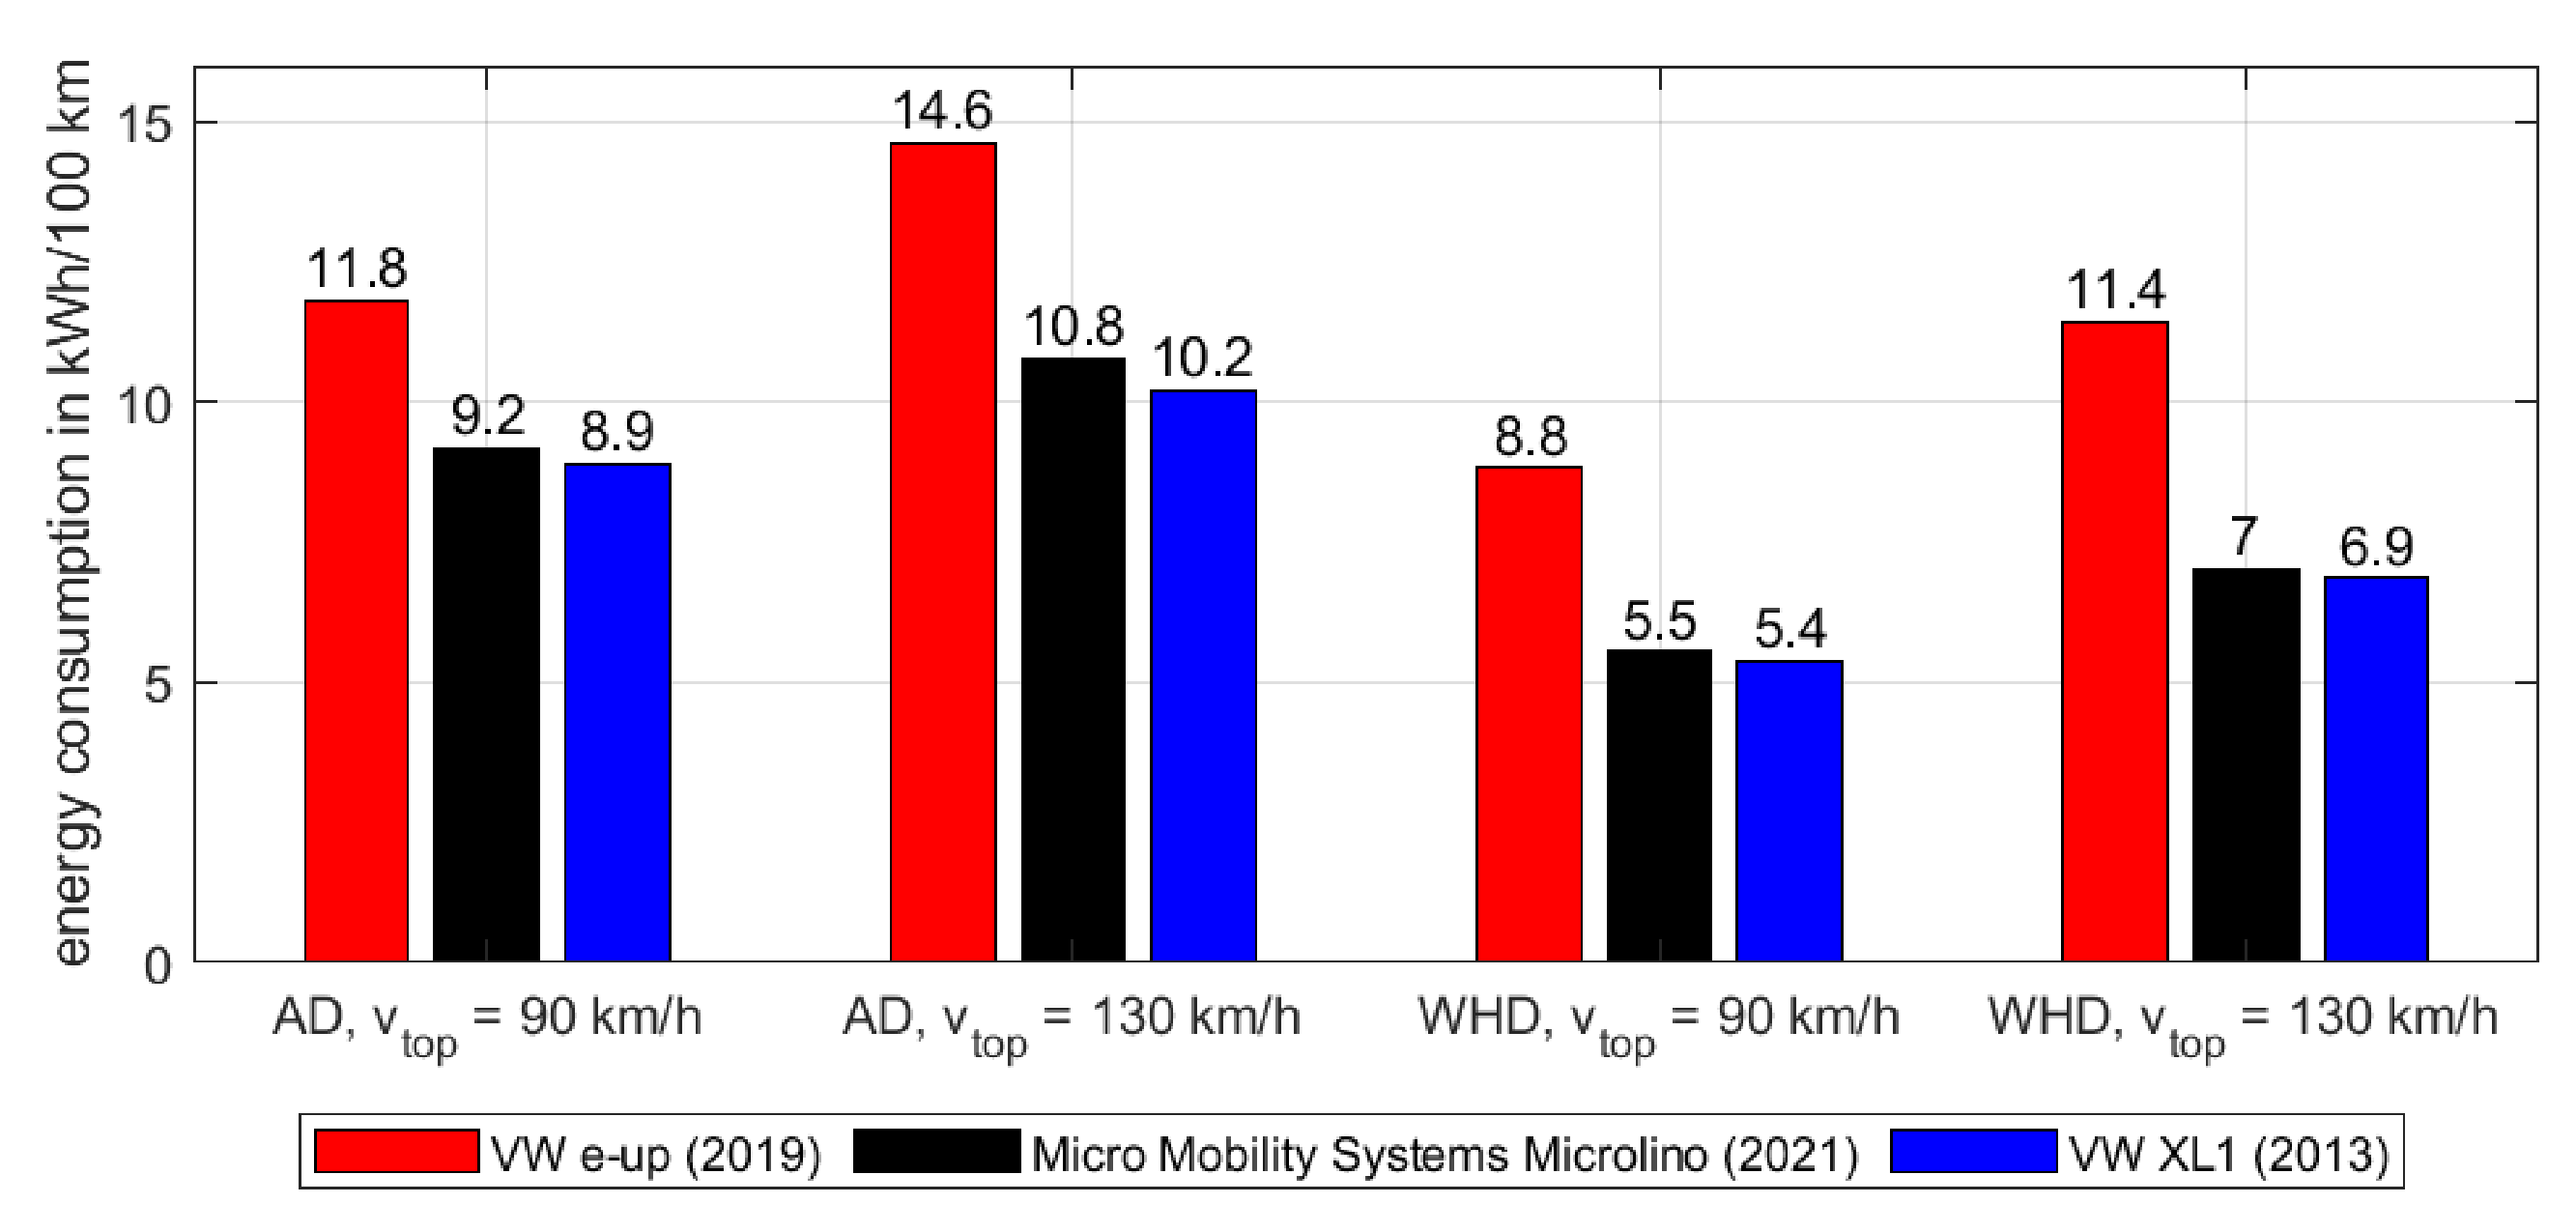
Figure 15 shows the consumption of the three vehicles with a battery capacity of 32 kWh, the e-up’s standard battery capacity. Looking at the consumption in kWh/100 km in relation to the battery capacity, it is noticeable that the e-up has the highest consumption for all combinations of top speeds and drives, whereas the energy consumption for Microlino and XL1 is very similar in the individual considerations, i.e., selected drive and top speed. The greatest deviation in consumption between the Microlino and XL1, with a battery capacity of 32 kWh, is achieved with the AD at a top speed of 130 km/h and is less than 5%. Comparing the consumption of the Microlino and XL1 with the consumption of the e-up, shows that the e-up with the AD has a consumption that is 1.3 to 1.4 times as high and with the WHD 1.6 to 1.7 times as high as the energy consumption of the Microlino and the XL1.
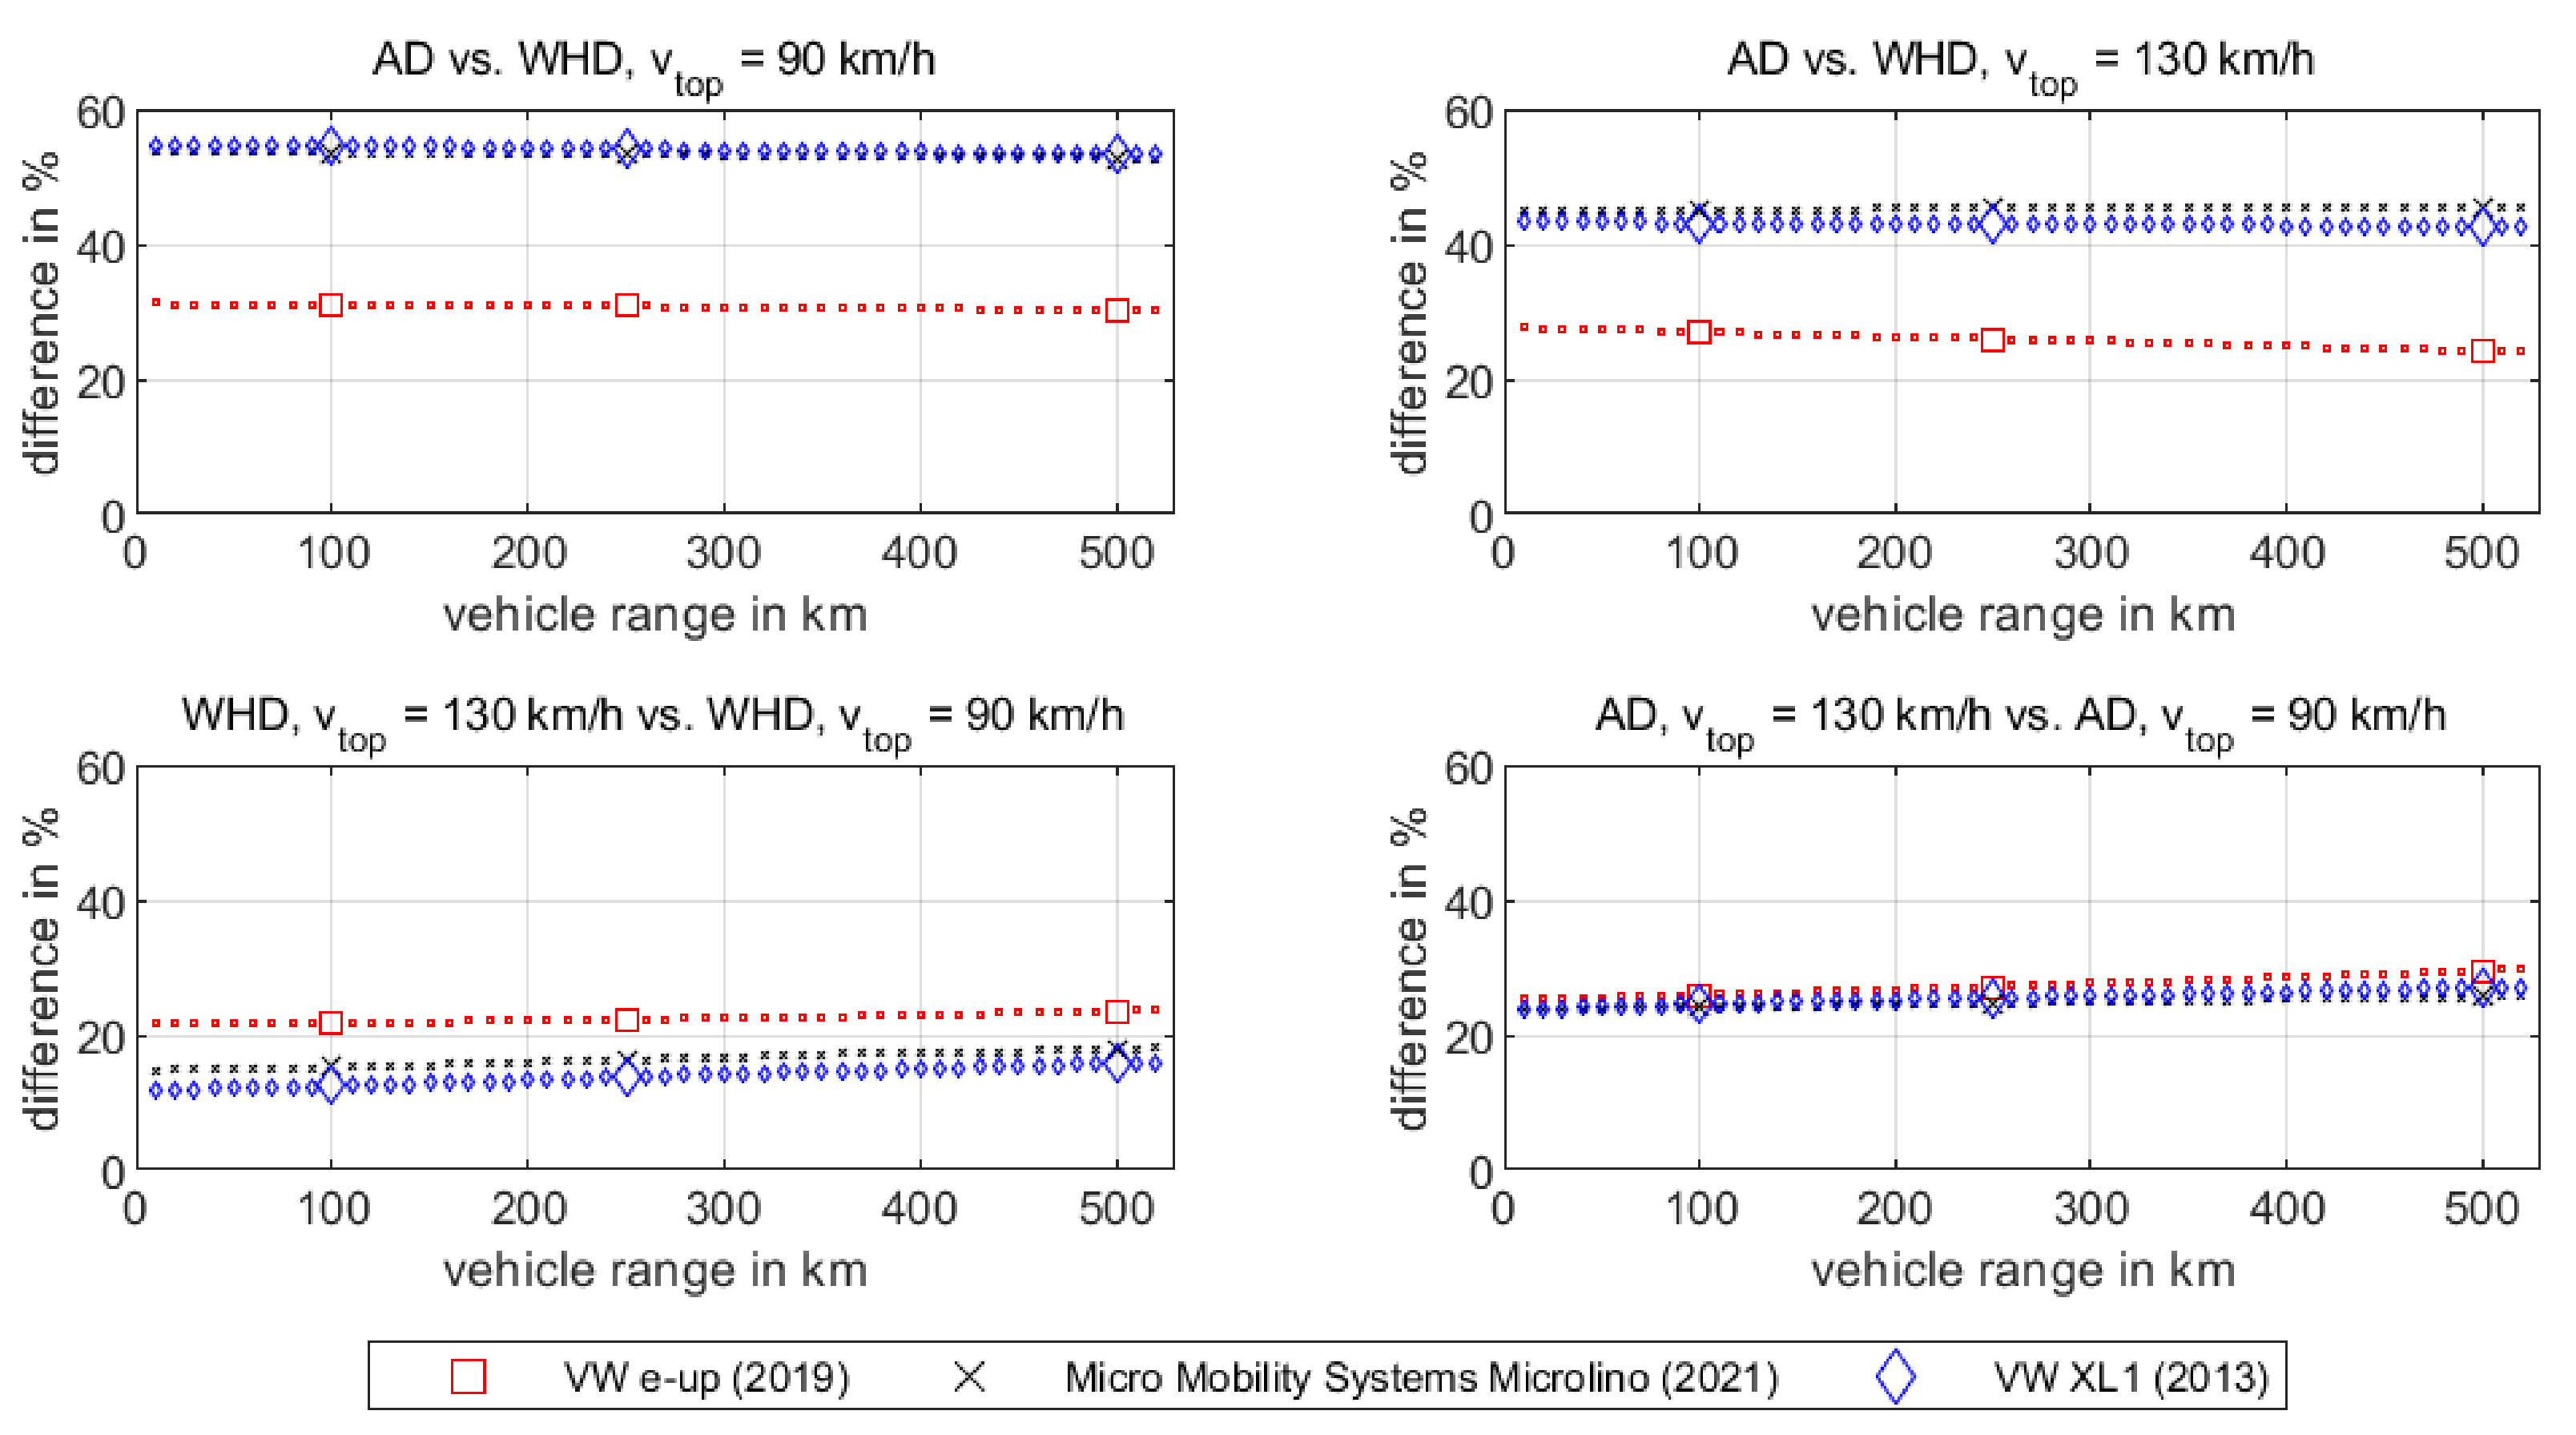
Figure 14 shows the change in consumption of the three vehicles over the possible range. Illustrated is the change in consumption between AD and WHD at a maximum speed of 90 km/h (top left) and a maximum speed of 130 km/h (top right). The graph below on the left shows the change in consumption between the two possible maximum speeds when using a wheel hub drive, and on the right below the change between the two maximum speeds when using axle drive. The percentage difference is calculated here as the absolute value of the change in value divided by the average times 100.
In all four graphs, the changes are relatively constant over the range. When comparing AD and WHD, the difference decreases slightly with increasing range; if only one drive is considered at different speeds, the difference increases with increasing range. The largest differences arise when AD and WHD are compared with each other. As illustrated in the efficiency maps (Figure 6 and Figure 7) the operating points are better aligned with high efficiencies for the WHD, which also comes from that the maximal power is lower for this variant.
At a top speed of 90 km/h, the difference between the two drives with a maximum range of 250 km is 31% for the e-up, 53% for the Microlino and 54% for the XL1. The smallest difference occurs when comparing the consumption for the two maximum speeds when installing the wheel hub drive: The relative difference and thus savings between 130 km/h and 90 km/h is greatest for the e-up at 22% for a maximum range of 250 km. When reducing the maximum speed, Microlino and XL1 have fewer savings potential with the wheel drive, namely 16 and 13%. Viewed in absolute terms, the Microlino and XL1 are always more economical than the e-up, as shown in Figure 15 for a battery capacity of 32 kW. Figure 15 also shows that a wheel hub drive is more economical than an axle drive in all cases. The same figure also shows that it is always more economical to drive at a top speed of 90 km/h than at a top speed of 130 km/h.
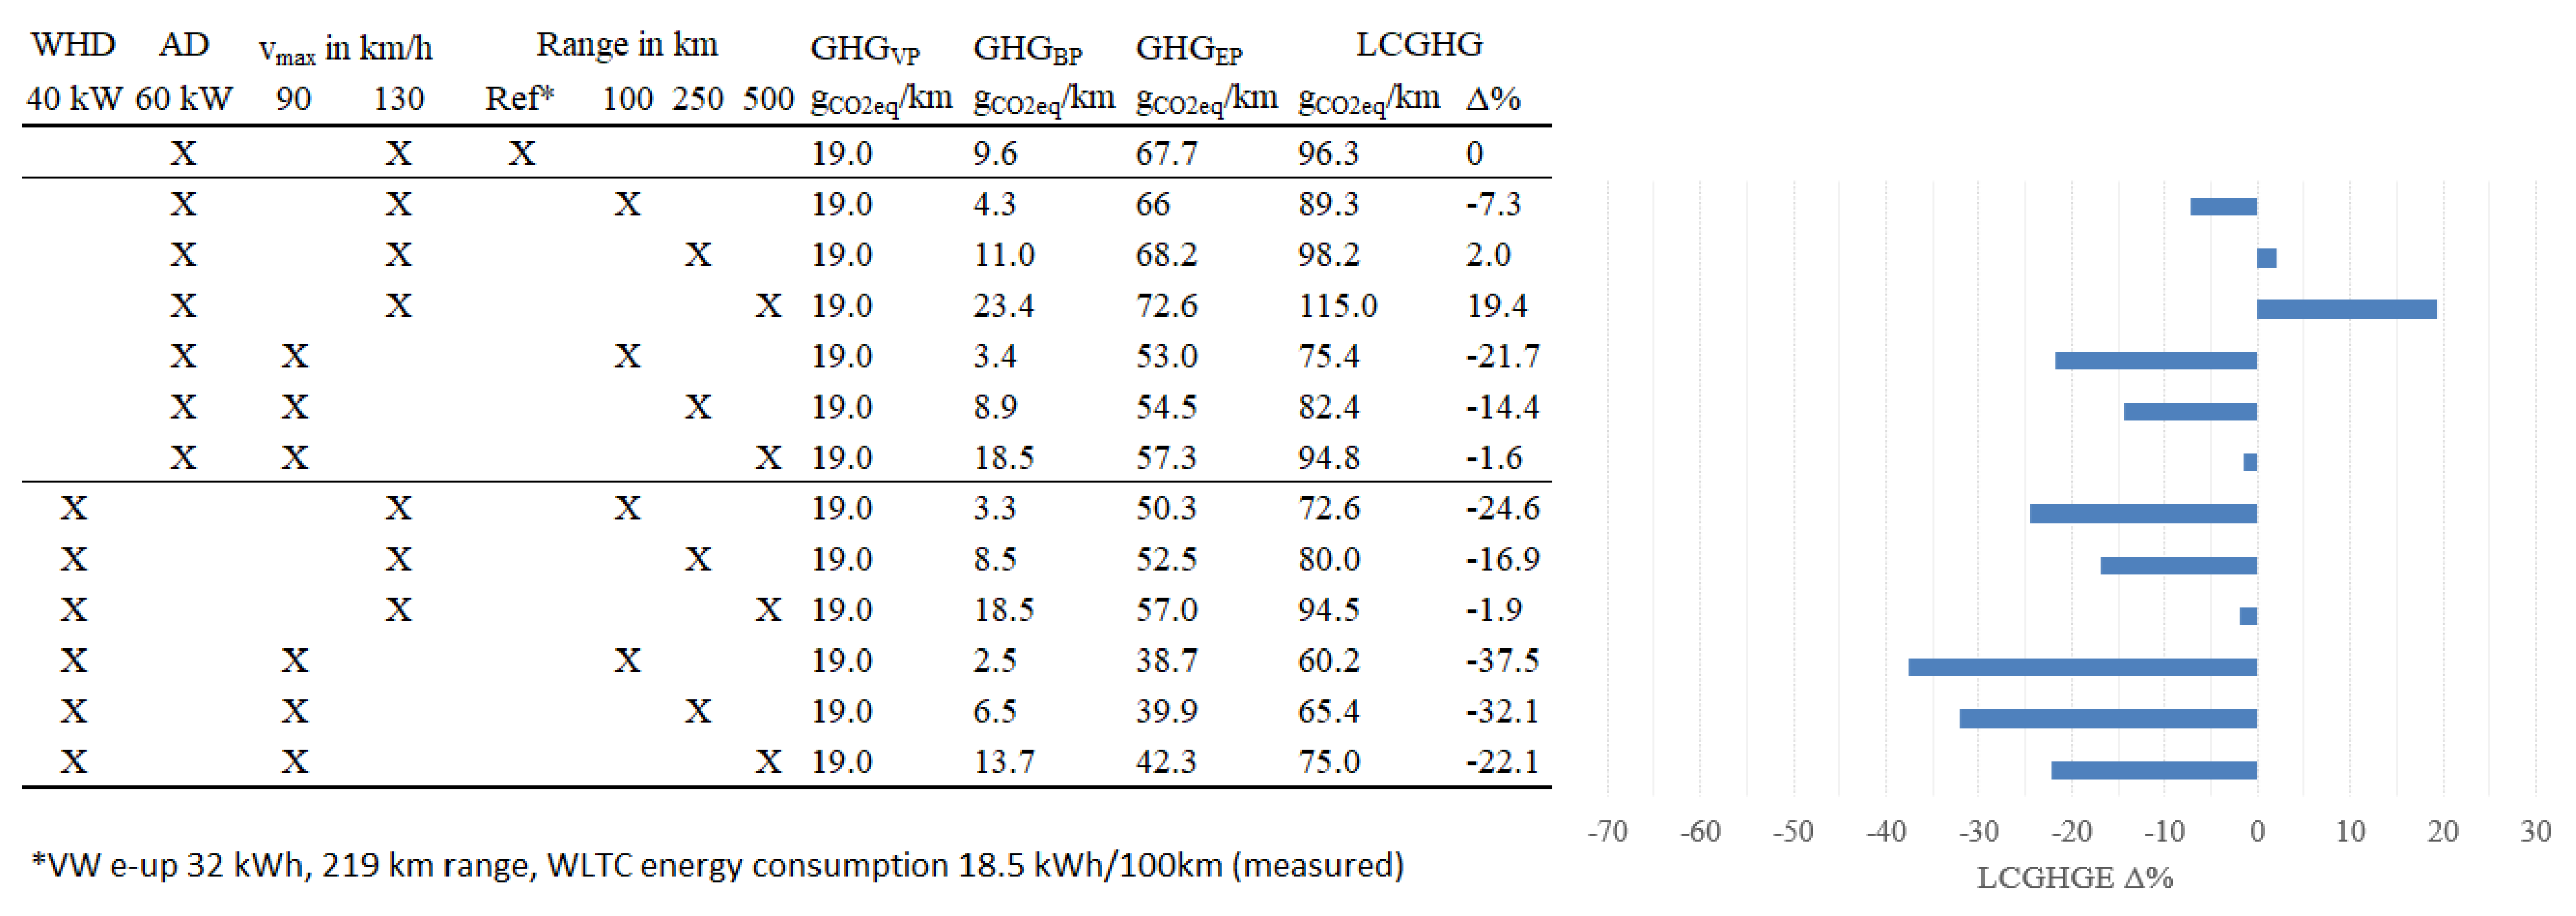
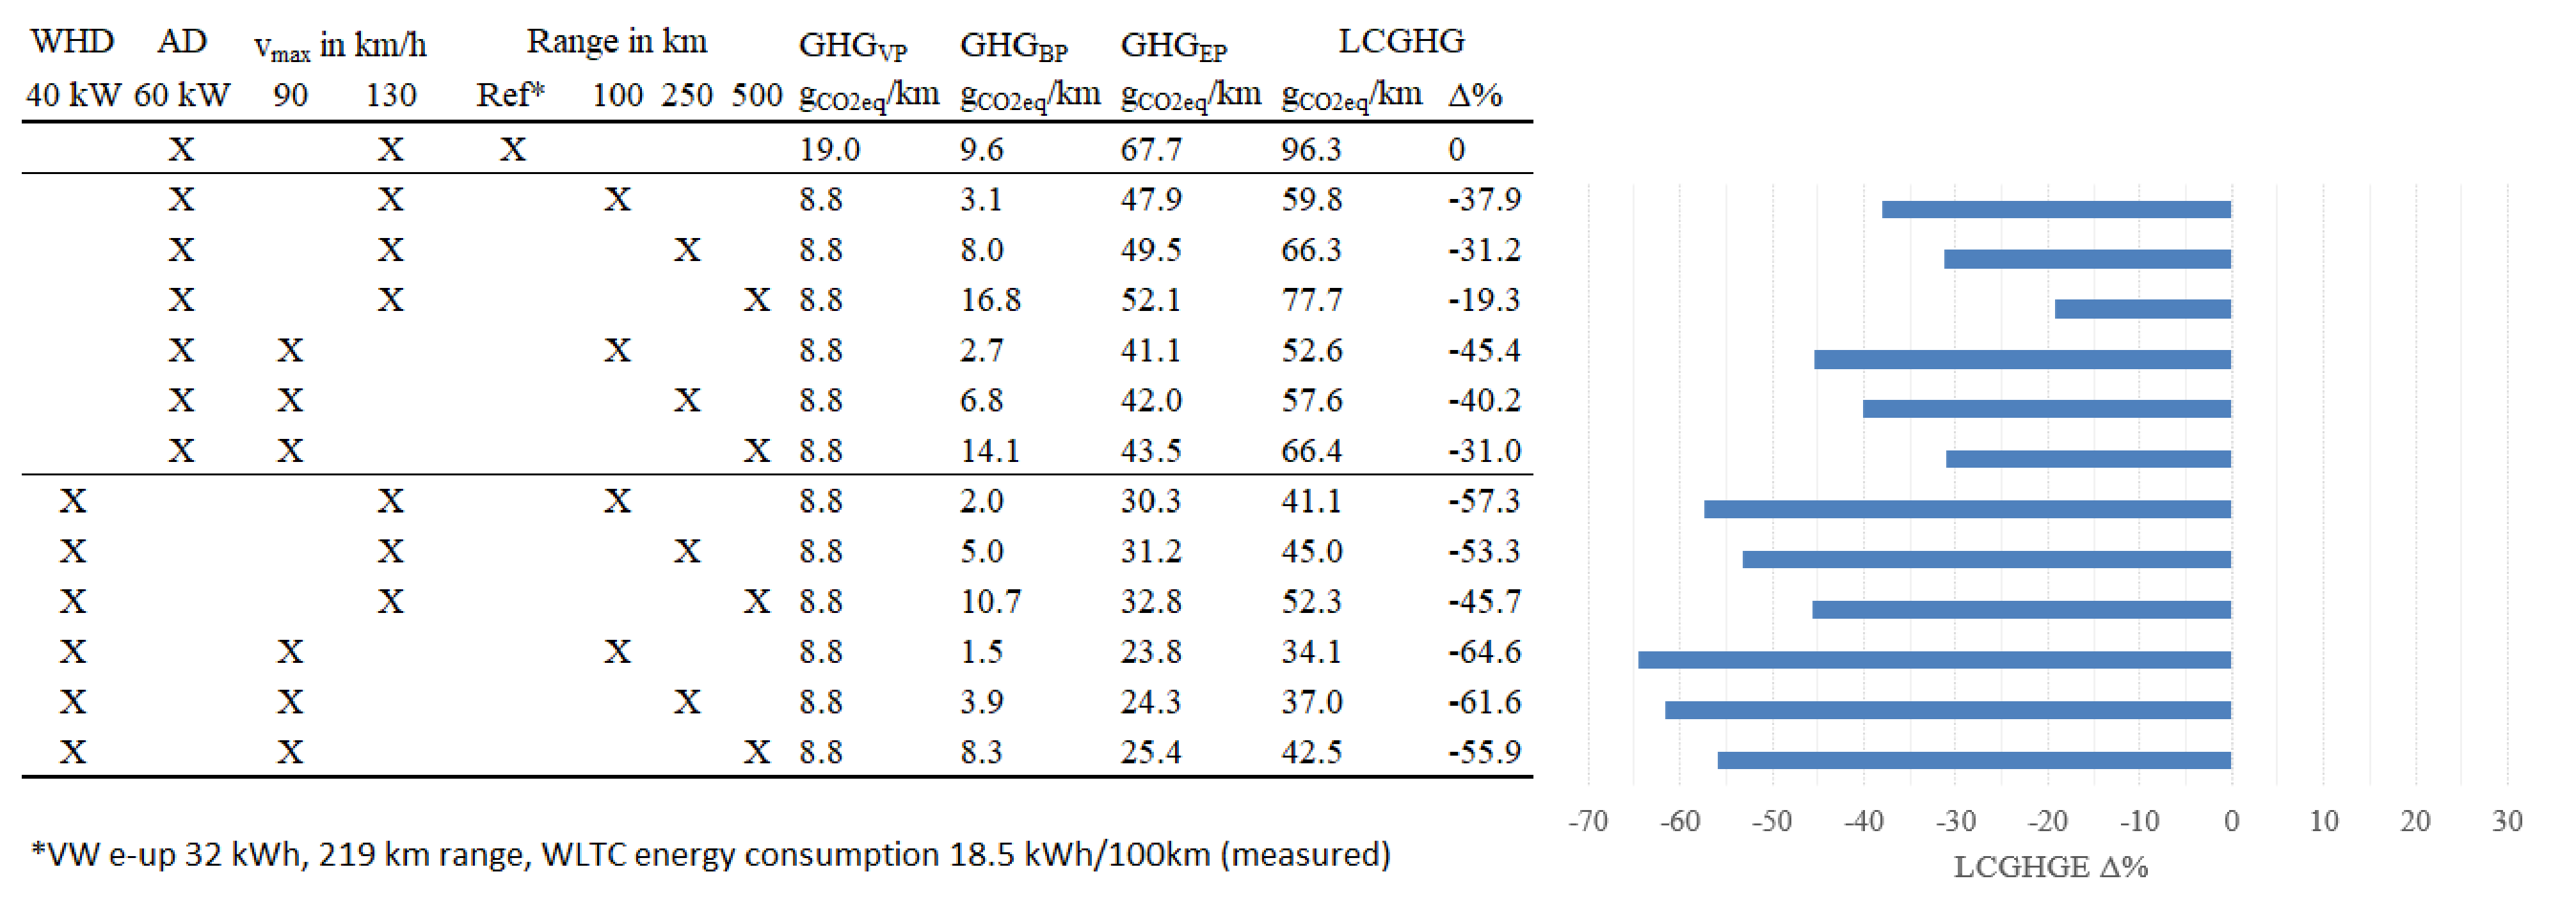
Figure 16, Figure 17 and Figure 18 show the results of the LCGHG simulations. The first data row shows the reference (labeled as Ref*) vehicle VW e-up with a 32 kWh battery capacity and a 60 kW AD. % shows the LCGHG difference between all other variants and the reference in %. The graphs on the right illustrate this deviation of LCGHG from the reference. The WHD variant has 20 kW less maximal power than the AD variants. The variant with WHD and a short range of 100 km has the highest potential to safe LCGHG for all vehicles. The Micro Mobility Microlino shows the highest potential to safe LCGHG with only 34.1 because it represents the most radical small car concept and is very lightweight. In comparison, the LCGHG of the e-up variant with 130 km/h top speed, AD and 500 km range are highest at 115 . This is 19.4% more emissions than the reference e-up emissions, and it is almost 3.4 times higher than the lowest-emission Microlino variant. The XL1 has slightly less potential than the Microlino with a minimum of 37.6 . The e-up emits at least 60.2 , the reference presents 96.3 . The absolute LCGHGs of the reference standard e-up are a little higher than the emissions of the presented average BEV in [8] based on the manufacturer’s specification (≈84 ). This is because the energy consumption of the e-up itself is based on a measured value of a series car and exceeds the manufacturer’s specifications [4]. Still, the ICEV presented in Figure 11 emits 2.5 times more than the simulated reference VW e-up. If Figure 16, Figure 17 and Figure 18 are compared in general, it must be stated that all variants of the Microlino and the XL1 are performing better than the VW e-up reference.
All e-up WHD simulations are borderline with regard to the required maximum power in the WLTC. This can also be seen for the reference variant of the e-up from Figure 7 at the white operating points. Some operating points are already at the level of maximum power. Accordingly, variants with higher battery capacity (250 km and 500 km) will suffer performance losses. In the e-up 500 km WHD variant, 27 calculation steps (27 s) exceed the maximum electric motor power .This is the variant with the largest error. The variant with 250 km range has an error of 13 calculation steps (13 s).
2.5. Discussion of Results
This subsection also discusses the effects if the presented small vehicles (Microlino, XL1) are not compared to another small vehicle (VW e-up). Instead, the results are compared to a state of the art SUV.
Based on a real-world consumption of 26 kWh/100 km, a Tesla Model X with the present simulation approach comes to 192 , which is already in the range of an average internal combustion engine-powered passenger cars (see Figure 11). The LCGHG are almost 5.4 times higher than the Microlino 90 km/h WHD variant.
This shows clearly that the data basis used for calculations is of immense importance for the evaluation of the LCGHG potential of battery electric mobility. If the aim is to show the potential of new technology in order to consciously steer developments in a sustainable direction, average vehicles on the market are currently not a suitable instrument. Furthermore, this SUV value and the share of SUVs sold also show that sustainable vehicles are not yet a development focus today. This is fueled, among other things, by the fact that BEVs today are given a flat 0 under the Worldwide Harmonized Light Vehicles Test Procedure, rather than the actual LCGHG.
Small vehicle concepts like all the small vehicles presented in this study can make a significant contribution to climate protection and thus to sustainability. In the case of the Microlino, emissions can be reduced by up to 85% today compared to an average ICEV. However, the driver has to accept a very small vehicle with a range of 100 km and a system power of 40 kW. Whether a Microlino vehicle variant up to 130 km/h with a range of 500 km can be realized cannot be clarified in this study. Such a vehicle concept still has an LCGHG value of only 56.8 , which is still 76% lower than the average ICEV presented. Overall, all WHD variants emit less than the AD variants. Due to the increased unsprung masses and a reduced system output of 20 kW, the driver has to accept not insignificant reductions in comfort. Whether the average driver is willing to accept those limitations is not focused on this study.
2.6. Reliability and Limitations
This chapter describes the simulations and calculations performed in terms of their limitations and accuracy.
The LCGHG results and the societal consequences in the following chapters are based on linearized LCGHG models and lose validity in the case of nonlinear correlations, which are to be expected in particular for very large vehicles or special vehicles, e.g., racing cars. There, for example, lightweight components are often used, which influence the LCGHG of vehicle production. The powertrain efficiency map was derived from measurements of the VW e-up, see Figure 8. This includes all losses occurring in addition to the e-machine and the power electronics. The influence of the gearbox or tires is therefore held constant in the model. There is no physical tire or transmission model included.
The quality of the simulation is adapted to the used driving cycles and the existing database. Detailed WLTC measurements and a real vehicle exist for the e-up. For this vehicle, a complex simulation in CARSIM or CarMaker would be possible. These simulation programs take into account the behavior of the driver, the vehicle kinematics, different powertrain variants as physical models and other detailed physical models such as dynamic nonlinear tire models. In the context of the present study, however, other vehicles (XL1 and Microlino) are investigated for which only basic data, such as values and vehicle masses, are available. In order to prevent major errors in the simulation caused by incorrectly estimated data, the approach of a simulation model as simple as possible was chosen. The non-real time simulation model is optimized for BEVs. Because only BEVs were considered in this study, no additional energy management had to be simulated, which would have been the case with simulating HEVs and what was examined in [26]. In the case of the e-up, this model was verified with measurements and provides excellent correlation with respect to the variables described in Section 2.2, Equation (5). This is due to the low dynamics, lack of cornering and driving without a gradient in the WLTC. Thus, a comparison of the simple simulation approach with simulation results from the CarMaker software in previous studies proved only minor differences in the WLTC.
3. Sustainability and the Importance of Utility in Product Development
In terms of sustainability, any development process can be clearly characterized according to its overall carbon footprint, its societal consequences or any other measurable indicator. What is often overlooked in this approach is the fact that any product does not only cost money, resources and CO, but it also affords utility.
While this view is generally present in economics and larger scale environmental strategies (see for example [27,28,29]) it is often omitted from concrete decision processes in product development or design choices. This is often due to the fact that utility is difficult to measure, as it usually has no directly attributable cost or value [30]. Here we would like to demonstrate that treatment of utility, even though a direct cost is hard to assess, can inform product design very well.
There would be no demand for a car if there was no need to travel fast and safe, and stay dry at the same time. Consequently, if a product is evaluated for sustainability this usefulness needs to be addressed, otherwise, the most sustainable solution is the trivial one: do not build it.
This often leads to a discussion in sustainable development that circles around what can no longer be done or what has to be sacrificed in order to make life more sustainable. If the focus is placed on the value that a product creates for society, more educated decisions can be made with respect to which value can be had at which price. This is a common feature in economics, where marginal utility and marginal cost are constantly compared to decide how much of a product can be sold with a profit.
A key evaluation criterion for sustainable product development should therefore be the marginal cost (or damage if so expressed) in all assessed criteria, as well as the marginal utility gained from each design decision. This can be easily seen in the case of range for an electrical vehicle.
A range of 100 km is much more useful than 50 km for an urban commuter with a 40 km one way trip to work. 150 km range is still more useful, but more as it brings added safety in case of congestion or bad weather. The step from 450 km to 500 km range will not bring much added utility.
Looking at the marginal monetary cost of each added kilometer of range, this will remain roughly constant, as each additional kilometer of range simply requires more of the same battery cells. For larger increments, it will likely increase due to the added overall weight. The same is true for the marginal cost in -footprint and use of rare resources.
Consequently, a utility cost can be calculated for each product according to the use case under inspection and the product’s characteristics. In a full treatment of a vehicle, the overall cost and CO footprint can be assessed, where each increment in range adds cost and weight, but also requires more powerful brakes and therefore increases the marginal cost of range for larger ranges.
For the sake of this example, two use cases will be treated: firstly, a vehicle with a maximum velocity of 90 km/h is used primarily for travel inside city limits with a 50 or 70 km/h speed limit. Here the utility and cost of the vehicle range are assessed. Secondly, a vehicle with a maximum range of 500 km, where the utility cost of the maximum vehicle speed is assessed.
The data used in these examples is the overall CO emission per kilometer found in Figure 16, Figure 17 and Figure 18.
The cost function is clear, as the range increases, so does the overall LCGHG value, the cost factor used here.
In order to assess the utility, a functional description of the utility as a function of the overall vehicle range is needed. For the use case of a city vehicle with low speed, several assumptions about the utility function can be made with common sense, as field data is not readily available yet.
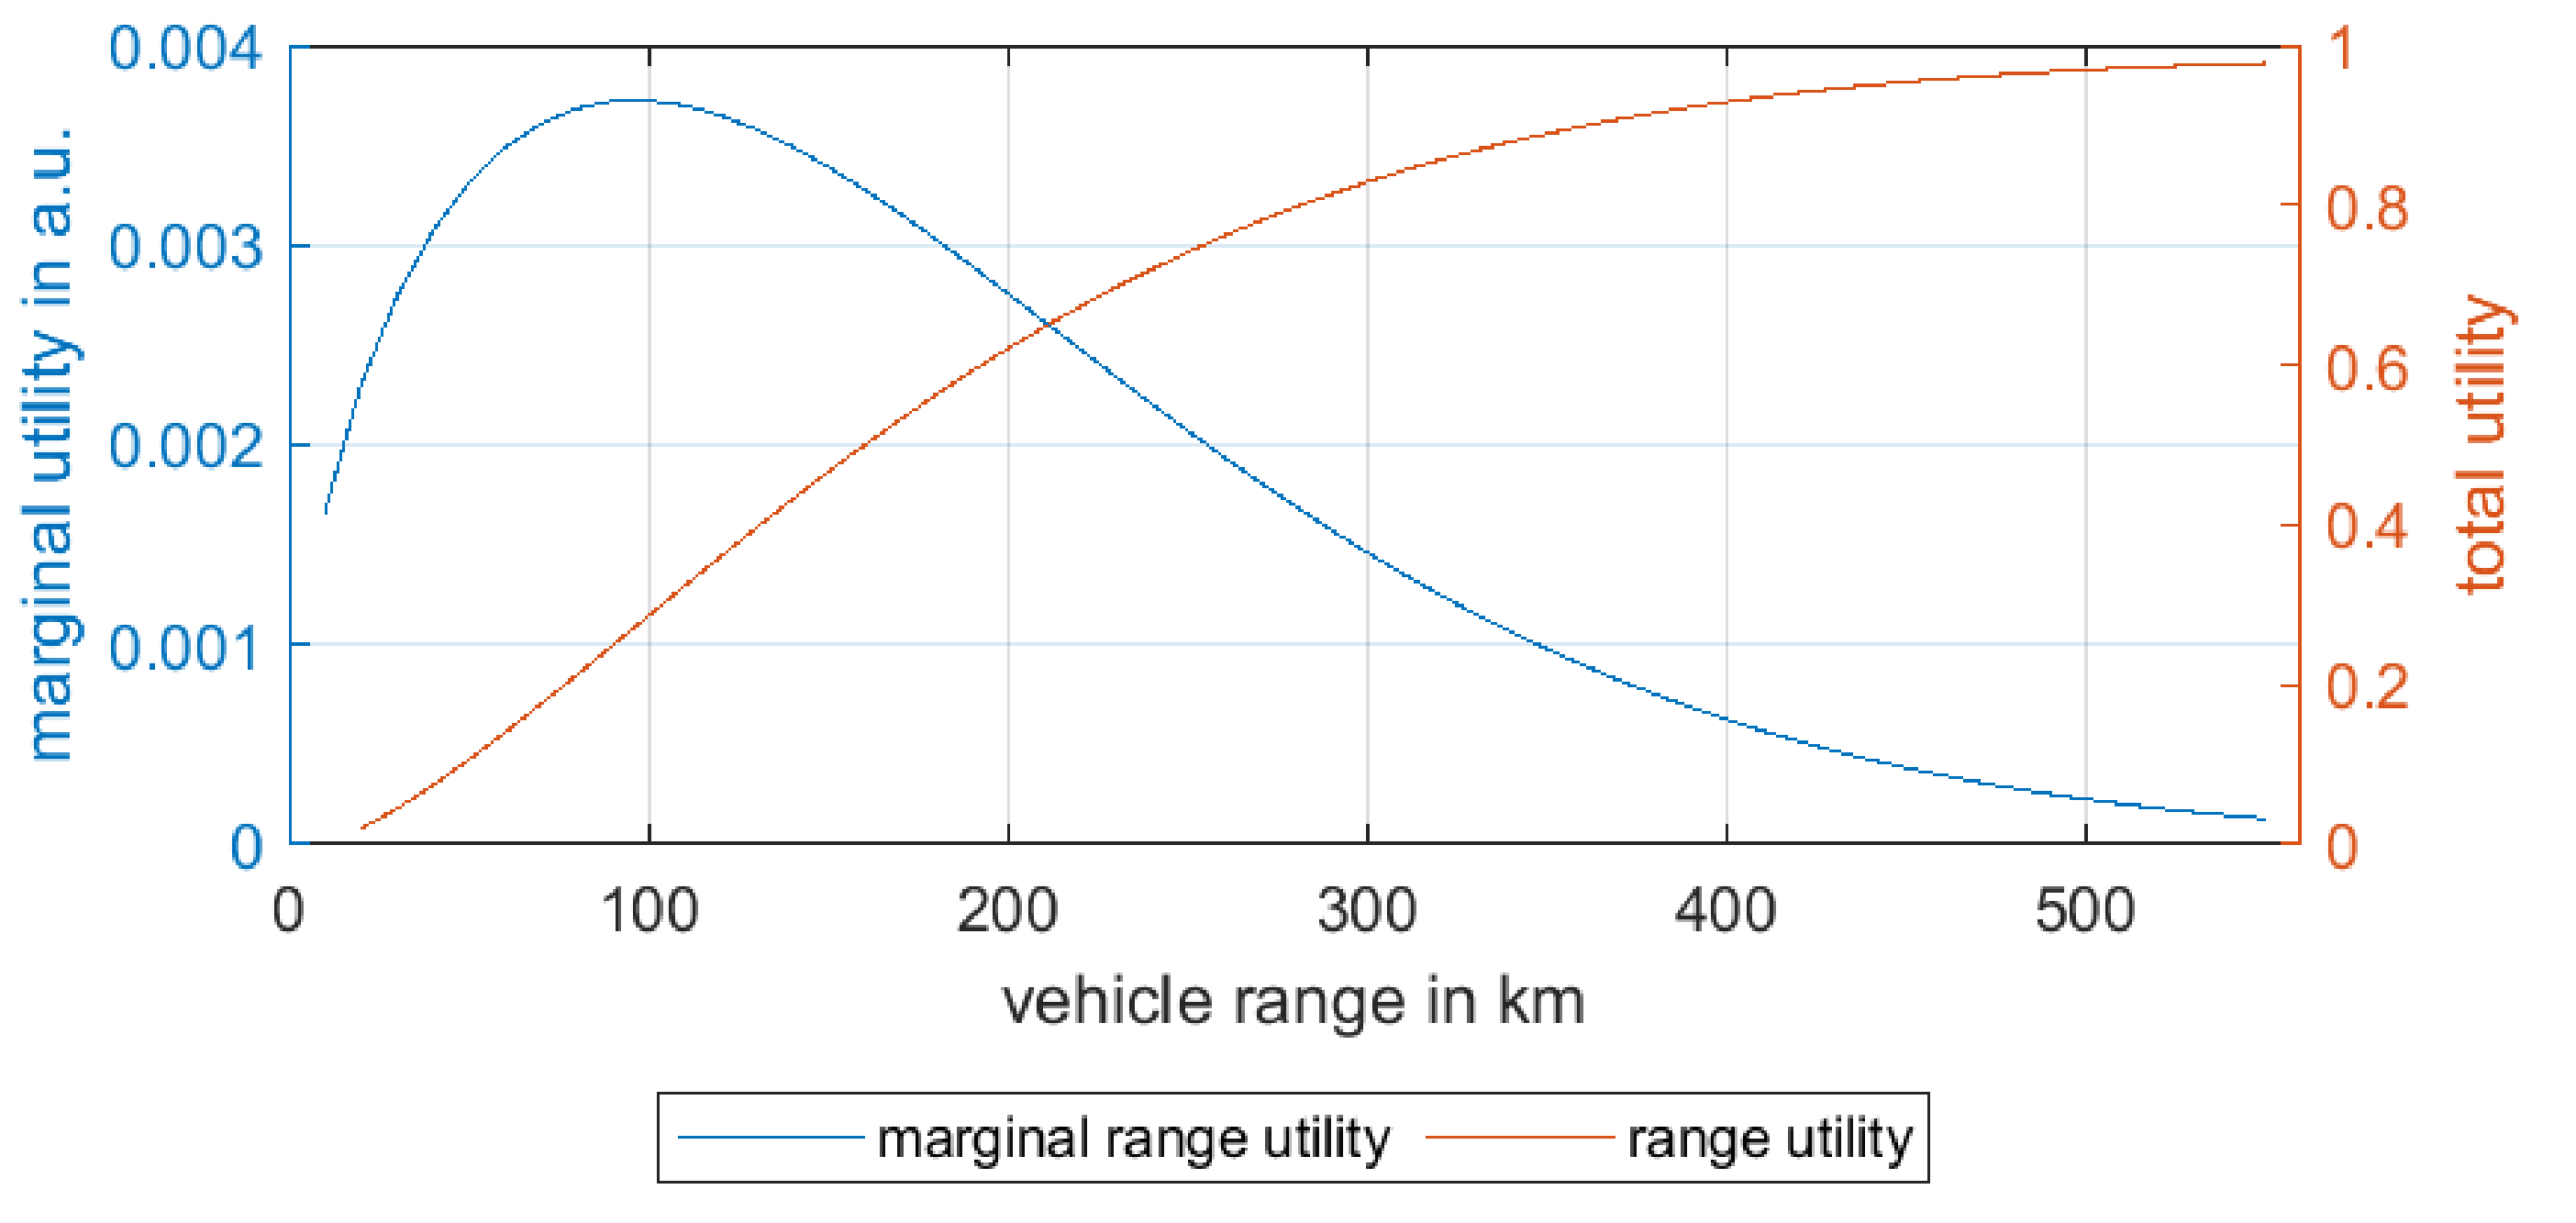
Generally in economics, there is the law of falling marginal utility [31], which states that the marginal utility drops monotonically, but a concrete functional dependency is often not known. In these special use cases, a modification was made so that the assumption is that for very low ranges the utility of adding range is still growing, has a maximum at a given range and then follows the law of falling marginal utility. This reflects the assumption that a vehicle with a range of 10 km will not benefit much from an additional 10 km range, as 20 km is still not very useful.
For a quantitative assessment, this marginal utility function will have to be measured by market research, for example. In order to fulfil the requirements stated before, a Weibull distribution has been assumed for the marginal utility as it offers the needed dependency, as can be seen in Figure 19. Increasing marginal utility per additional km at the beginning, a maximum and then declining marginal utility for larger ranges. The Weibull function is not used for any of its properties in statistical analysis, just for its applicable shape.
Looking at the assessment of utility costs for the vehicle range, the marginal increase in LCGHG value (units of gram per kilometer driven) is evaluated for each added kilometer of range. This is done by calculating the differential quotient of LCGHG/Range at each range point. Due to the discrete nature of this calculation, the final graph shows some uneven behavior for large ranges, this is purely numerical in nature.
As the pure CO cost is a very unusual number to work with, this is converted into a monetary cost. A total cost for Carbon-Dioxide Emission is given in [32]. A cost of 640 Euro/t has been adopted, this number including damages to the current as well as future generations. To put the results into a useful numerical range, Cents are used as monetary unit.
The marginal cost is calculated as the differential quotient of cost per driven kilometer over vehicle range : .
Whether this reflects an accurate cost is debatable, but it lends quantifiable comparability to the decisions between vehicles and their parameters.
In order to include the estimated utility of additional range, this value is divided by the marginal utility in arbitrary units [u] per kilometer, normalized to a maximum utility of one .
This ratio of marginal cost over marginal utility describes the additional cost per driven kilometer per each kilometer of added range. It is important to note that and have the same physical unit, but are of course different things and therefore have to be treated separately.
This yields a cost in Cent per kilometer per normalized utility for each range value . This number indicates how much each kilometer driven by the vehicle will cost more, weighted by the assumed utility of the added range, when another kilometer of the total vehicle range is added.
Typically, this cost will increase towards high ranges as the marginal utility drops and the marginal cost stays the same or even increases.
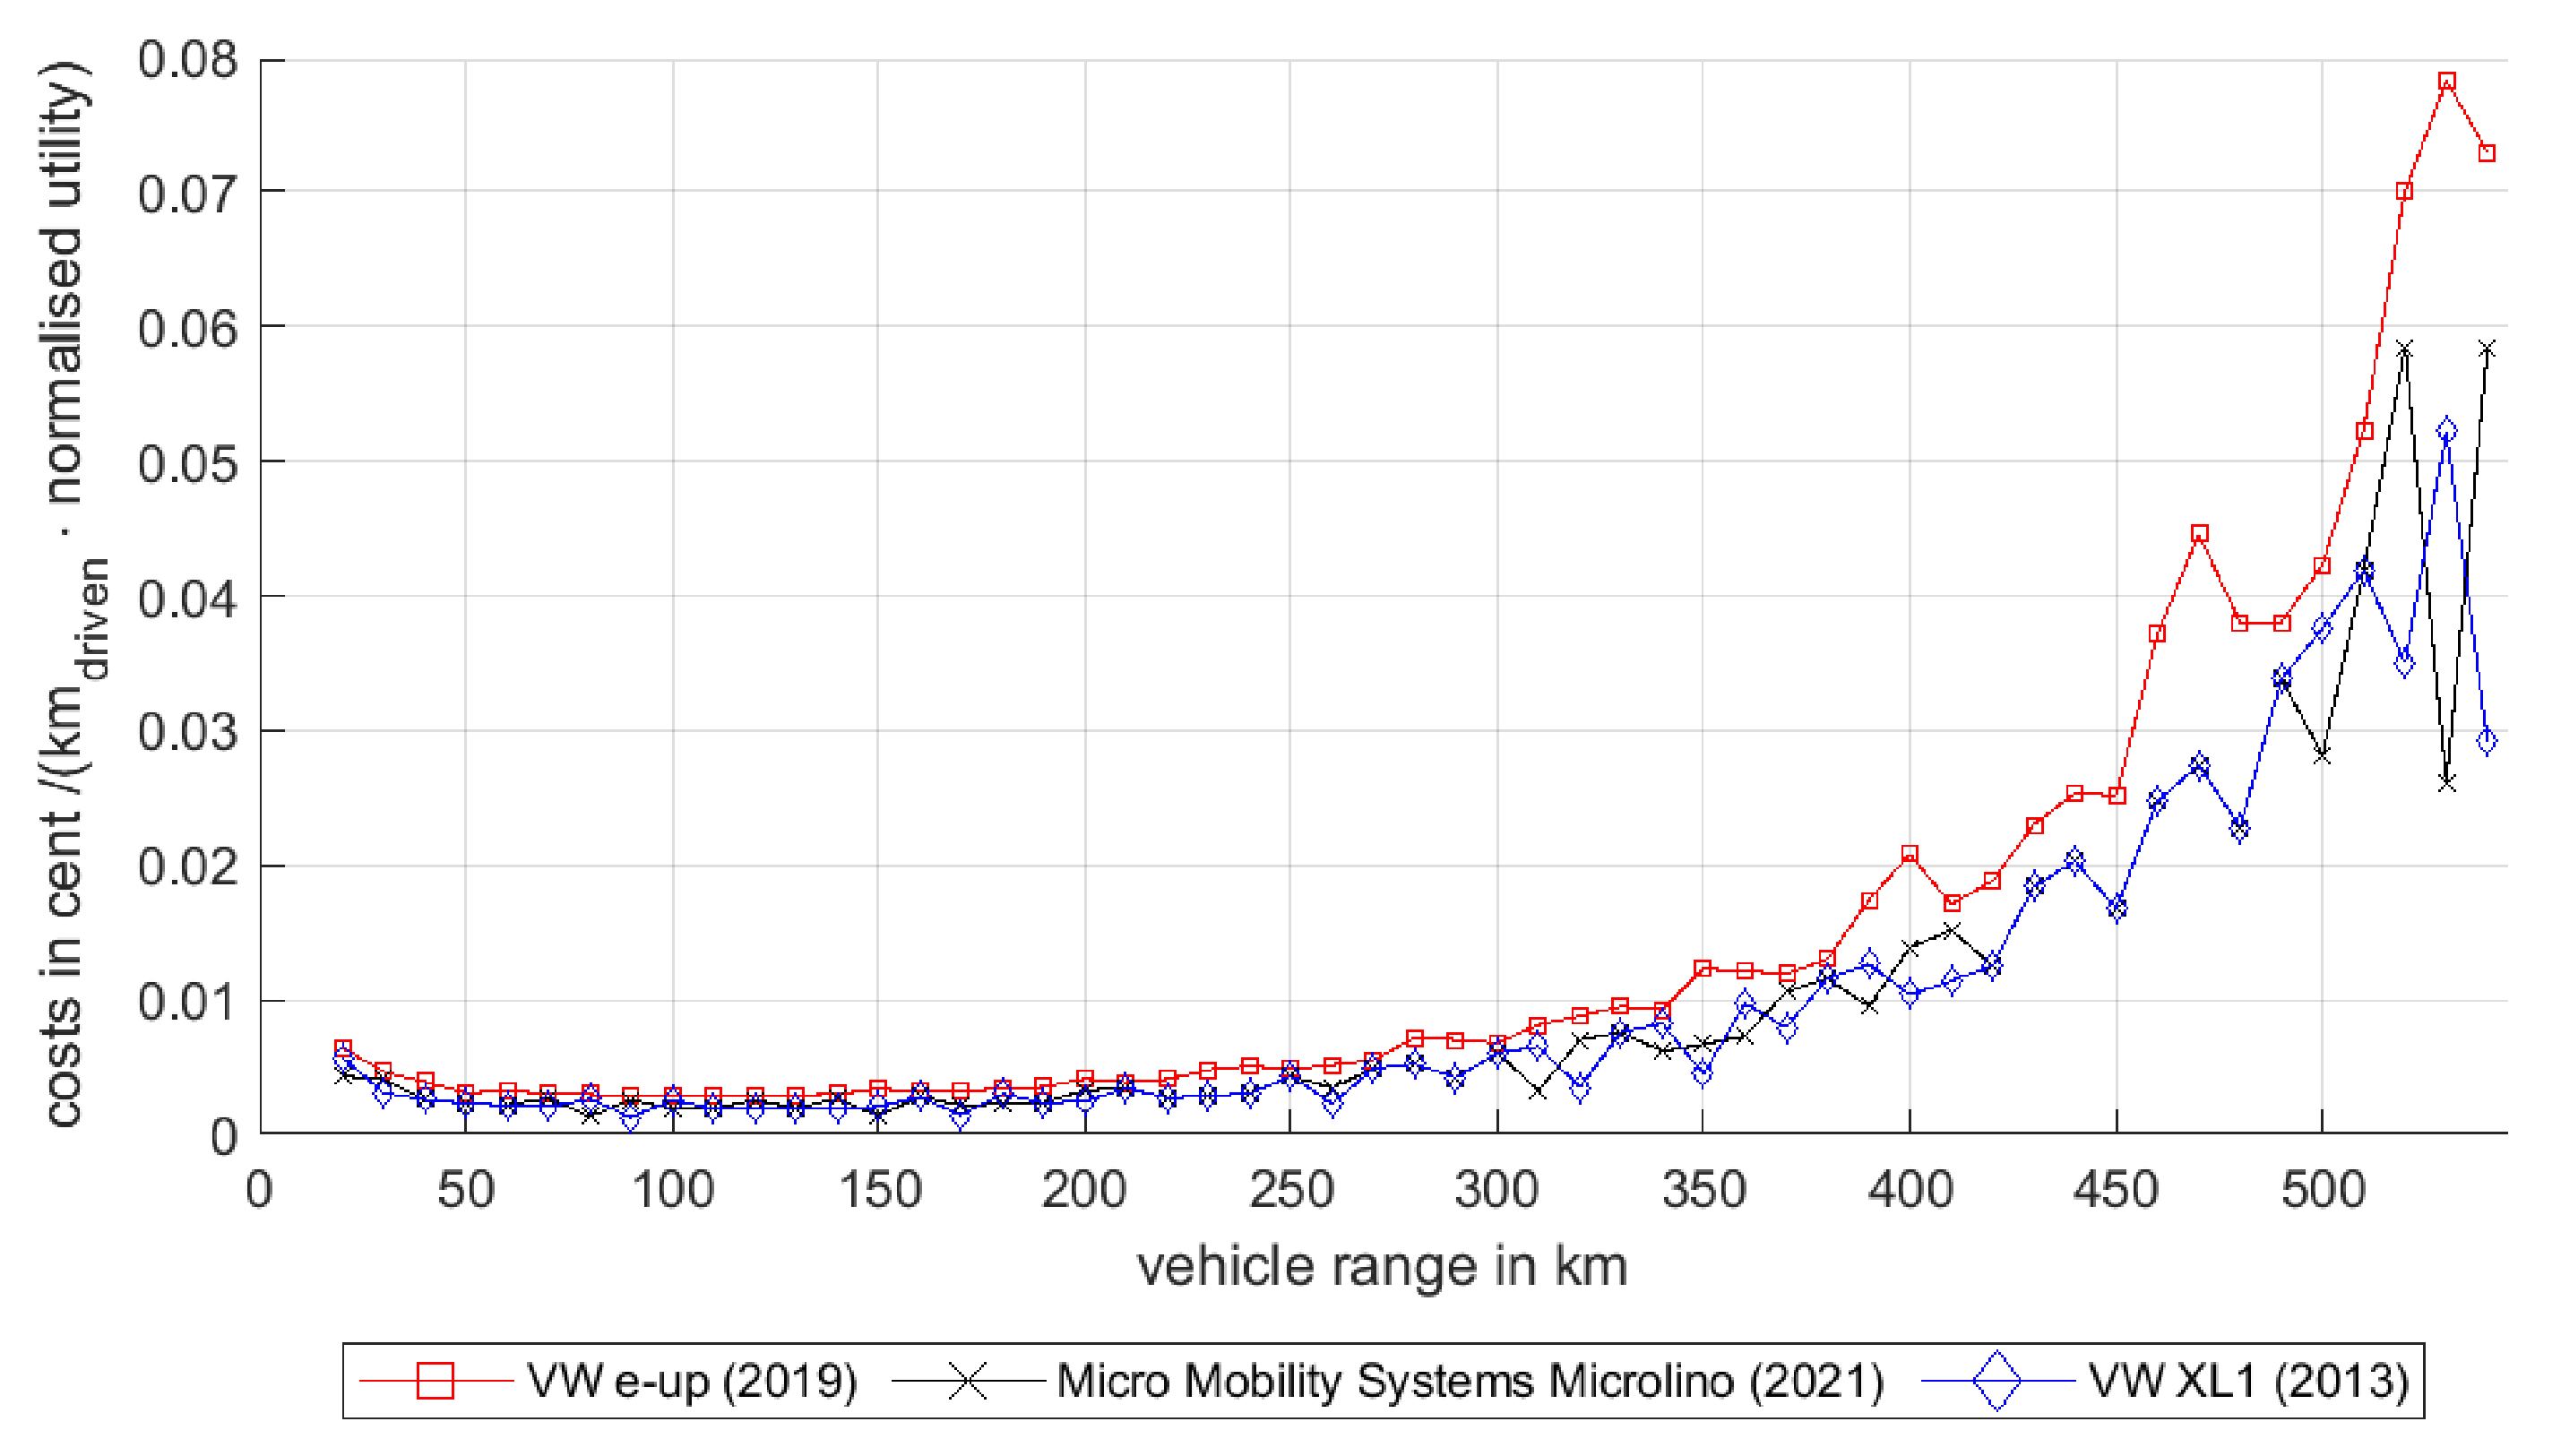
Figure 20 shows the result for a scenario of a maximum 90 km/h vehicle speed and an axle drive. The utility cost rises only slowly up to a range of 340 km when it begins to increase more sharply.
This indicates that an increase in range does not lead to added costs per utility for each driven kilometer at ranges below 220 and only from the 340 km range is the increase of cost per km is significant.
Based on this curve and assumptions it can be concluded that a maximum range of about 300 km will likely be the most cost vs utility effective solution for the owner and all three vehicles are roughly similar in this category.
For the variation of speed, a similarly distributed marginal utility for the increase in maximum vehicle speed has been assumed (Weibull distribution, k = 2.8, ). Again, this is an assumption made to demonstrate the process and will need to be replaced with data gathered in the field.
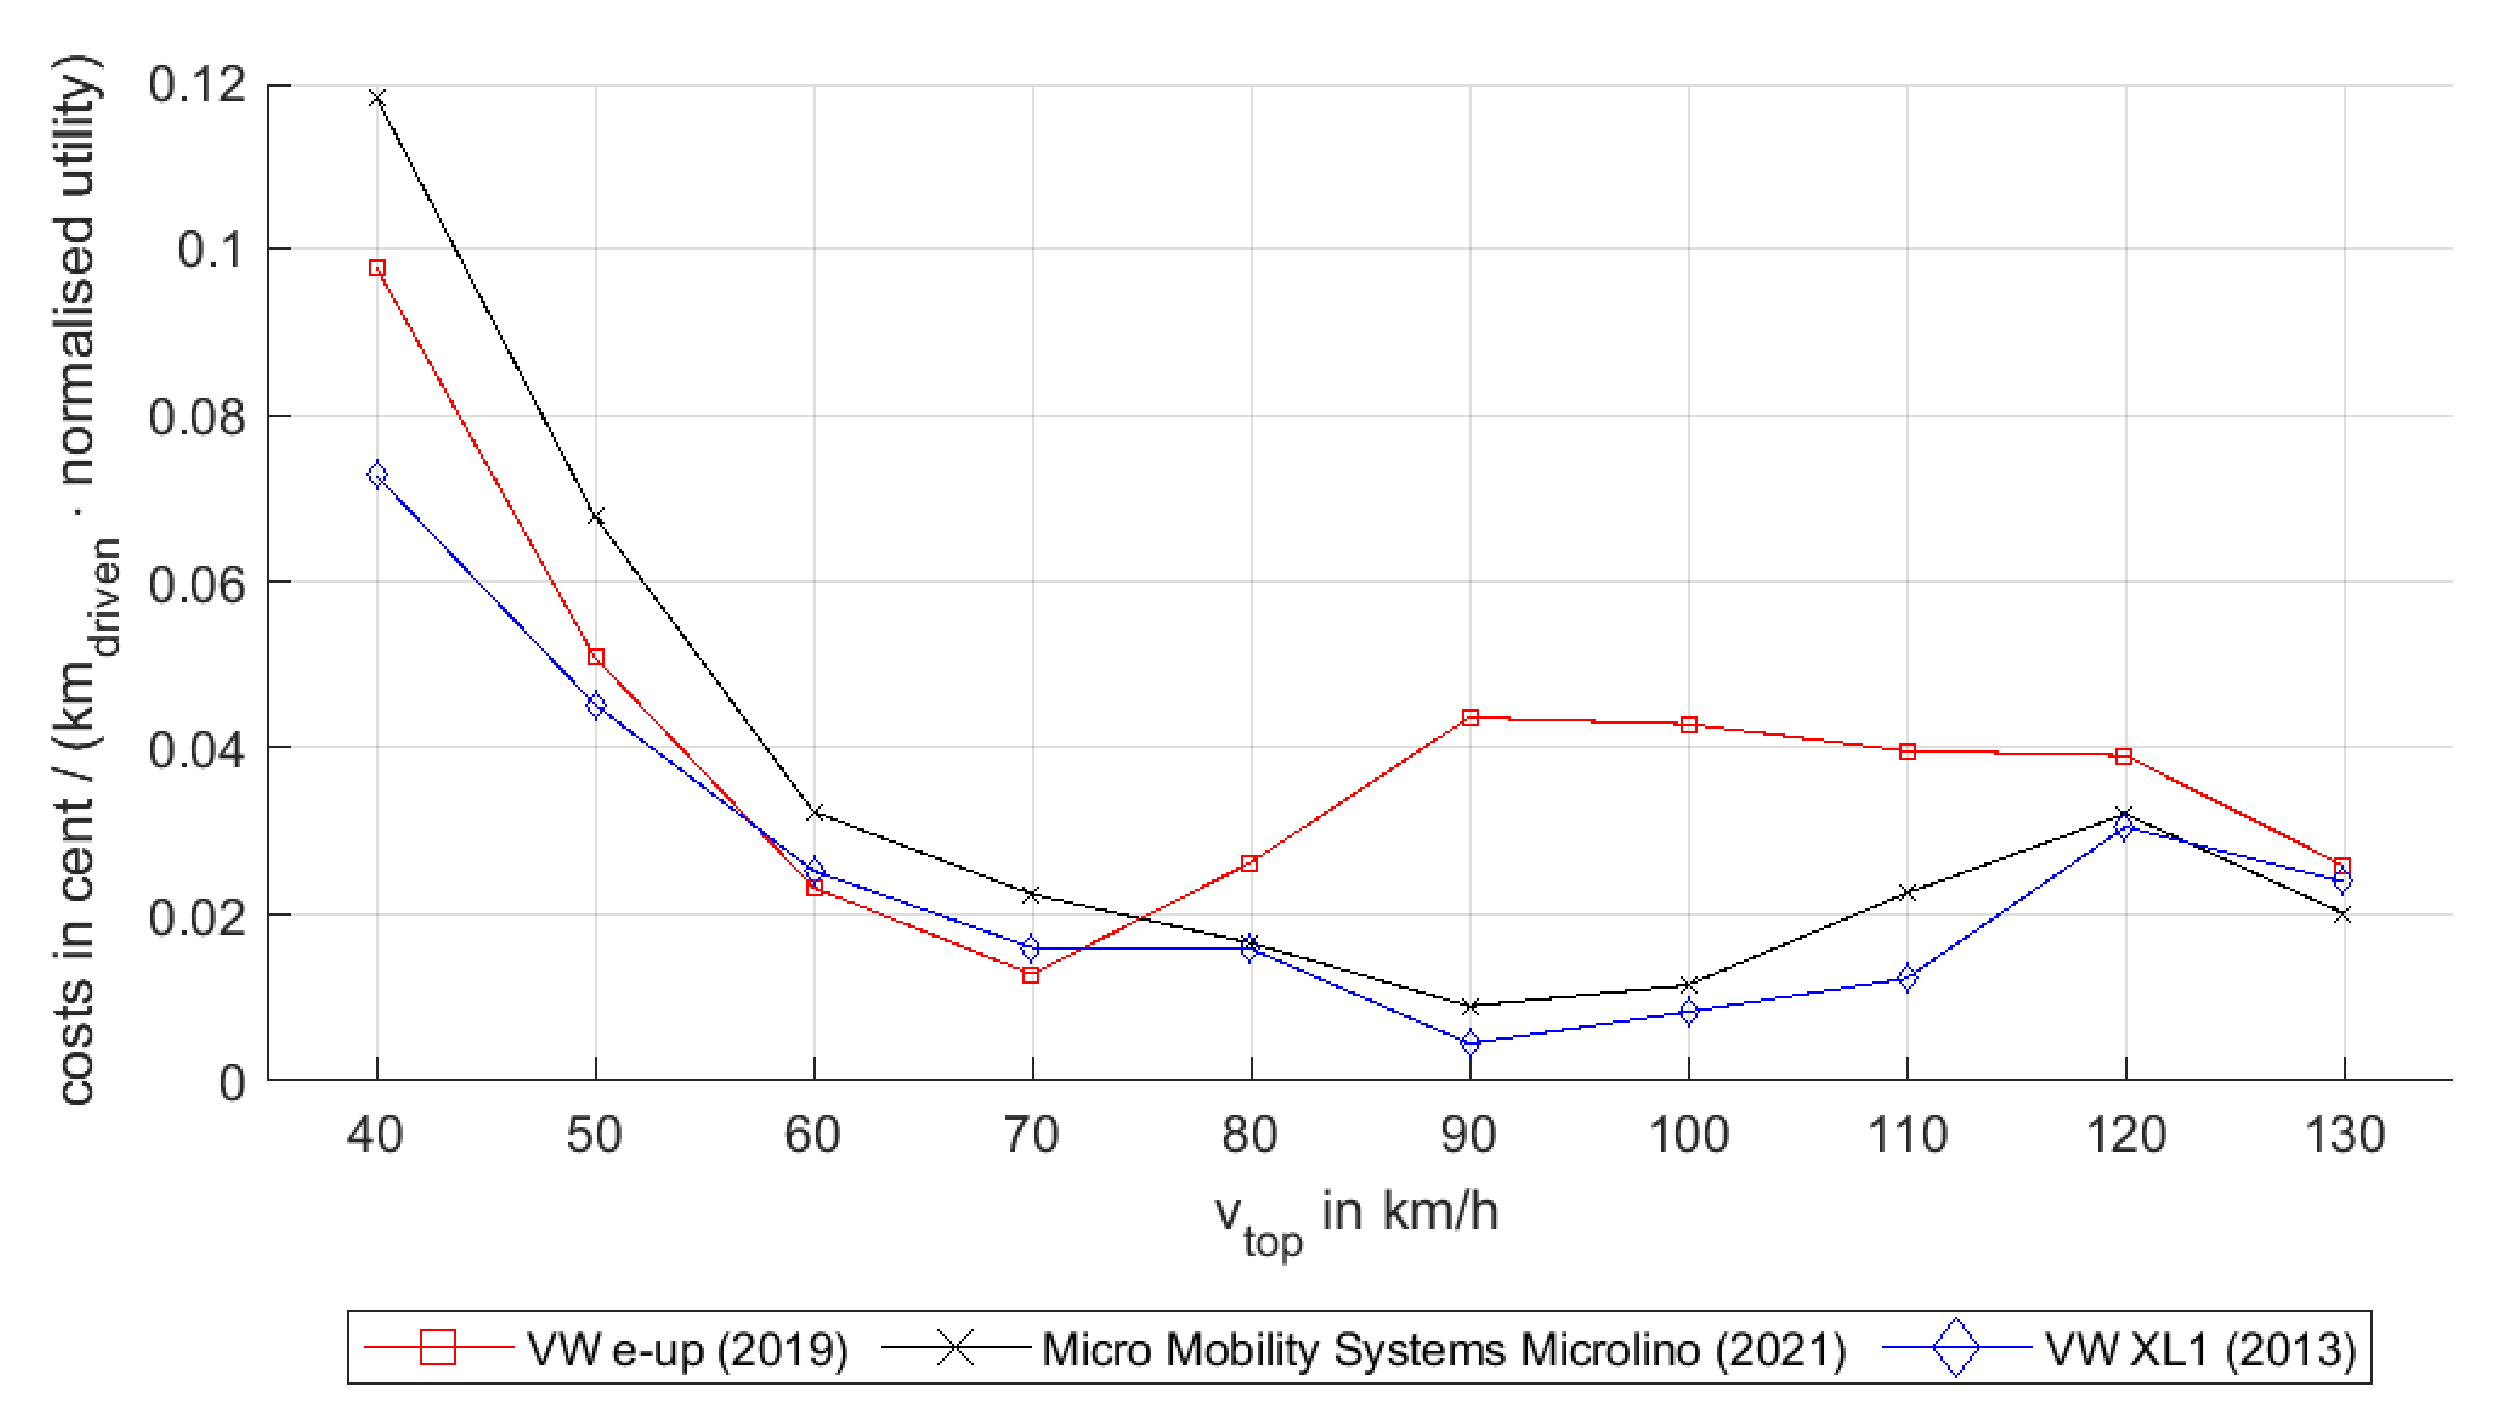
The resulting marginal cost for each km/h in maximum vehicle speed at a vehicle range of 500 km per km driven can be seen in Figure 21.
In this case, the utility does still continue to grow until the end of the data considered, so there is no sharp rise at the upper limit. However, both for the e-up (at 70 km/h) maximum vehicle speed and for the Microlino and XL1 (at around 90 km/h) there is a clear cost per utility minimum.
In summary, this weighting of marginal costs with a marginal utility function can better inform design decisions compared to pure cost or CO emission numbers as it includes the utility that additional cost brings to the user of the product.
4. Societal Consequences
From the analysis in the previous chapter, it becomes clear that the utility the driver assigns to the various vehicle parameters like maximum speed or range will strongly influence which additional monetary or environmental cost they will be ready to pay to get an additional increase in any parameter. For example, in Figure 21 it can be seen that for the e-up the Cost per Utility doubles from 70 km/h maximum vehicle speed to 90 km/h and then is comparatively stable. This would be a strong indicator that either a purely urban vehicle that can perform well within city limits or in areas of enforced speed limits of 70 would be desirable.
It also becomes clear that, where the CO emissions rise roughly linearly with the speed or range, and therefore any reduction in maximum vehicle speed will reduce CO emission accordingly, the inclusion of utility shows more efficiently how much extra emission users might be willing to accept to get an increase in range or maximum speed.
Any general speed limit would reduce the utility of speeds more than 20 km/h over the general speed limit dramatically, and therefore increase the Cost per Utility of higher maximum speeds.
Also, the analysis can make it obvious that a short-range, low-speed vehicle may offer very cheap satisfaction of the need for utility at low speeds inside city limits and could lead to big reductions in emissions.
5. Development Method for Sustainable Vehicles
The problem in automotive engineering is not that design engineers are not aware of the necessities and possibilities of sustainable product development. In fact, in the last decades multiple processes, algorithms, methods and tools were developed and were compiled in the last years in excellent surveys. The challenge for the design engineers is a result of four main characteristics of sustainable product development in automotive engineering, which will be explained in the following sentences.
The first main characteristic concerns the fact that a multitude of competing objectives have to be considered. Sustainable product development has to deal with multi-objective goal systems. This starts with the fact that a new car must deliver good results in the standardized efficiency tests, but it should also deliver good efficiency in the real application of the final customer. The future car should be efficient but also safe and comfortable. In many segments, the consumers expect additional performance, such as good acceleration and dynamic driving around corners. Last but not least, the production of a car needs to be economical, because otherwise it cannot be sold and cannot contribute to, e.g., a lower carbon footprint.
The second main characteristic is the fact that nearly all design decisions concern more than one domain [33]. A multi-domain optimization can include the domain’s mechanics, fluid dynamics, thermodynamics, electronics and software.
The third main characteristic concerns the fact that design solutions for battery electric vehicles can be topologically diverse, i.e., that different design solution possibilities are available, which not only divert in terms of parameters but use completely different solution elements and sometimes even physical effects. Some examples can be the kind of electrical drive motor (permanent-magnet synchronous reluctance motor, AC induction motor, …) or the number of gears in a transmission (usually one or two for BEVs). It is important to note that the topological realization of a BEV is not as transparent to the customer as it was for vehicles with a combustion engine (CVs). Usually, a CV customer knows the number of cylinders in the engine, their arrangement (in-line or V), the type of engine (petrol or diesel), the number of valves per cylinder, the number of gears of the transmission, etc. So, the topology may be partly hidden to the end customer, but the design engineers are more than ever required to achieve an optimum solution in a topologically diverse solution field.
The fourth main characteristic is the fact that surrounding conditions, which are important for evaluation and selection process, are continuously changing and that their change is difficult or even sometimes impossible to predict. This requires a revisit of this topic throughout the development process.
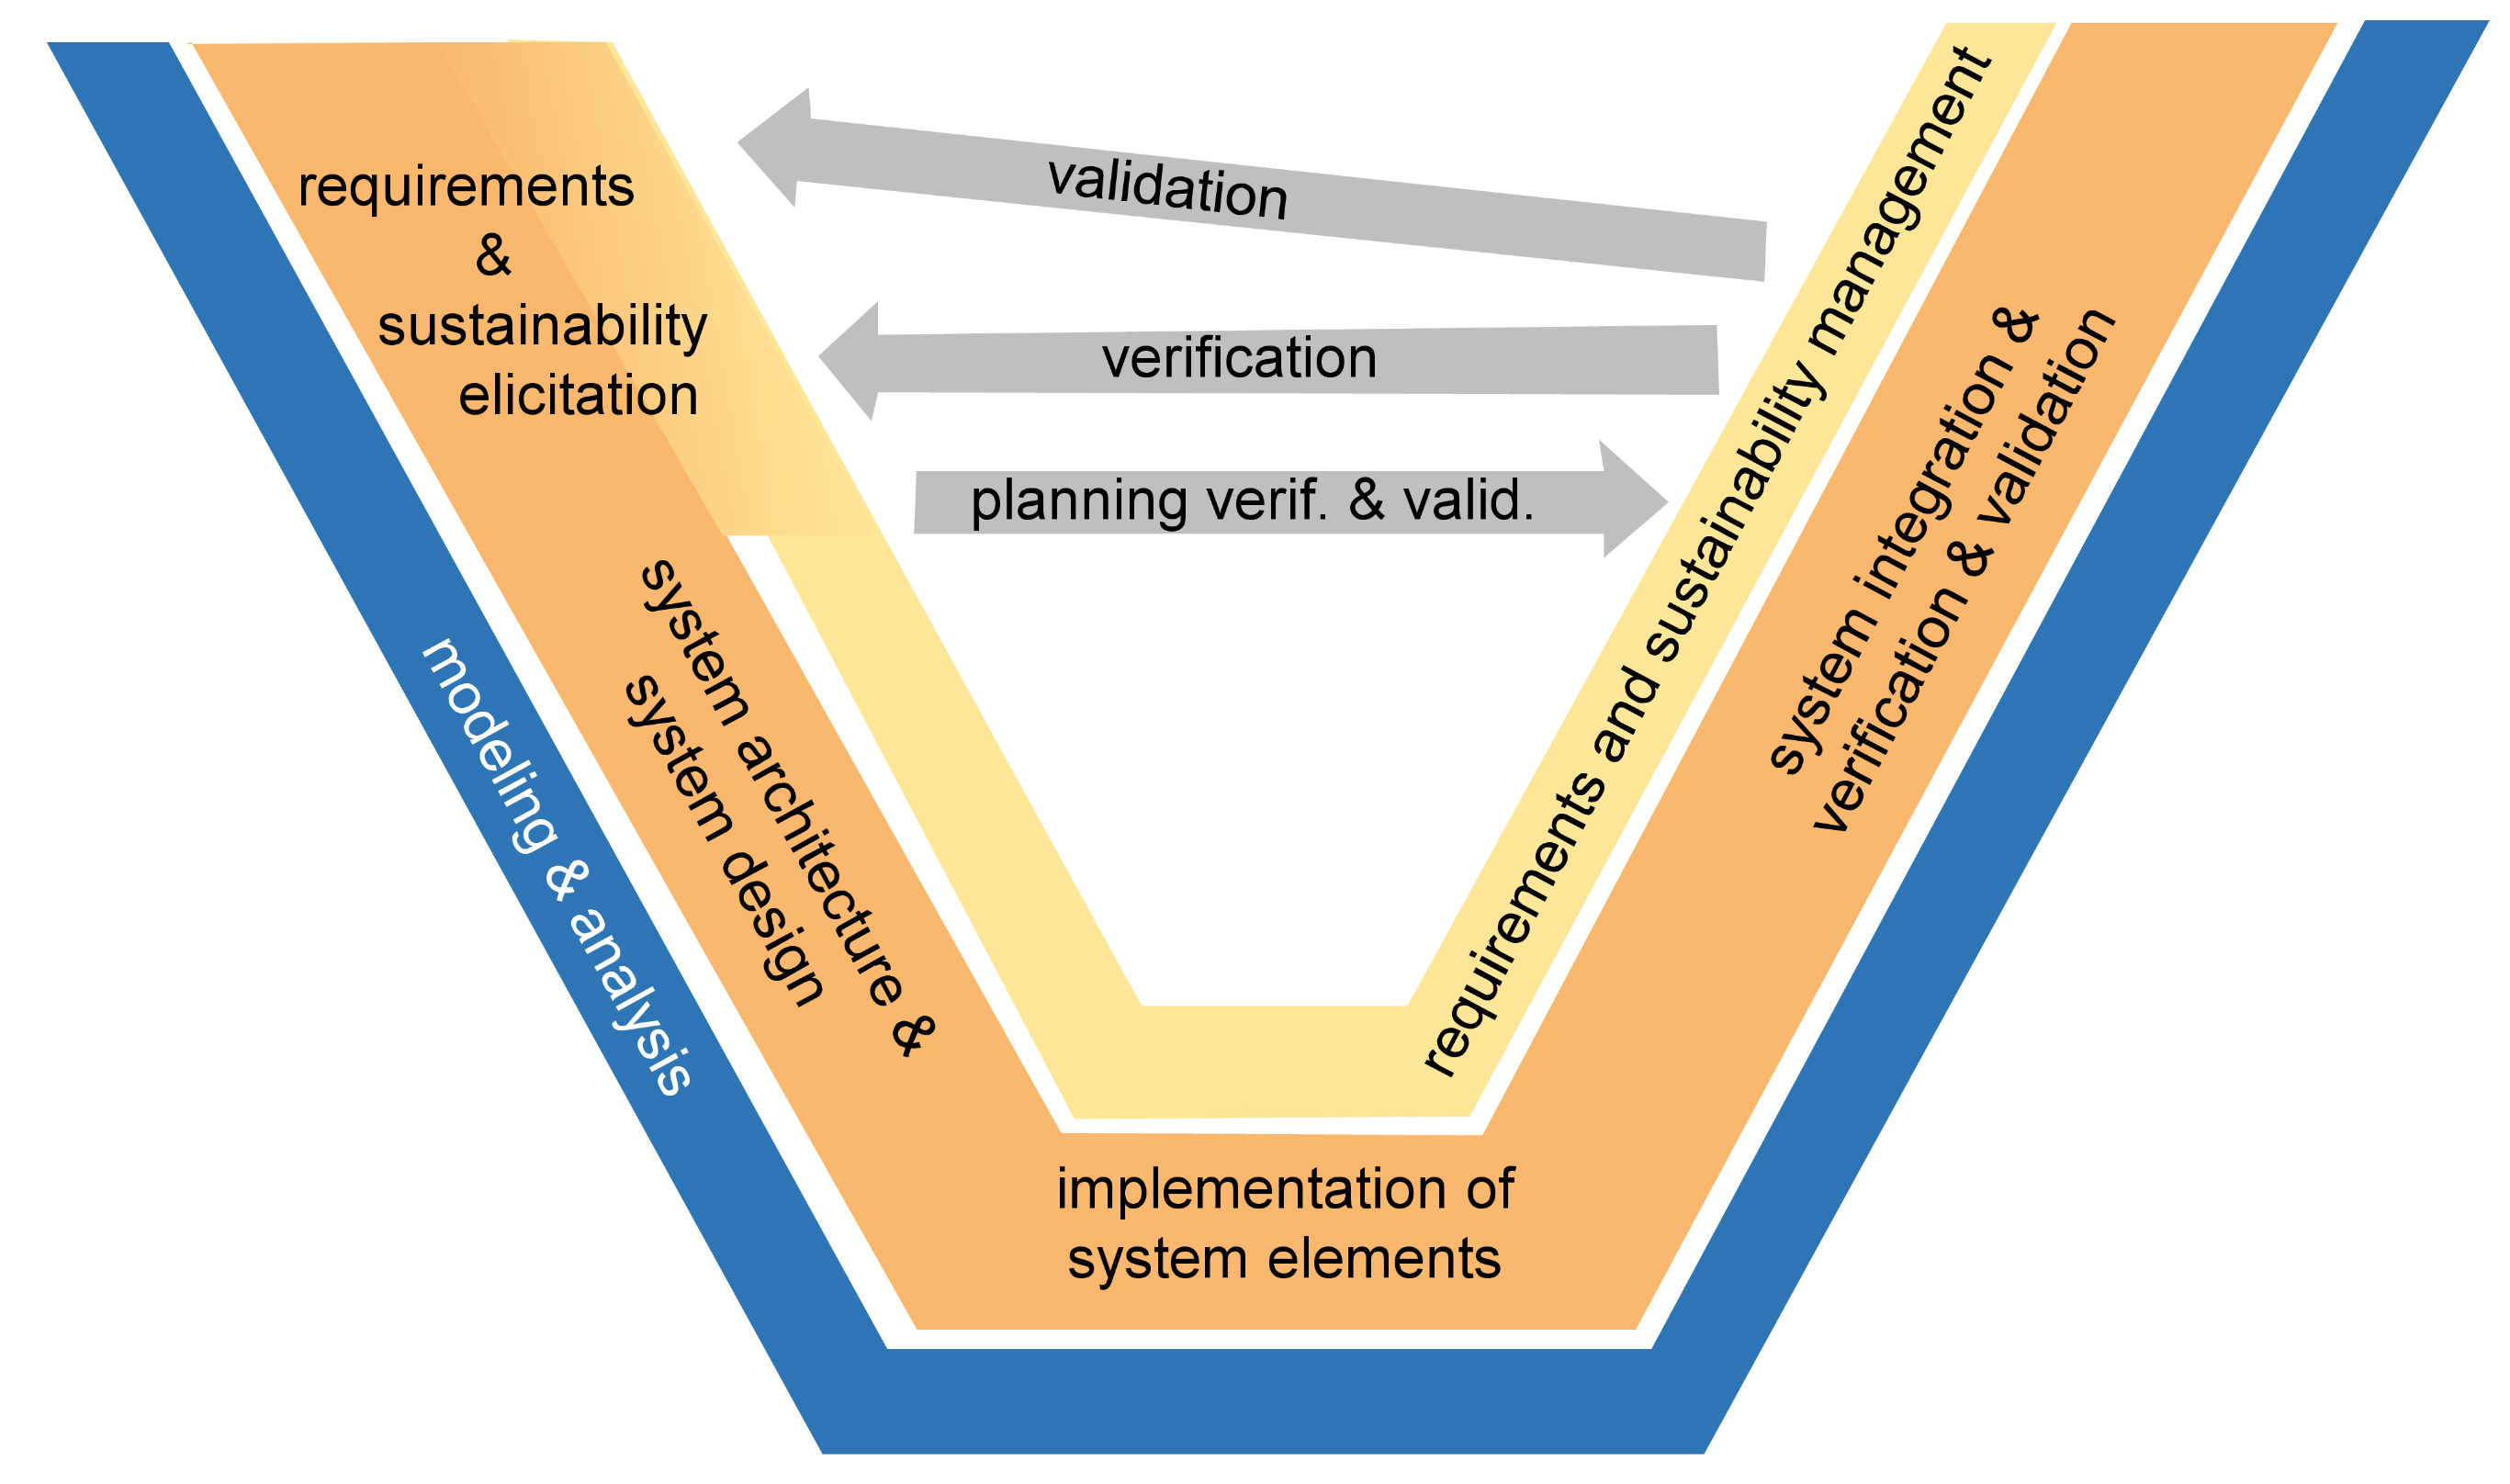
These four main characteristics need to be considered in the goal and procedure system of a product development method for sustainable vehicles. Additionally, those considerations have to be integrated into the complex product development processes already in place in industry. For the product development of electric vehicles, commonly model-based systems engineering (MBSE) processes [34] are applied in industry in order to achieve a continuous digital design process. In MBSE, usually product and process models are connected in order to allow these continuous digital processes [35] and abstract product models such as the function model [36] are integrated. Such processes allow multi-objective and domain spanning optimization; they avoid redundant data and design flaws. In many cases, the well-known V-model is used as a representation of the global logical structure of the process. One important knowledge base is the well-known guideline VDI/VDE 2206, which was republished in 2020 as a draft using the new name “Development of cyber-physical mechatronic systems (CPMS)” [37]. The essence of this guideline to offer user support for all process steps in the development of cyber-physical mechatronic systems (electrical vehicles also belong in this category due to the enormous complexity and due to developments such as Car-to X communication) by presenting the main logical relationships. In the center of the guideline is an inherent flow logic that is represented as an updated and extended V-model [38]. Researchers worldwide are seeking to expand the algorithms, tools, methods and strategies, which allow realizing this kind of process, current topics are domain-specific modeling approaches [39], automated parameter selection [40], the integration of verification processes into MBSE [41] the and the study of requirements change risk [42]. A strong emphasis on requirements and an intensive and continuous requirements management is present in the current approaches [43]; this is also visible in the new V-model of the Guideline VDI/VDE 2206. One may ask if sustainability is just a new (or even already existing) set of requirements. However, due to four issues listed earlier in this section and due to the enormous importance of this topic for the future of our planet, it is proposed in this paper to include this topic explicitly in the V-model, both in the initial phase and ongoing throughout the process (Figure 22).
The version of the V-model shown in Figure 22 clarifies that design engineers need to explicitly perform an elicitation of sustainability requirements, challenges and surrounding conditions–in this context elicitation essentially means to research and discover sustainability requirements, challenges and surrounding conditions from legislation, sustainability research, operation conditions prognoses (e.g., charging possibilities), customers and other stakeholders. It also clarifies that the sustainability issues and challenges need to be monitored, reflected, updated, revisited and controlled throughout the development processes. This can be realized by means of a connection with the already realized, ongoing requirements management process (Figure 22).
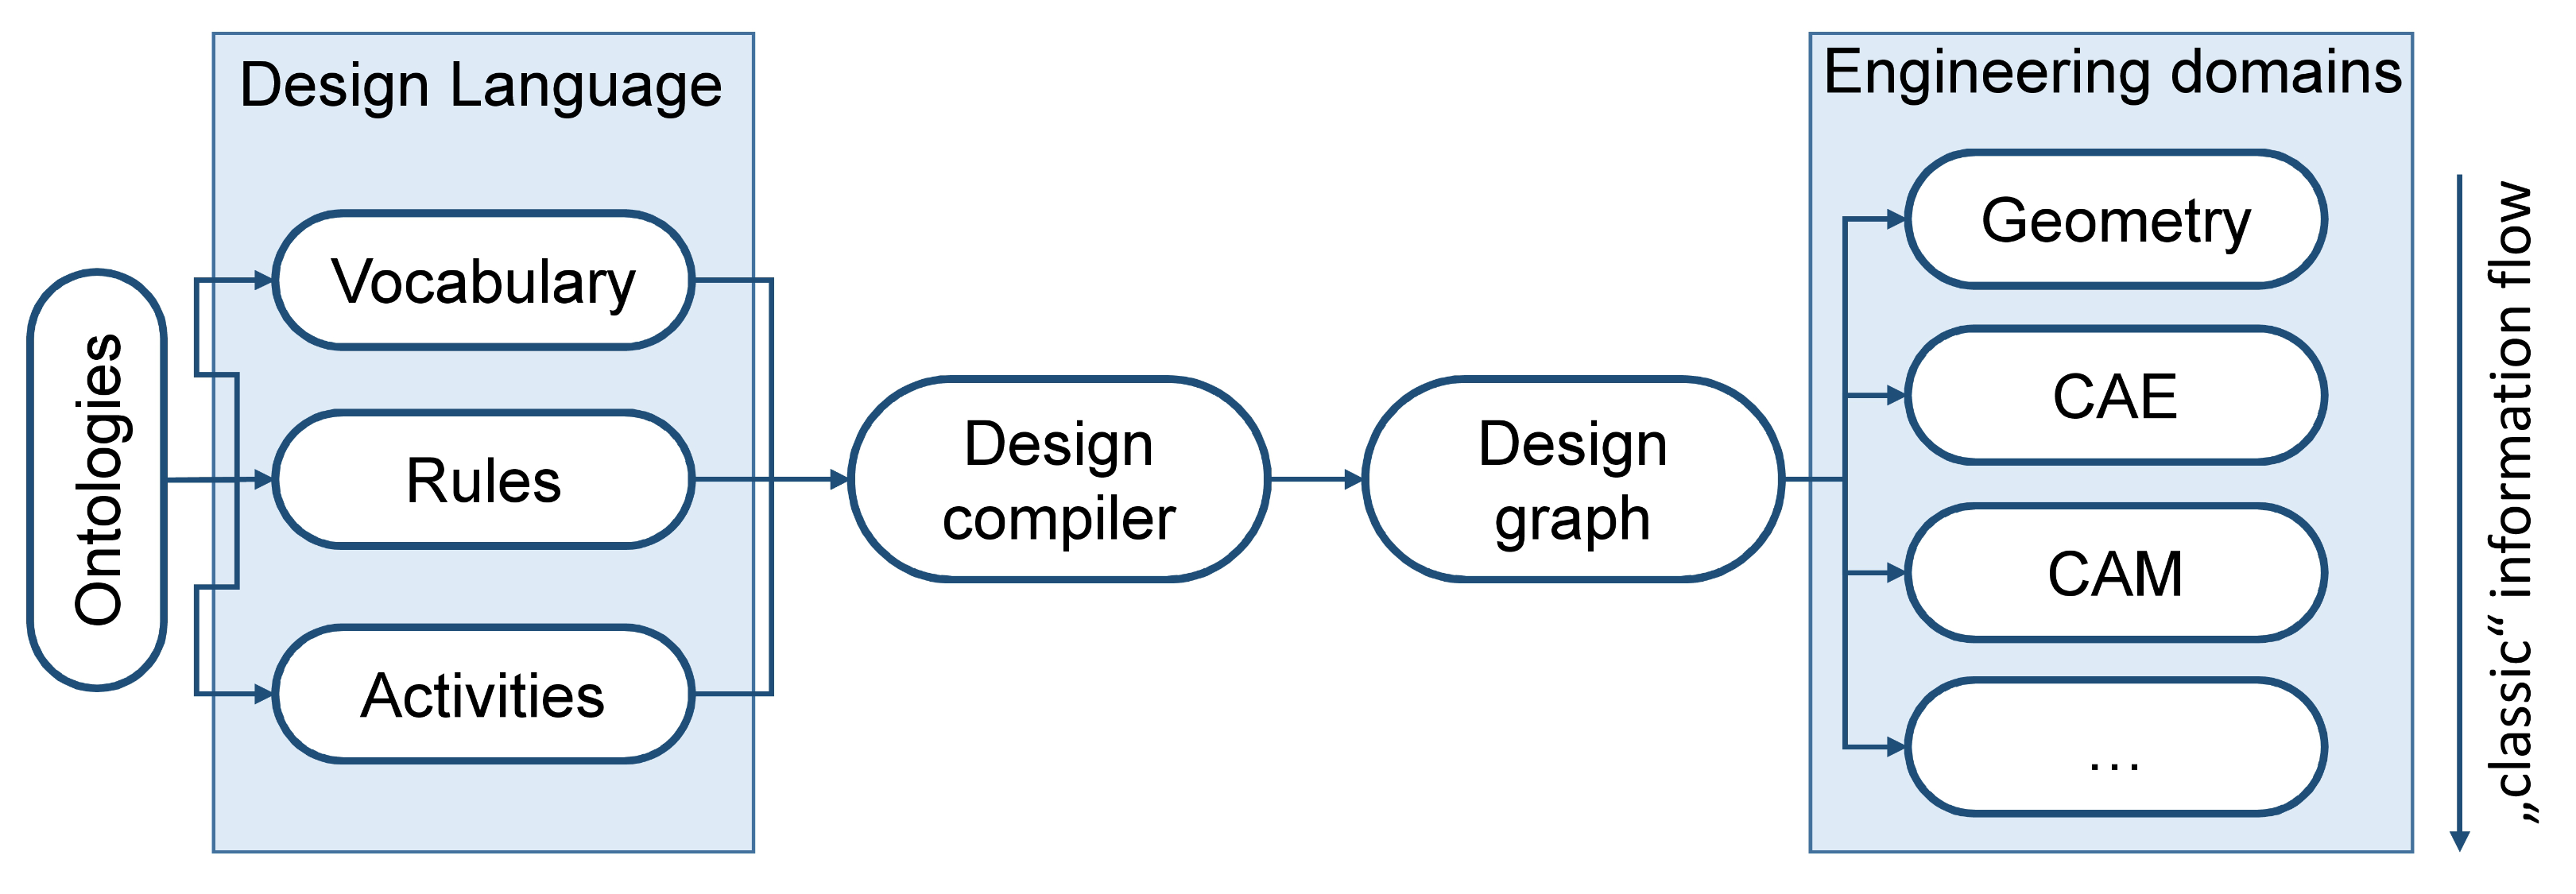
In the last years, graph-based design languages [44] were identified as one promising possibility to address the challenges in the development of complex products and for realizing MBSE by means of knowledge representation in the unified modelling language (UML). Knowledge represented in UML can be complied by means of a design compiler (DC43, IILS GmbH, Trochtelfingen, Germany [45]); this compilation leads to a machine-executable V-model (Figure 23).
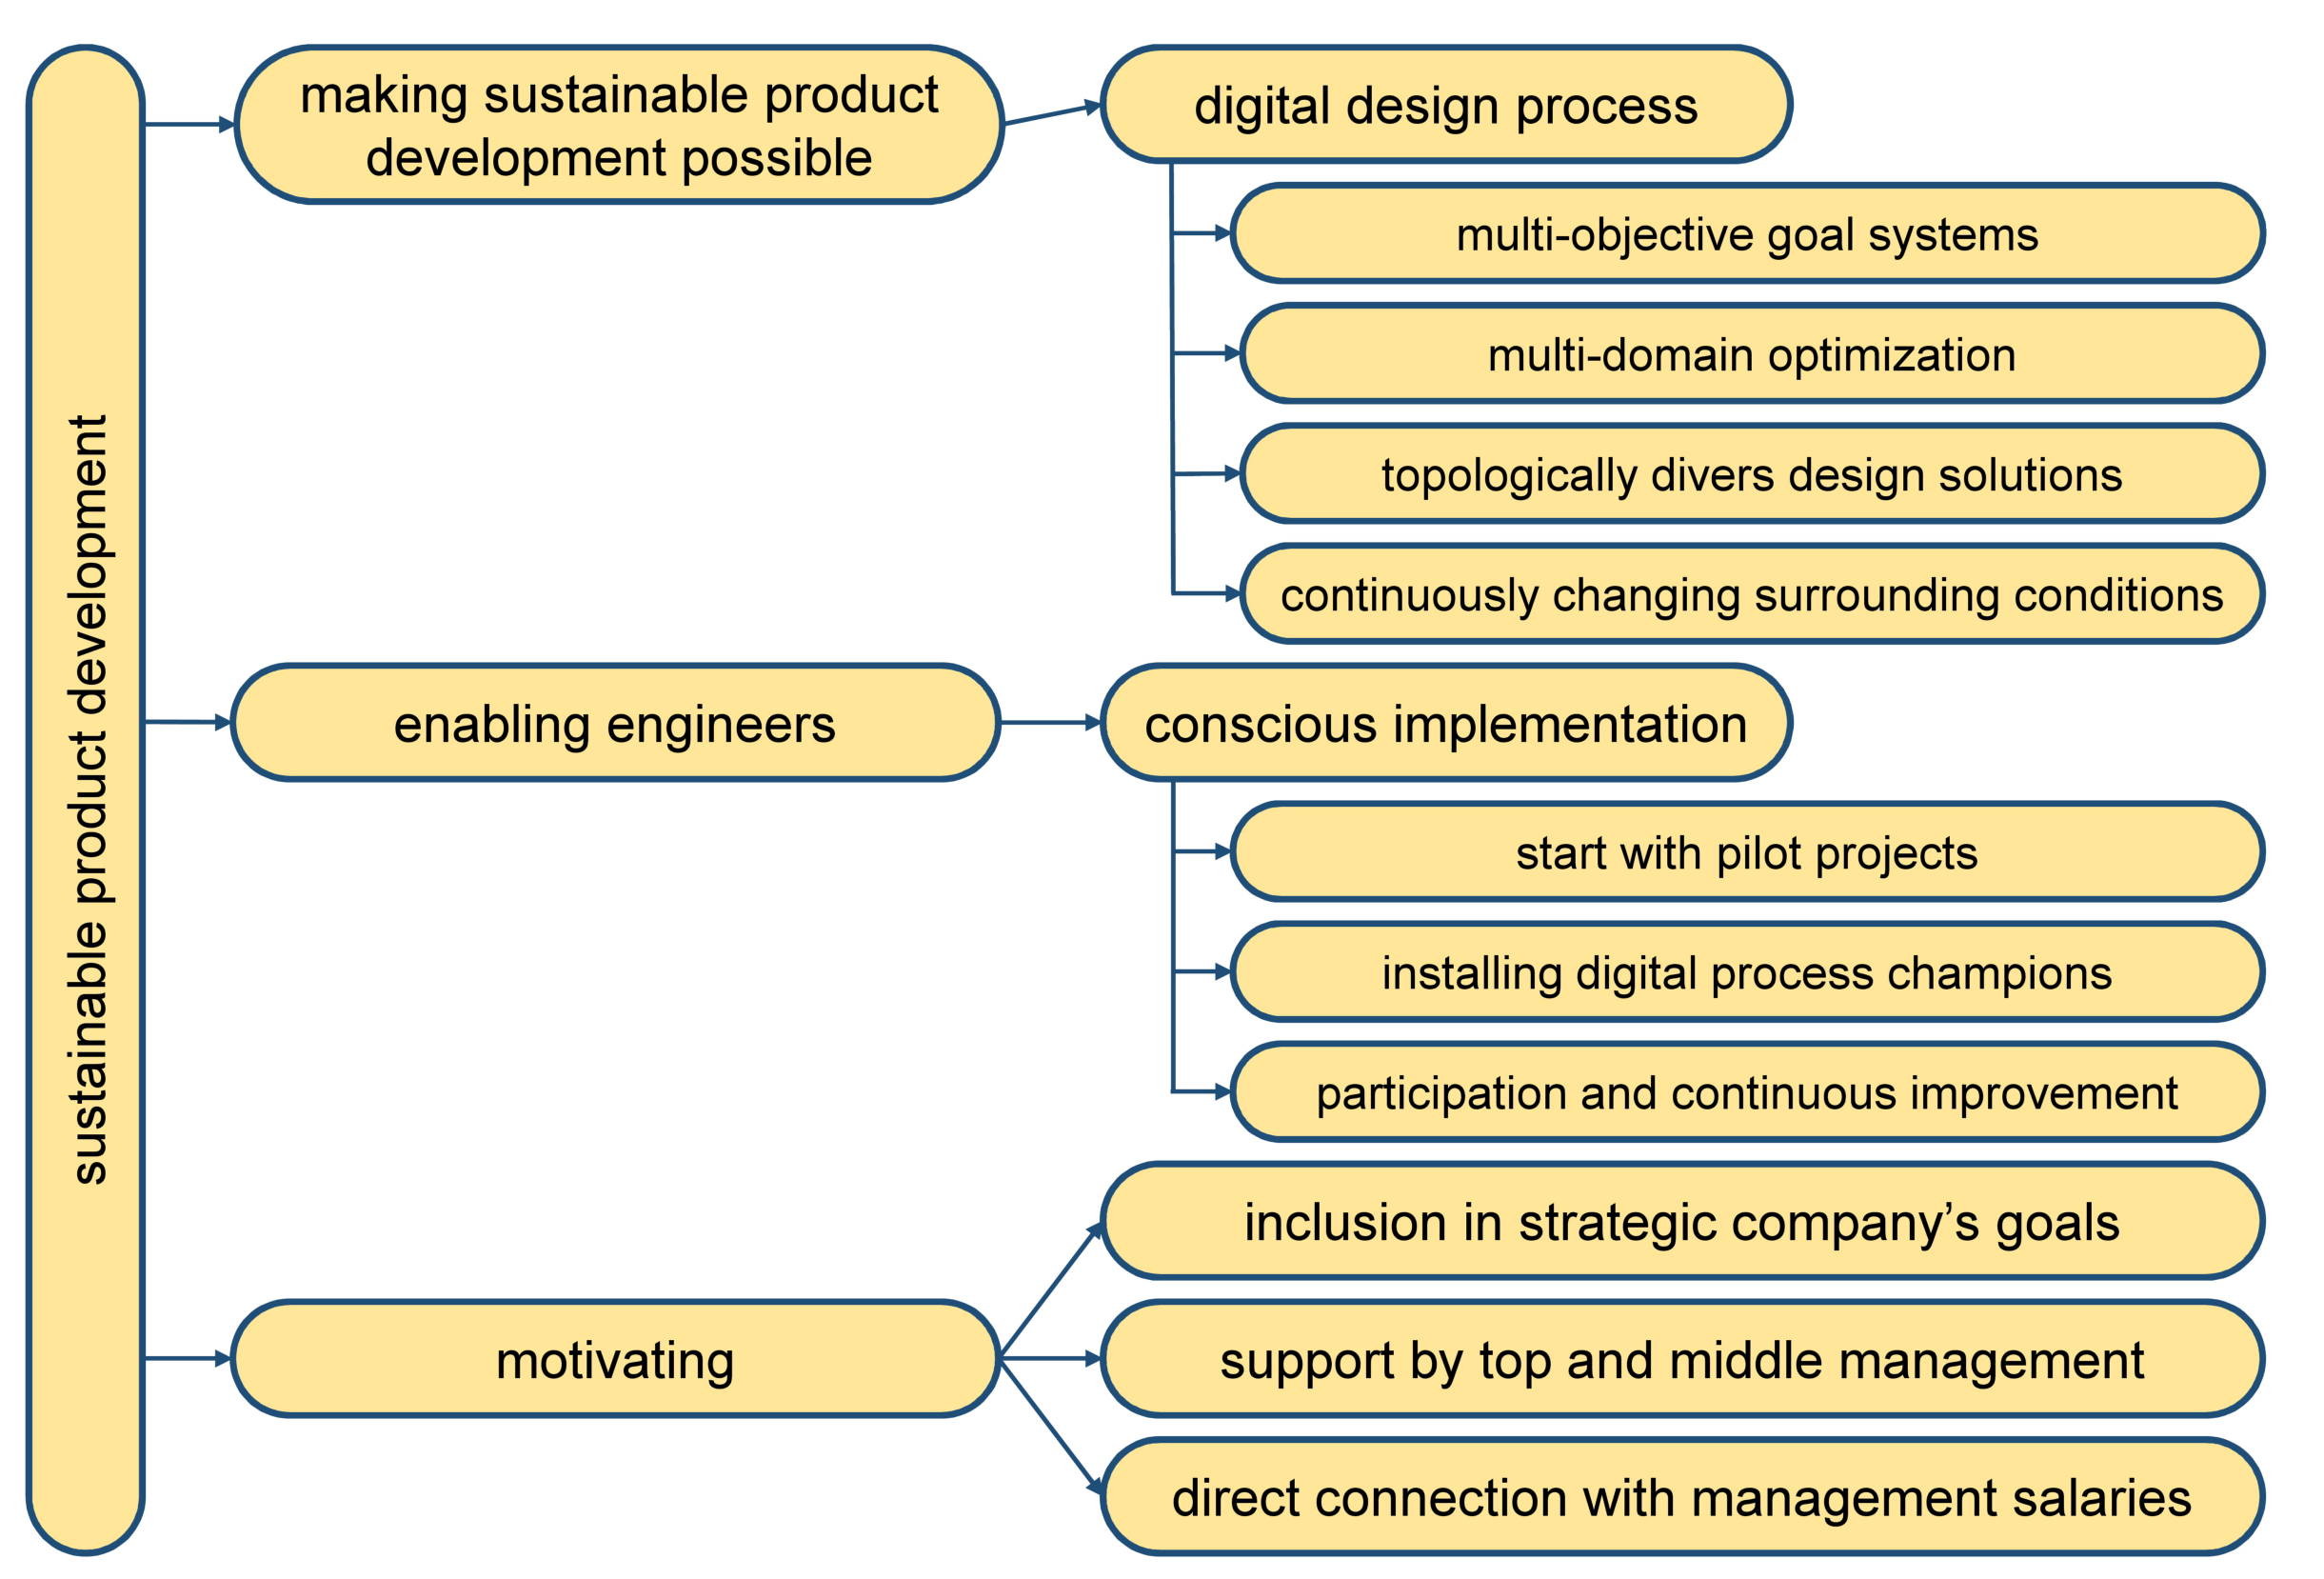
The basis for the digital development process is ontologies—a graph-based design language that uses these formal descriptions of the basic concepts and relationships, which defines the basic terms, concepts and relations for a certain area [46]. The main elements of a graph-based design language are the vocabulary (the components and sub-systems of the vehicle), the rules (descriptions of how these components can be combined) and the activities (the application of these rules). A design compiler can generate a design graph. From the design graph, the central data model, different kinds of models can be generated, such as geometry models in typical computer-aided design (CAD) formats, computer-aided engineering (CAE) models for simulating the stresses, deformations, motions, forces and moments of components of the vehicle and computer-aided manufacturing (CAM) models for the production of the components of the vehicle. These models in the different engineering domains represent the “classic” information flow in product development; the concept of graph-based design languages connects these models with synthesis and evaluation processes and the rationale behind certain design decisions. The central advantages of this kind of MBSE is that numerous, topologically diverse vehicle or vehicle subsystem configurations and be evaluated and that a multi-objective optimization is possible. In a sample application for a gear system for a two-wheel vehicle 13,892 valid geometrical variants could be generated, and the design optimum could be explored and a Pareto front (i.e., the set of all Pareto efficient solutions in multi-objective optimization) could be established [47]. Additionally, in the field of assembly planning, the processes could be improved by means of a multi-criteria evaluation of solution alternatives [48]. A holistic MBSE concept can also include abstract system description models such as requirement models [43], function models [49] and models describing abstract physics [50]. Due to this and the explicit formulation of vocabulary and rules, these holistic MBSE concepts also contribute to an intensified management of design, evaluation and decision knowledge [51]. Consequently, the combination of continuous sustainability management with digital processes, which allow the exploration of topological diverse product families and multi-objective optimization, is the main prerequisite for sustainable product development. However, a successful implementation of complex methods, tools and processes in industrial companies requires an in-depth consideration of additional aspects [52]. Additionally, Stark et al. [53] report that applying sustainability methods does not automatically lead to a more sustainable product, because, amongst others, of individual preferences and motivation of the stakeholders. The engineers in product development need to be enabled to realize sustainable solutions applying the respective processes. For all kinds of implementation processes, it was found to be advantageous to start with smaller pilot projects. They can lead to so-called quick-wins, i.e., immediate successes in terms of the intended goal—in terms of sustainability (frequently the term “low hanging fruits” is also used). Pilot projects allow engineers to get familiar with the novel digital processes and are helpful to convince people and to overcome barriers. They also help to enhance the processes and to ease their application. Three decades ago lightweight engineering was a major issue in the German automotive industry. In this time, dedicated weight “guardians” were installed in some companies, who had the sole responsibility to monitor the weight, which is the result of a current prognosis, of vehicles in product development. This concept may be extended to installing sustainability “guardians”, but more advantageous would be a connection to the enabling digital processes—the installation of digital processes champions. These can be specially trained engineers with high software skills, but also experienced engineers who are willing to accept the challenge and are trained “on the job” to master the digital processes and to continuously monitor the sustainability of the vehicles under development. In any case, the participation of all involved engineers and the realization of a continuous improvement cycle is of paramount importance. Another central prerequisite for successful sustainable product development is an inclusion in the strategic company’s goals. Most automotive companies have meanwhile included sustainability in their formulated objectives—it is nowadays more interesting how those objectives are operationalized within the organization. A key factor is continuous support, monitoring and control of sustainability aspects by top AND middle management. One main possibility for gaining this management attention would be a direct connection to the management salaries. Usually, members of the management have partly flexible compensation systems, which are frequently connected to the economic success of the company. This flexible part of the salary should also be connected with the fulfillment of the company’s overall sustainability objectives. Most probably, this would lead to high management attention and a continuous enabling of the necessary digital processes and the implementation steps. The implementation and motivation aspects listed above are summarized in Figure 24.
6. Conclusions and Outlook
The main intention of the paper was to elaborate on the different prerequisites for the sustainable product development of BEVs. One major prerequisite is the capability to perform holistic analyses, which are not compromised by certain conditions, such as the current fleet dominated by SUVs. In the presented analysis, the consequences of three car concepts (e-up, Microlino and fully-electric XL1), of two different drive-train topologies and three different battery sizes were clarified, leading to insights such as that energy savings up to 60.8% are theoretically possible. It was explained in detail how sustainability and usability aspects need to be combined and how societal aspects can influence the usage and perception of BEVs as well as the energy consumption in real-life transportation tasks. The influence of general speed limits and range and vehicle speed expectations was analyzed. A digital product development process was developed, which allows dealing with four major challenges: the necessity of multi-objective optimization, the necessity to enable multi-domain simulation, the necessity to explore topological diverse product families and the necessity to deal with continuously changing surrounding conditions. Future work will expand the investigations to other vehicle and topology types and will investigate concrete methods and tools for supporting the sustainable product development process. Similar investigations concerning hybrid electrical vehicles (HEV) would also be sensible.
In further studies, the balancing of LCGHG is to be detailed in order to reduce the aforementioned model limitations. Fields of work are both in the detailing of the vehicle simulation to simulate also real driving distances. This should include physical modeling of the vehicles to be simulated. The linearized LCGHG calculation models should be detailed step by step and, for example, take production processes into account. This in turn influences the product design process in product development and makes a holistic, well-thought-out and validated product development process for sustainable products necessary. In this paper, a digital process concept was described, but further research work concerning concrete methodical support is desirable.
Author Contributions
Conceptualization, V.G., B.R., R.S., M.T. and M.P.; methodology, B.R. and R.S.; analysis and simulation, V.G. and B.R.; writing—original draft preparation, V.G., B.R., R.S. and M.P.; writing—review and editing, B.R., R.S. and M.T. All authors have read and agreed to the published version of the manuscript.
Funding
This research received no external funding.
Institutional Review Board Statement
Not applicable.
Informed Consent Statement
Not applicable.
Data Availability Statement
Not applicable.
Conflicts of Interest
The authors declare no conflict of interest.
Abbreviations
The following abbreviations are used in this manuscript:
| AD | Axle-Drive |
| BEV | Battery Electric Vehicle |
| CAD | Computer Aided Design |
| CAE | Computer Aided Engineering |
| CAM | Computer Aided Manufacturing |
| CPMS | Cyber-physical mechatronic Systems |
| CV | Combustion engine Vehicle |
| GHG | GreenHouse Gas emissions |
| HEV | Hybrid Electric Vehicle |
| ICEV | Internal Combustion Engine Driven Vehicle |
| LCGHG | Life-Cycle GreenHouse Gas Emissions |
| MBSE | Model Based Systems Engineering |
| SUV | Sport Utility Vehicle |
| WHD | Wheel-Hub-Drive |
References
- World Commission on Environment and Development (WCED). Our Common Future; Oxford University Press: Oxford, UK, 1987. [Google Scholar]
- Arena, M.; Duque Ciceri, N.; Terzi, S.; Bengo, I.; Azzone, G.; Garetti, M. A state-of-the-art of industrial sustainability: Definitions, tools and metrics. Int. J. Prod. Lifecycle Manag. 2003, 4, 207–251. [Google Scholar] [CrossRef]
- Al-Buenain, A.; Al-Muhannadi, S.; Falamarzi, M.; Kutty, A.; Kucukvar, M.; Onat, N. The Adoption of Electric Vehicles in Qatar Can Contribute to Net Carbon Emission Reduction but Requires Strong Government Incentives. Vehicles 2021, 3, 618–635. [Google Scholar] [CrossRef]
- Reick, B.; Konzept, A.; Kaufmann, A.; Stetter, R.; Engelmann, D. Influence of Charging Losses on Energy Consumption and CO2 Emissions of Battery-Electric Vehicles. Vehicles 2021, 3, 736–748. [Google Scholar] [CrossRef]
- Konzept, A.; Reick, B.; Kaufmann, A.; Hermanutz, R.; Stetter, R. Battery Electric Vehicle Efficiency Test for Various Velocities. Vehicles 2022, 4, 60–73. [Google Scholar] [CrossRef]
- Bisenius, A.; Groß, J.; Hackmann, M.; Schenk, J.; Stanek, R. The CO2 footprint in the lifecycle of passenger cars. A comparison of hybrid, plug-in and electric vehicles with a detailed consideration of battery production and the country specific energy mix. In Proceedings of the 42th Internationale Wiener Motorensymposium, Virtual (online), Wien, Austria, 29–30 April 2021. [Google Scholar]
- Kairos. Umwelteffekte von Elektromobilität. In Kairos—Insitut für Wirkungsforschung und Entwicklung; Amt der Vorarlberger Landesregierung: Bregenz, Austria, 2017; pp. 1–13. [Google Scholar]
- Bieker, G. A global comparison of the life-cycle greenhouse gas emissions of combustion engine and electric passenger cars. Communications 2021, 49, 1–86. [Google Scholar]
- Transport Could Burn Up the EU’s Entire Carbon Budget. Available online: https://theicct.org/transport-could-burn-up-the-eus-entire-carbon-budget/ (accessed on 18 January 2022).
- Ernst, S.; Olschewski, I.; Eckstein, L. CO2-Emissionsreduktion bei PKW und Leichten Nutzfahrzeugen, Projektnummer 123320; Bundesministerium für Wirtschaft und Energie (BMWi): Berlin/Bonn, Germany, 2014. [Google Scholar]
- Auf Jedem Markt Europas sind SUVs die Top E-Autos: Ein Land ist die Ausnahme. Available online: https://efahrer.chip.de/news/auf-jeden-markt-europas-sind-suvs-die-top-e-autos-ein-land-ist-die-ausnahme_106554 (accessed on 18 January 2022).
- Bundesamt für Statistik; Bundesamt für Raumentwicklung. Verkehrsverhalten der Bevölkerung Ergebnisse des Mikrozensus Mobilität und Verkehr 2015; Neuchâtel and Bern: Neuchâtel, Switzerland, 2017; pp. 24–25, 30. [Google Scholar]
- Mobilität in Deutschland. Available online: https://www.bmvi.de/SharedDocs/DE/Anlage/G/mid-2017-kurzreport.pdf?__blob=publicationFile (accessed on 2 February 2022).
- United Nations. ECE/TRANS/180/Add.15/Amend.6 (Amendment 6 to United Nations Global Technical Regulation No. 15 (Worldwide harmonized Light vehicles Test Procedure)). 2021, pp. 31–85. Available online: https://unece.org/sites/default/files/2021-01/ECE-TRANS-180a15am6e.pdf (accessed on 29 January 2022).
- Mitschke, M.; Wallentowitz, H. Dynamik der Kraftfahrzeuge, 5th ed.; Springer Fachmedien Wiesbaden: Wiesbaden, Germany, 2014; pp. 11–16. [Google Scholar]
- Der XL1—Das Auto. Available online: https://web.archive.org/web/20140428014349/http://www.volkswagen-xl1.com/de/vision/aerodynamik (accessed on 6 February 2022).
- Der XL1—Flach wie ein Sportwagen. Available online: https://www.volkswagen-newsroom.com/de/der-xl1-3163/der-xl1-das-auto-3178 (accessed on 6 February 2022).
- Discover Microlino—Technik & Unterhalt. Available online: https://microlino-car.com/de/support/faq/service-maintenance (accessed on 6 February 2022).
- Charge Point Finder and Real Range Simulation. Available online: https://ecalc.ch/evcalc.php?ecalc&carmaker=m-cro&model=m-cro__microlino_-_14kwh_(2019) (accessed on 6 February 2022).
- Der e-up! Technik und Preise. Available online: https://www.volkswagen.de/idhub/content/dam/onehub_pkw/importers/de/besitzer-und-nutzer/hilfe-und-dialogcenter/downloads/produktbroschueren/up-12/up_katalog.pdf (accessed on 8 February 2022).
- Jelden, H.; Lück, P.; Kruse, G.; Tousen, J. Der Elektrische Antriebsbaukasten von Volkswagen. In Fahrerassistenzsysteme und Effiziente Antriebe; Springer Fachmedien Wiesbaden: Wiesbaden, Germany, 2015. [Google Scholar] [CrossRef]
- Luftgekühlter Radnabenmotor mit Hoher Drehmomentdichte auf Basis Gegossener Aluminiumspulen. Available online: https://www.elektromobilitaet.fraunhofer.de/de/antriebsstrang_fahrwerk/radnabenmotor.html (accessed on 31 January 2022).
- Zapf, M.; Pengg, H.; Bütler, T.; Bach, C.; Weindl, C. Kosteneffiziente und Nachhaltige Automobile, 2nd ed.; Springer: Wiesbaden, Germany, 2021. [Google Scholar]
- Hohe Reichweite und Schnelles Laden: Das Batteriesystem ist das Herz des Volkswagen ID.3, ID.4 und ID.4 GTX. Available online: https://www.volkswagenag.com/de/news/2021/05/long-range-and-rapid-charging.html (accessed on 3 February 2022).
- Studie zur Elektromobilität: Batterien Noch zu Schwer. Available online: https://www.automobilwoche.de/article/20160908/NACHRICHTEN/160909917/studie-zur-elektromobilitaet-batterien-noch-zu-schwer (accessed on 3 February 2022).
- Guo, N.; Zhang, X.; Zou, Y.; Du, G.; Wang, C.; Guo, L. Predictive Energy Management of Plug-in Hybrid Electric Vehicles by Real-time Optimization and Data-driven Calibration. IEEE Trans. Veh. Technol. 2021, 3–4. [Google Scholar] [CrossRef]
- Henseling, C.; Korte, F.; Göll, G. Nachhaltigkeit 2.0—Modernisierungsansätze zum Leitbild der nachhaltigen Entwicklung Diskurs “Wohlstands- und Entwicklungsmodelle” in TEXTE 92/2017 Umweltforschungsplan des Bundesministeriums für Umwelt, Naturschutz, Bau und Reaktorsicherheit Forschungskennzahl 3713 11 100 UBA-FB 002520/ANH,4. Available online: https://www.umweltbundesamt.de/sites/default/files/medien/1410/publikationen/2017-11-02_texte_92-2017_nachhaltigkeit-2-0_diskurs-wohlstand.pdf (accessed on 9 February 2022).
- Faria, J.R.; McAdam, P. The Green Golden Rule: Habit and Anticipation of Future Consumption in ECB Working Paper Series No 2247/February 2019. Available online: https://www.ecb.europa.eu/pub/pdf/scpwps/ecb.wp2247~72dc51ddd8.en.pdf (accessed on 9 February 2022).
- Liu, Y.; Jiao, R.; Zhao, L.; Liu, K. Impact of Greenization on the Marginal Utility of Intensity of Carbon Emissions and Factors Affecting it in China. Energy Eng. 2021, 118, 363–378. [Google Scholar] [CrossRef]
- Porsch, L.; Sutter, D.; Maibach, M.; Preiss, P.; Müller, W. Leitfaden zur Kosten-Nutzen-Abschätzung Umweltrelevanter Effekte in der Gesetzesfolgenabschätzung; Ecologic Institut, INFRAS, IER Universität Stuttgart: Dessau-Roßlau, Germany, 2014; ISSN 1862-4804. [Google Scholar]
- Pindyck, R.; Rubinfeld, D. Mikroökonomie, 7th ed.; Pearson: Munich, Germany, 2002; p. 139f. ISBN 978-3-8273-7282-6. [Google Scholar]
- Matthey, A.; Bünger, B. Methodenkonvention 3.0 zur Ermittlung von Umweltkosten Kostensätze Stand 02/2019—auf Grundlage der Ergebnisse des Forschungsprojekts “Methodenkonvention 3.0—Weiterentwicklung und Erweiterung der Methodenkonvention zur Schätzung von Umweltkosten”. Available online: https://www.umweltbundesamt.de/sites/default/files/medien/1410/publikationen/2019-02-11_methodenkonvention-3-0_kostensaetze_korr.pdf (accessed on 10 February 2022).
- Pulm, U.; Stetter, R. Systemic mechatronic function development. Proc. Des. Soc. 2021, 1, 2931–2940. [Google Scholar] [CrossRef]
- Walden, D.D.; Roedler, G.J.; Forsberg, K.; Hamelin, R.D.; Shortell, T.M. Systems Engineering Handbook: A Guide for System Life Cycle Processes and Activities, 4th ed.; Wiley: Hoboken, NJ, USA, 2015. [Google Scholar]
- Eckert, C.; Albers, A.; Bursac, N.; Chen, H.X.; Clarkson, J.; Gericke, K.; Gladysz, B.; Maier, J.; Rachenkova, G.; Shapiro, D.; et al. Integrated product and process models: Towards an integrated framework and review. In Proceedings of the ICED 2015, Milan, Italy, 27–30 July 2015. [Google Scholar]
- Eisenbart, B.; Gericke, K.; Blessing, L.T.; McAloone, T.C. A DSM-based framework for integrated function modelling: Concept, application and evaluation. Res. Eng. Des. 2017, 28, 25–51. [Google Scholar] [CrossRef] [Green Version]
- VDI/VDE 2206 Entwurf. Entwicklung Cyber-Physischer Mechatronischer Systeme (CPMS); Beuth: Berlin, Germany, 2020. [Google Scholar]
- Gräßler, I.; Hentze, J. The new V-Model of VDI 2206 and its validation. at-Automatisierungstechnik 2020, 68, 312–324. [Google Scholar] [CrossRef]
- Shaked, A.; Reich, Y. Using Domain-Specific Models to Facilitate Model-Based Systems-Engineering: Development Process Design Modeling with OPM and PROVE. Appl. Sci. 2021, 11, 1532. [Google Scholar] [CrossRef]
- Lu, J.; Chen, D.; Wang, G.; Kiritsis, D.; Törngren, M. Model-Based Systems Engineering Tool-Chain for Automated Parameter Value Selection. IEEE Trans. Syst. Man Cybern. Syst. 2021, 52, 2333–2347. [Google Scholar] [CrossRef]
- Laing, C.; David, P.; Blanco, E.; Dorel, X. Questioning integration of verification in model-based systems engineering: An industrial perspective. Comput. Ind. 2020, 114, 103163. [Google Scholar] [CrossRef]
- Gräßler, I.; Ole, C.; Scholle, P. Method for Systematic Assessment of Requirement Change Risk in Industrial Practice. Appl. Sci. 2020, 10, 8697. [Google Scholar] [CrossRef]
- Holder, K.; Zech, A.; Ramsaier, M.; Stetter, R.; Niedermeier, H.P.; Rudolph, S.; Till, M. Model-based requirements management in gear systems design based on graph-based design languages. Appl. Sci. 2017, 7, 1112. [Google Scholar] [CrossRef] [Green Version]
- Rudolph, S. Übertragung von Ähnlichkeitsbegriffen; Universität Stuttgart: Habilitationsschrift, Germany, 2002. [Google Scholar]
- IILS mbH Design Compiler 43. Available online: https://www.iils.de (accessed on 10 January 2022).
- Reichwein, A. Application-Specific UML Profiles for Multidisciplinary Product Data Integration; Universität Stuttgart: Stuttgart, Germany, 2011. [Google Scholar]
- Holder, K.; Schumacher, S.; Friedrich, M.; Till, M.; Stetter, R.; Fichter, W.; Rudolph, S. Digital Development Process for the Drive System of a Balanced Two-Wheel Scooter. Vehicles 2021, 3, 33–60. [Google Scholar] [CrossRef]
- Breckle, T. Digitale Intervallbasierte Planung und Bewertung Manueller Montagesysteme in der Konzeptplanungsphase; Shaker: Aachen, Germany, 2021. [Google Scholar]
- Ramsaier, M.; Holder, K.; Zech, A.; Stetter, R.; Rudolph, S.; Till, M. Digital representation of product functions in multicopter design. In Proceedings of the DS 87-1 21st International Conference on Engineering Design (ICED 17) Vol 1: Resource Sensitive Design, Design Research Applications and Case Studies, Vancouver, BC, Canada, 21–25 August 2017; pp. 369–378. [Google Scholar]
- Stetter, R. Approaches for Modelling the Physical Behavior of Technical Systems on the Example of Wind Turbines. Energies 2020, 13, 2087. [Google Scholar] [CrossRef]
- Vogel, S. Über Ordnungsmechanismen im Wissensbasierten Entwurf von SCR-Systemen. Ph.D. Thesis, Universität Stuttgart, Stuttgart, Germany, 2016. [Google Scholar]
- Stetter, R. Fault-Tolerant Design and Control of Automated Vehicles and Processes. Insights for the Synthesis of Intelligent Systems; Springer: Cham, Switzerland, 2020. [Google Scholar]
- Stark, R.; Buchert, T.; Neugebauer, S.; Bonvoisin, J.; Finkbeiner, M. Benefits and obstacles of sustainable product development methods: A case study in the field of urban mobility. Des. Sci. 2017, 3, E17. [Google Scholar] [CrossRef] [Green Version]
Figure 1.
Research framework.

Figure 2.
Velocity in the WLTC class 3b over distance driven from [4].
Figure 2.
Velocity in the WLTC class 3b over distance driven from [4].


Figure 4.
Axle drive (left) and wheel-hub drive (right).

Figure 5.
Compared Vehicles (attribution for (b): Micro Mobility Systems, CC BY-SA 4.0).

Figure 6.
Electric motor efficiency map of the VW e-up according to [21].
Figure 6.
Electric motor efficiency map of the VW e-up according to [21].

Figure 7.
Electric motor efficiency map for a wheel-hub drive according to [22].
Figure 7.
Electric motor efficiency map for a wheel-hub drive according to [22].

Figure 8.
Efficiency map from the optimization.

Figure 9.
Alignment measurement and simulation.

Figure 10.
Adapted WLTCs for class 3a and class 3b vehicles.

Figure 11.
LCGHG comparison of an average EU ICEV and an average BEV in the year 2021 according to [8].
Figure 11.
LCGHG comparison of an average EU ICEV and an average BEV in the year 2021 according to [8].

Figure 12.
Vehicle range—energy consumption for VW e-up (2019).

Figure 13.
Vehicle range—energy consumption for all vehicles using axial drive, = 130 km/h.

Figure 14.
Difference in energy consumption in all vehicles for different drives and top speeds.

Figure 15.
Energy consumption for all vehicles for different drives and top speeds with a battery capacity of 32 kWh.
Figure 15.
Energy consumption for all vehicles for different drives and top speeds with a battery capacity of 32 kWh.

Figure 16.
LCGHG simulation results of the e-up motor.

Figure 17.
LCGHG simulation results of the XL1.

Figure 18.
LCGHG simulation results of the Microlino.

Figure 19.
Range based utility at 90 km with range utility and marginal range utility (Weibull Distribution with and ).
Figure 19.
Range based utility at 90 km with range utility and marginal range utility (Weibull Distribution with and ).

Figure 20.
Utility cost per km driven and per km range added for the 90 km/h maximum speed scenario, marginal utility: Weibull with maximum at 100 km (urban use case).
Figure 20.
Utility cost per km driven and per km range added for the 90 km/h maximum speed scenario, marginal utility: Weibull with maximum at 100 km (urban use case).

Figure 21.
Utility cost per km driven for each km/h of speed added for the 500 km range scenario, marginal utility: Weibull with maximum at 90 km/h (urban use case).
Figure 21.
Utility cost per km driven for each km/h of speed added for the 500 km range scenario, marginal utility: Weibull with maximum at 90 km/h (urban use case).

Figure 22.
V-model for sustainable development.

Figure 23.
Conceptof graph-based design languages.

Figure 24.
Aspects of the realization of sustainable product development.


Table 1.
Life-cycle analysis scopes.
| Vehicle Manufacture | Energy Production | Use | Recycling |
|---|---|---|---|
| ⇒ Well-to-tank ⇒ | ⇒ Tank-to-wheel ⇒ | ||
| ========⇒ Well-to-wheel ========⇒ | |||
| ======================⇒ Cradle to grave ======================⇒ | |||
Table 2.
Determined driving resistance parameters.
| Tire Type | |||
|---|---|---|---|
| SR | 0.005 | 0.00001 | 0.0045 |
Table 3.
Compared vehicles.
| Variable | Symbol | Unit | Vehicle 1 | Vehicle 2 | Vehicle 3 |
|---|---|---|---|---|---|
| vehicle type | - | - | battery | battery | hybrid |
| electric | electric | electric | |||
| model line | - | - | e-up | Microlino | XL1 |
| manufacturer | - | - | Volkswagen | Micro Mobility | Volkswagen |
| Systems | |||||
| year of production | - | - | 2019 | 2021 | 2013 |
| number of seats | - | - | 4 | 2 | 2 |
| air drag coefficient | - | 0.308 [5] | - ** | 0.189 [16] | |
| projected cross | |||||
| sectional area | A | m | 2.07 [5] | - ** | 1.50 [17] |
| - | m | 0.6376 | 0.43 ** | 0.2835 | |
| curb weight * | kg | 1360 [5] | 513 [18] | 795 [16] | |
| dynamic rolling radius | m | 0.29 *** | 0.27 *** | 0.28 *** |
Publisher’s Note: MDPI stays neutral with regard to jurisdictional claims in published maps and institutional affiliations. |
© 2022 by the authors. Licensee MDPI, Basel, Switzerland. This article is an open access article distributed under the terms and conditions of the Creative Commons Attribution (CC BY) license (https://creativecommons.org/licenses/by/4.0/).
Share and Cite
MDPI and ACS Style
Glönkler, V.; Reick, B.; Stetter, R.; Till, M.; Pfeil, M. A Contribution to Sustainable Product Development Using the Example of Battery Electric Vehicles. Sustainability 2022, 14, 3729. https://0-doi-org.brum.beds.ac.uk/10.3390/su14073729
AMA Style
Glönkler V, Reick B, Stetter R, Till M, Pfeil M. A Contribution to Sustainable Product Development Using the Example of Battery Electric Vehicles. Sustainability. 2022; 14(7):3729. https://0-doi-org.brum.beds.ac.uk/10.3390/su14073729
Chicago/Turabian StyleGlönkler, Vivien, Benedikt Reick, Ralf Stetter, Markus Till, and Markus Pfeil. 2022. "A Contribution to Sustainable Product Development Using the Example of Battery Electric Vehicles" Sustainability 14, no. 7: 3729. https://0-doi-org.brum.beds.ac.uk/10.3390/su14073729
Note that from the first issue of 2016, this journal uses article numbers instead of page numbers. See further details here.