
Urban Flood-Risk Assessment: Integration of Decision-Making and Machine Learning
by
 , , ,
, , ,
Fereshteh Taromideh
1 ,
,
Ramin Fazloula
1,* ,
,
Bahram Choubin
2,
Alireza Emadi
1 and
Ronny Berndtsson
3,* 1
Department of Water Engineering, Sari Agricultural Sciences and Natural Resources University, Sari 48181-68984, Iran
2
Soil Conservation and Watershed Management Research Department, West Azarbaijan Agricultural and Natural Resources Research and Education Center, AREEO, Urmia 57169-63963, Iran
3
Centre for Advanced Middle Eastern Studies and Division of Water Resources Engineering, Lund University, P.O. Box 118, SE-221 00 Lund, Sweden
*
Authors to whom correspondence should be addressed.
Sustainability 2022, 14(8), 4483; https://0-doi-org.brum.beds.ac.uk/10.3390/su14084483
Submission received: 28 February 2022
/
Revised: 5 April 2022
/
Accepted: 6 April 2022
/
Published: 9 April 2022
(This article belongs to the Special Issue Artificial Intelligence Pathway for Environmental Sustainability: Monitoring, Modeling, and Decision Making)
Abstract
:Urban flood-risk mapping is an important tool for the mitigation of flooding in view of continuing urbanization and climate change. However, many developing countries lack sufficiently detailed data to produce reliable risk maps with existing methods. Thus, improved methods are needed that can help managers and decision makers to combine existing data with more soft semi-subjective data, such as citizen observations of flood-prone and vulnerable areas in view of existing settlements. Thus, we present an innovative approach using the semi-subjective Analytic Hierarchy Process (AHP), which integrates both subjective and objective assessments, to help organize the problem framework. This approach involves measuring the consistency of decision makers’ judgments, generating pairwise comparisons for choosing a solution, and considering criteria and sub-criteria to evaluate possible options. An urban flood-risk map was created according to the vulnerabilities and hazards of different urban areas using classification and regression-tree models, and the map can serve both as a first stage in advancing flood-risk mitigation approaches and in allocating warning and forecasting systems. The findings show that machine-learning methods are efficient in urban flood zoning. Using the city Rasht in Iran, it is shown that distance to rivers, urban drainage density, and distance to vulnerable areas are the most significant parameters that influence flood hazards. Similarly, for urban flood vulnerability, population density, land use, dwelling quality, household income, distance to cultural heritage, and distance to medical centers and hospitals are the most important factors. The integrated technique for both objective and semi-subjective data as outlined in the present study shows credible results that can be obtained without complicated modeling and costly field surveys. The proposed method is especially helpful in areas with little data to describe and display flood hazards to managers and decision makers.
1. Introduction
Among natural disasters, flooding is one of the most destructive hazards causing severe economic damage, and climate change is expected to increase its severity in many parts of the world [1,2]. Population growth, industrial expansion, and lack of space for construction, especially in metropolitan areas, have caused drastic changes in the morphologies of urban watersheds and increased the flooding in urban areas and risks of losses of human lives and properties. From 1998 to 2017, more than two billion people were affected by flooding throughout the world [3]. Iran has been severely affected by flooding in recent years [4]. For instance, in March 2019, at least 28 out of 31 provinces of Iran were affected by heavy floods for two weeks, causing infrastructure destructions of more than USD 3.5 billion [5,6]. Due to the highly destructive impacts of floods, there is a great need for improved flood-risk mapping. However, the scarcity of available hydrological and land-use data causes difficulties in managing flooding, especially in developing countries [7,8].
Common practices to evaluate urban flood risks involve hydrological and hydraulic parameterization methods to approximate flow and water levels at observation stations [9,10,11,12,13]. Lacking observations of rainfall and runoff increases the uncertainties and errors of these estimates [9]. Recent studies indicated that flood-risk assessment requires more research than an assessment of hydrological processes only. This is partly due to the fact that urban areas are not homogeneous in terms of socioeconomic conditions [9,12,14]. Floods have the most negative effects on vulnerable parts of the urban population [15]. To deal with this problem, an indirect method using multi-criteria decision-making (MCDM) has been proposed [16,17]. The analytic hierarchy process (AHP) is a kind of MCDM that has recently been employed in flood studies [18,19] that integrates subjective and objective assessments into one framework. This approach involves measuring the consistency of decision makers’ judgments, generating pairwise comparisons for choosing a single solution, and considering criteria and sub-criteria to evaluate options [16,18].
Recently, machine-learning (ML) methods [20,21,22,23]) have been applied to flooding issues. Moreover, ML can be used to assess the risks that are not exclusively caused by hydraulic factors [24,25]. Accordingly, recent studies have benefited from ML approaches to estimate flood hazards using, e.g., classification and regression trees (CARTs) [26], random forests (RFs) [27], boosted regression trees (BRTs) [28], multivariate adaptive regression splines (MARSs) [29,30], multivariate discriminant analyses (MDAs) [31], and support vector machines (SVMs) [27,32,33]. Due to the complexity of flood-risk assessment, ML models offer specific advantages, e.g., the CART model appears to perform well for heterogeneous data with a high non-linearity. Additionally, it can handle outliers [34,35]. The RF method performs predictions by taking the mean of the outputs from various trees [36,37,38]. The BRT method can handle different predictor variables [39,40]. The MARS method is more flexible than linear-regression models, and it is easy to interpret [29]. MDA is derived from a linear combination of several variables that are best at differentiating between pre-determined independent categories [31]. The advantages of SVMs involve being effective in cases where the number of dimensions is greater than the number of samples, being effective in highly dimensional spaces and being memory-efficient because it uses a subset of training points in the decision function that are called support vectors [41].
In view of the above, there is a need to explore alternative methods for flood-risk estimation due to the heterogeneous vulnerability of urban infrastructures and inhabitants. Thus, the objective of this study is not to assess traditional flood risks with hydrology and hydraulic factors but to identify flood risks using vulnerability and hazard indicators. The traditional approach to preparing flood-risk maps is to use engineering methods with hydrological and hydraulic calculations, the probabilities of precipitation and runoff, and water inflow–outflow relationships with water-level estimations. A novel approach is suggested that can be advantageous for, e.g., developing countries, where data are lacking or uncertainties and errors need to be combined with subjective observations. Since risk is a function of hazard and vulnerability [42], the integration of efficient methods for assessing both these items is needed. This is the main objective of this research. The partial objectives are to compare ML models, such as CART, RFs, BRT, MDA, MARS, and SVMs, to create an urban flood-risk map by identifying the most important indicators for hazards of and vulnerability to flooding. The resulting flood-risk map should have the potential to be used as a decision-making tool for flood managers and urban decision makers.
2. Materials and Methods
2.1. Study Area
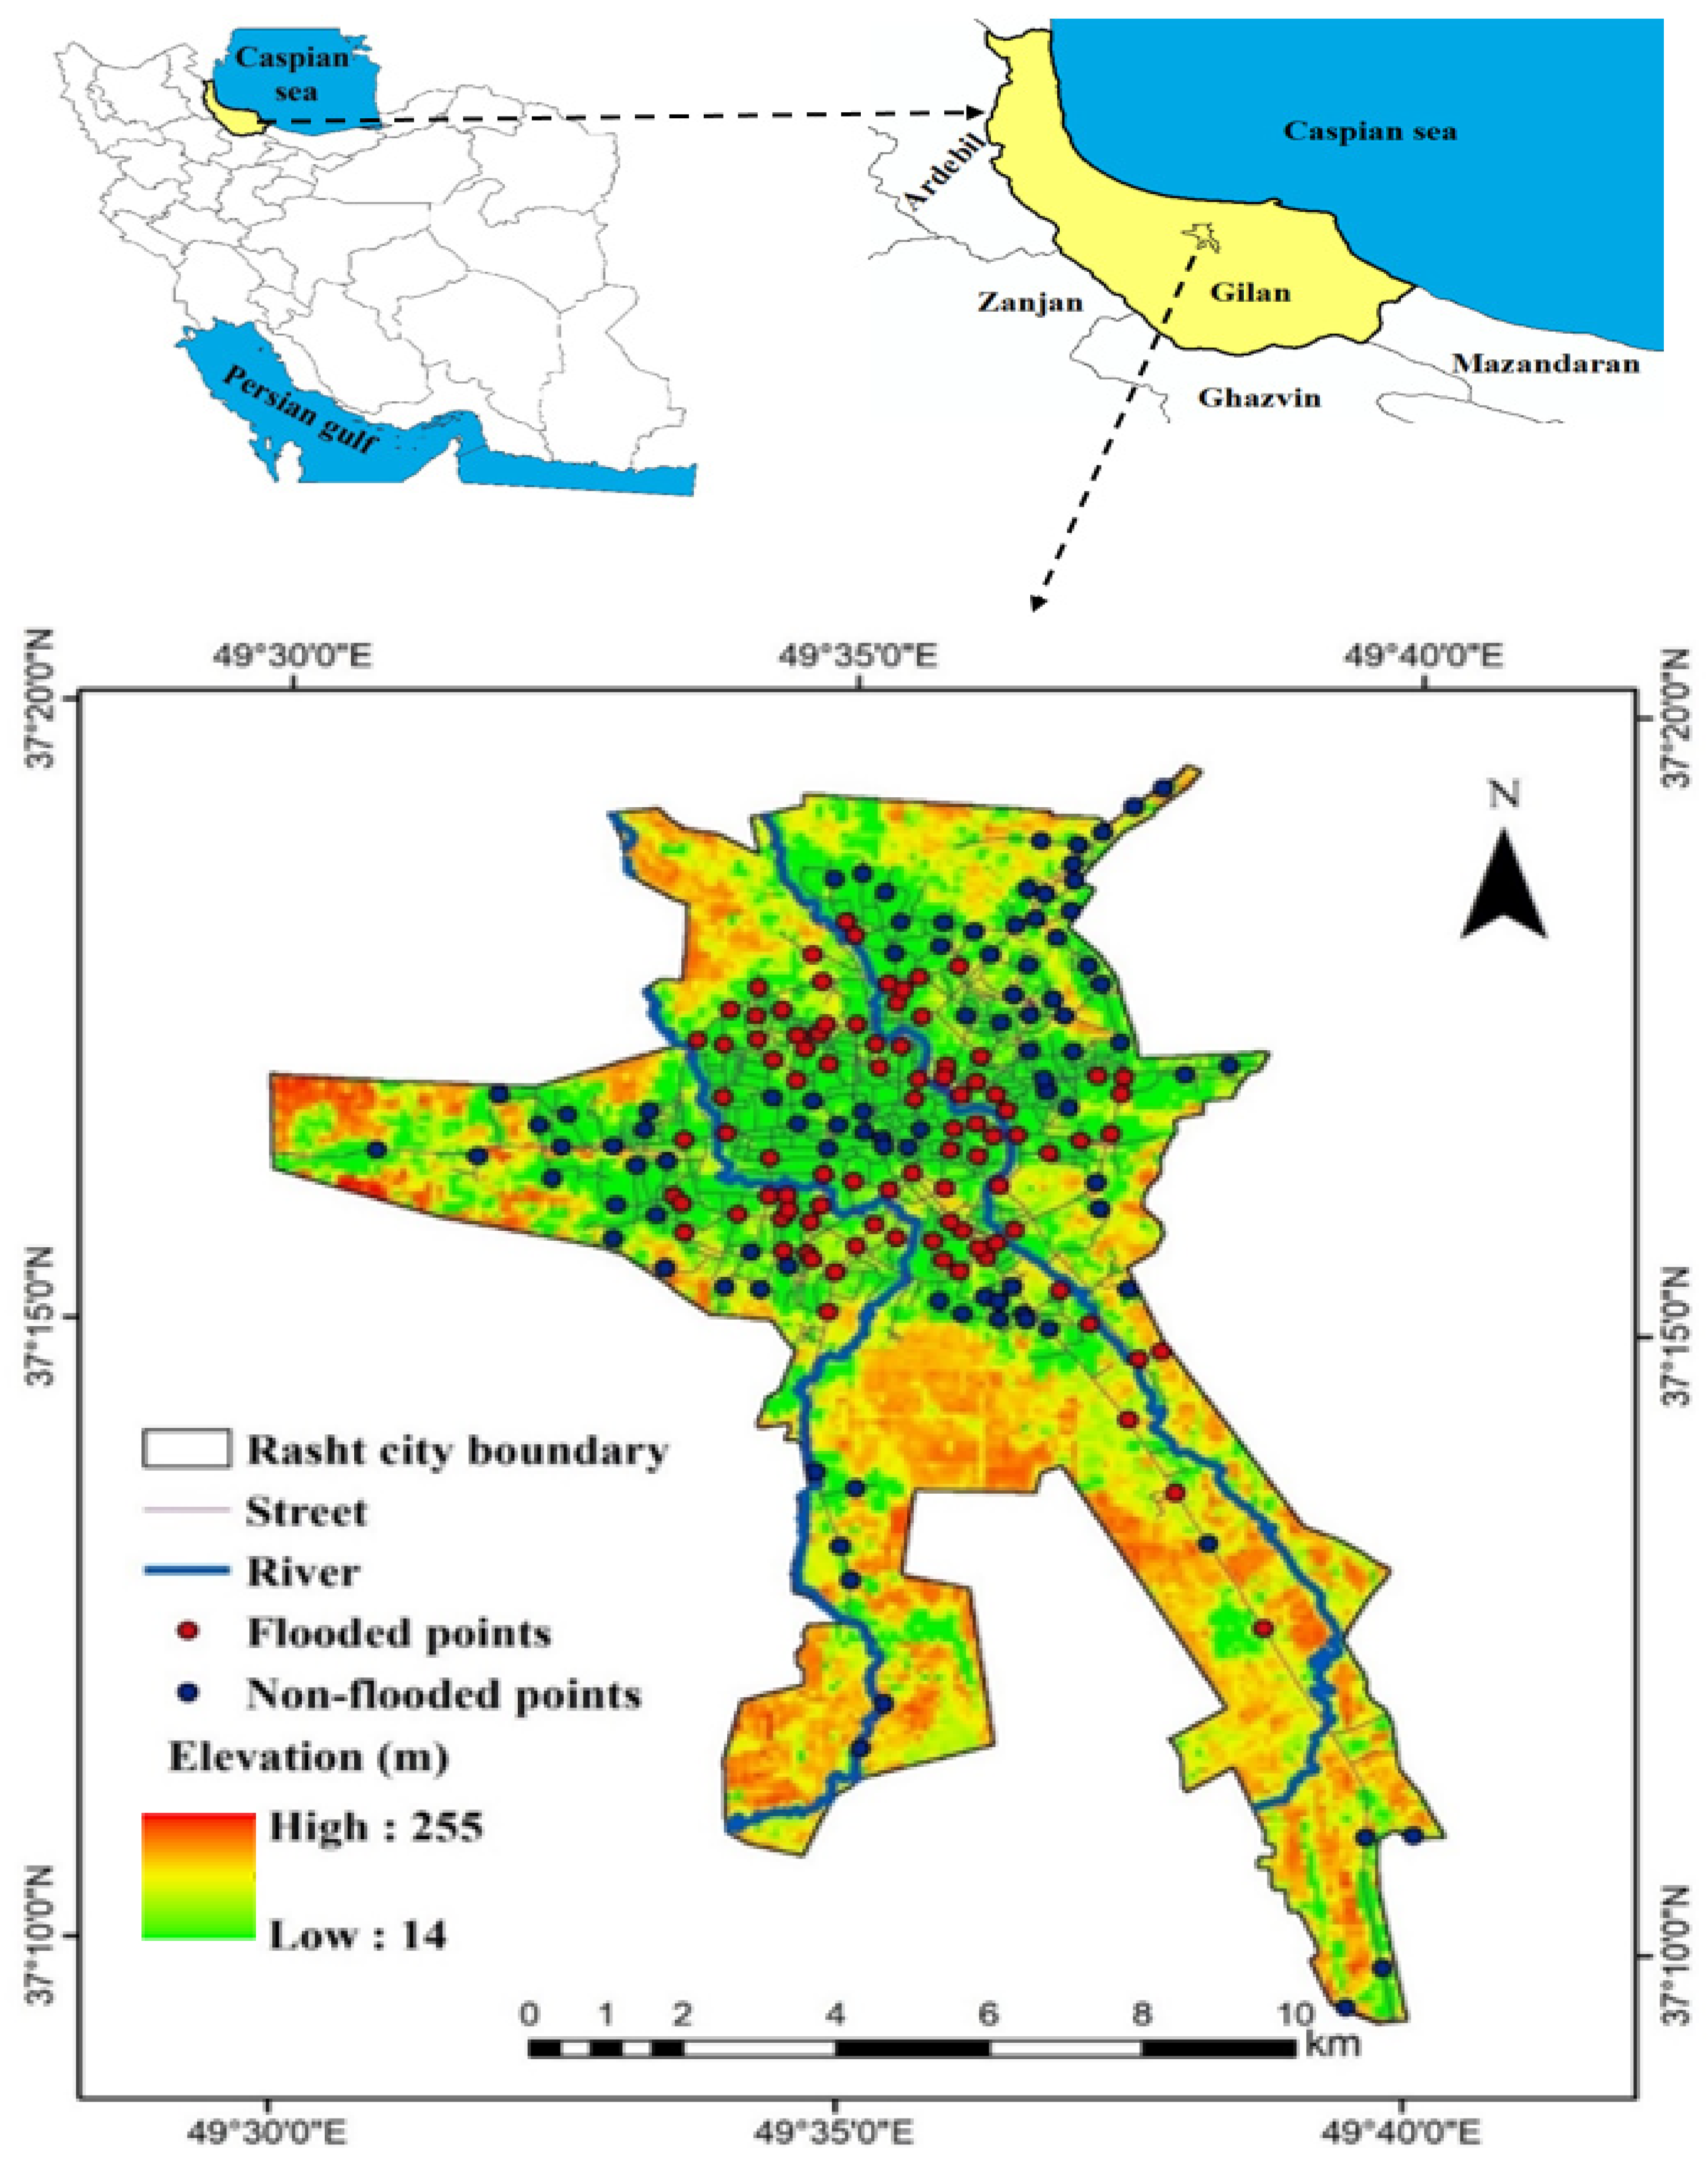
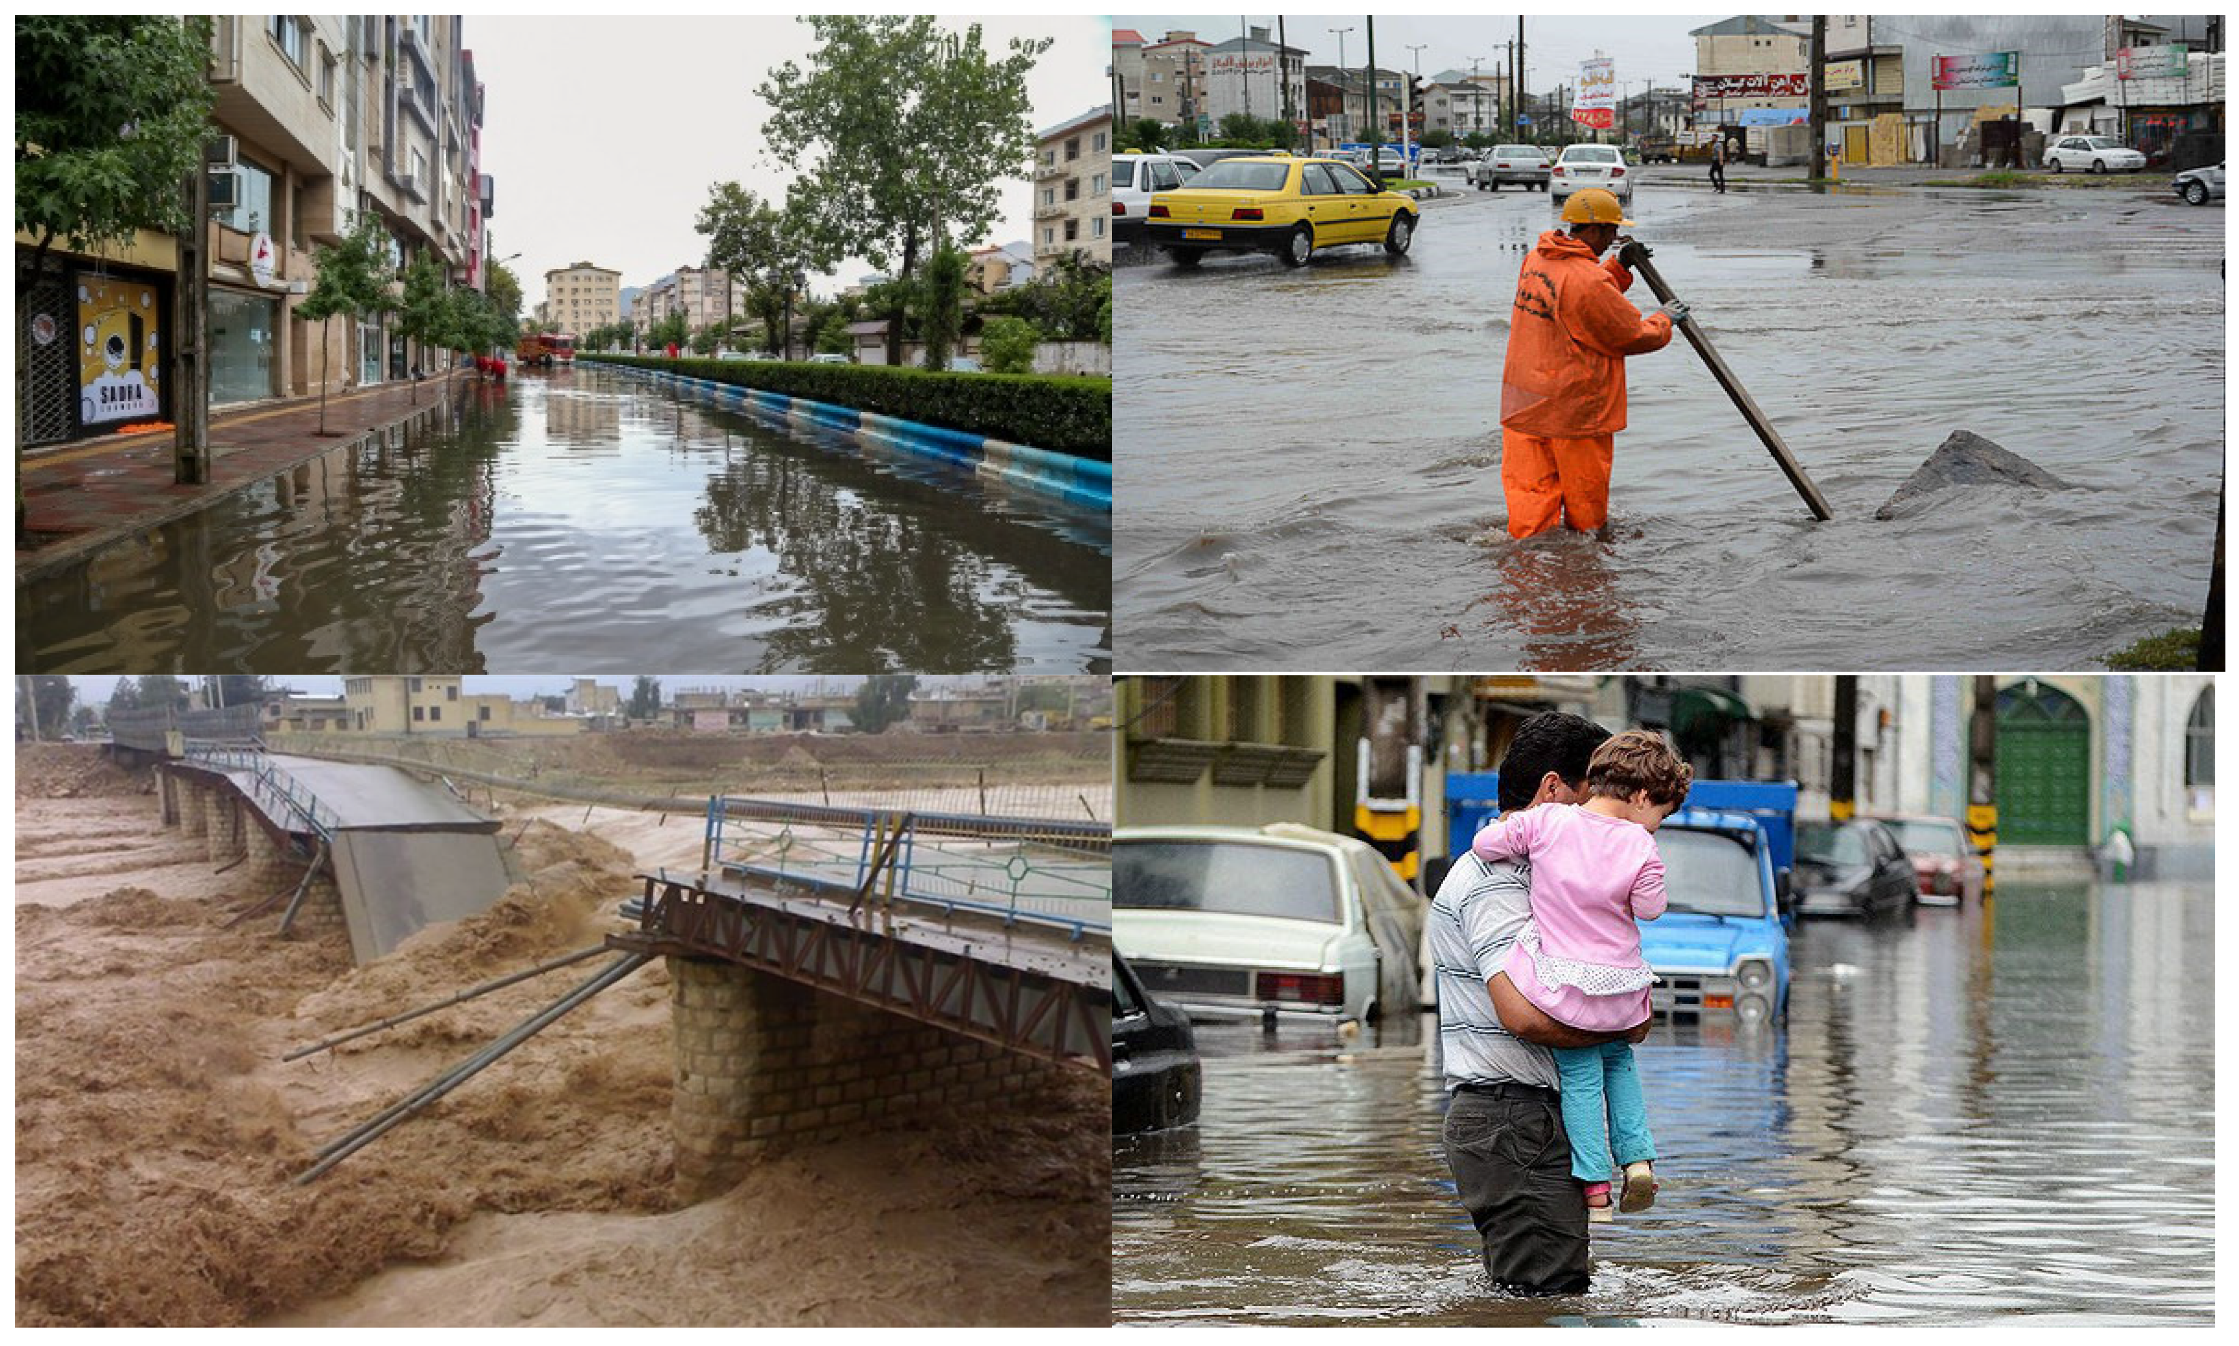
Rasht is one of the largest cities in Gilan Province in Northern Iran. It has an area of about 95 km2 and is located between longitude 49°27′42″ and 49°55′18″ east and latitude 37°00′30″ and 37°27′20″ north (Figure 1). The elevation varies between 14 and 255 m above mean sea level. It has a long coast to the Caspian Sea, with a population of about 632,000 persons [43]. The region has a Mediterranean climate with average annual precipitation and temperature of about 1337 mm and 10 °C, respectively (2000–2019). The Gohar and Zarjoub Rivers pass through Rasht from south to north and then discharge into the Anzali Lagoon [44]. Due to the climatic conditions with heavy and sudden rainfall, the city is exposed to frequent and severe flooding because of improper drainage, impermeable areas, and continuing decline of vegetated surfaces [45]. Destructive floods (Figure 2) that occurred on 25 March 2019 and 2 April 2019 (with peak flows of 132 and 169.4 m3/s, respectively) caused widespread damage to infrastructure, bridges, roads, and dwellings [6].
2.2. Urban Flood Observations
In total, data from 93 flooded observation points from 2009 to 2020 were used from the regional water company of Gilan Province and combined with field surveys. In addition, 93 non-flooded points were randomly chosen using ArcGIS 10.7 (Figure 1). The locations of flooded sites indicated which urban areas in Rasht are vulnerable to flooding.
2.3. Urban Flood Vulnerability
The vulnerability map shows susceptibility to the destructive impact of high water levels. In other words, it represents society’s sensitivity to flooding with potentially negative environmental, social, and economic effects [46]. Population density (PD), dwelling quality (DQ), household income (HI), distance to cultural heritage (DTCH), distance to medical centers and hospitals (DTMCH), and land use were selected as indicators or factors for vulnerability assessments of the urban flooding (Table 1 and Figure 3a–f). Questionnaires based on the analytical hierarchy process (AHP) were prepared to evaluate the urban flood vulnerability according to experts’ knowledge. The number of experts was 40 people and included Ph.D. students, faculty members, and executive experts of the regional water company of Gilan Province, Gilan Roads and Urban Development Office, Management and Planning Organization of Gilan, and Rasht City Authority. The AHP method applies a hierarchical structure to indicate a problem with users’ judgments to develop priorities for alternatives [47]. This method is performed in five steps [48] (Yalcin, 2008): (i) division of the problem into component parameters, (ii) development of the hierarchy, (iii) development of a paired comparison matrix according to subjective judgments as described by Bidwai et al. [49], (IV) estimation of the relative weights of factors, and (V) assessment of inconsistencies in the subjective judgments. For more details on AHP, see Bidwai et al. [49] and Danumah et al. [19]. All allocated scores by experts were examined according to an inconsistency ratio of less than 0.1 on the Saaty scale [47]. Subjective judgments were analyzed using SuperDecisions and AHP [19,49].
After computing the weights of layers by using the AHP model, pixel values of every layer were normalized according to the membership function (MF). Then the flood-vulnerability map (FV) was created based on the raster-calculator tools in ArcGIS 10.7, according to:
where FV is flood vulnerability, is the weight of variable calculated by AHP, is the normalized layer of variable i, and n is the number of variables. Data for vulnerability factors were collected from the National Statistics Center of Iran, Gilan Roads and Urban Development Office, the Management and Planning Organization of Gilan, and Rasht City Authority from 2016 to 2019.
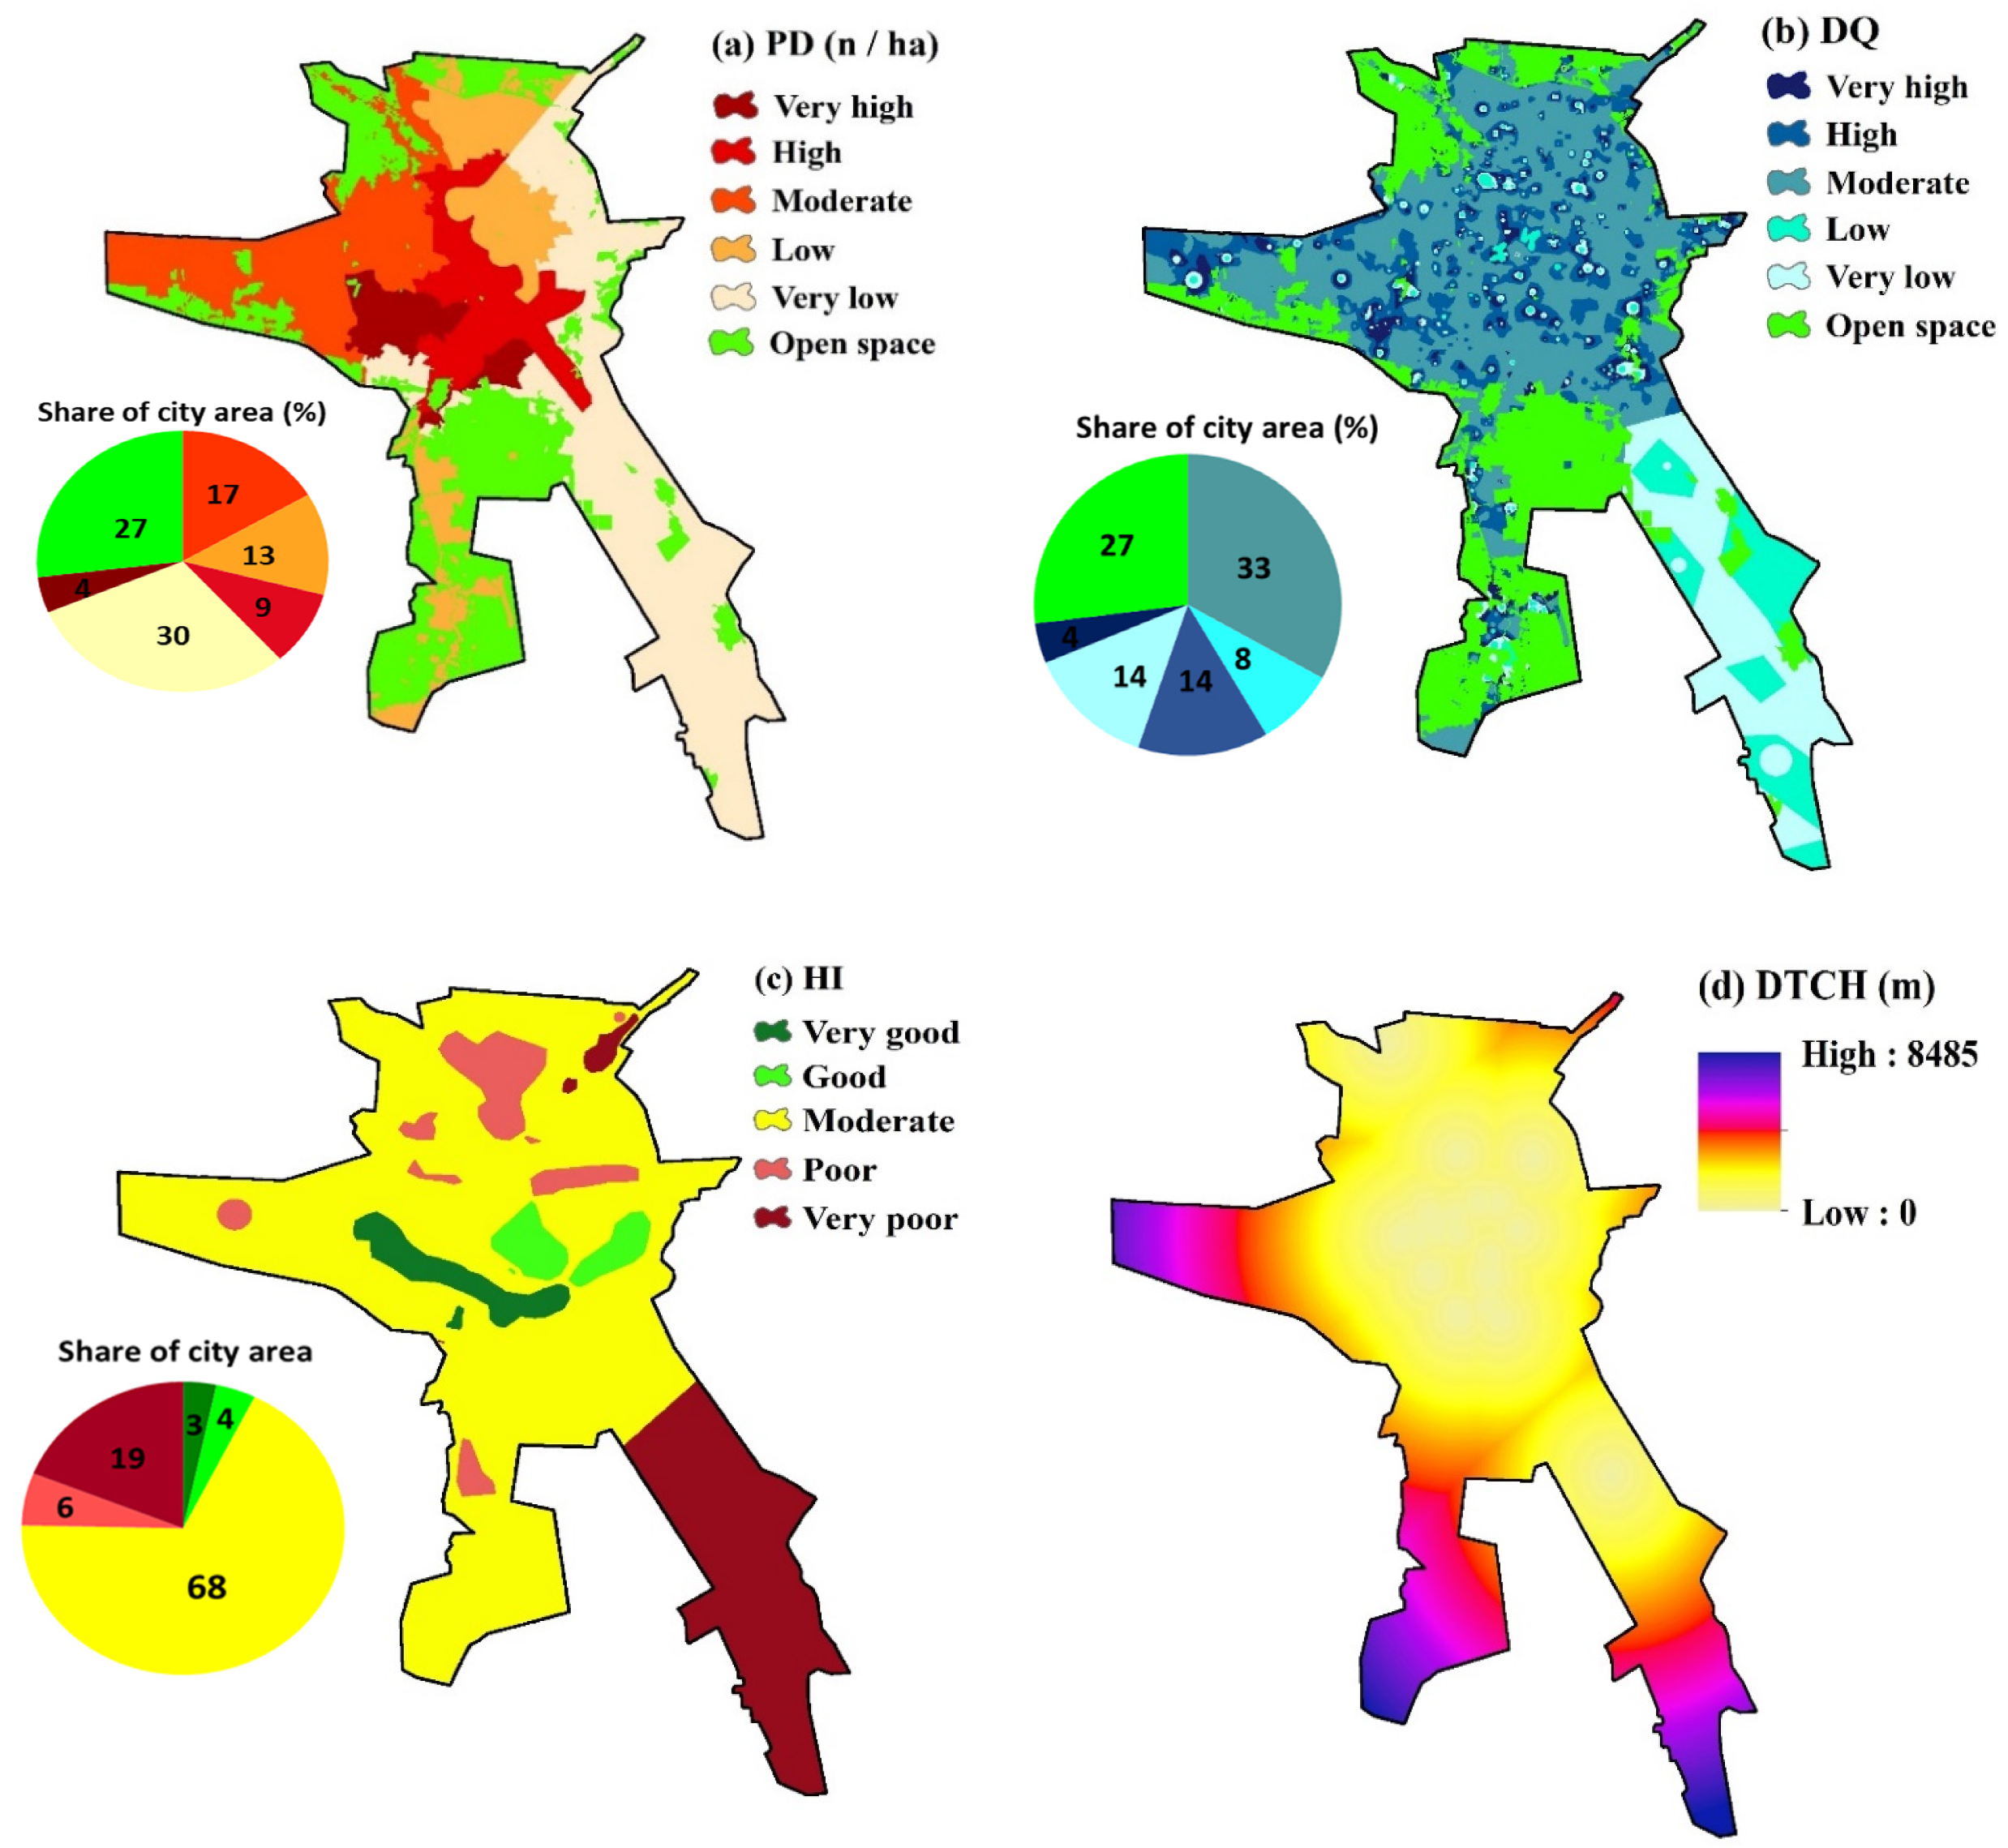
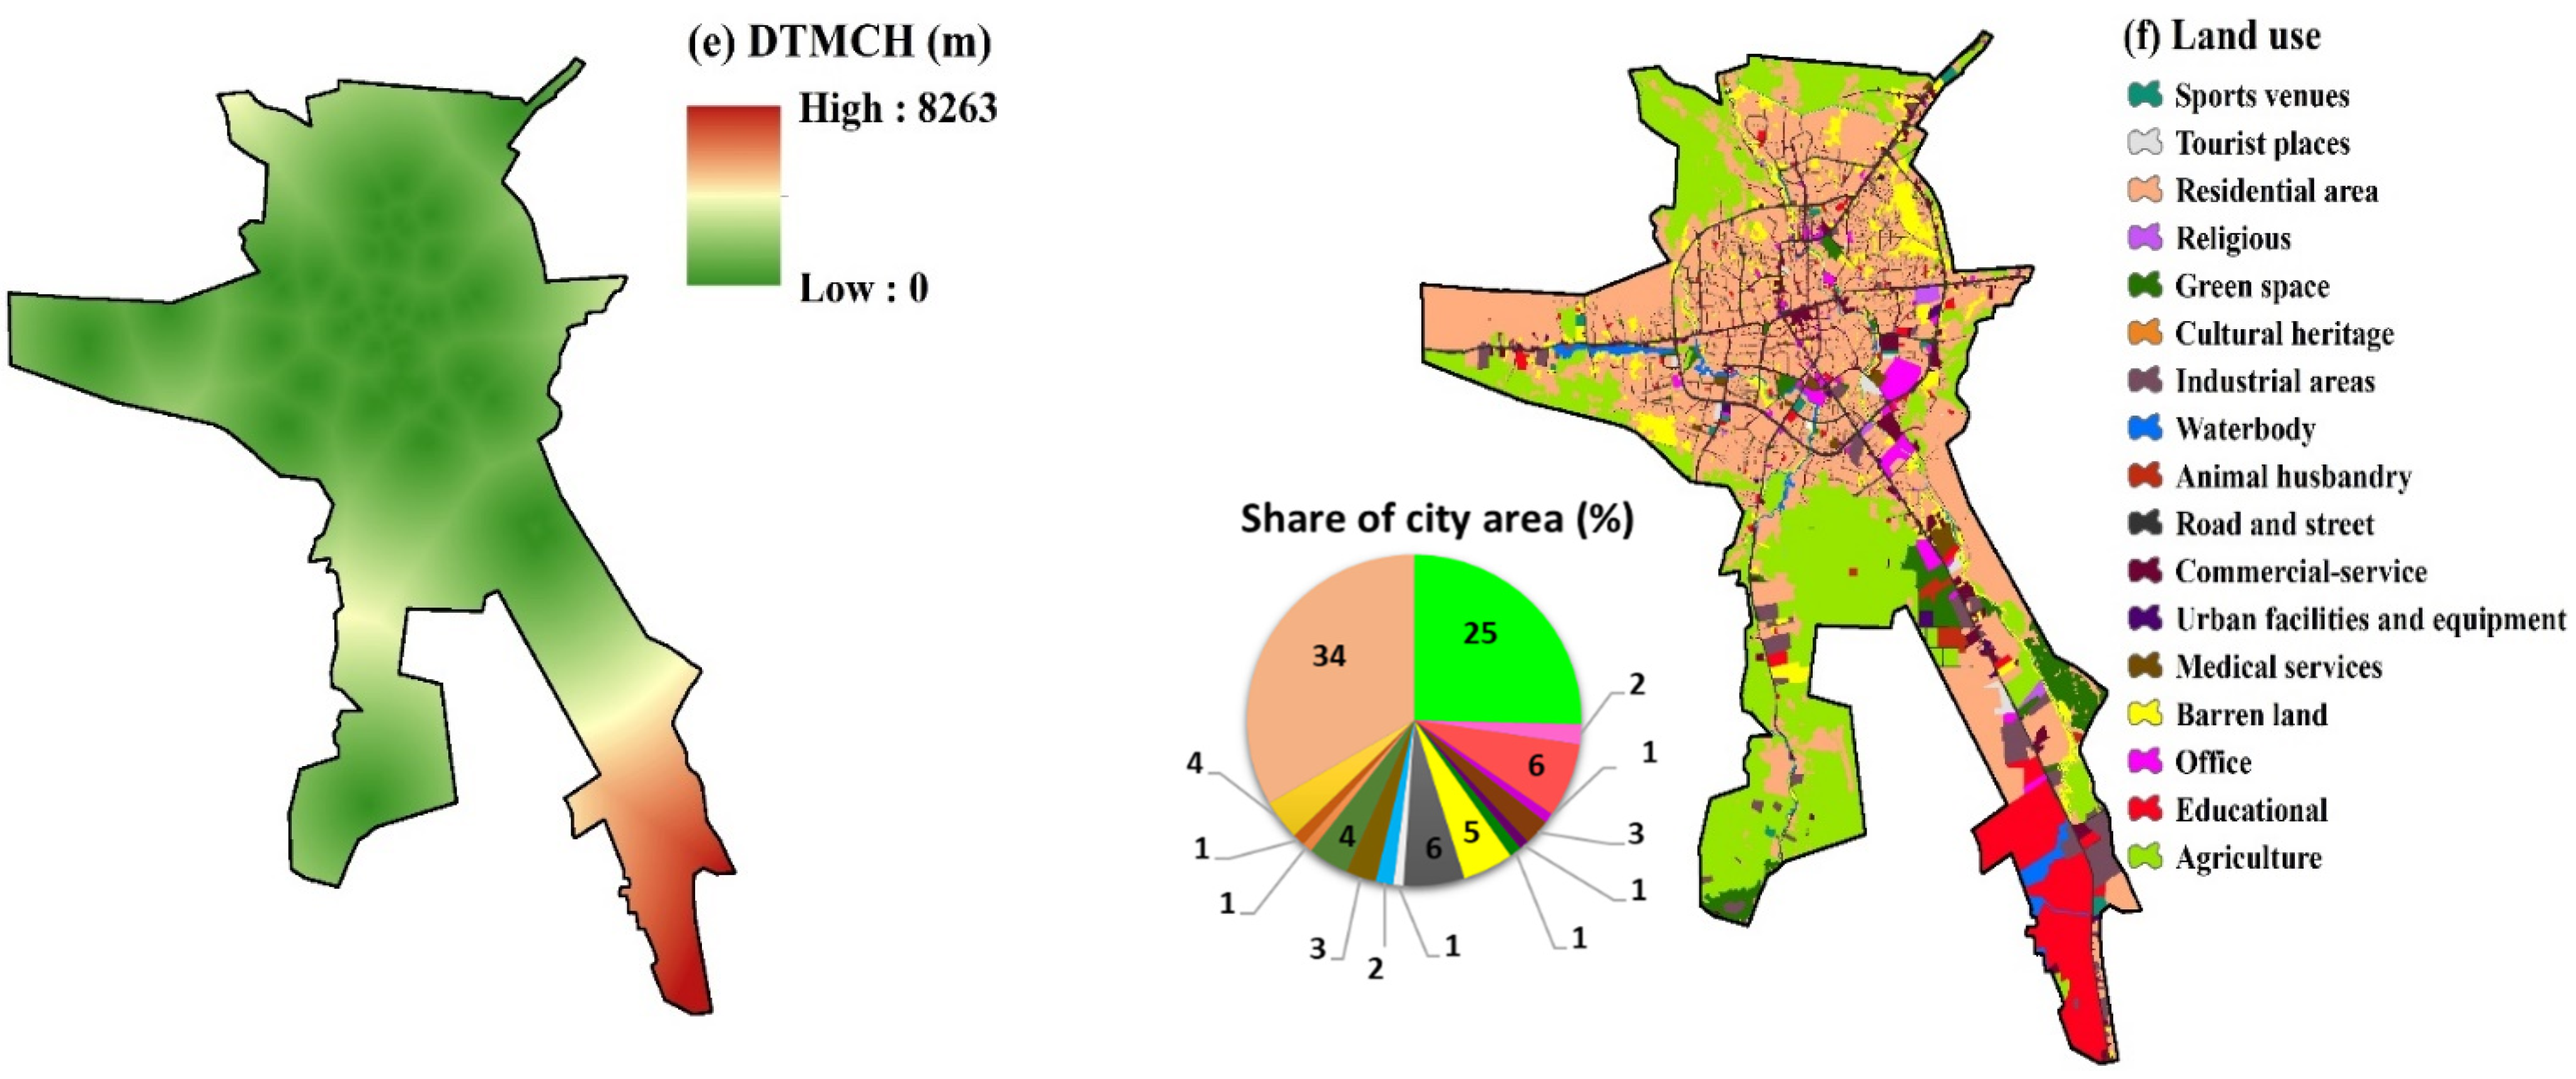
High population density (PD) indicates a higher vulnerability to flooding (Figure 3a). The PD data were collected with a pixel size of 12 × 12 m and grouped into five classes: very high, high, moderate, low, and very low. Very high PD, e.g., had a range of 200–250 people per ha. Dwelling quality (DQ) indicates building conditions and was divided into five classes: very high, high, moderate, low, and very low. It was assumed that buildings with high DQ are more resistant to damage. Household income (HI) is the combined income of all members of a household above 18. Floods tend to influence all income classes in an area; however, it was assumed more affluent households need a shorter recovery time after a disaster [50,51]. HI was also divided into five groups (very good, good, moderate, poor, and very poor) according to information from the Ministry of Cooperatives, Labor, and Social Welfare (2019). The distance to cultural heritage (DTCH; Figure 3d) describes where most of the cultural heritage is located in the city. When the DTCH decreases, the vulnerability increases. The distance to medical centers and hospitals (DTMCH) is another important factor. An increase in DTMCH is directly linked to vulnerability. The Euclidean distance tool in ArcGIS 10.7 was applied for preparing maps of DTCH and DTHMC. Land use is another important indicator of flood vulnerability. Runoff varies to a great extent depending on land use [6,18]. The land-use map was divided into seventeen categories (roads and streets, agricultural areas, offices, educational venues, religious venues, commercial service venues, urban facilities and equipment, sports venues, barren land, water bodies, tourist places, medical services, green space, cultural heritage, animal husbandry, industrial areas, and residential areas). Residential and agricultural areas occupied the largest areas and about 34 and 25% of the city, respectively.
2.4. Urban Flood-Hazard Evaluation
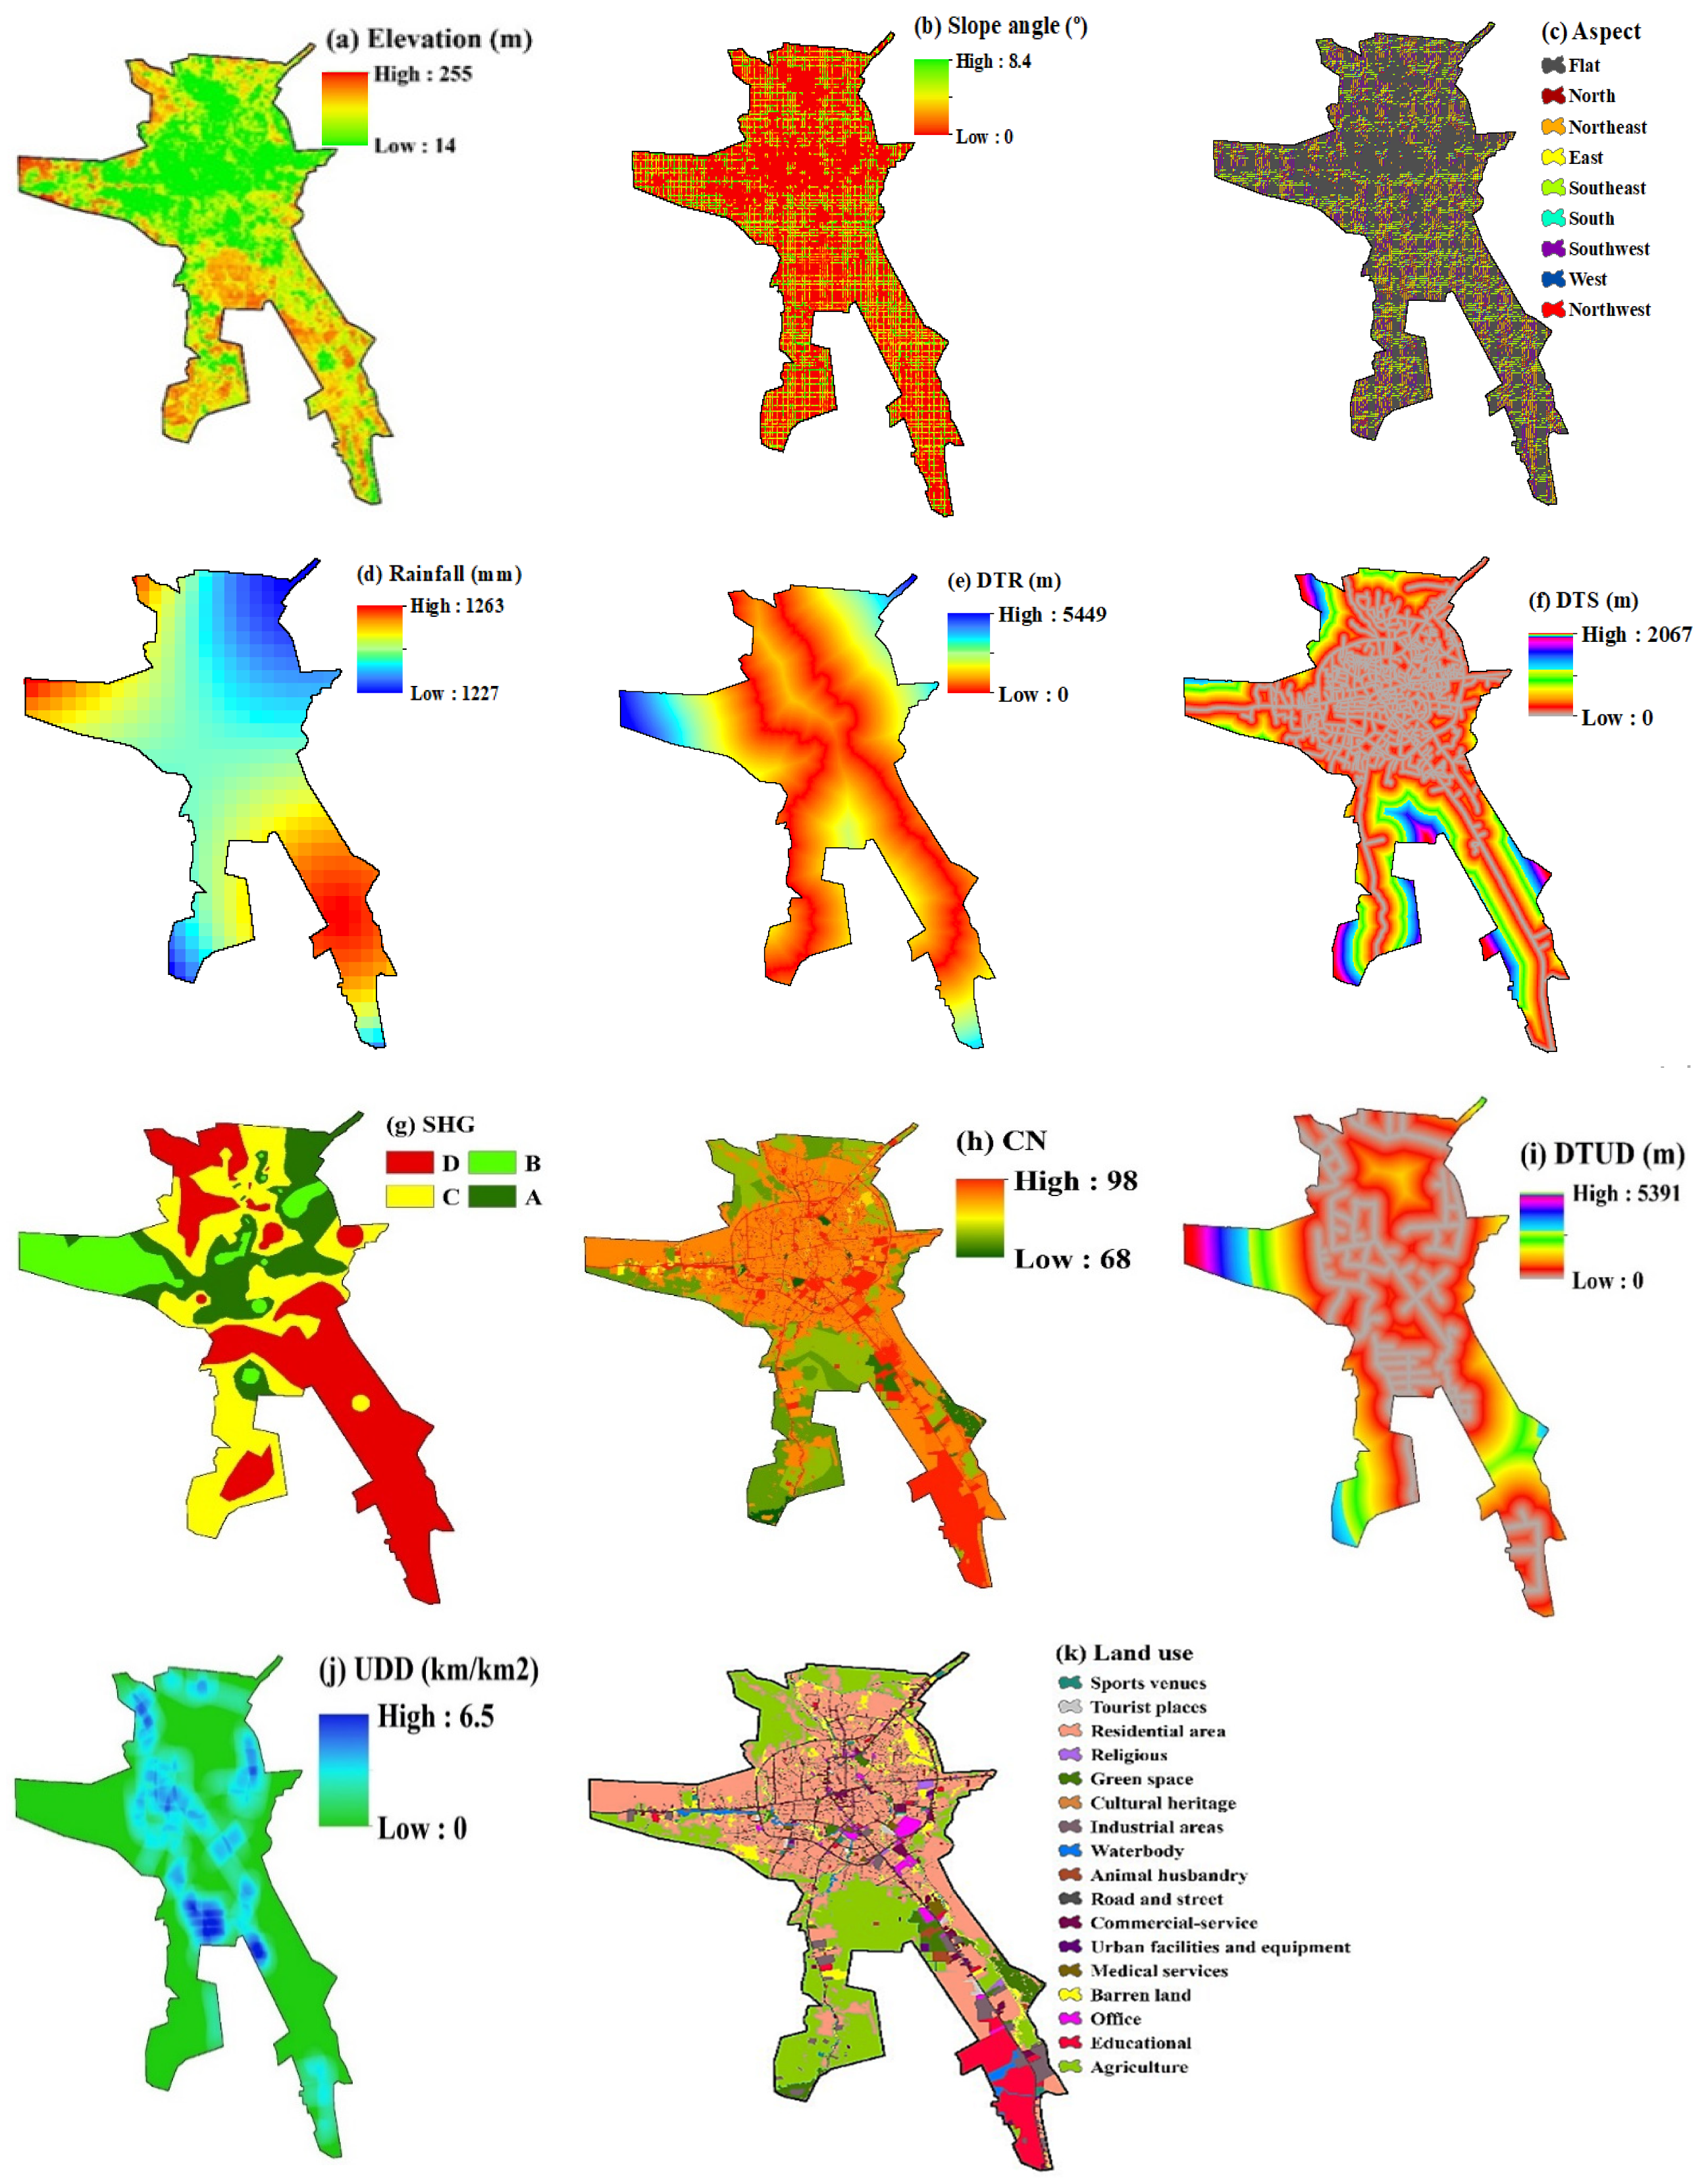
In total, eleven flood-conditioning parameters were considered, namely elevation, slope angle, aspect, rainfall, distance to rivers (DTR), distance to streets (DTS), soil hydrology group (SHG), curve number (CN), distance to urban drainage (DTUD), urban drainage density (UDD), and land use (Figure 4a–k). For producing the urban flood-hazard maps, the flooded and non-flooded points were assigned values of 1 and 0, respectively. The datasets were randomly chosen for training the ML models (70% of data) and validation (30% of data). The same training and validation data sets were used for all ML models.
2.4.1. Elevation
A digital-elevation model (DEM) was applied with a pixel size of 12 × 12 m. The elevation ranges from 14 to 255 m amsl (Figure 4a), which influences the flood depth and generation of surface-water flow.
2.4.2. Slope Angle
The slope-angle map was created by using the slope tool in ArcGIS 10.7. It ranges from 0 to 8.4 degrees (Figure 4b). A slope increase directly leads to faster and increasing surface runoff that influences flood hazards.
2.4.3. Aspect
Slope aspect is one of the most important flood-hazard indicators and is defined as the direction of the maximum slope of the area surface. It was created by using the aspect tool in the DEM layer in ArcGIS 10.7 and put into nine categories: flat, north, northeast, east, southeast, south, southwest, west, and northwest (Figure 4c).
2.4.4. Rainfall
To create the rainfall layer, data from 15 precipitation stations (2000–2019) were taken from the Iranian Meteorological Organization (IRIMO). The annual rainfall of the region was created using the inverse distance weighting (IDW) tool in ArcGIS 10.7 (varying between 1227 and 1263 mm/year; Figure 4d). The use of annual precipitation is regarded as proper detail for the present investigation. The wet-season rainfall in the area is strongly related to flooding problems. Since the annual precipitation is highly correlated to the wet-season rainfall, it is sufficient for achieving an overall-susceptibility map.
2.4.5. Distance to Rivers (DTR)
2.4.6. Distance to Streets (DTS)
2.4.7. Soil Hydrological Group (SHG)
Soil hydrological groups show soil quality based on the smallest amount of water infiltration rate. The Natural Resource Conservation Service has classified soils based on the runoff potentials of the soils into four SHGs (A, B, C, and D; [53]). Group D has the largest runoff potential and group A has the smallest [54,55]. Group D covered about 40% and group B covered about 11% of the study area (Figure 4g).
2.4.8. Curve Number (CN)
Curve number is a dimensionless factor that is a function of hydrological conditions, land use, soil type, and previous soil moisture [27,56]; it ranges from 0 to 100 with higher values showing higher runoff potentials and the lower values showing lower runoff potentials (Figure 4h; [57,58]). This map was generated based on land-use and SHG maps using the ArcCN-runoff tool in ArcGIS 10.7.
2.4.9. Distance to Urban Drainage (DTUD)
During severe rainstorms, areas near urban drainage systems are more prone to inundation and flooding. The DTUD map was produced by using the Euclidean Distance tool in ArcGIS 10.7 (Figure 4i).
2.4.10. Urban Drainage Density (UDD)
2.4.11. Land Use
Land use has an essential role in infiltration, runoff rates, interception, and evaporation, and thus, it directly affects runoff conditions [59,61]. The land-use map included 17 different classes (Figure 4k). Residential areas and streets are most susceptible to floods because in these regions, soil infiltration capacity is small.
2.5. Hazard Modeling
Classification and regression trees (CARTs), random forests (RFs), boosted regression trees (BRTs), multi-variate adaptive regression splines (MARSs), multi-variate discriminant analyses (MDAs), and support vector machines (SVMs) were applied to estimate the relationship between flooding and explanatory indicators and to create flood-hazard maps. The software R 4.0.4 and SDM (Species Distribution Modeling) package [62] were used to perform the modeling. Below, each model is briefly described.
CART: Classification and regression tree (CART) is a decision-tree (DT) model that can be utilized for predictive regression modeling or classification [63,64]. None of the different types of DT models, such as CART, Chi-Squared Automatic Interaction Detection (CHAID), and Quick, Unbiased, and Efficient Statistic Tree (QUEST) have previously been used for flood-hazard mapping in the region. The CART model searches through all values of all parameters according to:
where , and are parent, left, and right nodes; and are probabilities of right and left nodes; and maximum homogeneity of child nodes is defined by an impurity function i(t). More information about the CART model can be found in Breiman et al. [63] and Lawrence et al. [34].
RF: Random decision forest or random forest (RF) is an ensemble learning method for regression and classification. The ‘forest’ created by the random forest model is trained through bootstrap aggregation. The building blocks of a random forest algorithm are decision trees and comprise a decision support method. The decision tree has three components: decision nodes, leaf nodes, and root nodes; it divides a training data set into branches that further segregate it into other branches until a leaf node is attained. The leaf node cannot be segregated further. In the decision tree, the nodes show attributes that are applied to predict the outcome. A link to the leaves is provided with decision nodes [37,65].
BRT: Boosted regression trees are frequently used with different decision trees for improving the performance of models [40]. It is an ML algorithm merged with a statistical technique [39,66]. More information about this technique can be found in Elith et al. [67] and Schapire [40].
MARS: Multi-variate adaptive regression spline was introduced by Friedman [29]. This method is a non-parametric regression model that can be considered as an extension of linear models using automatic model interactions among non-linear variables.
MDA: The multi-variate discriminant analysis derives a linear combination of several variables that are best at differentiating between pre-determined independent categories. The procedure is performed by increasing the variance ratios for different categories [31].
SVM: Support vector machine is another ML model (supervised learning method) that is utilized for regression, classification, and outlier detection [41]. This approach draws a decision boundary, which is a hyperplane between any two classes for classifying them or separating them into two categories (i.e., no flood or flood). The purpose is to specify an optimum dividing hyperplane to increase the margins among various categories of the training data and reduce generalization errors [32,68].
2.6. Performance Evaluation
The evaluation of models was performed using a contingency table for binary forecasting (yes/no). According to previous studies [69], several metrics, including accuracy, probability of detection (POD), false alarm ratio (FAR), and precision, are used to evaluate and validate the model performance (Equations (3)–(6)). The accuracy is the ratio of the number of correct predictions to the total number of input samples (ranges from 0 to 1; [70]). The POD quantifies the probability of finding a specific flaw, which is strongly connected to the subjects of risk assessments and probabilistic analyses in the assessment of the integrity of components. The POD is the proportion of the number of missing data to the total number of observed incidences, and it ranges from 0 to 1 (the perfect value of POD is equal to 1; [71]). The FAR is false alarms per total number of warnings or alarms in each study or situation (between 0 and 1, where 0 is the desired result; [72]). Precision measures the number of hits to alarms per total number of warnings or alarms in each study; it denotes the closeness of measurements to each other, while accuracy is the closeness of measurements to a particular value:
where H indicates the number of hits, FA represents the number of false alarms, M is the number of misses, and CN specifies the number of correct negatives in the confusion matrix [69]. In addition to the above statistics, the receiver operating characteristic curve (ROC) and the area under the curve (AUC) were used to evaluate the performance of models [32,70,73,74]. The area under the receiver operating characteristic curve (AUC-ROC) has been broadly applied for evaluating model accuracy, which is the most popular assessment criterion.
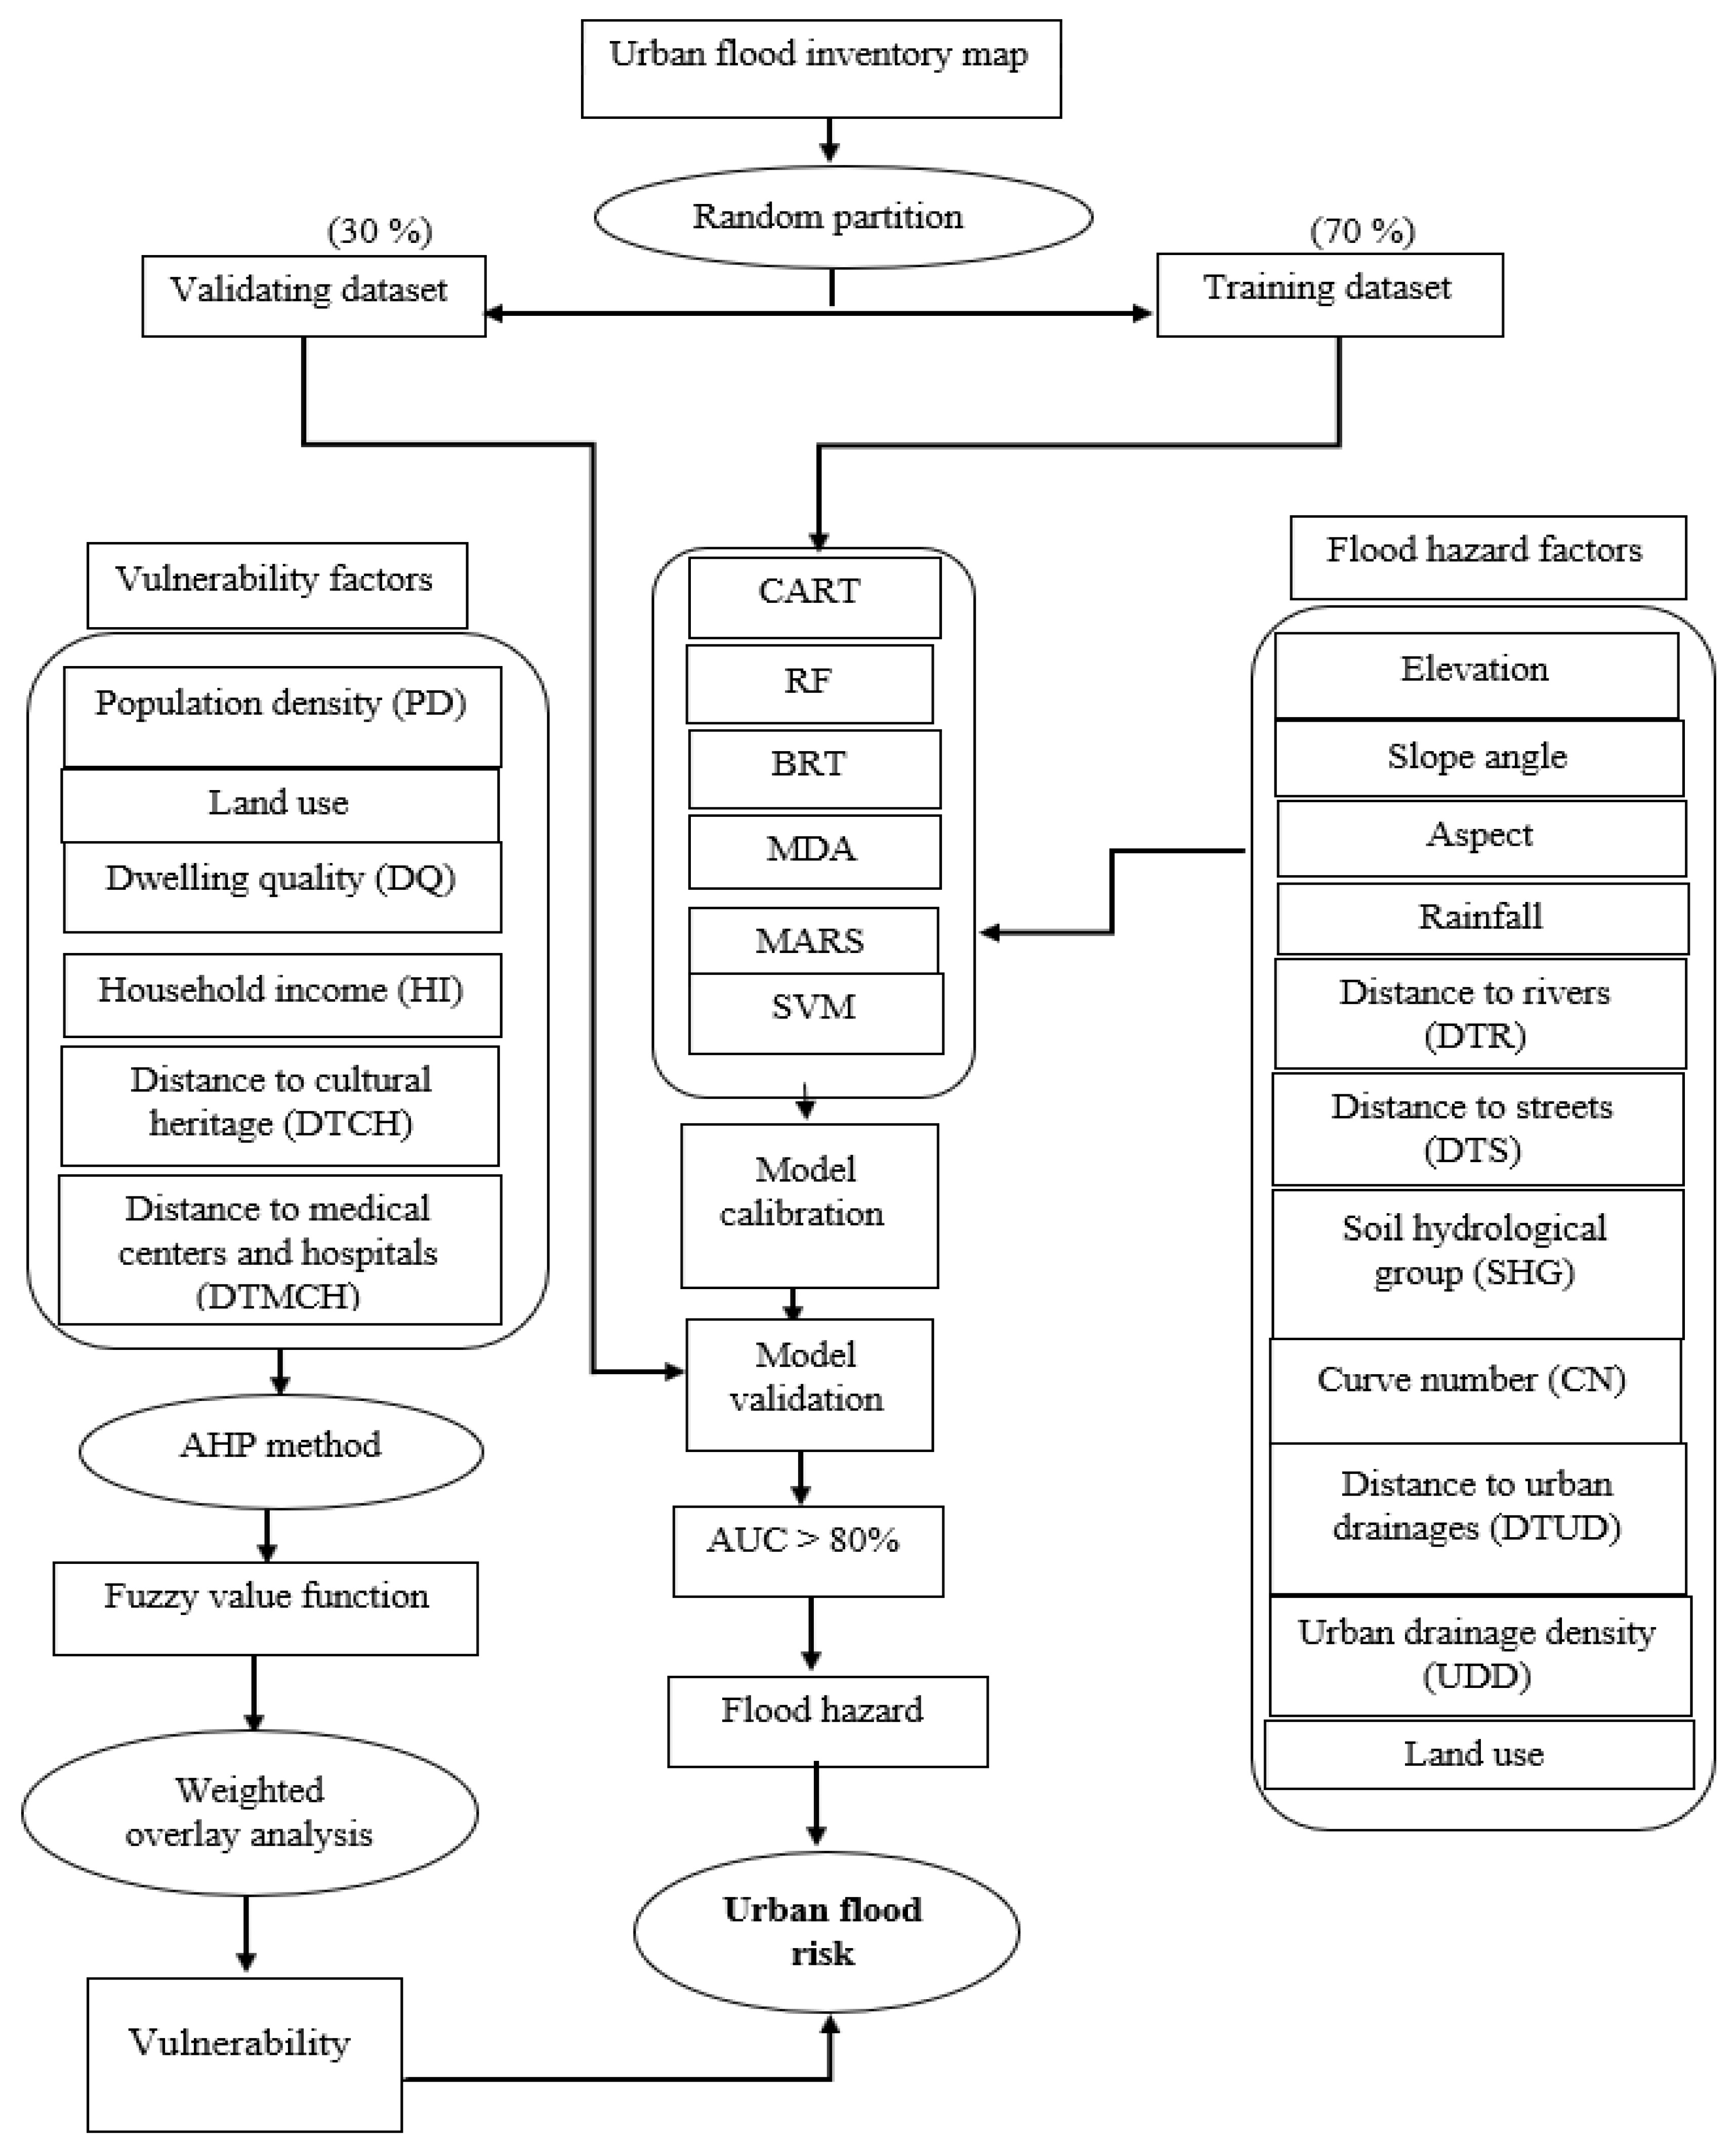
2.7. Urban Flood-Risk Assessment
The risk is a function of hazard and vulnerability [42]. The vulnerability is linked to socioeconomic indicators, and the hazard is linked to environmental indicators. Flood hazards may be low in an area, but socioeconomic vulnerability may be high or vice versa. Hence, vulnerability and hazards are jointly important for risk analysis. The flood-risk map was produced for Rasht based on the vulnerability and flood-hazard maps [75,76]:
Risk = Hazard × Vulnerability
The different steps in the suggested methodology are shown in Figure 5.
3. Results
3.1. Modeling Results
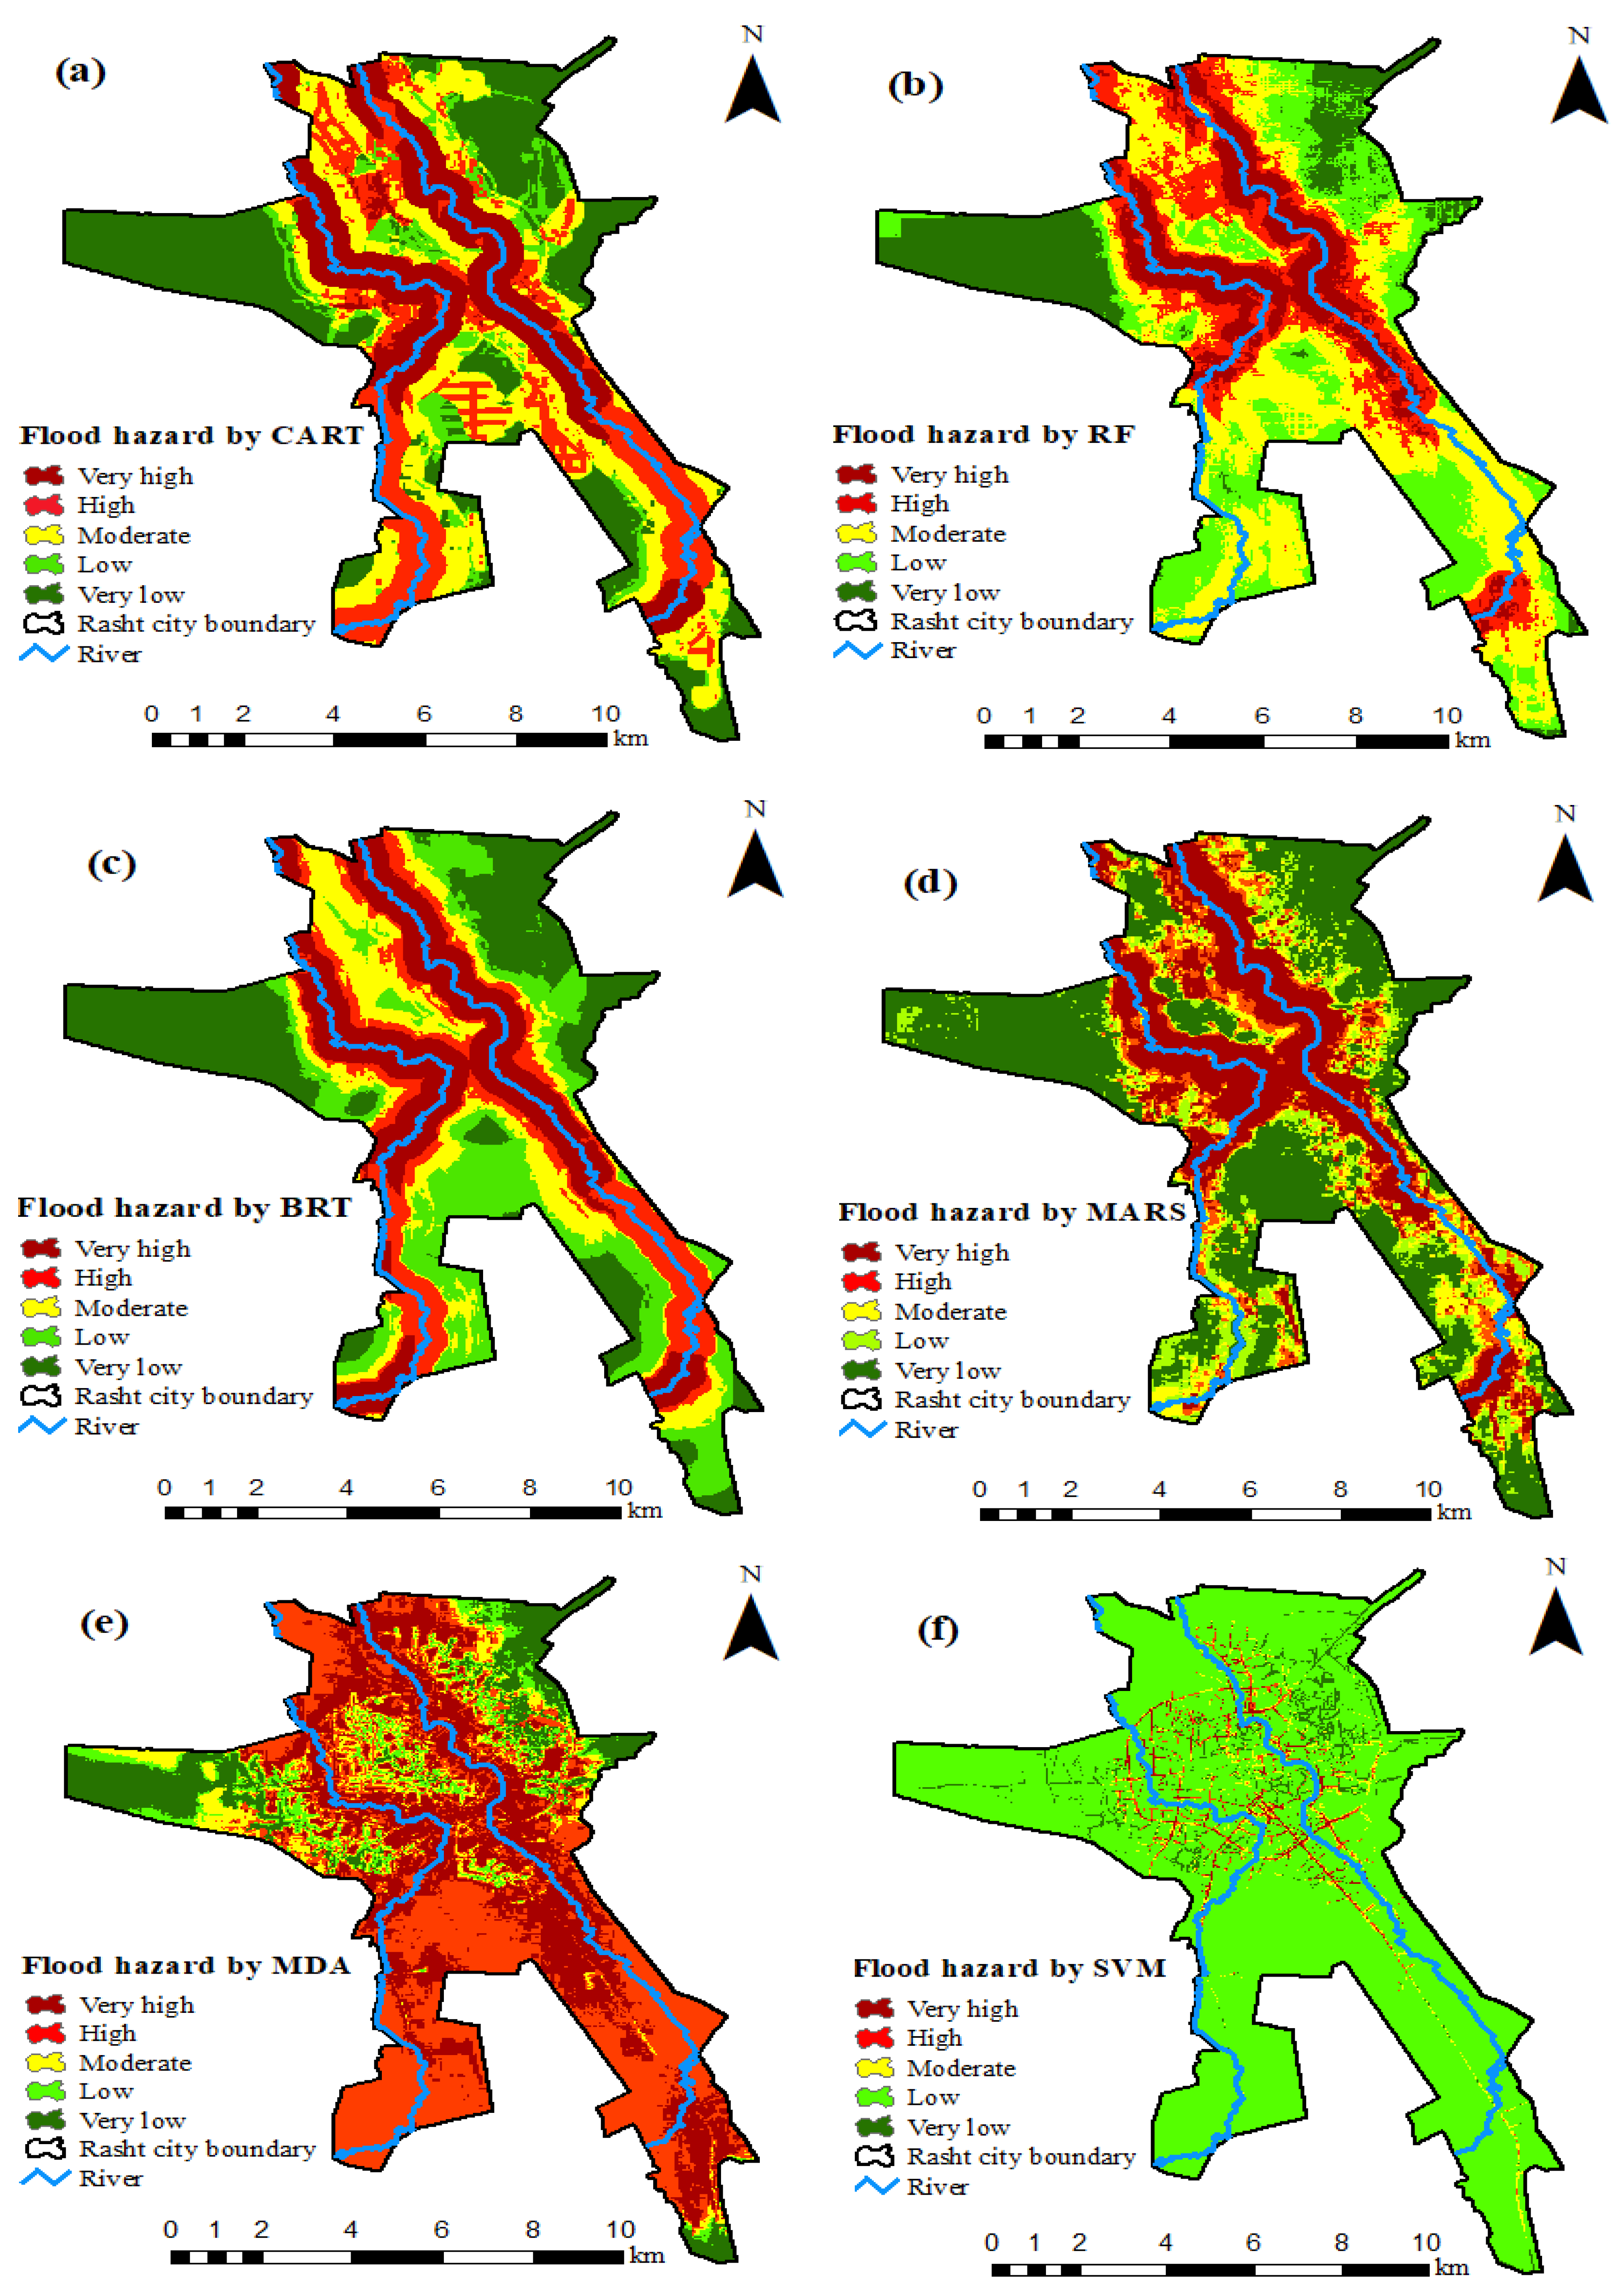
All six models considered in this study used the 11 conditioning parameters and flooded and non-flooded points for the calibration and validation. The model calibration was repeated until a suitable AUC was obtained (>80% according to Yesilnacar [74]) for which the flood-hazard maps were produced (Figure 6a–f).
The accuracies, PODs, FARs, and precisions of the six models are shown in Table 2 and Table 3. According to Table 3, the AUC ranged from 0.781 to 0.947 with CART as the best. The SVM model had the poorest performance (accuracy = 0.768, POD = 0.759, FAR = 0.214, precision = 0.786, and AUC = 0.781). The main reason for the poor performance of the SVM model is that the data input was not linear [77]. For the MDA model, poor performance (accuracy = 0.811, POD = 0.788, FAR = 0.143, precision = 0.857, and AUC = 0.889) is related to its need for a normal distribution of data; this model is also less capable of handling non-linear relationships between output and input factors [78].
According to Table 3, the CART model displayed the best performance among all the models (accuracy = 0.892, POD = 0.867, FAR = 0.071, precision = 0.929, and AUC = 0.947). The RF (accuracy = 0. 875, POD = 0. 839, FAR = 0.071, precision = 0.928, and AUC = 0.941) had a higher performance than the BRT (accuracy = 0.857, POD = 0.827, FAR = 0.111, precision = 0.889, and AUC = 0.921) and MARS (accuracy = 0.821, POD = 0.801, FAR = 0.133, precision = 0.867, and AUC = 0.916; Table 3).
3.2. Urban Flood-Hazard Map
The flood-hazard map was generated based on the results of the CART, RF, BRT, MARS, MDA, and SVM models (Figure 6). The equal interval classification method [79] was used to categorize the flood-hazard map and simplified the model comparison. In other words, the interval classification method divides categories equally with intervals of 0.2 (from 0 to 1). In each category, the number of records is different. When the distribution of the data is rectangular, the equal interval classification method is sufficient [80]. Applying this approach, the flood-hazard maps were classified into five categories: very high, high, moderate, low, and very low (Figure 6). The performance of the MDA and SVM algorithms was not suitable (Figure 6e,f; Table 4). The CART, RF, BRT, and MARS algorithms have similar distributions of flood-hazard categories (Figure 6a–d; Table 4). The hazard maps created by using the CART, RF, BRT, and MARS models indicated that low and very low flood hazards are represented in regions in the west, northeast, and south of the study area (Figure 6a–d). According to the CART-model map, the very high and high hazard classes cover the greatest area, 41.8%, and the low and very low hazard classes cover only about 36% of the city. For the RF-model map, the very high and high hazard classes cover the smallest region, about 31%, and the low and very low classes cover the greatest area, 38.6% (Table 4).
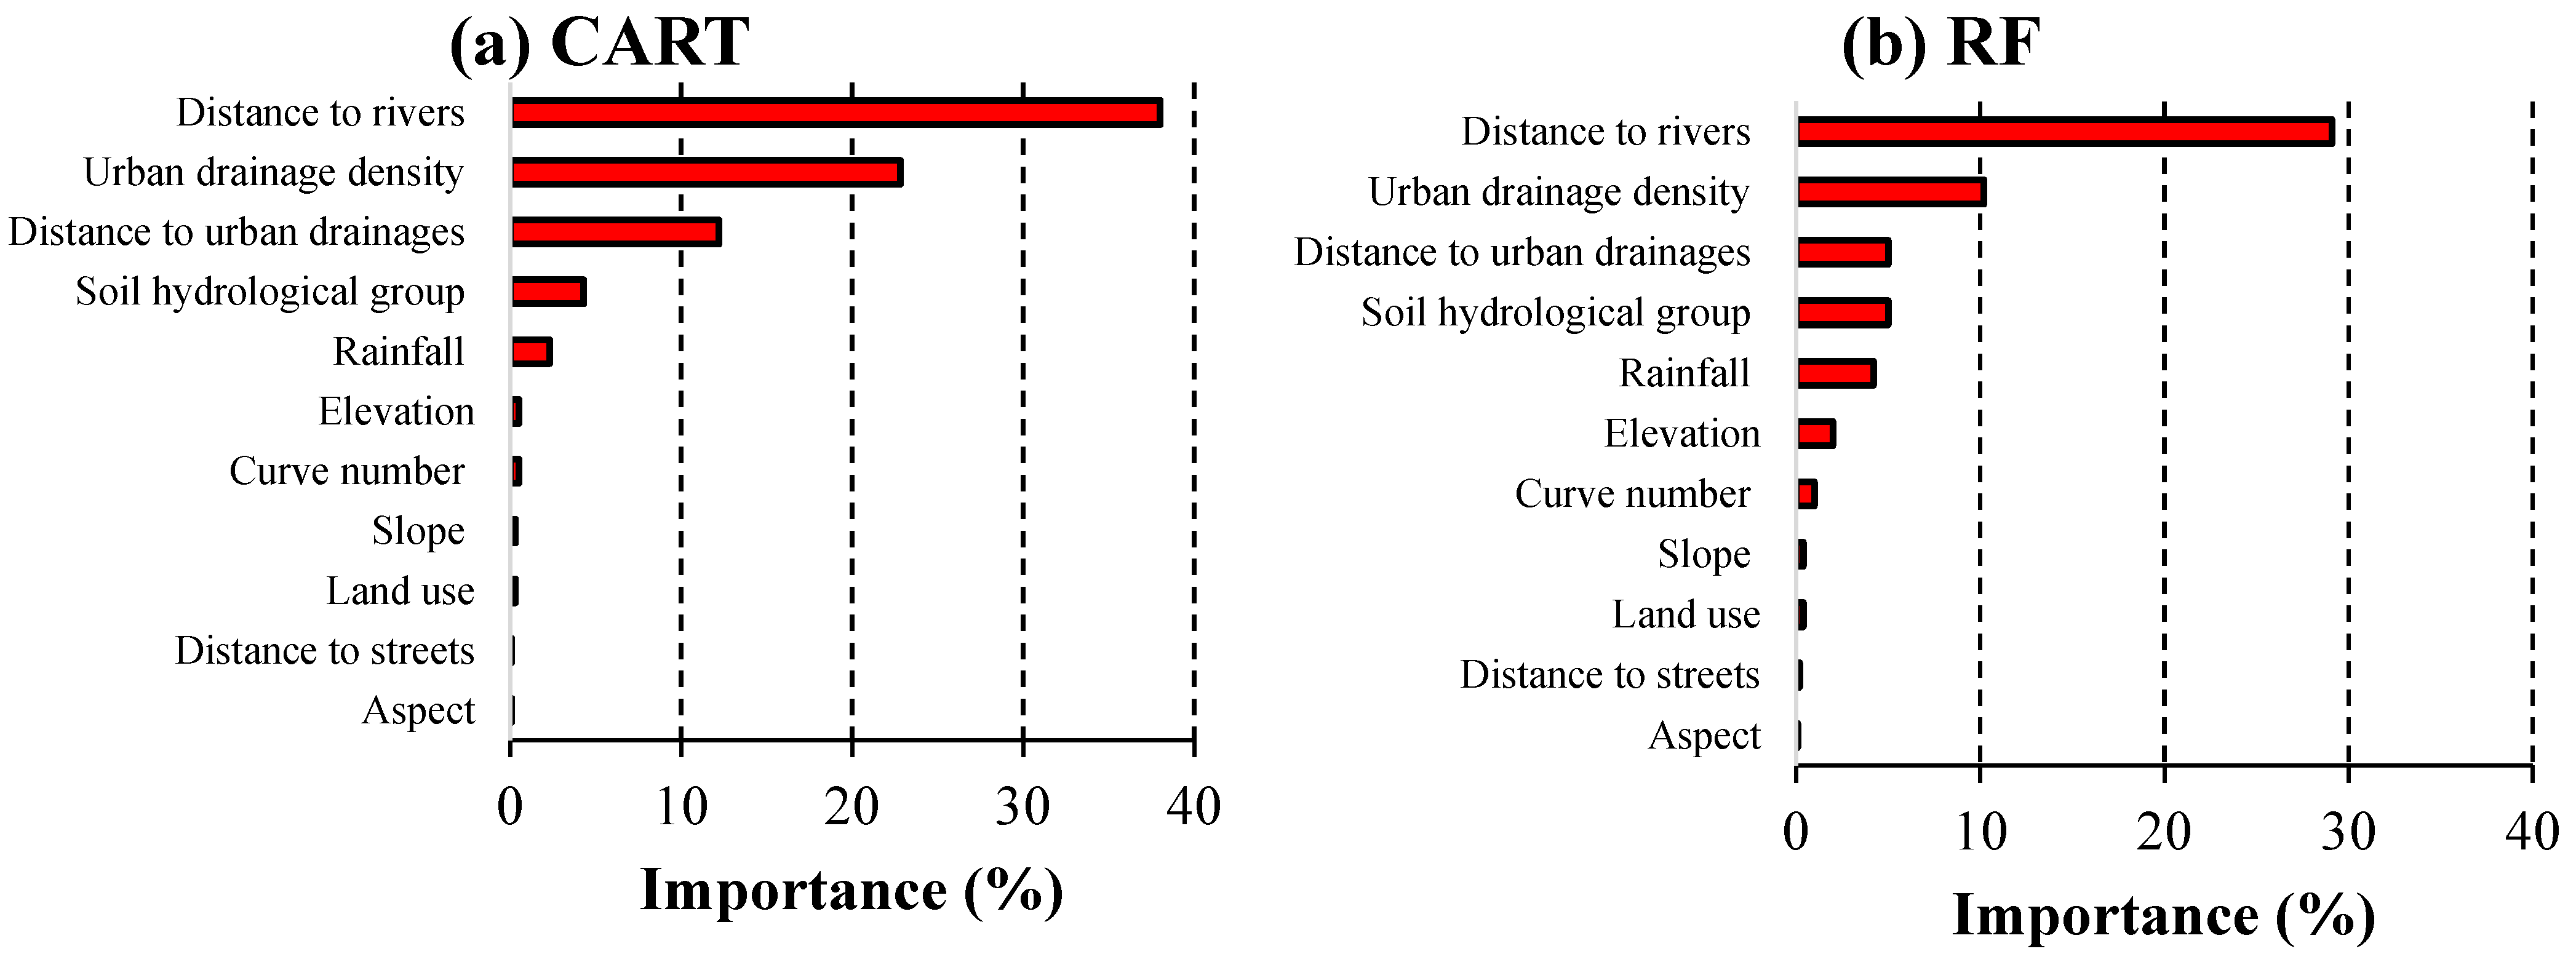
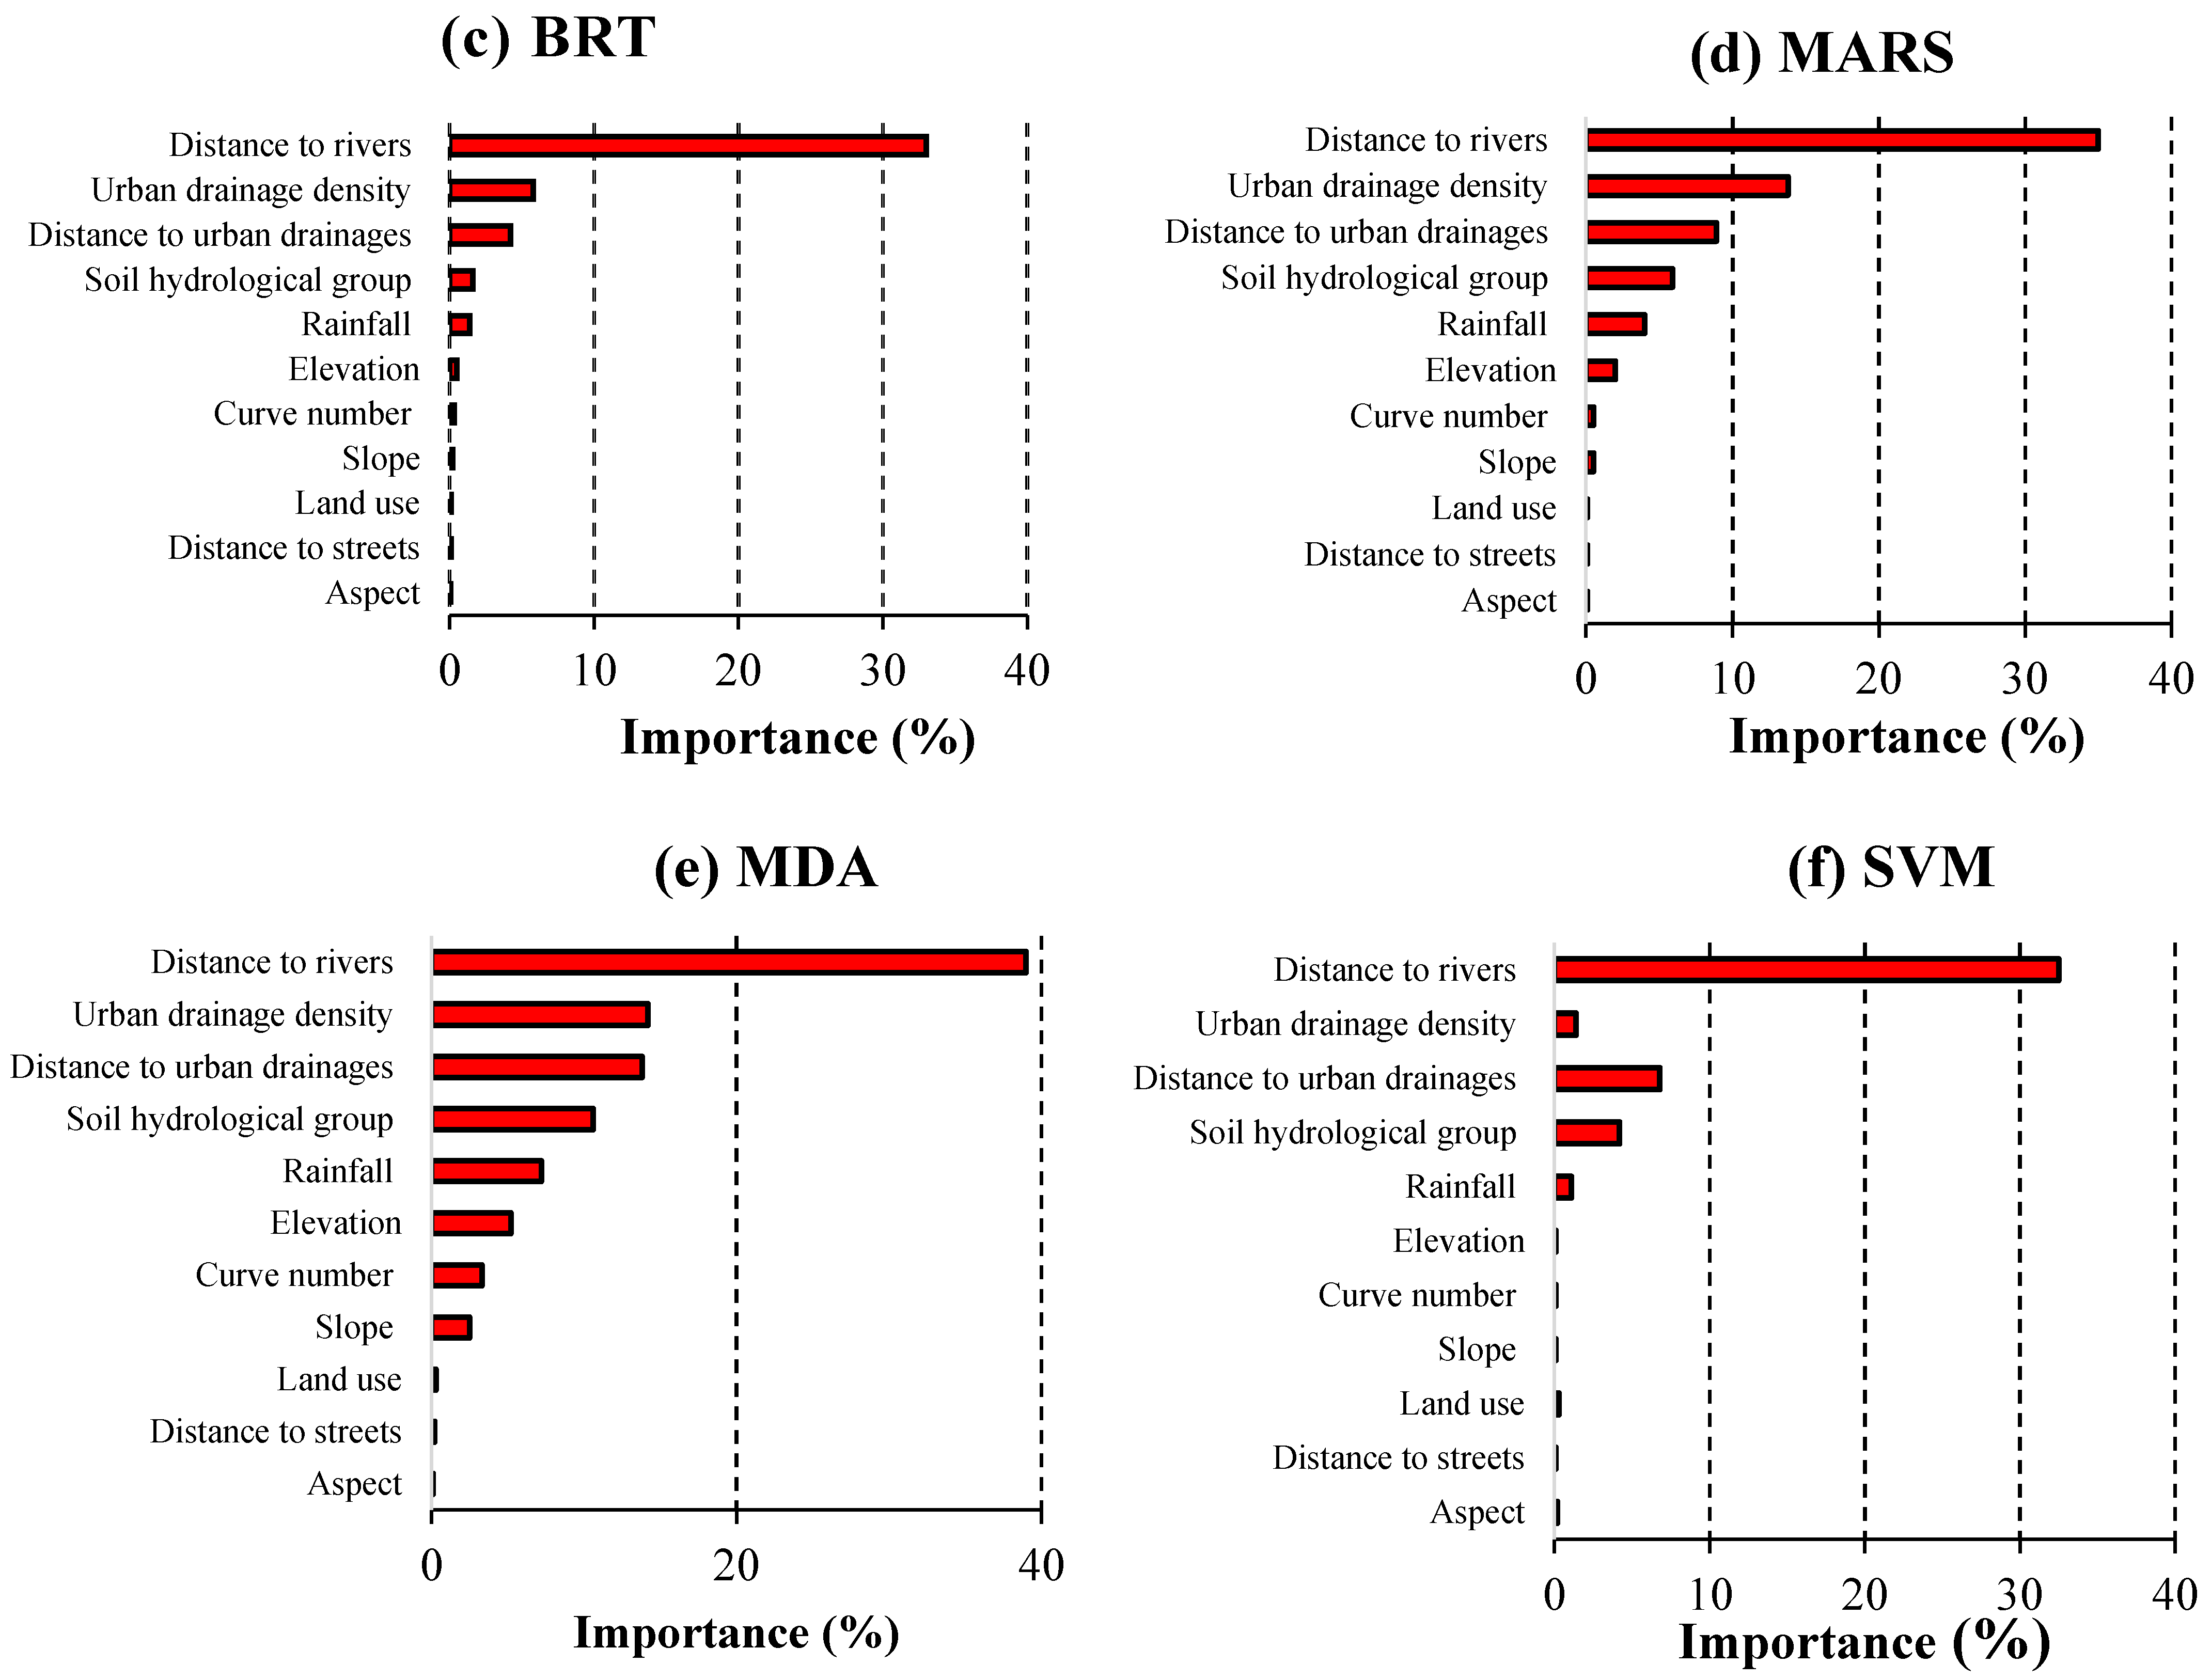
3.3. Importance of Flood-Hazard Factors
Selecting suitable conditioning factors is important in flood-hazard modeling [81]. In the present study, the sensitivity of the factors was investigated using a jackknife test, which is a fast and powerful method using partial-derivative calculations. Further details about the jackknife test are described by Skinner and Rao [82]. The relative importance of the flood-hazard factors used is shown in Figure 7. Distance to rivers (DTR) was the most influential factor, followed by urban drainage density (UDD) and distance to urban drainage (DTUD). Figure 8 shows that DTR was the most important among all the models (38, 29.1, 33, 39, 35, and 33 for the CART, RF, BRT, MDA, MARS, and SVM models, respectively). The importance of UDD and DTUD in the CART method was about 23 and 12, respectively; all other factors were less than five (Figure 7a). In the RF and BRT models, the importance of all the conditioning factors (except DTR and UDD) was less than five (Figure 7b,c). According to the MARS model, DTR, UDD, DTUD, and soil hydrological group (SHG; with 35, 14, 9, and 6) were the most significant factors in the flood hazard map (Figure 7d). In the MDA model, the importance of the DTR, UDD, SHG, and rainfall was about 39, 14, 14, 11, and 7, respectively; all the other factors were less than five (Figure 7e). In the SVM model (Figure 7f), the most important factors were DTR and DTUD (values equal to 33 and 7, respectively).
3.4. Importance of Vulnerability Indicators Using the AHP Method
The results obtained from the AHP indicate that among the urban flood-vulnerability parameters, population density (0.363), land use (0.279), and dwelling quality (0.158) are the most important, followed by household income (0.087), distance to cultural heritage (0.064), and distance to medical centers and hospitals (0.049). Table 5 shows the weights assigned to each parameter (based on the AHP method and expert knowledge).
3.5. Urban Flood-Vulnerability Maps
The obtained weights of the layers according to the AHP approach were normalized for every layer through the membership functions (MF). According to Samanlioglu et al. [83] and Azareh et al. [84], applying continuous values using a fuzzy method shows changes in factors more realistically. Additionally, fuzzy methods can reduce uncertainty. Thus, a suitable MF, considering the relationships between every layer and flood vulnerability, was used to standardize every layer between 0 and 1 using the fuzzy membership tool within ArcGIS 10.7 (Table 6).
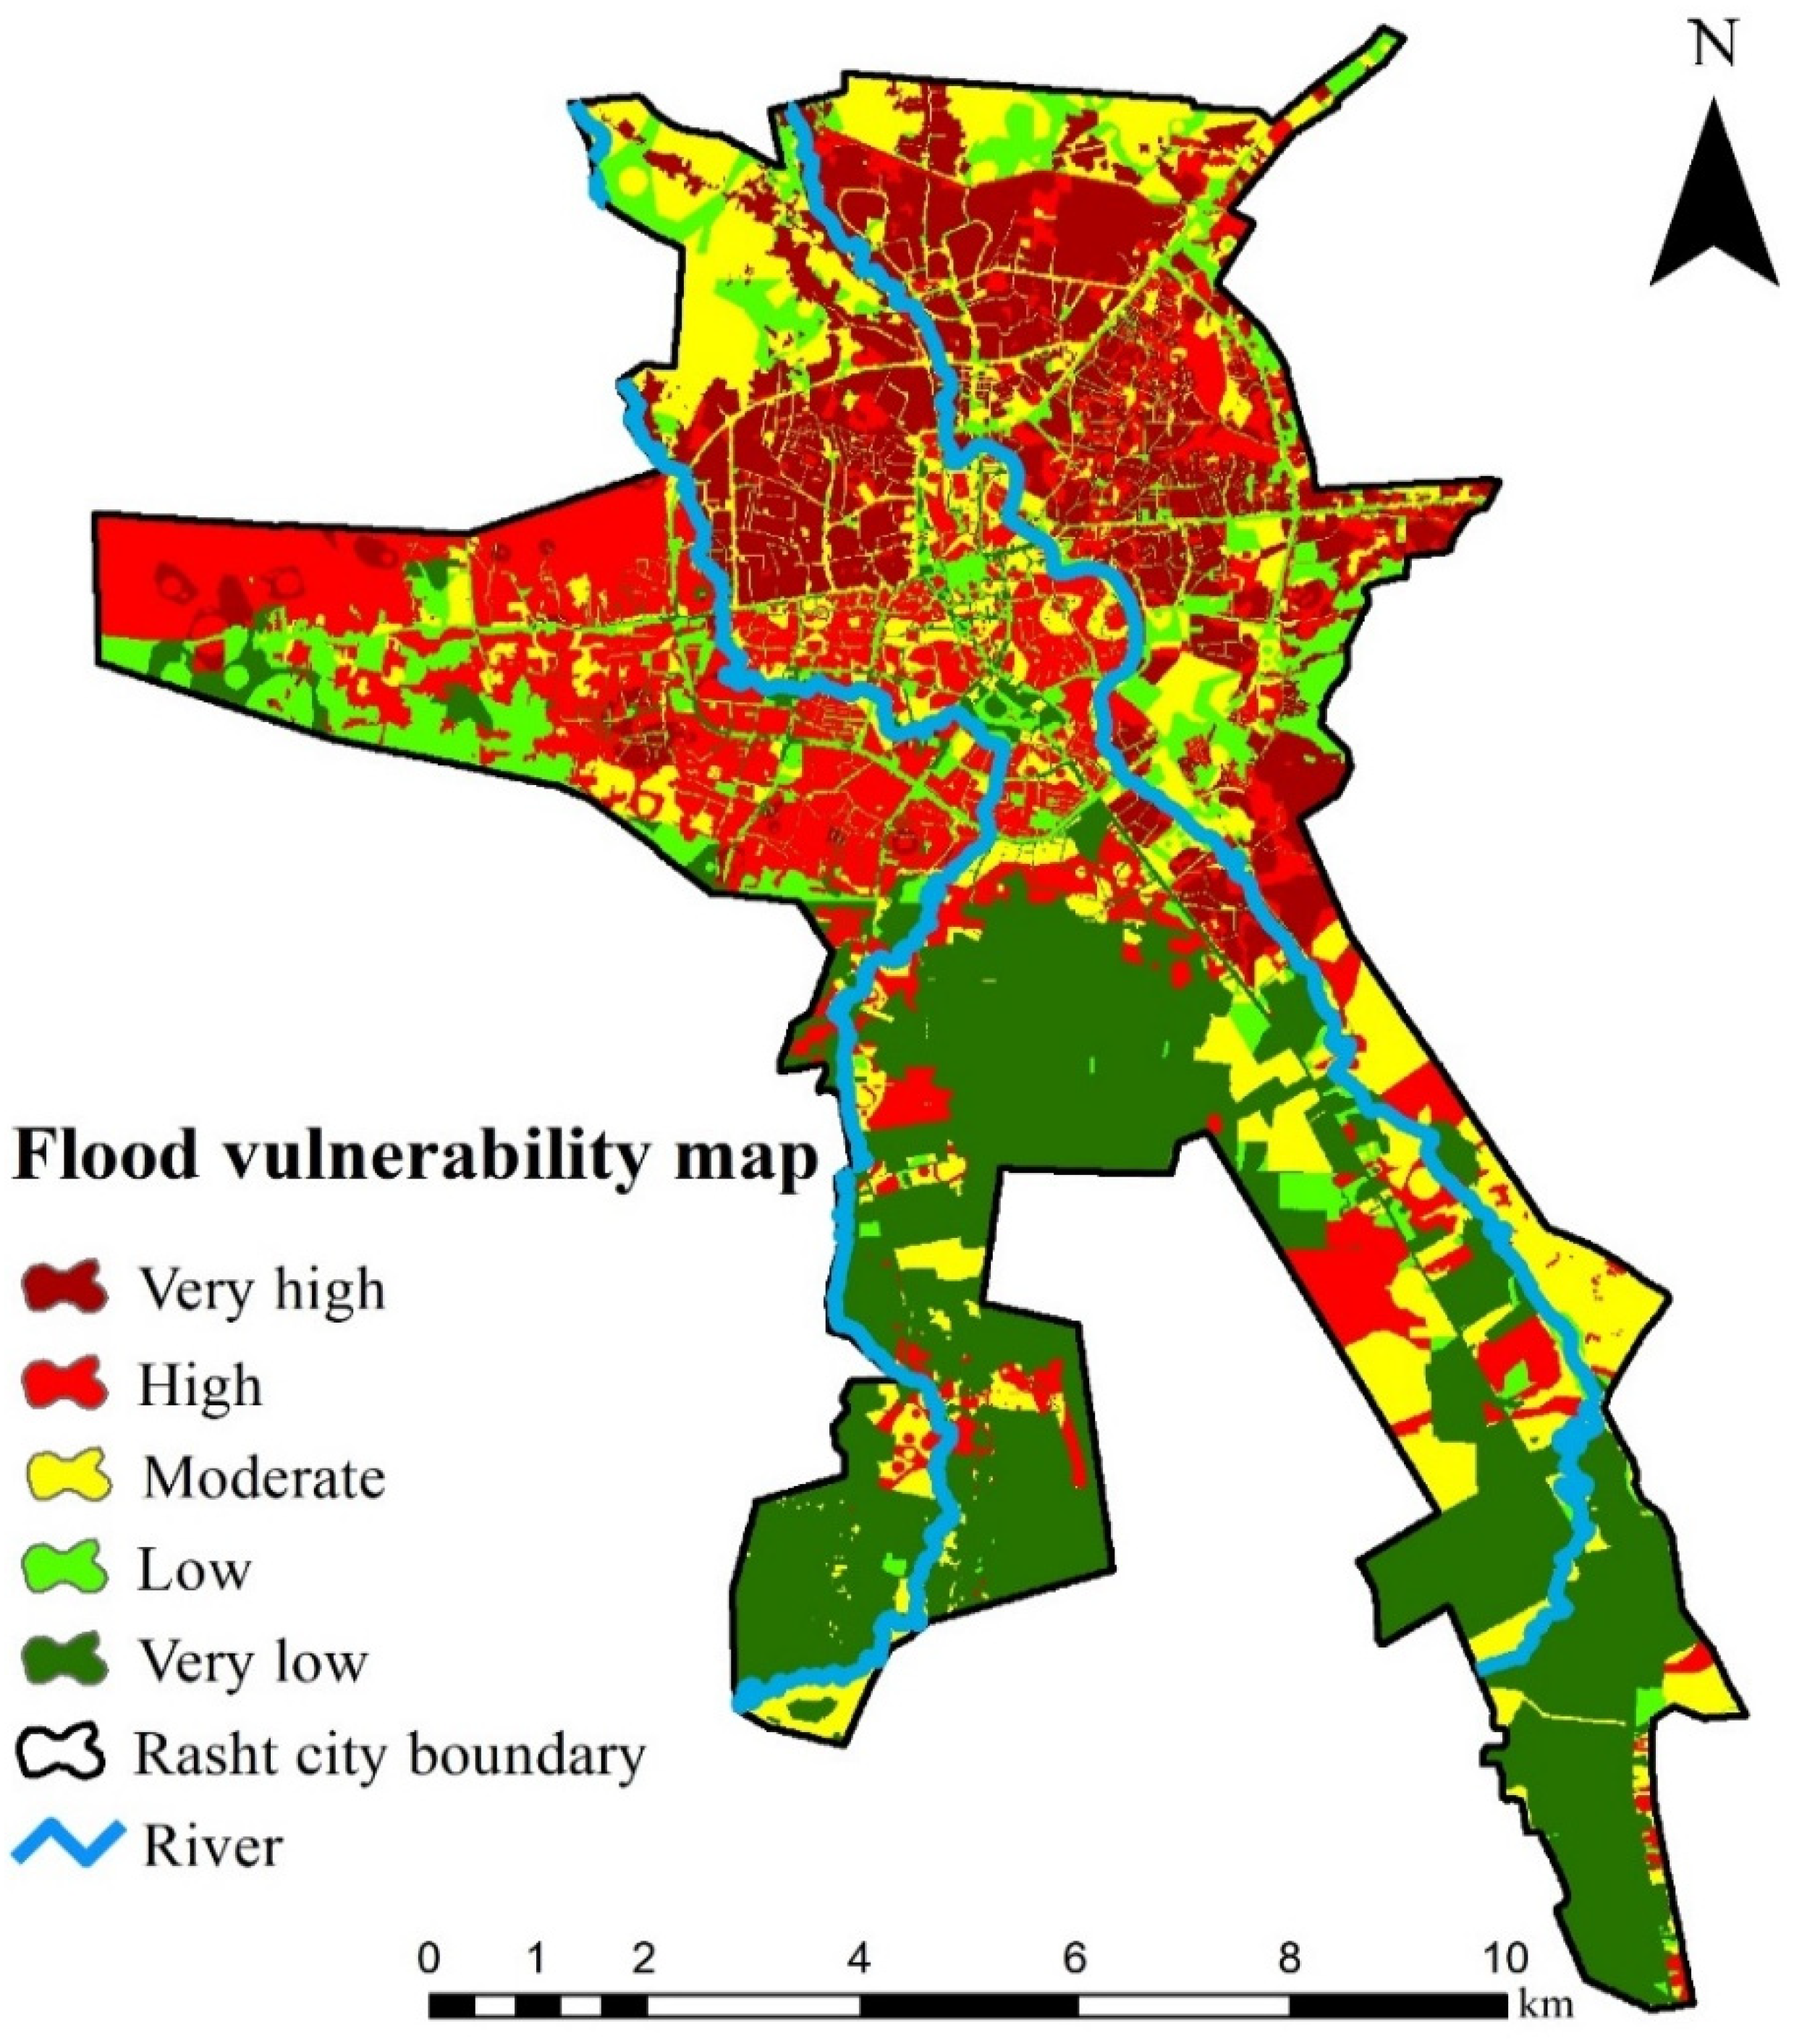
The flood-vulnerability map was produced through using the weights obtained from the AHP method and fuzzy layers (Equation (1)) using ArcGIS 10.7. The urban flood-vulnerability map of Rasht was then obtained with a pixel size of 12 × 12 m (Figure 8). According to the map, the most vulnerable flooding areas are located in the north and northeast parts of the city. The vulnerability was categorized into five classes for better visual interpretations (Figure 8): very low, low, moderate, high, and very high, representing 27.3, 11.9, 18.8, 14.7, and 22.3 km2 of the area, respectively (Table 7).
3.6. Urban Flood-Risk Map
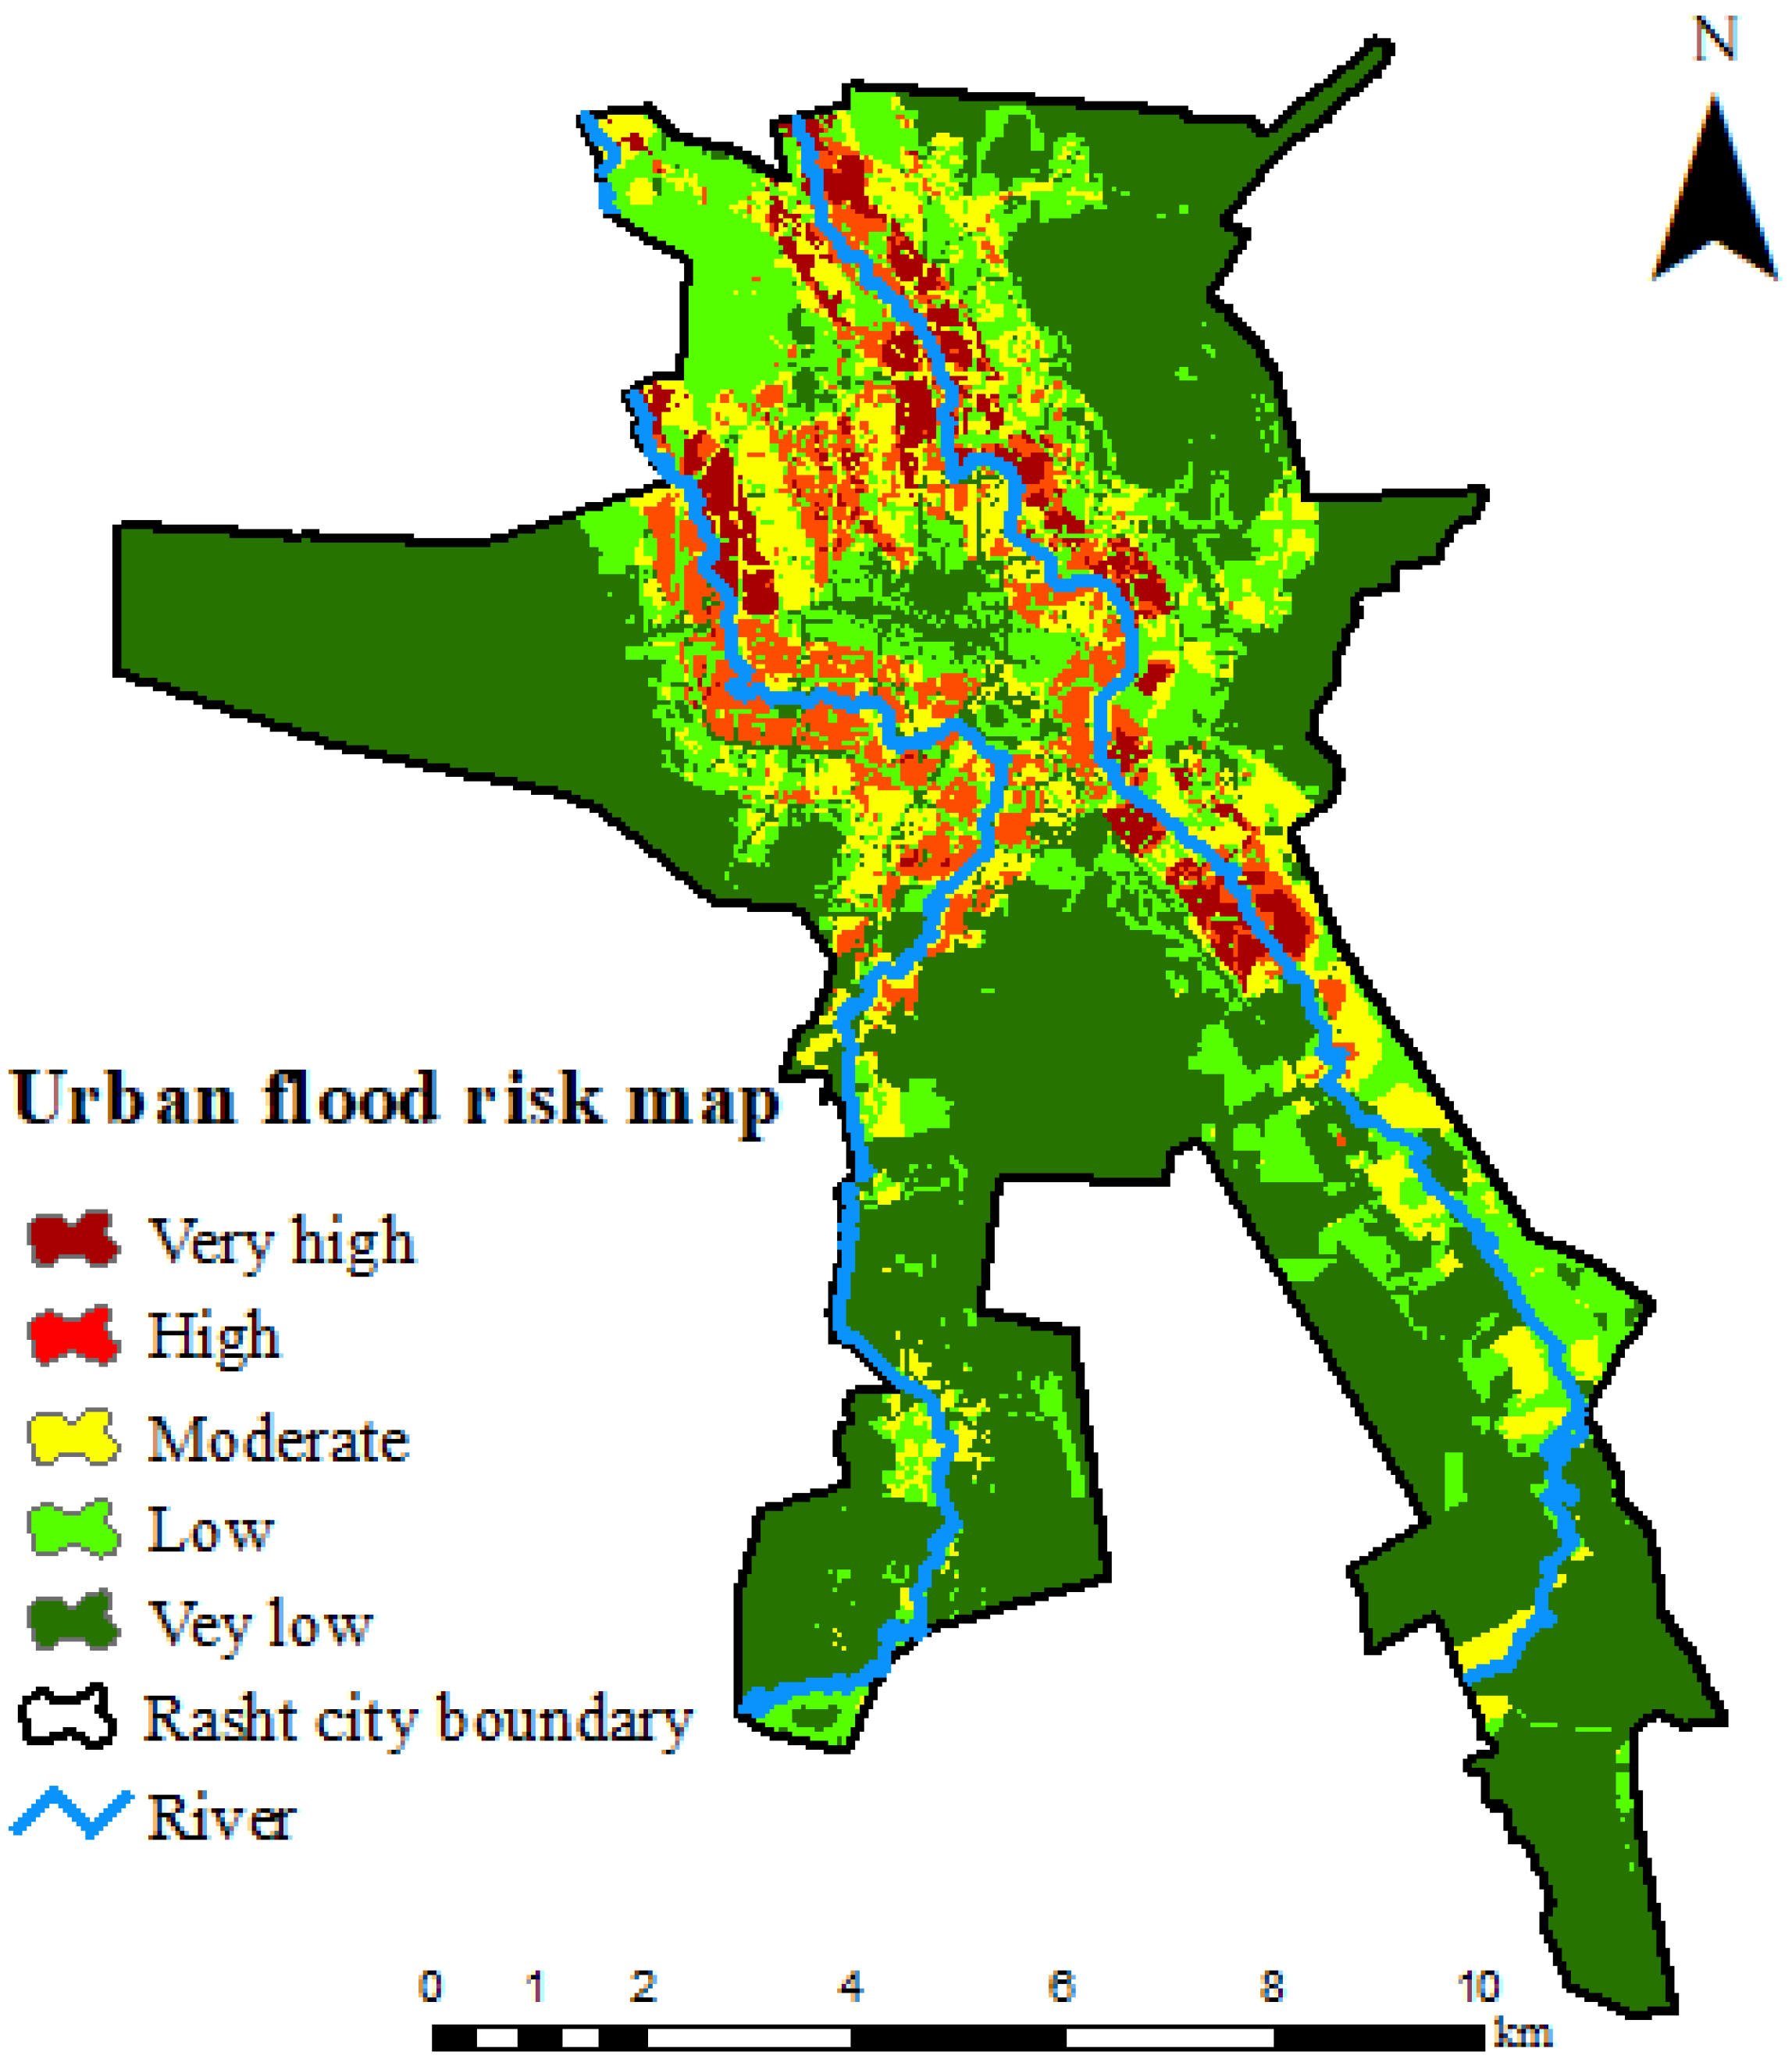
The flood-risk map for Rasht was created by using the hazard and vulnerability maps. According to the above, the vulnerability map was generated by applying the AHP and the hazard map was generated by applying the CART model. The flood-risk map was divided into five classes by using the equal interval method: very low, low, moderate, high, and very high (Figure 9), covering 44.4, 22.7, 14.8, 8.8, and 4.3 km2 of the city, respectively (Table 8). The north and southeast of the area are more exposed to flood risks, and several parts in the west and central areas have high flood risks (Figure 9).
4. Discussion
The results of the hazard modeling indicated that the SVM and MDA models had the poorest performance among all the models. The SVM model does not work well for non-linear relationships. The MDA model is a parametric approach that needs data with a normal distribution [78]. According to the AUC, accuracy, POD, FAR, and precision values, the CART model had the best performance (accuracy = 0.892, POD = 0.867, FAR = 0.071, precision = 0.929, and AUC = 0.947). The models showed that areas close to major rivers are much more exposed to flooding and were categorized as very high and high (about 38% of the area). This corroborates results found by Yang et al. [85].
The land-use and PD maps (Figure 3a,f) showed that residential areas with high and very high population densities are located in areas with very high flood hazards (Figure 6). Therefore, these areas require efforts to minimize future flood damage [81].
Similar to Pham et al. [86] and Darabi et al. [87], the machine-learning algorithms indicated that the factors of distance to rivers and urban drainage density were the most important features. In March 2019, the areas located in the vicinity of the rivers suffered heavily from flooding, which proves the obtained results of this work. In addition to being located along rivers, the weak drainage system in the hazardous areas is another root cause of widespread damage from flooding. Most roads and streets in Rasht, particularly in areas in the north, southeast, and southwest, lack suitable drainage systems (Figure 4i,j). These findings corroborate those found by Falah et al. [88] and Ogden et al. [89].
Generally, the flood-risk map (Figure 9) indicated that the north and southeast areas and several areas in the west and center of the city are most exposed to flood risks. Unplanned developments of residential areas along the rivers and a lack of suitable drainage systems are the most influential causes of inundation and flooding. Appropriate drainage systems and the maintenance of them are necessary for better urban flood management, and it is of great importance to identify the most vulnerable urban residents in all areas for decreasing flood risks.
Due to human activities (such as the development of the city, increasing permeable surfaces, and land-use changes) and climate change, the risk map may change over time. Thus, it is important to perform similar future investigations and compare these results. It may be possible to predict risk maps for future periods by considering local human activities and climate change’s impacts.
5. Conclusions
Flood-risk evaluation is essential for sustainable urban development and sustainable urban water management. A novel approach was suggested that does not require the traditional engineering modeling that requires high-quality input data. Six machine-learning techniques (CART, RF, BRT, MARS, MDA, and SVM) were applied to create a flood-hazard map for Rasht in Iran. The CART model outperformed other models (accuracy = 0.892, POD = 0.867, FAR = 0.071, and precision = 0.929). An urban flood-risk map was created based on vulnerability and hazard maps, which both can serve as a first stage in advancing flood-risk mitigation approaches and allocating warning and forecasting systems. Distance to river, urban drainage density, and distance to urban vulnerable areas are the most significant indicators that influence the flood hazard. The findings show that machine-learning methods are efficient in urban flood-risk assessments. For urban flood vulnerability, based on the AHP method and expert knowledge, the weight for each factor was: population density = 0.363, land use = 0.279, dwelling quality = 0.158, household income = 0.087, distance to cultural heritage = 0.064, and distance to medical centers and hospitals = 0.049; population density is a significant parameter in urban flood vulnerability. The integrated technique outlined in the present study shows credible results can be obtained without complex rainfall–runoff modeling and costly field surveys. The proposed method is especially helpful in areas with little data to describe and exhibit flood hazards. The risk map indicates that the north and southeast regions of Rasht are highly susceptible to flooding and must develop accurate management to prohibit flooding or provide a remedy against flooding.
Author Contributions
Conceptualization, F.T. and B.C.; methodology, F.T. and B.C.; software, F.T.; validation, F.T., R.F. and A.E.; formal analysis, F.T.; investigation, R.F.; data curation, F.T.; writing—original draft preparation, F.T.; writing—review and editing, B.C., R.F. and R.B.; visualization, F.T.; supervision, R.F.; project administration, B.C. All authors have read and agreed to the published version of the manuscript.
Funding
This research received no external funding.
Institutional Review Board Statement
Not applicable.
Informed Consent Statement
Not applicable.
Data Availability Statement
The data that support the findings of this study are available from the corresponding author, upon reasonable request.
Acknowledgments
This study was supported by the MECW (Middle East in the Contemporary World) project at the Centre for Advanced Middle Eastern Studies, Lund University.
Conflicts of Interest
The authors declare no conflict of interest.
References
- Alexander, M.; Viavattene, C.; Faulkner, H.; Priest, S. A GIS-Based Flood Risk Assessment Tool: Supporting Flood Incident Management at the Local Scale; ACADEMIA: San Francisco, CA, USA, 2011. [Google Scholar]
- Feng, L.H.; Lu, J. The Practical Research on Flood Forecasting Based on Artificial Neural Networks. Expert Syst. Appl. 2010, 37, 2974–2977. [Google Scholar] [CrossRef]
- Klaus, S.; Kreibich, H.; Merz, B.; Kuhlmann, B.; Schröter, K. Large-scale, seasonal flood risk analysis foagricultural crops in Germany. Environ. Earth Sci. 2016, 1289, 75. [Google Scholar]
- Modarres, R.; Sarhadi, A.; Burn, D.H. Changes of extreme drought and flood events in Iran. Glob. Planet. Chang. 2016, 144, 67–81. [Google Scholar] [CrossRef]
- Aminyavari, S.; Saghafian, B.; Sharifi, E. Assessment of Precipitation Estimation from the NWP Models and Satellite Products for the Spring 2019 Severe Floods in Iran. Remote Sens. 2019, 11, 2741. [Google Scholar] [CrossRef] [Green Version]
- Hosseini, F.S.; Khalighi, S.H.S.; Salajegheh, A.; Moghaddamnia, A.; Choubin, B. Towards a Flood Vulnerability Assessment of Watershed Using Integration of Decision Making Trial and Evaluation Laboratory, Analytical Network Process, and Fuzzy Theories. Environ. Sci. Pollut. Res. 2021, 28, 62487–62498. [Google Scholar] [CrossRef] [PubMed]
- De Bruijn, K. Resilience and flood risk management. Water Policy 2004, 6, 53–65. [Google Scholar] [CrossRef]
- Overton, I. Modelling floodplain inundation on a regulated river: Integrating GIS, remote sensing and hydrological models. River Res. Appl. 2005, 21, 991–1001. [Google Scholar] [CrossRef]
- Wijayarathne, D.B.; Coulibaly, P. Identification of hydrological models for operational flood forecasting in St. John’s, Newfoundland, Canada. Hydrol. Reg. Stud. 2020, 27, 100646. [Google Scholar] [CrossRef]
- Wiles, J.J.; Levine, N.S. A combined GIS and HEC model for the analysis of the effect of urbanization on flooding; the Swan Creek watershed, Ohio. Environ. Eng. Geosci. 2002, 8, 47–61. [Google Scholar] [CrossRef]
- Miguez, M.G.; Battemarco, B.P.; de Sousa, M.M.; Rezende, O.M.; Veról, A.P.; Gusmaroli, G. Pires and G. Gusmaroli. Urban Flood Simulation Using MODCEL—An Alternative Quasi-2D Conceptual Model. Water 2017, 9, 445. [Google Scholar] [CrossRef] [Green Version]
- Kauffeldt, A.; Wetterhall, F.; Pappenberger, F.; Salamon, P.; Thielen, J. Technical review of large-scale hydrological models for implementation in operational flood forecasting schemes on continental level. Environ. Model. Softw. 2016, 75, 68–76. [Google Scholar] [CrossRef]
- Burgan, H.I.; Icaga, Y. Flood analysis using Adaptive Hydraulics (AdH) model in Akarcay Basin. Tek. Dergi 2019, 30, 9029–9051. [Google Scholar] [CrossRef]
- Unduche, F.; Tolossa, H.; Senbeta, D.; Zhu, E. Evaluation of four hydrological models for operational flood forecasting in a Canadian Prairie watershed. Hydrol. Sci. J. 2018, 63, 1133–1149. [Google Scholar] [CrossRef] [Green Version]
- Mobini, S.; Becker, P.; Larsson, R.; Berndtsson, R. Systemic inequity in urban flood exposure and damage compensation. Water 2020, 12, 3152. [Google Scholar] [CrossRef]
- Nachappa, T.G.; Piralilou, S.T.; Gholamnia, K.; Ghorbanzadeh, O.; Rahmati, O.; Blaschke, T. Flood susceptibility mapping with machine learning, multi-criteria decision analysis and ensemble using Dempster Shafer Theory. J. Hydrol. 2020, 2020, 125275. [Google Scholar] [CrossRef]
- Luu, C.; von Meding, J.A. Flood Risk Assessment of Quang Nam, Vietnam Using Spatial Multicriteria Decision Analysis. Water 2018, 10, 461. [Google Scholar] [CrossRef]
- Ouma, Y.O.; Tateishi, R. Urban flood vulnerability and risk mapping using integrated multi-parametric AHP and GIS: Methodological overview and case study assessment. Water 2014, 6, 1515–1545. [Google Scholar] [CrossRef]
- Danumah, J.H.; Odai, S.N.; Saley, B.M.; Szarzynski, J.; Thiel, M.; Kwaku, A.; Kouame, F.K.; Akpa, L.Y. Flood risk assessment and mapping in Abidjan district using multi-criteria analysis (AHP) model and geoinformation techniques, (cote d’ivoire). Geoenviron. Disasters 2016, 3, 10. [Google Scholar] [CrossRef] [Green Version]
- Zarei, M.; Bozorg-Haddad, O.; Baghban, S.; Delpasand, N.; Goharian, E.; Loáiciga, H.A. Machine-learning algorithms for forecast-informed reservoir operation (FIRO) to reduce flood damages. Sci. Rep. 2021, 11, 24295. [Google Scholar] [CrossRef]
- Mateo-Garcia, G.; Veitch-Michaelis, J.; Smith, L.; Vlad Oprea, S.; Schumann, G.; Gal, Y.; Baydin, A.G.; Backes, D. Towards global flood mapping onboard low cost satellites with machine learning. Sci. Rep. 2021, 11, 7249. [Google Scholar] [CrossRef]
- Dong, B.; Xia, J.; Zhou, M.; Li, Q.; Ahmadian, R.; Falconer, R.A. Integrated modeling of 2D urban surface and 1D sewer hydrodynamic processes and flood risk assessment of people and vehicles. Sci. Total Environ. 2022, 827, 154098. [Google Scholar] [CrossRef]
- Musolino, G.; Ahmadian, R.; Falconer, R. Comparison of flood hazard assessment criteria for pedestrians with a refined mechanics-based method. J. Hydrol. X 2020, 9, 100067. [Google Scholar] [CrossRef]
- Tehrany, M.S.; Kumar, L.; Shabani, F. A novel GIS-based ensemble technique for flood susceptibility mapping using evidential belief function and support vector machine: Brisbane, Australia. PeerJ 2019, 7, e7653. [Google Scholar] [CrossRef]
- Chen, W.; Li, Y.; Xue, W.; Shahabi, H.; Li, S.; Hong, H.; Wang, X.; Bian, H.; Zhang, S.; Pradhan, B.; et al. Modeling flood susceptibility using data-driven approaches of naïve Bayes tree, alternating decision tree, and random forest methods. Sci. Total Environ. 2020, 701, 134979. [Google Scholar] [CrossRef]
- Berk, R.A. Classification and Regression Trees (CART). In Statistical Learning from a Regression Perspective; Springer Series in Statistics; Springer: New York, NY, USA, 2008. [Google Scholar]
- Zhao, G.; Pang, B.; Xu, Z.; Yue, J.; Tu, T. Mapping flood susceptibility in mountainous areas on a national scale in China. Sci. Total Environ. 2018, 615, 1133–1142. [Google Scholar] [CrossRef]
- Shafizadeh-Moghadam, H.; Valavi, R.; Shahabi, H.; Chapi, K.; Shirzadi, A. Novel forecasting approaches using combination of machine learning and statistical models for flood susceptibility mapping. J. Environ. Manag. 2018, 217, 1–11. [Google Scholar] [CrossRef] [Green Version]
- Friedman, J.H. Multivariate Adaptive Regression Splines. Ann. Stat. 1991, 19, 1–67. [Google Scholar] [CrossRef]
- Friedman, J.H. Fast MARS; Technical Report; Department of Statistics, Stanford University: Stanford, CA, USA, 1993; p. 110. [Google Scholar]
- Hair, J.F.; Black, W.C.; Babin, B.J.; Anderson, R.E.; Tatham, R.L. Multivariate data analysis. N. J. 1998, 5, 207–219. [Google Scholar]
- Tehrany, M.S.; Pradhan, B.; Mansor, S.; Ahmad, N. Flood susceptibility assessment using GIS-based support vector machine model with different kernel types. Catena 2015, 125, 91–101. [Google Scholar] [CrossRef]
- Rahmati, O.; Pourghasemi, H.R. dentification of Critical Flood Prone Areas in Data-Scarce and Ungauged Regions: A Comparison of Three Data Mining Models. Water Resour. Manag. 2017, 31, 1473–1487. [Google Scholar] [CrossRef]
- Lawrence, R.L.; Wright, A. Rule-Based Classification Systems Using Classification and regression tree (CART) Analysis. Photogramm. Eng. Remote Sens. 2001, 12, 1137–1142. [Google Scholar]
- Timofeev, E.A. Random minimal trees. Theory Probab. Appl. 1984, 29, 134–141. [Google Scholar] [CrossRef]
- Belgiu, M.; Drăgu, L. Random forest in remote sensing: A review of applications and future directions. ISPRS J. Photogramm. Remote Sens. 2016, 114, 24–31. [Google Scholar] [CrossRef]
- Cutler, A.; Cutler, D.R.; Stevens, J.R. Random Forests BT—Ensemble Machine Learning: Methods and Applications. In Ensemble machine learning; Springer: Boston, MA, USA, 2012; Volume 45, pp. 157–175. [Google Scholar]
- Cutler, D.R.; Edwards, T.C.; Beard, K.H.; Cutler, A.; Hess, K.T.; Gibson, J.; Lawler, J.J. Random forests for classification in ecology. Ecology 2007, 88, 2783–2792. [Google Scholar] [CrossRef]
- Yang, R.M.; Zhang, G.L.; Liu, F.; Lu, Y.Y.; Yang, F.; Yang, F.; Yang, M.; Zhao, Y.G.; Li, D.C. Comparison of boosted regression tree and random forest models for mapping topsoil organic carbon concentration in an alpine ecosystem. Ecol. Indic. 2016, 60, 870–878. [Google Scholar] [CrossRef]
- Schapire, R.E. The boosting approach to machine learning: An overview. Nonlinear Estim. Classif. 2003, 171, 149–171. [Google Scholar]
- Zhao, G.; Pang, B.; Xu, Z.; Peng, D.; Xu, L. Assessment of urban flood susceptibility using semi-supervised machine learning model. Sci. Total Environ. 2019, 659, 940–949. [Google Scholar] [CrossRef]
- Sharma, A.; Tiwari, K.N.; Bhadoria, P.B.S. Effect of land use land cover change on soil erosion potential in an agricultural watershed. Environ. Monit. Assess. 2011, 173, 789–801. [Google Scholar] [CrossRef]
- National Statistics Center of Iran. General Population and Housing Census and Agricultural Census. 2016. Available online: https://www.amar.org.ir/2016/11/16 (accessed on 27 February 2022).
- Tarh-O-Kavosh Consulting Engineers. Rasht Comprehensive Planning (RCP); Final Report; Tarh-O-Kavosh Consulting Engineers: Rasht, Iran, 2015. [Google Scholar]
- Hosseini, O. Identifying the most important causes of floods in Rasht (case study of Rasht). In Proceedings of the 3rd National Conference of Flood Management and Engineering, Tehran, Iran, 30 October 2015. [Google Scholar]
- Munyai, R.B.; Musyoki, A.; Nethengwe, N.S. An assessment of flood vulnerability and adaptation: A case study of Hamutsha-Muungamunwe village, Makhado municipality. Jamba J. Disaster Risk Stud. 2019, 11, 1–8. [Google Scholar] [CrossRef] [Green Version]
- Saaty, T.L. The Analytic Hierarchy Process: Planning, Priority Setting, Resource Allocation; Mc Graw-Hill: New York, NY, USA, 1980. [Google Scholar]
- Yalcin, A. GIS-based landslide susceptibility mapping using analytical hierarchy process and bivariate statistics in Ardesen (Turkey): Comparisons of results and confirmations. Catena 2008, 72, 1–12. [Google Scholar] [CrossRef]
- Bidwai, D.; Suman, S.; Joy, S. Flood Risk Assessment Using Analytical Hierarchy Process (AHP) and Machine Learning: A Comparison. In Case Studies & Projects, Environment, Machine Learning; Omdena: Trieste, Italy, 2021. [Google Scholar]
- Brouwer, R.; Akter, S.; Brander, L.; Haque, E. Socioeconomic vulnerability and adaptation to environmental risk: A case study of climate change and flooding in Bangladesh. Risk Anal. 2007, 27, 313–326. [Google Scholar] [CrossRef] [Green Version]
- Ward, P.S.; Shively, G.E. Disaster risk, social vulnerability, and economic development. Disasters 2017, 41, 324–351. [Google Scholar] [CrossRef]
- Versini, P.A.; Gaume, E.; Andrieu, H. Assessment of the susceptibility of roads to flooding based on geographical information—Test in a flash flood prone area (the Gard region, France). Nat. Hazards Earth Syst. Sci. 2010, 10, 793–803. [Google Scholar] [CrossRef] [Green Version]
- United States Department of Agriculture. Chapter 7—Hydrologic soil groups. In National Engineering Handbook; United States Department of Agriculture: Washington, DC, USA, 2007; p. 630. [Google Scholar]
- Gittleman, M.; Farmer, C.J.; Kremer, P.; McPhearson, T. Estimating stormwater runoff for community gardens in New York City. Urban Ecosyst. 2017, 20, 129–139. [Google Scholar] [CrossRef] [Green Version]
- USDA; SCS. Urban hydrology for small watersheds. Tech. Release 1986, 55, 2–6. [Google Scholar]
- Zhan, X.; Huang, M.L. ArcCN-Runoff: An ArcGIS tool for generating curve number and runoff maps. Environ. Model. Softw. 2004, 19, 875–879. [Google Scholar] [CrossRef]
- Darabi, H.; Shahedi, K.; Solaimani, K.; Miryaghoubzadeh, M. Prioritization of subwatersheds based on flooding conditions using hydrological model, multivariate analysis and remote sensing technique. Water Environ. J. 2014, 28, 382–392. [Google Scholar] [CrossRef]
- Menberu, M.W.; Haghighi, A.T.; Ronkanen, A.K.; Kværner, J.; Kløve, B. Runoff curve numbers for peat-dominated watersheds. J. Hydrol. Eng. 2014, 20, 04014058. [Google Scholar] [CrossRef]
- Komolafe, A.A.; Herath, S.; Avtar, R. Methodology to Assess Potential Flood Damages in Urban Areas under the Influence of Climate Change. Nat. Hazards Rev. 2018, 19, 05018001. [Google Scholar] [CrossRef]
- Mahmoud, S.H.; Gan, T.Y. Urbanization and climate change implications in flood risk management: Developing an efficient decision support system for flood susceptibility mapping. Sci. Total Environ. 2018, 636, 152–167. [Google Scholar] [CrossRef]
- Yalcin, A.; Reis, S.; Aydinoglu, A.C.; Yomralioglu, T. A GIS-based comparative study of frequency ratio, analytical hierarchy process, bivariate statistics and logistics regression methods for landslide susceptibility mapping in Trabzon, NE Turkey. Catena 2011, 85, 274–287. [Google Scholar] [CrossRef]
- Naimi, B.; Araújo, M.B. sdm: A reproducible and extensible R platform for species distribution modelling. Ecography 2016, 39, 368–375. [Google Scholar] [CrossRef] [Green Version]
- Breiman, L.; Friedman, J.; Olshen, R.; Stone, C. Classification and Regression Trees (Wadsworth Statistics/Probability); Chapman and Hall: New York, NY, USA, 1984. [Google Scholar]
- Brownlee, J. Master Machine Learning Algorithms; Machine Learning Mastery: San Francisco, CA, USA, 2016. [Google Scholar]
- Breiman, L. Random forests. Mach. Learn 2001, 45, 5–32. [Google Scholar] [CrossRef] [Green Version]
- Aertsen, W.; Kint, V.; de Vos, B.; Deckers, J.; van Orshoven, J.; Muys, B. Predicting forest site productivity in temperate lowland from forest floor, soil and litterfall characteristics using boosted regression trees. Plant Soil 2012, 354, 157–172. [Google Scholar] [CrossRef] [Green Version]
- Elith, J.; Leathwick, J.R.; Hastie, T. A working guide to boosted regression trees. J. Anim. Ecol. 2008, 77, 802–813. [Google Scholar] [CrossRef]
- Abe, S. Multiclass Support Vector Machines; Royal Holloway University of London: London, UK, 2010; pp. 113–161. [Google Scholar]
- Sokolova, M.; Japkowicz, N.; Szpakowicz, S. Beyond Accuracy, F-Score and ROC: A Family of Discriminant Measures for Performance Evaluation; AAAI Workshop—Technical Report; Association for the Advancement of Artificial Intelligence: Menlo Park, CA, USA, 2006; pp. 1015–1021. [Google Scholar]
- Mosavi, A.; Ozturk, P.; Chau, K.W. Flood prediction using machine learning models: Literature review. Water 2018, 10, 1536. [Google Scholar] [CrossRef] [Green Version]
- Wilks, D.S. Cluster Analysis. In Statistical Methods in the Atmospheric Sciences; Elsevier: Amsterdam, The Netherlands, 2011; pp. 603–616. [Google Scholar]
- Levine, R.A.; Wilks, D.S. Statistical Methods in the Atmospheric Sciences. J. Am. Stat. Assoc. 2000, 344, 95. [Google Scholar] [CrossRef]
- Frattini, P.; Crosta, G.; Carrara, A. Techniques for evaluating the performance of landslide susceptibility models. Eng. Geol. 2010, 111, 62–72. [Google Scholar] [CrossRef]
- Yesilnacar, E.K. The Application of Computational Intelligence to Landslide Susceptibility Mapping in Turkey. Ph.D. Thesis, University of Melbourne, Melbourne, Australia, 2005; p. 200. [Google Scholar]
- Zêzere, J.L.; Garcia, R.A.C.; Oliveira, S.C.; Reis, E. Probabilistic landslide risk analysis considering direct costs in the area north of Lisbon (Portugal). Geomorphology 2008, 94, 467–495. [Google Scholar] [CrossRef]
- Chung, C.J.F.; Fabbri, A.G. Systematic procedures of landslide hazard mapping for risk assessment using spatial prediction models. In Landslide Hazard Risk; John Wiley & Sons: Hoboken, NJ, USA, 2012; pp. 139–174. [Google Scholar]
- Batuwita, R.; Palade, V. Class Imbalance Learning Methods for Support Vector Machines. In Imbalanced Learning; John Wiley & Sons: Hoboken, NJ, USA, 2013. [Google Scholar]
- Xie, C.; Luo, C.; Yu, X. Financial distress prediction based on SVM and MDA methods: The case of Chinese listed companies. Qual. Quant. 2011, 45, 671–686. [Google Scholar] [CrossRef]
- Judith, T. Principles of Map Design; The Guilford Press: New York, NY, USA, 2010; p. 167. [Google Scholar]
- Slocum, T. Thematic Cartography and Geovisualization; Pearson Prentice Hall: Upper Saddle River, NJ, USA; New York, NY, USA, 2009; p. 60. [Google Scholar]
- Kourgialas, N.N.; Karatzas, G.P. Flood management and a GIS modeling method to assess flood hazard areas—A case study. Hydrol. Sci. J. 2012, 56, 212–225. [Google Scholar] [CrossRef]
- Skinner, C.J.; Rao, J.N.K. Estimation in dual frame survey with complex design. J. Am. Stat. Assoc. 1996, 91, 349–356. [Google Scholar] [CrossRef]
- Samanlioglu, F.; Ayağ, Z. Fuzzy ANP-based PROMETHEE II approach for evaluation of machine tool alternatives. J. Intell. Fuzzy Syst. 2016, 30, 2223–2235. [Google Scholar] [CrossRef]
- Azareh, A.; Rafiei Sardooi, E.; Choubin, B.; Barkhori, S.; Shahdadi, A.; Adamowski, J.; Shamshirband, S. Incorporating multi-criteria decision-making and fuzzy-value functions for flood susceptibility assessment. Geocarto Int. 2021, 36, 2345–2365. [Google Scholar] [CrossRef]
- Yang, W.; Xu, K.; Lian, J.; Ma, C.; Bin, L. Integrated flood vulnerability assessment approach based on TOPSIS and Shannon entropy methods. Ecol. Indic. 2018, 89, 269–280. [Google Scholar] [CrossRef]
- Pham, B.T.; Avand, M.; Janizadeh, S.; Van Phong, T.; Al-Ansari, N.; Ho, L.S.; Das, S.; Van Le, H.; Amini, A.; Bozchaloei, S.K.; et al. GIS Based Hybrid Computational Approaches for Flash Flood Susceptibility Assessment. Water 2020, 12, 683. [Google Scholar] [CrossRef] [Green Version]
- Darabi, H.; Haghighi, A.T.; Mohamadi, M.A.; Rashidpour, M.; Ziegler, A.D.; Hekmatzadeh, A.A.; Kløve, B. Urban flood risk mapping using data-driven geospatial techniques for a flood-prone case area in Iran. Hydrol. Res. 2020, 51, 127–142. [Google Scholar] [CrossRef] [Green Version]
- Falah, F.; Rahmati, O.; Rostami, M.; Ahmadisharaf, E.; Daliakopoulos, I.N.; Pourghasemi, H.R. Artificial Neural Networks for Flood Susceptibility Mapping in Data-Scarce Urban Areas. In Spatial Modeling in GIS and R for Earth and Environmental Sciences; Elsevier: Amsterdam, The Netherlands, 2019; pp. 323–336. [Google Scholar]
- Ogden, F.L.; Pradhan, N.R.; Downer, C.W.; Zahner, J.A. Relative importance of impervious area, drainage density, width function, and subsurface storm drainage on flood runoff from an urbanized catchment. Water Resour. 2011, 47. [Google Scholar] [CrossRef] [Green Version]
Figure 1.
Location of Rasht City in Iran.

Figure 2.
Examples of the 2019 floods in Rasht (photos by Fereshteh Taromideh).

Figure 3.
Vulnerability factors: (a) population density (PD), (b) dwelling quality (DQ), (c) household income (HI), (d) distance to cultural heritage (DTCH), (e) distance to medical centers and hospitals (DTMCH), and (f) land use.
Figure 3.
Vulnerability factors: (a) population density (PD), (b) dwelling quality (DQ), (c) household income (HI), (d) distance to cultural heritage (DTCH), (e) distance to medical centers and hospitals (DTMCH), and (f) land use.


Figure 4.
Flood hazard factors: (a) elevation, (b) slope angle, (c) aspect, (d) rainfall, (e) distance to rivers, (f) distance to streets, (g) soil hydrological group, (h) curve number, (i) distance to urban drainage, (j) urban drainage density, and (k) land use.
Figure 4.
Flood hazard factors: (a) elevation, (b) slope angle, (c) aspect, (d) rainfall, (e) distance to rivers, (f) distance to streets, (g) soil hydrological group, (h) curve number, (i) distance to urban drainage, (j) urban drainage density, and (k) land use.

Figure 5.
Schematic of suggested flood-risk methodology.

Figure 6.
Flood-hazard maps based on the (a) CART, (b) RF, (c) BRT, (d) MARS, (e) MDA, and (f) SVM models.
Figure 6.
Flood-hazard maps based on the (a) CART, (b) RF, (c) BRT, (d) MARS, (e) MDA, and (f) SVM models.

Figure 7.
Importance of conditioning factors for urban flood hazards based on AUCs.


Figure 8.
Flood vulnerability map for the city of Rasht.

Figure 9.
Flood-risk map for Rasht based on the CART (best hazard model) and AHP methods.


Table 1.
Investigated vulnerability factors.
| Factor | Type | Relationship with Vulnerability |
|---|---|---|
| Population density (PD) | Social | Higher number of people, higher vulnerability |
| Land use | Physical | Based on expert knowledge |
| Dwelling quality (DQ) | Economic | Higher dwelling quality, lower vulnerability |
| Household income (HI) | Economic | Higher income, lower vulnerability |
| Distance to cultural heritage (DTCH) | Social | Higher DTCH, lower vulnerability |
| Distance to medical centers and hospitals (DTMCH) | Social | Higher DTMCH, higher vulnerability |
Table 2.
Models’ performance using the training dataset.
| Criterion | CART | RF | BRT | MARS | MDA | SVM |
|---|---|---|---|---|---|---|
| Accuracy | 0.985 | 0.931 | 0.901 | 0.869 | 0.854 | 0.831 |
| POD | 0.985 | 0.924 | 0.906 | 0.871 | 0.833 | 0.794 |
| FAR | 0.015 | 0.061 | 0.077 | 0.108 | 0.108 | 0.169 |
| Precision | 0.985 | 0.938 | 0.923 | 0.892 | 0.892 | 0.831 |
Table 3.
Models’ performance using the validation dataset.
| Criterion | CART | RF | BRT | MARS | MDA | SVM |
|---|---|---|---|---|---|---|
| Accuracy | 0.892 | 0.875 | 0.857 | 0.821 | 0.811 | 0.768 |
| POD | 0.867 | 0.839 | 0.827 | 0.801 | 0.788 | 0.759 |
| FAR | 0.071 | 0.071 | 0.111 | 0.133 | 0.143 | 0.214 |
| Precision | 0.929 | 0.928 | 0.889 | 0.867 | 0.857 | 0.786 |
| AUC | 0.947 | 0.941 | 0.921 | 0.916 | 0.889 | 0.781 |
Table 4.
Areas for different flood-hazard classes derived from the CART, RF, BRT, MARS, MDA, and SVM models.
Table 4.
Areas for different flood-hazard classes derived from the CART, RF, BRT, MARS, MDA, and SVM models.
| Flood Hazard | CART | RF | BRT | MARS | MDA | SVM | ||||||
|---|---|---|---|---|---|---|---|---|---|---|---|---|
| (km2) | (%) | (km2) | (%) | (km2) | (%) | (km2) | (%) | (km2) | (%) | (km2) | (%) | |
| Very high | 20.6 | 21.7 | 14.1 | 14.8 | 21.7 | 22.8 | 24.9 | 26.3 | 32.2 | 33.9 | 1.6 | 1.7 |
| High | 19.1 | 20.1 | 15.2 | 15.9 | 14.8 | 15.6 | 10.1 | 10.6 | 37.1 | 39.1 | 1.8 | 1.9 |
| Moderate | 21.2 | 22.3 | 29.2 | 30.7 | 14.4 | 15.2 | 9.6 | 10.1 | 7.9 | 8.3 | 2.3 | 2.5 |
| Low | 7.3 | 7.7 | 22.8 | 23.9 | 20.5 | 21.5 | 12.4 | 13.1 | 6.7 | 7.1 | 85.9 | 90.5 |
| Very low | 26.8 | 28.2 | 13.7 | 14.7 | 23.6 | 24.9 | 37.9 | 39.9 | 11.1 | 11.6 | 3.2 | 3.4 |
| Total | 95 | 100 | 95 | 100 | 95 | 100 | 95 | 100 | 95 | 100 | 95 | 100 |
Table 5.
Importance of the flood-vulnerability indicators based on the AHP method.
| Indicator | Weight |
|---|---|
| Population density (PD) | 0.363 |
| Land use | 0.279 |
| Dwelling quality (DQ) | 0.158 |
| Household income (HI) | 0.087 |
| Distance to cultural heritage (DTCH) | 0.064 |
| Distance to medical centers and hospitals (DTMCH) | 0.049 |
| Total | 1.000 |
Table 6.
Fuzzy membership function for different indicators.
| Indicator | Membership Function |
|---|---|
| Population density (PD) | Linear increasing |
| Dwelling quality (DQ) | Linear decreasing |
| Household income (HI) | Linear decreasing |
| Distance to cultural heritage (DTCH) | Linear decreasing |
| Distance to medical centers and hospitals (DTMCH) | Linear increasing |
| Land use | User-defined (0 for barren land; 0.1 for green space and water bodies; 0.3 for sports venues; 0.6 for urban facilities and equipment, cultural heritage, and tourist places; 0.8 for offices, religious venues, commercial service venues, and animal husbandry; 0.9 for agricultural areas, roads and streets, educational venues, medical services, and industrial areas; and 1 for residential areas) |
Table 7.
Areas with different flood vulnerability categories.
| Flood Vulnerability | km2 |
|---|---|
| Very high | 22.3 |
| High | 14.7 |
| Moderate | 18.8 |
| Low | 11.9 |
| Very low | 27.3 |
| Total | 95 |
Table 8.
Areas with different flood risk categories.
| Risk Class | km2 |
|---|---|
| Very high | 4.3 |
| High | 8.8 |
| Moderate | 14.8 |
| Low | 22.7 |
| Very low | 44.4 |
| Total | 95 |
Publisher’s Note: MDPI stays neutral with regard to jurisdictional claims in published maps and institutional affiliations. |
© 2022 by the authors. Licensee MDPI, Basel, Switzerland. This article is an open access article distributed under the terms and conditions of the Creative Commons Attribution (CC BY) license (https://creativecommons.org/licenses/by/4.0/).
Share and Cite
MDPI and ACS Style
Taromideh, F.; Fazloula, R.; Choubin, B.; Emadi, A.; Berndtsson, R. Urban Flood-Risk Assessment: Integration of Decision-Making and Machine Learning. Sustainability 2022, 14, 4483. https://0-doi-org.brum.beds.ac.uk/10.3390/su14084483
AMA Style
Taromideh F, Fazloula R, Choubin B, Emadi A, Berndtsson R. Urban Flood-Risk Assessment: Integration of Decision-Making and Machine Learning. Sustainability. 2022; 14(8):4483. https://0-doi-org.brum.beds.ac.uk/10.3390/su14084483
Chicago/Turabian StyleTaromideh, Fereshteh, Ramin Fazloula, Bahram Choubin, Alireza Emadi, and Ronny Berndtsson. 2022. "Urban Flood-Risk Assessment: Integration of Decision-Making and Machine Learning" Sustainability 14, no. 8: 4483. https://0-doi-org.brum.beds.ac.uk/10.3390/su14084483
Note that from the first issue of 2016, this journal uses article numbers instead of page numbers. See further details here.