
GIS-Based Frequency Ratio and Analytic Hierarchy Process for Forest Fire Susceptibility Mapping in the Western Region of Syria

 ,
,
Abstract
:1. Introduction
2. Material and Methods
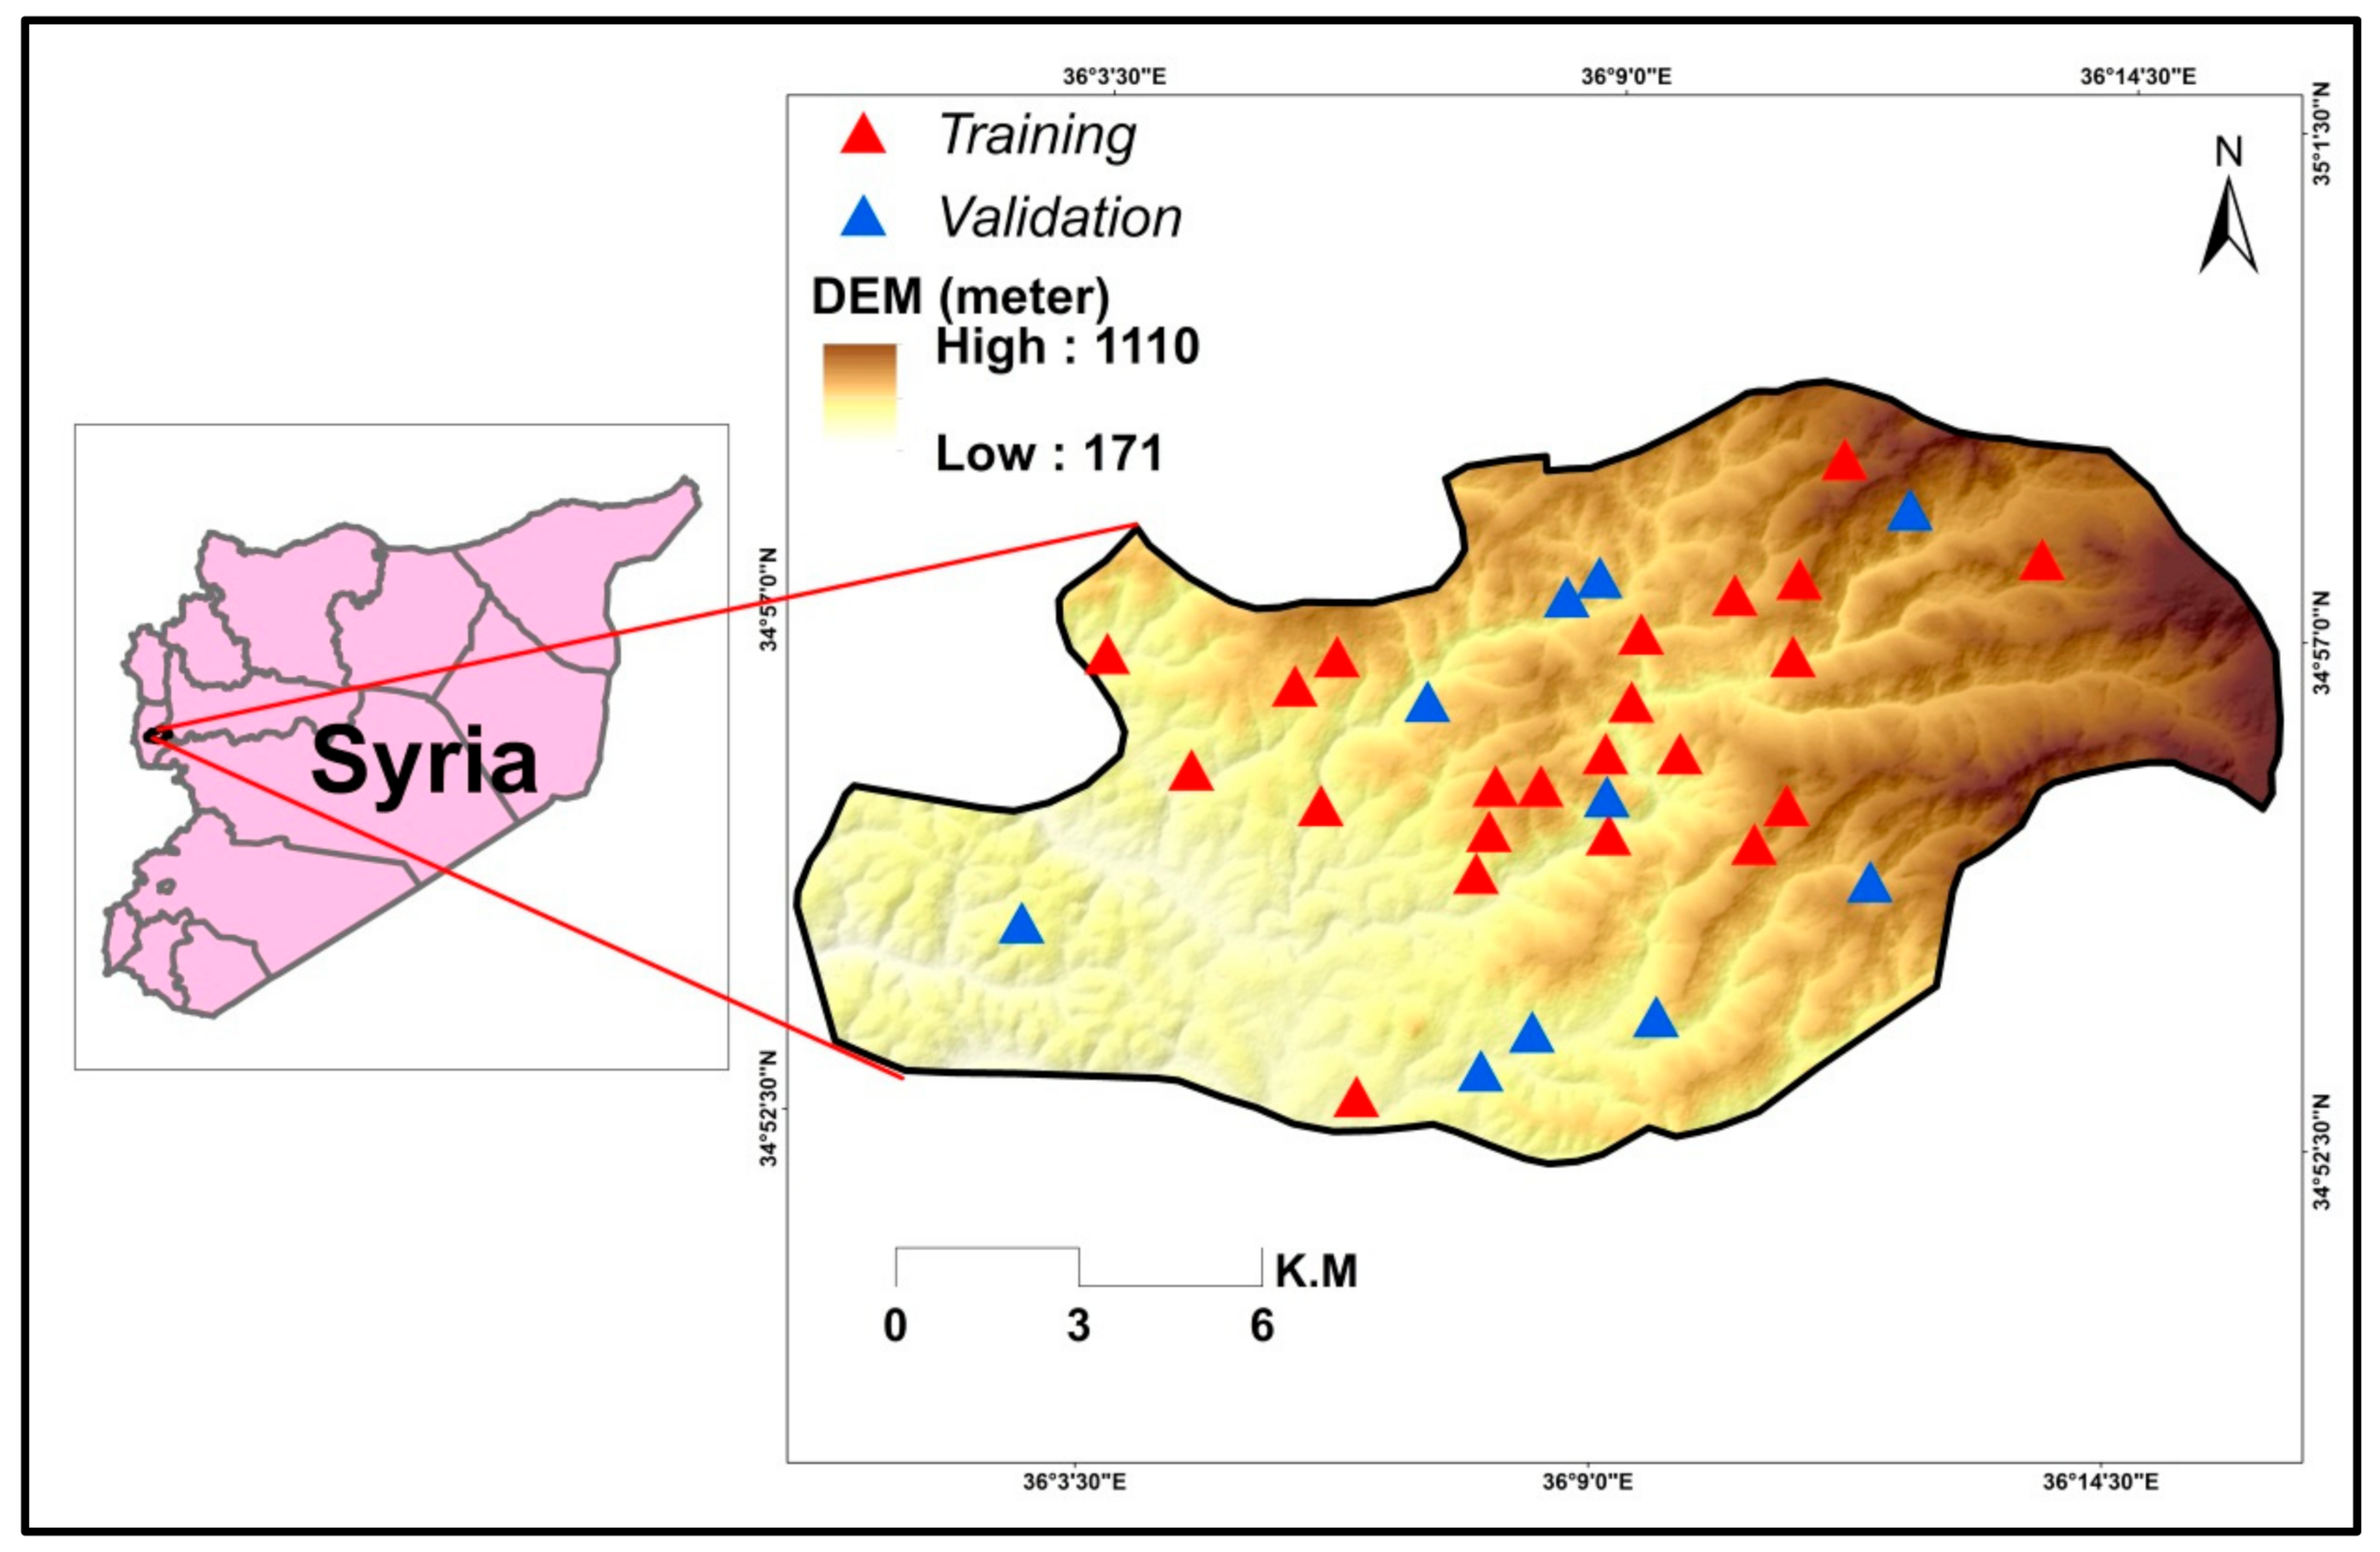
2.1. Study Area
2.2. Data Used
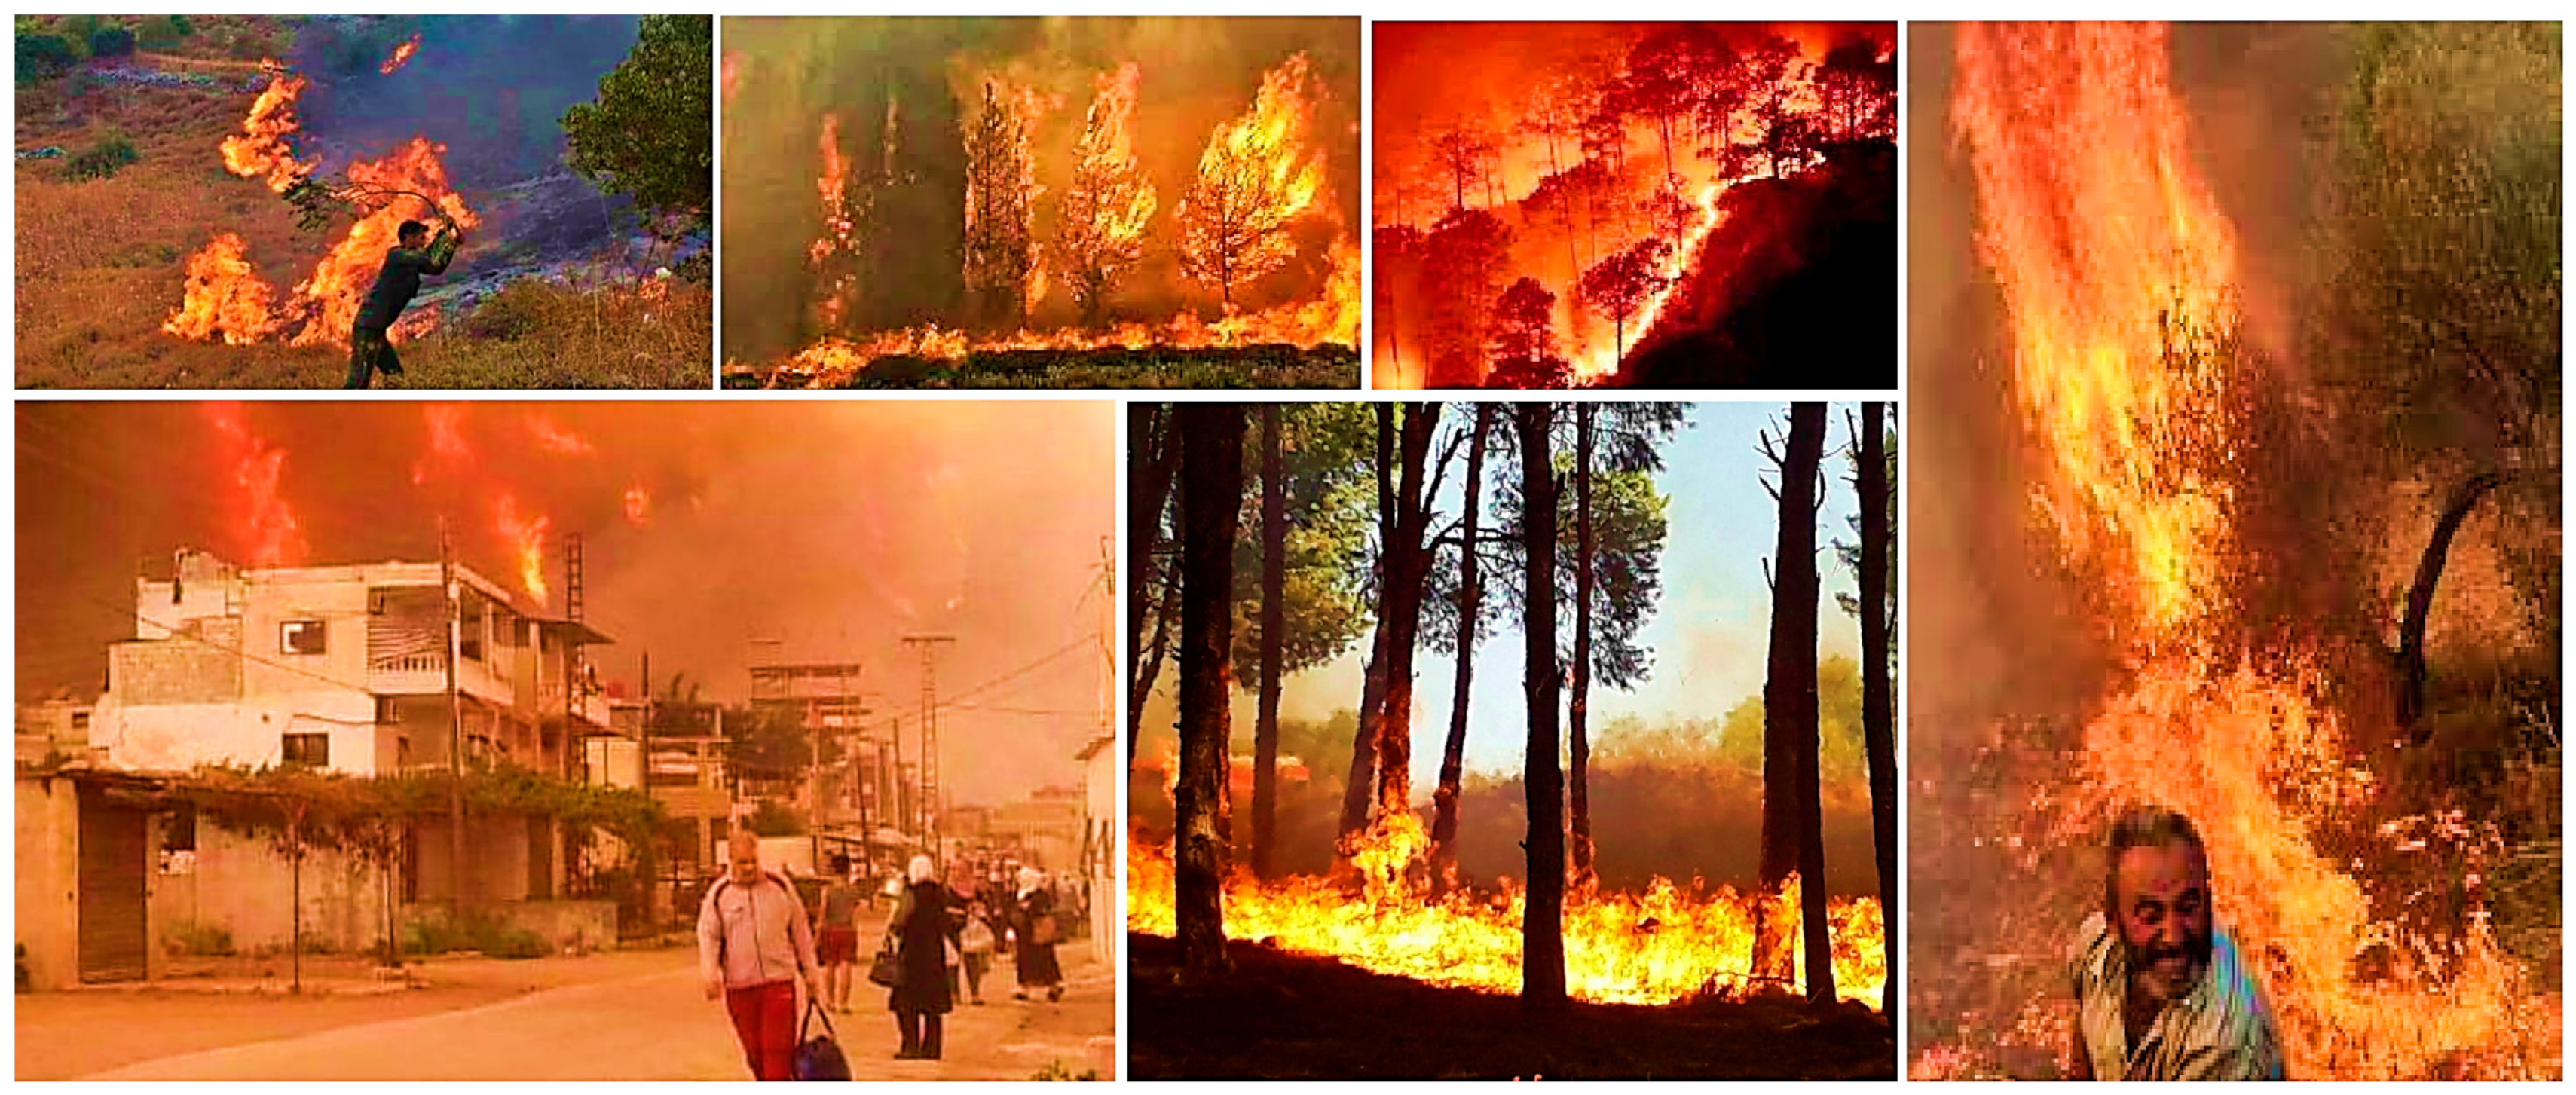
2.3. Forest Fire Inventory Map
2.4. Causative Factor Layers
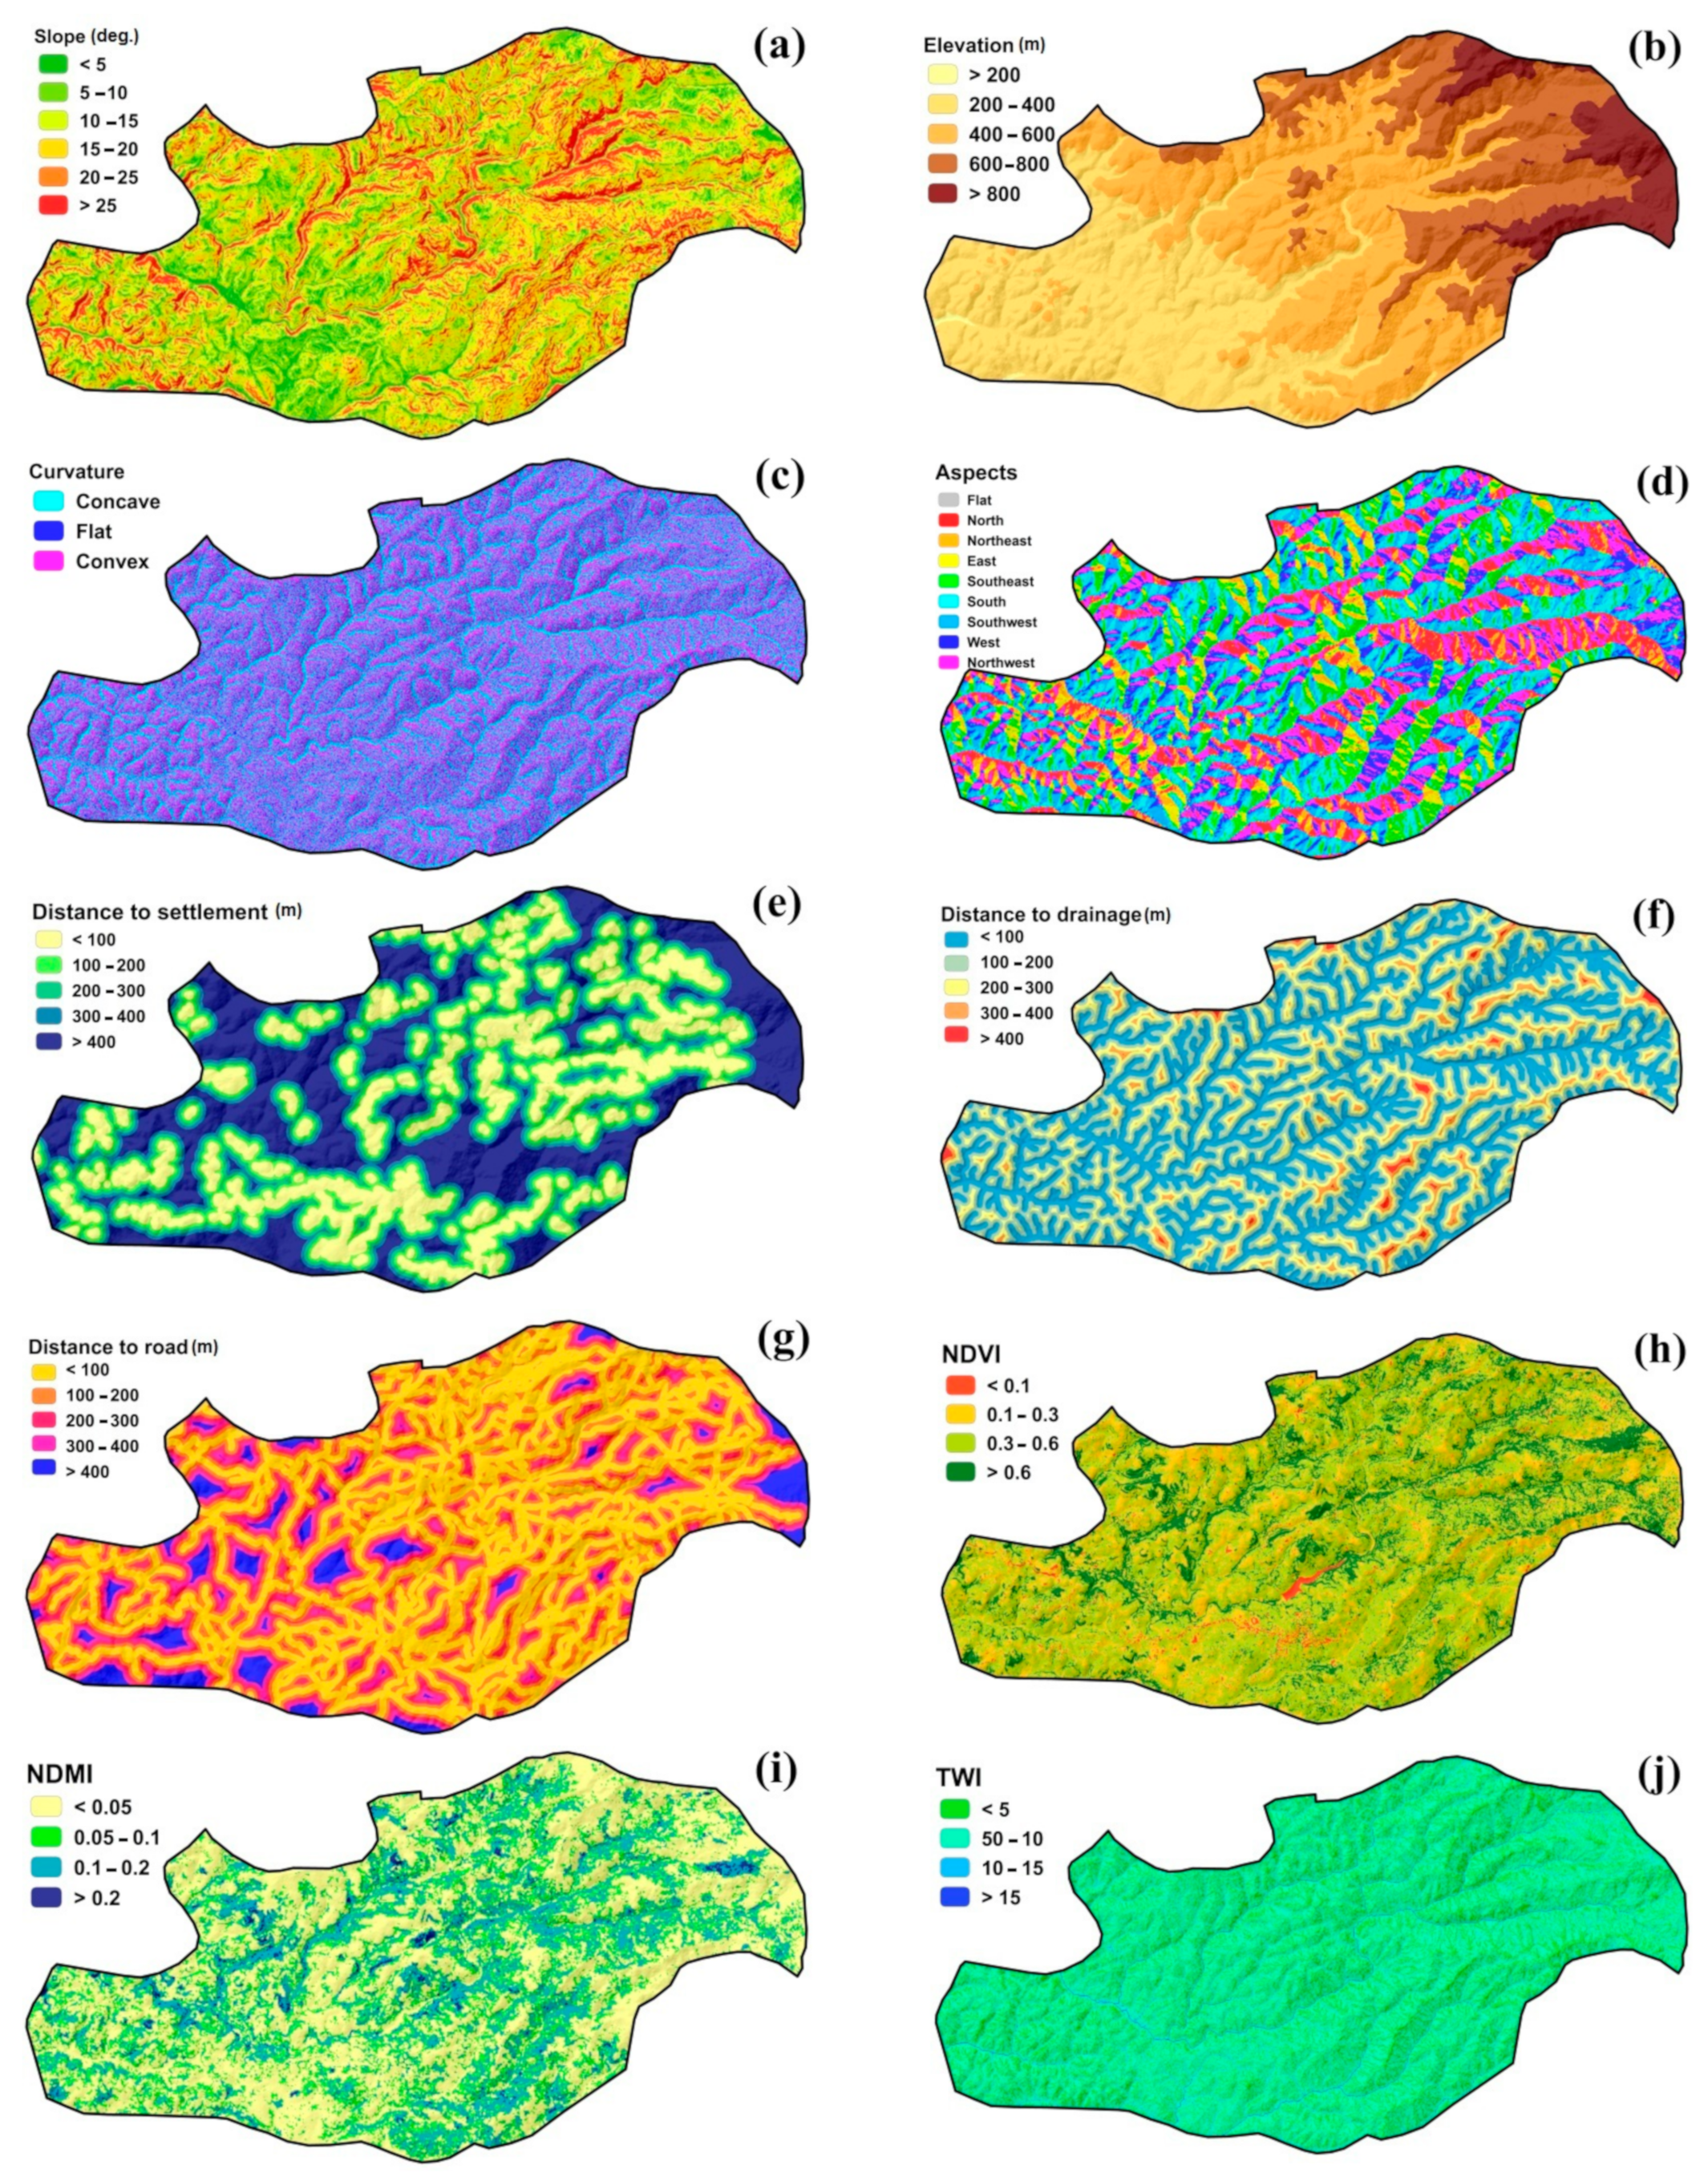
2.4.1. Slope (S)
2.4.2. Elevation (EI)
2.4.3. Curvature (CV)
2.4.4. Aspects (AS)
2.4.5. Distance to Settlement (DS)
2.4.6. Distance to Drainage (DD)
2.4.7. Distance to Road (DR)
2.4.8. Normalized Difference Vegetation Index (NDVI)
2.4.9. Normalized Difference Moisture Index (NDMI)
2.4.10. Topographic Wetness Index (TWI)
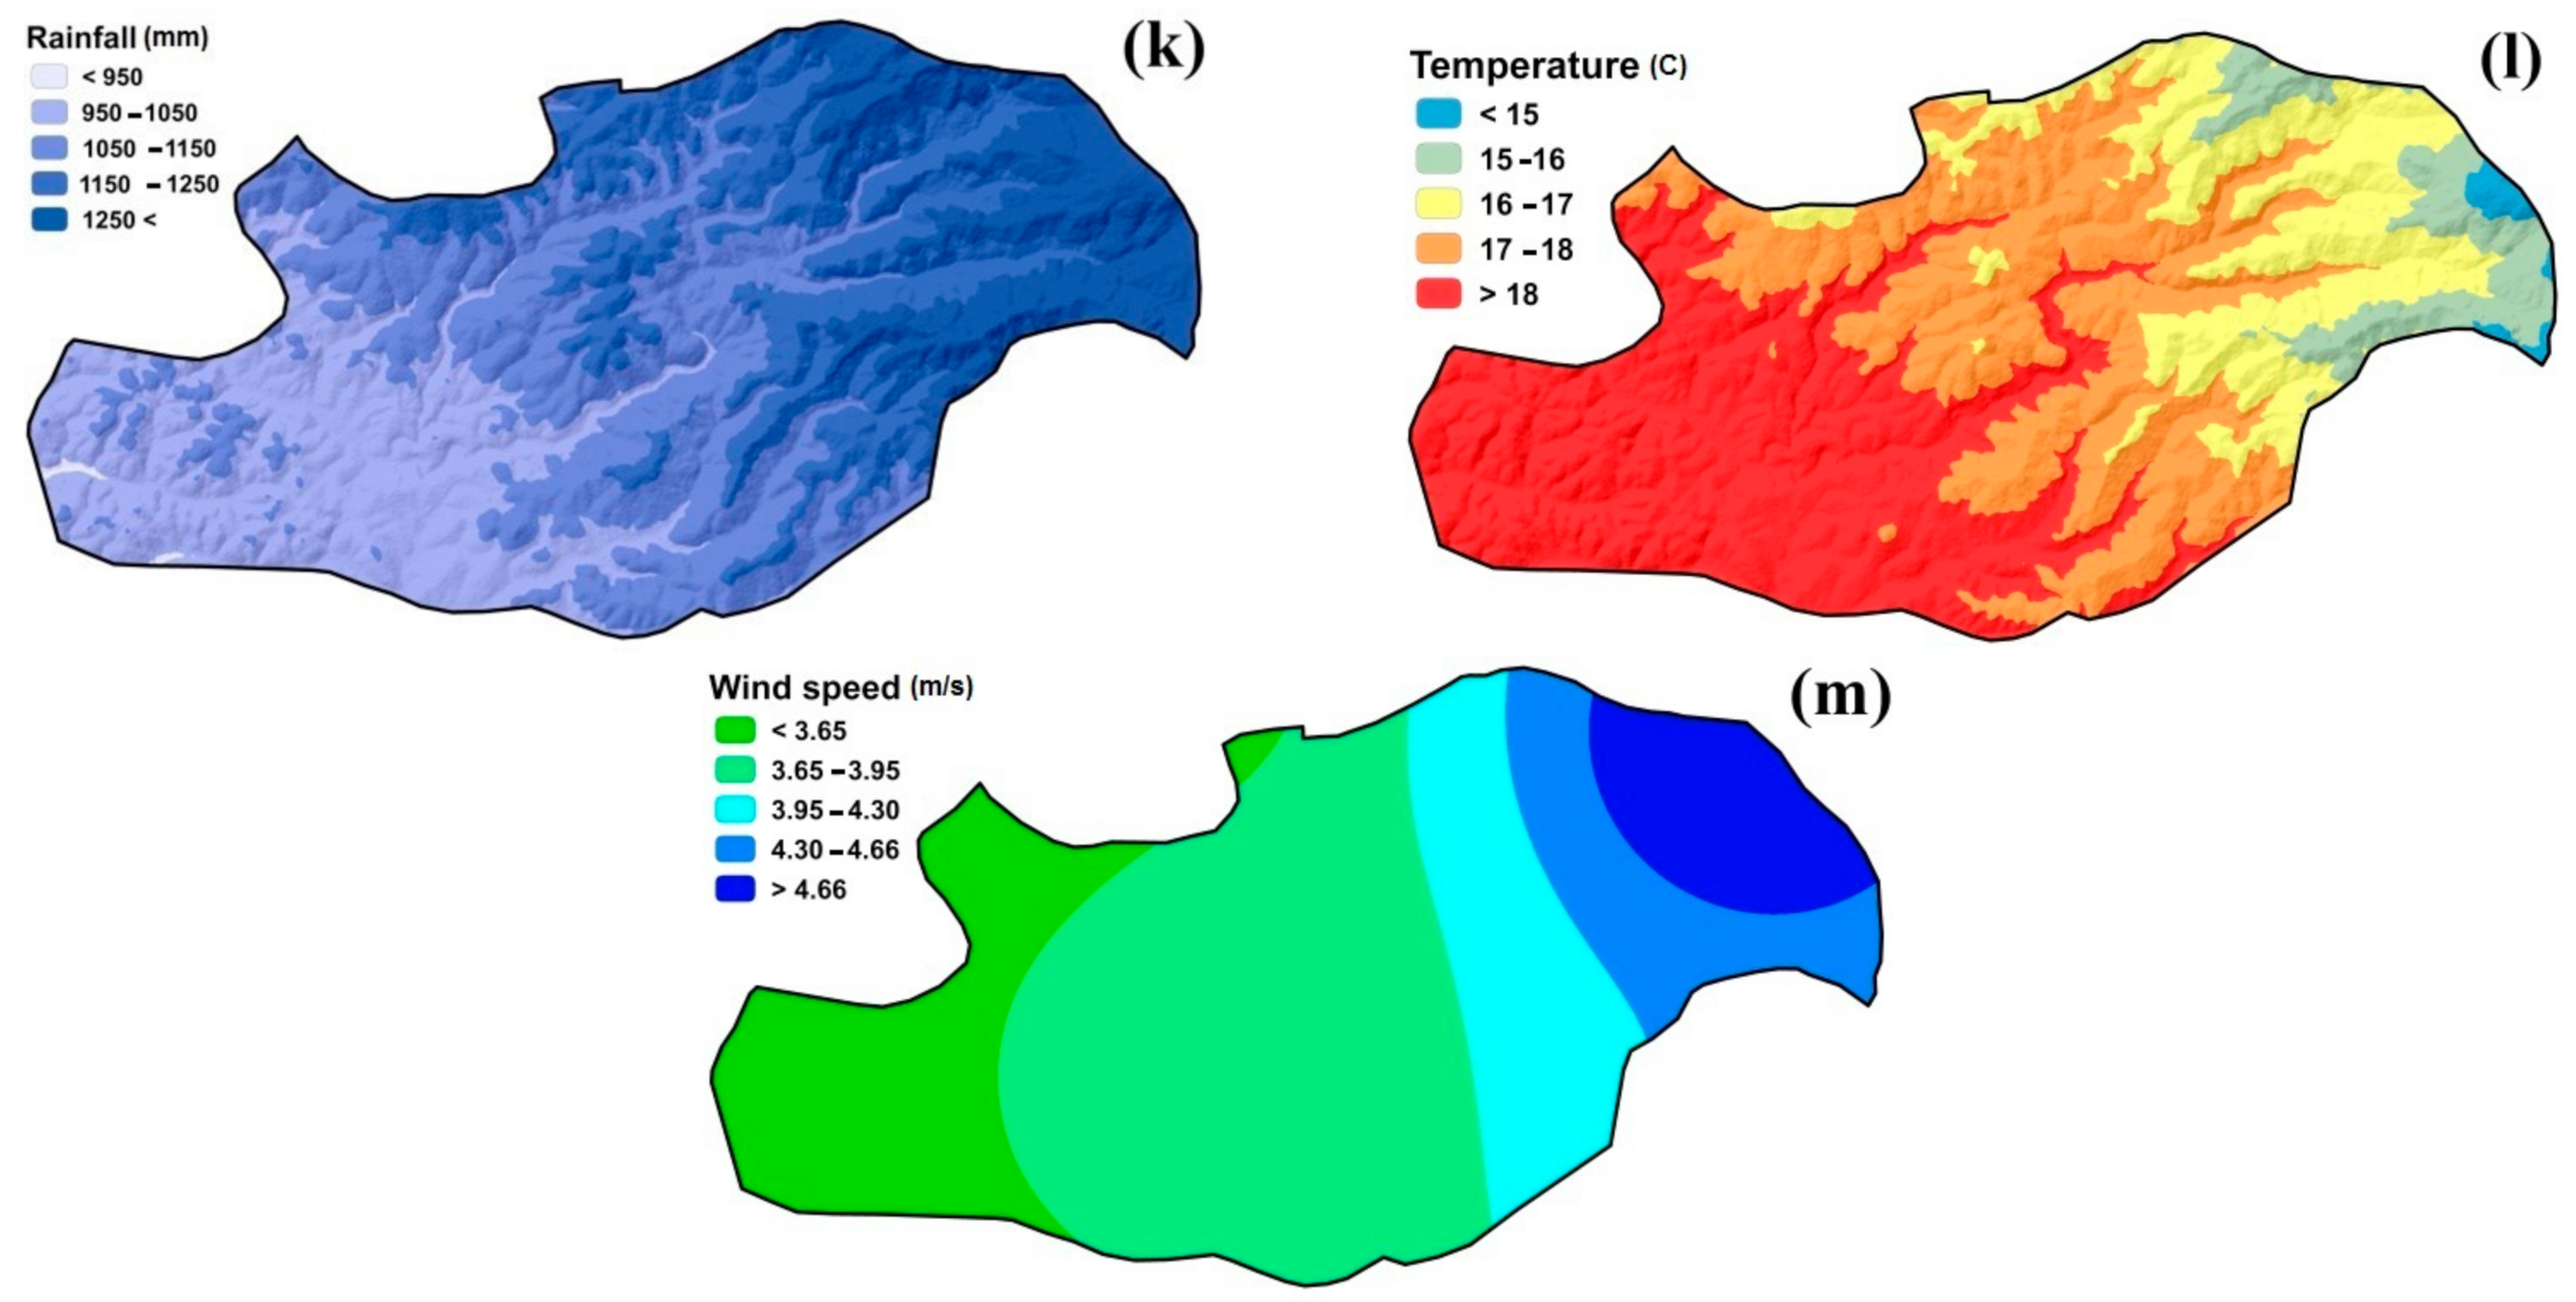
2.4.11. Rainfall (RF)
2.4.12. Temperature (TM)
2.4.13. Wind Speed (WS)
2.5. Statistical Analyses
2.5.1. Frequency Ratio (FR)
2.5.2. Analytic Hierarchy Process (AHP)
2.6. Accuracy Assessment of Forest Fire Susceptibility Maps
3. Results
3.1. Forest Fire Susceptibility Mapping
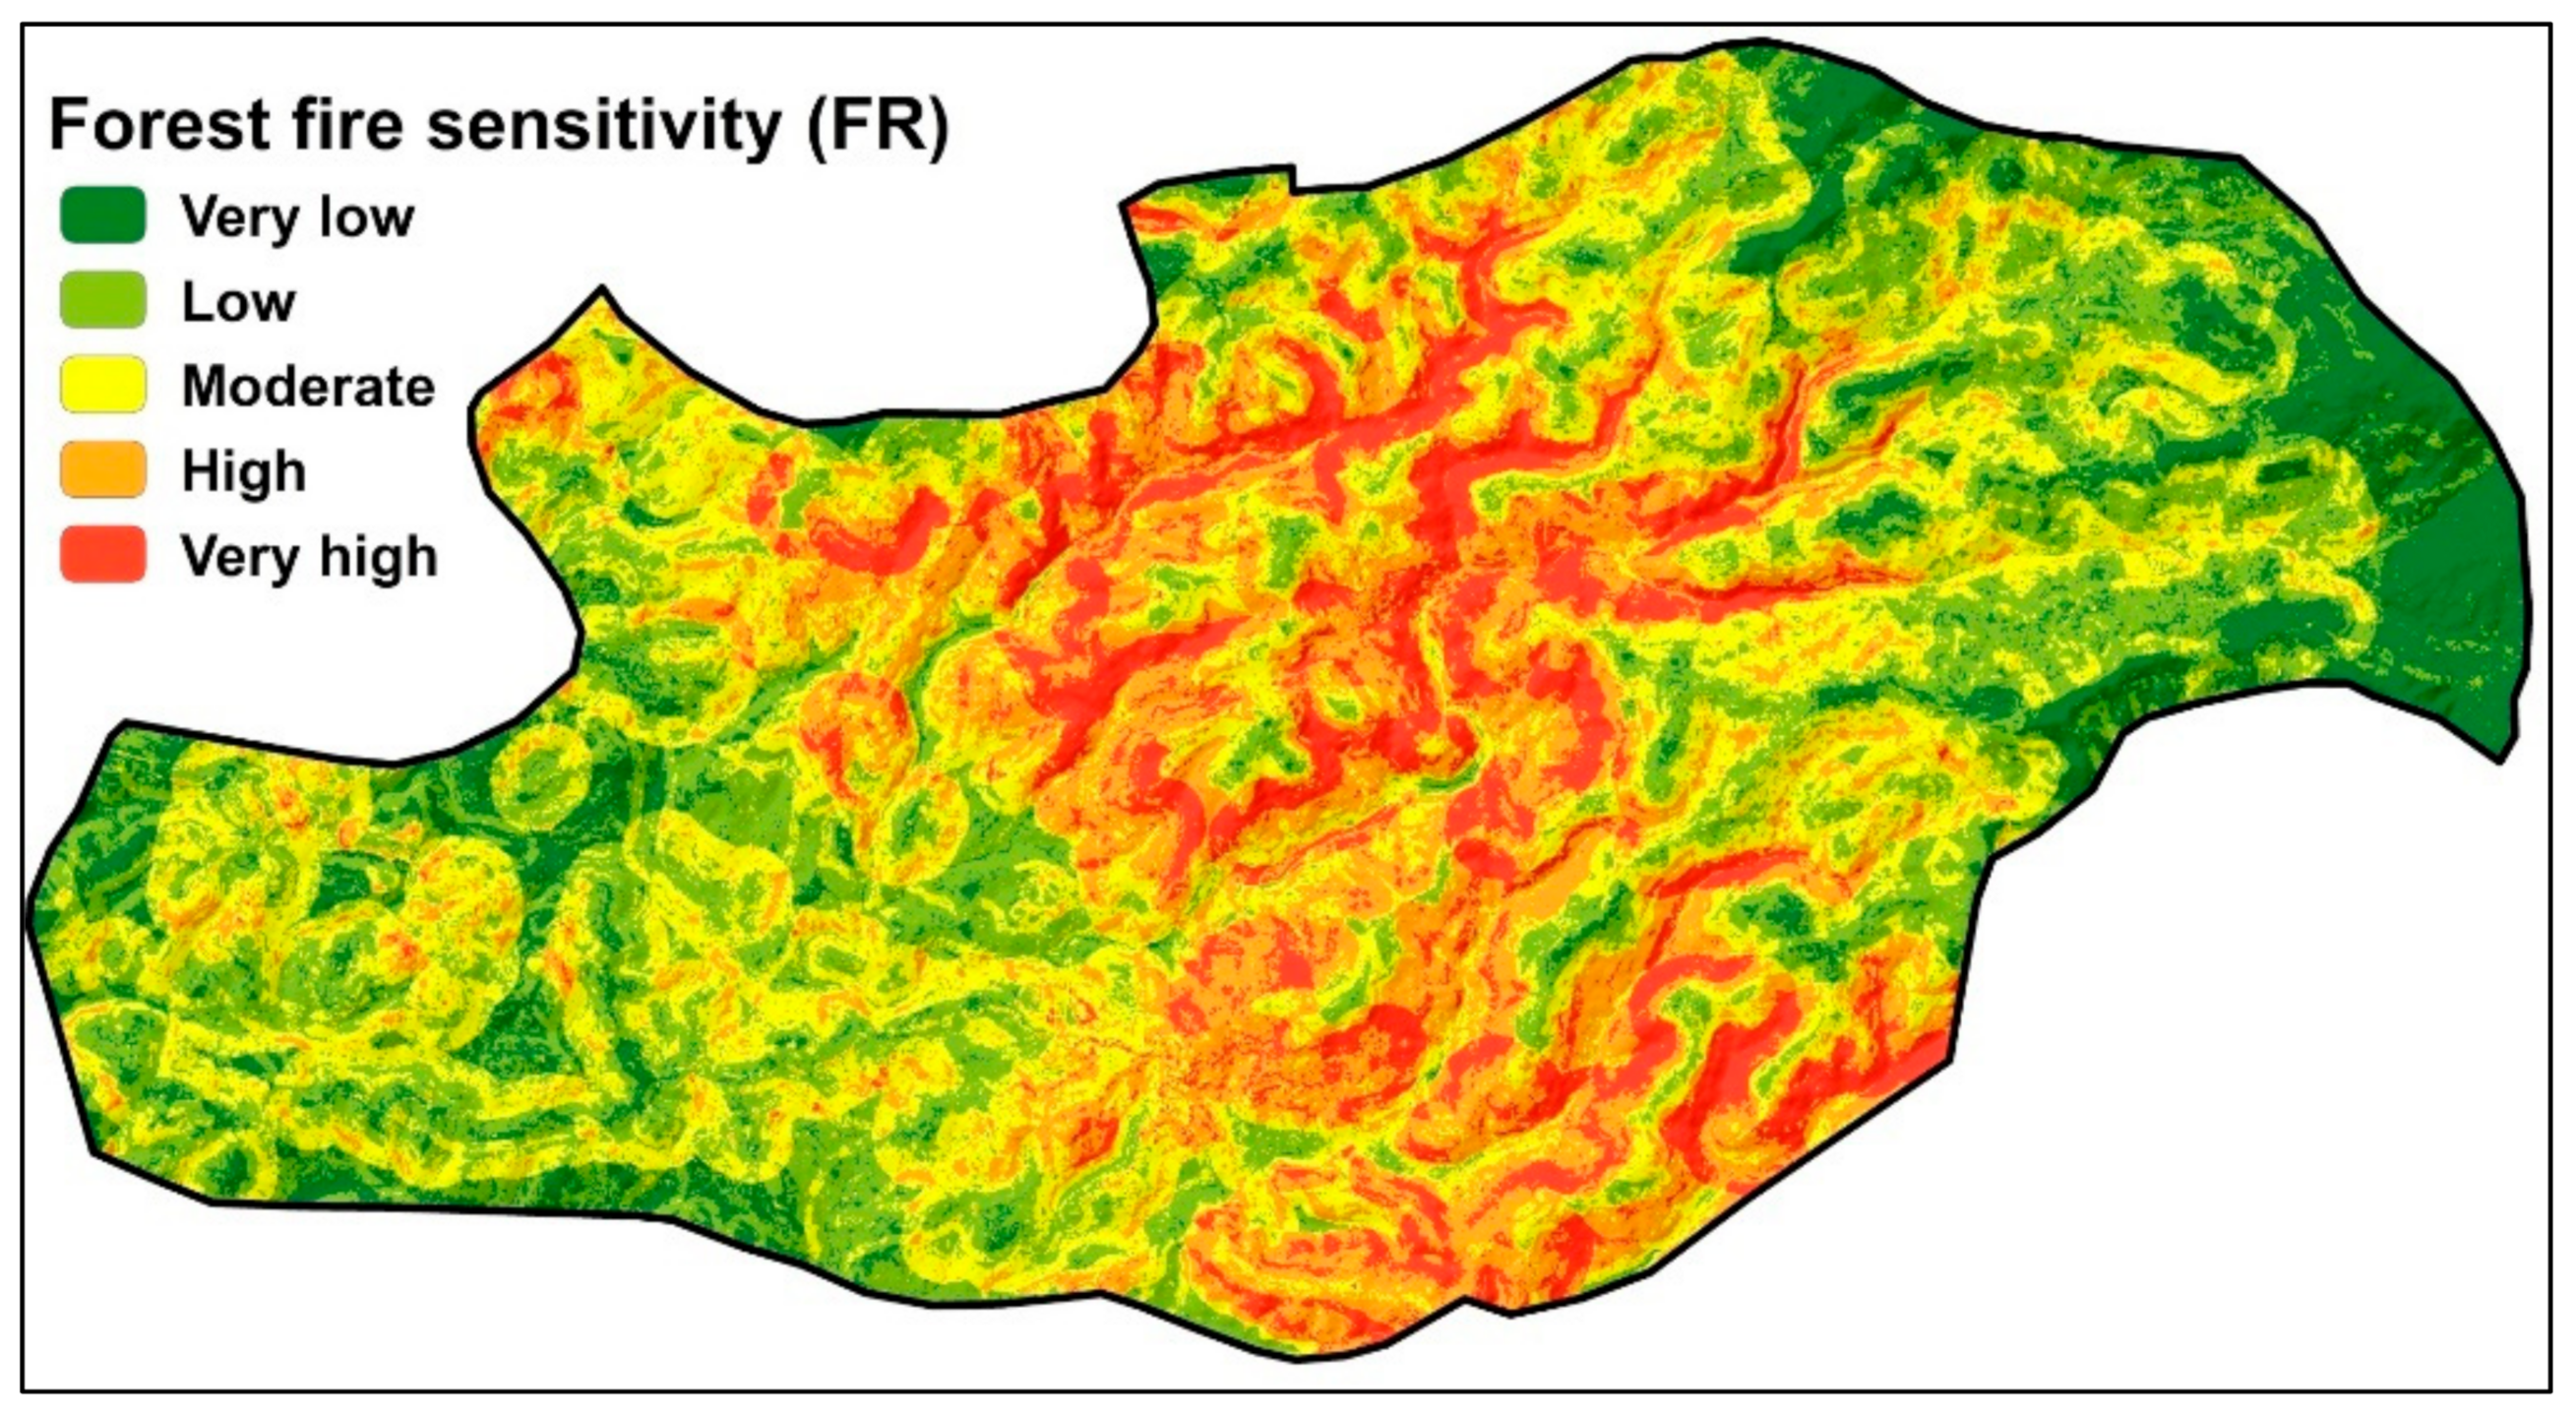
3.1.1. Forest Fire Susceptibility Mapping with the FR Method
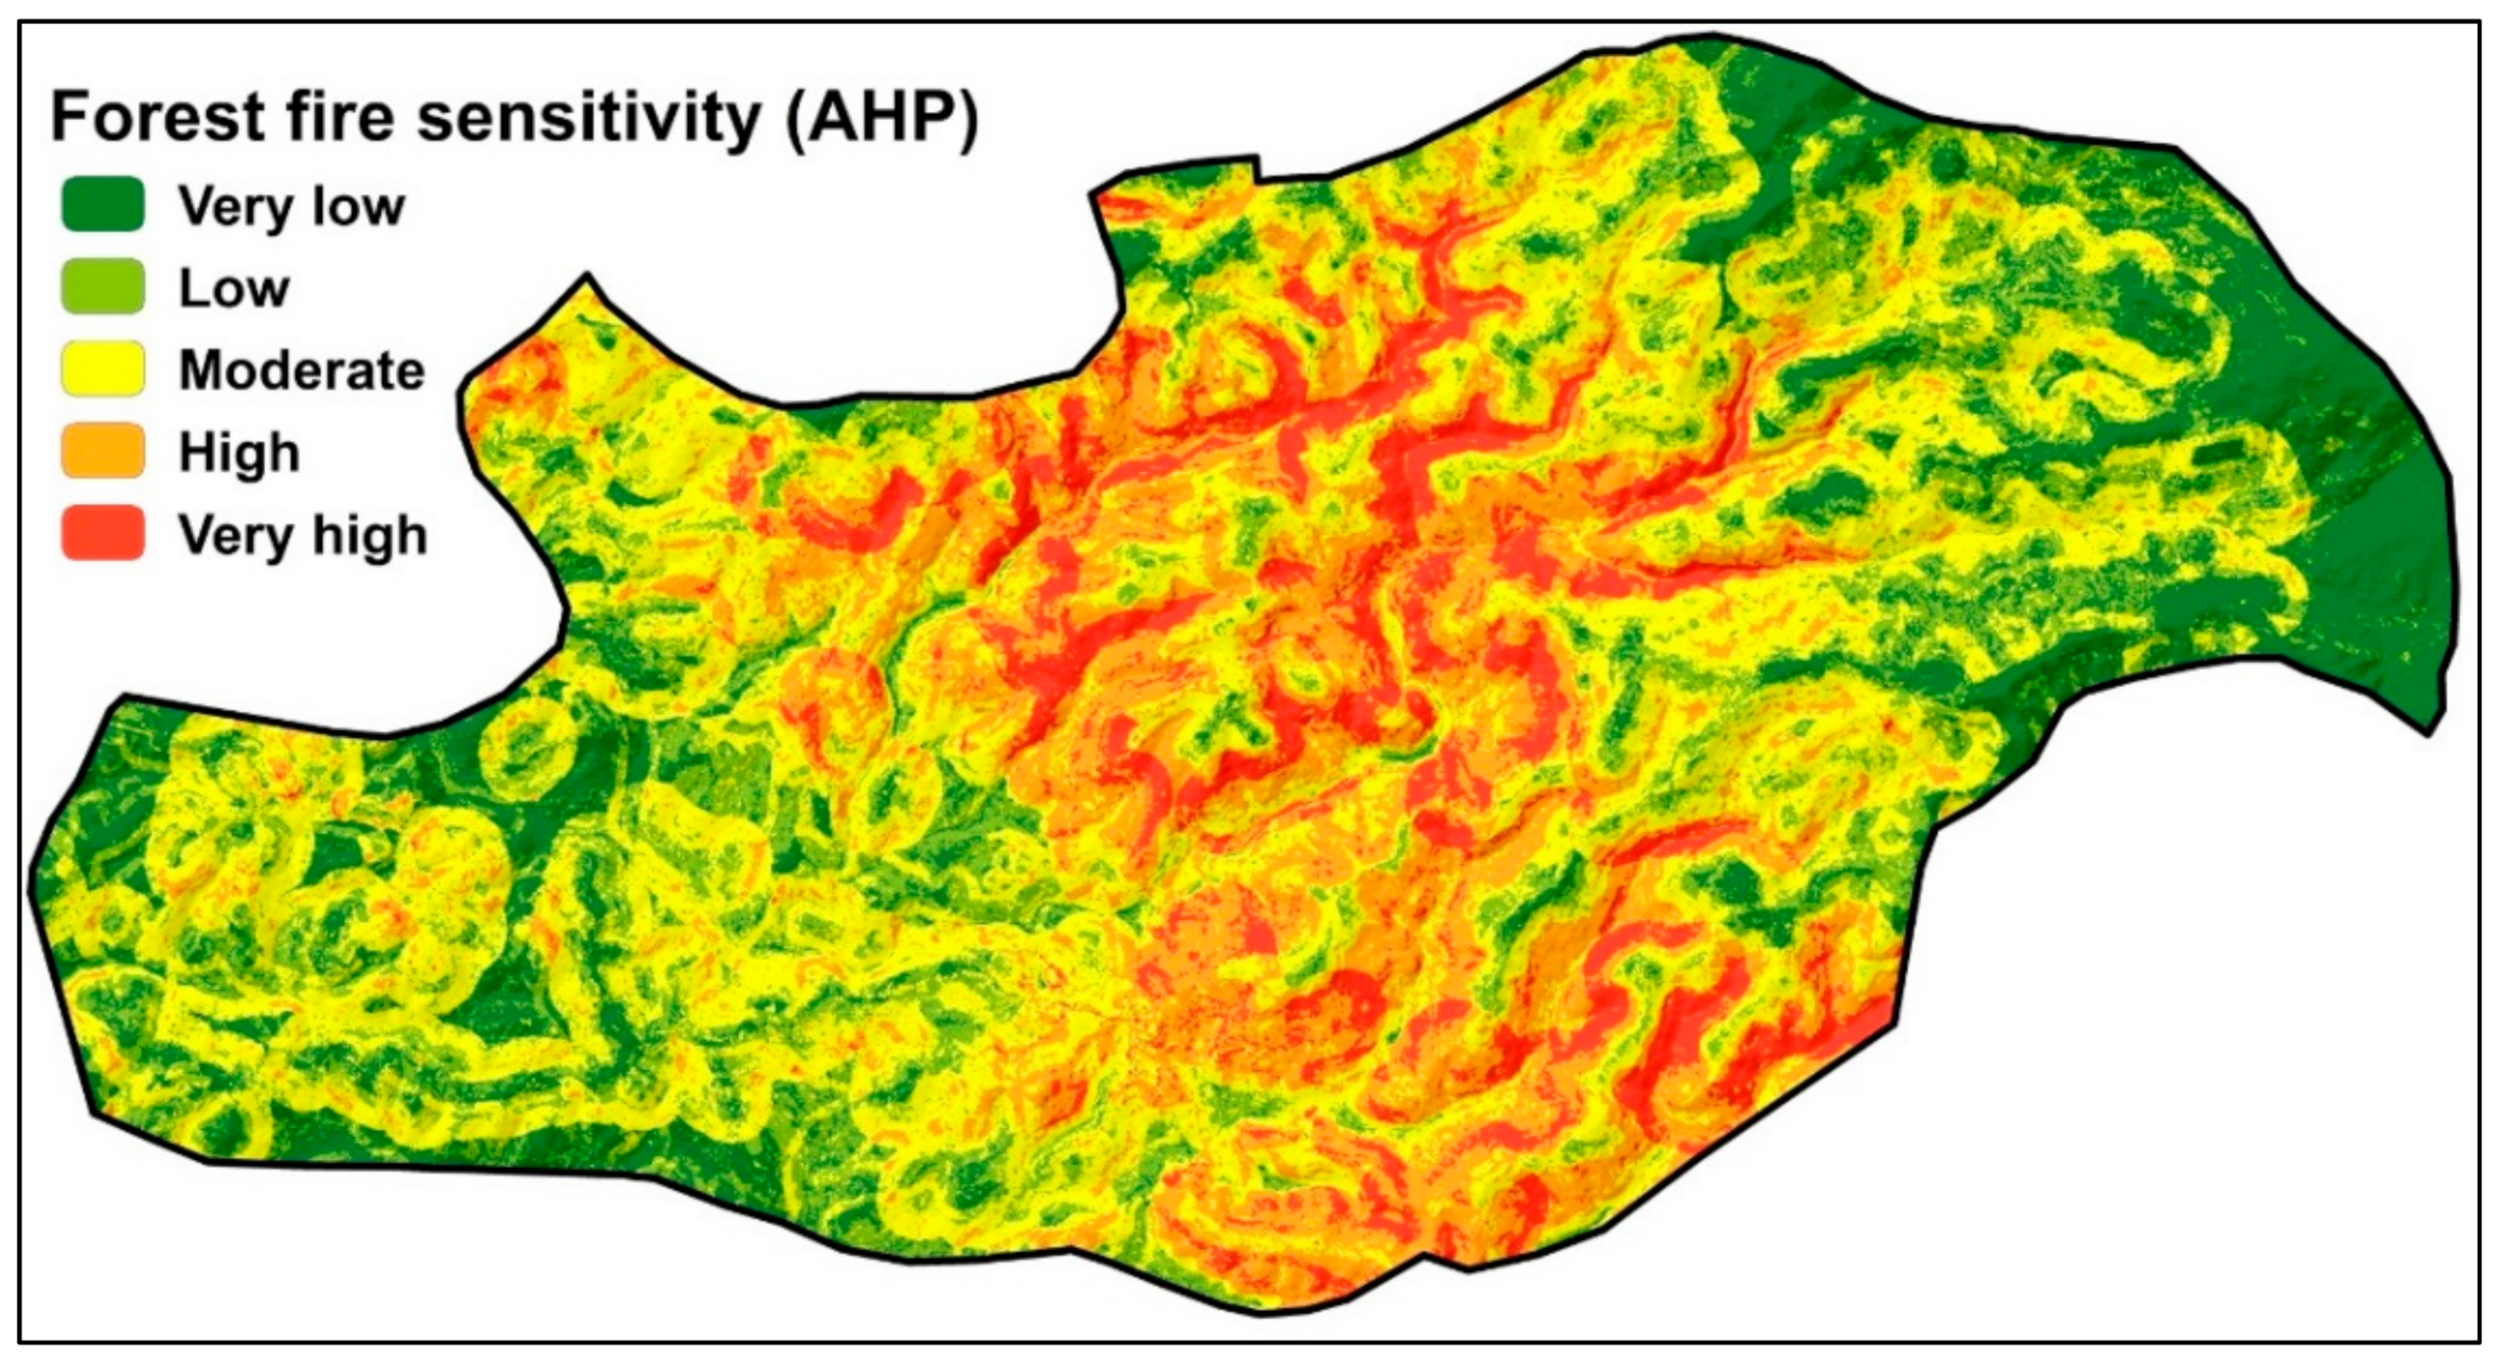
3.1.2. Forest Fire Susceptibility Mapping with the AHP Method
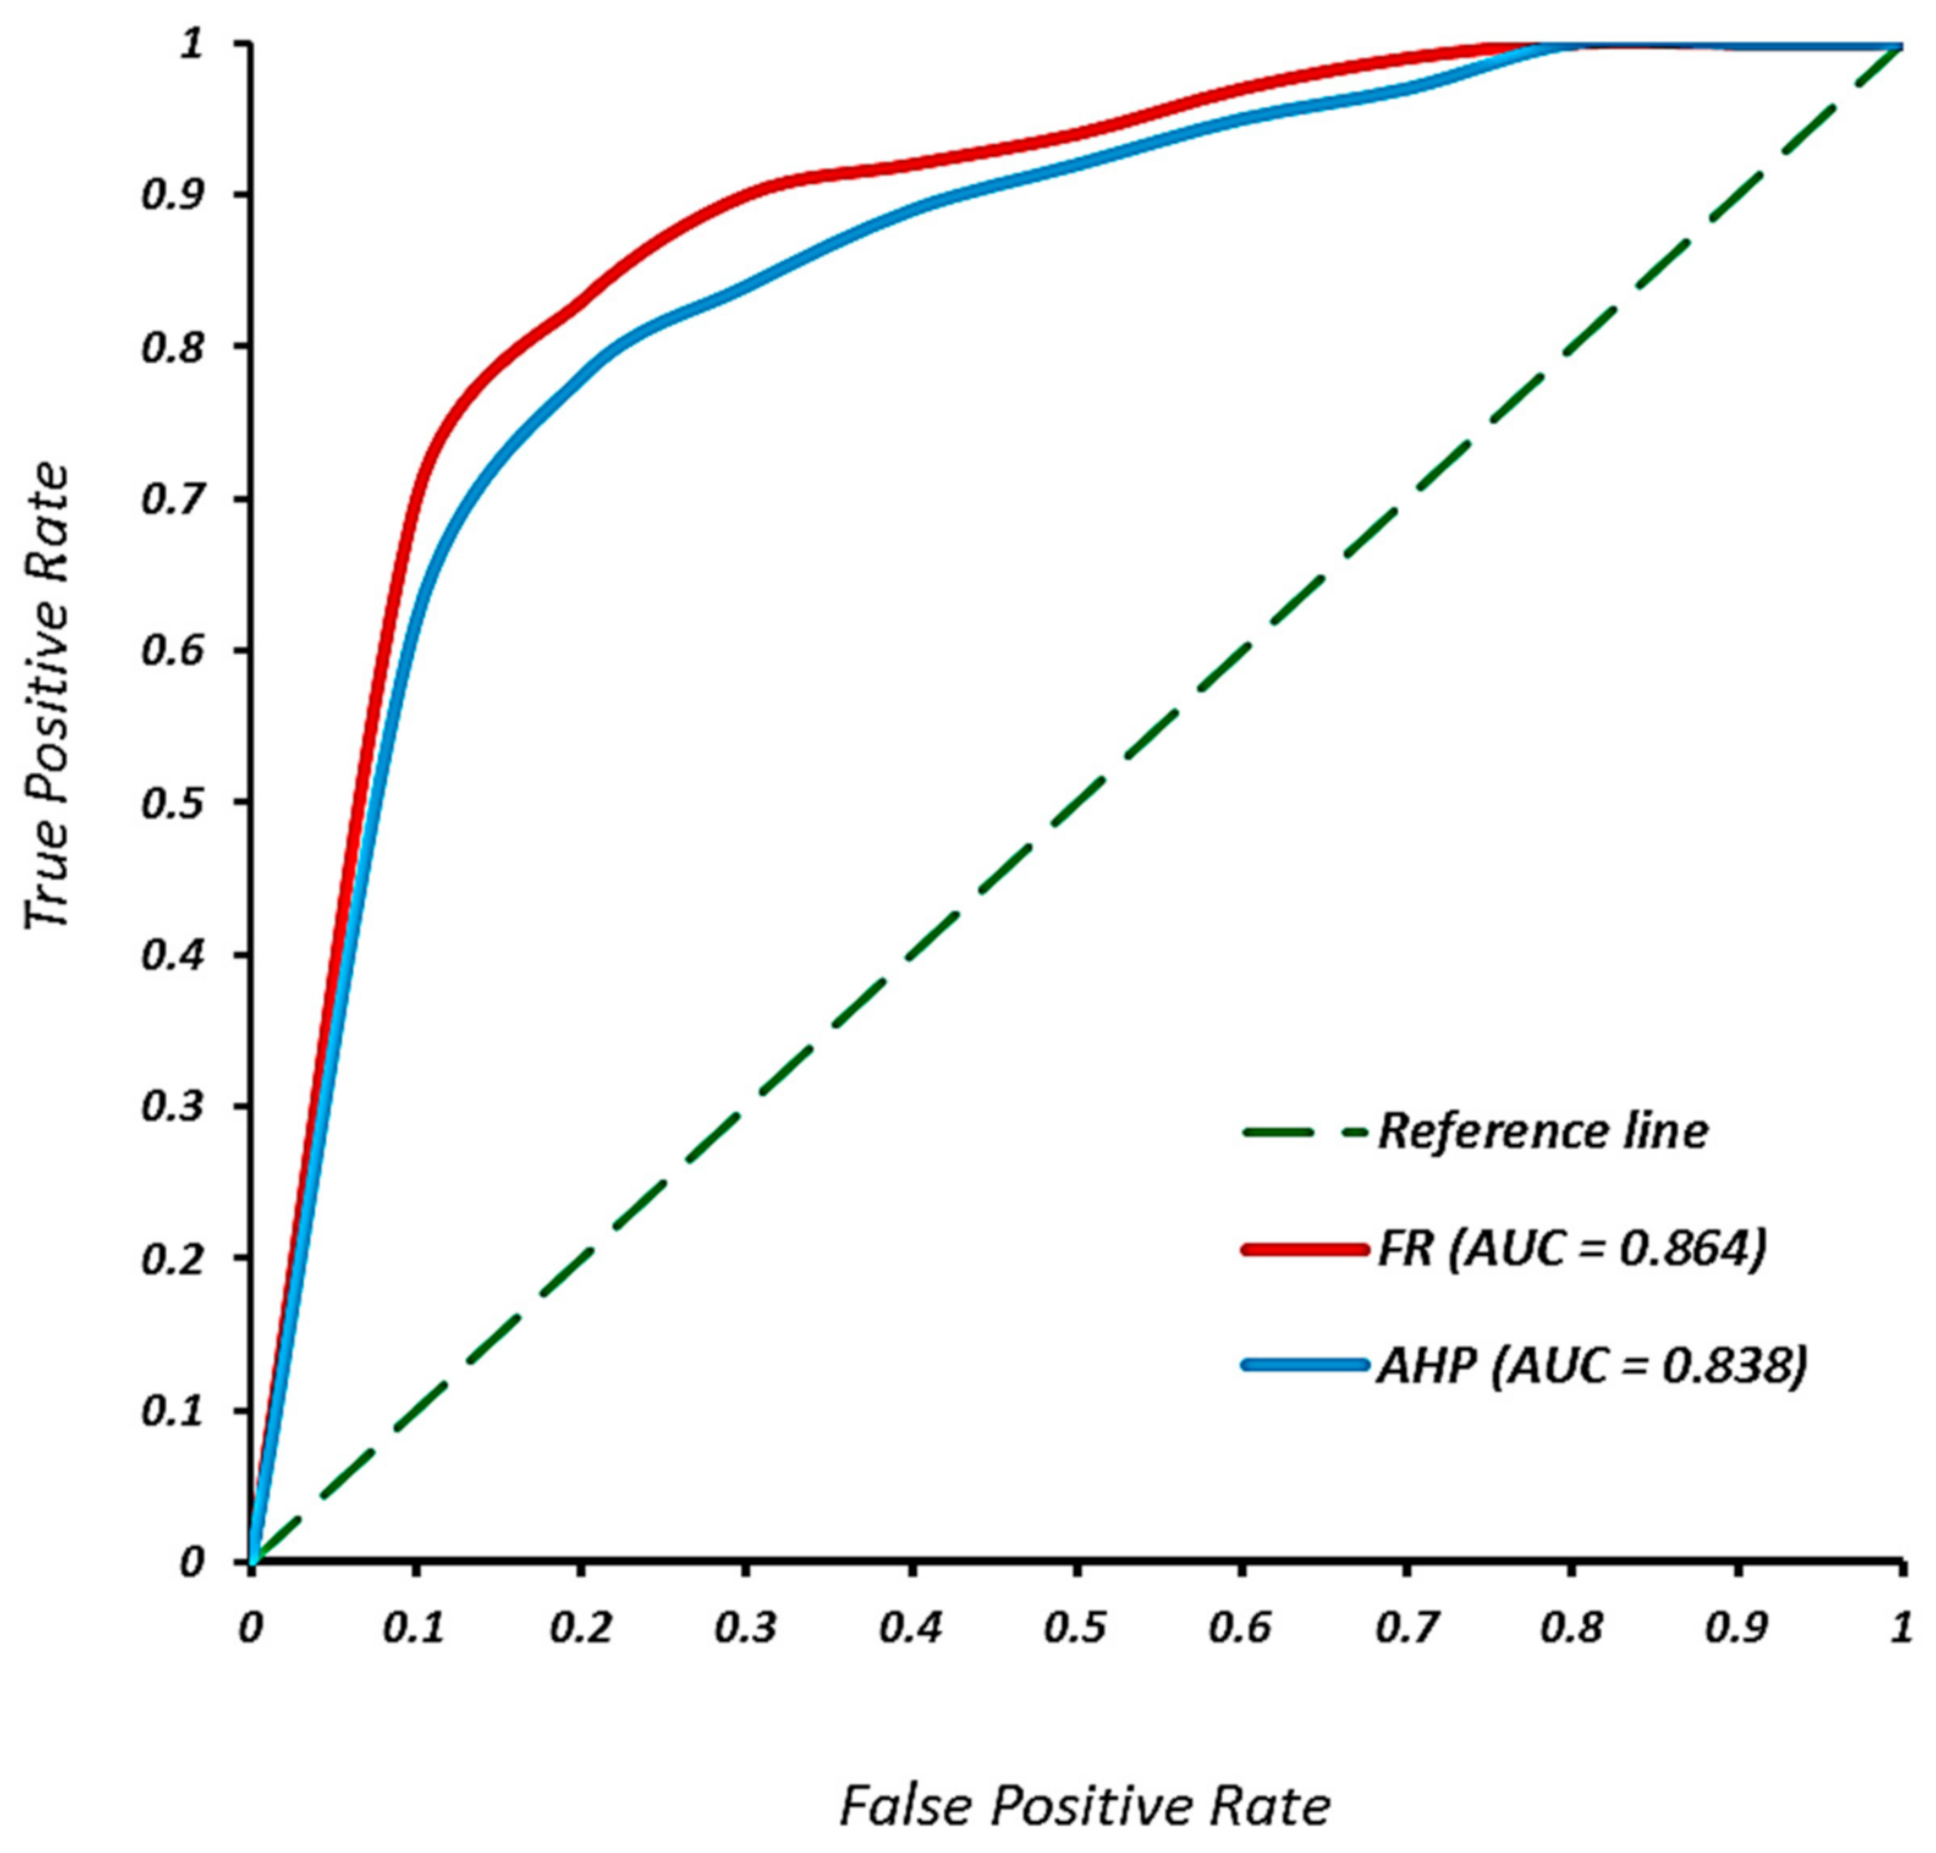
3.2. Validation
4. Discussion
5. Conclusions
Author Contributions
Funding
Institutional Review Board Statement
Informed Consent Statement
Data Availability Statement
Acknowledgments
Conflicts of Interest
References
- Abedi Gheshlaghi, H.; Feizizadeh, B.; Blaschke, T. GIS-based forest fire risk mapping using the analytical network process and fuzzy logic. J. Environ. Plan. Manag. 2020, 63, 481–499. [Google Scholar] [CrossRef]
- Tuyen, T.T.; Jaafari, A.; Yen, H.P.H.; Nguyen-Thoi, T.; Van Phong, T.; Nguyen, H.D.; Van Le, H.; Phuong, T.T.M.; Nguyen, S.H.; Prakash, I. Mapping forest fire susceptibility using spatially explicit ensemble models based on the locally weighted learning algorithm. Ecol. Inform. 2021, 63, 101292. [Google Scholar] [CrossRef]
- Mafi-Gholami, D.; Jaafari, A.; Zenner, E.K.; Kamari, A.N.; Bui, D.T. Spatial modeling of exposure of mangrove ecosystems to multiple environmental hazards. Sci. Total Environ. 2020, 740, 140167. [Google Scholar] [CrossRef] [PubMed]
- Nuthammachot, N.; Stratoulias, D. A GIS-and AHP-based approach to map fire risk: A case study of Kuan Kreng peat swamp forest, Thailand. Geocarto Int. 2021, 36, 212–225. [Google Scholar] [CrossRef]
- McGuire, S.; IFAD; WFP. The State of Food Insecurity in the World 2015: Meeting the 2015 International Hunger Targets: Taking Stock of Uneven Progress; FAO: Rome, Italy, 2015; pp. 623–624. [Google Scholar]
- Jaafari, A.; Mafi-Gholami, D.; Pham, B.T.; Tien Bui, D. Wildfire probability mapping: Bivariate vs. multivariate statistics. Remote Sens. 2019, 11, 618. [Google Scholar] [CrossRef] [Green Version]
- Abdo, H.G. Impacts of war in Syria on vegetation dynamics and erosion risks in Safita area, Tartous, Syria. Reg. Environ. Chang. 2018, 18, 1707–1719. [Google Scholar] [CrossRef]
- Novo, A.; Fariñas-Álvarez, N.; Martínez-Sánchez, J.; González-Jorge, H.; Fernández-Alonso, J.M.; Lorenzo, H. Mapping forest fire risk—A case study in Galicia (Spain). Remote Sens. 2020, 12, 3705. [Google Scholar] [CrossRef]
- Pham, B.T.; Jaafari, A.; Avand, M.; Al-Ansari, N.; Dinh Du, T.; Yen, H.P.H.; Phong, T.V.; Nguyen, D.H.; Le, H.V.; Mafi-Gholami, D. Performance evaluation of machine learning methods for forest fire modeling and prediction. Symmetry 2020, 12, 1022. [Google Scholar] [CrossRef]
- Hong, H.; Jaafari, A.; Zenner, E.K. Predicting spatial patterns of wildfire susceptibility in the Huichang County, China: An integrated model to analysis of landscape indicators. Ecol. Indic. 2019, 101, 878–891. [Google Scholar] [CrossRef]
- Jaafari, A.; Razavi Termeh, S.V.; Bui, D.T. Genetic and firefly metaheuristic algorithms for an optimized neuro-fuzzy prediction modeling of wildfire probability. J. Environ. Manag. 2019, 243, 358–369. [Google Scholar] [CrossRef]
- Santín, C.; Doerr, S.H. Fire effects on soils: The human dimension. Philos. Trans. R. Soc. B Biol. Sci. 2016, 371, 20150171. [Google Scholar] [CrossRef] [PubMed] [Green Version]
- Gupta, S.; Roy, A.; Bhavsar, D.; Kala, R.; Singh, S.; Kumar, A.S. Forest fire burnt area assessment in the biodiversity rich regions using geospatial technology: Uttarakhand Forest Fire event 2016. J. Indian Soc. Remote Sens. 2018, 46, 945–955. [Google Scholar] [CrossRef]
- Venkatesh, K.; Preethi, K.; Ramesh, H. Evaluating the effects of forest fire on water balance using fire susceptibility maps. Ecol. Indic. 2020, 110, 105856. [Google Scholar] [CrossRef]
- Ibrahem, A.; Koubaily, E.; Thabeet, A. Modeling the natural regeneration of Cedrus libani A. Richard in Slenfeh, Syria, using binary logistic regression. Model. Earth Syst. Environ. 2021, 7, 41–55. [Google Scholar] [CrossRef]
- Recanatesi, F.; Giuliani, C.; Ripa, M.N. Monitoring Mediterranean Oak decline in a peri-urban protected area using the NDVI and Sentinel-2 images: The case study of Castelporziano State Natural Reserve. Sustainability 2018, 10, 3308. [Google Scholar] [CrossRef] [Green Version]
- Almohamad, H.; Knaack, A.L.; Habib, B.M. Assessing spatial equity and accessibility of public green spaces in Aleppo City, Syria. Forests 2018, 9, 706. [Google Scholar] [CrossRef] [Green Version]
- Verkerk, P.J.; Fitzgerald, J.B.; Datta, P.; Dees, M.; Hengeveld, G.M.; Lindner, M.; Zudin, S. Spatial distribution of the potential forest biomass availability in Europe. For. Ecosyst. 2019, 6, 5. [Google Scholar] [CrossRef]
- Çolak, E.; Sunar, F. Evaluation of forest fire risk in the Mediterranean Turkish forests: A case study of Menderes region, Izmir. Int. J. Disaster Risk Reduct. 2020, 45, 101479. [Google Scholar] [CrossRef]
- Liu, B.; Spiekermann, R.; Zhao, C.; Püttmann, W.; Sun, Y.; Jasper, A.; Uhl, D. Evidence for the repeated occurrence of wildfires in an upper Pliocene lignite deposit from Yunnan, SW China. Int. J. Coal Geol. 2022, 250, 103924. [Google Scholar] [CrossRef]
- Busico, G.; Giuditta, E.; Kazakis, N.; Colombani, N. A hybrid GIS and AHP approach for modelling actual and future forest fire risk under climate change accounting water resources attenuation role. Sustainability 2019, 11, 7166. [Google Scholar] [CrossRef] [Green Version]
- Arca, D.; Hacısalihoğlu, M.; Kutoğlu, Ş.H. Producing forest fire susceptibility map via multi-criteria decision analysis and frequency ratio methods. Nat. Hazards 2020, 104, 73–89. [Google Scholar] [CrossRef]
- Akbulak, C.; Tatlı, H.; Aygün, G.; Sağlam, B. Forest fire risk analysis via integration of GIS, RS and AHP: The Case of Çanakkale, Turkey. J. Hum. Sci. 2018, 15, 2127–2143. [Google Scholar] [CrossRef] [Green Version]
- Mohamed, M.A. An Assessment of Forest Cover Change and Its Driving Forces in the Syrian Coastal Region during a Period of Conflict, 2010 to 2020. Land 2021, 10, 191. [Google Scholar] [CrossRef]
- Almohamad, H. Impact of land cover change due to armed conflicts on soil erosion in the basin of the northern Al-Kabeer River in Syria using the RUSLE model. Water 2020, 12, 3323. [Google Scholar] [CrossRef]
- Schon, J.; Mezuman, K.; Heslin, A.; Field, R.D.; Puma, M.J. How fire patterns reveal uneven stabilization at the end of conflict: Examining Syria’s unusual fire year in 2019. Environ. Res. Lett. 2021, 16, 044046. [Google Scholar] [CrossRef]
- Abdo, H.G. Evolving a total-evaluation map of flash flood hazard for hydro-prioritization based on geohydromorphometric parameters and GIS–RS manner in Al-Hussain river basin, Tartous, Syria. Nat. Hazards 2020, 104, 681–703. [Google Scholar] [CrossRef]
- Salhab, H.M.; Ali, W.; Abboud, L. Influence of Precipitation and Temperature on Tree-Ring Width of Brutia Pine (Pinus Brutia Ten.) in Tartous-Syria; ACADEMIA: San Francisco, CA, USA, 2018. [Google Scholar]
- Zhao, X.; Xia, H.; Pan, L.; Song, H.; Niu, W.; Wang, R.; Li, R.; Bian, X.; Guo, Y.; Qin, Y. Drought monitoring over Yellow River basin from 2003–2019 using reconstructed MODIS land surface temperature in Google Earth Engine. Remote Sens. 2021, 13, 3748. [Google Scholar] [CrossRef]
- Yin, L.; Wang, L.; Keim, B.D.; Konsoer, K.; Zheng, W. Wavelet Analysis of Dam Injection and Discharge in Three Gorges Dam and Reservoir with Precipitation and River Discharge. Water 2022, 14, 567. [Google Scholar] [CrossRef]
- Chao, L.; Zhang, K.; Wang, J.; Feng, J.; Zhang, M. A Comprehensive Evaluation of Five Evapotranspiration Datasets Based on Ground and GRACE Satellite Observations: Implications for Improvement of Evapotranspiration Retrieval Algorithm. Remote Sens. 2021, 13, 2414. [Google Scholar] [CrossRef]
- Tiwari, A.; Shoab, M.; Dixit, A. GIS-based forest fire susceptibility modeling in Pauri Garhwal, India: A comparative assessment of frequency ratio, analytic hierarchy process and fuzzy modeling techniques. Nat. Hazards 2021, 105, 1189–1230. [Google Scholar] [CrossRef]
- Nikhil, S.; Danumah, J.H.; Saha, S.; Prasad, M.K.; Rajaneesh, A.; Mammen, P.C.; Ajin, R.; Kuriakose, S.L. Application of GIS and AHP Method in Forest Fire Risk Zone Mapping: A Study of the Parambikulam Tiger Reserve, Kerala, India. J. Geovis. Spat. Anal. 2021, 5, 14. [Google Scholar] [CrossRef]
- Tarboton, D.G. A new method for the determination of flow directions and upslope areas in grid digital elevation models. Water Resour. Res. 1997, 33, 309–319. [Google Scholar] [CrossRef] [Green Version]
- Mafi-Gholami, D.; Zenner, E.K.; Jaafari, A. Mangrove regional feedback to sea level rise and drought intensity at the end of the 21st century. Ecol. Indic. 2020, 110, 105972. [Google Scholar] [CrossRef]
- Mafi-Gholami, D.; Zenner, E.K.; Jaafari, A.; Bui, D.T. Spatially explicit predictions of changes in the extent of mangroves of Iran at the end of the 21st century. Estuar. Coast. Shelf Sci. 2020, 237, 106644. [Google Scholar] [CrossRef]
- Nhu, V.-H.; Mohammadi, A.; Shahabi, H.; Ahmad, B.B.; Al-Ansari, N.; Shirzadi, A.; Clague, J.J.; Jaafari, A.; Chen, W.; Nguyen, H. Landslide susceptibility mapping using machine learning algorithms and remote sensing data in a tropical environment. Int. J. Environ. Res. Public Health 2020, 17, 4933. [Google Scholar] [CrossRef]
- Falkowski, M.J.; Gessler, P.E.; Morgan, P.; Hudak, A.T.; Smith, A.M. Characterizing and mapping forest fire fuels using ASTER imagery and gradient modeling. For. Ecol. Manag. 2005, 217, 129–146. [Google Scholar] [CrossRef] [Green Version]
- Satir, O.; Berberoglu, S.; Donmez, C. Mapping regional forest fire probability using artificial neural network model in a Mediterranean forest ecosystem. Geomat. Nat. Hazards Risk 2016, 7, 1645–1658. [Google Scholar] [CrossRef] [Green Version]
- Jaafari, A. LiDAR-supported prediction of slope failures using an integrated ensemble weights-of-evidence and analytical hierarchy process. Environ. Earth Sci. 2018, 77, 42. [Google Scholar] [CrossRef]
- Jaafari, A.; Zenner, E.K.; Pham, B.T. Wildfire spatial pattern analysis in the Zagros Mountains, Iran: A comparative study of decision tree based classifiers. Ecol. Inform. 2018, 43, 200–211. [Google Scholar] [CrossRef]
- Xie, W.; Nie, W.; Saffari, P.; Robledo, L.F.; Descote, P.-Y.; Jian, W. Landslide hazard assessment based on Bayesian optimization–support vector machine in Nanping City, China. Nat. Hazards 2021, 109, 931–948. [Google Scholar] [CrossRef]
- Jaafari, A.; Pourghasemi, H.R. Factors Influencing Regional-Scale Wildfire Probability in Iran: An Application of Random Forest and Support Vector Machine. In Spatial Modeling in GIS and R for Earth and Environmental Sciences; Elsevier: Amsterdam, The Netherlands, 2019; pp. 607–619. [Google Scholar]
- Zhang, K.; Shalehy, M.H.; Ezaz, G.T.; Chakraborty, A.; Mohib, K.M.; Liu, L. An integrated flood risk assessment approach based on coupled hydrological-hydraulic modeling and bottom-up hazard vulnerability analysis. Environ. Model. Softw. 2022, 148, 105279. [Google Scholar] [CrossRef]
- Wang, S.; Zhang, K.; Chao, L.; Li, D.; Tian, X.; Bao, H.; Chen, G.; Xia, Y. Exploring the utility of radar and satellite-sensed precipitation and their dynamic bias correction for integrated prediction of flood and landslide hazards. J. Hydrol. 2021, 603, 126964. [Google Scholar] [CrossRef]
- Geng, M.; Ma, K.; Sun, Y.; Wo, X.; Wang, K. Changes of land use/cover and landscape in Zhalong wetland as “red-crowned cranes country”, Heilongjiang province, China. Glob. NEST J. 2020, 22, 477–483. [Google Scholar]
- Jaafari, A.; Zenner, E.K.; Panahi, M.; Shahabi, H. Hybrid artificial intelligence models based on a neuro-fuzzy system and metaheuristic optimization algorithms for spatial prediction of wildfire probability. Agric. For. Meteorol. 2019, 266–267, 198–207. [Google Scholar] [CrossRef]
- Zhang, K.; Ali, A.; Antonarakis, A.; Moghaddam, M.; Saatchi, S.; Tabatabaeenejad, A.; Chen, R.; Jaruwatanadilok, S.; Cuenca, R.; Crow, W.T. The sensitivity of North American terrestrial carbon fluxes to spatial and temporal variation in soil moisture: An analysis using radar-derived estimates of root-zone soil moisture. J. Geophys. Res. Biogeosci. 2019, 124, 3208–3231. [Google Scholar] [CrossRef]
- Veena, H.S.; Ajin, R.S.; Loghin, A.-M.; Sipai, R.; Adarsh, P.; Viswam, A.; Vinod, P.G.; Jacob, M.K.; Jayaprakash, M. Wildfire risk zonation in a tropical forest division in Kerala, India: A study using geospatial techniques. Int. J. Conserv. Sci. 2017, 8, 475–484. [Google Scholar]
- Jaafari, A.; Pazhouhan, I.; Bettinger, P. Machine Learning Modeling of Forest Road Construction Costs. Forests 2021, 12, 1169. [Google Scholar] [CrossRef]
- Salloum, J.; Abdo, H. Statistical modeling of conservation the vegetation of the land in Alqadmous area from rainfall erosion. Tishreen Univ. J. Res. Sci. Stud.-Arts Hum. Ser. 2016, 38, 667–683. [Google Scholar]
- Li, J.; Zhao, Y.; Zhang, A.; Song, B.; Hill, R.L. Effect of grazing exclusion on nitrous oxide emissions during freeze-thaw cycles in a typical steppe of Inner Mongolia. Agric. Ecosyst. Environ. 2021, 307, 107217. [Google Scholar] [CrossRef]
- Jaafari, A.; Gholami, D.M.; Zenner, E.K. A Bayesian modeling of wildfire probability in the Zagros Mountains, Iran. Ecol. Inform. 2017, 39, 32–44. [Google Scholar] [CrossRef]
- Fornacca, D.; Ren, G.; Xiao, W. Evaluating the best spectral indices for the detection of burn scars at several post-fire dates in a mountainous region of Northwest Yunnan, China. Remote Sens. 2018, 10, 1196. [Google Scholar] [CrossRef] [Green Version]
- Shabani, S.; Najafi, A.; Majnonian, B.; Alavi, J.; Sattarian, A. Spatial prediction of soil disturbance caused by forest logging using generalized additive models and GIS. Eur. J. For. Res. 2019, 138, 595–606. [Google Scholar] [CrossRef]
- Masinda, M.M.; Sun, L.; Wang, G.; Hu, T. Moisture content thresholds for ignition and rate of fire spread for various dead fuels in northeast forest ecosystems of China. J. For. Res. 2021, 32, 1147–1155. [Google Scholar] [CrossRef]
- Zhang, K.; Wang, S.; Bao, H.; Zhao, X. Characteristics and influencing factors of rainfall-induced landslide and debris flow hazards in Shaanxi Province, China. Nat. Hazards Earth Syst. Sci. 2019, 19, 93–105. [Google Scholar] [CrossRef] [Green Version]
- Kayet, N.; Chakrabarty, A.; Pathak, K.; Sahoo, S.; Dutta, T.; Hatai, B.K. Comparative analysis of multi-criteria probabilistic FR and AHP models for forest fire risk (FFR) mapping in Melghat Tiger Reserve (MTR) forest. J. For. Res. 2020, 31, 565–579. [Google Scholar] [CrossRef]
- Abedi Gheshlaghi, H. Using GIS to develop a model for forest fire risk mapping. J. Indian Soc. Remote Sens. 2019, 47, 1173–1185. [Google Scholar] [CrossRef]
- Sahana, M.; Ganaie, T.A. GIS-based landscape vulnerability assessment to forest fire susceptibility of Rudraprayag district, Uttarakhand, India. Environ. Earth Sci. 2017, 76, 676. [Google Scholar] [CrossRef]
- Mohammed, S.; Hassan, E.; Abdo, H.G.; Szabo, S.; Mokhtar, A.; Alsafadi, K.; Al-Khouri, I.; Rodrigo-Comino, J. Impacts of rainstorms on soil erosion and organic matter for different cover crop systems in the western coast agricultural region of Syria. Soil Use Manag. 2021, 37, 196–213. [Google Scholar] [CrossRef]
- Wang, X.; Zhang, Y.; Luo, M.; Xiao, K.; Wang, Q.; Tian, Y.; Qiu, W.; Xiong, Y.; Zheng, C.; Li, H. Radium and nitrogen isotopes tracing fluxes and sources of submarine groundwater discharge driven nitrate in an urbanized coastal area. Sci. Total Environ. 2021, 763, 144616. [Google Scholar] [CrossRef]
- Kanga, S.; Tripathi, G.; Singh, S.K. Forest fire hazards vulnerability and risk assessment in Bhajji forest range of Himachal Pradesh (India): A geospatial approach. J. Remote Sens. GIS 2017, 8, 1–16. [Google Scholar]
- Abdo, H. Assessment of landslide susceptibility zonation using frequency ratio and statistical index: A case study of Al-Fawar basin, Tartous, Syria. Int. J. Environ. Sci. Technol. 2022, 19, 2599–2618. [Google Scholar] [CrossRef]
- Jaafari, A.; Najafi, A.; Pourghasemi, H.R.; Rezaeian, J.; Sattarian, A. GIS-based frequency ratio and index of entropy models for landslide susceptibility assessment in the Caspian forest, northern Iran. Int. J. Environ. Sci. Technol. 2014, 11, 909–926. [Google Scholar] [CrossRef] [Green Version]
- Jaafari, A.; MafiGholami, D. Wildfire hazard mapping using an ensemble method of frequency ratio with Shannon’s entropy. Iran. J. For. Poplar Res. 2017, 25, 232–243. [Google Scholar]
- Setiawan, I.; Mahmud, A.R.; Mansor, S.; Shariff, A.R.M.; Nuruddin, A.A. GIS-grid-based and multi-criteria analysis for I dentifying and mapping peat swamp forest fire hazard in Pahang, Malaysia. Disaster Prev. Manag. Int. J. 2004, 13, 379–386. [Google Scholar] [CrossRef]
- Hossain, M.K.; Meng, Q. A fine-scale spatial analytics of the assessment and mapping of buildings and population at different risk levels of urban flood. Land Use Policy 2020, 99, 104829. [Google Scholar] [CrossRef]
- Jaafari, A.; Najafi, A.; Melón, M.G. Decision-making for the selection of a best wood extraction method: An analytic network process approach. For. Policy Econ. 2015, 50, 200–209. [Google Scholar] [CrossRef] [Green Version]
- TL, S. The Analytic Hierarchy Process, Planning, Priority Setting. In Resource Allocation; McGraw-Hill International Book Company: New York, NY, USA, 1980. [Google Scholar]
- Pham, B.T.; Jaafari, A.; Phong, T.V.; Yen, H.P.H.; Tuyen, T.T.; Luong, V.V.; Nguyen, H.D.; Le, H.V.; Foong, L.K. Improved flood susceptibility mapping using a best first decision tree integrated with ensemble learning techniques. Geosci. Front. 2021, 12, 101105. [Google Scholar] [CrossRef]
- Pham, B.T.; Jaafari, A.; Van Phong, T.; Mafi-Gholami, D.; Amiri, M.; Van Tao, N.; Duong, V.-H.; Prakash, I. Naïve Bayes ensemble models for groundwater potential mapping. Ecol. Inform. 2021, 64, 101389. [Google Scholar] [CrossRef]
- Tran, Q.C.; Minh, D.D.; Jaafari, A.; Al-Ansari, N.; Minh, D.D.; Van, D.T.; Nguyen, D.A.; Tran, T.H.; Ho, L.S.; Nguyen, D.H. Novel Ensemble Landslide Predictive Models Based on the Hyperpipes Algorithm: A Case Study in the Nam Dam Commune, Vietnam. Appl. Sci. 2020, 10, 3710. [Google Scholar] [CrossRef]
- Jaafari, A.; Panahi, M.; Mafi-Gholami, D.; Rahmati, O.; Shahabi, H.; Shirzadi, A.; Lee, S.; Bui, D.T.; Pradhan, B. Swarm intelligence optimization of the group method of data handling using the cuckoo search and whale optimization algorithms to model and predict landslides. Appl. Soft Comput. 2022, 116, 108254. [Google Scholar] [CrossRef]
- Shang, K.; Chen, Z.; Liu, Z.; Song, L.; Zheng, W.; Yang, B.; Liu, S.; Yin, L. Haze Prediction Model Using Deep Recurrent Neural Network. Atmosphere 2021, 12, 1625. [Google Scholar] [CrossRef]
- Yin, L.; Wang, L.; Huang, W.; Tian, J.; Liu, S.; Yang, B.; Zheng, W. Haze Grading Using the Convolutional Neural Networks. Atmosphere 2022, 13, 522. [Google Scholar] [CrossRef]
- Gholamnia, K.; Gudiyangada Nachappa, T.; Ghorbanzadeh, O.; Blaschke, T. Comparisons of Diverse Machine Learning Approaches for Wildfire Susceptibility Mapping. Symmetry 2020, 12, 604. [Google Scholar] [CrossRef] [Green Version]
- Tshering, K.; Thinley, P.; Shafapour Tehrany, M.; Thinley, U.; Shabani, F. A comparison of the qualitative analytic hierarchy process and the quantitative frequency ratio techniques in predicting forest fire-prone areas in Bhutan using GIS. Forecasting 2020, 2, 36–58. [Google Scholar] [CrossRef] [Green Version]
- Gülçin, D.; Deniz, B. Remote sensing and GIS-based forest fire risk zone mapping: The case of Manisa, Turkey. Turk. J. For. 2020, 21, 15–24. [Google Scholar] [CrossRef]
- Suryabhagavan, K.; Alemu, M.; Balakrishnan, M. GIS-based multi-criteria decision analysis for forest fire susceptibility mapping: A case study in Harenna forest, southwestern Ethiopia. Trop. Ecol. 2016, 57, 33–43. [Google Scholar]
- Eugenio, F.C.; dos Santos, A.R.; Fiedler, N.C.; Ribeiro, G.A.; da Silva, A.G.; dos Santos, Á.B.; Paneto, G.G.; Schettino, V.R. Applying GIS to develop a model for forest fire risk: A case study in Espírito Santo, Brazil. J. Environ. Manag. 2016, 173, 65–71. [Google Scholar] [CrossRef]
- Abdo, H.G. Estimating water erosion using RUSLE, GIS and remote sensing in Wadi-Qandeel river basin, Lattakia, Syria. Proc. Indian Natl. Sci. Acad. 2021, 87, 514–523. [Google Scholar] [CrossRef]
- Abdo, H.G. Evaluating the potential soil erosion rate based on RUSLE model, GIS, and RS in Khawabi river basin, Tartous, Syria. DYSONA-Appl. Sci. 2022, 3, 24–32. [Google Scholar]


| Factor | Data Source | Data Format | Resolution |
|---|---|---|---|
| Slope (deg.) Elevation (m) Curvature Aspect Drainages Topographic Wetness Index (TWI) | USGC EarthExplorer (https://earthexplorer.usgs.gov/) (accessed on 12 September 2021) | Spatial raster grid data | 30 m |
| Settlements Normalized Difference Vegetation Index (NDVI) Normalized Difference Moisture Index (NDMI) | Landsat OLI-TIRS, August 2021 (USGS EarthExplorer) (accessed on 14 September 2021) | Spatial raster grid data | 30 m |
| Rainfall (mm) Temperature (°C) Wind speed (m/s) | General Directorate of Meteorology—Damascus | Spatial vector data | - |
| Roads | Directorate of Transport and Public Roads—Tartous Governorate | Spatial vector data | - |
| Intensity of Importance | Definition | Explanation |
|---|---|---|
| 1 | Equal importance | Two activities contribute equally to the objective. |
| 2 | Weak or slight | |
| 3 | Moderate importance | Experience and judgment slightly favor one activity over another. |
| 4 | Moderate plus | |
| 5 | Strong importance | Experience and judgment strongly favor one activity over another. |
| 6 | Strong plus | |
| 7 | Very strong or demonstrated importance | An activity is favored very strongly over another; its dominance is demonstrated in practice. |
| 8 | Very, very strong | |
| 9 | Extreme importance | The evidence favoring one activity over another is of the highest possible order of affirmation. |
| Reciprocals | Opposites | Used for inverse comparison. |
| Number of Criteria | 1 | 2 | 3 | 4 | 5 | 6 | 7 | 8 | 9 | 10 | 11 | 12 | 13 | 14 |
|---|---|---|---|---|---|---|---|---|---|---|---|---|---|---|
| Random Inconsistency | 0.00 | 0.00 | 0.58 | 0.90 | 1.12 | 1.24 | 1.32 | 1.41 | 1.45 | 1.49 | 1.51 | 1.54 | 1.56 | 1.57 |
| No. | Factor | Class | No. of Forest Fires | % of Forest Fires | No. of Pixels in Domain | % of Domain | FR |
|---|---|---|---|---|---|---|---|
| 1 | Slope (SL) (deg.) | <5 | 1 | 4.55 | 78,901 | 6.61 | 0.69 |
| 5–10 | 2 | 9.09 | 225,232 | 18.87 | 0.48 | ||
| 10–15 | 7 | 31.82 | 311,353 | 26.09 | 1.22 | ||
| 15–20 | 5 | 22.73 | 313,773 | 26.29 | 0.86 | ||
| 20–25 | 4 | 18.18 | 172,842 | 14.48 | 1.26 | ||
| >25 | 3 | 13.64 | 91,244 | 7.65 | 1.78 | ||
| 2 | Elevation (El) (m) | <200 | 0 | 0 | 2244 | 0.19 | 0 |
| 200–400 | 5 | 22.73 | 386,567 | 32.39 | 0.7 | ||
| 400–600 | 12 | 54.55 | 432,655 | 36.26 | 1.5 | ||
| 600–800 | 4 | 18.18 | 265,559 | 22.25 | 0.82 | ||
| >800 | 1 | 4.55 | 106,320 | 8.91 | 0.51 | ||
| 3 | Curvature (CV) | Concave | 7 | 31.82 | 449,983 | 37.71 | 0.84 |
| Flat | 4 | 18.18 | 290,548 | 24.35 | 0.75 | ||
| Convex | 11 | 50 | 452,814 | 37.94 | 1.32 | ||
| 4 | Aspects (AS) | Flat | 0 | 0 | 2430 | 0.2 | 0 |
| North | 0 | 0 | 62,626 | 5.25 | 0 | ||
| Northeast | 1 | 4.55 | 67,936 | 5.69 | 0.18 | ||
| East | 3 | 13.64 | 91,840 | 7.7 | 0.39 | ||
| Southeast | 7 | 31.82 | 179,250 | 15.02 | 0.47 | ||
| South | 3 | 13.64 | 216,539 | 18.15 | 0.17 | ||
| Southwest | 5 | 22.73 | 174,690 | 14.64 | 0.34 | ||
| West | 1 | 4.55 | 153,288 | 12.85 | 0.08 | ||
| Northwest | 2 | 9.09 | 172,575 | 14.46 | 0.14 | ||
| North | 0 | 0 | 72,171 | 6.05 | 0 | ||
| 5 | Distance to settlement (DS) (m) | <100 | 4 | 18.18 | 314,685 | 26.37 | 0.69 |
| 100–200 | 5 | 22.73 | 203,579 | 17.06 | 1.33 | ||
| 200–300 | 7 | 31.82 | 174,913 | 14.66 | 2.17 | ||
| 300–400 | 5 | 22.73 | 140,437 | 11.77 | 1.93 | ||
| >400 | 1 | 4.55 | 359,731 | 30.14 | 0.15 | ||
| 6 | Distance to drainage (DD) (m) | <100 | 12 | 54.55 | 515,300 | 43.18 | 1.26 |
| 100–200 | 8 | 36.36 | 400,678 | 33.58 | 1.08 | ||
| 200–300 | 2 | 9.09 | 218,759 | 18.33 | 0.5 | ||
| 300–400 | 0 | 0 | 51,924 | 4.35 | 0 | ||
| >400 | 0 | 0 | 6684 | 0.56 | 0 | ||
| 7 | Distance to road (DR) (m) | <100 | 8 | 36.36 | 584,659 | 48.99 | 0.74 |
| 100–200 | 10 | 45.45 | 313,772 | 26.29 | 1.73 | ||
| 200–300 | 2 | 9.09 | 152,051 | 12.74 | 0.71 | ||
| 300–400 | 1 | 4.55 | 74,051 | 6.21 | 0.73 | ||
| >400 | 1 | 4.55 | 68,812 | 5.77 | 0.79 | ||
| 8 | NDVI | <0.1 | 1 | 4.55 | 17,383 | 1.46 | 3.12 |
| 0.1–0.3 | 3 | 13.64 | 264,964 | 22.2 | 0.61 | ||
| 0.3–0.6 | 15 | 68.18 | 688,852 | 57.72 | 1.18 | ||
| >0.6 | 3 | 13.64 | 222,146 | 18.62 | 0.73 | ||
| 9 | NDMI | <0.05 | 13 | 59.09 | 605,701 | 50.76 | 1.16 |
| 0.05–0.1 | 5 | 22.73 | 316,206 | 26.5 | 0.86 | ||
| 0.1–0.2 | 4 | 18.18 | 254,833 | 21.35 | 0.85 | ||
| >0.2 | 0 | 0 | 16,605 | 1.39 | 0 | ||
| 10 | Topographic Wetness Index (TWI) | <5 | 8 | 36.36 | 387,855 | 32.5 | 1.12 |
| 5–10 | 13 | 59.09 | 771,304 | 64.63 | 0.91 | ||
| 10–15 | 1 | 4.55 | 28,410 | 2.38 | 1.91 | ||
| >15 | 0 | 0 | 5776 | 0.48 | 0 | ||
| 11 | Rainfall (RF) (mm) | <950 | 0 | 0 | 2244 | 0.19 | 0 |
| 950–1050 | 3 | 13.64 | 314,981 | 26.39 | 0.52 | ||
| 1050–1150 | 15 | 68.18 | 388,447 | 32.55 | 2.09 | ||
| 1150–1250 | 2 | 9.09 | 292,709 | 24.53 | 0.37 | ||
| >1250 | 2 | 9.09 | 194,964 | 16.34 | 0.56 | ||
| 12 | Temperature (TM) (°C) | <15 | 7 | 31.82 | 482,874 | 40.46 | 0.79 |
| 15–16 | 11 | 50 | 391,289 | 32.79 | 1.52 | ||
| 16–17 | 4 | 18.18 | 226,069 | 18.94 | 0.96 | ||
| 17–18 | 0 | 0 | 81,499 | 6.83 | 0 | ||
| >18 | 0 | 0 | 11,614 | 0.97 | 0 | ||
| 13 | Wind speed (WS) (m/s) | <3.65 | 2 | 9.09 | 243,083 | 20.37 | 0.45 |
| 3.65–3.95 | 14 | 63.64 | 543,309 | 45.53 | 1.4 | ||
| 3.95–4.30 | 4 | 18.18 | 173,464 | 14.54 | 1.25 | ||
| 4.30–4.66 | 1 | 4.55 | 130,006 | 10.89 | 0.42 | ||
| >4.66 | 1 | 4.55 | 103,483 | 8.67 | 0.52 |
| Factors | SL | EL | CR | AS | DS | DD | DR | NDVI | NDMI | TWI | RF | TM | WS |
|---|---|---|---|---|---|---|---|---|---|---|---|---|---|
| Slope (SL) | 1 | 5.00 | 7.00 | 5.00 | 6.00 | 6.00 | 5.00 | 4.00 | 3.00 | 6.00 | 5.00 | 6.00 | 3.00 |
| Elevation (El) | 0.20 | 1 | 2.00 | 3.00 | 2.00 | 5.00 | 4.00 | 4.00 | 3.00 | 5.00 | 3.00 | 5.00 | 3.00 |
| Curvature (CV) | 0.14 | 0.50 | 1 | 3.00 | 2.00 | 3.00 | 4.00 | 3.00 | 2.00 | 3.00 | 4.00 | 3.00 | 2.00 |
| Aspects (AS) | 0.20 | 0.33 | 0.33 | 1 | 1.00 | 3.00 | 2.00 | 4.00 | 3.00 | 4.00 | 2.00 | 3.00 | 2.00 |
| Distance to settlement (DS) | 0.17 | 0.50 | 0.50 | 1.00 | 1 | 2.00 | 1.00 | 2.00 | 4.00 | 3.00 | 2.00 | 4.00 | 2.00 |
| Distance to drainage (DD) | 0.17 | 0.20 | 0.33 | 0.33 | 0.50 | 1 | 1.00 | 2.00 | 1.00 | 2.00 | 2.00 | 4.00 | 1.00 |
| Distance to road (DR) | 0.20 | 0.25 | 0.25 | 0.50 | 1.00 | 1.00 | 1 | 2.00 | 2.00 | 3.00 | 4.00 | 3.00 | 2.00 |
| NDVI | 0.25 | 0.25 | 0.33 | 0.25 | 0.50 | 0.50 | 0.50 | 1 | 1.00 | 2.00 | 1.00 | 3.00 | 1.00 |
| NDMI | 0.33 | 0.33 | 0.50 | 0.33 | 0.25 | 1.00 | 0.50 | 1.00 | 1 | 2.00 | 1.00 | 2.00 | 1.00 |
| Topographic Wetness Index (TWI) | 0.17 | 0.20 | 0.33 | 0.25 | 0.33 | 0.50 | 0.33 | 0.50 | 0.50 | 1 | 1.00 | 2.00 | 1.00 |
| Rainfall (RF) | 0.20 | 0.33 | 0.25 | 0.50 | 0.50 | 0.50 | 0.25 | 1.00 | 1.00 | 1.00 | 1 | 3.00 | 2.00 |
| Temperature (TM) | 0.17 | 0.20 | 0.33 | 0.33 | 0.25 | 0.25 | 0.33 | 0.33 | 0.50 | 0.50 | 0.33 | 1 | 1.00 |
| Wind speed (WS) | 0.33 | 0.33 | 0.50 | 0.50 | 0.50 | 1.00 | 0.50 | 1.00 | 1.00 | 1.00 | 0.50 | 1.00 | 1 |
| SL | EL | CR | AS | DS | DD | DR | NDVI | NDMI | TWI | RF | TM | WS | Weight | Rank | |
|---|---|---|---|---|---|---|---|---|---|---|---|---|---|---|---|
| SL | 0.283 | 0.531 | 0.513 | 0.313 | 0.379 | 0.242 | 0.245 | 0.155 | 0.130 | 0.179 | 0.186 | 0.150 | 0.136 | 0.265 | 1 |
| El | 0.057 | 0.106 | 0.147 | 0.188 | 0.126 | 0.202 | 0.196 | 0.155 | 0.130 | 0.149 | 0.112 | 0.125 | 0.136 | 0.141 | 2 |
| CV | 0.040 | 0.053 | 0.073 | 0.188 | 0.126 | 0.121 | 0.196 | 0.116 | 0.087 | 0.090 | 0.149 | 0.075 | 0.091 | 0.108 | 3 |
| AS | 0.057 | 0.035 | 0.024 | 0.063 | 0.063 | 0.121 | 0.098 | 0.155 | 0.130 | 0.119 | 0.075 | 0.075 | 0.091 | 0.085 | 4 |
| DS | 0.048 | 0.053 | 0.037 | 0.063 | 0.063 | 0.081 | 0.049 | 0.077 | 0.174 | 0.090 | 0.075 | 0.100 | 0.091 | 0.077 | 5 |
| DD | 0.048 | 0.021 | 0.024 | 0.021 | 0.032 | 0.040 | 0.049 | 0.077 | 0.043 | 0.060 | 0.075 | 0.100 | 0.045 | 0.049 | 7 |
| DR | 0.057 | 0.027 | 0.018 | 0.031 | 0.063 | 0.040 | 0.049 | 0.077 | 0.087 | 0.090 | 0.149 | 0.075 | 0.091 | 0.066 | 6 |
| NDVI | 0.071 | 0.027 | 0.024 | 0.016 | 0.032 | 0.020 | 0.024 | 0.039 | 0.043 | 0.060 | 0.037 | 0.075 | 0.045 | 0.039 | 10 |
| NDMI | 0.093 | 0.035 | 0.037 | 0.021 | 0.016 | 0.040 | 0.024 | 0.039 | 0.043 | 0.060 | 0.037 | 0.050 | 0.045 | 0.042 | 8 |
| TWI | 0.048 | 0.021 | 0.024 | 0.016 | 0.021 | 0.020 | 0.016 | 0.019 | 0.022 | 0.030 | 0.037 | 0.050 | 0.045 | 0.028 | 12 |
| RF | 0.057 | 0.035 | 0.018 | 0.031 | 0.032 | 0.020 | 0.012 | 0.039 | 0.043 | 0.030 | 0.037 | 0.075 | 0.091 | 0.040 | 9 |
| TM | 0.048 | 0.021 | 0.024 | 0.021 | 0.016 | 0.010 | 0.016 | 0.013 | 0.022 | 0.015 | 0.012 | 0.025 | 0.045 | 0.022 | 13 |
| WS | 0.093 | 0.035 | 0.037 | 0.031 | 0.032 | 0.040 | 0.024 | 0.039 | 0.043 | 0.030 | 0.019 | 0.025 | 0.045 | 0.038 | 11 |
| λ | 14.17 | ||||||||||||||
| n | 13 | ||||||||||||||
| CI | 0.097 | ||||||||||||||
| RI: n = 13 | 1.56 | ||||||||||||||
| CR | 0.062 | ||||||||||||||
| CR% | 6.25 |
| No. | Factor | Sub-Criteria | Susceptibility Class of FRS | Rating | AHP Weight |
|---|---|---|---|---|---|
| 1 | Slope (SL) (deg.) | <5 | Very low | 1 | 0.265 |
| 5–10 | Low | 2 | |||
| 10–15 | Moderate | 3 | |||
| 15–20 | High | 4 | |||
| 20–25 | Very high | 5 | |||
| >25 | Very high | 5 | |||
| 2 | Elevation (El) (m) | <200 | Very high | 5 | 0.141 |
| 200–400 | High | 4 | |||
| 400–600 | Moderate | 3 | |||
| 600–800 | Low | 2 | |||
| >800 | Very low | 1 | |||
| 3 | Curvature (CV) | Concave | Moderate | 3 | 0.108 |
| Flat | Very high | 5 | |||
| Convex | High | 4 | |||
| 4 | Aspects (AS) | Flat | Very high | 5 | 0.085 |
| North | Moderate | 3 | |||
| Northeast | Low | 2 | |||
| East | Very high | 5 | |||
| Southeast | Very high | 5 | |||
| South | High | 4 | |||
| Southwest | High | 4 | |||
| West | Very high | 5 | |||
| Northwest | Moderate | 3 | |||
| North | Low | 2 | |||
| 5 | Distance to settlement (DS) (m) | <100 | Very high | 5 | 0.077 |
| 100–200 | High | 4 | |||
| 200–300 | Moderate | 3 | |||
| 300–400 | Low | 2 | |||
| >400 | Very low | 1 | |||
| 6 | Distance to drainage (DD) (m) | <100 | Very high | 5 | 0.049 |
| 100–200 | High | 4 | |||
| 200–300 | Moderate | 3 | |||
| 300–400 | Low | 2 | |||
| >400 | Very low | 1 | |||
| 7 | Distance to road (DR) (m) | <100 | Very high | 5 | 0.066 |
| 100–200 | High | 4 | |||
| 200–300 | Moderate | 3 | |||
| 300–400 | Low | 2 | |||
| >400 | Very low | 1 | |||
| 8 | NDVI | <0.1 | Low | 2 | 0.039 |
| 0.1–0.3 | Moderate | 3 | |||
| 0.3–0.6 | High | 4 | |||
| >0.6 | Very high | 5 | |||
| 9 | NDMI | <0.05 | Low | 1 | 0.042 |
| 0.05–0.1 | Moderate | 3 | |||
| 0.1–0.2 | High | 4 | |||
| >0.2 | Very high | 5 | |||
| 10 | Topographic Wetness Index (TWI) | <5 | Low | 2 | 0.028 |
| 5–10 | Moderate | 3 | |||
| 10–15 | High | 4 | |||
| >15 | Very high | 5 | |||
| 11 | Rainfall (RF) (mm) | <950 | Very high | 5 | 0.04 |
| 950–1050 | High | 4 | |||
| 1050–1150 | Moderate | 3 | |||
| 1150–1250 | Low | 2 | |||
| <1250 | Very low | 1 | |||
| 12 | Temperature (TM) (°C) | <15 | Very low | 1 | 0.022 |
| 15–16 | Low | 2 | |||
| 16–17 | Moderate | 3 | |||
| 17–18 | High | 4 | |||
| >18 | Very high | 5 | |||
| 13 | Wind speed (WS) (m/s) | <3.65 | Very low | 1 | 0.038 |
| 3.65–3.95 | Low | 2 | |||
| 3.9–4.30 | Moderate | 3 | |||
| 4.30–4.66 | High | 4 | |||
| >4.66 | Very high | 5 |
| Degree | Forest Fire Susceptibility | FR | AHP | ||
|---|---|---|---|---|---|
| Area (km2) | % | Area (km2) | % | ||
| 1 | Very low | 22.32 | 12.00 | 29.46 | 15.83 |
| 2 | Low | 48.51 | 26.07 | 33.33 | 17.91 |
| 3 | Moderate | 52.61 | 28.27 | 64.66 | 34.75 |
| 4 | High | 40.65 | 21.85 | 40.54 | 21.79 |
| 5 | Very high | 21.99 | 11.82 | 18.10 | 9.73 |
Publisher’s Note: MDPI stays neutral with regard to jurisdictional claims in published maps and institutional affiliations. |
© 2022 by the authors. Licensee MDPI, Basel, Switzerland. This article is an open access article distributed under the terms and conditions of the Creative Commons Attribution (CC BY) license (https://creativecommons.org/licenses/by/4.0/).
Share and Cite
Abdo, H.G.; Almohamad, H.; Al Dughairi, A.A.; Al-Mutiry, M. GIS-Based Frequency Ratio and Analytic Hierarchy Process for Forest Fire Susceptibility Mapping in the Western Region of Syria. Sustainability 2022, 14, 4668. https://0-doi-org.brum.beds.ac.uk/10.3390/su14084668
Abdo HG, Almohamad H, Al Dughairi AA, Al-Mutiry M. GIS-Based Frequency Ratio and Analytic Hierarchy Process for Forest Fire Susceptibility Mapping in the Western Region of Syria. Sustainability. 2022; 14(8):4668. https://0-doi-org.brum.beds.ac.uk/10.3390/su14084668
Chicago/Turabian StyleAbdo, Hazem Ghassan, Hussein Almohamad, Ahmed Abdullah Al Dughairi, and Motirh Al-Mutiry. 2022. "GIS-Based Frequency Ratio and Analytic Hierarchy Process for Forest Fire Susceptibility Mapping in the Western Region of Syria" Sustainability 14, no. 8: 4668. https://0-doi-org.brum.beds.ac.uk/10.3390/su14084668