Article

Evaluation of Agronomic Performance and Genetic Diversity Analysis Using Simple Sequence Repeats Markers in Selected Wheat Lines

1
Institute of Biotechnology and Genetic Engineering, The University of Agriculture, Peshawar 25130, Pakistan
2
Department of Business Administration, College of Business Administration, Princess Nourah bint Abdulrahman University, P.O. Box 84428, Riyadh 11671, Saudi Arabia
3
Department of Botany, Islamia College Peshawar, Peshawar 25120, Pakistan
4
Biology Laboratory, Agriculture University Public School and College for Boys (AUPS & C), The University of Agriculture Peshawar, Peshawar 25130, Pakistan
5
Department of Plant Sciences, Quaid-i-Azam University, Islamabad 45320, Pakistan
6
Department of Biological Sciences, Faculty of Science, King Abdulaziz University (KAU), P.O. Box 80141, Jeddah 21589, Saudi Arabia
7
King Fahd Medical Research Center, Yousef Abdullatif Jameel Chair of Prophetic Medicine Application, Faculty of Medicine, King Abdulaziz University, Jeddah 21589, Saudi Arabia
*
Authors to whom correspondence should be addressed.
Sustainability 2023, 15(1), 293; https://0-doi-org.brum.beds.ac.uk/10.3390/su15010293
Submission received: 19 October 2022 / Revised: 24 November 2022 / Accepted: 8 December 2022 / Published: 24 December 2022

Abstract

:
Crop improvement is the fundamental goal of plant biologists, and genetic diversity is the base for the survival of plants in nature. In this study, we evaluated 20 wheat lines for morphological and genetic diversity using eight simple sequence repeats markers from Wheat Microsatellite Consortium (WMC). Morphologically, variations were observed among all of the different wheat lines for the studied trait except for single spike weight. The highest values for different agronomic traits were recorded for the different wheat lines. The maximum days to heading were recorded for Borlaug-16 (128.3 ± 2.52 days). Similarly, days to maturity were recorded and were highest in Markaz-19 (182.3 ± 5.13 days), followed by Borlaug-16 (182.0 ± 4.58 days). The highest plant height was observed for Zincol-16 (122.3 ± 2.51 cm), followed by Markaz-19 (120.0 ± 14.79 cm) and Borlaug-16 (119.7 ± 6.8 cm). The productivity measured by 100-grain weight was highest in the case of Zincol-16 (84.0 ± 7.5 g). In contrast, wheat lines Shahkar, Sehar, and Farid-6 showed the lowest values for the traits tested. The results of genetic diversity revealed a total number of 16 alleles at eight SSR markers with an average of 2.00 ± 0.534 alleles per locus. Out of eight SSR markers, one marker (WMC105) was monomorphic, and six were dimorphic, showing two alleles at each locus. The maximum number of alleles (3) was observed for marker WMC78, in which genotypes AC and AA were predominantly found in high-yielding lines Borlaug-2016 and Zincol-2016 that were distantly related to other varieties. Zincol-2016 was also agronomically distinct from the rest of the 19 wheat lines. The results obtained from this study may be of importance for the scientific community to further explore the underlying genetic polymorphism associated high yielding varieties using marker-assisted selection for sustainable agriculture.

1. Introduction

Wheat is an essential field crop utilized as the main crop that is consumed worldwide [1,2,3,4]. Wheat accounts for 10% of the value-added in agriculture and 2.2% of the Gross Domestic Product (GDP) of Pakistan. During 2018–2019, the wheat crop was reported to be sown in an area of 9.04 million hectares, reporting a decrease of 2% as compared to 9.22 million hectares during 2017–2018. Production of Wheat was reported to be 27 million tons during 2019, with an enhancement of 7.3% more as compared to the previous year’s yield of 25.16 million tons. The yield enhancement contributed to increasing per hectare yield [5]. During the last few years, wheat has been the main essential food item, and improvement in its production, quality, and architecture occurred following the Green Revolution [6]. Successes in wheat breeding are improved and resulted in higher yields due to tackling the following factors: resistance to diseases [7,8] and tolerance to soil micronutrient imbalances [9], resistance to lodging, industrial quality, tolerance to drought [10,11,12], acidity, heavy metals [13,14,15,16,17], heat, cold, and salinity [18,19,20,21,22,23], bio-control [24,25], changes in grain color, photo-period sensitivity, nitrogen use efficiency, pre and post-harvest [26] sprouting resistance, and swift grain filling [27].
Seed yield is a complicated quantitative trait; hence, selection based on the performance of genotype for seed production was generally not effective. Selection for seed production by considering physiological and morphological characters as indirect selection standard is a choice breeding method [28]. The assessment of yield-related characters with respect to their genetics is essential for the improvement of seed production. Correlation among quantitative plant characters with their direct and indirect response to seed production is of huge importance for the achievement of the selection that is applied during the breeding methods. However, these characters are more affected by the environment and genotype due to their quantitative nature [29]. Agro-morphological traits (phenotyping) are the first step towards line and protection of genetic diversity [30,31]. When investigating genetic biodiversity, the use of agromorphological diversity gives more complex data to molecular marker characterization. Morphological criteria such as the structure and color of seeds, spike density, plant height, glume nature, days to heading and maturity, 1000 seed weight, etc., can be utilized as criteria to evaluate the diversity among the wheat variation [32,33].
Genetic variation is the base for genetic development. Germplasm diversity information has an important impact on crop plant improvement [34,35,36]. Advanced breeding recommends that genetic variation in wheat has been narrowing. Narrow genetic diversity is an issue counteracting adaptation to abiotic stresses [37,38,39,40], such as salt [41,42,43], drought, heavy metals [44,45,46,47] tolerance, and biotic stresses, such as a pest etc. Henceforth, it is important to broaden the genetic diversity of wheat for future wheat breeding programs [48]. Climate change is one of the important factors that elevate both biotic and abiotic stresses in plants [49]. Due to continuous climate change events in recent years, wheat breeding programs have been severely affected, resulting in a loss of adaptability and productivity [50]. The major impact of climate change is on agriculture production due to changes in rain patterns, floods, droughts, and temperature. Therefore, plant productivity and resistance to climatic stresses are currently the major topics of interest for sustainable agriculture [35]. To combat climatic stresses, genetic diversity assessment of the existing germplasm is of prime importance to identify the genetic basis of adaptability and productivity [34].
The molecular marker(s) for the evaluation of genetic diversity evaluation is a very trendy approach. Wheat scientists investigated genetic variations in wheat using various DNA markers such as RFLPs [51], AFLPs [52], RAPDs [53], ISSRs [54], and STS [55]. However, some markers have a low level of polymorphism in common wheat, particularly among cultivars [56]. Simple sequence repeats (SSRs) have been considered the most effective marker for the genetic variation assessment among the different wheat lines because of their chromosomal specificity, multiallelic, and even distribution along the chromosomes [57]. SSR markers are applied mainly for the identification of QTLs [58], tagging resistance genes [48,59], and confirming the integrity and genetic solidity of gene bank accessions and marker-assisted pick in wheat [60]. These markers also showed a high level of polymorphism among diploid species, in the case of tetraploid wheat Aegilops tauschii and Triticum dicoccoides, the D-genome donor of wheat, and also in hexaploid wheat varieties [61].
In wheat, there are many SSR markers accessible that have already been mapped on its genome [62]. SSR markers are beneficial and befalling to be renowned for countless applications in wheat breeding because of their high polymorphism level and ease of handling [63]. Microsatellite markers are exploited to evaluate the genetic variety of hexaploid wheat (Triticum astivum. L) landraces in connection to their geographic source [64]. However, some limitations associated with SSR markers include a limited number of SSR motifs in the genome, labor-intensive gel-based assays, limited multiplexing potential, low throughput, and higher cost [65]. Therefore, genotyping and diversity assessment methods in wheat lines are now changing to high-throughput SNP genotyping technology, which has the potential to overcome the limitations associated with conventional SSR genotyping.
Registration and identification of wheat cultivars are mainly based on physiological and morphological traits. Even if they are useful, they can be affected by environmental factors. DNA marker is very helpful in providing information about the physiological and morphological characterization of the different varieties of wheat due to tissue independency or ecological effects, plentiful, and cultivar detection early in plant germination. DNA-based characterization of varieties is also beneficial in providing information related to genetic erosion [66].
This study was designed to evaluate the morphological diversity of 20 selected wheat lines. Different agronomic parameters, including days to heading, days to maturity, number of spikelets per spike, grain yield, etc., were compared among the selected wheat lines. In addition, molecular variance (allelic polymorphism, genetic diversity, and genetic distance) among the selected wheat lines was analyzed using eight different SSR DNA markers. The association between agronomic traits and SSR polymorphism was evaluated to identify potential loci/alleles for future studies.

2. Materials and Methods

2.1. Experimental Material

The experimental material was comprised of 20 varieties of wheat (Table 1). All the 20 wheat lines used for this study were genetically diverse and are the results of different breeding experiments for better performance in the local environment. The pedigrees of the seeds material are given in the table below.

2.2. Experimental Design

The current research was carried out at the National Agricultural Research Centre, Islamabad, to assess morphological and molecular genetic variation in wheat. Sowing was performed in triplicates during the third week of October using a Randomized Complete Block Design (RCBD). In order to attain maximum accuracy, the agronomic attempts were executed for all genotypes in every replication. The crop was irrigated as per needs. Data were cured on five randomly selected plants for distinct genotypes in each replication on the following parameters.

2.3. Parameters under Consideration

Data was cured for the given traits, and their mean was computed. All the parameters were measured for at least triplicates for each one of the given lines. Days to 50 percent heading were calculated starting immediately after the sowing date to the emergence of the spike from the flag leave sheath of half of the plants. The count of days to maturity was calculated starting at the sowing date and ending at the physiological maturity date of genotypes. In five (5) randomly selected plants, plant height was measured from the level of the ground to the top of the spike apart from awns using a measuring rod at plant maturity. The count of spikelet/spike was calculated for selected spikes for each plot, and then their average was used for the final analysis. Single spike weight was measured for each randomly selected spike in a digital balance machine and then averaged for data analysis. The number of seeds of randomly selected spikes was weighed in grams by using an electronic balance, and then the mean and SD were then calculated. A sample of hundred seeds was weighted in grams (g) for each randomly selected plant, and then the average for data analysis was determined. Seed yield/plant was obtained by weighting the total seed produced per plant after threshing of each selected plant, and then the mean was determined.

2.4. DNA Isolation from Leaf Samples

Leaf samples of each genotype were collected, and DNA was extracted from these samples using a standard protocol. The samples were ground in liquid nitrogen, and the warmed (65 °C) CTAB buffer (800 μL) was added to each tube, and the resulting mixture was vortexed thoroughly to homogenize. Tubes were then incubated in a water bath for 1 h at 65 °C. Chloroform and phenol-isoamyl-alcohol (800 μL) at a ratio of 24:1 were added to each tube, and the solution was mixed gently by inverting tubes for 2 min.
The samples were centrifuged at 14,000 rpm for 15 min. The supernatant was transferred to new 1.5 μL Eppendorf tubes. Cold isopropanol (2/3rd volume of supernatant) was added to each tube and mixed gently. Samples were again centrifuged at 14,000 rpm for 10 min to pellet DNA. The supernatant was discarded, and the sample was washed with the help of ethanol (70%). Ethanol was discarded, and the DNA pellets were allowed to dry at 27 °C for 10 min. The DNA samples were dissolved in 100 μL TE (pH 8.0) and stored at −20 °C.

2.5. Polymerase Chain Reaction (PCR)

PCR mixture of 25 μL containing 80 ng of DNA template, 1 unit of Taq polymerase, 1.5 mM MgCl2, 0.2 mM dNTPs, and 200 nM primer. Specific regions in DNA were amplified through Polymerase Chain Reaction using specific primers (Table 2). PCR reaction was conducted according to specific conditions and standard protocol. PCR profile was three minutes of denaturing at 94 °C, 43 cycles for 1 min of denaturation at 94 °C, one minute of annealing at 55 °C, and two minutes of extension at 72 °C. A final extension step was 10 min at 72 °C.
Analyses of amplified products were conducted with 3% agarose electrophoresis gel. The fragments were run in 0.5X Tris EDTA with 120 V (4 v/cm) and were imaged by the ethidium bromide staining method. Pictures of bands were taken under UV light.

2.6. SSR Makers

Molecular marker offers a nearly indefinite number of markers to relate distinct genotypes under a wider collection of environmental settings. Further, they are not linked with crop growth stages and provide data that can be studied empirically. Interestingly, simple sequence repeats (SSRs), also renowned as microsatellite markers, are known to be valuable for producing contrastive genetic maps, studying genomic polymorphism in dissimilar germplasms, studying genetic diversity, and supporting genotypic selection [67,68,69,70]. Consequently, SSR analysis can perform a vital role in the determination of the alleles relating to diversity that would be beneficial for plant breeders to exploit and produce new varieties through genetic diversity.
In the present study, eight Wheat Microsatellite Consortium (WMC) SSR markers (Table 2) were used to characterize the 20 wheat varieties. Gene diversity, heterozygosity, major allele frequency, and the polymorphism information content (PIC) were calculated for all eight SSR markers. These markers are associated with the various morphological traits that identify genetic diversity. Francois et al. [71] described that both bread and durum wheat have huge genetic diversity regarding various morphological traits. Therefore, if the evaluation of genotypes for genetic diversity during the seed germination process, genetically diverse genotypes can be recognized at the early growth stages.

2.7. Data Analysis

The data were analyzed using different software as follows.

2.7.1. Statistical Analysis

All the statistical analysis was performed using SPSS software version 23. The data for all parameters were analyzed for means and standard deviation for all wheat lines. One-way ANOVA with Post Hoc Tukey’s test (at p-value ≤ 0.05) was performed to analyze the differences among the different wheat lines. Different shades of red color indicate significant differences among the different lines.

2.7.2. Phylogenetic Analysis

Genotypes were assigned to each DNA sample based on the gel banding pattern. Genetic diversity parameters, i.e., the number of observed and effective alleles; observed and expected heterozygosities; Shannon information index; and allele frequencies were calculated using POPGENE software [72]. Genetic distance among different combinations of wheat lines was also calculated from the genotype data. A dendrogram was constructed from the SSR data to evaluate the phylogenetic relationship among the 20 varieties.

3. Results

The study of agronomic traits is important for identifying high-producing wheat lines. It also provides the basis for exploring genetic diversity for further supplementation of the data for selecting high-producing lines with desirable traits. The wheat lines analyzed in this study showed significant diversity in both their agronomic traits (Table S1) and DNA markers. Results showing variations in the agronomic traits and genotypes of the 20 wheat lines are presented in this section.

3.1. Variation in Days to 50% Heading

Days to heading is an important agronomic trait that controls flowering time in wheat. The result of the current study showed variations in days to 50% heading among the different lines. The mean values for days to 50% heading ranged between 114.7 ± 0.58 and 128.3 ± 2.52 (Figure 1A). Different wheat lines showed different values for days to 50% heading.
The lowest value for days to 50% heading was recorded for Shahkar-13 and Farid-06 (114.7 ± 0.58 and 114.7 ± 3.05 days, respectively), which was significantly lower than Pakistan-13, Khatakwal, Zincol-16, NARC-11, Magalla-99, Markaz-19, NARC-09, Wafaq-01 and Borloaug-16 (123.7 ± 1.15 to 128.3 ± 2.52 days) (Figure 1B). The most prolonged days to 50% heading was recorded for Borloaug-16 (128.3 ± 2.52 days). Breeders prefer the lines which show early heading; thus, the agronomic trait (days to 50% heading) was more desirable for wheat lines Shahkar-13 and Farid-06. However, analysis of other desirable traits is important before the final selection.

3.2. Days to Maturity in Different Wheat Lines

Early crop maturity is a desirable characteristic in agriculture. The current data revealed significant variations in days to maturity among the 20 studied wheat lines (Figure 2A). The Farid-06 wheat line showed the lowest number of days needed to reach maturity (168.3 ± 2.89 days), which was significantly lower than 13 out of 19 lines studied (Figure 2B). The remaining six lines (Panjab-11, Pirsabaq-05, Pirsabaq-13, Galaxy-13, Sehar-06, and Shahkar-13) also showed a lower number of days needed to maturity (ranging between171.0 ± 2.64 to 176.0 ± 3.00) similar to Farid-06. Markaz-19 needed the longest time to reach days to maturity (182.3 ± 5.13 days), followed by Bouloaug-16 (182.0 ± 4.58 days). Plant height ranged from 105.7 ± 6.8 (Shahkar-13) to 122.3 ± 2.5 (Zincol-16), which were significantly different from each other (p < 0.05). Plant height among the rest of the 18 varieties showed no significant differences.

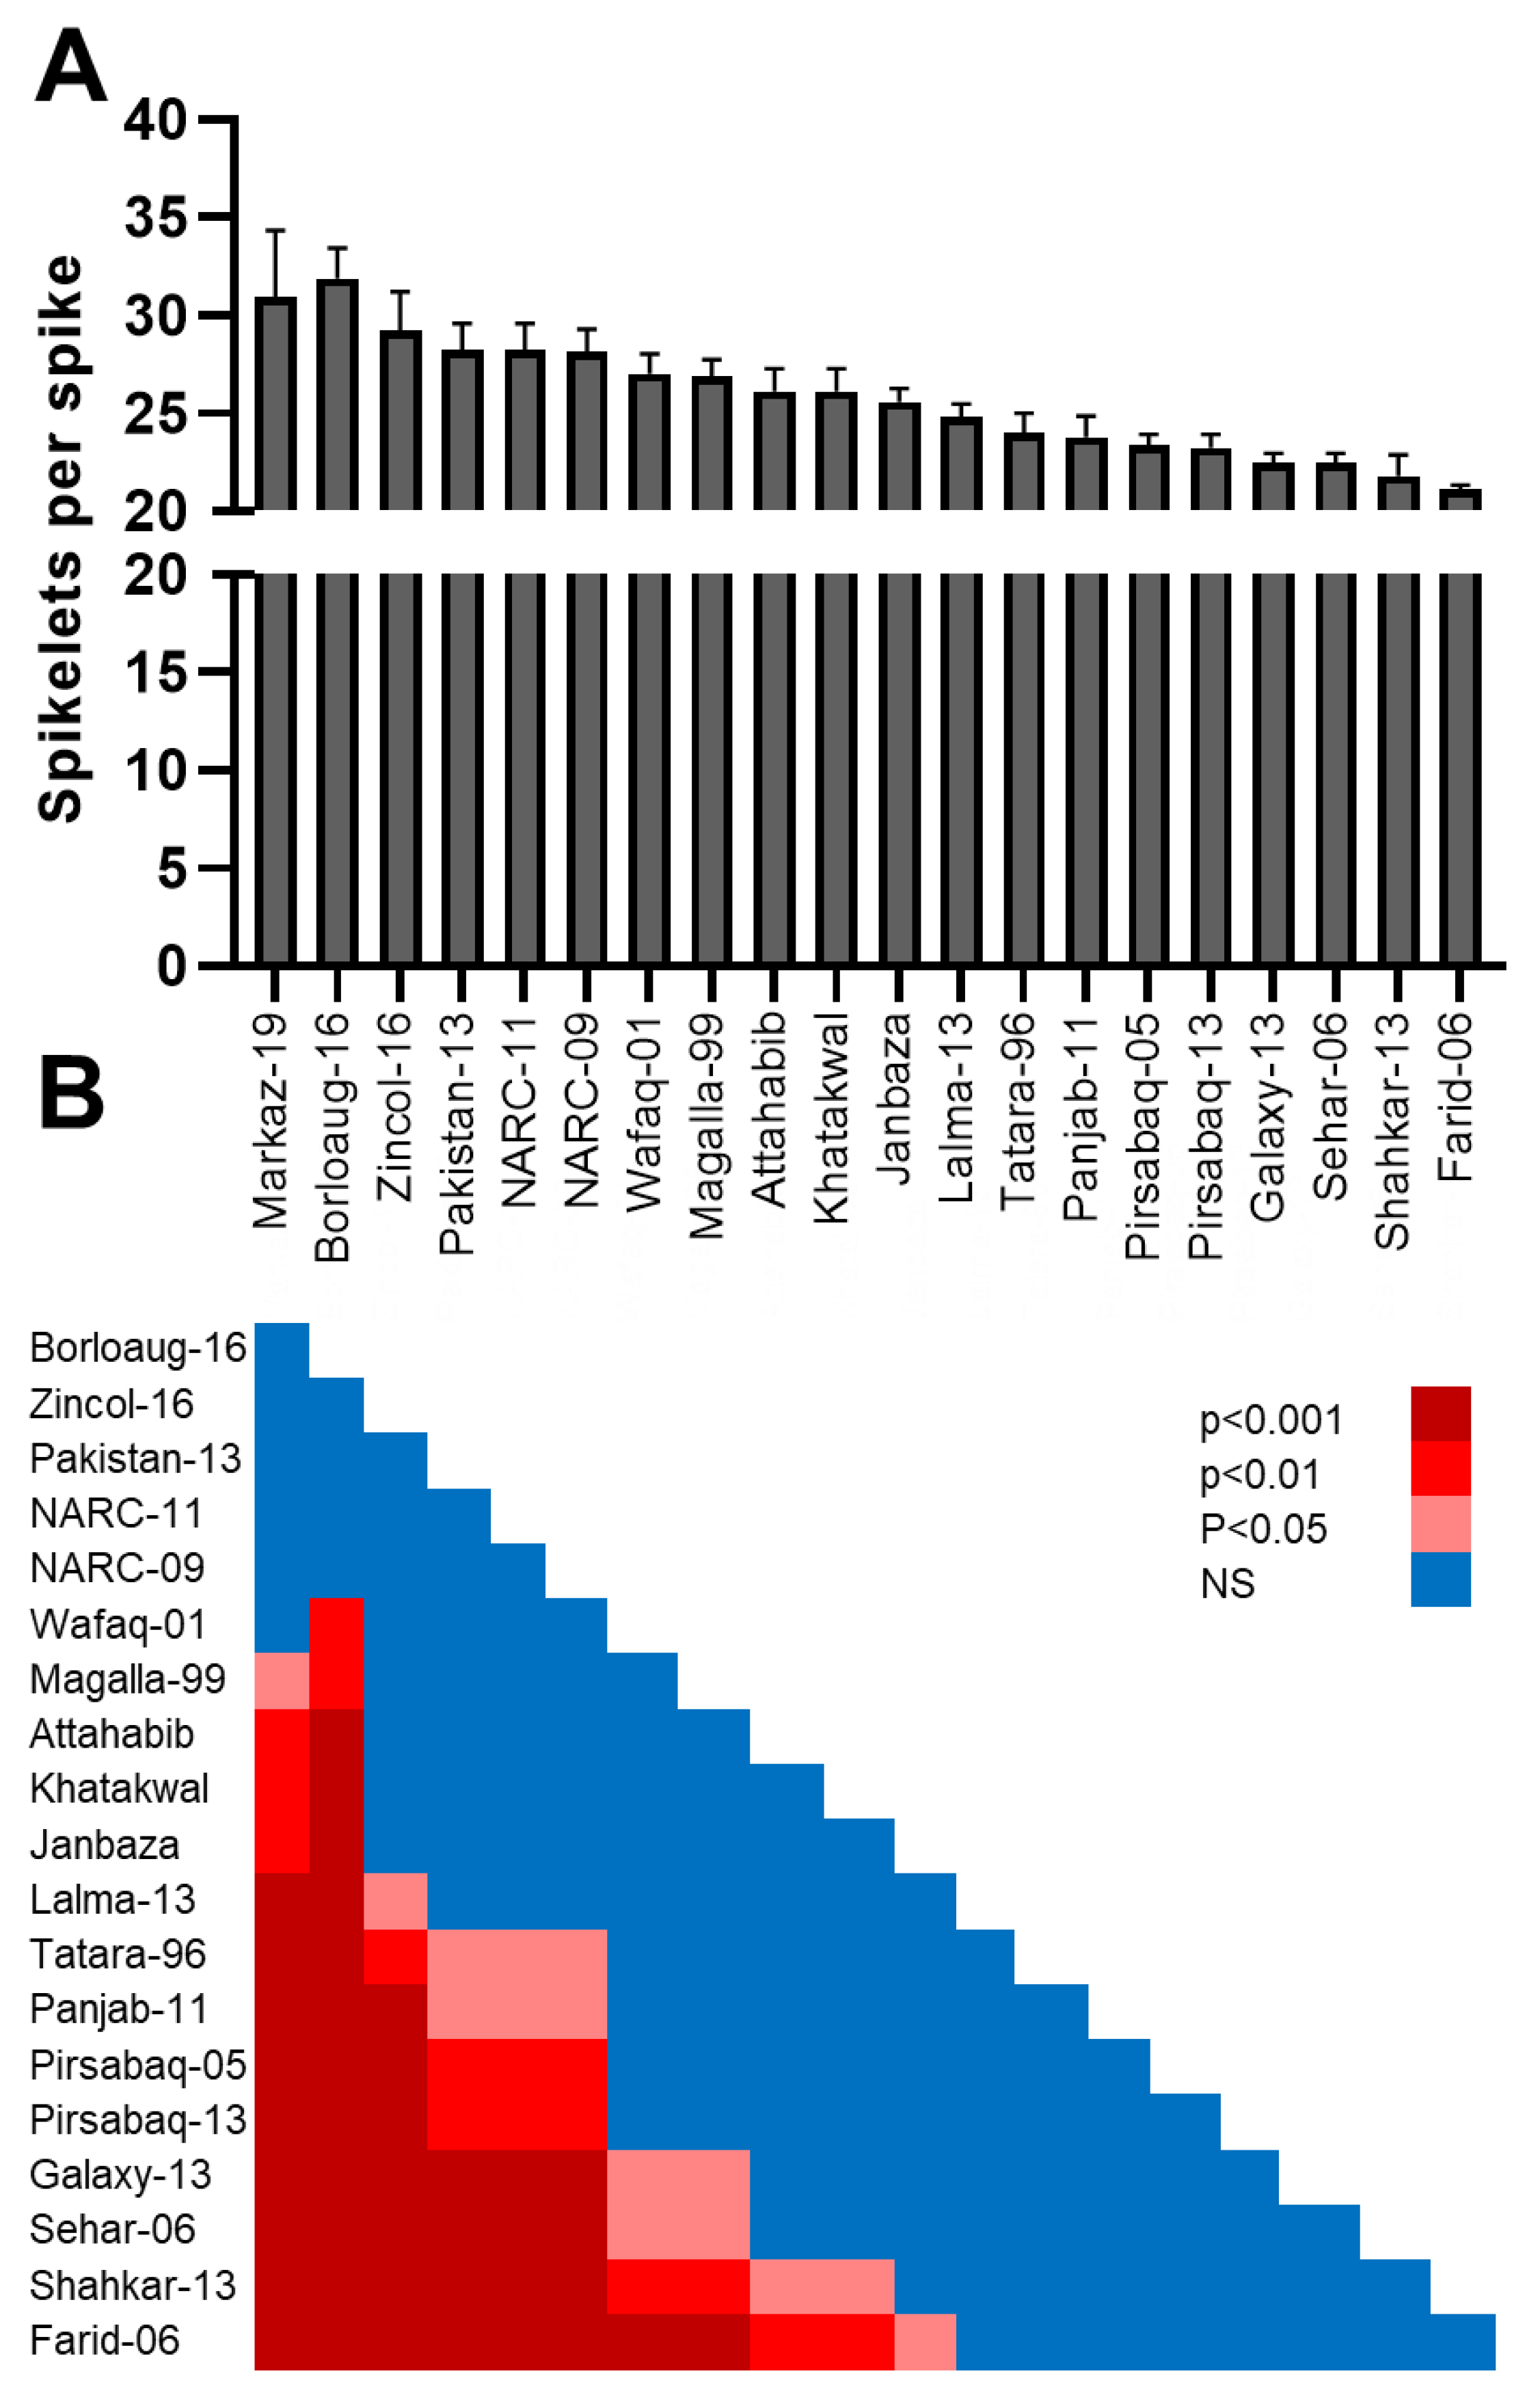
3.3. Number of Spikelets per Spike

Spikelet per spike is one of the essential wheat characteristics which is directly linked to the grain yield component. There was a significant variation in the number of spikelets per spike among the 20 wheat lines (Figure 3A). The highest number of spikelets per spike was recorded for the Borloaug-16 wheat line (31.9 ± 1.5), while the lowest number of spikelets per spike was noted in the case of Farid-06 (21.1 ± 0.2). The value for spikelet per spike for Borloaug-16 was significantly higher than 14 of the studied lines (p < 0.01 against 2 lines; p < 0.001 against 12 lines) (Figure 3B). In contrast, the lowest number of spikelets per spike was observed for Farid-06, which was significantly lower as compared to the 11 other lines (Figure 4B). The maximum value for single spike weight was recorded for Markaz-19 (57.7 ± 8.1 g), while the minimum value for single spike weight was recorded for Farid-06 (27.9 ± 11.1 g).

3.4. Hundred (100) Seeds Weight (g)

The mean of the hundred seeds weight varied among the 20 studied wheat lines and ranged between (8.4 ± 0.8 to 5.8 ± 0.7 g). The highest value for mean hundred seeds weight was recorded for two wheat lines: Zincol-16 (8.4 ± 0.8) and NARC-09 (8.1 ± 0.8) (Figure 4A). These lines showed significantly higher hundred seeds weight in comparison to Galaxy-13 (5.8 ± 0.30), Pirsabaq-13 (5.7 ± 0.5), Shahkar-13 (6.1 ± 0.7), and Farid-06 (5.8 ± 0.7) with lowest hundred seeds weight (Figure 4B).

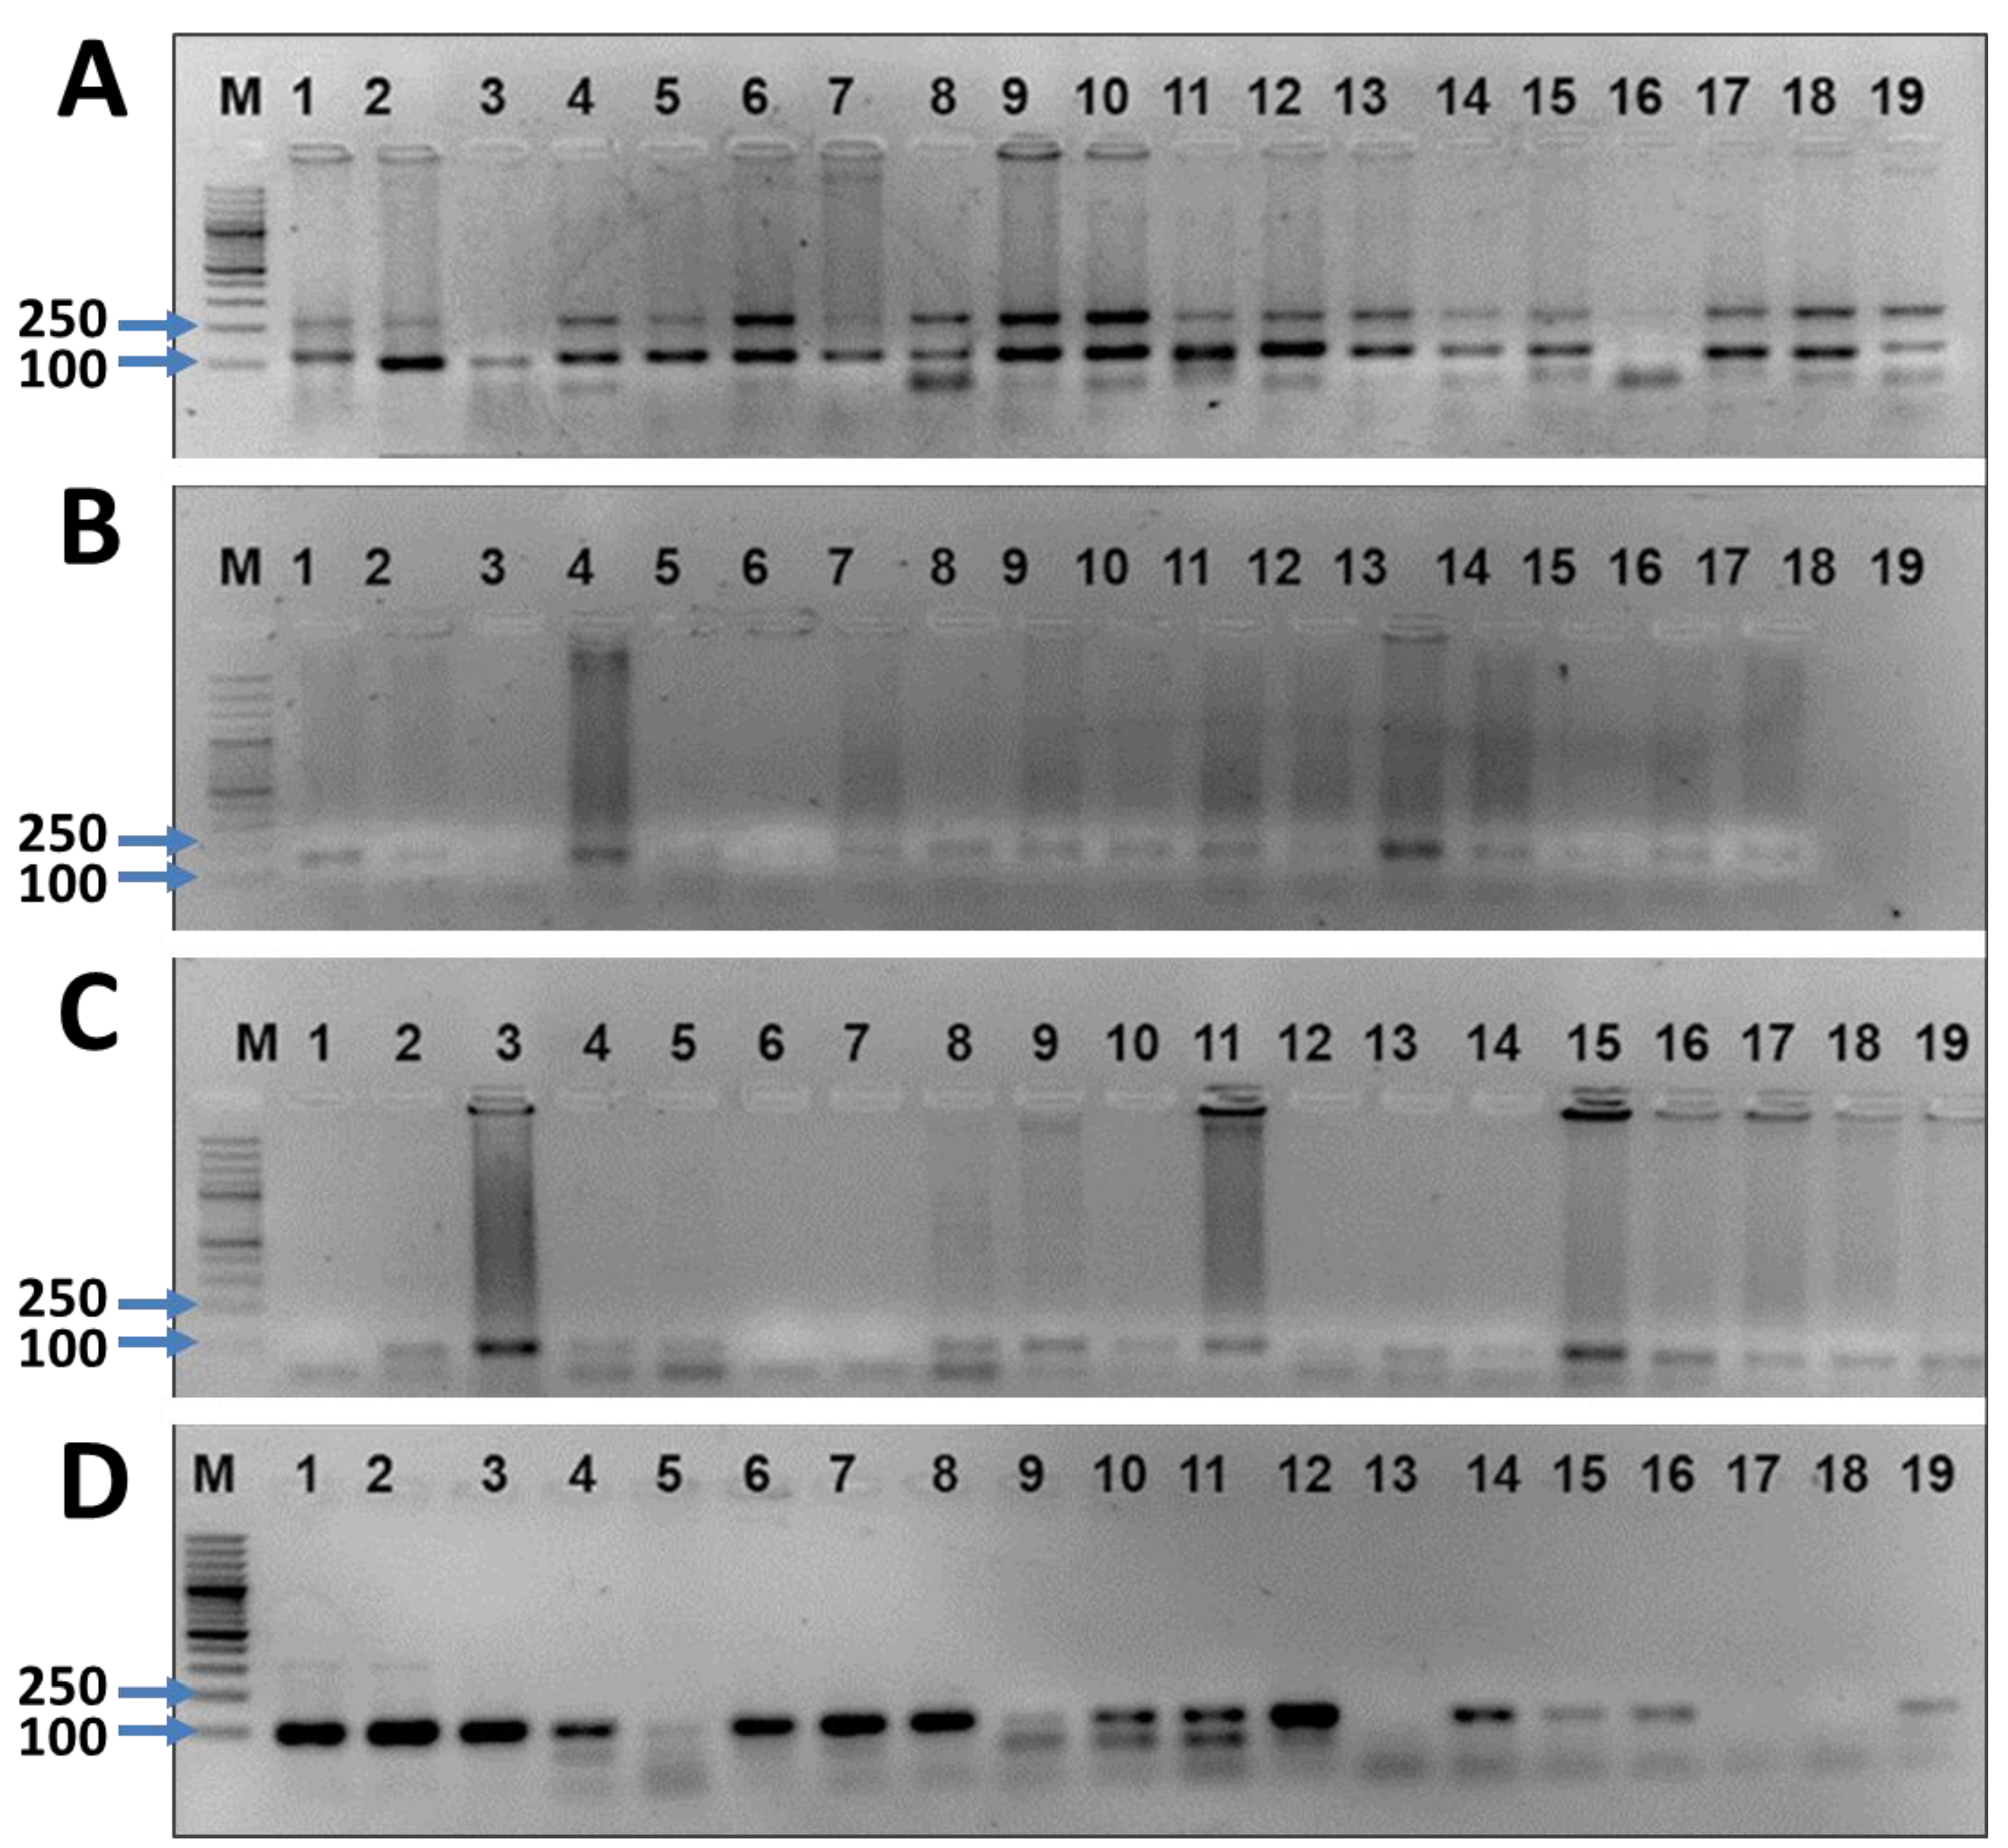
3.5. Diversity Assessment of 20 Wheat Lines Using SSR Markers

The genetic diversity among the 20 wheat lines was evaluated using eight SSR markers. Each of the SSR markers was amplified in each of the 20 wheat lines. Representative gel pictures showing the amplified bands of four SSR markers in 19 wheat samples are displayed in Figure 5. Variations were observed in the banding pattern, presence or absence of bands, band sizes, and the presence of a single band indicating a homozygous allele and double bands indicating heterozygous alleles among different wheat lines using different SSR markers. The band sizes ranged from 90 bp (WMC150) to 260 bp (WMC78). The bands were manually scored and analyzed for allelic variation, allele frequencies, and genetic distance evaluation.
The genotypes for each line decoded from the gel pictures are presented in Table 3. The results showed genotype variations based on the different SSR markers among the 20 wheat lines. Marker WMC105 showed a single genotype for all wheat lines; however, it did not show any band in two lines (Sehar-6 and Shahkar-13). Similarly, marker WMC168 was missing in two lines, marker WMC153 was missing in four lines, marker WMC165 was missing in 13 lines, and marker WM167 was missing in 15 out of 20 wheat lines (Table 3). The remaining markers amplified in all lines.
The diversity of 20 wheat lines assessed through eight SSR markers revealed a total number of 16 alleles with an average of 2.00 ± 0.534 alleles per locus, as presented in Table 4. One of the SSR markers (WMC105) was monomorphic, while the remaining showed polymorphism. Out of the seven polymorphic markers, six were dimorphic, showing two alleles at each locus. The maximum number of alleles (3) was observed for marker WMC78. Effective numbers of alleles were less than the observed values at each locus showing the dominance of some alleles over others.
The diversity estimates (Shannon index, observed, and expected heterozygosity) showed variations among the different SSR markers. The PIC values calculated from the allele frequency data for the SSR markers in this study showed medium polymorphism (PIC = 0.342 to 0.403), except WMC153 (PIC = 0.229) (Table 4).
Frequencies of the different alleles at each SSR locus also showed s (Table 5). The results showed that some of the alleles at each SSR locus were dominant with a high frequency, while the other alleles were less frequent in the pool. The presence of different genotypes also varied among wheat lines.

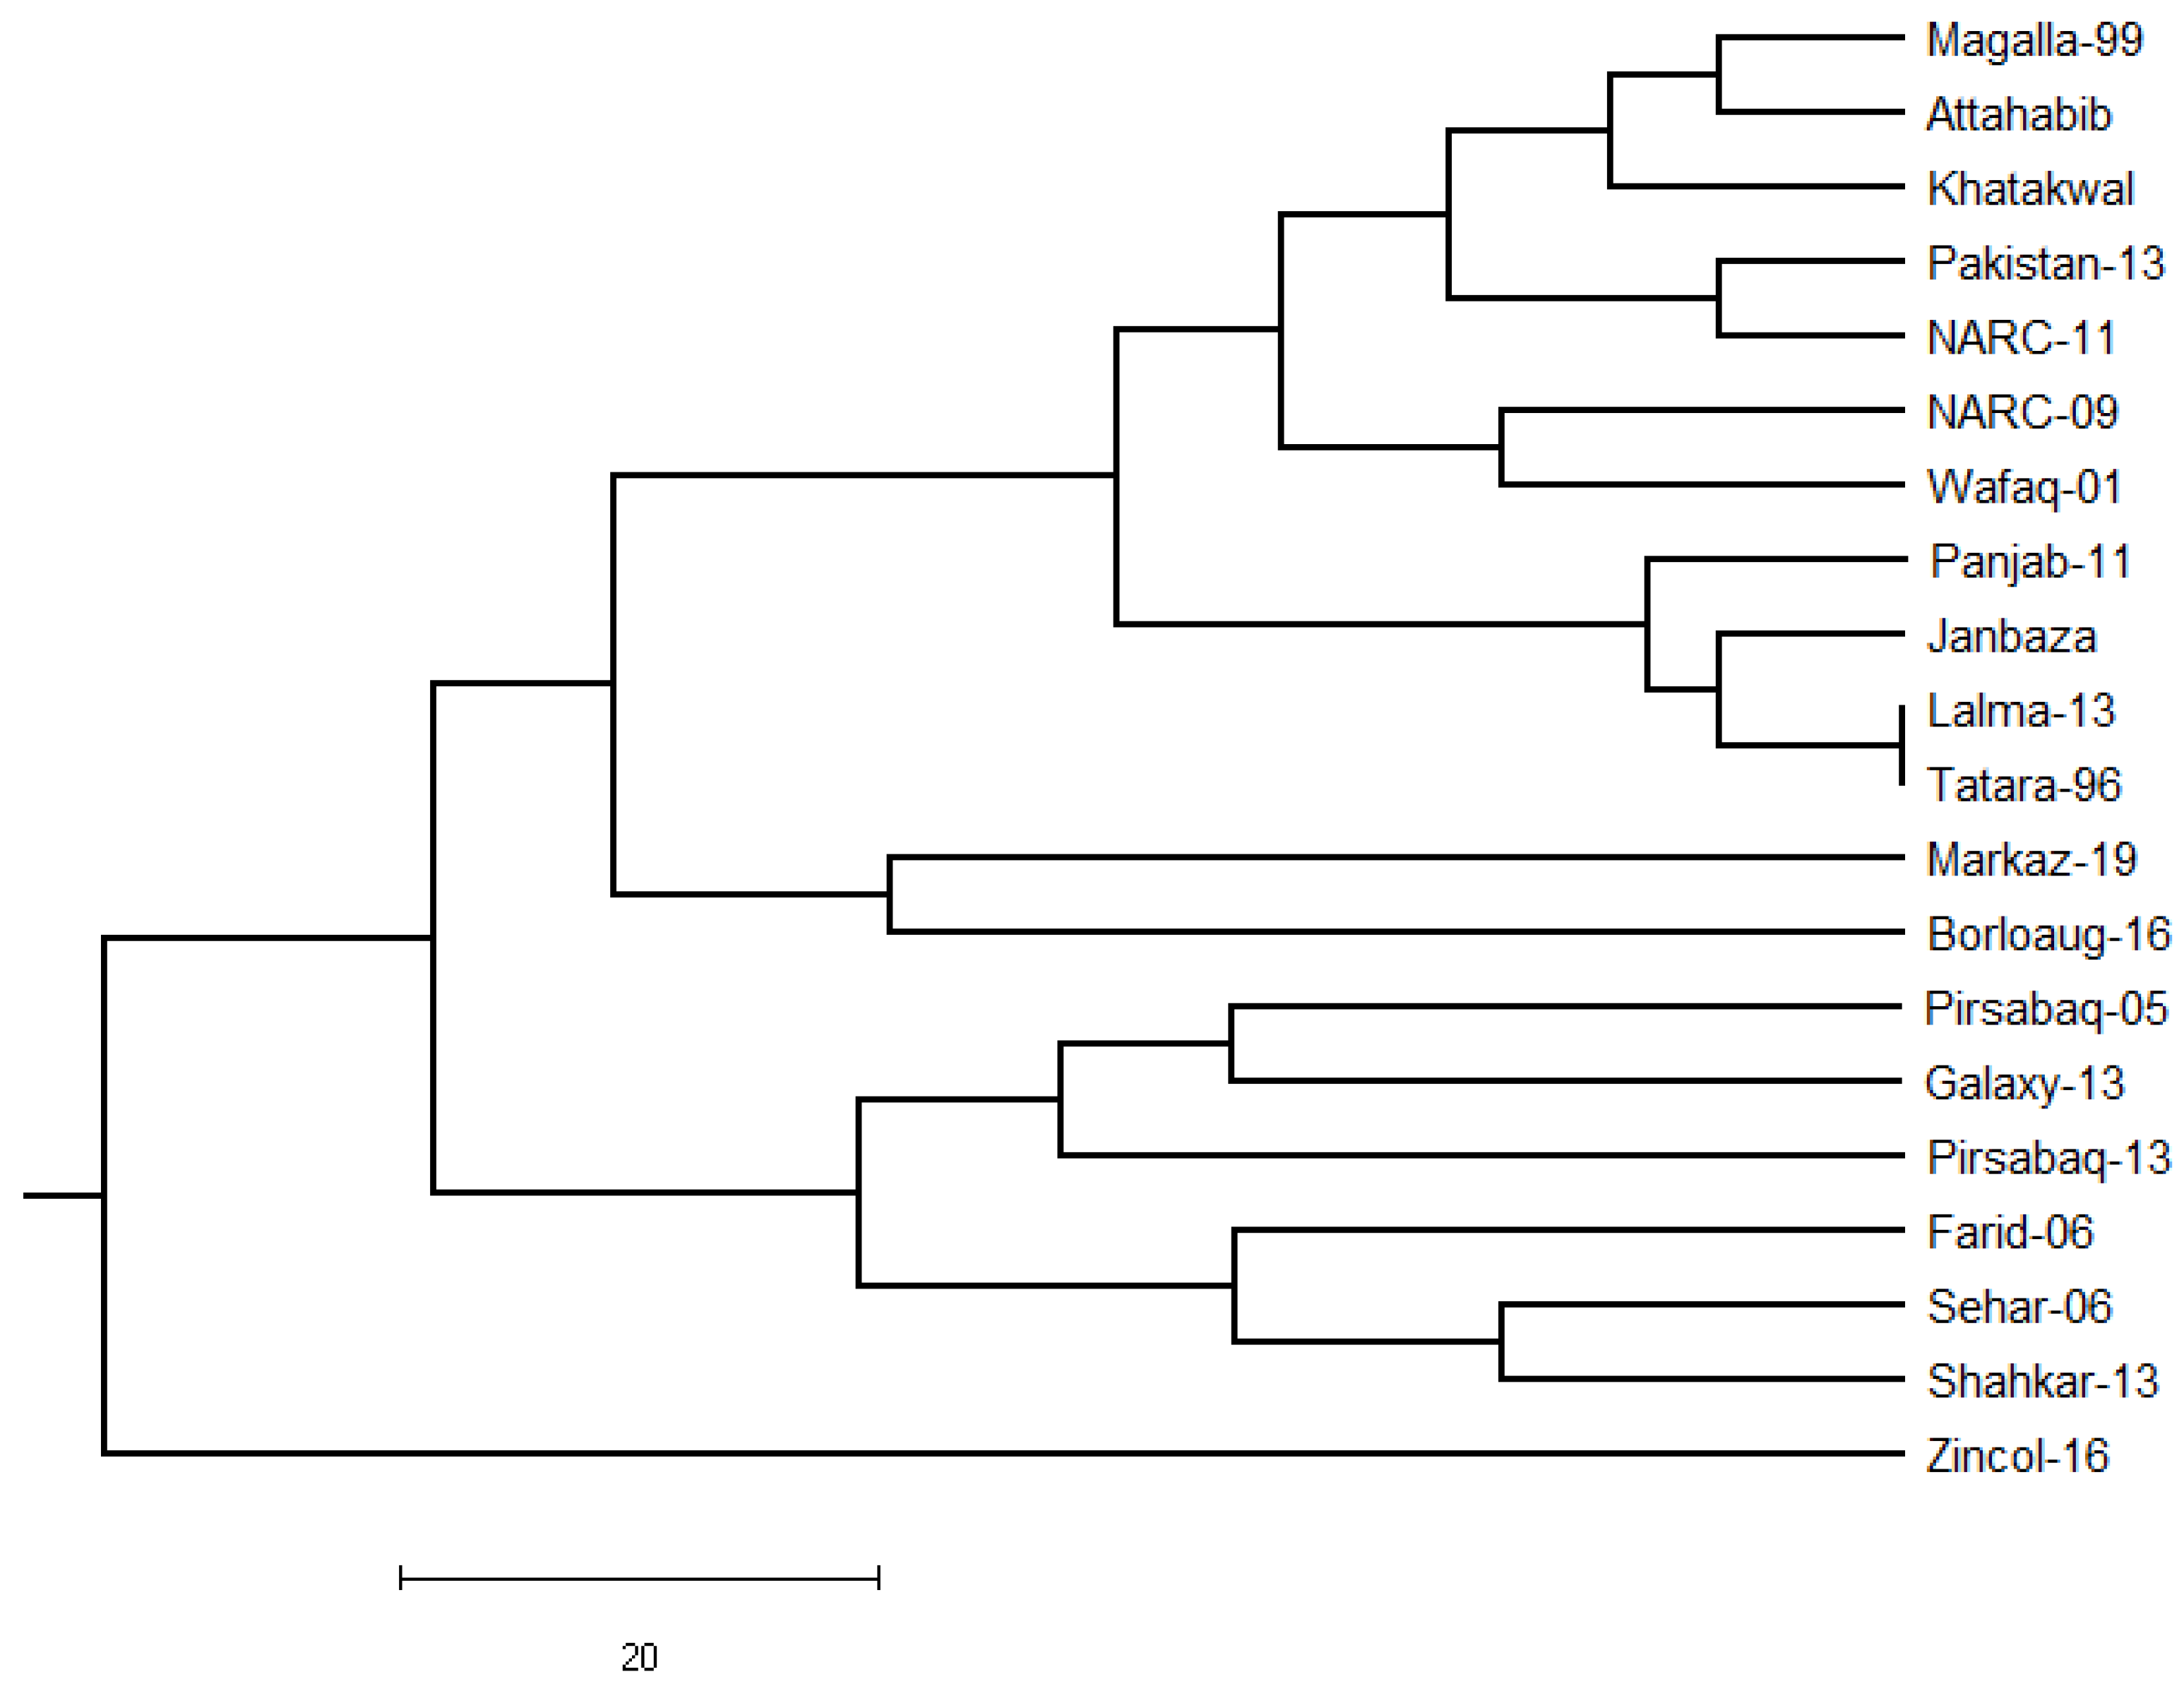
3.6. Genetic Distance

The pairwise genetic distance of the 20 wheat lines is shown in (Figure 6). The results showed that Sehar 6 was the most genetically distant line from the other lines. Comparatively, less genetic distance was observed among Pakistan-13, Lalma-13, Tatara-96, and Panjab-11. Random variations existed among different lines. This has also been shown in the dendrogram.
The grouping of wheat lines based on Agronomic trait data is presented in Figure 7. The results showed significant consistencies between the genetic grouping and the grouping based on agronomic data. Zincol-2016, a high-yielding line, was distinct from all the remaining 19 lines genetically. This result was further supported by the grouping based on the agronomic traits. Similarly, Lalma-13 and Tatara-96, genetically close to each other, were also morphologically similar.

3.7. Correlation between SSR Markers and Morphological Parameters

The principal component analysis (PCA) indicated 43% variance for component one and 13% variance for component two. Moreover, the data points were divided into two main groups. HM showed a higher association with six SSR markers. While other morphological parameters (DH, SSW, PH, DM, GWS, SPS, and HGW) showed a positive association with only two markers (WMC105 and WMC153). In contrast, the WMC150 was the most distantly located on the PCA plot showing its negative association with the studied morphological traits (Figure 8A).
In addition, a simple correlation was estimated among the studied SSR markers and morphological parameters. A strong positive correlation was recorded only for two primers (WM105 and WM153) with all morphological parameters except with HM. In contrast, strong negative correction was recorded only in two markers (WMC150 and WMC167) with all morphological parameters except HM. Other markers showed a weak correlation with the studied traits (Figure 8B).

4. Discussion

Genetic diversity is critical for the existence of plants in the natural world and crop yield. Variation in the plant genetic reserves offers the prospect for plant breeders to foster new and enhanced cultivars with appropriate characteristics, which contain both farmer-preferred characteristics (large seed, elevated yield potential, etc.) and breeder-preferred characteristics (photosensitivity, pest, and disease resistance, etc.). Since the inception of agriculture, natural genetic adaptability has been subjugated within the crop species to encounter subsistence food necessities [73]. Later, the focus transferred to growing surplus food for mounting populations. Currently, the focus is on both the quality and yield aspects of the main food crops to deliver a balanced diet to human beings. With changing climatic conditions, breeding of the climate robust lines is becoming of utmost importance. The presence of genetic diversity embodied in the shape of wild species, breeding stocks, mutant lines, related species, etc., may assist as the source of required alleles and may support plant breeders in breeding robust climate lines [74].
The vital difference amongst the genotypes for the characteristics implies the existence of considerable deviations among the genotypes, which are essential to study for both the qualitative and quantitative characteristics; further, it gives a prospect to plant breeders for the enhancement of these traits via breeding. Moreover, the existence of genotypic and phenotypic variability in species is of extreme importance in breeding improved lines and the start-up of a breeding program [75].
Days to heading, plant height, and flowering time are directly associated with wheat [76]. The current study showed variation in days to heading among different wheat lines. Similarly, variation in days to heading has been reported in 30 wheat landraces in Turkey [77]. However, the days to heading reported in that study were less (67.2 ± 0.99 to 77.0 ± 0.45) compared to the results of the current study. Days to heading vary between different wheat varieties; e.g., spring wheat has shown early heading (90 days), while average days to heading in winter wheat have been reported to be 120 days [78]. The days to heading in the current study were in accordance with other winter wheat varieties. Days to physiological maturity also depend on heading time in wheat [79]. A previous study by Hossain et al. [80] on eight Bangladeshi wheat lines has shown a shorter time (105 ± 1.24 to 122 ± 3.51 days) to reach physiological maturity compared to our results. The reason for early maturity in those lines may be due to the different sowing times (November to December) they used in their experiments, while in the current study, the sowing was performed in October.
Little variation was observed in the plant height among different varieties in the current study. Similar variations have been shown in the plant height of Italian and European wheat lines. Assessment of diversity trend in Italian wheat lines has shown shorter plant heights (65 ± 1.64 to 120 ± 2.56 cm) compared to the current study [81]. In another study, diversity in Nordic spring wheat lines of Northern Europe has shown plant heights (113–120 cm) similar to our results [82]. The variation in plant height depends on several other environmental factors, including different soil types and temperatures [83], as well as agronomic practices and genetic changes [83,84]. Variation in single spike weight found in the current study was similar to that reported by Mollasadeghi et al. [85].
Yield is directly linked to grain weight per spike [86]. The differences in grain weight per spike recorded in the current study may be attributed to the genotype differences, as the environment was constant for all experiments. Previous studies have shown comparatively less grain weight per spike in Serbian wheat lines ranging from 1.81 to 2.61 g [87]. The higher grain weights per spike in our study may be attributed to the different genetics and environmental conditions in the current study. Likewise, hundred seed weight also showed variation among wheat varieties in the current study. Similar results have been shown by Khan et al. [88], who reported hundred seed weights ranging from 2 to 9 g in different reciprocal crosses of bread wheat verities from Chitral. Comparatively lighter hundred seed weights have been reported in Nordic spring wheat lines (3.5 to 4.1 g) [82] and Saudi wheat lines (3.3 to 4.3 g) [89].
The SSR markers used in the current study revealed significant polymorphism deciphered by their PIC values. Conferring to Vaiman et al. [90], loci polymorphism can be reflected as high, medium, or low if PIC > 0.5, 0.5 > PIC > 0.25, and p < 0.25, respectively. SSR markers or microsatellite markers are befalling the markers of choice because of higher reliability as well as an enhanced level of polymorphism [91]. Several alleles were obtained from the eight SSR markers. All the SSR markers were polymorphic across the varieties except WMC105. The PIC values calculated from the allele frequency data for the SSR markers in this study showed medium polymorphism (PIC = 0.342 to 0.403), except WMC153 (PIC = 0.229). The polymorphism of SSR loci distinguished in this work was consistent with data acquired in some previous research where SSRs represent the highly suitable marker system in wheat [92] and have been effectively used to characterize the genetic diversity in complex wheat breeding materials [93]. On the dendrogram, the different wheat lines made separated groups suggesting distinct and close relations among genotypes.
With the help of SSR markers and phenotypic data, we were able to determine how potentially the various wheat genotypes used in this study might be used in breeding programs for future sustainable agricultural production [94]. SSR markers exhibited reasonable polymorphism in the studied wheat varieties. Further, it was presumed that similarity in genetic level might cause a biased selection of material in future breeding programs that will eventually narrow the genetic foundation of the wheat germplasm in the region. Additional polymorphic wheat SSR markers may be used for proficient screening of germplasm by overfilling extra regions of the wheat genome. Furthermore, high-throughput SNP markers with genome-wide coverage may be exploited as a possible source for identifying uncharacterized QTL [95].

5. Conclusions

Different wheat lines showed differences in their morphological parameters and genetic makeup. Wheat lines Borlaug-16, Zincol-16, and Markaz-19 showed higher values for different agronomic traits. Shahkar, Sehar, and Farid-6 were comparatively less productive in their traits. Genotype analysis using eight SSR markers revealed a total number of 16 alleles among different wheat lines. The PIC values suggested medium polymorphism of the markers used in this study. The alleles identified in the current study need to be further evaluated at sequencing and expression levels before incorporating them into the breeding programs for selecting the high-performing wheat lines. The alleles may be associated with other production traits such as disease resistance, adaptability, climate resilience, etc. Therefore, a further collection of the required data was important for such studies.

Supplementary Materials

The following supporting information can be downloaded at: https://0-www-mdpi-com.brum.beds.ac.uk/article/10.3390/su15010293/s1, Table S1: Agronomic parameters of the 20 wheat lines. Letters in the superscripts indicate significant variation among lines.

Author Contributions

Conceptualization, O.T. and I.U.D.; Methodology, M.I.; Software, S.A.K.B., S.S., M.N.K., A.H. and B.A.; Validation, S.H.K. and S.W.; Formal analysis, S.S.; Investigation, O.T., S.A.K.B. and I.U.D.; Resources, B.A. and S.H.; Data curation, S.A.K.B., M.I., S.H.K., A.H. and S.W.; Writing—original draft, O.T. and M.N.K.; Writing—review & editing, S.A.K.B., M.I., I.U.D., M.N.K., A.H., B.A., R.M.M. and S.H.; Visualization, S.H.K., S.W. and R.M.M.; Project administration, R.M.M. and S.H.; Funding acquisition, S.S. All authors have read and agreed to the published version of the manuscript.

Funding

This research was supported by the Princess Nourah bint Abdulrahman University Researchers Supporting Project number (PNURSP2022R259), Princess Nourah bint Abdulrahman University, Riyadh, Saudi Arabia.

Institutional Review Board Statement

Not applicable.

Informed Consent Statement

Not applicable.

Data Availability Statement

Not applicable.

Acknowledgments

This research work was funded by the Institutional Fund projects under grant no. (IFPDP-96-22). Therefore, the authors gratefully acknowledge the technical and financial support from the Ministry of Education and King Abdulaziz University, Deanship of Scientific Research, Jeddah, Saudi Arabia.

Conflicts of Interest

The authors declare no conflict of interest.

References

  1. Shewry, P.R.; Hey, S.J. The contribution of wheat to human diet and health. Food Energy Secur. 2015, 4, 178–202. [Google Scholar] [CrossRef]
  2. Adnan, M.; Fahad, S.; Saleem, M.H.; Ali, B.; Mussart, M.; Ullah, R.; Arif, M.; Ahmad, M.; Shah, W.A.; Romman, M. Comparative efficacy of phosphorous supplements with phosphate solubilizing bacteria for optimizing wheat yield in calcareous soils. Sci. Rep. 2022, 12, 11997. [Google Scholar] [CrossRef]
  3. Ahmad, M.; Ishaq, M.; Shah, W.A.; Adnan, M.; Fahad, S.; Saleem, M.H.; Khan, F.U.; Mussarat, M.; Khan, S.; Ali, B.; et al. Managing Phosphorus Availability from Organic and Inorganic Sources for Optimum Wheat Production in Calcareous Soils. Sustainability 2022, 14, 7669. [Google Scholar] [CrossRef]
  4. Khan, M.A.; Adnan, M.; Basir, A.; Fhad, S.; Hafeez, A.; Subhan, F.; Alamri, S.; Hashem, M.; Rehman, I.U. Impact of tillage, potassium levels and sources on growth, yield and yield attributes of wheat. Pak. J. Bot. 2022, 55. [Google Scholar] [CrossRef]
  5. Mahmood, N.; Arshad, M.; Kächele, H.; Ullah, A.; Müller, K. Economic efficiency of rainfed wheat farmers under changing climate: Evidence from Pakistan. Environ. Sci. Pollut. Res. 2020, 27, 34453–34467. [Google Scholar] [CrossRef]
  6. Nelson, A.R.L.E.; Ravichandran, K.; Antony, U. The impact of the Green Revolution on indigenous crops of India. J. Ethn. Foods 2019, 6, 8. [Google Scholar] [CrossRef] [Green Version]
  7. Al-Zaban, M.I.; Alhag, S.K.; Dablool, A.S.; Ahmed, A.E.; Alghamdi, S.; Ali, B.; Al-Saeed, F.A.; Saleem, M.H.; Poczai, P. Manufactured nano-objects confer viral protection against cucurbit chlorotic yellows virus (CCYV) infecting nicotiana benthamiana. Microorganisms 2022, 10, 1837. [Google Scholar] [CrossRef]
  8. Metayi, M.H.; Abd El-Naby, S.S.; El-Habal, N.A.; Fahmy, H.H.; Abdou, M.S.; Ali, B.; Abdel-Rheim, K.H.; Abdel-Megeed, A. Omani Frankincense nanoemulsion formulation efficacy and its latent effects on biological aspects of the spiny bollworm Earias insulana (Boisd.). Front. Physiol. 2022, 13, 2129. [Google Scholar] [CrossRef]
  9. Umar, U.d.; Ahmed, N.; Zafar, M.Z.; Rehman, A.; Naqvi, S.A.H.; Zulfiqar, M.A.; Malik, M.T.; Ali, B.; Saleem, M.H.; Marc, R.A. Micronutrients Foliar and Drench Application Mitigate Mango Sudden Decline Disorder and Impact Fruit Yield. Agronomy 2022, 12, 2449. [Google Scholar] [CrossRef]
  10. Wahab, A.; Abdi, G.; Saleem, M.H.; Ali, B.; Ullah, S.; Shah, W.; Mumtaz, S.; Yasin, G.; Muresan, C.C.; Marc, R.A. Plants&rsquo; Physio-Biochemical and Phyto-Hormonal Responses to Alleviate the Adverse Effects of Drought Stress: A Comprehensive Review. Plants 2022, 11, 1620. [Google Scholar] [CrossRef]
  11. Dola, D.B.; Mannan, M.A.; Sarker, U.; Al Mamun, M.A.; Islam, T.; Ercisli, S.; Saleem, M.H.; Ali, B.; Pop, O.L.; Marc, R.A. Nano-iron oxide accelerates growth, yield, and quality of Glycine max seed in water deficits. Front. Plant Sci. 2022, 13, 992535. [Google Scholar] [CrossRef] [PubMed]
  12. Farooq, T.H.; Rafy, M.; Basit, H.; Shakoor, A.; Shabbir, R.; Riaz, M.U.; Ali, B.; Kumar, U.; Qureshi, K.A.; Jaremko, M. Morpho-Physiological Growth Performance and Phytoremediation Capabilities of Selected Xerophyte Grass Species Towards Cr and Pb Stress. Front. Plant Sci. 2022, 13, 997120. [Google Scholar] [CrossRef] [PubMed]
  13. Bibi, S.; Ullah, S.; Hafeez, A.; Khan, M.N.; Javed, M.A.; Ali, B.; Din, I.U.; Bangash, S.A.K.; Wahab, S.; Wahid, N. Exogenous Ca/Mg quotient reduces the inhibitory effects of PEG induced osmotic stress on Avena sativa L. Braz. J. Biol. 2022, 84, e264642. [Google Scholar] [CrossRef]
  14. Naz, R.; Khan, M.S.; Hafeez, A.; Fazil, M.; Khan, M.N.; Ali, B.; Javed, M.A.; Imran, M.; Shati, A.A.; Alfaifi, M.Y. Assessment of phytoremediation potential of native plant species naturally growing in a heavy metal-polluted industrial soils. Braz. J. Biol. 2022, 84, e264473. [Google Scholar] [CrossRef] [PubMed]
  15. Ma, J.; Ali, S.; Saleem, M.H.; Mumtaz, S.; Yasin, G.; Ali, B.; Al-Ghamdi, A.A.; Elshikh, M.S.; Vodnar, D.C.; Marc, R.A.; et al. Short-term responses of Spinach (Spinacia oleracea L.) to the individual and combinatorial effects of Nitrogen, Phosphorus and Potassium and silicon in the soil contaminated by boron. Front. Plant Sci. 2022, 13, 983156. [Google Scholar] [CrossRef]
  16. Ma, J.; Saleem, M.H.; Ali, B.; Rasheed, R.; Ashraf, M.A.; Aziz, H.; Ercisli, S.; Riaz, S.; Elsharkawy, M.M.; Hussain, I.; et al. Impact of foliar application of syringic acid on tomato (Solanum lycopersicum L.) under heavy metal stress-insights into nutrient uptake, redox homeostasis, oxidative stress, and antioxidant defense. Front. Plant Sci. 2022, 13, 950120. [Google Scholar] [CrossRef]
  17. Ma, J.; Saleem, M.H.; Yasin, G.; Mumtaz, S.; Qureshi, F.F.; Ali, B.; Ercisli, S.; Alhag, S.K.; Ahmed, A.E.; Vodnar, D.C.; et al. Individual and combinatorial effects of SNP and NaHS on morpho-physio-biochemical attributes and phytoextraction of chromium through Cr-stressed spinach (Spinacia oleracea L.). Front. Plant Sci. 2022, 13, 973740. [Google Scholar] [CrossRef] [PubMed]
  18. Ali, B.; Hafeez, A.; Ahmad, S.; Javed, M.A.; Cavalu, S.; Afridi, M.S. Bacillus thuringiensis PM25 Ameliorates Oxidative Damage of Salinity Stress in Maize via Regulating Growth, Leaf Pigments, Antioxidant Defense System, and Stress Responsive Gene Expression. Front. Plant Sci. 2022, 13, 921668. [Google Scholar] [CrossRef]
  19. Ali, B.; Hafeez, A.; Ammar Javed, M.; Ahmad, S.; Afridi, M.S.; Ullah, A.; Alwahibi, M.S.; Elsheikh, M.S.; Muresan, C.C.; Marc, R.A. Bacterial-Mediated Salt Tolerance in Maize: Insights into Plant Growth Promotion, Antioxidant Defenses System, Oxidative Stress, and Surfactant Production. Front. Plant Sci. 2022, 3170. [Google Scholar]
  20. Ali, B.; Hafeez, A.; Javed, M.A.; Afridi, M.S.; Abbasi, H.A.; Qayyum, A.; Batool, T.; Ullah, A.; Marc, R.A.; Al Jaouni, S.K.; et al. Role of endophytic bacteria in salinity stress amelioration by physiological and molecular mechanisms of defense: A comprehensive review. S. Afr. J. Bot. 2022, 151, 33–46. [Google Scholar] [CrossRef]
  21. Ali, B.; Wang, X.; Saleem, M.H.; Azeem, M.A.; Afridi, M.S.; Nadeem, M.; Ghazal, M.; Batool, T.; Qayyum, A.; Alatawi, A.; et al. Bacillus mycoides PM35 Reinforces Photosynthetic Efficiency, Antioxidant Defense, Expression of Stress-Responsive Genes, and Ameliorates the Effects of Salinity Stress in Maize. Life 2022, 12, 219. [Google Scholar] [CrossRef] [PubMed]
  22. Ali, B.; Wang, X.; Saleem, M.H.; Hafeez, A.; Afridi, M.S.; Khan, S.; Ullah, I.; do Amaral Júnior, A.T.; Alatawi, A.; Ali, S. PGPR-Mediated Salt Tolerance in Maize by Modulating Plant Physiology, Antioxidant Defense, Compatible Solutes Accumulation and Bio-Surfactant Producing Genes. Plants 2022, 11, 345. [Google Scholar] [CrossRef] [PubMed]
  23. Afridi, M.S.; Javed, M.A.; Ali, S.; De Medeiros, F.H.V.; Ali, B.; Salam, A.; Sumaira; Marc, R.A.; Alkhalifah, D.H.M.; Selim, S.; et al. New opportunities in plant microbiome engineering for increasing agricultural sustainability under stressful conditions. Front. Plant Sci. 2022, 13, 899464. [Google Scholar] [CrossRef]
  24. Mehmood, S.; Khatoon, Z.; Amna; Ahmad, I.; Muneer, M.A.; Kamran, M.A.; Ali, J.; Ali, B.; Chaudhary, H.J.; Munis, M.F.H. Bacillus sp. PM31 harboring various plant growth-promoting activities regulates Fusarium dry rot and wilt tolerance in potato. Arch. Agron. Soil Sci. 2021, 1–15. [Google Scholar] [CrossRef]
  25. Solanki, M.K.; Solanki, A.C.; Rai, S.; Srivastava, S.; Kashyap, B.K.; Divvela, P.K.; Kumar, S.; Yandigeri, M.S.; Kashyap, P.L.; Shrivastava, A.K.; et al. Functional interplay between antagonistic bacteria and Rhizoctonia solani in the tomato plant rhizosphere. Front. Microbiol. 2022, 13, 990850. [Google Scholar] [CrossRef] [PubMed]
  26. Haider, M.W.; Nafees, M.; Ahmad, I.; Ali, B.; Maryam, B.; Iqbal, R.; Vodnar, D.C.; Marc, R.A.; Kamran, M.; Saleem, M.H.; et al. Postharvest dormancy-related changes of endogenous hormones in relation to different dormancy-breaking methods of potato (Solanum tuberosum L.) tubers. Front. Plant Sci. 2022, 13, 945256. [Google Scholar] [CrossRef] [PubMed]
  27. Curtis, T.; Halford, N. Food security: The challenge of increasing wheat yield and the importance of not compromising food safety. Ann. Appl. Biol. 2014, 164, 354–372. [Google Scholar] [CrossRef] [Green Version]
  28. Michel, S.; Löschenberger, F.; Ametz, C.; Pachler, B.; Sparry, E.; Bürstmayr, H. Simultaneous selection for grain yield and protein content in genomics-assisted wheat breeding. Theor. Appl. Genet. 2019, 132, 1745–1760. [Google Scholar] [CrossRef]
  29. Novoselovic, D.; Baric, M.; Drezner, G.; Gunjaca, J.; Lalic, A. Quantitative inheritance of some wheat plant traits. Genet. Mol. Biol. 2004, 27, 92–98. [Google Scholar] [CrossRef] [Green Version]
  30. Singh, D.; Dhillon, T.S.; Javed, T.; Singh, R.; Dobaria, J.; Dhankhar, S.K.; Kianersi, F.; Ali, B.; Poczai, P.; Kumar, U. Exploring the Genetic Diversity of Carrot Genotypes through Phenotypically and Genetically Detailed Germplasm Collection. Agronomy 2022, 12, 1921. [Google Scholar] [CrossRef]
  31. Amallah, L.; Taghouti, M.; Rhrib, K.; Gaboun, F.; Hassikou, R. Genetic variability in agro-morphological and quality traits of Mediterranean durum wheat landraces. Cereal Res. Commun. 2015, 43, 123–132. [Google Scholar] [CrossRef]
  32. Bashir, K.; Matsui, A.; Rasheed, S.; Seki, M. Recent advances in the characterization of plant transcriptomes in response to drought, salinity, heat, and cold stress. F1000Resarch 2019, 8, 658. [Google Scholar] [CrossRef] [PubMed] [Green Version]
  33. Brodt, S.; Six, J.; Feenstra, G.; Ingels, C.; Campbell, D. Sustainable agriculture. Nat. Educ. Knowl. 2011, 3, 1. [Google Scholar]
  34. Saini, A.; Manuja, S.; Kumar, S.; Hafeez, A.; Ali, B.; Poczai, P. Impact of Cultivation Practices and Varieties on Productivity, Profitability, and Nutrient Uptake of Rice (Oryza sativa L.) and Wheat (Triticum aestivum L.) Cropping System in India. Agriculture 2022, 12, 1678. [Google Scholar] [CrossRef]
  35. Saeed, S.; Ullah, A.; Ullah, S.; Noor, J.; Ali, B.; Khan, M.N.; Hashem, M.; Mostafa, Y.S.; Alamri, S. Validating the Impact of Water Potential and Temperature on Seed Germination of Wheat (Triticum aestivum L.) via Hydrothermal Time Model. Life 2022, 12, 983. [Google Scholar] [CrossRef]
  36. Tao, Y.; Zhao, X.; Mace, E.; Henry, R.; Jordan, D. Exploring and exploiting pan-genomics for crop improvement. Mol. Plant 2019, 12, 156–169. [Google Scholar] [CrossRef] [Green Version]
  37. Akram, N.A.; Saleem, M.H.; Shafiq, S.; Naz, H.; Farid-ul-Haq, M.; Ali, B.; Shafiq, F.; Iqbal, M.; Jaremko, M.; Qureshi, K.A. Phytoextracts as Crop Biostimulants and Natural Protective Agents—A Critical Review. Sustainability 2022, 14, 14498. [Google Scholar] [CrossRef]
  38. Amna; Ali, B.; Azeem, M.A.; Qayyum, A.; Mustafa, G.; Ahmad, M.A.; Javed, M.T.; Chaudhary, H.J. Bio-Fabricated Silver Nanoparticles: A Sustainable Approach for Augmentation of Plant Growth and Pathogen Control. In Sustainable Agriculture Reviews 53; Springer: Berlin/Heidelberg, Germany, 2021; pp. 345–371. [Google Scholar]
  39. Faryal, S.; Ullah, R.; Khan, M.N.; Ali, B.; Hafeez, A.; Jaremko, M.; Qureshi, K.A. Thiourea-Capped Nanoapatites Amplify Osmotic Stress Tolerance in Zea mays L. by Conserving Photosynthetic Pigments, Osmolytes Biosynthesis and Antioxidant Biosystems. Molecules 2022, 27, 5744. [Google Scholar] [CrossRef]
  40. Fahad, S.; Chavan, S.B.; Chichaghare, A.R.; Uthappa, A.R.; Kumar, M.; Kakade, V.; Pradhan, A.; Jinger, D.; Rawale, G.; Yadav, D.K.; et al. Agroforestry Systems for Soil Health Improvement and Maintenance. Sustainability 2022, 14, 14877. [Google Scholar] [CrossRef]
  41. Hussain, S.S.; Rasheed, M.; Hamzah Saleem, M.; Ahmed, Z.I.; Hafeez, A.; Jilani, G.; Alamri, S.; Hashem, M.; Ali, S. Salt tolerance in maize with melatonin priming to achieve sustainability in yield on salt affected soils. Pak. J. Bot. 2023, 55. [Google Scholar] [CrossRef]
  42. Salam, A.; Afridi, M.S.; Javed, M.A.; Saleem, A.; Hafeez, A.; Khan, A.R.; Zeeshan, M.; Ali, B.; Azhar, W.; Sumaira; et al. Nano-Priming against Abiotic Stress: A Way Forward towards Sustainable Agriculture. Sustainability 2022, 14, 14880. [Google Scholar] [CrossRef]
  43. Ali, S.; Ullah, S.; Khan, M.N.; Khan, W.M.; Razak, S.A.; Wahab, S.; Hafeez, A.; Khan Bangash, S.A.; Poczai, P. The Effects of Osmosis and Thermo-Priming on Salinity Stress Tolerance in Vigna radiata L. Sustainability 2022, 14, 12924. [Google Scholar] [CrossRef]
  44. Nawaz, H.; Ali, A.; Saleem, M.H.; Ameer, A.; Hafeez, A.; Alharbi, K.; Ezzat, A.; Khan, A.; Jamil, M.; Farid, G. Comparative effectiveness of EDTA and citric acid assisted phytoremediation of Ni contaminated soil by using canola (Brassica napus). Braz. J. Biol. 2022, 82, e261785. [Google Scholar] [CrossRef]
  45. Zainab, N.; Khan, A.A.; Azeem, M.A.; Ali, B.; Wang, T.; Shi, F.; Alghanem, S.M.; Hussain Munis, M.F.; Hashem, M.; Alamri, S. PGPR-Mediated Plant Growth Attributes and Metal Extraction Ability of Sesbania sesban L. in Industrially Contaminated Soils. Agronomy 2021, 11, 1820. [Google Scholar] [CrossRef]
  46. Saleem, K.; Asghar, M.A.; Saleem, M.H.; Raza, A.; Kocsy, G.; Iqbal, N.; Ali, B.; Albeshr, M.F.; Bhat, E.A. Chrysotile-Asbestos-Induced Damage in Panicum virgatum and Phleum pretense Species and Its Alleviation by Organic-Soil Amendment. Sustainability 2022, 14, 10824. [Google Scholar] [CrossRef]
  47. Rehman, H.; Munir, M.; Ashraf, K.; Fatima, K.; Shahab, S.; Ali, B. Analysis of Drinking Water Quality in the Newly Developed. Water 2022, 14, 1–16. [Google Scholar]
  48. Brenchley, R.; Spannagl, M.; Pfeifer, M.; Barker, G.L.; D’Amore, R.; Allen, A.M.; McKenzie, N.; Kramer, M.; Kerhornou, A.; Bolser, D. Analysis of the bread wheat genome using whole-genome shotgun sequencing. Nature 2012, 491, 705–710. [Google Scholar] [CrossRef] [Green Version]
  49. Chaudhry, S.; Sidhu, G.P.S. Climate change regulated abiotic stress mechanisms in plants: A comprehensive review. Plant Cell Rep. 2022, 41, 1–31. [Google Scholar] [CrossRef]
  50. Atlin, G.N.; Cairns, J.E.; Das, B. Rapid breeding and varietal replacement are critical to adaptation of cropping systems in the developing world to climate change. Glob. Food Sec. 2017, 12, 31–37. [Google Scholar] [CrossRef]
  51. Kim, H.; Ward, R. Patterns of RFLP-based genetic diversity in germplasm pools of common wheat with different geographical or breeding program origins. Euphytica 2000, 115, 197–208. [Google Scholar] [CrossRef]
  52. Burkhamer, R.L.; Lanning, S.P.; Martens, R.J.; Martin, J.M.; Talbert, L.E. Predicting progeny variance from parental divergence in hard red spring wheat. Crop Sci. 1998, 38, 243–248. [Google Scholar] [CrossRef]
  53. Joshi, C.P.; Nguyen, H.T. RAPD (random amplified polymorphic DNA) analysis based intervarietal genetic relationships among hexaploid wheats. Plant Sci. 1993, 93, 95–103. [Google Scholar] [CrossRef]
  54. Nagaoka, T.; Ogihara, Y. Applicability of inter-simple sequence repeat polymorphisms in wheat for use as DNA markers in comparison to RFLP and RAPD markers. Theor. Appl. Genet. 1997, 94, 597–602. [Google Scholar] [CrossRef]
  55. Chen, H.; Martin, J.; Lavin, M.; Talbert, L. Genetic diversity in hard red spring wheat based on sequence-tagged-site PCR markers. Crop Sci. 1994, 34, 1628–1632. [Google Scholar] [CrossRef]
  56. Devos, K.; Gale, M.D. The use of random amplified polymorphic DNA markers in wheat. Theor. Appl. Genet. 1992, 84, 567–572. [Google Scholar] [CrossRef]
  57. The International Wheat Genome Sequencing Consortium (IWGSC); Appels, R.; Eversole, K.; Stein, N.; Feuillet, C.; Keller, B.; Rogers, J.; Pozniak, C.J.; Choulet, F.; Distelfeld, A.; et al. Shifting the Limits in Wheat Research and Breeding Using a Fully Annotated Reference Genome. Science 2018, 361, eaar7191. [Google Scholar] [CrossRef] [Green Version]
  58. Akbari, M.; Wenzl, P.; Caig, V.; Carling, J.; Xia, L.; Yang, S.; Uszynski, G.; Mohler, V.; Lehmensiek, A.; Kuchel, H. Diversity arrays technology (DArT) for high-throughput profiling of the hexaploid wheat genome. Theor. Appl. Genet. 2006, 113, 1409–1420. [Google Scholar] [CrossRef]
  59. Khattak, S.H.; Begum, S.; Aqeel, M.; Fayyaz, M.; Bangash, S.A.K.; Riaz, M.N.; Saeed, S.; Ahmed, A.; Ali, G.M. Investigating the allelic variation of loci controlling rust resistance genes in wheat (Triticum aestivum L.) land races by SSR marker. Appl. Ecol. Environ. Res. 2020, 18, 8091–8118. [Google Scholar] [CrossRef]
  60. Chapman, J.A.; Mascher, M.; Buluç, A.; Barry, K.; Georganas, E.; Session, A.; Strnadova, V.; Jenkins, J.; Sehgal, S.; Oliker, L. A whole-genome shotgun approach for assembling and anchoring the hexaploid bread wheat genome. Genome Biol. 2015, 16, 1–17. [Google Scholar] [CrossRef] [Green Version]
  61. Saintenac, C.; Jiang, D.; Wang, S.; Akhunov, E. Sequence-based mapping of the polyploid wheat genome. G3 Genes|Genomes|Genet. 2013, 3, 1105–1114. [Google Scholar] [CrossRef] [Green Version]
  62. Röder, M.S.; Korzun, V.; Wendehake, K.; Plaschke, J.; Tixier, M.-H.; Leroy, P.; Ganal, M.W. A microsatellite map of wheat. Genetics 1998, 149, 2007–2023. [Google Scholar] [CrossRef] [PubMed]
  63. Lelley, T.; Stachel, M.; Grausgruber, H.; Vollmann, J. Analysis of relationships between Aegilops tauschii and the D genome of wheat utilizing microsatellites. Genome 2000, 43, 661–668. [Google Scholar] [CrossRef] [PubMed]
  64. Khanjari, S.A.; Filatenko, A.A.; Hammer, K.; Buerkert, A. Morphological spike diversity of Omani wheat. Genet. Resour. Crop Evol. 2008, 55, 1185–1195. [Google Scholar] [CrossRef]
  65. Thomson, M.J. High-throughput SNP genotyping to accelerate crop improvement. Plant Breed. Biotechnol. 2014, 2, 195–212. [Google Scholar] [CrossRef]
  66. Manifesto, M.M.; Schlatter, A.; Hopp, H.E.; Suárez, E.Y.; Dubcovsky, J. Quantitative evaluation of genetic diversity in wheat germplasm using molecular markers. Crop Sci. 2001, 41, 682–690. [Google Scholar] [CrossRef] [Green Version]
  67. Ott, A.; Trautschold, B.; Sandhu, D. Using microsatellites to understand the physical distribution of recombination on soybean chromosomes. PLoS ONE 2011, 6, e22306. [Google Scholar] [CrossRef] [PubMed] [Green Version]
  68. Islam, M.M. Mapping Salinity Tolerance Genes in Rice (Oryza sativa L.) at Reproduction Stage. Ph.D. Thesis, University of the Philippines Los Baños College, Laguna, Philippines, 2004. [Google Scholar]
  69. Miah, G.; Rafii, M.Y.; Ismail, M.R.; Puteh, A.B.; Rahim, H.A.; Islam, K.N.; Latif, M.A. A review of microsatellite markers and their applications in rice breeding programs to improve blast disease resistance. Int. J. Mol. Sci. 2013, 14, 22499–22528. [Google Scholar] [CrossRef] [Green Version]
  70. Shahzad, A.; Ahmad, M.; Iqbal, M.; Ahmed, I.; Ali, G. Evaluation of wheat landrace genotypes for salinity tolerance at vegetative stage by using morphological and molecular markers. Genet. Mol. Res. 2012, 11, 679–692. [Google Scholar] [CrossRef]
  71. Francois, L.; Maas, E.; Donovan, T.; Youngs, V. Effect of Salinity on Grain Yield and Quality, Vegetative Growth, and Germination of Semi-Dwarf and Durum Wheat1. Agron. J. 1986, 78, 1053–1058. [Google Scholar] [CrossRef]
  72. Yeh, F.C.; Yang, R.C.; Boyle, T.; Mao, J.X. PopGene: Microsoft Window-Based Freeware for Population Genetic Analysis; Version 1.31; University of Alberta: Edmonton, AB, Canada, 1999. [Google Scholar]
  73. Thakur, A.; Singh, S.; Singh, N.; Ali, B.; Hafeez, A.; Vodnar, D.C.; Marc, R.A. Nutritional evaluation, phytochemical makeup, antibacterial and antioxidant properties of wild plants utilized as food by the Gaddis-a tribal tribe in the Western Himalayas. Front. Agron. 2022, 4, 1010309. [Google Scholar] [CrossRef]
  74. Bhandari, H.; Bhanu, A.N.; Srivastava, K.; Singh, M.; Shreya, H.A. Assessment of genetic diversity in crop plants-an overview. Adv. Plants Agric. Res. 2017, 7, 279–286. [Google Scholar]
  75. Mohammed, A.; Amsalu, A.; Geremew, B. Genetic variability, heritability and trait associations in durum wheat (Triticum turgidum L. var. durum) genotypes. Afr. J. Agric. Res. 2011, 6, 3972–3979. [Google Scholar]
  76. Langer, S.M.; Longin, C.F.H.; Würschum, T. Flowering time control in European winter wheat. Front. Plant Sci. 2014, 5, 537. [Google Scholar] [CrossRef] [PubMed] [Green Version]
  77. Gürcan, E.C. Political geography of Turkey’s intervention in Syria: Underlying causes and consequences (2011–2016). J. Aggress. Confl. Peace Res. 2017, 11. [Google Scholar] [CrossRef]
  78. Acevedo, E.; Silva, P.; Silva, H. Wheat Growth and Physiology. Bread Wheat: Improvement and Production; 2002; Available online: https://www.fao.org/3/y4011e/y4011e06.htm (accessed on 18 October 2022).
  79. Tewolde, H.; Fernandez, C.J.; Erickson, C.A. Wheat cultivars adapted to post-heading high temperature stress. J. Agron. Crop Sci. 2006, 192, 111–120. [Google Scholar] [CrossRef]
  80. Hossain, A.; da Silva, J.A.T. Phenology, growth and yield of three wheat (Triticum aestivum L.) varieties as affected by high temperature stress. Not. Sci. Biol. 2012, 4, 97–109. [Google Scholar] [CrossRef] [Green Version]
  81. Ormoli, L.; Costa, C.; Negri, S.; Perenzin, M.; Vaccino, P. Diversity trends in bread wheat in Italy during the 20th century assessed by traditional and multivariate approaches. Sci. Rep. 2015, 5, 8574. [Google Scholar] [CrossRef] [Green Version]
  82. Ortiz, R.; Sayre, K.D.; Govaerts, B.; Gupta, R.; Subbarao, G.; Ban, T.; Hodson, D.; Dixon, J.M.; Ortiz-Monasterio, J.I.; Reynolds, M. Climate change: Can wheat beat the heat? Agric. Ecosyst. Environ. 2008, 126, 46–58. [Google Scholar] [CrossRef]
  83. Egamberdiyeva, D.; Höflich, G. Influence of growth-promoting bacteria on the growth of wheat in different soils and temperatures. Soil Biol. Biochem. 2003, 35, 973–978. [Google Scholar] [CrossRef]
  84. Royo, C.; Ammar, K.; Villegas, D.; Soriano, J.M. Agronomic, physiological and genetic changes associated with evolution, migration and modern breeding in durum wheat. Front. Plant Sci. 2021, 12, 674470. [Google Scholar] [CrossRef]
  85. Mollasadeghi, V.; Elyasi, S.; Mirzamasoumzadeh, B. Genetic variation of 12 bread wheat genotypes based on number of phonological and morphological traits. Ann. Biol. Res. 2012, 3, 4734–4740. [Google Scholar]
  86. Kuang, C.-H.; Zhao, X.-F.; Yang, K.; Zhang, Z.-P.; Ding, L.; Pu, Z.-E.; Ma, J.; Jiang, Q.-T.; Chen, G.-Y.; Wang, J.-R. Mapping and characterization of major QTL for spike traits in common wheat. Physiol. Mol. Biol. Plants 2020, 26, 1295–1307. [Google Scholar] [CrossRef] [PubMed]
  87. Knežević, D.; Radosavac, A.; Zelenika, M. Variability of grain weight per spike in wheat grown in different ecological conditions. Acta Agric. Serbica 2015, 20, 85–95. [Google Scholar] [CrossRef] [Green Version]
  88. Khan, M.; Ujala, M.; Muhammad, A. In vitro and greenhouse response of different wheat lines against salinity stress. Int. J. Biol. Biotechnol. 2016, 13, 377–383. [Google Scholar]
  89. Abdelkhalik, S.M.; Salem, A.K.M.; Abdelaziz, A.R.; Ammar, M.H. Morphological and sequence-related amplified polymorphism-based molecular diversity of local and exotic wheat genotypes. Genet. Mol. Res. 2016, 15, 1–9. [Google Scholar] [CrossRef] [PubMed]
  90. Vaiman, D.; Mercier, D.; Moazami-Goudarzi, K.; Eggen, A.; Ciampolini, R.; Lépingle, A.; Velmala, R.; Kaukinen, J.; Varvio, S.-L.; Martin, P. A set of 99 cattle microsatellites: Characterization, synteny mapping, and polymorphism. Mamm. Genome 1994, 5, 288–297. [Google Scholar] [CrossRef]
  91. Fu, X.S.; Choi, E.; Bubley, G.J.; Balk, S.P. Identification of hypoxia-inducible factor-1α (HIF-1α) polymorphism as a mutation in prostate cancer that prevents normoxia-induced degradation. Prostate 2005, 63, 215–221. [Google Scholar] [CrossRef]
  92. Hammer, K.; Filatenko, A.; Korzun, V. Microsatellite markers—A new tool for distinguishing diploid wheat species. Genet. Resour. Crop Evol. 2000, 47, 497–505. [Google Scholar] [CrossRef]
  93. Dreisigacker, S.; Zhang, P.; Warburton, M.; Van Ginkel, M.; Hoisington, D.; Bohn, M.; Melchinger, A. SSR and pedigree analyses of genetic diversity among CIMMYT wheat lines targeted to different megaenvironments. Crop Sci. 2004, 44, 381–388. [Google Scholar] [CrossRef]
  94. Christov, N.K.; Tsonev, S.; Dragov, R.; Taneva, K.; Bozhanova, V.; Todorovska, E.G. Genetic diversity and population structure of modern Bulgarian and foreign durum wheat based on microsatellite and agronomic data. Biotechnol. Biotechnol. Equip. 2022, 36, 637–652. [Google Scholar] [CrossRef]
  95. Kumar, D.; Chhokar, V.; Sheoran, S.; Singh, R.; Sharma, P.; Jaiswal, S.; Iquebal, M.A.; Jaiswar, A.; Jaisri, J.; Angadi, U.B. Characterization of genetic diversity and population structure in wheat using array based SNP markers. Mol. Biol. Rep. 2020, 47, 293–306. [Google Scholar] [CrossRef] [PubMed]
Figure 1. Days to 50% heading of 20 different lines. (A) Grey columns indicate the mean of the number of days to heading. Error bars indicate SD. Mean (±SD) was calculated based on data from five replicates for each line. (B) Data were analyzed using One-Way ANOVA, pairwise Post Hoc Tukey’s test at p-value ≤ 0.05. Different shades of red color indicate significant differences among the different lines.
Sustainability 15 00293 g001
Figure 2. Days to maturity in 20 different lines. (A) Grey columns indicate the mean of the number of days to heading. Error bars indicate SD. Mean (±SD) was calculated from five replicates for each line. (B) Data were analyzed using One-Way ANOVA, pairwise Post Hoc Tukey’s test at p-value ≤ 0.05. Different shades of red color indicate significant differences among the different lines.
Sustainability 15 00293 g002
Figure 3. Spikelets per spike in 20 different lines. (A) Grey columns indicate the mean of the number of days to heading. Error bars indicate SD. Mean (±SD) was calculated from five replicates for each line. (B) Data were analyzed using One-Way ANOVA, pairwise Post Hoc Tukey’s test at p-value ≤ 0.05. Different shades of red color indicate significant differences among the different lines.
Sustainability 15 00293 g003
Figure 4. One-hundred-grain weight in 20 different lines. (A) Grey columns indicate the mean of the number of days to heading. Error bars indicate SD. Mean (±SD) was calculated from five replicates for each line. (B) Data were analyzed using One-Way ANOVA, pairwise Post Hoc Tukey’s test at p-value ≤ 0.05. Different shades of red color indicate significant differences among the different lines.
Sustainability 15 00293 g004
Figure 5. Gel showing the amplified gene products in 19 wheat lines. (AD) representative sampled products of SSR marker WMC78, WMC105, WMC150, and WMC153, respectively.
Sustainability 15 00293 g005
Figure 6. (A) Genetic distance among the 20 wheat lines. (B) Cluster dendrogram depicting the phylogenetic relationship among the 20 wheat lines based on eight SSR markers.
Sustainability 15 00293 g006
Figure 7. Dendrogram based on Agronomic traits data.
Sustainability 15 00293 g007
Figure 8. Biplot of PCA and Correlation matrix. (A) PCA analysis (B) Simple correlation performed among the studied parameters and SSR markers. DH (Days to 50% heading), DM (Days to maturity), HM (Days heading to maturity), PH (Plant height), SPS (Spikelets per spike), SSW (Single spike weight), GWS (Grain weight per spike), HGW (100-grain weight).
Sustainability 15 00293 g008
Table 1. List of wheat varieties and their pedigree used for the study.
Wheat VarietyPedigree
Markaz-2019SOKOLL//FRTL/2*PIFED
Borlaug-2016SOKOLL/3/PASTOR//HXL7573/2*BAU
Zincol-2016OASIS/SKAUZ//4*BCN/3/2*PASTOR/4/T.SPELTA PI348449/5/BACEU #1/6/WBLL1*2/CHAPIO
Pakistan-13MSA04M00552S-040ZTP0Y-040ZTM-040SY-19ZTM-03Y-0B-01D
NARC-2011OASIS/SKAUZ//4*BCN/3/2*PASTOR
NARC-2009INQALAB 91*2/TUKURU
Wafaq-2001OPATA/RAYON//KAUZ
Magalla-99OPATA/BOW’S’
AttahabibINQALAB 91*2/TUKURU
KhatakwalLand race of Southern KPK, Pakistan
JanbazaGEN*2//BUC/FILK/3/BUCHIN
Lalma-13“PASTOR/3/ALTAR84/AE.SQUARROSA(TAUS)//OPATA(SOKOLL)
Tatara-96JUP/ALDS??KLTS/3VEES
Punjab-11SA 42 *2/4CC/INIA//BB/3/INIA/HD832
Pirsabaq-5CMSS93B00729S-23Y-010M-010Y-010M-7Y-1M-0Y
Pirsabaq-13CS/TH.SC//3*PVN/3/MIRLO/BUC/4/MILAN/5/TILHI
Galaxy-2013CMH84.3379/CMH78.578//MILAN
Sehar-06CHILL/2* STAR/4/BOW//BUC/PVN/3/2*VEE#10
Shahkar-13CMH84.3379/CMH78.578//MILAN
Farid-06PT’S’/3/TOB/LFN//BB/4/BB/HD-832-5//ON/5/G-V/ALD’S’//HPO
Table 2. Primer information of SSR markers for genetic diversity of wheat.
MarkerForward Primer
(5′–3′)
Reverse Primer
(5′–3′)
Length
(bp)
Annealing
(°C)
WMC177AGGGCTCTCTTTAATTCTTGCTGGTCTATCGTAATCCACCTGTA2261.7
WMC168AACACAAAAGATCCAACGACACCAGTATAGAAGGATTTTGAGAG2256.8
WMC167AGTGGTAATGAGGTGAAAGAAGTCGGTCGTATATGCATGTAAAG2261.0
WMC165CACACTCGCACGATTTTCCTATTCGGTTACACTGGAAGTGGTCT2263.9
WMC153ATGAGGACTCGAAGCTTGGCCTGAGCTTTTGCGCGTTGAC2065.2
WMC150CATTGATTGAACAGTTGAAGAACTCAAAGCAACAGAAAAGTAAA2258.4
WMC105AATGTCATGCGTGTAGTAGCCAAAGCGCACTTAACAGAAGAGGG2265.1
WMC78AGTAAATCCTCCCTTCGGCTTCAGCTTCTTTGCTAGTCCGTTGC2264.9
Table 3. Genotypes of the 20 wheat lines at different SSR markers.
Wheat LinesWMC
78105150153165167168177
Markaz-19BCAAAABB ABAB
NARC-2011BCAAABBBAB ABAB
NARC-2009BCAAAABBAB ABBB
Wafaq-2001BCAAAABB ABBB
Punjab-11BCAAABBBAABBAAAB
Borlaug-2016ACAAABBBAA ABAB
Pirsabaq-13CCAAABBBABABABAB
JanbazaBCAABBABAB AABB
Margalla-99BCAAABBB AABB
Tatara-96BCAAAB AAAB
Pakistan-13BCAAABAB ABAAAB
Lalma-13BCAAABAB AAAB
AttahabibBCAAABAB BB
Farid-06BCAABB BB
Galaxy-2013BCAABB ABABBBBB
KhatakwalBCAABBAB BBAB
Pirsabaq-5BCAAABBB ABBBAB
Zincol-2016AAAABBBB ABAB
Sehar-06BC BB AAAB
Shahkar-13BC BBBB ABAB
Table 4. Diversity parameters at different SSR markers.
LocusSample SizeNaNeIHoHePIC
WMC782032.2920.9040.9000.5780.403
WMC1051811.00000-
WMC1502021.9230.6730.5000.4920.365
WMC1531621.3580.4330.3120.2720.229
WMC165721.8490.6510.7140.4940.354
WMC167521.9230.6730.8000.5330.365
WMC1681821.9050.6680.4440.4880.362
WMC1772021.7810.6300.6500.4500.342
Mean 2.001.7540.5790.5860.3950.346
St. Dev 0.5340.3970.2660.1890.1800.055
Key: Na = Observed number of alleles; Ne = Effective number of alleles I = Shannon’s Information index; Ho = observed heterozygosity; He = Expected heterozygosity; PIC=Polymorphism information content.
Table 5. Allele and genotype frequencies at different SSR markers.
LocusAllelesGenotypes
ABCAAABBBBCACCC
WMC780.0750.4250.51--1711
WMC1051--18-----
WMC1500.40.6-3107---
WMC1530.15620.8438--511---
WMC1650.64290.3571-25----
WMC1670.40.6--41---
WMC1680.61110.3889-783---
WMC1770.3250.675--137---
Disclaimer/Publisher’s Note: The statements, opinions and data contained in all publications are solely those of the individual author(s) and contributor(s) and not of MDPI and/or the editor(s). MDPI and/or the editor(s) disclaim responsibility for any injury to people or property resulting from any ideas, methods, instructions or products referred to in the content.

