
Evaluating Portuguese Public Hospitals Performance: Any Difference before and during COVID-19?

1
Centre for Public Administration and Public Policies, Institute of Social and Political Sciences, Universidade de Lisboa, Rua Almerindo Lessa, 1300-663 Lisbon, Portugal
2
CERIS, Instituto Superior Técnico, University of Lisbon, Av. Rovisco Pais 1, 1049-001 Lisbon, Portugal
*
Author to whom correspondence should be addressed.
Sustainability 2023, 15(1), 294; https://0-doi-org.brum.beds.ac.uk/10.3390/su15010294
Submission received: 13 October 2022
/
Revised: 29 November 2022
/
Accepted: 21 December 2022
/
Published: 24 December 2022
(This article belongs to the Special Issue Multicriteria Decision Analysis and the Sustainability of Public Systems Worldwide)
Abstract
:COVID-19 is a well-known respiratory disease that has spread worldwide since January 2020, causing many deaths and massive pressure on health systems. This pandemic’s appearance compromised health service sustainability and quality as many procedures were postponed or canceled, with an expected increase of adverse events like nosocomial infections, in-hospital deaths, and the worsening of the patient’s clinical status. For instance, the year 2020 featured an increase in undesirable results in Portugal: a rise of 10% in delayed first medical appointments, 0.02% in avoidable bloodstream infections, and more than 100 post-operative pulmonary embolisms and septicemia cases per 100,000 inpatients. Therefore, assessing whether the healthcare providers’ performance has changed is paramount. In this case, we evaluated public hospitals in Portugal. To this end, we developed a network data envelopment analysis model relating to efficiency and effectiveness. We observed consistent drops in efficiency when the pandemic started, followed by a recovery to levels above the pre-pandemic ones. Regarding effectiveness, we observed a positive trend during the evaluated period. We conclude that, apart from the great resilience of public healthcare providers, the Portuguese state was unprepared for a pandemic like COVID-19, but still the actions taken (including massive vaccination) were beneficial.
1. Introduction
Over their lifetime, healthcare systems worldwide have faced many challenges. One of the most relevant ones is their sustainability, which relates to the increase of health care costs, marked on the one hand by inflation, innovation, and scarcity of raw materials, and on the other hand by the aging of the population, the increase of chronic diseases prevalence, as well as the difficulty in finding health professionals in the market in most areas of medicine [1].
To exacerbate this worrying scenario, pneumonia of unknown etiology appeared unexpectedly in Wuhan (Hubei, China) at the end of December 2019. This new pneumonia was followed by complications like severe acute respiratory syndrome and respiratory failure, among others [2,3,4]. It has since been coined Coronavirus Disease 2019 (COVID-19) by the World Health Organization (WHO) and is caused by the Severe Acute Respiratory Syndrome Coronavirus-2 (SARS-CoV-2) [3,5]. In a follow-up, the transmission of the disease between humans was soon verified and on January 23 of that year, the WHO declared that the outbreak of COVID-19 would be a public health emergency, with international contours. The same organization classified it as a pandemic on 11 March 2020 [5].
As happens with most pandemics, the SARS-CoV-2 virus spread rapidly and created new problems and constraints for health systems. No country was prepared for such a rapid spread and such harmful effects on human health. Consequently, both national and local authorities had to promptly react at all levels to contain the virus and prevent the collapse of health systems [6,7]. These were forced to develop organizational management mechanisms to respond to new health needs [8].
Among the various levels of response recognized by the WHO, hospital health care stood out to receive and care for the most seriously ill patients and thus avoid a greater number of deaths. According to Ghosh and Qadeer [9], about 20% of COVID-19 cases reported in the year 2020 (before the existence of any vaccine) required hospital care, while about 5% needed ventilatory support in an intensive care unit. For this reason, many hospital units have exceeded their normal capacity, closing other non-priority services to focus all attention on COVID-19 patients [10].
In what concerns the Portuguese case, the virus introduction was verified on 2 March 2020, in the north of the country, originating from two cases from Spain and Italy. By such time, the virus was nothing new, being overlooked by health authorities, when it was already proliferating in other countries, namely China. For this reason, there was no prior planning or official alert to the population, leading to an increase of cases in the most densely populated metropolitan areas, totaling 7.6 cases per million inhabitants, two weeks after the alert [5,11].
In general, as in most European countries, Portugal’s policymakers chose to manage transmission chains, in contrast to countries like Brazil and the United States, which ignored these chains, and New Zealand, Thailand, Iceland, and some parts of China, which opted for eradication [12]. In this sense, national measures were taken in Portugal, such as successive declarations of a state of emergency to prevent the virus spread. However, the truth is that the number of positive cases has increased, and the virus quickly spread to the entire national territory.
In terms of health management, the pandemic generated pressure on health services, and measures were taken to alleviate this, such as the postponement or suspension of non-COVID clinical activity [2]. The objectives would be to contain the evolution of new contagions and ensure a greater capacity of health units to treat patients with COVID-19. Even so, in the third wave, the National Health Service (NHS) practically reached its limit with 6829 hospitalized in wards (1 February 2021) and 904 in intensive care units (5 February 2021) [13]. At that time, European support was sent by countries such as Germany, France, and Luxembourg, through teams of health professionals sent to help Portuguese hospital units and their staff.
However, little is known about the efficiency and effectiveness of Portuguese public hospitals since the COVID-19 pandemic started, nor if they improved or worsened their performance compared to the pre-pandemic period. Indeed, we could not find previously published performance studies of this level carried out in this period in health systems identical to the Portuguese NHS, which is publicly funded, public, and universal (for anyone), general (for all needs), and tendentially free. On the one hand, there may be suspicions about the decrease in efficiency, given the reduction in the number of cases treated in hospitals during the pandemic, without a proportional reduction in the resources consumed. On the other hand, unless clinical practices appropriate to the situation have been adopted, it is likely that the number of situations such as nosocomial infections and preventable deaths will have increased. These situations are often the result of environments featured by burnout staff, poor safety and hygiene conditions, or the adoption of inappropriate practices in stressful situations. That is, it is expected that the effectiveness of health care has also dropped during the pandemic period. Overall, global performance is expected to have worsened from 2020 onwards, compromising the economic, financial, and social sustainability of the NHS. Meanwhile, ensuring the implementation of knowledge management and organizational culture, while employing management systems/tools/methods and fulfilling hospital managers’ commitments to the well-being of employees and society are cornerstones or drivers for the management of sustainability in hospitals
The objective of the present study is, therefore, to evaluate the performance of hospital units of the NHS before and during the pandemic period, considering not only the efficiency but also the effectiveness of clinical procedures. For this, 2795 observations from public hospitals were considered (43 public hospitals observed in a broad period). Different dimensions were analyzed, based on a set of indicators measured by the Portuguese health authorities. These indicators reflect not only the volume of hospital activity, and the expenses incurred by them, but also the health outcomes. These health outcomes reflect the reliability/safety of the patient as well as the adequacy of care.
We found no efficiency/performance studies of this level carried out in this period in health systems identical to the Portuguese case, which is public and circumscribed to an NHS. However, the following (neutral) hypothesis is proposed for investigation:
Research Hypothesis.
There was no change in hospital performance in the pandemic period compared to the previous homologous period.
The non-rejection of this hypothesis in the light of the statistical evidence leads to the conclusion that the disease has had no impact on hospital performance and the measures to contain it on hospital performance. To this end, an innovative benchmarking model was developed based on the concept of network Data Envelopment Analysis (NDEA). This model searches for the best practices within the field through the construction of a frontier where efficient and effective players are positioned. The model, as based on the standard DEA, is nonparametric, meaning that the frontier is constructed using the data only, and disregards often biased assumptions about its shape. In short, it uses linear programming with soft constraints and the dataset to construct that frontier and project the poor-performance hospitals there. The new model integrates the concepts of efficiency and effectiveness as if they were two serially connected concepts; see Ferreira et al. [14]. In a simplified way, the model considers the input of hospital resources, which are consumed to treat patients, regardless of the quality of the service (first stage). The gross volume of treated patients is then classified into successful procedures, or desirable results, and unsuccessful procedures, or undesirable results, this time considering the quality or effectiveness of the service (second stage). Thus, the first stage corresponds to efficiency while the second stage refers to the effectiveness of the entity under analysis. To date, no such model has been used to estimate hospital performance, although some NDEA models have been developed [15], but without simultaneously incorporating the efficiency and quality of the service, and without evaluating the impact of the pandemic on hospitals and their performance.
The innovation of this study is twofold. First and foremost, to the best of our knowledge, this is the first study developing a serial NDEA model to integrate the efficiency and effectiveness of hospitals. Second, using the newly developed model, this study seeks to unveil whether public hospitals were resilient against the COVID-19 pandemic and to what extent their performance was affected by the new disease and the virus-containment policies during the pandemic period. No other study before has used such a large quantity of observations and variables. The authors believe that such completeness in a performance analysis study is absolutely essential, mainly when evaluating hospitals or any other publicly funded organizations. Additionally, there are not many studies evaluating the hospital’s overall performance (efficiency and effectiveness) before and after COVID-19. This assessment may offer precious insights on how to recover from difficult times of resource scarcity like the ones of COVID-19 or the current war in Ukraine. Despite their unpredictability, pandemics are stochastic events whose emergence rate has grown in the past few years. For instance, one can easily see that the time gap between the emergence of recent pandemics (including COVID-19 in 2020, swine flu in 2009, Ebola in 2014, HIV/AIDS in 1981, Asian flu in 1957, and Spanish flu in 1918) is getting smaller compared with the past (like the Black death/Bubonic plague in 1347, small pox in 1520, and the 17th century great plagues in Europe back). Therefore, healthcare providers must quickly develop contingency plans to treat newly infected people without forgetting the others demanding health care. Still, constructing such plans requires the knowledge of what went right and wrong in past experience, such as during the COVID-19 pandemic.
Besides the mathematical model that is completely stereotypable to any other study, generalizing the results of the present case study to other countries worldwide is a hard task, given the specifications of each independent health system. However, the health care provision entities and health policy-makers must be aware of good and poor practices during pandemic times as well as possible trade-offs between efficiency and effectiveness, two highly described and debated concepts in the literature. Still, these trade-offs are not consensual among researchers and have not been studied during the pandemic times. Developing the aforementioned contingency plans demands this knowledge.
2. The Portuguese National Health Service before and during the COVID-19 Pandemic
The reform of public administration in European countries extended to the health sector, based mainly on the main values of the new public management (NPM) theory that involve the State and society [16]. This management perspective had a strong influence on health reforms, namely in terms of development, the existence of internal markets, with the objective of promoting competition and healthy competition between public healthcare units [17]. In this sense, there was a separation between the State as a financier/service provider and the State as a regulator, promoting the contractualization of the service with the providers [18].
The NPM theory was applied to the health sector as theoretical support for an interdisciplinary view of the new measures implemented in the sector [19]. In the reforms carried out in health, the traditional administrative model was considered bureaucratic, centralized, hierarchical, and impersonal and the social and economic regulation of health was promoted, which fits the NPM theory. In line with this model, efficiency gains were also sought, with a fight against waste and greater responsibility in the use of resources [16,20].
The NPM theory implies, in Public Administration, an adaptation of the State to new roles and rewards a relationship with private management models. The modernization of public administration is demanded by the citizens, being given by them, special prominence to the health sector [21]. The innovation and application of NPM measures to the health sector are focused on the search for efficiency and effectiveness and on the creation of value [19]. However, the criticism of this transformation involves the public-private dichotomy, which is considered the paradigm of current criticism of European health systems, due to the fact that most countries have adopted a social insurance model (Germany, Belgium, France) while others (United Kingdom, Portugal, Spain, Greece, Italy) an NHS model. In the latter case, the solution to this problem involved the adoption of business management models for public services to improve both efficiency and effectiveness and/or resorting to public-private partnerships for financing and/or management of health units, which implied a greater effort from managers, debureaucratization, and decentralization of management processes [22].
The NPM applied to the health sector promoted, as in the public service, a management approach centered on the patient/user, accountability for results, performance levels, and on transparency [23]. This way, the health sector was also influenced by this theory, reflected in terms of the application of market mechanisms that stimulated competitiveness, the acceptance of new operators, and the logic of contracting out. On the other hand, this modernization also promoted a greater opening of the public administration to society and defended the principle of freedom of choice and the involvement of the citizens in decisions about their health, demarcating the quality of access and thus stimulating the competition, positive differentiation between providers and the active participation of society [16]. Based on experiences in the United Kingdom and Scandinavian countries, user freedom of choice tends to generate a trend towards higher quality services, which leads to greater internal competition between them to attract users [24]. Ellis [25] also mentions that the phenomena that generate internal competition between public hospitals are allied to higher quality issues, which highlights the advantage of carrying out evaluation studies.
This process of transformation that took place in the Traditional Public Administration, in the search for greater efficiency and performance for the public sector, was the basis of health reforms and as such founded the process of the corporatization of hospital units. The first effective steps in applying the NPM to hospital management were taken with the corporatization of the units. Additionally, hospitals have been merged into hospital centers and the creation of local health units, with the aim of rationalizing resources, and avoiding duplication of services. The objectives would be to increase efficiency, promoting a concern with cost control, while maintaining or raising standard levels of quality.
Based on these principles, the most recent reform of the hospital management law took effect in 2017, so it is one of the time periods to be considered when evaluating the performance/efficiency of hospital units. Another factor that may have affected their performance was registered in the first quarter of 2020 with the COVID-19 pandemic, which caught health systems off guard. Measures to restrict the movement of citizens were fundamental to preparing the units of health and defining action plans. However, in the Portuguese case, the preparation of hospital units for the pandemic was largely at the expense of reducing or suspending the scheduled activity and other usual activities of health units dubbed non-COVID (by ministerial order of 15 March), not only for reasons of space management and the measures necessary to isolate patients but also for reasons of allocation of resources diverted to the so-called COVID areas. In addition, field hospitals were planned, as well as the installation of tents near the hospital emergency services, which allowed for a better triage of patients.
In Portugal, the development of hospital units was oriented towards providing quality care to users, always taking into account the principles of efficiency of hospital resources, although conditioned by the human resources existing in the hospital units. In 2019, there were 28,822 physicians (74.0% specialist physicians, 25.5% intern physicians, and 0.5% non-specialist physicians), 45,444 nurses (76.6% general care nurses and 23.4% specialist nurses), 10,090 technicians and therapeutics, and 6407 senior health technicians and other senior technicians [26].
In the first two months of the pandemic, the Court of Auditors carried out a comparative analysis of hospital healthcare production in Portugal, by comparing the results in March and April 2020 with the homologous period in 2019. The results were as follows: (i) at the primary health care level, a reduction of 15% (−1156,689) in the total of medical appointments carried out and a drop of 13% (−77,330) in the administration of vaccines in the national health plan; (ii) at the secondary health care level (public hospitals), a reduction of 28% (−882,333) in the total number of medical appointments, of which a total of 364,535 first appointments (not properly compensated by the telemedicine which registered an average of 4000 monthly contacts); and (iii) a reduction of 44% in non-COVID urgent care episodes (−683,289) [27].
Bearing in mind this scenario, it is also necessary to consider that, in addition to the postponement or suspension of planned clinical activities, the reduction in demand from patients also contributed to these results. By order of the Minister of Health (Order No. 5314/2020, of 2 May) a recovery plan for the assistance activity was defined, based on seven measures: (i) recourse to non-face-to-face means, using telemedicine mechanisms, namely teletracking, teleconsultation, telemonitoring, and teleconsulting programmes, except when this was not clinically appropriate or technically possible; (ii) different opening hours, including on weekends; (iii) scheduling by appointment, ensuring that users remain in the health services only for the strictly necessary period; (iv) travel to the user’s home, or equivalent, in clinical situations where this proves to be appropriate; (v) referral of emergency episodes sorted with white, blue or green colour in hospital emergency services to another type of health care, namely, primary health care and other programmed hospital responses; (vi) promotion of hospital consultation activities, in a decentralized manner in primary health care or through teleconsultation; and (vii) implementation of complementary means of diagnosis and therapy in primary health care, in cases where such availability existed.
Although the gradual resumption of non-COVID-19 activity was determined as of May 2020, these measures did not have the desired effects by the Ministry of Health. The “Saúde em Dia” movement, led by the “Ordem dos Médicos” and the Portuguese Association of Hospital Administrators (APAH), reveals that throughout 2020, compared to 2019:
- (i)
- 11.4 million fewer face-to-face consultations in primary health care (−38%);
- (ii)
- 3.6 million fewer face-to-face nursing contacts (−18%);
- (iii)
- 3.4 million fewer assistances in hospitals (−11% of consultations, −18% of surgeries, and −31% of emergencies);
- (iv)
- 25 million fewer diagnostic and therapeutic acts, of which 12.5 million were in rehabilitation sessions, and 434 thousand fewer cancer screenings, of which 169 thousand were for breast cancer, 140 thousand for cervical cancer, and 125 thousand for colon and rectal cancer [28].
Given the above, after the implementation plan for these measures has passed without knowledge of their implementation, in a context of less pressure on the installed capacity of the NHS, the challenge remains to seek and plan new solutions to minimize the effects on citizens’ health. For this reason, an assessment of the performance of hospital units with a broader spectrum and including a set of more robust indicators is fundamental for this analysis.
3. Methods: A Network-Based Benchmarking Model for Hospital Performance Assessment
This study evaluates the evolution of Portuguese public hospitals’ performance, mainly trying to unveil whether there were substantial differences before and during the COVID-19 pandemic. We do not conduct an after-pandemic analysis because neither the virus was eradicated, nor the pandemic was considered an endemic in Portugal by the time we wrote this article (September 2022). Before evaluating the performance evolution, one must clearly state the model and variables used for that end. These materials should be capable of thoroughly describing the operations and the value chain of a public hospital in Portugal (the decision unit) and, simultaneously, what performance stands for.
Although the concept of performance could be difficult to define, given its comprehensiveness, we may simplify it using two distinct but interrelated concepts: efficiency and effectiveness. One can define efficiency (or technical efficiency) as doing things right without wasting resources; mathematically, it is the relation between: (1) what was spent and what should have been spent; or (2) what was produced and what should have been produced. In some cases, one may wish to contemplate both scenarios, allowing for the reduction of spent resources and increased produced goods or services simultaneously. In opposition, effectiveness is to do the right things, which in hospital administration and management constitutes a premise for patient safety and the prompt accomplishment of evidence-based medical guidelines for the appropriateness of care. Healthcare providers’ main goal is naturally improving patients’ quality of life, so if any of these dimensions (safety, care appropriateness, and timeliness) is compromised, the patient life is at risk. Therefore, a good performer does right the right things, thus ensuring each patient is wholly treated following technical, ethical, and moral standards, but without compromising its economic sustainability.
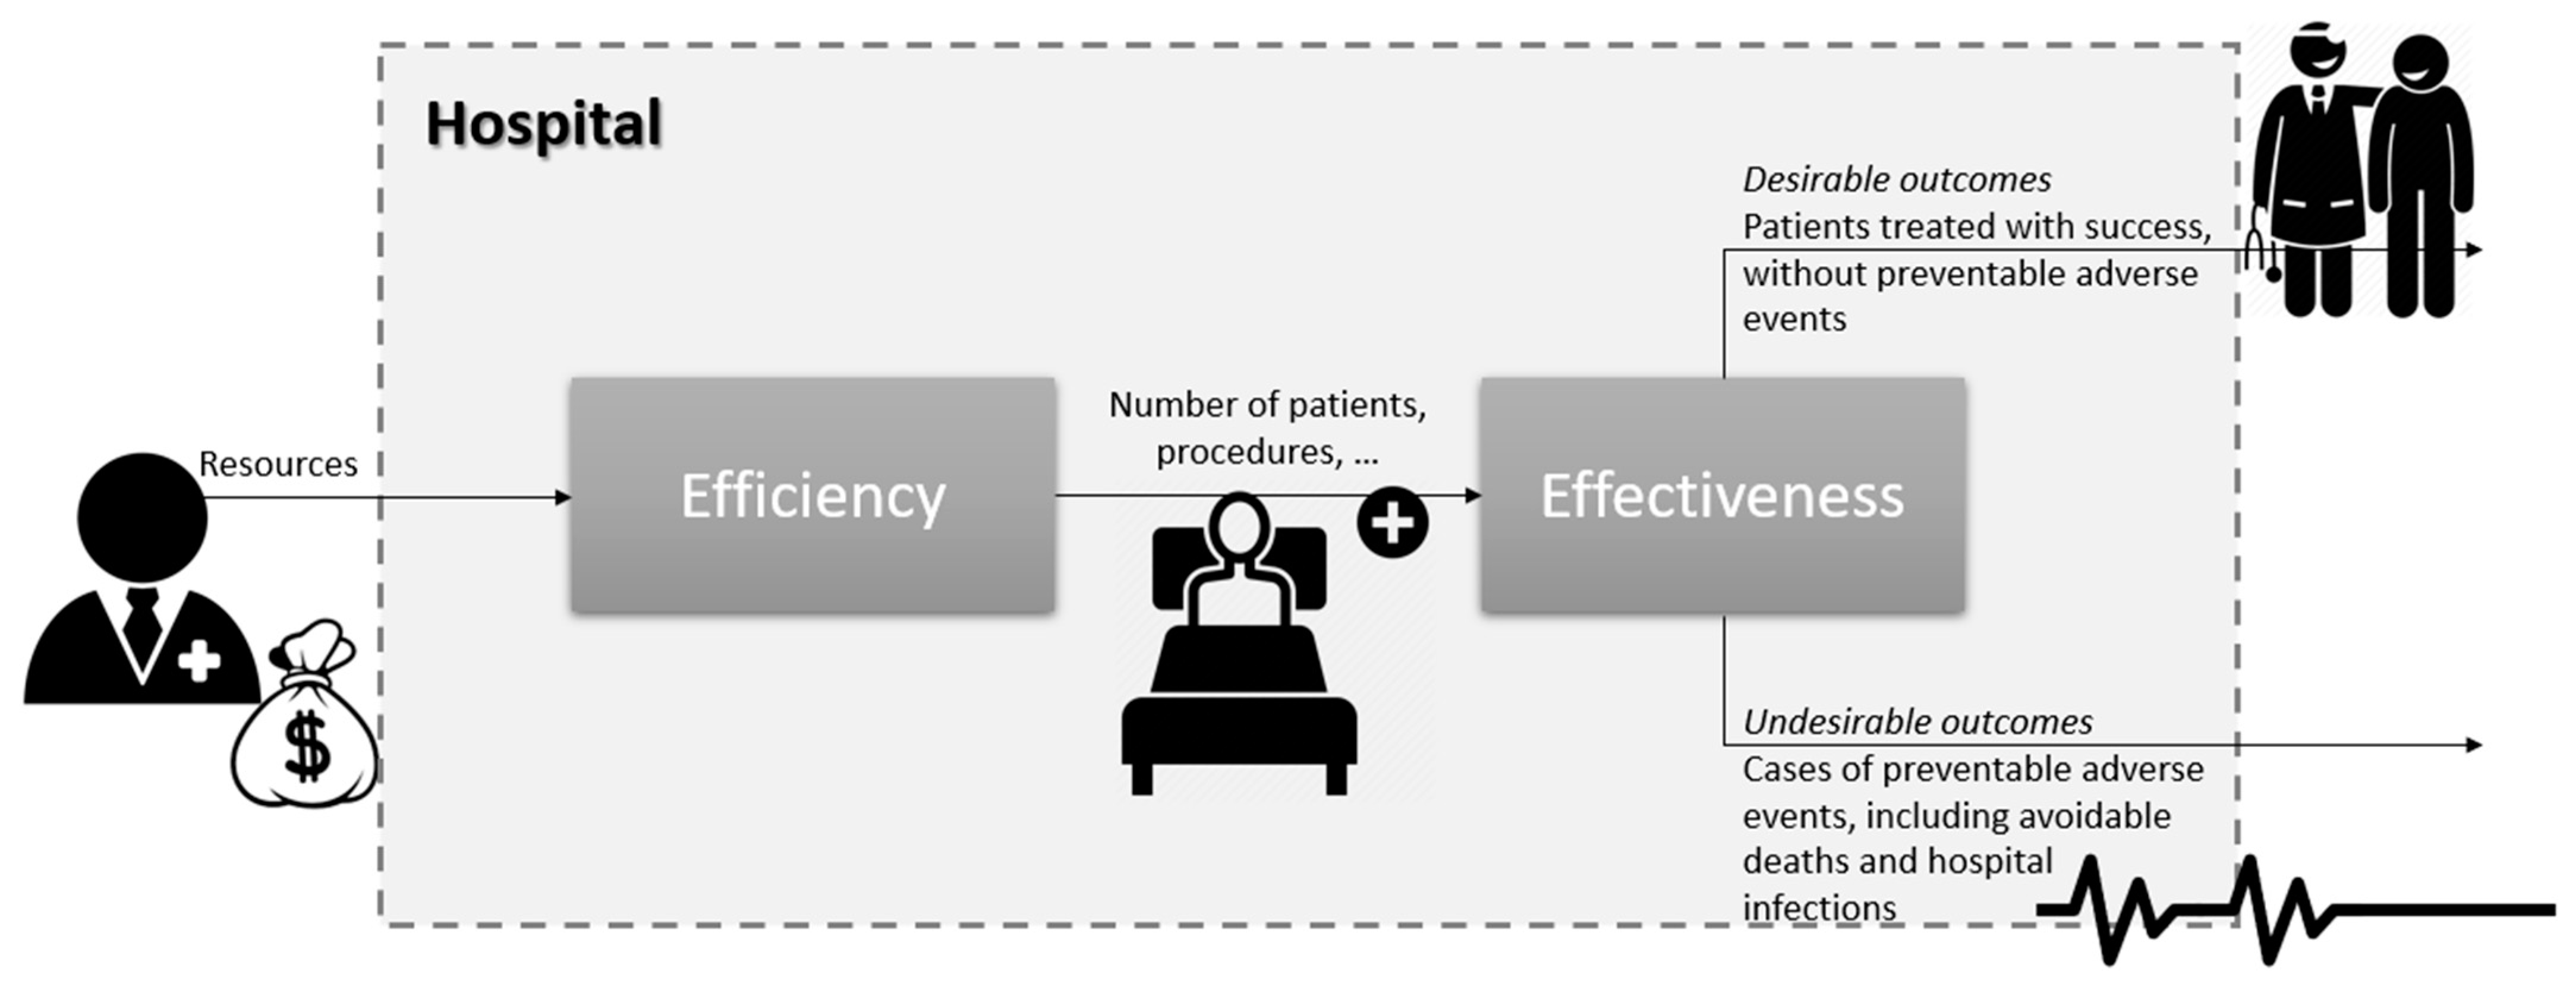
Bearing these definitions in mind, we can formulate a serial model in which efficiency is the first stage and effectiveness is the second stage of hospital care; see Figure 1. The first stage’s output(s) acts as the input(s) of the second stage. Efficiency measures the degree of a number of care procedures and patients seen (outputs) for the resources consumed (number of medical doctors, nurses, and beds, to name a few), regardless of the quality of care. Meanwhile, effectiveness measures the rate of success or adverse events given the (gross) quantity of outputs. We divide the potential outcomes (results) in hospital care into desirable (successfully treated patients, without preventable adverse events) and undesirable (preventable adverse events like avoidable deaths in low-severity cases). Naturally, desirable outcomes should be maximized, while one must minimize the undesirable ones.
Let the ith input (resource) used to produce the outputs, in the first stage of hospital . Moreover, let and denote the desirable and undesirable outcomes produced in the second stage, respectively. Since variables do not contribute equally to the hospital performance and their impact differs between providers, we should assign hospital-specific weights to each dimension: for the inputs, for the outputs, for the desirable outcomes, and for the undesirable outcomes (t stands for the hospital identification). Except for undesirable results, all weights must be strictly positive. Modeling undesirable outcomes in performance assessment could use the widely used concept of weak disposability. However, it demands that it is impossible to erase this type of product from the production process. This assumption is, however, not compatible with the hospital care process, as it is theoretically possible to prevent all avoidable adverse events. Therefore, instead of using the weak disposability theory, we simply model undesirable outcomes through strictly negative weights . This way, it is being imposed that these dimensions contribute negatively to the hospital’s performance. The objective then is to optimize weights so that it is impossible to find any other set of weights for which the performance is larger.
If the hospital j was modeled like a black box receiving inputs and delivering outputs, its efficiency would be simply given by the ratio “weighted outputs/weighted inputs”, or, mathematically, . In short, we consider some weights (to be optimized) for the model entries (inputs) and exits (outputs) that are used to construct the basic black box model. However, in a more complex way, we can split the black box in two stages, each one with entries and exits. For instance, the effectiveness stage receives the outputs of the efficiency stage (treating them as inputs) and delivering outcomes, either desirable or not (treating them as outputs). Having this in mind, we can straightforwardly define equations of efficiency, , effectiveness, , and performance, , scores of hospital j as functions of variables and their weights (the unknowns to be optimized):
It is interesting to note that, according to our model, performance results from the contribution of both efficiency and effectiveness. We impose those scores expressed in Equations (1)–(3) within the range 0 (worst level)—1 (best level). For instance, concerning Equation (1), such an imposition will lead to , which is equivalent to or , and or or (resulting into the constraint expressed in Equation (4) below). Doing a similar exercise with Equations (2) and (3), we obtain the following set of constraints:
Naturally, Equation (6) holds if both Equations (4) and (5) also hold so the former is unnecessary. Likewise, since and are non-negative for any r and j, the second constraint of Equation (4) is also unnecessary.
For the sake of the sustainability of the Portuguese NHS, we must ensure that resources are not wasted. From such an economic standpoint, to be a benchmark, the hospital must be efficient in resource usage, reducing them whenever necessary, while holding the produced outputs and results. Mathematically, it corresponds to imposing an additional constraint on the ones above:
where k stands for the hospital of which we are computing the efficiency and effectiveness. Finally, under this premise, we can straightforwardly define the objective function of this problem:
for which we know that for any t = 1,…, v.
Let be a minimal positive quantity, useful to guarantee that all weights are different from zero (so all variables are accounted for in the performance assessment, not being overlooked by the optimization [maximization] model). This way, by gathering Equations (4)–(8), we can formulate the following linear programming model that allows us to estimate both efficiency and effectiveness (and, by extension, the hospital performance) of hospital k (which belongs to the set {1,…, j,…, J}):
Once we have run the model in Equation (9) for each hospital k, we can use Equations (1)–(3) with the optimal values of weights to determine the efficiency, effectiveness, and overall performance.
4. Case Study
4.1. Variables
Table 1 presents the variables considered in the current study, categorized into their four possible groups (inputs, outputs, and (un)desirable outcomes). The selection of these variables followed three main criteria: availability of data, importance to the Ministry of Health, and the literature. Data availability is a standard criterion for variable selection; however, it is not the only one and is far from being the most relevant. In this case, the Central Administration of Health Systems monitors the selected variables monthly to control the annual contracts between the State and each healthcare provider. This procedure reflects the importance of these variables to the Ministry of Health. Finally, selecting variables should also follow the recommendations made by several references. In the present case, and aligned with the primary goal of this paper, we are interested in the variables affected mainly by the pandemics. Please, see Table 1 for details.
4.2. Sample
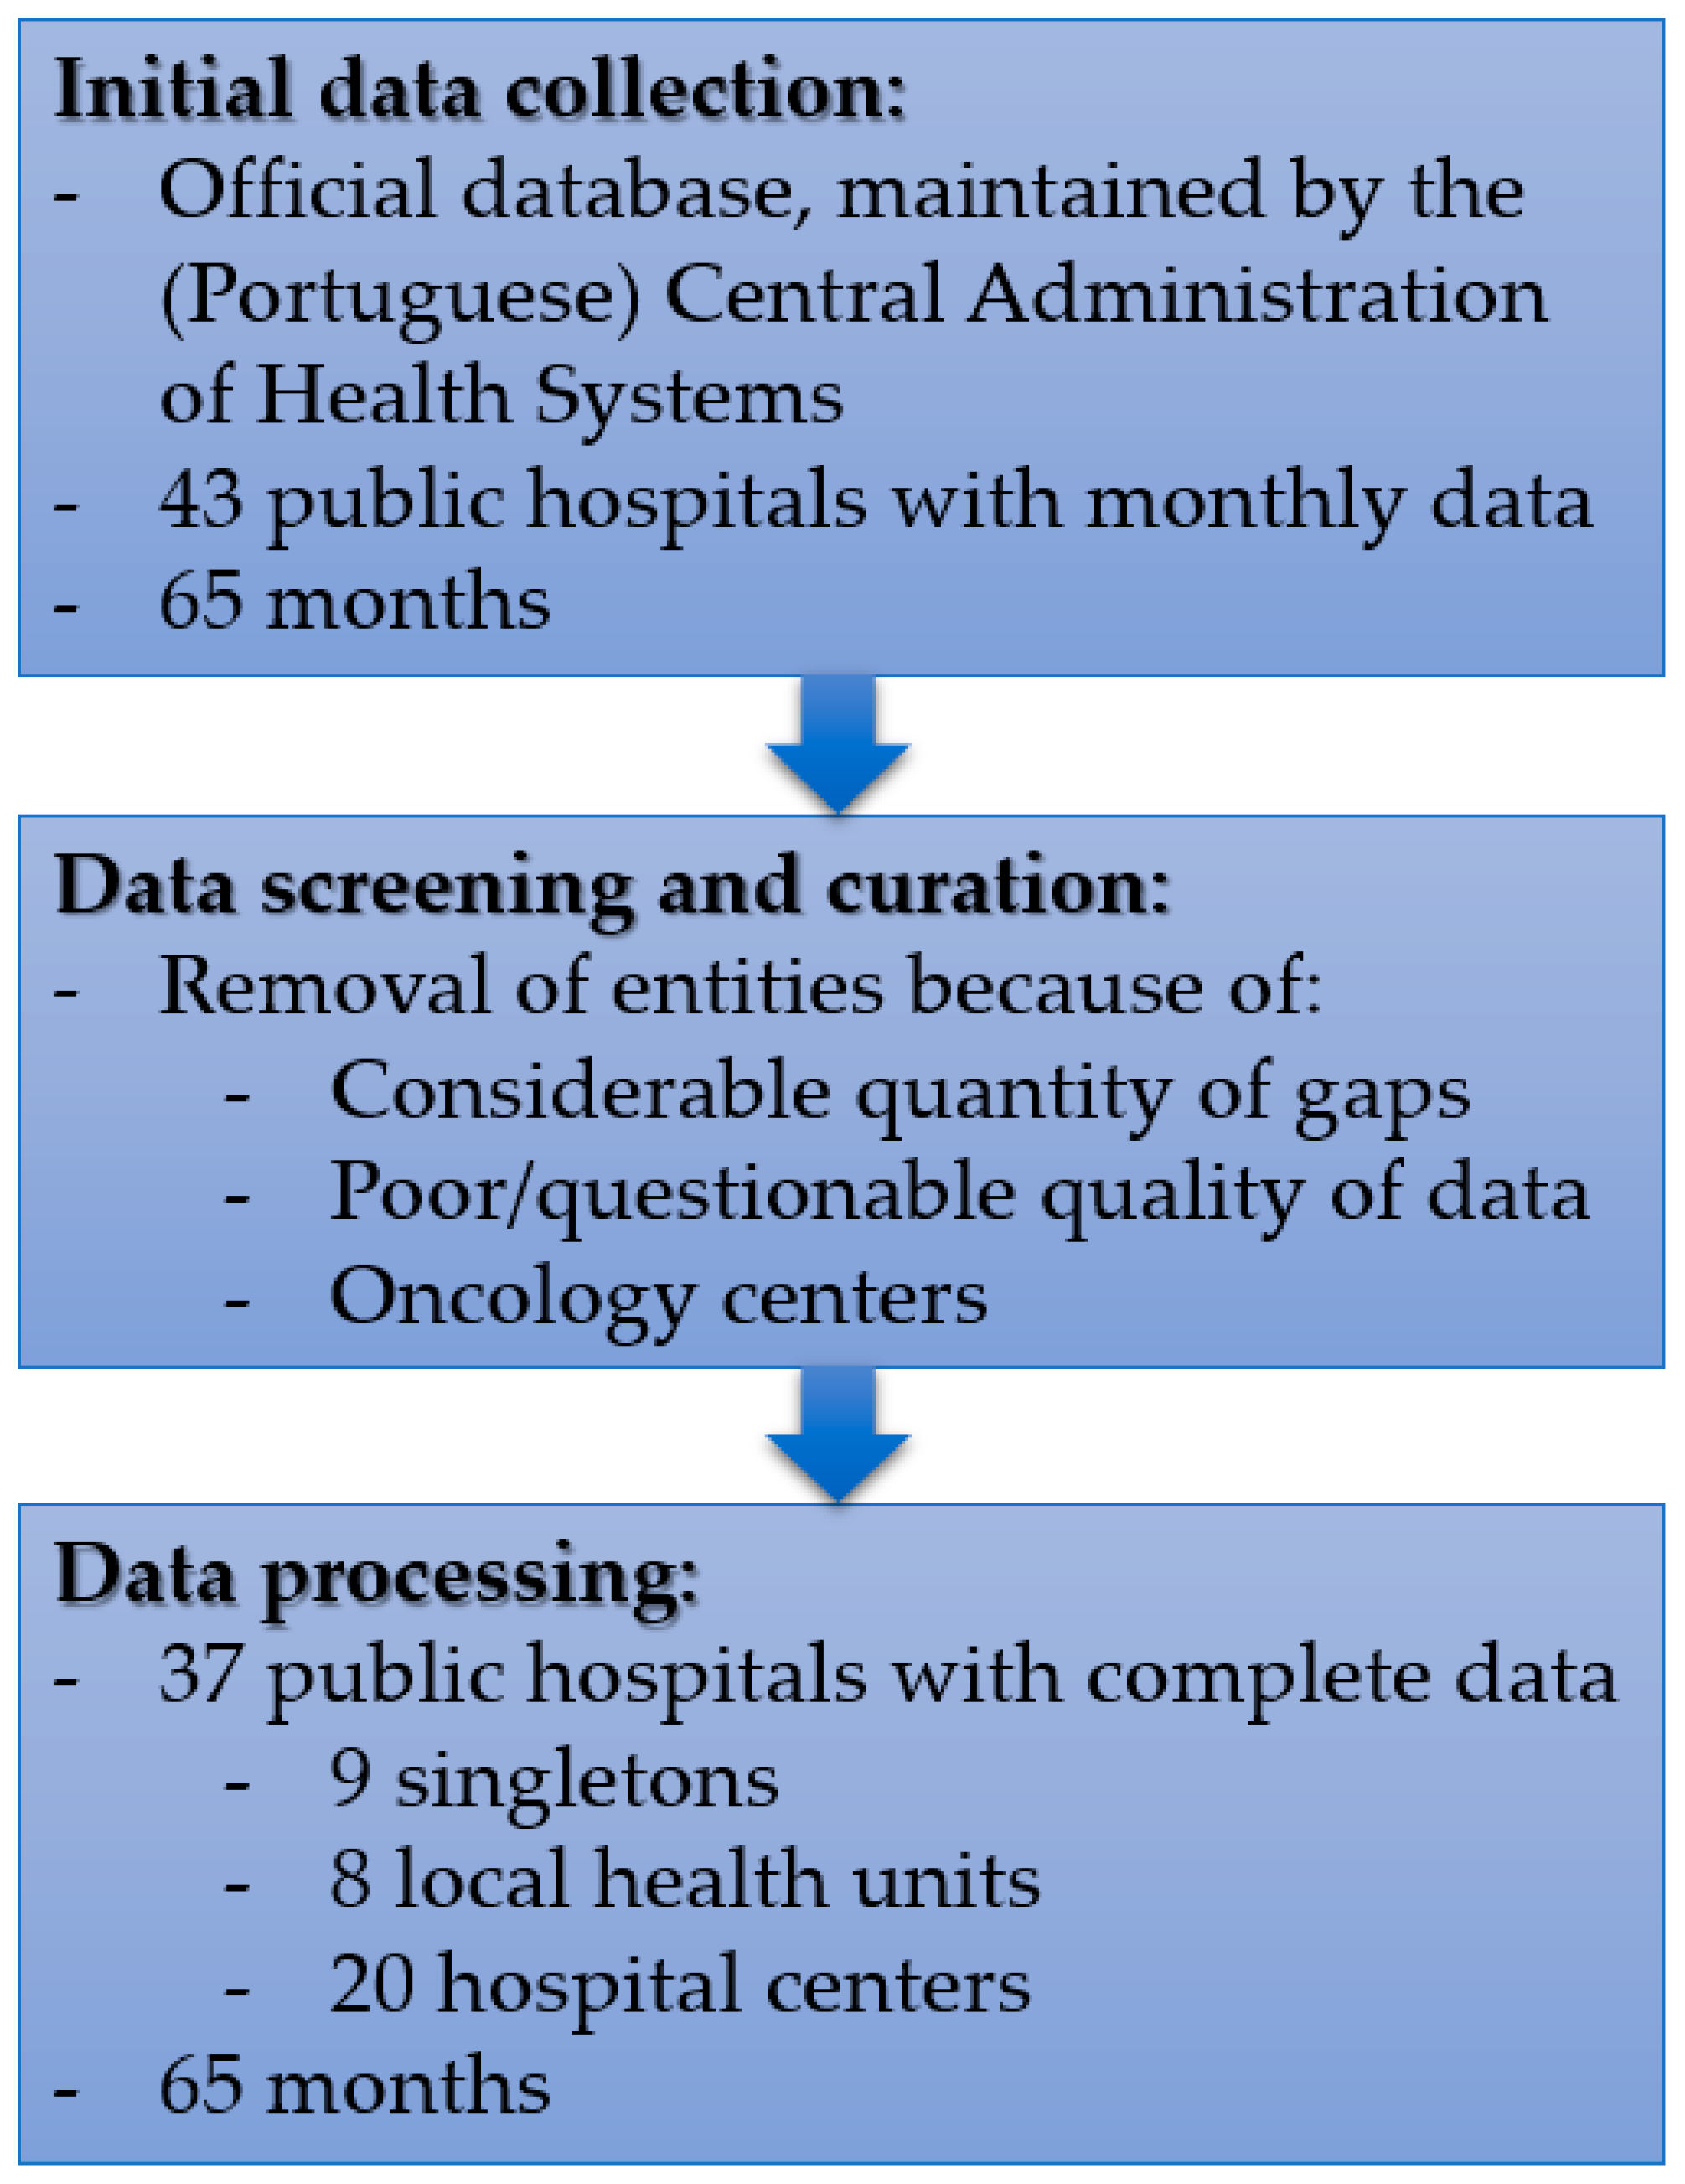
Our original sample was composed of 2795 observations corresponding to the 43 Portuguese public hospitals that provide secondary care response to the population. Nonetheless, we removed 352 entries from the sample due to some critical data missing gaps, doubts about the quality of some other data, and the existence of three oncology centers in the sample. These entities have different production technology, so they are not comparable to general hospitals. Therefore, we ended up with 2443 observations containing data of the 18 variables above.
The final sample comprises information about 37 hospitals. Of them, nine are singletons, eight are local health units, resulting from the vertical merging of a hospital and primary health centers located in its vicinity, and the remaining are hospital centers, resulting from the horizontal merging of two or more hospitals. Note that the data associated with the variables are related to the hospital production only (not the primary care level), making local health units comparable to the other types of hospitals. Figure 2 shows the flowchart associated with the data collection and curation.
4.3. Period of Analysis
The 2443 observations composing our database distribute evenly from January 2017 to May 2022, i.e., 65 months, of which 38 (58%) correspond to the pre-pandemic period. Provided that the pandemic was not over by the last month contained in our dataset, we can only make a comparison of hospital performance before and during the COVID-19 pandemic.
4.4. Additional Methodological Concerns
4.4.1. Adjustment of Outputs for Complexity and Severity and the Operational Conditions
An essential aspect of benchmarking is that all entities must be comparable. Even assuming that all decision-making units are unique, a certain homogeneous degree should exist, allowing us to compare their performance and determine best practices. This aspect is even more prominent in hospital performance assessment, given the size and scope of activities these entities carry on. A common way of making hospitals comparable is by adjusting their production, i.e., the number of patients seen, using the so-called Case-Mix Index (CMI). However, such an instrument has been criticized by several researchers (see Ferreira & Marques [43], for a survey), mainly when one performs international or time-window analyses. The CMI is computed yearly considering a national baseline that results from the average costs of all Diagnosis-related groups of patients in that year. Thus, if a hospital keeps the same CMI for two or more years, it does not mean that the complexity of patients treated there was unchanged. It simply means that such complexity remained nearly steady when compared to the national average. In the same vein, two hospitals (each located in different countries) with equal CMIs do not necessarily treat similar patients with similar complexity because the baseline used to compute each CMI depends on the country. Indeed, Ferreira and Marques [43] concluded that an adjustment for the environmental conditions in which hospitals operate or an adjustment by the CMI produces similar results, which was an expected result as the patients’ complexity is linked to the environmental conditions to which they are subjected.
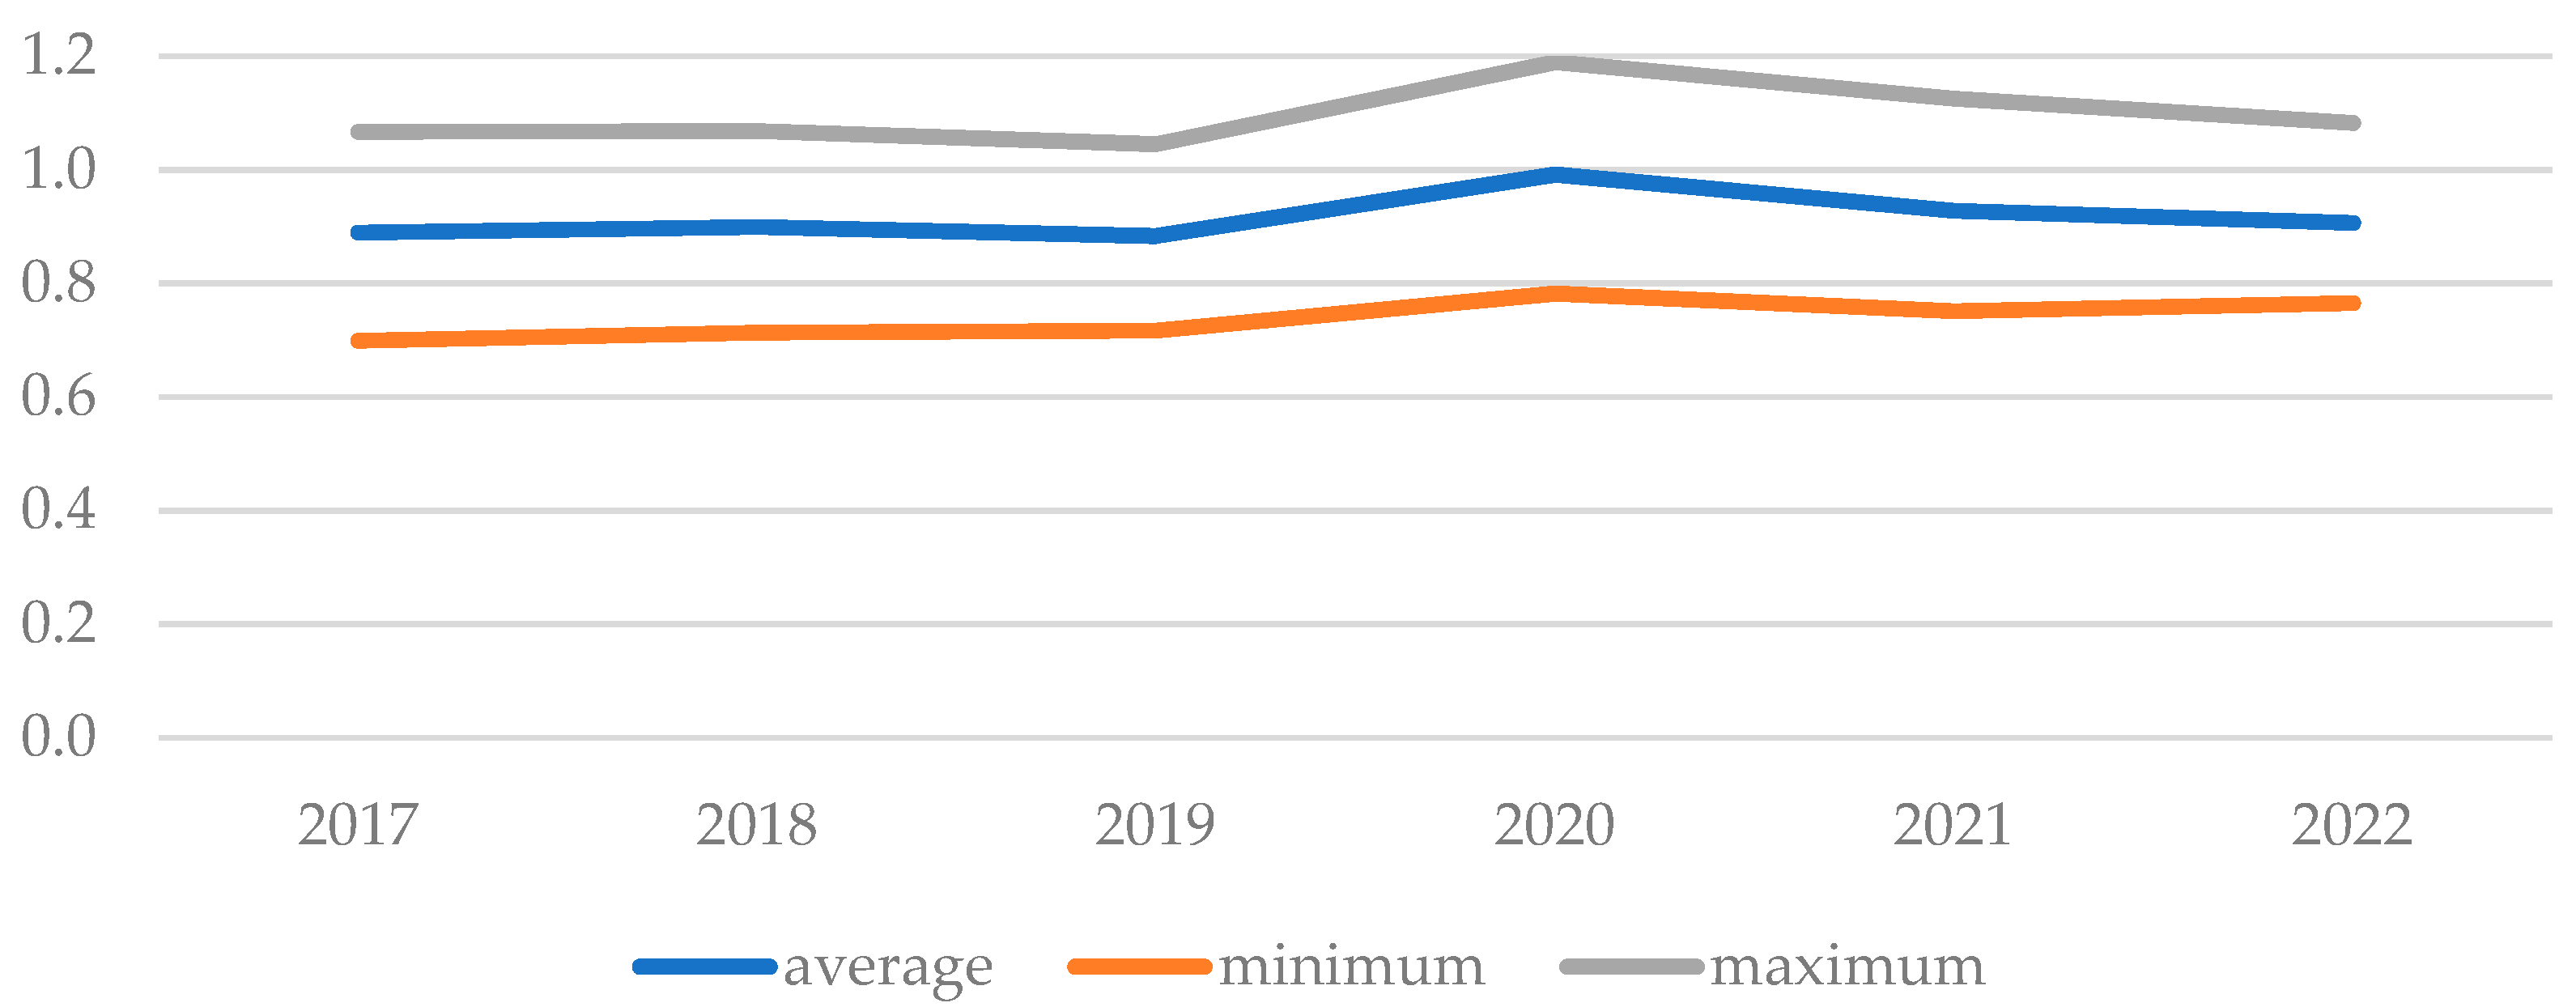
For the present case, the CMI is not available for all hospitals in Portugal or all years. Additionally, as we should conduct an analysis over time, the CMI does not seem appropriate for the reasons above. Besides, the output was already adjusted by the competent health administration authorities, turning the production homogeneous. Nonetheless, both desirable and undesirable outcomes remain unadjusted for complexity. Indeed, the likelihood of adverse events naturally increases with the patient’s complexity and severity, thus demanding more resources. Of course, hospitals handling more complex patients should not be penalized because of it. It should be possible to determine an index capable of homogenizing healthcare results. Indeed, we may consider the suggestion by Herr [44], which corresponds to using the average length of stay (or simply average delay) instead of CMI, under the assumption that the more complex the patients, the more days they should stay in the hospital wards. Therefore, considering the entire time lag (January 2017 to May 2022), we can find the national baseline as the arithmetic mean of all observed average delays computed for each hospital in each month. Then, we measure patients’ complexity by dividing the average delay by the national arithmetic mean. A unitary ratio means that the hospital treated (in a given month) patients whose complexity was equal to the national average in the 65 months; a ratio above (below) one indicates that patients treated were more (less) complex than the national average in the considered period. Figure 3 portrays the evolution of this proxy from 2017 to 2022 (January to May). We observe a shaky ratio growth between 2019 and 2020, probably motivated by the barriers to access to healthcare facilities (limited to the most complex cases), followed by a decrease in 2021 and 2022 to the pre-pandemic values. Nonetheless, statistically speaking, the observed changes were not significant at the significance level of 5%. The Kruskal-Wallis nonparametric test returned a p-value of 0.8024 for the null hypothesis of equal distributions of the average length of stay before and during the pandemic.
Another essential aspect when conducting benchmarking exercises is to make sure that one compares “apples with apples, not with oranges.” That being said, it is fundamental that entities to be evaluated are compared with their peers, provided these operate in similar conditions as the former. Entities operating in unfavorable conditions are more likely to be inefficient when compared to others working in favorable environments. Many studies have already considered this aspect when measuring hospitals’ efficiency, e.g., Amado et al. [45]. These studies usually consider environmental (or operational) conditions as explanatory dimensions used to explain performance, not necessarily considering them when evaluating the production process. However, this production process is not generally inseparable from the conditions in which it takes place, although most studies consider them separable and independent. Epidemiologic and demographic dimensions, like longevity, literacy, and purchasing power, can usually characterize the environment in which hospitals operate.
Currently, the (Portuguese) Central Administration of Health Systems (CAHS) classifies public hospitals into five groups, B to F, the last one reserved for oncology centers (thus, out of this study’s scope). CAHS uses groups of homogeneous entities, with similar production processes and operating under similar conditions, typically for financing purposes. For that, the entity uses well-grounded statistical frameworks and variables such as urgency typology, resources (including medical hours, beds, and other equipment), production (hospitalization episodes and medical appointments, to name a few), the case-mix index, and importantly the environmental reality of the population served by each hospital (resident population, level of education, average income, purchasing power, and longevity). For this reason, we followed the approach of CAHS and divided our sample based on the group to which each hospital belongs. In other words, we consider a frontier for each group and year. That way, our results are not likely biased because of the absence of operational conditions-related variables as they were already considered during the definition of groups. Table 2 presents the distribution of observations per group (B to E) and year (2017 to 2022). We observe no major changes in the number of observations from 2017 to 2021, and the differences between years result mostly from data missing or poor quality, leading to the removal of the observation. We also observe a substantial drop in the number of observations from 2021 to 2022, resulting from having data from January to May 2022 only.
4.4.2. A Panel Analysis vs. A Metafrontier Analysis
Typical analyses of hospital performance tend to be divided into two main streams: either using panel data (panel analysis) or pooling all data into a single database (metafrontier or meta-technology analysis). In the former case, the same hospital is evaluated once for each analysis conducted on a year-/month-basis. In other words, the same sample is repeated over as many times as the number of periods considered in the research, leading to the same quantity of frontiers. For instance, let the hospital HA be observed (evaluated) in two instants, 2020 and 2021, following a panel analysis. Then, observation HA(2020) is projected in the frontier constructed using 2020-data, F(2020), while the observation HA(2021) is projected in F(2021). Technology gaps resulting from differences in frontiers of consecutive years can, thus, be assessed through productivity indices like the Malmquist Index or the Hicks-Moorsteen Index. In opposition, if one pools the data into a single dataset, it is implicit that the same hospital has several observations, all projected in the same frontier. In this case, both HA(2020) and HA(2021) would be compared with the benchmarks in the common frontier F.
There are several reasons to elect one analysis over the other, but the choice mainly depends on the case study. On the one hand, the panel analysis is appropriate when there are suspicions about technology gaps, likely when the time lag is substantial. If not, the metafrontier analysis is more straightforward and should return similar performance scores. Nonetheless, applying productivity indices demands a steady sample, which is not the case in the present study (see Table 2). On the other hand, it is well-known that nonparametric benchmarking models are sensitive to the sample’s size, and the results tend to be biased when the number of variables is too big compared to the sample (the so-called curse of dimensionality). A rule-of-thumb (not mathematically proved) suggests that the sample’s size should be at least three times the number of variables. For 18 variables, the sample should contain 18 × 3 = 54 observations at least to prevent that curse (using such a rula). As we can see from Table 2, some groups have smaller sizes than this threshold, making infeasible the panel analysis. However, we opted for a different strategy that would allow us to use it, which consists of constructing possible theoretical benchmarks via virtual hospitals with no undesirable outcomes (vide Section 4.4.3). Let H be the actual observation associated with a hospital and H’ the virtual observation related to H. Since the inputs and outputs are equal, and H’ has no undesirable events and has more desirable outcomes than H, it becomes evident that H’ outperforms H. Yet, it is not necessary for H’ to be a benchmark; if it is not a benchmark, then H cannot be either. This way, the creation of virtual hospitals allows the introduction of targets in terms of effectiveness, as the former are naturally more effective than the actual observations. Additionally, these virtual hospitals allow doubling the sample as we have two dataset entries per observation. Therefore, the curse of dimensionality described before is mitigated.
4.4.3. The Construction of Virtual Hospitals
In our experiments, we considered each hospital’s actual (or observational) and virtual data representing the hospital absent from undesirable, still preventable events (see Table 3). In this case, for instance, there are no cases of bloodstream infections in the postoperative period: the actual cases are treated as additional successful major surgeries, ceteris paribus, as the patients did not suffer from this kind of adverse event.
4.4.4. Computation
Model in Equation (9) was performed via the integration of the IBM Ilog Cplex Optimization Studio (Armonk, New York, US) package, no-cost edition, and the high-performance Matlab software (version R2022b). The Matlab code can be provided upon request.
5. Results
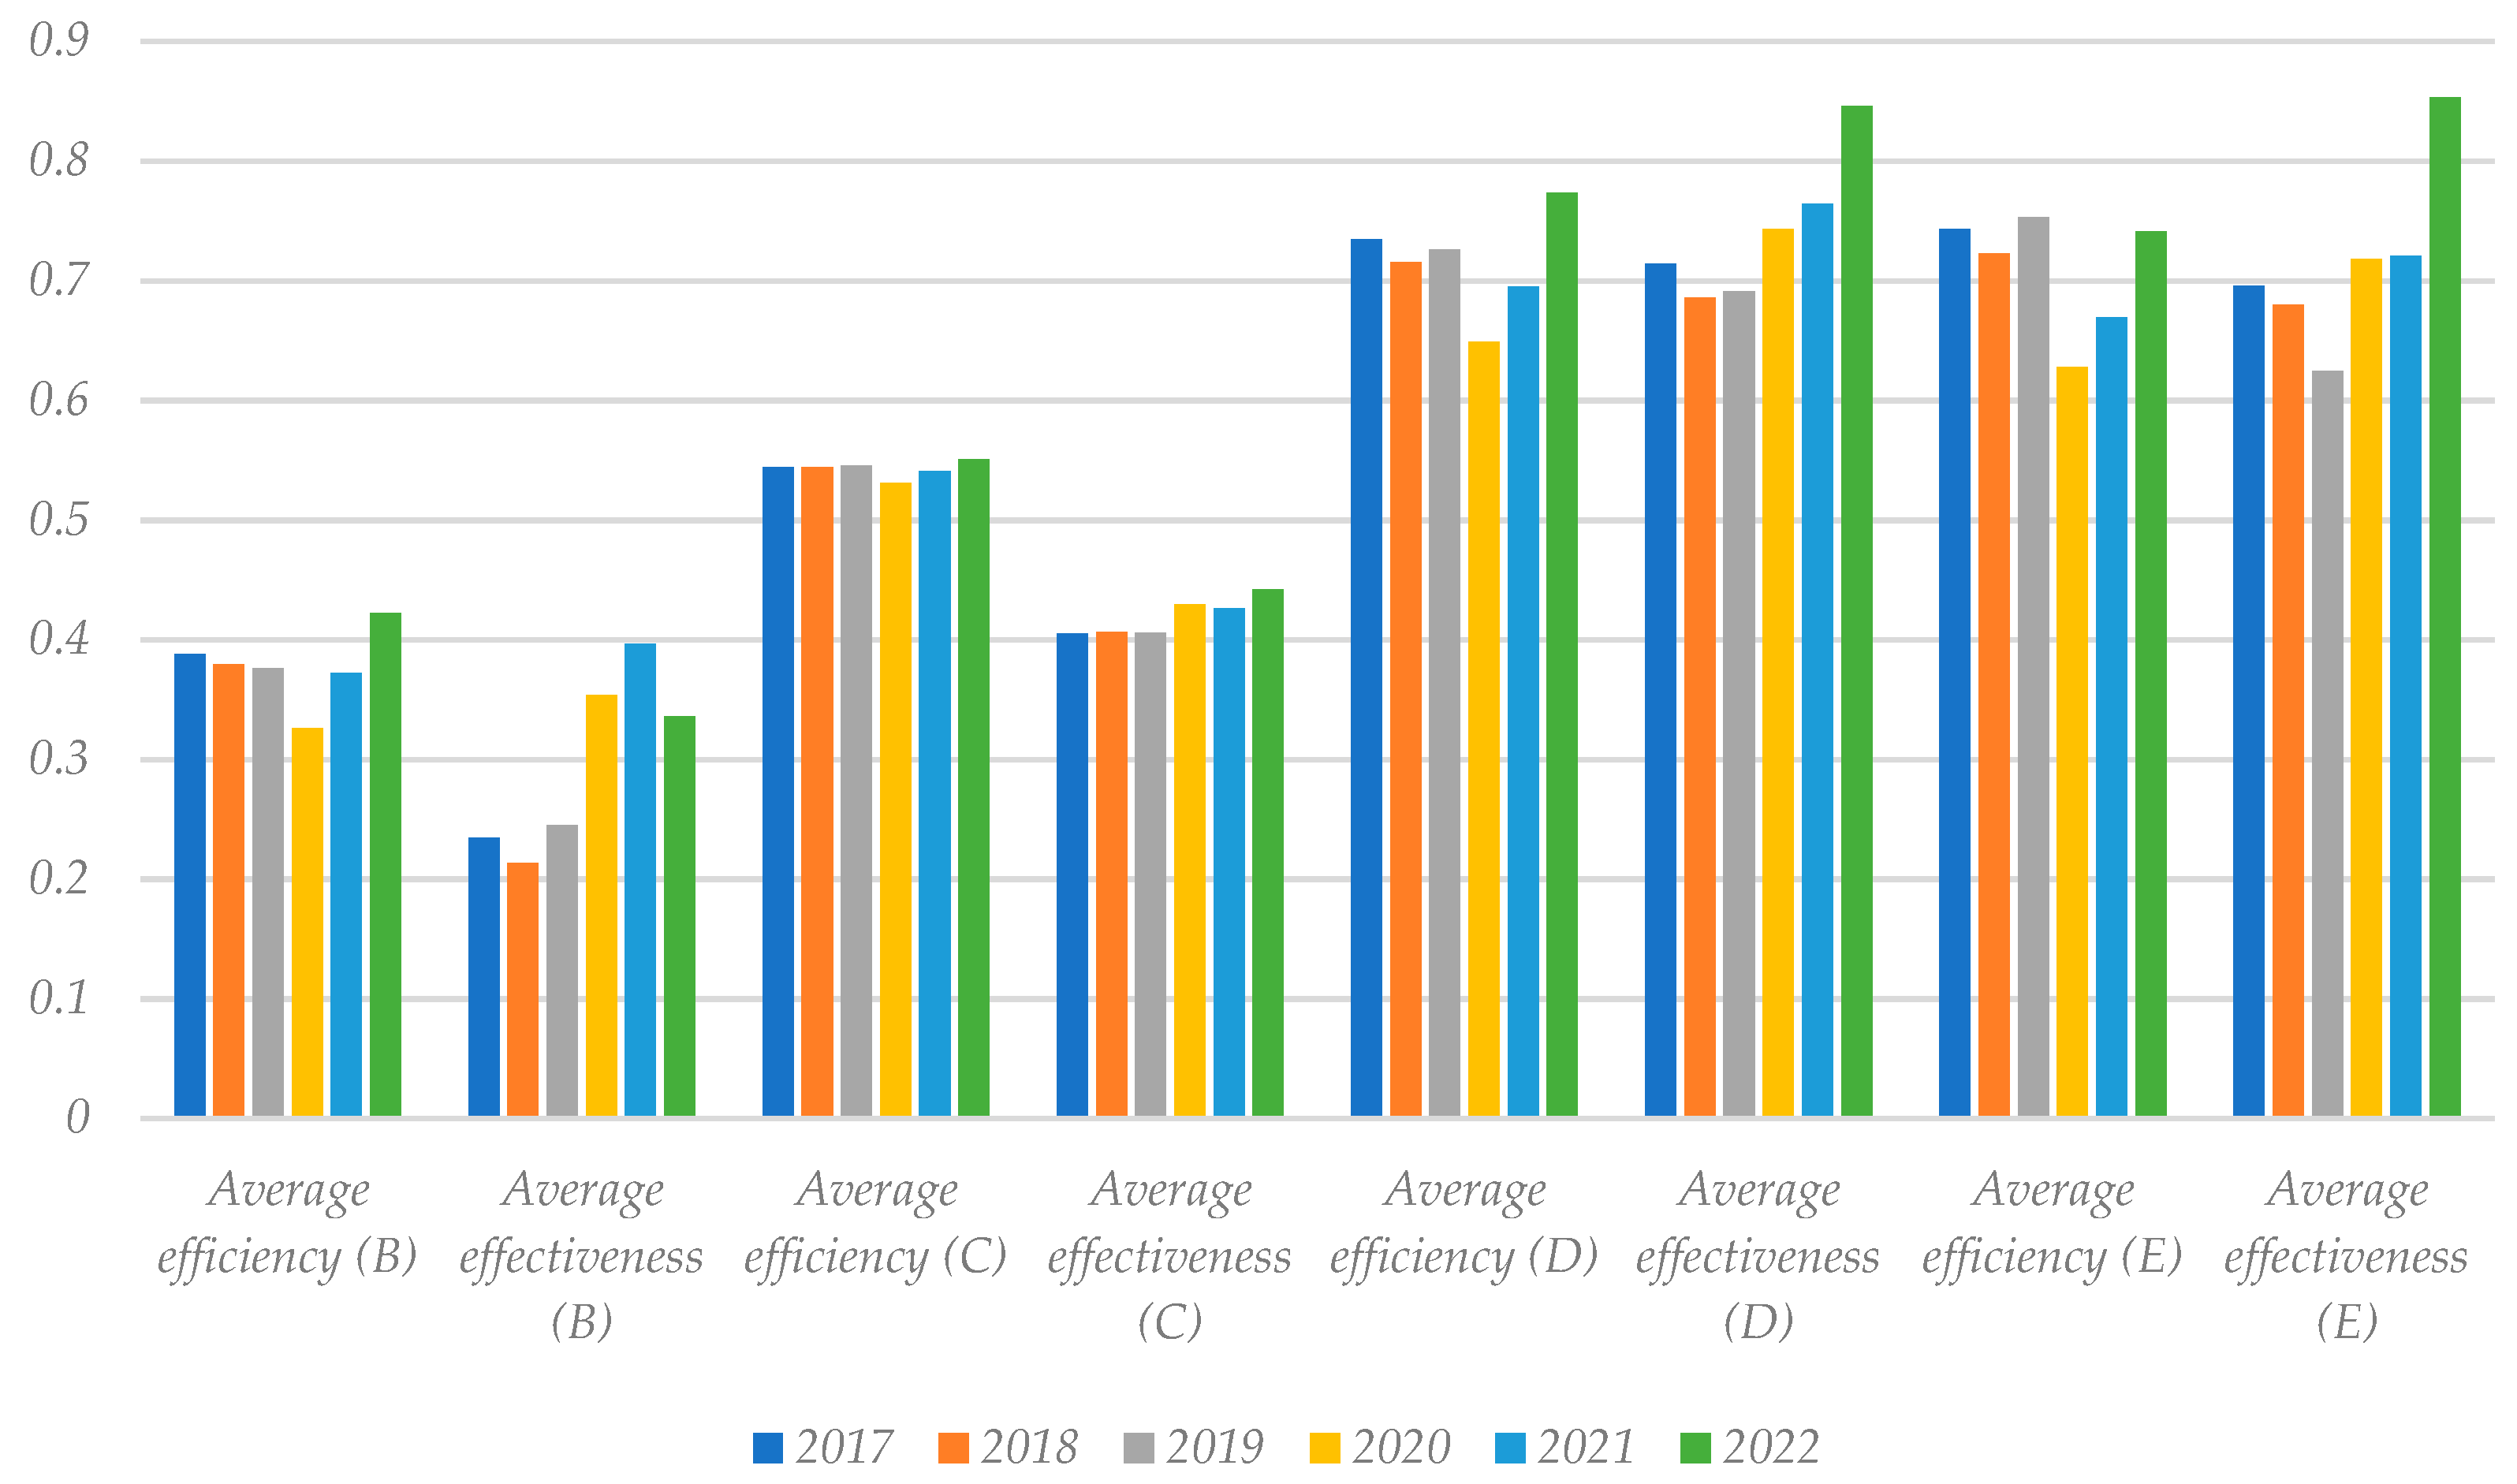
Figure 4 portrays the evolution of hospitals’ average efficiency and effectiveness, as computed using Equations (1) and (2) with weights optimized via the linear programming model in Equation (9). Differences between groups are noteworthy and statistically significant as per the Kruskal-Wallis test. First and foremost, one would expect that the hospitals in group B were the most efficient and effective, as they receive the least complex cases (nonetheless, we remark that production and outcomes were adjusted for the patients’ complexity and severity). Conversely, hospitals in groups D and E exhibit higher average efficiency and effectiveness scores, although they are primarily central hospitals that receive more complex cases. We observed no meaningful differences between scores for groups D and E. These results suggest that, opposite to our expectations, larger hospitals located in urban centers can perform better than others in better operational conditions. Second, entering the COVID-19 pandemic in 2020 seems to have led to an abatement of efficiency in all groups, although not significant in group C. However, the years 2021 and 2022 (during the pandemic) were featured by the efficiency recovery to pre-pandemic levels or even above. Third, and opposite to what happened to the efficiency, effectiveness watched statistically significant improvements in all groups, again apart from group C (in which the effectiveness remained nearly unchanged). This effectiveness enhancement may have occurred because of the reduction of attended patients, lowering the number of complex patients, or because the hospitals became more resilient to adverse events, adopting safer practices for patients and staff.
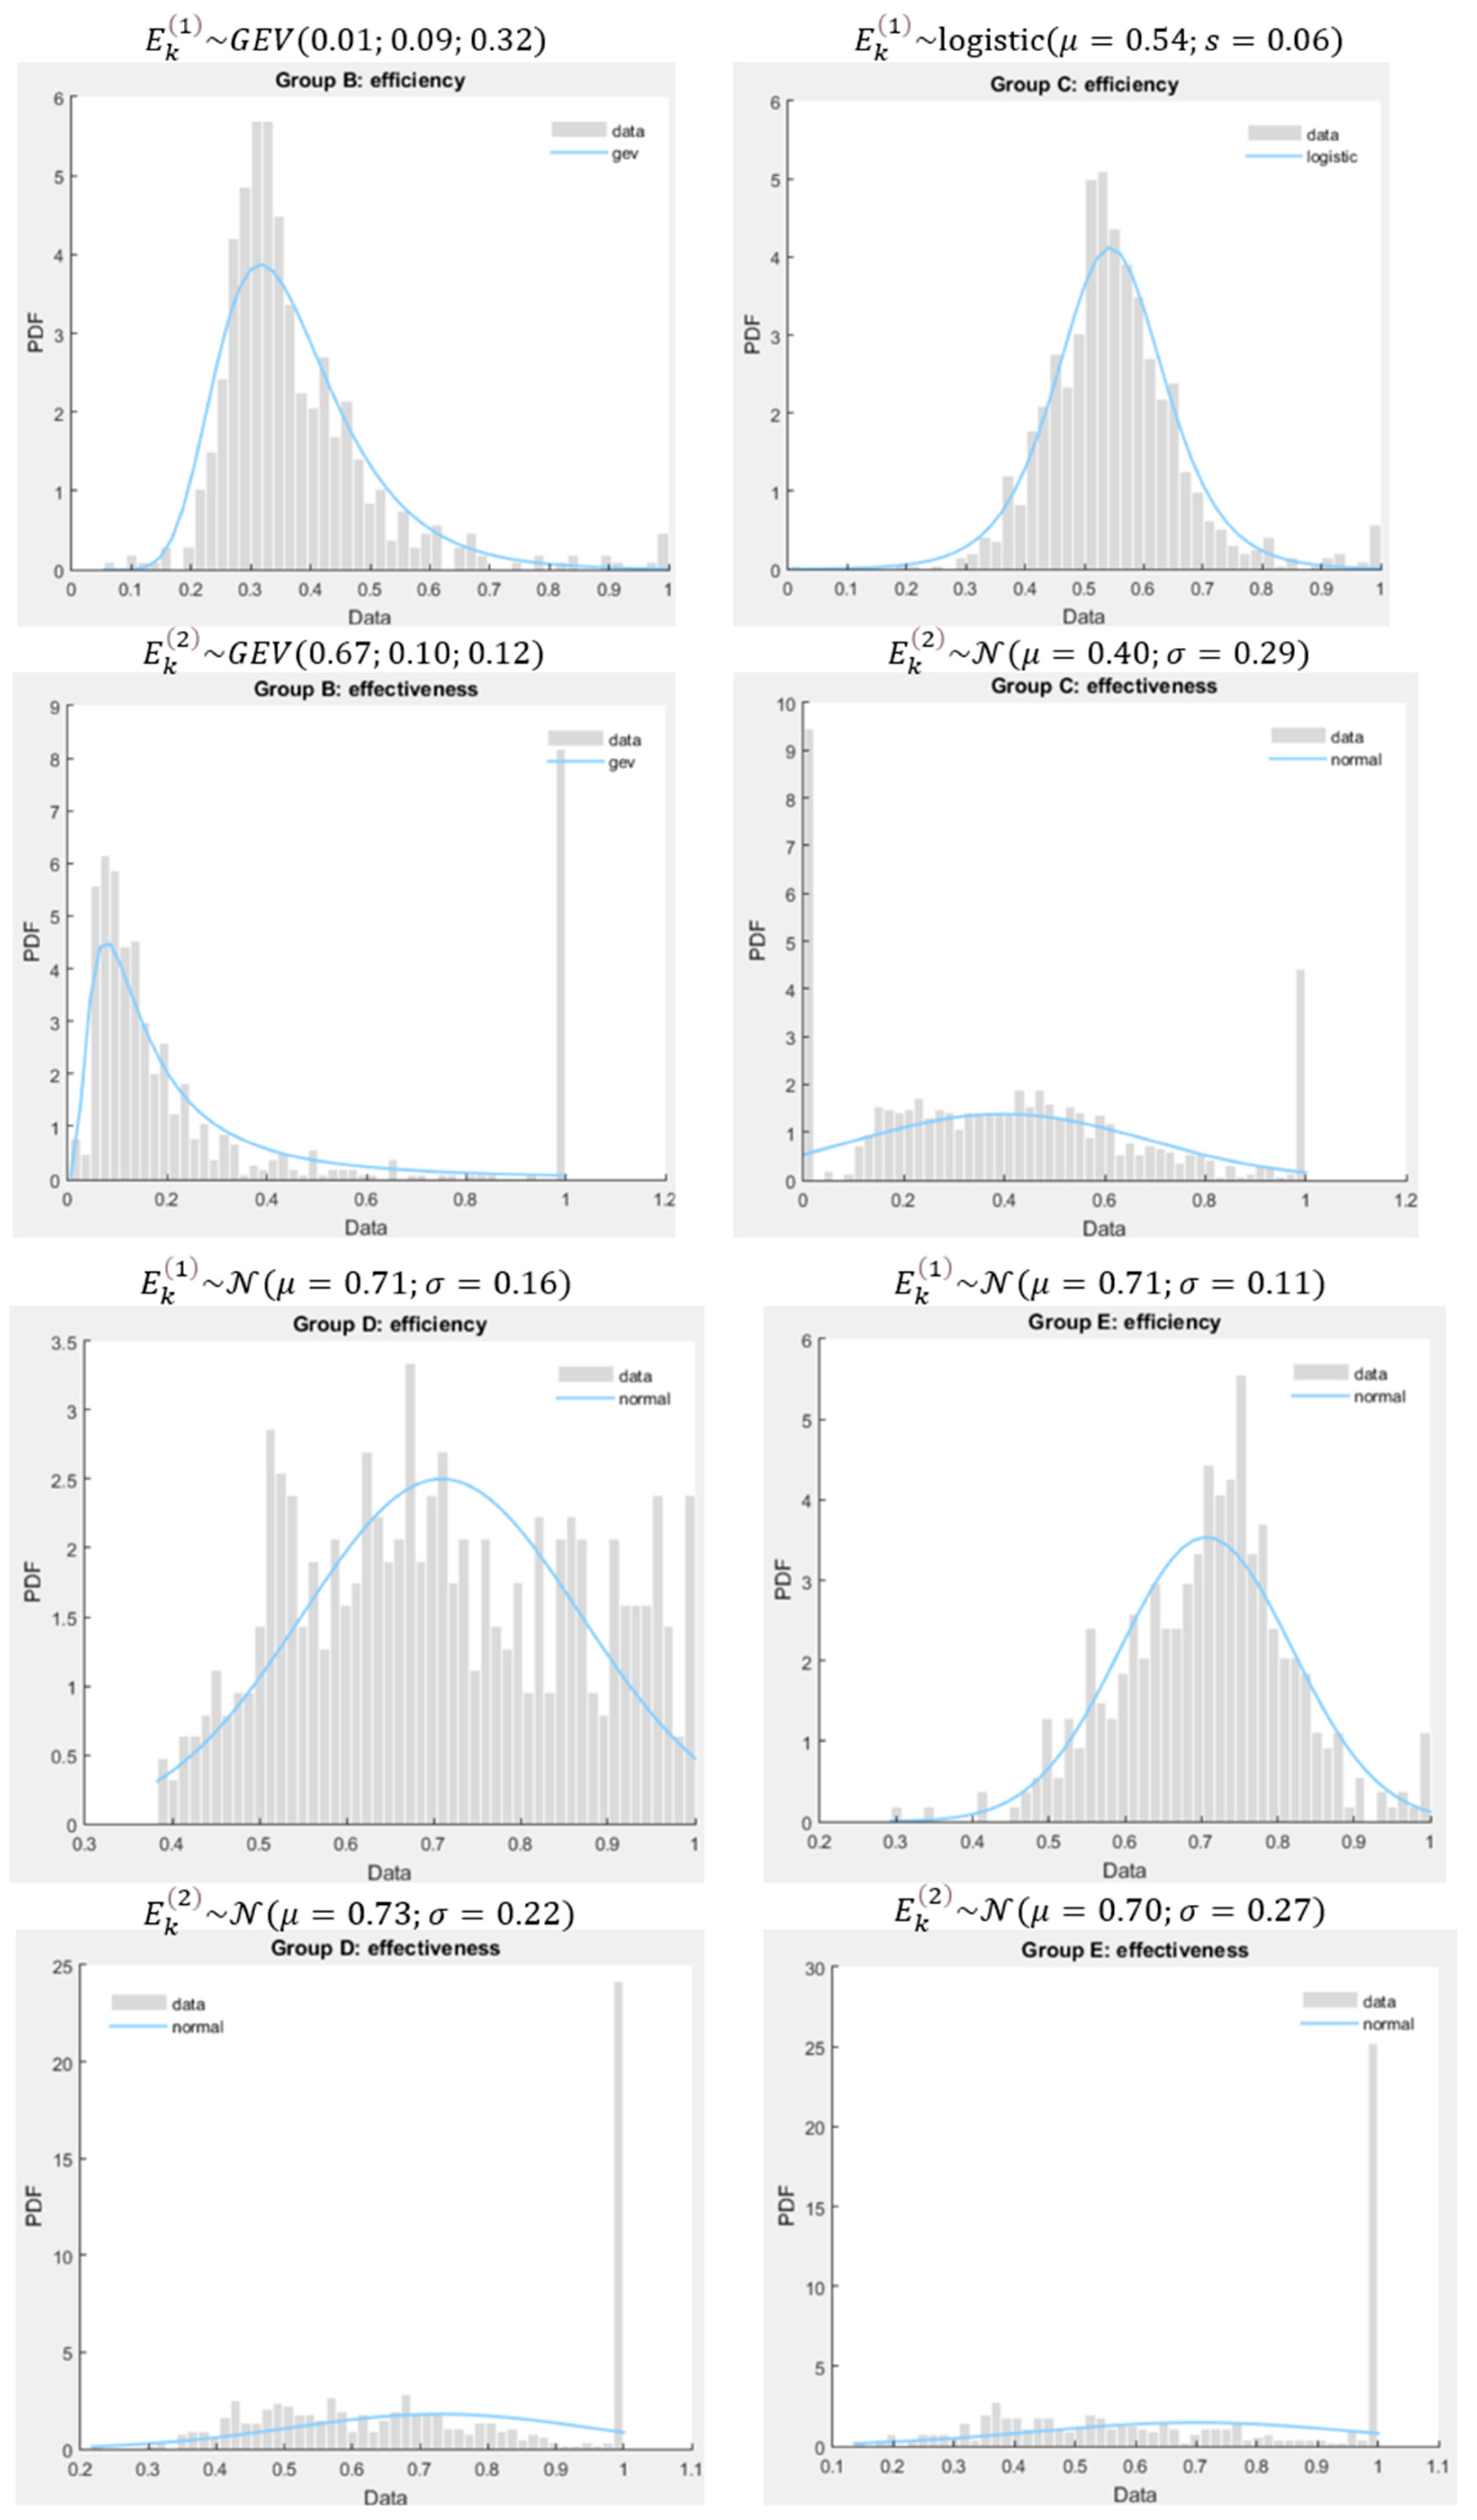
The differences between the two performance dimensions are also remarkable, especially for groups B (p = 2.91 × 10−52) and C (p = 1.73 × 10−56). We found no differences for groups D (p = 0.0620) and E (p = 0.9475). It suggests that hospitals in groups B and C have focused more on saving resources than caring for patients and their well-being. Noteworthy is that actual observations were compared with virtually constructed hospitals with better performance than the former. Therefore, we should conclude that hospitals in these two groups are far from the theoretical ideal levels. For this reason, the mathematical model seems to highly penalize hospitals for their poor performance regarding undesirable outcomes. Nonetheless, there are some exceptions, performing relatively well concerning effectiveness, as shown in the histograms of Figure 5.
We also determined the probability density functions of both efficiency and effectiveness of the four groups of hospitals. These functions obeyed the Akaike Information and the Log-Likelihood Criteria simultaneously. In most cases, a Normal or Gaussian distribution fits the distributions well. This type of distribution, besides being well-known, only accounts for two parameters (mean or location, and standard deviation or scale) and has nice properties allowing us to conduct statistical tests on the results. For instance, if and are two random variables following Normal distributions, with and standing respectively for the average and the standard deviation, then is also a random variable following the Normal distribution .
Besides the commonly known Normal or Gaussian distribution, the other two were identified in our research: logistic and generalized extreme value (GEV) distribution. The former is featured by a location parameter, (coincident with the average), and a scale parameter, s (closely related to the variance). Meanwhile, the GEV distribution is featured by three parameters: location, , scale, , and shape, . All these parameters affect the main statistics moments (average, variance, skewness, kurtosis). For instance, the average of a GEV distribution, GEV(ξ; σ; μ), is with ; the group B’s efficiency average is 0.32 + 0.09(g1 − 1)/0.01, with g1 = Γ(1 − 0.01) = Γ(0.99) = 1.01 (Γ is the Gamma function), i.e., 0.32 + 0.09(g1 − 1)/0.01 = 0.32 + 0.09 × 0.01/0.01 = 0.32 + 0.09 = 0.41.
With the property above, we can estimate the likelihood of finding a hospital in group E more efficient than in group D, as follows: with , , and , which results into 50%. We can use the same rationale in the effectiveness case, which is 19.48% for and . Likewise, the probability of a hospital belonging to group D being more effective than efficient is roughly 52.79%, which is expected given the large number of effective hospitals in this group and the average effectiveness score is slightly larger than the average efficiency score. That value reduces to 48.8% in the case of hospitals of group E.
In the case of groups B and C, finding such a probability is harder as probability density functions are not Gaussian. Let and . We need to compute the following probability: for , , to understand if group B outperforms C. In this case, we have with and the auxiliary functions and . Since and , we easily conclude that the probability of group B outperforms group C (in terms of efficiency) is nearly zero (almost an impossible event).
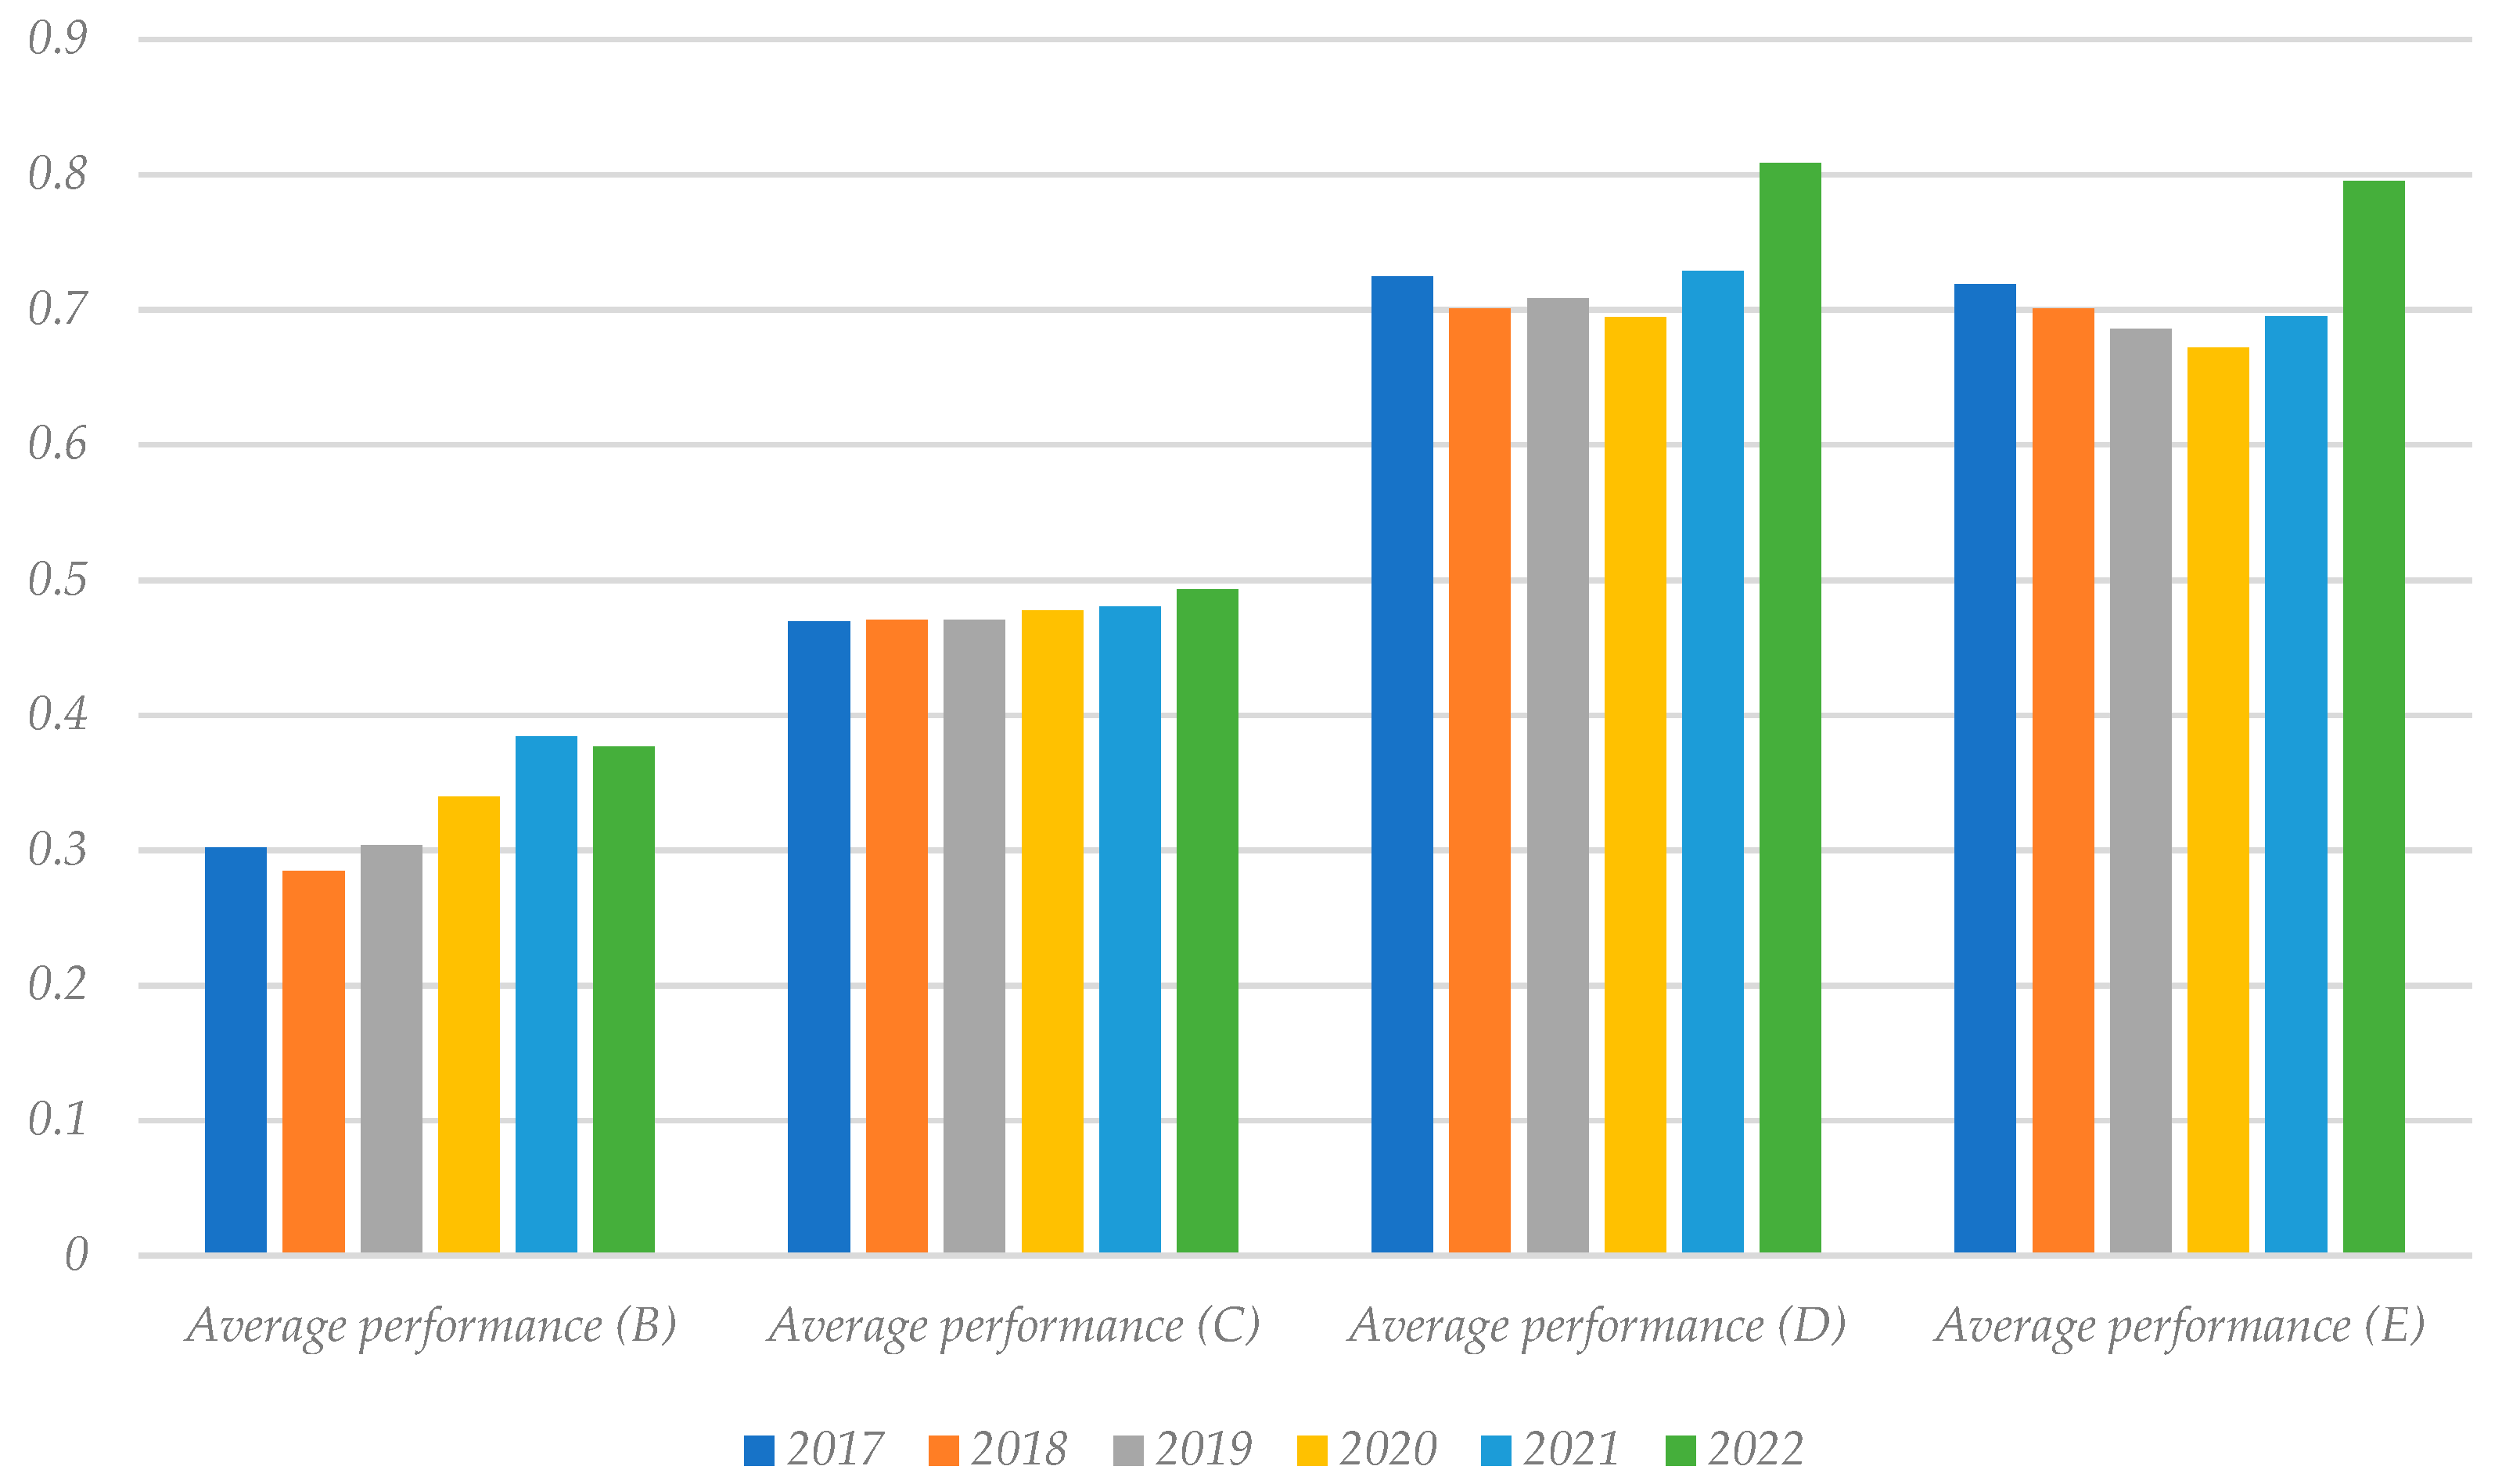
All in all, when considering the aggregated measure of overall performance, we observe that all groups of hospitals improved it (on average terms) from January 2017 to May 2022; see Figure 6. Unsurprisingly from the previous results, hospitals in groups D and E exhibited better overall performance levels, followed by the ones in group C. The performance scores of groups D and E were not statistically different as per the Kruskal-Wallis test: p = 0.2767 (>0.05). The poorest performance group is B, which also achieved the most negligible levels of efficiency and effectiveness according to our model. Using the same statistical test, group B shows statistically lower performance scores than group C (p = 2.18 × 10−44), which in turn shows lesser scores than groups D and E (p = 5.76 × 10−153).
6. Discussion, Limitations, and Future Work
6.1. Discussion
In the present study, both the efficiency and effectiveness of hospital healthcare providers in Portugal were analyzed in the periods before and during the COVID-19 pandemic. This type of analysis is extremely important in hospital administration and management as it constitutes a premise for the sustainability of services but also for patient safety and prompt compliance with evidence-based medical guidelines for the adequacy of care.
For this purpose, in the evaluation of efficiency, when measuring the number of procedures and patients attended (outputs) for the resources consumed (number of doctors, nurses, and beds, to name a few), regardless of the quality of care, it can be observed that this performance dimension dropped in the year 2020 in all hospital groups, resuming a growth trajectory in the year 2021. The reduction in efficiency from 2019 to 2020 appears to have been the result of the decrease in hospital production. Despite the increase in their complexity (if measured by the average delay as a proxy for complexity and severity), this was not enough to offset the drop in output, without there having been a proportional decrease in input. However, the atypical results observed in 2020, in terms of efficiency, were recovered in the following years. In this sense, there seems to be some guarantee or hope regarding the sustainability of the SNS in Portugal.
The main objective of health professionals is to provide the best health care to users, upkeeping their safety and giving them the most appropriate care following the best technical and ethical standards. In that sense, it seems that the effectiveness maintained a growing trend during the pandemic period in all groups. However, it is worth noting the fact that effectiveness in all hospital groups shows a decreasing trend in the pre-pandemic period was potentially motivated by the exodus of highly qualified health professionals not only to the private sector but also abroad. At stake will be the search for better salaries and working conditions, as they were widely criticized for the fact that these professionals work in increasingly precarious conditions in the public sector.
The increasing trend of effectiveness in the pandemic period compared to the three pre-pandemic years may be related to the resilience of health services and professionals, despite difficult working conditions, burnout, and staff shortages. However, the increase in barriers to access was evident, namely through the postponement and cancellation of medical appointments and the delay in registering on the list for surgeries, as was the increase in some undesirable results such as pulmonary embolisms and cases of septicemia that are linked to the increase in severe cases of COVID-19 (especially in 2020). From 2021 onwards, vaccination contributed to a reduction in the severity of the disease, that is, to a decrease in cases of in-hospital pulmonary embolisms and septicemia related to that disease. However, with the reduction of barriers to access, it is natural that other undesirable cases could have increased, contributing to the degradation of the effectiveness of hospital care. Still, poor results on some quality variables were offset by other dimensions in which hospitals appear to have improved performance, such as hospital readmissions and timely hip surgeries. Naturally, this result is also linked to demand or access limitations. It is also necessary to take into account that the outcomes were adjusted to the patient’s complexity and, for this reason, it is natural that even the increases observed in some undesirable dimensions contribute less to the estimation of effectiveness. Furthermore, the model used is an optimization of the weights in the optimistic sense, seeking to maximize the weights of the dimensions where the hospital performed well, giving primacy to the dimensions where the hospital management invested more. In other words, it is possible to conclude that some dimensions end up being undervalued when estimating hospital performance. Note, however, that the weights are never zero, so there is always a contribution from all variables, even if this contribution is marginal for some cases.
In order to discuss the results in more depth, let us recall the seven measures adopted by the Minister of Health (Order No. 5314/2020, of 2 May) as a recovery plan for the assistance activity:
- (i)
- Recourse to non-face-to-face means, using telemedicine mechanisms, namely teletracking, teleconsultation, telemonitoring, and teleconsulting programs, except when this was not clinically appropriate or technically possible;
- (ii)
- Different opening hours, including on weekends;
- (iii)
- Scheduling by appointment, ensuring that users remain in the health services only for the strictly necessary period;
- (iv)
- Travel to the user’s home, or equivalent, in clinical situations where this proves to be appropriate;
- (v)
- Referral of emergency episodes sorted with white, blue, or green color in hospital emergency services to another type of health care, namely, primary health care and other programmed hospital responses;
- (vi)
- Promotion of hospital consultation activities, in a decentralized manner in primary health care or through teleconsultation; and
- (vii)
- Implementation of complementary means of diagnosis and therapy in primary health care, in cases where such availability existed.
Measure (i) was based on the fact that the first hospital appointments are forwarded by family doctors in the primary health care units and require greater differentiation with a great need for complementary means of diagnosis and therapy. Even if in cases where medical specialties allow and the user has already had exams, this would require specific equipment that not all users have. Of course, this issue could be mitigated through primary health care, with the family health team making the connection. In addition to these limitations, the data presented by the Central Administration of the Health System and released by the Court of Auditors between March and May 2020 referred to a monthly average of 4000 telemedicine consultations, far below the needs. When compared to the same period in 2019, there were less than 882,333 consultations, 364,000 of which were first appointments. That is, on average, there were 172,599 fewer subsequent consultations and 121,512 fewer first monthly consultations. The 4000 teleconsultations registered per month had a residual representation of 3.2% of the total of first consultations or 2.3% of the total of subsequent consultations. However, this is an interesting strategy for the future of health systems that allows for greater efficiency and effectiveness of medical work in conjunction with primary health care.
Measure (ii) appears to have had some positive effects. However, it lacks some availability of health professionals for the weekend when, as a rule, the Health Centers are closed (the rest days of the teams would have to be compensated by weekly days). During this period, hospital units operate with fewer services as they concentrate their activities during weekdays and in the morning. However, this limitation with shift hours could be contemplated in some types of activities and in additional production, with the respectively associated incentives.
In turn, Measure (iii) is a strategy that, in a first analysis, would reduce the presence and permanence of users in health services. However, it would no longer be a pioneer in the NHS, which has proven to be ineffective due to the unpredictability of acts provision and because, in some cases, doctors are not only dedicated to this task but sometimes have to interrupt the service cycle for users. All these facts would generate waiting and agglomeration of users, which contradicts the initial objective of the measure.
Measure (iv) was initially envisaged as a strategy with advantages for the citizen, namely in cases without the ability to travel to health facilities. However, its implementation would be (as it was before) residual since it would remove professionals from the health units, where they are essential. It should also be noted that this measure may conflict with the previous ones, as it increases the average time of service, reduces the margin for scheduling, and does not allow the extension of hours to weekends, as it would reduce the capacity of professionals to attend more patients, which is done more efficiently in health facilities.
Measure (v) could have resulted in very positive effects on hospital care, as it would allow for less pressure in emergencies, freeing up time for the recovery of non-COVID activity with more non-urgent case scheduling. However, it is necessary to bear in mind that primary health care must also recover its activity in the control of chronic disease and in the updating of vaccination that was not carried out in the COVID-19 period due to lack of demand. This fact limits the action of these professionals who no longer must follow users at home, having passed this function to other types of response. Even so, the referral of users for hospital-programmed responses to hospital units that focus on non-COVID patients would be an interesting measure capable of recovering production. It would also be important to create an Integrated Activity Recovery System, whose functionality was like the Integrated Access Management System. It would allow doctors to make a safe referral with online knowledge of the units’ availability, avoiding clusters of users waiting for care and promoting good articulation between health units.
On the other hand, Measure (vi) made it possible to alleviate the concentration of users in hospitals (lower risks for them) and, at the same time, allowed hospitals to focus on more differentiated cases. However, it has some associated problems such as the availability of teams or physical spaces and necessary equipment, which can undermine it without prior and proper planning and investment.
Finally, Measure (vii) was unsuccessful because of the meaningful asymmetry between primary health care providers and the lack of investment to improve this level of care’s solvability, which limits and would hardly produce the desired effects in the short term.
6.2. Limitations and Future Work Insights
The main limitation of this study is precisely the fact that the proposed model is optimistic, as is the case with almost all DEA models. Therefore, future work consists of developing a pessimistic approach, to verify to what extent hospital performance changes when more emphasis or weight is given to variables where performance was weaker. Furthermore, this study adopted a perspective of minimizing the consumption of resources, to guarantee or promote the economic and financial sustainability of the Portuguese NHS. However, in the future, a perspective of maximizing desirable results (and consequent minimization of undesirable results) must be adopted from a social and not so much a financial point of view. In that vein, the results must be compared with the ones achieved in the present research.
Author Contributions
Conceptualization, A.M.N.; methodology, D.F.d.C.F.; software, D.F.d.C.F.; validation, A.M.N. and D.F.d.C.F.; formal analysis, A.M.N.; investigation, A.M.N.; resources, A.M.N. and D.F.d.C.F.; data curation, A.M.N. and D.F.d.C.F.; writing—original draft preparation, A.M.N. and D.F.d.C.F.; writing—review and editing, A.M.N. and D.F.d.C.F.; visualization, A.M.N. and D.F.d.C.F.; supervision, A.M.N.; project administration, A.M.N. and D.F.d.C.F.; funding acquisition, A.M.N. and D.F.d.C.F. All authors have read and agreed to the published version of the manuscript.
Funding
This research received no external funding.
Institutional Review Board Statement
Not applicable.
Informed Consent Statement
Not applicable.
Data Availability Statement
Data are publicly available in the mentioned official databases, maintained by the Portuguese Ministry of Health (https://benchmarking-acss.min-saude.pt/ (accessed on 17 August 2022) [website in Portuguese]).
Conflicts of Interest
The authors declare no conflict of interest.
References
- Storto, C.L.; Goncharuk, A.G. Performance Measurement of Healthcare Systems in Europe. J. Appl. Manag. Investig. 2017, 6, 170–174. [Google Scholar]
- Markowicz, I.; Rudawska, I. Struggling with COVID-19—A Framework for Assessing Health System Performance. Sustainability 2021, 13, 11146. [Google Scholar] [CrossRef]
- Sohrabi, C.; Alsafi, Z.; O’Neill, N.; Khan, M.; Kerwan, A.; Al-Jabir, A.; Iosifidis, C.; Agha, R. World Health Organization declares global emergency: A review of the 2019 novel coronavirus (COVID-19). Int. J. Surg. 2020, 76, 71–76. [Google Scholar] [CrossRef]
- Al-Abrrow, H.; Al-Maatoq, M.; Alharbi, R.K.; Alnoor, A.; Abdullah, H.O.; Abbas, S.; Khattak, Z.Z. Understanding employees’ responses to the COVID -19 pandemic: The attractiveness of healthcare jobs. Glob. Bus. Organ. Excel. 2020, 40, 19–33. [Google Scholar] [CrossRef]
- Almeida, R.; Oliveira, R.C. Revisiting Clinical Autopsies: Lessons to be Taken from the COVID-19 Pandemic. Acta Med. Port. 2020, 33, 703–712. [Google Scholar] [CrossRef]
- Guida, C.; Carpentieri, G. Quality of life in the urban environment and primary health services for the elderly during the COVID-19 pandemic: An application to the city of Milan (Italy). Cities 2021, 110, 103038. [Google Scholar] [CrossRef]
- Nicola, M.; Alsafi, Z.; Sohrabi, C.; Kerwan, A.; Al-Jabir, A.; Iosifidis, C.; Agha, M.; Agha, R. The socio-economic implications of the coronavirus pandemic (COVID-19): A review. Int. J. Surg. 2020, 78, 185–193. [Google Scholar] [CrossRef]
- Lloyd-Smith, M. The COVID-19 pandemic: Resilient organisational response to a low-chance, high-impact event. BMJ Lead. 2020, 4, 109–112. [Google Scholar] [CrossRef]
- Qadeer, I.; Ghosh, S.M. COVID-19: Beyond Biological Dynamics. Soc. Chang. 2020, 50, 359–384. [Google Scholar] [CrossRef]
- Sun, K.; Wang, W.; Gao, L.; Wang, Y.; Luo, K.; Ren, L.; Zhan, Z.; Chen, X.; Zhao, S.; Huang, Y.; et al. Transmission heterogeneities, kinetics, and controllability of SARS-CoV-2. Science 2021, 371, eabe2424. [Google Scholar] [CrossRef]
- Correia, P.; Mendes, I.; Pereira, S.; Subtil, I. The Combat against COVID-19 in Portugal: How State Measures and Data Availability Reinforce Some Organizational Values and Contribute to the Sustainability of the National Health System. Sustainability 2020, 12, 7513. [Google Scholar] [CrossRef]
- Correia, T. The political management of COVID-19 in Portugal: Analytical insights for the international debate. SciELO 2020. preprints. [Google Scholar] [CrossRef]
- Direção Geral da Saúde. Dados Epidemiológicos COVID. Available online: https://covid19estamoson.gov.pt/estado-epidemiologico-covid19-portugal (accessed on 2 September 2022).
- Ferreira, D.C.; Graziele, I.; Marques, R.C.; Gonçalves, J. Investment in drinking water and sanitation infrastructure and its impact on waterborne diseases dissemination: The Brazilian case. Sci. Total Environ. 2021, 779, 146279. [Google Scholar] [CrossRef]
- Pereira, M.A.; Ferreira, D.C.; Figueira, J.R.; Marques, R.C. Measuring the efficiency of the Portuguese public hospitals: A value modelled network data envelopment analysis with simulation. Expert Syst. Appl. 2021, 181, 115169. [Google Scholar] [CrossRef]
- Nunes, A.M.; Ferreira, D.C. The health care reform in Portugal: Outcomes from both the New Public Management and the economic crisis. Int. J. Health Plan. Manag. 2018, 34, 196–215. [Google Scholar] [CrossRef] [Green Version]
- Harding, A.; Preker, A. Undestanding Organizational Reform: The Corporatization of Public Hospitals; World Bank: Washington, DC, USA, 2000; pp. 38–42. [Google Scholar]
- Nunes, A.M.; Ferreira, D.C.; Fernandes, A.C. Financial Crisis in Portugal: Effects in the Health Care Sector. Int. J. Health Serv. 2019, 49, 237–259. [Google Scholar] [CrossRef] [Green Version]
- Volacu, A. Justice, Efficiency, and the New Public Management. Aust. J. Public Adm. 2017, 77, 404–414. [Google Scholar] [CrossRef]
- Abrate, G.; Boffa, F.; Erbetta, F.; Vannoni, D. Voters’ Information, Corruption, and the Efficiency of Local Public Services. Sustainability 2018, 10, 4775. [Google Scholar] [CrossRef] [Green Version]
- Mailloux, D.; Lacharité, C. Beyond new public management: Empowering community-based organisations. J. Community Psychol. 2020, 48, 2571–2588. [Google Scholar] [CrossRef]
- Nunes, A. Reformas na Gestão Hospitalar: Análise dos efeitos da empresarialização. Ph.D. Thesis, Health Administration at University of Lisbon, Lisbon, Portugal, 2016. [Google Scholar]
- Hood, C. A public management for all seasons? Public Adm. 1991, 69, 3–19. [Google Scholar] [CrossRef]
- Propper, C.; Wilson, D.; Burgess, S. Extending Choice in English Health Care: The Implications of the Economic Evidence. J. Soc. Policy 2006, 35, 537–557. [Google Scholar] [CrossRef]
- Ellis, R.P. Creaming, skimping and dumping: Provider competition on the intensive and extensive margins. J. Health Econ. 1998, 17, 537–555. [Google Scholar] [CrossRef] [PubMed]
- Instituto Nacional de Estatística. Persons Employed (No.) in Public Hospitals. Available online: https://www.ine.pt/xportal/xmain?xpid=INE&xpgid=ine_indicadores&indOcorrCod=0008117&contexto=bd&selTab=tab2&fbclid=IwAR1GNZcJO-nIUpjczks-EgPwKTjzebgXxWl93TxxpBdUc2GlkrbGKMZdXsc (accessed on 6 October 2022).
- de Contas, T. COVID-19—Impacto na Atividade e no Acesso ao SNS. Relatório n.º 5/2020—2.º secção; Tribunal de Contas: Lisbon, Portugal, 2020. [Google Scholar]
- Movimento Saúde em Dia. Indicadores de Acesso. Available online: https://www.saudeemdia.pt/?p=indicadores (accessed on 6 October 2022).
- Ferreira, D.; Marques, R.C. Did the corporatization of Portuguese hospitals significantly change their productivity? Eur. J. Health Econ. 2014, 16, 289–303. [Google Scholar] [CrossRef] [PubMed]
- Kohl, S.; Schoenfelder, J.; Fügener, A.; Brunner, J.O. The use of Data Envelopment Analysis (DEA) in healthcare with a focus on hospitals. Health Care Manag. Sci. 2019, 22, 245–286. [Google Scholar] [CrossRef]
- Rego, G.; Nunes, R.; Costa, J. The challenge of corporatisation: The experience of Portuguese public hospitals. Eur. J. Health Econ. 2010, 11, 367–381. [Google Scholar] [CrossRef]
- Murthy, S.; Clapp, J.T.; Burson, R.C.; Fleisher, L.A.; Neuman, M.D. Physicians’ perspectives of prognosis and goals of care discussions after hip fracture. J. Am. Geriatr. Soc. 2022, 70, 1487–1494. [Google Scholar] [CrossRef]
- Donabedian, A. Evaluating the quality of medical care. Milbank Meml. Fund Q. 1966, 44, 166–206. [Google Scholar] [CrossRef] [Green Version]
- Brent, L.; Ferris, H.; Sorensen, J.; Valentelyte, G.; Kelly, F.; Hurson, C.; Ahern, E. Impact of COVID-19 on hip fracture care in Ireland: Findings from the Irish Hip Fracture Database. Eur. Geriatr. Med. 2022, 13, 425–431. [Google Scholar] [CrossRef]
- Sleiwah, A.; Nair, G.; Mughal, M.; Lancaster, K.; Ahmad, I. Perioral pressure ulcers in patients with COVID-19 requiring invasive mechanical ventilation. Eur. J. Plast. Surg. 2020, 43, 727–732. [Google Scholar] [CrossRef]
- Pitiriga, V.; Kanellopoulos, P.; Bakalis, I.; Kampos, E.; Sagris, I.; Saroglou, G.; Tsakris, A. Central venous catheter-related bloodstream infection and colonization: The impact of insertion site and distribution of multidrug-resistant pathogens. Antimicrob. Resist. Infect. Control. 2020, 9, 189. [Google Scholar] [CrossRef]
- Pérez-Granda, M.J.; Carrillo, C.S.; Rabadán, P.M.; Valerio, M.; Olmedo, M.; Muñoz, P.; Bouza, E. Increase in the frequency of catheter-related bloodstream infections during the COVID-19 pandemic: A plea for control. J. Hosp. Infect. 2022, 119, 149–154. [Google Scholar] [CrossRef]
- Nyquist, P.; Bautista, C.; Jichici, D.; Burns, J.; Chhangani, S.; DeFilippis, M.; Goldenberg, F.D.; Kim, K.; Liu-DeRyke, X.; Mack, W.; et al. Prophylaxis of Venous Thrombosis in Neurocritical Care Patients: An Evidence-Based Guideline: A Statement for Healthcare Professionals from the Neurocritical Care Society. Neurocrit. Care 2016, 24, 47–60. [Google Scholar] [CrossRef]
- Sauro, K.M.; Soo, A.; Kramer, A.; Couillard, P.; Kromm, J.; Zygun, D.; Niven, D.J.; Bagshaw, S.M.; Stelfox, H.T. Venous Thromboembolism Prophylaxis in Neurocritical Care Patients: Are Current Practices, Best Practices? Neurocrit. Care 2019, 30, 355–363. [Google Scholar] [CrossRef]
- Middeldorp, S.; Coppens, M.; Van Haaps, T.F.; Foppen, M.; Vlaar, A.P.; Müller, M.C.A.; Bouman, C.C.S.; Beenen, L.F.M.; Kootte, R.S.; Heijmans, J.; et al. Incidence of venous thromboembolism in hospitalized patients with COVID-19. J. Thromb. Haemost. 2020, 18, 1995–2002. [Google Scholar] [CrossRef]
- Cataldo, M.A.; Tetaj, N.; Selleri, M.; Marchioni, L.; Capone, A.; Caraffa, E.; Di Caro, A.; Petrosillo, N. Incidence of bacterial and fungal bloodstream infections in COVID-19 patients in intensive care: An alarming “collateral effect”. J. Glob. Antimicrob. Resist. 2020, 23, 290–291. [Google Scholar] [CrossRef]
- Bonazzetti, C.; Morena, V.; Giacomelli, A.; Oreni, L.; Casalini, G.; Galimberti, L.R.; Bolis, M.; Rimoldi, M.; Ballone, E.; Colombo, R.; et al. Unexpectedly High Frequency of Enterococcal Bloodstream Infections in Coronavirus Disease 2019 Patients Admitted to an Italian ICU: An Observational Study. Crit. Care Med. 2021, 49, e31–e40. [Google Scholar] [CrossRef]
- Ferreira, D.C.; Marques, R.C. Should inpatients be adjusted by their complexity and severity for efficiency assessment? Evidence from Portugal. Health Care Manag. Sci. 2016, 19, 43–57. [Google Scholar] [CrossRef]
- Herr, A. Cost and technical efficiency of German hospitals: Does ownership matter? Health Econ. 2008, 17, 1057–1071. [Google Scholar] [CrossRef]
- Amado, G.C.; Ferreira, D.C.; Nunes, A.M. Vertical integration in healthcare: What does literature say about improvements on quality, access, efficiency, and costs containment? Int. J. Health Plan. Manag. 2022, 37, 1252–1298. [Google Scholar] [CrossRef]
Figure 1.
Serial model for hospital performance assessment.

Figure 2.
Flowchart of data collection and curation.

Figure 3.
Evolution of the patients’ average complexity measured with the average delay and for the same baseline.
Figure 3.
Evolution of the patients’ average complexity measured with the average delay and for the same baseline.

Figure 4.
Evolution of hospitals’ average efficiency and effectiveness per group (B, C, D, and E).

Figure 5.
Statistical distributions of efficiency and effectiveness per group (B, C, D, and E).

Figure 6.
Evolution of hospitals’ average overall performance per group (B, C, D, and E).


Table 1.
Variables considered in the current study.
| Variable | Description and Rationale |
|---|---|
| Inputs | |
| x1, Hospital days | Total number of days spent by all inpatients in the hospital wards. Other authors, like Ferreira and Marques [29], have already considered the number of hospital days as an input, although others may disagree (for a survey, please see Kohl et al. [30]). In line with the former, we argue that time in the ward is a resource needed to treat inpatients. We should note that beds and hospital wards are rivalrous resources, which means that the more time one inpatient stays in bed, the fewer additional patients can be admitted. Additionally, more time in the hospital ward may encompass other risks like nosocomial infections. |
| x2, Beds | Total beds used in all hospital wards. This variable is a standard input in most studies and can reflect the hospital size and investment in other equipment (see, e.g., Rego et al. [31]). |
| x3, Days before surgery | Total number of days all admitted patients stay in the hospital wards waiting for major scheduled surgery. In line with the rationale behind the choice of hospital days, efficient hospitals have fewer days before surgery. To our knowledge, this variable was never used before in hospital performance assessment. |
| x4, Doctors working time | Total number of hours (ordinary and extraordinary) worked by all medical doctors. |
| x5, Nurses working time | Total number of hours (ordinary and extraordinary) worked by all nurses. |
| Outputs | |
| y1, Number of standard patients | Total number of patients (both inpatients and outpatients) seen in the hospital, adjusted for their complexity and severity to become equivalent (standard). This variable can be seen as an aggregated hospital activity and production measure. It makes the comparison between hospitals under different conditions fairer as it is done on a common (national) basis. |
| Desirable outcomes | |
| d1, Number of first medical appointments within the legally defined time | In Portugal, outpatients can only have access to medical appointments in the hospital through the emergency department or by reference letters from the family doctor at the primary care level. However, the Portuguese State has defined a maximum legal time such that hospitals must schedule the first medical appointment once the reference letter has been received. That way, the timeliness of services is expected to improve as patients wait less for an appointment. The closer the number of first medical appointments within the legally defined time is to the effective number of first medical appointments, the timelier the hospital is. |
| d2, Number of registers on the surgery waiting list within the legally defined time | As in the case of first medical appointments, there is a maximum legal time for registering and scheduling surgeries (either minor or major). |
| d3, Number of hip surgeries in the first 48 h after fracture | This variable measures the number of patients over 65 years old with hip surgery in the first 48 h after a fracture. This event has long been reported as a significant cause of geriatric in-hospital mortality. The American Academy of Orthopedic Surgeons suggests a limit of two days for hip surgery to prevent complications like hospital-acquired infections [32]. |
| d4, Number of inpatients without adverse events | This variable refers to the total number of patients seen that did not suffer any preventable adverse event during treatment (especially during their stay in hospital), including but not limited to septicemia, bloodstream infections, thromboembolisms, bedsores, and death. Although we could not assess whether the patients’ quality of life has improved (i.e., the results as for the Donabedian’s model; see Donabedian [33]), this variable can capture whether the care process was well conducted, i.e., care was safe and appropriate, following evidence-based guidelines. |
| Undesirable outcomes | |
| u1, Number of delayed first medical appointments | This variable results from subtracting the number of timely first appointments (d1) from the total first appointments. Therefore, they measure the number of first appointments delayed beyond what is legally defined. It constitutes a significant barrier to secondary care because the entry can only result from two ways: the emergency room or referral from the primary care level. Scheduled surgeries, for instance, can only be performed after the first medical appointment. Therefore, delays in first medical appointments result in downstream delays, worrying should the patient’s condition be severe. In Portugal, the average rate of delayed first medical appointments increased from 26.7% (2017, 2018, and 2019) to 36.9% in 2020, i.e., more than 10%. In 2021 and 2022, that average decreased to 23.7%, i.e., 3% smaller than in the pre-pandemic period. Still, the meaningful increase between 2019 and 2020 can be explained by the constraints imposed to prevent the outbreak, which had perverse effects, bounding the access to those that demanded hospital care. |
| u2, Number of registers on surgery waiting list beyond the legally defined time | As in the previous case, delays in registering patients for surgery constitute a barrier to hospital care. In Portugal, the average rate of delayed registrations for the surgery waiting list was 26.8% (2017–2019), 34.7% (2020), and 25.9% (2021–2022). The 7.9% increase between 2019 and 2020 is meaningful and worrying, once more explained by the restrictive policies to limit the virus spread. |
| u3, Number of readmitted cases after 30 days of inpatient discharge | Readmitting inpatients after discharging them is, in most cases, the result of poor care, e.g., the inpatient was inappropriately discharged or was not correctly informed about home care. Generally, the inpatient is in a more severe and complex clinical scenario when readmitted than was during the first admission and, for that reason, demands more resources. In Portugal, the average rate of readmissions after 30 days was 8.19% (2017–2019), 7.43% (2020), and 6.40% (2021–2022). Despite the observed drop in readmission rates, differences are not statistically significant (Kruskal-Wallis test: p = 2.32 × 10−81). |
| u4, Number of hip surgeries beyond 48 h after fracture | As mentioned earlier, two days is the recommended time limit for patient presentation for hip surgery, especially when the patient is 65 years old or older. Brent et al. [34] observed a 15% reduction in admissions for hip surgery and a decrease in compliance with many surgery standards following the COVID-19 pandemic in Ireland. In Portugal, the hip surgery rate beyond the appropriate time was, on average, 54.4% (2017–2019), 53.0% (2020), and 51.1% (2021–2022), without expressive differences. Therefore, it seems that the outbreak did not impact this variable in the light of statistical evidence. |
| u5, Number of avoidable bedsore cases | Pressure ulcers are skin or underlying tissues injuries commonly found in low-mobility patients spending most of their in-hospital time laying on their beds. These injuries jeopardize the patient’s safety. Evidence suggests that COVID-19 patients admitted to intensive care units are prone to the development of this type of injury in the head, neck, and respiratory system, e.g., because of the use of devices to secure endotracheal tubes [35]. In Portugal, the bedsore rate was, on average, 0.0007 (2017–2019), 0.0010 (2020), and 0.0011 (2021–2022) per 100,000 inpatients, without expressive differences. As before, we found no evidence suggesting that outbreak impacted this dimension. |
| u6, Number of avoidable bloodstream infections | Bloodstream infections result from bacteremia present in not properly sterilized intravenous catheters, which is a leading cause of in-hospital mortality [36]. The literature suggests that the COVID-19 pandemic may have led to an increase in the frequency of catheter-related bloodstream infections [37], which can be linked to the harsh circumstances in hospital workplace. In Portugal, the average rate of avoidable bloodstream infections raised from 0.01% in 2017–2019 to 0.03% in 2020, which remained unchanged in the period 2021–2022. However, these differences are not statistically significant (Kruskal-Walis test: p = 1.13 × 10⁻⁹), suggesting that the difficult conditions in which hospital staff were working during the pandemic may not have conditioned the patients’ safety, having been adopted good medical and nursing practices. |
| u7, Number of avoidable postoperative pulmonary embolisms | A pulmonary embolism occurs mostly after a major surgery or a major injury, when a blood clot forms in a deep vein and breaks loose traveling through bloodstream to the lungs, resulting in several in-hospital preventable events including lack of oxygen in organs and tissues, and ultimately death [38,39]. The literature suggests an increase of pulmonary embolism events and thromboembolisms because of the systemic coagulation activation and thrombotic complications resulting from COVID-19 infections [40]. In Portugal, the average rates of post-operative pulmonary embolisms were 189.4 (2017–2019), 292.3 (2020), and 296.9 (2021–2022) per 100,000 inpatients. |
| u8, Number of septicemia cases | Hospital-acquired infections by bacteria, viruses, or fungi, mostly because of poor materials cleanliness, are called septicemia or nosocomial infections, and seriously compromise the patients’ safety during their stay in the hospital ward. During the COVID-19 this type of infections may have increased because of ventilator-associated pneumonia and bacteremia [41,42]. In Portugal, the average rates of post-operative septicemia cases were 537.0 (2017–2019), 655.6 (2020), and 760.9 (2021–2022) per 100,000 inpatients. These differences are statistically significant (Kruskal-Wallis test: p = 0.0054), which means that the increase of these infections during the pandemic period was meaningful and worrying. |
Table 2.
The number of observations in the dataset per group.
| 2017 | 2018 | 2019 | 2020 | 2021 | 2022 | Total | |
|---|---|---|---|---|---|---|---|
| Group B | 95 | 106 | 107 | 108 | 108 | 45 | 569 |
| Group C | 179 | 179 | 180 | 180 | 177 | 74 | 969 |
| Group D | 96 | 96 | 95 | 96 | 96 | 40 | 519 |
| Group E | 72 | 72 | 72 | 72 | 69 | 29 | 386 |
| Total | 442 | 453 | 454 | 456 | 450 | 188 | 2443 |
Table 3.
Observational and virtual data.
| Observational Data | Virtual Data | |
|---|---|---|
| Inputs | x | x |
| Outputs | y | y |
| Desirable outcomes | d | d + u |
| Undesirable outcomes | u | 0 |
Disclaimer/Publisher’s Note: The statements, opinions and data contained in all publications are solely those of the individual author(s) and contributor(s) and not of MDPI and/or the editor(s). MDPI and/or the editor(s) disclaim responsibility for any injury to people or property resulting from any ideas, methods, instructions or products referred to in the content. |
© 2022 by the authors. Licensee MDPI, Basel, Switzerland. This article is an open access article distributed under the terms and conditions of the Creative Commons Attribution (CC BY) license (https://creativecommons.org/licenses/by/4.0/).
Share and Cite
MDPI and ACS Style
Nunes, A.M.; Ferreira, D.F.d.C. Evaluating Portuguese Public Hospitals Performance: Any Difference before and during COVID-19? Sustainability 2023, 15, 294. https://0-doi-org.brum.beds.ac.uk/10.3390/su15010294
AMA Style
Nunes AM, Ferreira DFdC. Evaluating Portuguese Public Hospitals Performance: Any Difference before and during COVID-19? Sustainability. 2023; 15(1):294. https://0-doi-org.brum.beds.ac.uk/10.3390/su15010294
Chicago/Turabian StyleNunes, Alexandre Morais, and Diogo Filipe da Cunha Ferreira. 2023. "Evaluating Portuguese Public Hospitals Performance: Any Difference before and during COVID-19?" Sustainability 15, no. 1: 294. https://0-doi-org.brum.beds.ac.uk/10.3390/su15010294
Note that from the first issue of 2016, this journal uses article numbers instead of page numbers. See further details here.