
The Portuguese Public Hospitals Performance Evolution before and during the SARS-CoV-2 Pandemic (2017–2022)

1
Business and Economic School, Instituto Superior de Gestão, Av. Mal. Craveiro Lopes 2A, 1700-284 Lisbon, Portugal
2
CEG-IST, Instituto Superior Técnico, University of Lisbon, Av. Rovisco Pais 1, 1040-001 Lisbon, Portugal
3
Centre for Local Government, UNE School of Business, University of New England, Armidale, NSW 2350, Australia
4
CEFAGE, Faculdade de Economia, Universidade do Algarve, Campus of Gambelas, 8005-139 Faro, Portugal
*
Author to whom correspondence should be addressed.
Sustainability 2023, 15(15), 11572; https://0-doi-org.brum.beds.ac.uk/10.3390/su151511572
Submission received: 7 March 2023
/
Revised: 18 July 2023
/
Accepted: 21 July 2023
/
Published: 26 July 2023
(This article belongs to the Special Issue Multicriteria Decision Analysis and the Sustainability of Public Systems Worldwide)
Abstract
:COVID-19 is a disease caused by SARS-CoV-2, which has spread worldwide since the beginning of 2020. Several pharmaceutical and non-pharmaceutical strategies were proposed to contain the virus, including vaccination and lockdowns. One of the consequences of the pandemic was the denial or delay of access to convenient healthcare services, but also potentially the increase in adverse events within those services, like the number of hospital infections. Therefore, the main question here is about what happened to the performance of Portuguese public hospitals. The main goal of this work was to test if the Portuguese public hospitals’ performance has been affected by the SARS-CoV-2 pandemic. We used the Benefit-of-Doubt method integrated with the Malmquist Index to analyze the performance evolution over time. Then, we employed a multiple regression model to test whether some pandemic-related variables could explain the performance results. We considered a database of 40 Portuguese public hospitals evaluated from January 2017 to May 2022. The period 2017 to 2019 corresponds to the baseline (pre-pandemic), against which the remaining period will be compared (during the pandemic). We also considered fourteen variables characterizing hospital quality, divided into three main performance definitions (efficiency and productivity; access; safety and care appropriateness). As potential explanatory variables, we consider seven dimensions, including vaccination rate and the need for intensive care for COVID-19-infected people. The results suggest that COVID-19 pandemic features help explain the drop in access after 2020, but not the evolution of safety and appropriateness of care, which surprisingly increased the whole time.
1. Introduction
COVID-19 is a respiratory disease caused by the SARS-CoV-2 virus belonging to the coronavirus family, a major threat to public health worldwide [1]. Symptoms of the infection in humans by this type of virus range from upper respiratory tract infections (as in a common cold) to severe acute respiratory syndrome, pneumonia, and bronchitis [2]. Elders, children, immunosuppressed people, and those with weak immunologic systems usually express a more severe form of the disease when they get infected, which may result in death [3]. The virus was first identified in Wuhan city, China, in January 2020 [4]. It soon spread all over the globe, primarily because of most governments’ inability to control their own countries’ borders [5]. By August 2022, 32 months after its discovery, COVID-19 had infected over 586 million people worldwide, of whom 6.42 million have passed away (death rate of about 1.1%). In the same time, about 62.6% of people worldwide were fully vaccinated by the end of December 2020, 12.4 billion doses having been administered (Data retrieved from the “Our World in Data” website, a project of the Global Change Data Lab founded by Max Roser and based at the University of Oxford. Website: https://ourworldindata.org/explorers/coronavirus-data-explorer, accessed on 10 December 2022). The development of COVID-19 vaccines has accelerated since the World Health Organization declared a pandemic in March 2020 [6,7]. After conducting a literature review and meta-analysis, Zheng et al. [8] concluded that these vaccines, especially the Pfizer-BioNTech and Moderna vaccines, are highly protective against SARS-CoV-2 virus-related diseases in real-world settings. However, there are still about one million new infections and over three thousand deaths daily (August 2022), a worrying figure resulting perhaps from the relatively low rate of people fully vaccinated.
The first patient infected with SARS-CoV-2 in Portugal was detected in March 2020. Since then, over half of the country’s population has been infected: in August 2022, there were 5.37 million Portuguese citizens infected, with 24,707 COVID-19-related deaths. This corresponds to an average death rate of 0.46%, far below the world average. One can attribute part of this success in saving lives or avoiding COVID-19-related mortality (compared to peers) to some sequential strategies implemented, including lockdowns [9], limitation of access to essential services like hospital care, and massive testing and vaccination, despite a low adherence/high hesitance at the beginning [10]. Compared to the global average, Portugal has performed well regarding vaccination. In total, 86.4% of Portuguese citizens are fully vaccinated against SARS-CoV-2, 24.8 million doses having been administered so far (August 2022). Perhaps because this high rate, most stringency measures taken to limit the outbreaks were lifted in early 2022. Still, Portugal is amongst the countries with the highest infection rates, which does not seem to worry the Portuguese Ministry of Health, given the high full vaccination rate achieved.
Although beneficial to containing the virus, blocking access to healthcare services was not without adverse effects on citizens’ quality of life. Medical appointments, surgeries, exams, and other treatments in primary and secondary healthcare levels were postponed, and admission to emergency rooms and other hospital services was limited to those severely ill. However, denying or delaying care to those searching for it will eventually cause the exacerbation of their illnesses, which become more complex to treat and, ultimately, costlier. This fact jeopardizes the Portuguese publicly available National Health Service’s (already weakened) financial and social sustainability. In addition, the barriers created for entering the health system could have contributed to the increase in excess mortality, not directly related to COVID-19. For instance, the non-COVID-19 excess mortality in Portugal fluctuated between 51% and 92% in 2020 [11].
Any healthcare provider, hospitals included, aims at improving patients’ quality of life while being economically, socially, and environmentally sustainable [12]. In Portugal, given the universal and general nature of its National Health Service (NHS), these providers must be capable of treating all patients efficiently without denying them timely, appropriate, evidence-based, and safe care services, equitably and regardless of the patients’ purchasing power [13]. Excellence or quality in healthcare provision is achieved when all these aspects are met, i.e., when providers are efficient and effective in treating their patients, and there are no barriers to access. Meanwhile, managers should be held responsible for the poor or good healthcare results regarding both resource consumption and response to society [14].
It should be evident that the effects of a pandemic on hospital performance may not be the entire responsibility of its managers and staff. Part of the results during such a period result from policy measures imposed at the central, regional/federal, or local levels, but also from other factors non-discretionary to hospital managers. Nevertheless, one must assess hospital quality results to search for best practices, i.e., the resilient entities that kept or even improved their performance during the difficult times of the most recent known pandemic. By doing so, hospitals with poor outcomes may adopt and adapt those practices to improve their own, hopefully becoming more resilient in future outbreaks [15]. Also, the design and implementation of good contingency plans could contribute to a quicker response by these players, avoiding events like the overload and saturation of health systems’ resources in the early stages of a pandemic [16]. With this study, we do not aim at demerit hospitals with poor performance during pandemic times.
Several studies have been published on this topic, evaluating the performance of hospitals or healthcare systems [17,18,19]. Besides the fact that most studies we found are focused on comparing countries or states (leaving a considerable gap in the literature), researchers seem more interested in the technical efficiency of resource utilization rather than effective results in healthcare. Most results derived concern the first year of the pandemic, while more than twenty months have passed since. Given the growth rates of infected cases and mortality because of COVID-19, it is difficult to understand whether the results are already outdated. In our perspective, evaluating hospital performance requires efficiency and effectiveness analyses in a time range broader than one year to check if low-quality hospitals remain as such during the pandemic, or if high-quality hospitals become less resilient, worsening their health results. No study before this has tried to understand if changes in hospital performance could be affected by COVID-19-specific spread features. Moreover, only a few studies have been concerned about the quality of care or access to hospital services [19]. This being one of our goals, it is clearly an innovation.
Additionally, one must account for the fact that hospitals do not all operate in the same environment, and some are impaired because of the hazardous conditions in which they operate. Allegedly, the earlier studies seem to have overlooked this important aspect. However, an adjustment mechanism should be developed for hospital benchmarking. This is another innovation as, to the best of our knowledge, no other study has conducted a benchmarking exercise of hospitals during the COVID-19 pandemic with a correction or adjustment for the non-discretionary operational environment.
The objectives of this study are fourfold: first, to estimate an aggregated measure of the hospitals’ quality-based performance individually, with a correction for the operational environment and using benchmarking; second, to compare performance results and evaluate a trend; third, to investigate whether the hospital quality worsened because of the outbreak of SARS-CoV-2; fourth, to test if the disease-spreading features (e.g., reproduction rate, hospital admissions due to COVID-19 per million inhabitants) help to explain the estimated performance evolution. To estimate the quality-based performance, we have used variables like the rate of appointments or surgeries within the legal time, the prevalence of undesirable events within the hospital ward (including, but not limited to, the cases of septicemia or pulmonary embolisms), and even the efficiency of resource usage (including the occupancy of beds and the number of patients per doctor or nurse). Finally, the environmental variables, not controllable by the hospital management, were related to COVID-19 spreading, and include the infection rate, the mortality rate, and the rate of hospital admissions related to COVID-19 infection.
Based on these objectives, we have formulated three main research questions and two hypotheses per question. In line with the paper’s primary goal, these research questions are linked to hospital performance before and during the COVID-19 pandemic. We consider the period before (January 2017 to February 2020) as a baseline to which we can compare the results of the next time interval (March 2020 to May 2022). By the time we wrote this paper (December 2022/January 2023), the pandemic was not considered extinct. Thus, comparing hospital performance before, during, and after the pandemic is impossible. As commonly done in statistics, we state our null hypotheses considering that there is a chance that hospitals may have worsened their performance during the outbreaks, but there is also a chance that they have improved it, at least in some performance dimensions. In other words, we assume the absence of performance change over time in the null hypothesis, and search for evidence disproving it. This is because there are no solid theoretical suggestions concerning this topic. That is, the research questions (Ri) and corresponding null (H0) and alternative (H1) hypotheses are as follows:
(R1) How did the static performance of Portuguese public hospitals evolve from January 2017 to May 2022?
H0(R1):
The static performance of Portuguese public hospitals did not change in the considered period.
H1(R1):
Portuguese public hospitals’ static performance changed in that period.
(R2) How did the dynamic performance of Portuguese public hospitals grow from January 2017 to May 2022?
H0(R2):
The dynamic performance of Portuguese public hospitals did not change in the considered period.
H1(R2):
Portuguese public hospitals’ dynamic performance changed in the period.
(R3) Can SARS-CoV-2-related indicators justify the performance evolution in Portuguese public hospitals?
H0(R3):
SARS-CoV-2 does not influence the performance evolution of Portuguese public hospitals.
H1(R3):
SARS-CoV-2 influenced the performance evolution of Portuguese public hospitals.
Please note that, in our study, the static performance concerns the efficiency and access to safe and appropriate hospital care at each moment. There is an empirical frontier (that should be close to a theoretical one) where benchmarks or best practices are placed. The greater the distance to the frontier, the lower the performance level. The hospital performance will be static should the frontier be constructed using data of just one moment (one year or month). When evaluating the performance evolution over time, one must account for two potential scenarios: frontier and hospital shifts. A change in hospital position regarding the frontier (regardless of the frontier shift) constitutes a static performance evolution. However, benchmarks themselves may also change their positions with time, improving or worsening their performance. That way, the frontier will likely shift alongside the benchmarks. The relative position of two frontiers constructed using data from two instants constitutes the dynamic performance.
The reminder of this manuscript is set out as follows. Section 2 contains a comprehensive literature review of the works dealing with the performance of healthcare systems concerning fighting against SARS-CoV-2 and its impacts on healthcare provision. Section 3 presents the materials and methods used in this work. Particularly, we define quality in healthcare provision, given the complexity of this concept. Then, we identify the main variables used to quantify the performance of Portuguese hospitals, which resulted mainly from the literature review undertaken, as well as the data availability in the official sources. The evolution of these variables in the Portuguese public hospitals context is also described. Once these variables have been identified and characterized, we highlight the quantitative methods utilized to construct a composite indicator capable of describing and quantifying the hospitals’ performance before and during the pandemic. We also identify a relational model and non-discretionary variables to try to explain the performance evolution. In Section 3, case studies and the figures related to COVID-19 in Portugal are described as well. Section 4 presents the main results concerning the main topics that characterize quality in healthcare: efficiency and productivity, access, and safety and care appropriateness. Section 5 discusses these findings, and finally, Section 6 concludes this document with the main lessons learned.
2. Literature Review
Several studies have been published on this topic, evaluating the performance of hospitals or healthcare systems. Concerning the former scenario, Nepomuceno et al. [17] used a Data Envelopment Analysis (DEA) model for hospital bed vacancy and reallocation during the COVID-19 pandemic. That way, the authors communicated the existence of 3772 beds able to be evacuated by 64% of health units. Kamel and Mousa [18] estimated the operational efficiency of isolation hospitals in Egypt. They found that less than half of the sample achieved efficiency, and the results were explained more by the numbers of nurses and beds than by the numbers of medical doctors. Through a value-based DEA model, Henriques and Gouveia [19] assessed the outbreak’s impact on the efficiency of Portuguese state-owned enterprise hospitals. They reported that a lack of resources does not explain inefficiency levels.
There are several other studies comparing countries or states within one country [20,21,22,23,24,25,26]. Aydin and Yurdakul [20] integrated machine learning (ML) with a stochastic imprecise DEA model to assess the performance of 142 countries against the COVID-19 outbreak. In short, the machine learning techniques included clustering analyses with k-means and hierarchical clustering methods. The authors found that gross domestic product, smoking rates, and the rate of diabetic patients do not explain the effectiveness level of countries. Taherinezhad and Alinezhad [21] also integrated ML with DEA to evaluate nations’ performance during the outbreak. Ibrahim et al. [22] utilized DEA for a country efficiency analysis and concluded that nearly 90% of studied countries were inefficient in pandemic control, and 80% were inefficient during the treatment of positive cases. Using an inverted DEA model, Ferraz et al. [23] constructed a COVID-19 index for Brazil’s microregions; unsurprisingly, the poorest regions are the most vulnerable. Differently, Mariano et al. [24] used the Network-DEA (NDEA) to analyze the regional discrepancies within the same country, having identified the state of Amazonas as the least efficient. Similarly, Hamzah et al. [25] also used an NDEA model to investigate the relative efficiency level while managing COVID-19 in Malaysia. The authors verified the good overall performance of the Malaysian health system, reflecting the robust preparedness and rapid reallocation of resources during the outbreak. Also resorting to the DEA model, Klumpp et al. [26] compared the performances of countries within the OECD, and found that systems oriented to primary care were more efficient than others. In opposition, healthcare systems that are highly dependent on public funding and heavily regulated were less efficient.
Researchers on hospital performance tend to consider population demographics and epidemiology variables to characterize the operational environment [27]. Pecoraro et al. [28] analyzed and compared the efficiency of ordinary hospital bed management in France, Germany, Italy, and Spain. The authors concluded that the structural components of these countries explain part of the pressure in hospital systems during pandemics. These structural components included the heterogeneity of COVID-19 case distribution and the availability of beds. Concerning the first component, it is worth mentioning that the distribution of cases is linked to some population characteristics, particularly the education level, related to compliance with the implemented sanitary measures. For instance, Carlucci et al. [29] concluded that women, most educated people, middle-aged individuals, and health workers are more likely to adhere to lockdowns and other imposed policies. Jabbari et al. [30] and Oyeyemi et al. [31] reached similar conclusions, indicating that people’s education (health literacy) plays a vital role in containing outbreaks. Furthermore, the success of hospitals largely depends on the complexity of cases handled therein [32]. Concerning COVID-19, evidence has suggested that aging, gender, chronic underlying disease (like hypertension and diabetes mellitus), mental status impairment, length of hospital stay, and high risk of acute deterioration are risk factors associated with unfavorable outcomes [33,34]. It should be evident that hospitals in areas with higher rates of chronic diseases or older/less educated populations face worsen conditions in treating their patients.
3. Materials and Methods
3.1. Quality in Health (Hospital) Care
3.1.1. Definition of Quality in Health (Hospital) Care
Measuring the performance of hospitals is not an easy task. Indeed, it is necessary to consider all possible dimensions of hospital care and how they interact to reach the hospital’s primary goal: to improve the patient’s quality of life while keeping the operations financially and environmentally sustainable [35]. Meanwhile, quality of life is another quasi-transcendent concept resulting from health- and non-health-related dimensions [36]. Concerning the capacity of hospitals (or any other healthcare entity) to improve patients’ quality of life, those dimensions are primarily associated with the results (e.g., the patient lives or dies after surgery), but also with the process of care (e.g., the patient suffered a septicemia event in the nursery) and hospital attributes (e.g., facilities are clean and technology-updated)—see Ferreira, Marques, Nunes and Figueira [37]. Overall, such a capacity is inherently linked to the quality of care [38,39,40], ultimately leading to patient (dis)satisfaction [41] and quality of life. The (North American) Institute of Medicine defines the quality of care using six domains—safety, effectiveness, patient-centeredness, timeliness, efficiency, and equity in access [42,43,44]:
- Safety is the capacity to avoid harm to patients;
- Effectiveness is related to “making the right things”, which in healthcare corresponds to using scientific knowledge to treat patients in the best possible way;
- Patient-centeredness corresponds to human and social skills, necessary in any healthcare treatment, as patients’ needs, beliefs, values, preferences, gender, sexual orientation, and ethnicity must be respected;
- Timeliness is the capacity to provide care whenever the patient needs it, without potentially harmful delays;
- Unlike effectiveness, efficiency (and productivity) is related to “making things right” without wasting resources;
- Equity regards the fairness of resource distribution, as two patients in the same condition should receive equal treatment.
Table 1 provides the correspondence between the main quality domains identified above in the different literature sources. Although the Institute of Medicine divides quality into six items, they are somehow linked to the three quality categories according to Donabedian (attributes, process of care, and results). The attributes are associated with the infrastructure and facilities, thus with the availability of resources, which in turn condition the access to (and timeliness of) the service and its efficiency. Indeed, given the levels of patients in the hospital services, the greater the amount of resources, the better the access, but the lower the efficiency. Thus, a trade-off between these two concepts is expected to arise. The care process concerns all the events that occur between the patient entering the hospital infrastructure and them leaving the system. These events can be adverse (like in-hospital infections) or not, but result primarily from the received care, especially the patient safety (or absence of it) and the patient-centeredness. The latter is heavily linked to care appropriateness. Finally, the care results include improved quality of life and patient satisfaction [45].
3.1.2. Quality Variables
Building on the previous discussion and the definitions given by the Portuguese Ministry of Health itself, we consider the following set of criteria: (1) efficiency and productivity; (2) access; (3) safety; and (4) care appropriateness. Each criterion is operationalized by several indicators that have been extensively used in the literature concerning Portuguese public hospitals; see, e.g., Amado et al. [46], Ferreira, Marques and Nunes [47], Ferreira and Marques [48,49], Pereira et al. [50], Ferreira, Nunes and Marques [51,52], and Pederneiras et al. [12], to name a few. The main justification for these indicators is that they are monitored by the Ministry of Health and figured out in yearly contracts between the hospitals’ management and the ministerial tutelage. For that reason, among many other possible indicators, these appear to be the most relevant to the primary stakeholder [53]. However, since safety and care appropriateness may be interlinked and the boundary between them is not clear, we decided to gather their related indicators in the same groups.
- Efficiency and productivity:
- (a)
- Occupancy rate. This variable indicates the average rate of beds occupied by an inpatient each day (e.g., on an average day, 75 beds out of 150 were occupied; thus, the occupancy rate was 75/150 = 0.5 or 50%). The optimal occupancy rate ranges from 80 to 90%, with 85% frequently deemed as the optimal occupancy rate [54]. Less than 80% indicates the underutilization of beds or excessive resource use (low efficiency). In comparison, an occupancy rate above 90% suggests the overutilization of beds and a lack of this resource for peak events, like during SARS-CoV-2 pandemic outbreaks. Furthermore, high occupancy rates tend to directly influence the incidence of hospital-acquired infections [55];
- (b)
- Standard patients per Full-Time Equivalent (FTE) doctor. This indicator reflects the productivity of hospitals by relating the standardized number of patients seen and a resource (doctors in this case). More patients per FTE doctor means larger hospital productivity (monetization of an asset);
- (c)
- Standard patients per FTE nurse is another productivity indicator with a similar interpretation.
- Access:
- (a)
- Rate of first medical appointments within the legally fixed period. There are two main ways of getting a medical appointment in a Portuguese public hospital—either through the emergency room or via healthcare centers (primary care). For the latter scenario, Portuguese legislation defines the maximum time between the request and the first appointment. This indicator measures how many patients have seen their access to secondary care denied or delayed. The larger the indicator, the better the access to care and, consequently, the better the hospital performance. During the COVID-19 pandemic, many non-urgent medical appointments were canceled, decreasing this indicator (and the access). Accordingly, patients’ health status may have worsened, reducing their quality of life and increasing the costs of future health services (as the severity of illness is positively associated with health expenditures; see Thuong et al. [56]);
- (b)
- Rate of enrolled patients on the waiting list for surgery within the legally prescribed time. As before, there is a maximum legal time for which patients can be enroll on the waiting list for surgery, either major (requiring hospitalization) or minor. A low rate means that patients face difficulties accessing the service they need, i.e., a barrier that may result from administrative processes, bureaucracy, or lack of resources. During the COVID-19 pandemic, most non-urgent surgeries were canceled, meaning that this indicator (and the access) decreased. For instance, Ciarleglio et al. [57] and the COVIDSurg Collaborative [58] reported the harmful effects of COVID-19 and lockdown on emergency and elective surgery due to delayed access;
- (c)
- Average time before surgery. This indicator measures the average number of days the patients stay in the hospital ward after admission until they are surgically operated on in the operating room. More significant average times mean that patients unnecessarily occupy a bed (and other resources) that another patient elsewhere could use;
- (d)
- Rate of hip surgeries within the first 48 h. This indicator quantifies the percentage of geriatric hip surgery within the first 48 h after fracture (out of total hip surgeries). Hip fracture has long been reported as an essential predictor of in-hospital mortality in patients aged 65 years or older [59]. Two days (48 h) of patient presentation is the limit of time recommended by the American Academy of Orthopedic Surgeons for hip surgery [60] to prevent complications. Thus, this indicator is a good proxy for hospital timeliness. Interestingly, Brent et al. [61] observed a 15% reduction in admissions for hip surgery as well as a reduction in compliance with many surgery standards following the COVID-19 pandemic in Ireland.
- Safety and care appropriateness:
- (a)
- Bedsore rate. Bedsores or pressure ulcers are skin or underlying tissue injuries commonly found in low-mobility patients’ heels, ankles, and hips, for those who spend most of their in-hospital time lying on their beds. High rates indicate a considerable probability of bedridden patients developing skin wounds, thus jeopardizing their safety. Challoner et al. [62] mentioned that prone positioning has been employed to treat severe hypoxia in COVID-19 patients, which may constitute a risk of developing pressure ulcers on the head, neck, and genitalia. Sleiwah et al. [63] reported similar findings regarding perioral pressure ulcers resulting from using devices to secure endotracheal tubes in COVID-19 patients admitted to the intensive care units. These results thus suggest that patients’ safety in terms of bedsores may have been compromised during the pandemic;
- (b)
- Rate of in-hospital-developed septicemia (postoperative). This indicator refers to the percentage of septicemia cases developed in-hospital divided by the total inpatients. Septicemia or nosocomial infection is caused by bacteria, viruses, and fungi, and is acquired during hospital ward stays. If developed within the hospital (often in the postoperative period), this event results from the lack of patient safety, primarily the poor cleanliness of materials. Some authors have reported an increase in nosocomially acquired infections during the COVID-19 pandemic, mostly because of ventilator-associated pneumonia and bacteremia [64,65]. Therefore, the literature suggests that this indicator has probably increased, implying that patients’ clinical safety is worsening;
- (c)
- Rate of catheter-related bloodstream infection events. Catheter-related bloodstream infections result from bacteremia in inadequately sterilized intravenous catheters, being a significant cause of nosocomial bacteremia. These costly events and complications may cause high morbidity and mortality [66]. Recently, Pérez-Granda et al. [67] noticed an increase in the frequency of catheter-related bloodstream infections during the COVID-19 pandemic, claiming the need to reinforce classic and new preventive measures to avoid these events. The authors associated the increase in infections with the harsh circumstances (increased workload and use of staff with a sub-optimal degree of training with intensive care patients). However, other authors reached the opposite conclusions, e.g., Heidempergher et al. [68]. That being said, the literature is not clear about the effects of the pandemic on this indicator and, consequently, the hospital’s performance regarding the patients’ safety;
- (d)
- Rate of postoperative pulmonary embolism events and thromboembolisms. Thromboembolisms occur when blood clots form in deep veins and break loose, traveling through the bloodstream, often to the lungs (pulmonary embolism). This event is more likely to occur after major surgeries or injuries. The consequences include blood flow and oxygen restrictions, damaging organs and tissues, and ultimately causing death. Narayan et al. [69] mentioned that hospital-acquired venous thromboembolism is a leading cause of morbidity and mortality, and about one in ten cases is preventable. Meanwhile, this value increases for critically ill patients due to the elevated risk of thrombosis, such as for coma or paralysis patients [70,71]. Schulman [72] mentioned that the best estimates indicate that about half a million Americans each year suffer from pulmonary embolisms. At least one-tenth of a million deaths may be directly or indirectly related to these diseases, which are too many, as this in-hospital death cause is highly preventable. Additionally, COVID-19 can lead to systemic coagulation activation and thrombotic complications [73], resulting in pulmonary embolism events and thromboembolisms. However, a systematic review and meta-analysis conducted by Porfidia et al. [74] showed that the incidence of this disease in COVID-19 patients is unclear;
- (e)
- Rate of performed minor surgeries out of potential minor surgeries. Minor surgeries, such as dental restorations and cataract surgeries, are minimally invasive procedures that do not require an operating theatre or an inpatient service admission. In opposition, major surgeries such as cesarean sections, organ or joint replacements, total hysterectomies, and heart or bariatric surgeries usually involve opening the body and, consequently, major tissue trauma and a more significant risk of infection (worsening the patients’ safety). Recoveries in these cases are more extended than minor surgeries. In many cases, however, one can solve the same problem through minor or major surgery. The best alternative depends on each case, but the benefits are frequently similar. Therefore, the infection risks and recovery period must not be overlooked nor outweighed. Medical guidelines argue that if a patient’s clinical issue could be appropriately solved through minor surgery, one should adopt it instead of a major procedure, so as to reduce the risk of infection and improve recovery. Thus, this performance indicator is such that the closer to 100%, the better the care appropriateness. Baboudjian et al. [75] concluded that minor surgery is still safe in the COVID-19 era if all appropriate protective measures are implemented. This result suggests that there was no significant decrease in the indicator. Although many surgeries were canceled or postponed, the ones that were not could have been minor procedures (whenever appropriate) that limit patient exposure to SARS-CoV-2, hopefully increasing this indicator;
- (f)
- Rate of readmissions within 30 days after discharging. Readmitting patients after releasing them for the same reasons as the first admission results, in many cases, from poor care appropriateness. For instance, the patient was not totally healed and was incorrectly discharged, leaving them to search for healthcare for a while. However, it is usual that the clinical condition has worsened, making the patient’s illness more severe and complex. The literature suggests that 60-day readmission amongst COVID-19 survivors is less likely than that amongst pneumonia or heart failure survivors, but the opposite conclusion concerning the 10-day readmissions was also reached [76]. However, recent studies are more concerned with the readmission of COVID-19 patients than other patients readmitted in the COVID-19 era. Therefore, there is no clear evidence that total readmissions have increased or decreased in this period;
- (g)
- Rate of inpatients staying hospitalized for more than 30 days. Staying in the hospital ward for more time than required dramatically increases the risk of acquiring severe nosocomial infections [77], developing other comorbidities, or even dying. With the pandemic’s development, the risks associated with lengthy stays in the hospital may have increased, jeopardizing the patients’ safety. For instance, the longer the patient stays in the inpatient service, the higher the probability of being infected by SARS-CoV-2; thus, the higher the risk of developing often-fatal bacteria-related hospital-acquired pneumonia [78].
Although neither of these variables are strictly linked to SARS-CoV-2-related hospital admissions, the truth is that the pandemic may have played an important role in delaying and worsening healthcare for other patients that represent most of the hospital population. In addition, COVID-19-related hospital admissions were low compared to the total inpatients in Portugal; thus, it seems pointless to include specific dimensions of the COVID-19 pandemic when measuring a general hospital’s performance. These, measured typically at the national or municipal level, can instead be used as independent variables, potentially explaining the hospital’s performance.
The pandemic may have worsened the patients’ health status before and during internment in the hospital ward. In some cases, the decrease in hospital performance may not have resulted from poor safety or a lack of care appropriateness. Instead, the increase in adverse events may have resulted from the increased severity and complexity of the illness. Therefore, an adjustment for these situations must be introduced. The case-mix index (CMI) is widely used across the healthcare management literature [79]. The higher (lower) the index is, the more (less) complex the patients treated in the hospital are. A unitary CMI corresponds to a year’s national standard. Meanwhile, CMI = 1 + k suggests that, on average, the hospital treats patients whose complexity is greater than the national standard, thus consuming k% more resources than an average hospital (k can be either positive or negative). However, Ferreira and Marques [80] verified that the CMI is ineffective when evaluating performance through time, as the baseline (national average expenditures) is not steady. Additionally, the authors concluded that once appropriate demography and epidemiology-based indicators have been included in the model to help explain efficiency, the CMI becomes useless. Later, to study the impacts of patient safety, care appropriateness, and access on hospital efficiency in a given moment, the same authors used the CMI to adjust the performance indicators [35]. Their strategy encompassed the classification of these indicators into desirable and undesirable. The former corresponds to those indicators contributing positively to the performance (whenever increasing), like the rate of hip surgeries within the first 48 h. Conversely, undesirable indicators contribute negatively to performance when increasing, such as the rate of readmissions within 30 days after discharge.
Once classified, the indicators were adjusted with the CMI as follows: undesirable indicators were divided by the CMI, while the desirable ones were multiplied by it. That way, one expects the impact of high patient complexity in performance indicators to be mitigated, and hospitals may become comparable. Provided that the baseline used to compute the CMI every year tends to change, we opted to follow Herr [81] and adopt the average delay as a proxy of complexity. This is a valid assumption, as the more complex the patients are, the more days they must stay in the hospital ward. Let be the annual number of days in hospital j (j = 1, …, n) in year t (t = 0, …, T); likewise, let be the total inpatients admitted to that hospital, j, in the same year, t. The average delay is simply . The national average delay in the period [0, T] (i.e., the baseline) is . Therefore, the proxy of complexity based on average delay is simply . If , this means a higher number of days (on average) that the patients were hospitalized in hospital j in year t, compared to the baseline, making their case more complex and requiring more resources. Thus, the indexes and CMI have the same interpretation.
3.2. Performance Assessment Methods
3.2.1. The Benefit-of-Doubt Approach
One easy and straightforward way of estimating a hospital’s performance based on several indicators is the so-called Benefit-of-Doubt (BoD), derived from the well-known Data Envelopment Analysis (DEA) model. Let denote the observation associated with the ith indicator (i = 1, …, m), the jth hospital (j = 1, …, n), and the moment t. These indicators assume non-negative values. It is believed that they contribute positively to the performance of the hospital. Since it is not always the case, we follow Cherchye et al. [82,83], and scale the indicators as follows:
In Equation (1), stands for the hypothesized optimal value associated with the indicators that are neither desirable nor undesirable. In some cases, indicators should not be maximized nor minimized, but there is a value (or a range) in which the optimal indicator should lie. For instance, the occupancy rate should range between 80% and 90%, so that we can fix as the middle point of the interval, i.e., (90 + 80)/2 = 85%. After Equation (1), the resulting indicators range between 0 and 1, and it becomes clear that the higher, the better.
There should exist a set of m non-negative weights, , that maximize the overall composite indicator, CI, for the hospital j in instant t, from now on denoted by [84]. Let us assume that such a CI can be assessed through an additive model: . Because the weights are such that the CI is maximal, no other weights set should result in a higher CI. These weights (also named multipliers) are hospital and time-dependent. Although some authors have criticized the fact that weights are not equal for all entities under evaluation [85], in the words of Grego et al. [86] and Decancq and Lugo [87], this is the method’s beauty, as common weights “decrease the desirability of this method—that of favorable weights in the eyes of policymakers—based on which this approach gained such momentum in the first place”.
Provided that all indicators should be considered for the construction of the CI, weights must not be zero, but above a threshold, , denoting the minimum acceptable value for a weight: . Let us assume . Moreover, it should be possible to impose that an indicator (compared to the others) is not underrepresented; therefore, we add the following constraint: for a given level , such as [88]. This constraint reduces the heterogeneity of the weights’ distributions. The resulting linear programming BoD model is as follows [89]:
As obtained from Equation (2), the CI is bounded upwardly by one and downwardly by zero. If CI = 1, the hospital h is performing well at t, and can be considered a best practice among its peers (of the same period). Otherwise, its performance is not outstanding, and the managers should revise their processes (following a search for the best practices) to improve it.
As detailed before, we have three distinct criteria describing hospital care quality. In that sense, we can apply Equation (2) for the set of indicators corresponding to each criterion and construct four partial performance indicators: the efficiency composite indicator (ECI), access composite indicator (ACI), and safety/care-appropriateness composite indicator (SCACI). Finally, and following Matos et al. [90], we can aggregate these three into an overall CI using Equation (2), but with ECI, ACI, and SCACI instead of the 16 standardized indicators . That way, we reduce the impacts of many dimensions on the results’ resolution, commonly known as the curse of dimensionality. Simultaneously, the influence of each initial indicator on constructing the partial performance indicators is maintained. That is, since is the weight of indicator i to evaluate hospital h in instant t in terms of ECI, and is the weight of ECI in the overall composite indicator, the contribution of the initial indicator is given by .
3.2.2. Performance Evolution
As determined using Equation (2), the CI provides a static performance measure. However, the performance also encompasses a dynamic parcel that needs to be evaluated to investigate if hospitals have approached the best practices and improved their performance during the evaluation time. Indeed, we can build on Ferreira and Marques [91] and propose the following Total Factor Productivity (TFP) associated with the hospital j and two instants, t and t + 1:
where is a non-negative weight of indicator i and hospital j that resulted from averaging the weights obtained for that indicator and that hospital over the whole period. Thus, if N is the number of evaluated time instants, . TFP > 1 means that hospital j saw a productivity improvement between t and t + 1, resulting from enhancements in (most of) the indicators.
Building upon Portela and Thanassoulis [92,93], we can formulate the weighted Geometric Distance Function (GDF) that relates to the CI as computed by (2). Let us use a star * to denote the optimal level of an indicator given an instant t. These targets can be easily obtained by constructing the dual version of the model (2). The GDF of hospital j in moment t is:
The closer it is to one, the higher the hospital’s performance at that moment. Note that some hospitals may have (scaled) indicators equal to zero, which would mean a GDF equal to zero (while they could exhibit good performance in other indicators). We replace those zeros with minimal positive quantities to avoid this problem.
The static performance evolution between those moments can be defined as the ratio between two GDF measures:
That is, the performance change between two moments, , is related to productivity change in the same period, as measured by the TFP. If P > 1, hospital j improved its (static) performance between t and t + 1. According to Equation (5), the static performance evolution is proportional to the productivity growth, and the remaining parcel is the reciprocal of the technology shift, T, between t and t + 1:
i.e., the technology shift T is the relationship between targets in both moments. T > 1 indicates that benchmarks in t + 1 exhibit better performance than those in t. In other words, there was an improvement in the dynamic performance of hospital j.
This simple decomposition of TFP into two indices (P and T) presupposes that the hospitals face constant returns to scale, which is a reliable assumption since the indicators are ratios, meaning that two hospitals distinct in terms of size become comparable. In other words, the notion of size vanishes.
We individually evaluate each of the performance growth indices, TFP, P, and T, per quality criterion (efficiency and productivity, access, safety, and care appropriateness) and their aggregation (overall composite indicator). The evaluation was made monthly, starting January 2017 and ending May 2022 (i.e., 59 time intervals: January 2017–February 2017 to April 2022–May 2022).
3.2.3. A Relational Model
To answer the third research question (R3), we use the multiple linear regression model; see Equation (7):
with the stepwise forward method as a heuristic to obtain the most representative model with only the statistically relevant independent variables, , and no multicollinearity problems [36]. We consider three dependent variables (TFP, P, and T), y, resulting in three distinct models to check if the pandemic’s evolution may help explain the growth or decay of any of these indices. The selected independent variables, x, reflect the national average monthly change of SARS-CoV-2 outbreaks in Portugal since March 2020, when the virus was first introduced within the country. Therefore, the following seven (independent, explanatory) variables are measured as rates of growth between t and t + 1 (for t > February 2020), i.e., measured as percentages, :
- x1.
- Infected people per million inhabitants. The number of positive cases of SARS-CoV-2 multiplied by 1,000,000 and divided by the number of Portuguese inhabitants.
- x2.
- COVID-19-related deaths per million inhabitants. The number of deaths because of SARS-CoV-2 was multiplied by 1,000,000 and divided by the number of Portuguese inhabitants.
- x3.
- Reproduction rate. Usually represented by R, this rate is a standard transmissibility parameter that measures how many people can be infected by a positive case. For instance, R = 2 means that one infected person can infect two people with the COVID-19 virus. Therefore, the reproduction rate must be below one to curb the spread of a pathogen.
- x4.
- Intensive care unit admissions (because of COVID-19) per million inhabitants. The number of COVID-19-related hospital entries requiring intensive care, multiplied by 1,000,000 and divided by the number of Portuguese inhabitants. The search for intensive care because of SARS-CoV-2 resulted from the severe consequences of the disease like pneumonia, acute respiratory distress syndrome, multi-organ failure, septic shock, and, in many cases, death. Such a demand may have compromised the access to the same level of care by other patients as beds, and other resources (such as ventilators) are of limited availability.
- x5.
- Hospital admissions (because of COVID-19) per million inhabitants. The number of COVID-19-related hospital ward admissions not requiring intensive care, multiplied by 1,000,000 and divided by the number of Portuguese inhabitants. Although with less severe complications than those admitted to the intensive care unit, these inpatients also demand specialized nursery care. As in the previous case, this demand may constitute a barrier to access by other patients.
- x6.
- Vaccination (complete) rate. This indicator measures the percentage associated with the fully vaccinated population (BioNTech/Pfizer, Moderna, Novavax, AstraZeneca, Johnson & Johnson). For instance, a citizen with a single shot of BioNTech/Pfizer is not considered, as the minimum number of doses required is two. Evidence suggests that complete vaccination diminishes the severity of illness provoked by COVID-19, thus the need for hospitalizations and the burden on hospitals. This variable was zero until December 2020, when the first citizens got the shots.
- x7.
- Stringency index. According to the Oxford Coronavirus Government Response Tracker, the stringency index is a composite indicator based on nine response metrics related to the restrictions imposed by governments: school closures; workplace closures; the cancellation of public events; restrictions on public gatherings; closures of public transport; stay-at-home requirements; public information campaigns; restrictions on internal movements; and international travel controls [94]. The index ranges from 0 to 100, the highest level associated with the strictest response. One of the major goals underlying the imposition of these restrictions is the reduction of infected people and, by extension, the hospital burden with patients requiring (often intensive) medical care.
3.3. The Case Study
3.3.1. The Portuguese National Health Service
The Portuguese healthcare system is featured by a complex network of providers, rulers, and regulators. Providers can be either public or private or even belong to the social sector. The public healthcare provision service is known as the National Health Service (NHS), which follows a Beveridge model, and is thus publicly funded with money collected from taxes. The NHS is universal, general, and tendentiously free, with only a few moderating fees when patients access care services [95].
Healthcare in Portugal has three main “layers”: primary (e.g., primary healthcare centers, clinics), secondary (hospitals), and tertiary (continuing care, palliative care) [96,97]. Hospitals are entities that consume more resources within the national health system. According to Portugal Statistics, hospitals spent roughly EUR 9,110,868 in 2020, representing 43% of total healthcare expenditures (Data retrieved from https://www.pordata.pt/en/Subtheme/Portugal/Expenditure-37 (accessed on 23 January 2023)). Also, these entities more than doubled the consumed resources in twenty years (EUR 4,212,793 in 2000), an increase frequently associated with the aging population and technological and pharmaceutical developments [98]. The NHS had a total expenditure of EUR 11,679.8 million in 2020, i.e., 55% of national healthcare expenditure. That year, each citizen contributed an average of EUR 1186.8 to the NHS, while that value was EUR 609.6 twenty years ago.
There are currently 102 hospital facilities belonging to the NHS, of which 25 are specialized hospitals (e.g., oncology centers, psychiatric hospitals, and maternities) and 77 are general hospitals. Together, these entities have 22,226 beds, of which 91.6% are in general hospitals. There were 21,297 medical doctors and 39,913 nurses working in hospitals of the NHS in 2020. However, that year, there were 57,198 registered medical doctors and 77,984 registered nurses, most working in the private or social sectors. There has been an exodus of qualified health staff to these sectors or even abroad, looking for higher wages and better working conditions than in the NHS [99].
Despite the number of physical facilities, there are currently 45 hospital entities in the NHS, resulting from successive structural reforms in the public sector (mainly after the introduction of the New Public Management [100]). These reforms included the vertical and horizontal amalgamation of nearby healthcare infrastructures to form entities with integrated management, which were expected to yield economies of scale and scope [101]. Vertical margining corresponds to the integration of different levels of care, e.g., primary and secondary levels (one hospital and the primary healthcare centers located in the former’s vicinity). The new entities are the Local Health Units (LHU), and there are currently eight of these, primarily located in the countryside, where access to healthcare is limited. In opposition, horizontal merging results from integrating two or more close hospitals under the umbrella of the same administrative council, creating so-called Hospital Centers (HC) [102]. There are 21 HCs in Portugal. The remaining 16 public hospital entities are distributed as follows: 5 specialized hospitals and 11 singletons, 1 of which is a public–private partnership (PPP). Although PPP management is not under the direct control of the Ministry of Health, the provider must follow general guidelines set by the Ministry and the Directorate-General for Health. Since this entity also belongs to the NHS, it should be considered within our sample.
Past studies concerning the Portuguese NHS have disregarded specialized hospitals (because of their unique production technology), PPPs (because of missing data, especially the financial ones), and LHUs (because collected data regard both the hospital and the primary healthcare centers)—see Matos et al. [90] and Amado et al. [46] for details. Although we agree with removing specialized hospitals from the sample, when we look at the set of selected variables (Section 3.1.2), all concern the hospital activity, and there are no financial data (nor data gaps). Therefore, we should dismiss neither LHUs nor the PPPs. That being said, our sample comprises 40 entities observed in a 65-month time frame.
It is also worth mentioning that the Central Administration of the Health System in Portugal classifies hospitals into groups B to F, depending on features such as size, scope of activities carried out, differentiation, and operational conditions (epidemiology and demographics). Such a classification resulted from an empirical analysis through k-means and a comprehensive set of variables characterizing hospitals. That way, entities within the same group become comparable based on size, scope, and environment, an important issue when benchmarking is to be considered. In the words of Cook et al. [103], hospitals must be “assumed to be homogeneous (that is, comparable in terms of the indicators selected for the analysis), while those within the groups share objectives, policies, etc., which may differ across groups”. Creating those groups or clusters ensures the desired comparability among hospitals being compared. Therefore, each hospital cluster has its own performance analysis. Cluster B contains the smallest and least differentiated hospitals, for a total of nine institutions. Cluster C is the largest one, with 17 healthcare entities. They receive and treat more complex patients than the hospitals in cluster B. Cluster D comprises eight central hospitals that are more differentiated than the ones in clusters B and C. Cluster E has the biggest secondary care facilities within the whole NHS, i.e., those treating the most complex patients. The hospitals of cluster E are in Lisbon (the capital), Oporto (the second largest city in Portugal), and Coimbra, but receive patients from the entire country. Together, the metropolitan areas of Lisbon and Oporto comprise 45% of the population on Portugal’s mainland. Also located in these cities are the oncology centers (Instituto Português de Oncologia, in Portuguese), which form cluster F; for the reasons stated above, we will not consider this cluster hereinafter.
We gathered data on KPIs from the official database, maintained by the (Portuguese) Central Administration of Health System and publicly available (Official website (in Portuguese): https://benchmarking-acss.min-saude.pt/ (accessed on 23 January 2023)). Meanwhile, we collected data on explanatory variables from the Our World in Data platform, a project of the Global Change Data Lab, under the supervision of the University of Oxford (Our World in Data website: https://ourworldindata.org/coronavirus#explore-the-global-situation (accessed on 23 December 2022)).
3.3.2. COVID-19 in Portugal: Some Figures
Like many other countries, Portugal has been severely hit by the COVID-19 disease. According to the latest official figures, the country recorded almost 5.5 million infected and 25,000 deaths by August 2022. Figure 1a shows the COVID-19number of daily new COVID-19 cases registered in Portugal since March 2020. There were three prominent peaks of infection: January 2021, January 2022, and May 2022. The peaks in January were most likely because of Christmas and New Year’s Eve. Interestingly, the last two main infection peaks occurred when most Portuguese citizens were already fully vaccinated. By January 2022, about 83% of the population had completed the vaccination plan. However, more infected people does not mean higher mortality, as shown in Figure 1b. Indeed, the peak of infections in January 2021 led to higher mortality than the peaks in 2022; the reason may be vaccination, which seems to reduce mortality among COVID-19 patients. Nonetheless, two peaks in mortality in February and June 2022 were observed, which coincide with the peaks of infected people in the same year (with a certain delay).
Concerning hospital and intensive care unit admissions due to COVID-19 (see Figure 2), there were more than six thousand hospitalizations at the beginning of 2021, when the first peak of infections was observed, and more people died because of this disease. By that time, the admissions to intensive care also reached the maximum in the entire period. Once people were fully vaccinated, hospital admissions decreased to values close to the pandemic’s beginning. Interestingly, when infections reached their maximum in 2022, hospital admissions did not increase as much as in 2021, most likely because of vaccination. It is worth mentioning that the gap between hospital admissions and intensive care unit admissions became larger because the disease severity decreased. Overall, there is a strong correlation (R = 0.86, p < 0.001) between hospital/intensive care unit admissions and mortality due to COVID-19.
4. Results
4.1. Efficiency and Productivity
Hospital efficiency and productivity were assessed using the occupancy rate and the availability of clinical human resources per treated patient (after adjustment by complexity and severity of illness). Figure 3 exhibits the evolution of hospital average efficiency and productivity in terms of static performance (Figure 3a) and dynamic performance (Figure 3b). Additionally, Table 2 presents a summary of these dimensions, and the TFP per group of hospitals and period: pre-pandemic period (January 2017–February 2020) and pandemic period (March 2020–May 2022). For a better analysis, we split the pandemic period into two: first year, pre-vaccination (March 2020–February 2021), and after vaccination (March 2021–May 2022) (until February 2021 only a very small share (6.3%) of the population had received one dose of the COVID-19 vaccine, which is thus unsuitable to significantly mitigate the impact of the disease in hospitals). While static performance measures how hospitals get closer to the frontier, thus becoming more or less efficient, dynamic performance measures the frontier shift between two consecutive years. TFP is an aggregated measure of static and dynamic performance. Therefore, should a hospital approach the frontier in one year and the benchmarks in that frontier are more productive than before, the hospital can be seen to have improved its TFP (overall performance).
When analyzing the static performance of hospitals’ efficiency and productivity, there was a reduction between January 2017 and February 2020, with an average ranging from 0.9554 (group E) to 0.9995 (group B). In other words, hospitals’ efficiency was estimated to have decreased by up to 4.46% in that period. Note that the observed decay in group B was not considered statistically significant as per the Kruskal–Wallis nonparametric statistical test. In this period, hospitals were moving away from the frontier. However, at the pandemic’s start, there was a tiny efficiency and productivity improvement of 0.33–3.96%, depending on the hospital group, from March 2020 until May 2022. If we split this period in two, we can verify a global improvement in both, although they were not different in the light of statistical evidence. Overall, considering the entire period, hospitals were more inefficient in 2022 than in 2017, except for the ones in group B (the smallest ones). In other words, hospitals in May 2022 were further away from the frontier than in January 2017. Regarding the dynamic performance evolution, we can observe a worsening of efficiency in the whole period, which means that the frontier has progressively shifted towards a more inefficient region. Overall, the benchmarks in May 2022 are less efficient than the ones in January 2017 by about 2–4%. Overall, hospitals nowadays seem to be in a worse position than five years ago, concerning efficiency and productivity.
Table 3 presents the beta coefficients for the three different multiple regression analyses. Malmquist indices P, T, and TFP were the dependent variables of each analysis, which can be explained by seven COVID-19-related variables (as independent ones). Beta coefficients are the linear coefficients (resulting from the ordinary least squares method) divided by the variables’ standard deviation. Therefore, beta coefficients allow us to determine the weight or importance of each explanatory variable in explaining the dependent variable. Additionally, the same table contains information about the adjustment quality (coefficient of determination, usually represented by R2) and appropriateness. The latter is assessed through three main conditions over the regression residuals: normality, homoskedasticity, and independence. Normality was tested using the nonparametric Kolmogorov–Smirnov statistical test for null hypothesis H0: the sample follows a Gaussian distribution with a zero average and constant standard deviation resulting from the data. We tested the residual’s homoskedasticity by plotting residuals as a function of the fitted or predicted values of the dependent variable. If the resulting fitting line has a slope and intercept both equal to zero, then residuals are homoscedastic. Finally, we assessed the residual’s independence using the Durbin–Watson test, for which a value of 2 suggests the absence of autocorrelation.
A look into the results displayed in Table 3 allows us to conclude that neither of the considered potentially explanatory variables help justify the evolution of the static performance of hospitals, P, in terms of efficiency and productivity, i.e., whether they approach or move away from the frontier, becoming more or less efficient. That is, hospitals did not improve their resource usage because of the Government’s stringency or the rates of infection, mortality, or vaccination. Even the admissions to the hospital wards or the intensive care units could not explain this performance measure. For this reason, the coefficient of determination was only 0.039, i.e., the adopted linear model with the stepwise forward method and COVID-19-related dimensions only explains about 4% of the hospitals’ static performance change regarding efficiency and productivity. However, the same cannot be said about their dynamic performance change, T. Some variables tend to explain why the frontier shifts with time, so benchmarks in one year can outperform or be outperformed by the benchmarks in another moment. In the case of the efficiency and productivity group of variables, it seems that benchmarks can get more efficient and productive with time because of variables like the infection and reproduction rates, the admission rates to hospital wards and intensive care units, and the stringency index. There is a positive technology (frontier) shift promoted by more infected people and higher reproduction rates associated with a higher need for hospital care. More admitted patients (regardless of being infected by SARS-CoV-2 or not) means a higher monetization of assets. Also, the average complexity of patients increased in this period because only the more severe cases were attended in hospitals, raising, even more, the output, although only slightly. Finally, more significant stringency indices tend to be associated with a negative frontier shift, i.e., a loss of productivity, because many treatments in hospitals were denied or postponed, thus decreasing the hospital output. This linear model has reached an acceptable adjustment quality (explaining about 56% of the dynamic performance change) and appropriateness (no test over residuals failed). There is thus evidence to reject the null hypothesis H0(R3) that concerns the third research question, (R3), and the variables group of efficiency and productivity.
4.2. Access
As shown in Figure 4 and Table 4, hospitals in groups B and E improved their performance regarding access between 2017 and the beginning of 2020, right before the pandemic started. In opposition, groups C and D hospitals worsened their performance levels in the same period. Similar results were observed for both static and dynamic performances. For instance, considering the hospitals within group D, access to their services was reduced by 8.36% on average, while the frontier saw a negative shift (worsening the performance) of 9.31%. Overall, the average performance of hospital providers in terms of access reduced by nearly 17% in just three years. The pandemic exacerbated the barriers to healthcare in Portugal in all groups, especially in the first year (March 2020 to February 2021), when lockdowns, the postponement of medical appointments and surgeries, and other pandemic containment policies were in force. Concerning the entire period (2017–2022), there was an aggravation of barriers to proper secondary healthcare. Although potentiated by the pandemic and the measures taken to prevent the virus from widely spreading, such walls result primarily from structural problems, such as the highly reported lack of medical doctors and nurses in public services. Most of the clinical staff have opted to work in the private sector, where the working conditions and remunerations are better than in the public sector, which then limits the availability of the already scarce resources, delaying, even more, the already delayed medical and nursing care, and jeopardizing the sustainability and mission of the NHS in Portugal.
In the case of access to hospital care, the explanatory multiple linear models seem to reproduce similar results, regardless of whether the dependent variable is P, T, or TFP. According to the evidence in Table 5, all models reached acceptable adjustment quality (explaining at least 59% of the performance change) and appropriateness (as no test over residuals was rejected). Concerning access, only three variables seem to help explain performance change: admissions to intensive care units or hospital wards because of COVID-19 and stringency index. All the significant variables exhibited a negative influence on the performance change. The reasons behind this result seem apparent. As regards the Government’s stringency, there was a substantial limitation to the access to healthcare services, decreasing the number of appointments and enrollments on surgery waiting lists within the legally defined time, as well as the surgeries themselves, and increasing simultaneously the average time before surgery. Concerning the admissions to hospital care, one must recognize that hospital resources (mainly beds and clinical staff) are rivalrous, i.e., there is competition for the same resource. Suppose an inpatient infected with SARS-CoV-2 occupies a bed or a ventilator. In that case, the same resource will not be available for another user for a while, denying or delaying the appropriate care for that person. We expected these results, as COVID-19 and the policies implemented to contain it constituted a massive barrier to hospital care. There is thus evidence to reject the null hypothesis H0(R3) that concerns the third research question (R3) and the variables group of access.
4.3. Safety and Care Appropriateness
Unlike what happened to the access to hospital care, primarily resulting from administrative, political, and contingency barriers, safety and care appropriateness in hospitals improved during the entire period (see Figure 5 and Table 6). Although some ups and downs were observed in both static and dynamic performance estimates, hospitals are currently in a better position than in 2017, delivering better care without as many undesirable events as before. The pandemic does not seem to have influenced this set of dimensions, as hospitals and their clinical staff seem to have adopted good empirically based practices without jeopardizing the patients’ safety. Overall, hospitals approached their own year-based frontier, as this frontier moved towards a region characterized by better care outcomes. As shown in Table 7, no COVID-19-related variable seems to explain the hospital performance change concerning safety and appropriateness of care. The linear models were also unsuitable, exhibiting very small coefficients of determination, and two criteria over residuals failed (homoskedasticity and independence). Thus, there is no evidence to reject the null hypothesis H0(R3) that concerns the third research question (R3) and the variables group of safety and care appropriateness. These results suggest that the safety and appropriateness of care in Portuguese public hospitals have nothing to do with the evolution of COVID-19. Hospitals seem to deliver safe and appropriate care regardless of the widespread pandemic, suggesting that all best practices and international and national guidelines have been adopted to treat all patients equally well. Hospital care does not seem to have been affected by the pandemic, nor the harsh conditions in which the clinical staff had to work and the burnout to which they were subjected.
5. Discussion
During the COVID-19 pandemic, hospitals faced significant challenges in providing quality care due to the overwhelming number of cases, resource constraints, and the need to implement infection control measures. While the specific quality of care varied across different regions and healthcare systems, there are some common factors that affected hospital quality during this time: surges in COVID-19 cases, resource constraints, staffing issues, delayed or deferred non-urgent care, infection control measures, and adaptation to new care models.
The sudden influx of COVID-19 patients put immense strain on healthcare systems, leading to overcrowding and potential shortages of beds, equipment, and medical personnel. This surge impacted the overall quality of care as hospitals struggled to manage the increased workload. Meanwhile, some strategies have been implemented worldwide to mitigate this surge: expanding hospital capacity, repurposing existing spaces for isolation spaces, optimizing resource allocation, developing protocols for judicious resource use, prioritizing patients based on severity, enhancing staffing levels (addressing staff shortages by hiring additional workers, redeploying staff from non-urgent areas, and seeking support from external sources, like volunteers), implementing infection control measures like regular staff testing, enhancing testing and contact tracing, expanding telehealth services (remote consultations, monitoring patients, and triage cases). Flexibility, adaptability, and the continuous evaluation of interventions are crucial for an effective response to the surge in COVID-19 cases. In Portugal, a reform of letting patients be interned in their own home is being tested, which could be a solution for non-COVID-19 cases requiring hospital admission and stay at ward during the surge.
The scarcity of critical resources such as personal protective equipment, ventilators, and testing supplies created challenges in providing optimal care for both COVID-19 patients and those with other medical conditions. Limited resources could affect the ability to offer timely and appropriate treatment. Surpassing surmounting resource constraints in hospitals during a surge can be challenging, but there are strategies that can help optimize resource utilization and alleviate some of the constraints: resource allocation and prioritization through protocols and guidelines prioritizing patients based on clinical need and prognosis; collaboration among healthcare facilities and providers within a region and resource sharing to distribute the burden of patient care; seeking external support via partnerships with other organizations, such as government agencies, non-profit organizations, private businesses, and local communities to raise awareness about the resource needs; resource conservation and efficiency of usage through proper training and education, implementing systems to track and manage inventories effectively as well as protocols to reduce waste via evidence-based practices to minimize unnecessary procedures, tests, or treatments; staff optimization via telehealth and reallocation; and supply chain management via enhanced coordination and communication with suppliers and vendors to anticipate and address potential shortages.
Healthcare workers were at the forefront of the pandemic response, working tirelessly under immense pressure. Staff shortages due to illness, burnout, or the need for self-isolation further strained hospitals’ ability to maintain high-quality care. Burnout among health staff is a critical aspect during surges, and addressing/mitigating its impact is crucial for maintaining their well-being and effectiveness. Some strategies include prioritizing staff well-being, creating a supportive environment that values and prioritizes their mental and emotional health, encouraging open communication and providing channels for staff to express concerns or seek support, and avoiding excessive workloads and fatigue by improving staffing levels, while allowing for flexible scheduling and breaks. Recognition, appreciation, training, education, clear communication, transparency, and employee involvement in decision-making are also important strategies related to implement.
To allocate resources and reduce the risk of COVID-19 transmission, many hospitals had to delay or defer non-urgent procedures and appointments. This situation could lead to longer waiting times, the potential worsening of certain conditions, and overall dissatisfaction among patients. Avoiding care delays or deferrals during pandemics requires a careful balance between managing the surge’s cases and ensuring timely access to essential healthcare services. For that, one should try to minimize care delays via risk stratification and prioritization based on severity, the introduction or enhancement of telehealth services for remote consultations, follow-ups, and monitoring for non-urgent or low-risk cases, creating dedicated COVID-19 facilities, improving the collaboration with primary care providers to ensure that non-urgent care is appropriately managed outside of the hospital setting, and finally continuously monitoring and evaluating the impact of care delays or deferrals on patient outcomes.
Hospitals implemented strict infection control protocols to prevent the spread of COVID-19 among patients and healthcare workers. While necessary, these measures, such as isolation protocols and visitor restrictions, could impact the patient experience and affect the quality of care, particularly in terms of emotional support and family involvement.
Many hospitals had to rapidly adapt their care models to accommodate the challenges posed by the pandemic. This included telehealth services, remote monitoring, and triaging mechanisms to manage patient volumes effectively. While these innovations were crucial, they also required adjustments in workflows, and could potentially impact the patient–provider relationship.
It is important to note that the quality of care varied among different regions and hospitals. Some facilities successfully managed the challenges and maintained high-quality care, while others faced more significant difficulties. A closer look at some of the benchmarks during the pandemic period allowed us to see that they have adopted a meaningful set of the abovementioned strategies, and for that reason, they became more resilient against the surge. Healthcare providers have been continuously learning and adapting throughout the pandemic to improve care delivery in the face of ongoing challenges. However, the pandemic features only explain a small share of hospital performance evolution, with the noteworthy exception of access dimensions. But one should note that delayed care and deferrals were mostly the result of the Central Government’s strategy to contain the virus, forgetting that other pathologies needed attention. This caused a worsening of the severity of illnesses, and it is well-known that later stages of diseases are usually costlier than the earlier ones. Aside from the issue of access, the pandemic does not clearly explain the evolution of hospital performance in terms of efficiency and care safety and appropriateness. This result suggests that changes in performance should be interpreted in the light of internal structure (poor preparedness, staff burnout, hysteria, among others). As the World Health Organization has already decreed the pandemic’s end, it is important that healthcare providers and governments prepare themselves for likely future pandemics, by following the best practices (benchmarks) and designing reliable contingency plans [104,105,106].
Academic implications: Beyond the findings about the strategic management of healthcare systems in the presence of a pandemic (vide infra for the practical implications), it is worth mentioning that there are some academic implications for researchers in the economics and operational research fields. In fact, the use of a weight-constrained BoD together with the GDF-based TFP, as a first stage, and then the productivity indices used in the relational model, would be innovative and open doors to future uses, even in different case studies. It should be noted that the use of this kind of models is relevant to assessments of performance levels and potential drivers, especially when the systems’ sustainability is at stake [107,108,109,110].
Practical implications: The COVID-19 pandemic has exposed significant challenges faced by hospitals, including resource constraints, staffing issues, delayed non-urgent care, and infection control measures. These challenges require strategies to maintain quality care and address the strain on healthcare systems. Our results have highlighted the importance of developing comprehensive contingency plans, optimizing resource utilization, addressing healthcare worker burnout, balancing urgent and non-urgent care, maintaining patient experience and emotional support, adjusting care models, analyzing regional variations in quality of care, and assessing and improving internal structures to enhance the response to pandemics like COVID-19. These strategies can lead to better resource management, improved healthcare worker well-being, optimized patient care, and increased resilience during challenging times. By learning from past experiences and benchmarking against successful strategies, hospitals can improve preparedness for future public health crises. Healthcare providers should also prioritize staff well-being, provide a supportive environment, encourage open communication, and implement strategies to manage workloads and fatigue. Balancing urgent and non-urgent care, patient experience, and emotional support is crucial during pandemics. Adapting care models, analyzing regional variations in quality of care, and assessing internal structures can help hospitals better respond to future challenges. Overall, implementing these strategies can lead to better resource management, improved healthcare worker well-being, optimized patient care, and increased resilience during challenging times.
6. Conclusions
This work has dealt with three important research questions that have not been answered in the literature. Evidence suggests that hospital performance has been heavily conditioned by the Ministry of Health’s external impositions, especially concerning the barriers created to contain the pandemic’s dissemination. The COVID-19 pandemic’s features explain part of the hospitals’ performance after March 2020, especially the access and efficiency dimensions. Although hospitals have adopted safe and appropriate clinical practices internally, some resource availability problems need to be addressed urgently. The lack of medical doctors and nurses in public healthcare provider services is not a new problem, and was exacerbated by the harsh conditions in the workplace created by the pandemic. Introducing policies that condition access to those services increased the existing barriers to the NHS. The postponement or cancellation of medical appointments and surgeries and the constraints on the emergency departments only resulted in the worsening of patients’ quality of life, and increases in costs in the future, because the related clinical status becomes more complex and severe to treat. It becomes evident that these policies put the NHS’s sustainability and mission at stake. If future pandemics occur, it is paramount to assess the past best practices within the Portuguese NHS and internationally. But this benchmarking exercise does not end with identifying those best practices: one needs to adapt and then adopt them in the NHS, such that the healthcare providers’ resilience and capacity to respond to the demand for care are not at risk. In the current times, characterized by an ongoing pandemic, the exodus of clinical staff to the private sector or abroad, along with political instability, it is challenging to implement the required structural reforms that allow the NHS to fulfill its mission. Nonetheless, they are undoubtedly necessary, and we should focus on improving clinical staff working conditions, hiring more staff, fostering meritocracy, reducing bureaucracy, and guaranteeing equitable access to quality healthcare for the entire population (in particular, the people living in the countryside).
Our study is not absolutely foolproof, as one may identify some limitations. In particular, the variables and models used to quantify hospital performance can always be debatable. In fact, some dimensions, like the in-hospital mortality for low-severity cases, can be included to improve the performance estimation. Of course, we are always bounded by the availability, which may hamper the model’s refinement. Regarding the model, we should highlight its compensatory and benevolent nature, meaning that larger weights are assigned to variables in which hospitals have better performances, while zero-weights can be obtained when the performance is low. This is because the optimization model seeks to maximize performance, so no other system of weights would result in a higher performance score. This is simultaneously a merit and a drawback of the method, as some variables may outweigh others, as long as this would result in a larger score. That being said, it is important to compare our results against those achieved with, for example, a pessimistic benchmarking model.
Author Contributions
Conceptualization, P.C. and M.V.; methodology, P.C. and M.V.; software, P.C. and M.V.; validation, P.C. and M.V.; formal analysis, P.C. and M.V.; investigation, P.C. and M.V.; resources, P.C. and M.V.; data curation, P.C. and M.V.; writing—original draft preparation, P.C. and M.V.; writing—review and editing, P.C. and M.V.; visualization, P.C. and M.V.; supervision, P.C. and M.V.; project administration, P.C. and M.V.; funding acquisition, P.C. and M.V. All authors have read and agreed to the published version of the manuscript.
Funding
This research received no external funding.
Institutional Review Board Statement
Not applicable.
Informed Consent Statement
Not applicable.
Data Availability Statement
Data will be made available upon reasonable request.
Conflicts of Interest
The authors declare no conflict of interest.
References
- De Oliveira Toledo, S.L.; Nogueira, L.S.; das Graças Carvalho, M.; Rios, D.R.A.; de Barros Pinheiro, M. COVID-19: Review and hematologic impact. Clin. Chim. Acta 2020, 510, 170–176. [Google Scholar] [CrossRef]
- Schoeman, D.; Fielding, B.C. Coronavirus envelope protein: Current knowledge. Virol. J. 2019, 16, 69. [Google Scholar] [CrossRef] [PubMed] [Green Version]
- Ioannidis, J. Over-and under-estimation of COVID-19 deaths. Eur. J. Epidemiol. 2021, 36, 581–588. [Google Scholar] [CrossRef] [PubMed]
- Zhu, N.; Zhang, D.; Wang, W.; Li, X.; Yang, B.; Song, J.; Zhao, X.; Huang, B.; Shi, W.; Lu, R.; et al. A novel coronavirus from patients with pneumonia in China, 2019. N. Engl. J. Med. 2020, 382, 727–733. [Google Scholar] [CrossRef] [PubMed]
- Pereira, M.A.; Dinis, D.C.; Ferreira, D.C.; Figueira, J.R.; Marques, R.C. A network Data Envelopment Analysis to estimate nations’ efficiency in the fight against SARS-CoV-2. Exp. Syst. Appl. 2022, 210, 118362. [Google Scholar] [CrossRef]
- Ciotti, M.; Ciccozzi, M.; Terrinoni, A.; Jiang, W.C.; Wang, C.B.; Bernardini, S. The COVID-19 pandemic. Crit. Rev. Clin. Lab. Sci. 2020, 57, 365–388. [Google Scholar] [CrossRef]
- Ndwandwe, D.; Wiysonge, C.S. COVID-19 vaccines. Curr. Opin. Immunol. 2021, 71, 111–116. [Google Scholar] [CrossRef]
- Zheng, C.; Shao, W.; Chen, X.; Zhang, B.; Wang, G.; Zhang, W. Real-world effectiveness of COVID-19 vaccines: A literature review and meta-analysis. Int. J. Infect. Dis. 2022, 114, 252–260. [Google Scholar] [CrossRef] [PubMed]
- Vieira, D.A.; Meirinhos, V. COVID-19 lockdown in Portugal: Challenges, strategies and effects on mental health. Trends Psychol. 2021, 29, 354–374. [Google Scholar] [CrossRef]
- Soares, P.; Rocha, J.V.; Moniz, M.; Gama, A.; Laires, P.A.; Pedro, A.R.; Dias, S.; Leite, A.; Nunes, C. Factors associated with COVID-19 vaccine hesitancy. Vaccines 2021, 9, 300. [Google Scholar] [CrossRef]
- Vieira, A.; Ricoca, V.P.; Aguiar, P.; Sousa, P.; Nunes, C.; Abrantes, A. Years of life lost by COVID-19 in Portugal and comparison with other European countries in 2020. BMC Public Health 2021, 21, 1054. [Google Scholar] [CrossRef]
- Pederneiras, Y.M.; Pereira, M.A.; Figueira, J.R. Are the Portuguese public hospitals sustainable? A triple bottom line hybrid data envelopment analysis approach. Int. Trans. Oper. Res. 2023, 30, 453–475. [Google Scholar] [CrossRef]
- Nunes, A.M.; Ferreira, D.C. Social Inequity and Health: From the Environment to the Access to Healthcare in Composite Indicators, the Portuguese Case. In Sustainable Policies and Practices in Energy, Environment and Health Research; Springer: Cham, Switzerland, 2022; pp. 371–389. [Google Scholar]
- Grossi, G.; Kallio, K.M.; Sargiacomo, M.; Skoog, M. Accounting, performance management systems and accountability changes in knowledge-intensive public organizations: A literature review and research agenda. Account. Audit. Account. J. 2019, 33, 256–280. [Google Scholar] [CrossRef]
- Font, J.C.; Levaggi, R.; Turati, G. Resilient managed competition during pandemics: Lessons from the Italian experience during COVID-19. Health Econ. Policy Law 2022, 17, 212–219. [Google Scholar] [CrossRef] [PubMed]
- Pecoraro, F.; Luzi, D.; Clemente, F. Analysis of the different approaches adopted in the Italian regions to care for patients affected by COVID-19. Int. J. Environ. Res. Public Health 2021, 18, 848. [Google Scholar] [CrossRef] [PubMed]
- Nepomuceno, T.C.; Silva, W.; Nepomuceno, K.T.; Barros, I.K. A DEA-based complexity of needs approach for hospital beds evacuation during the COVID-19 outbreak. J. Healthc. Eng. 2020, 2020, 8857553. [Google Scholar] [CrossRef] [PubMed]
- Kamel, M.A.; Mousa, M.E.S. Measuring operational efficiency of isolation hospitals during COVID-19 pandemic using data envelopment analysis: A case of Egypt. Benchmark. Int. J. 2021, 28, 2178–2201. [Google Scholar] [CrossRef]
- Henriques, C.O.; Gouveia, M.C. Assessing the impact of COVID-19 on the efficiency of Portuguese state-owned enterprise hospitals. Socio-Econ. Plan. Sci. 2022, 84, 101387. [Google Scholar] [CrossRef]
- Aydin, N.; Yurdakul, G. Assessing countries’ performances against COVID-19 via WSIDEA and machine learning algorithms. Appl. Soft Comput. 2020, 97, 106792. [Google Scholar] [CrossRef]
- Taherinezhad, A.; Alinezhad, A. Nations performance evaluation during SARS-CoV-2 outbreak handling via data envelopment analysis and machine learning methods. Int. J. Syst. Sci. Oper. Logist. 2022, 10, 1–18. [Google Scholar] [CrossRef]
- Ibrahim, M.D.; Binofai, F.A.; Mm Alshamsi, R. Pandemic response management framework based on efficiency of COVID-19 control and treatment. Future Virol. 2020, 15, 801–816. [Google Scholar] [CrossRef]
- Ferraz, D.; Mariano, E.B.; Manzine, P.R.; Moralles, H.F.; Morceiro, P.C.; Torres, B.G.; de Almeida, M.R.; Soares de Mello, J.C.; Rebelatto, D.A.D.N. Covid health structure index: The vulnerability of Brazilian microregions. Soc. Indic. Res. 2021, 158, 197–215. [Google Scholar] [CrossRef]
- Mariano, E.; Torres, B.; Almeida, M.; Ferraz, D.; Rebelatto, D.; de Mello, J.C.S. Brazilian states in the context of COVID-19 pandemic: An index proposition using Network Data Envelopment Analysis. IEEE Lat. Am. Trans. 2021, 19, 917–924. [Google Scholar] [CrossRef]
- Hamzah, N.; Yu, M.M.; See, K.F. Assessing the efficiency of Malaysia health system in COVID-19 prevention and treatment response. Health Care Manag. Sci. 2021, 24, 273–285. [Google Scholar] [CrossRef]
- Klumpp, M.; Loske, D.; Bicciato, S. COVID-19 health policy evaluation: Integrating health and economic perspectives with a data envelopment analysis approach. Eur. J. Health Econ. 2022, 23, 1263–1285. [Google Scholar] [CrossRef] [PubMed]
- Guerrini, A.; Romano, G.; Campedelli, B.; Moggi, S.; Leardini, C. Public vs. private in hospital efficiency: Exploring determinants in a competitive environment. Int. J. Public Adm. 2018, 41, 181–189. [Google Scholar] [CrossRef]
- Pecoraro, F.; Luzi, D.; Clemente, F. The efficiency in the ordinary hospital bed management: A comparative analysis in four European countries before the COVID-19 outbreak. PLoS ONE 2021, 16, e0248867. [Google Scholar] [CrossRef] [PubMed]
- Carlucci, L.; D’ambrosio, I.; Balsamo, M. Demographic and attitudinal factors of adherence to quarantine guidelines during COVID-19: The Italian model. Front. Psychol. 2020, 11, 559288. [Google Scholar] [CrossRef]
- Jabbari, P.; Taraghikhah, N.; Jabbari, F.; Ebrahimi, S.; Rezaei, N. Adherence of the general public to self-protection guidelines during the COVID-19 pandemic. Disaster Med. Public Health Prep. 2022, 16, 871–874. [Google Scholar] [CrossRef]
- Oyeyemi, O.T.; Oladoyin, V.O.; Okunlola, O.A.; Mosobalaje, A.; Oyeyemi, I.T.; Adebimpe, W.O.; Nwuba, R.I.; Anuoluwa, I.I.; Tiamiyu, A.M.; Ovuakporie-Uvo, O.O.; et al. COVID-19 pandemic: An online-based survey of knowledge, perception, and adherence to preventive measures among educated Nigerian adults. J. Public Health 2022, 30, 1603–1612. [Google Scholar] [CrossRef]
- Rosko, M.D.; Chilingerian, J.A. Estimating hospital inefficiency: Does case mix matter? J. Med. Syst. 1999, 23, 57–71. [Google Scholar] [CrossRef] [PubMed]
- Adamuz, J.; González-Samartino, M.; Jiménez-Martínez, E.; Tapia-Pérez, M.; López-Jiménez, M.M.; Rodríguez-Fernández, H.; Castro-Navarro, T.; Zuriguel-Pérez, E.; Carratal, J.; Juvé-Udina, M. Risk of acute deterioration and care complexity individual factors associated with health outcomes in hospitalised patients with COVID-19: A multicentre cohort study. BMJ Open 2021, 11, e041726. [Google Scholar] [CrossRef] [PubMed]
- Albitar, O.; Ballouze, R.; Ooi, J.P.; Ghadzi, S.M.S. Risk factors for mortality among COVID-19 patients. Diabetes Res. Clin. Pract. 2020, 166, 108293. [Google Scholar] [CrossRef]
- Ferreira, D.C.; Marques, R.C. Do quality and access to hospital services impact on their technical efficiency? Omega 2019, 86, 218–236. [Google Scholar] [CrossRef]
- Ferreira, D.C.; Caldas, P.; Marques, R.C. Ageing as a determinant of local government performance: Myth or reality? The Portuguese experience. Local Gov. Stud. 2021, 47, 475–497. [Google Scholar] [CrossRef]
- Ferreira, D.C.; Marques, R.C.; Nunes, A.M.; Figueira, J.R. Patients’ satisfaction: The medical appointments valence in Portuguese public hospitals. Omega 2018, 80, 58–76. [Google Scholar] [CrossRef]
- Donabedian, A. Evaluating the quality of medical care. Milbank Meml. Fund Q. 1966, 44, 166–206. [Google Scholar] [CrossRef]
- Donabedian, A. The quality of care: How can it be assessed? JAMA 1988, 260, 1743–1748. [Google Scholar] [CrossRef]
- Donabedian, A. The seven pillars of quality. Arch. Pathol. Lab. Med. 1990, 114, 1115–1118. [Google Scholar]
- Ferreira, D.C.; Marques, R.C.; Nunes, A.M.; Figueira, J.R. Customers satisfaction in pediatric inpatient services: A multiple criteria satisfaction analysis. Socio-Econ. Plan. Sci. 2021, 78, 101036. [Google Scholar] [CrossRef]
- Baker, A. Crossing the Quality Chasm: A New Health System for the 21st Century; National Academic Press: Washington, DC, USA, 2001; Volume 323, p. 1192. [Google Scholar]
- Hibbard, J.; Pawlson, L.G. Why not give consumers a framework for understanding quality? Jt. Comm. J. Qual. Saf. 2004, 30, 347–351. [Google Scholar] [CrossRef] [PubMed]
- Ring, J.C.; Chao, S.M. Performance Measurement: Accelerating Improvement. Retrieved from Institute of Medicine. 2006. Available online: https://www.ncvhs.hhs.gov/wp-content/uploads/2014/05/060222p1.pdf (accessed on 6 March 2023).
- Ferreira, D.C.; Vieira, I.; Pedro, M.I.; Caldas, P.; Varela, M. Patient Satisfaction with Healthcare Services and the Techniques Used for its Assessment: A Systematic Literature Review and a Bibliometric Analysis. Healthcare 2023, 11, 639. [Google Scholar] [CrossRef]
- Amado, G.C.; Ferreira, D.C.; Nunes, A.M. Vertical integration in healthcare: What does literature say about improvements on quality, access, efficiency, and costs containment? Int. J. Health Plan. Manag. 2022, 37, 1252–1298. [Google Scholar] [CrossRef] [PubMed]
- Ferreira, D.C.; Marques, R.C.; Nunes, A.M. Pay for performance in health care: A new best practice tariff-based tool using a log-linear piecewise frontier function and a dual-primal approach for unique solutions. Oper. Res. 2021, 21, 2101–2146. [Google Scholar]
- Ferreira, D.C.; Marques, R.C. A step forward on order-α robust nonparametric method: Inclusion of weight restrictions, convexity and non-variable returns to scale. Oper. Res. 2020, 20, 1011–1046. [Google Scholar] [CrossRef]
- Ferreira, D.C.; Marques, R.C. Public-private partnerships in health care services: Do they outperform public hospitals regarding quality and access? Evidence from Portugal. Socio-Econ. Plan. Sci. 2021, 73, 100798. [Google Scholar] [CrossRef]
- Pereira, M.A.; Machete, I.F.; Ferreira, D.C.; Marques, R.C. Using multi-criteria decision analysis to rank European health systems: The Beveridgian financing case. Socio-Econ. Plan. Sci. 2020, 72, 100913. [Google Scholar] [CrossRef]
- Ferreira, D.C.; Nunes, A.M.; Marques, R.C. Operational efficiency vs clinical safety, care appropriateness, timeliness, and access to health care. J. Product. Anal. 2020, 53, 355–375. [Google Scholar] [CrossRef]
- Ferreira, D.C.; Nunes, A.M.; Marques, R.C. Optimizing payments based on efficiency, quality, complexity, and heterogeneity: The case of hospital funding. Int. Trans. Oper. Res. 2020, 27, 1930–1961. [Google Scholar] [CrossRef]
- Rocha, A.; Costa, A.S.; Figueira, J.R.; Ferreira, D.C.; Marques, R.C. Quality assessment of the Portuguese public hospitals: A multiple criteria approach. Omega 2021, 105, 102505. [Google Scholar] [CrossRef]
- Maaz, M.; Papanastasiou, A. Determining the optimal capacity and occupancy rate in a hospital: A theoretical model using queuing theory and marginal cost analysis. Manag. Decis. Econ. 2020, 41, 1305–1311. [Google Scholar] [CrossRef]
- Kaier, K.; Mutters, N.T.; Frank, U. Bed occupancy rates and hospital-acquired infections—Should beds be kept empty? Clin. Microbiol. Infect. 2012, 18, 941–945. [Google Scholar] [CrossRef] [PubMed] [Green Version]
- Thuong, N.T.; Van Den Berg, Y.; Huy, T.Q.; Tai, D.A.; Anh, B.N.H. Determinants of catastrophic health expenditure in Vietnam. Int. J. Health Plan. Manag. 2021, 36, 316–333. [Google Scholar] [CrossRef]
- Ciarleglio, F.A.; Rigoni, M.; Mereu, L.; Tommaso, C.; Carrara, A.; Malossini, G.; Tateo, S.; Tirone, G.; Bjerklund Johansen, T.E.; Benetollo, P.P.; et al. The negative effects of COVID-19 and national lockdown on emergency surgery morbidity due to delayed access. World J. Emerg. Surg. 2021, 16, 37. [Google Scholar] [CrossRef]
- CovidSurg Collaborative. Effect of COVID-19 pandemic lockdowns on planned cancer surgery for 15 tumour types in 61 countries: An international, prospective, cohort study. Lancet Oncol. 2021, 22, 1507–1517. [Google Scholar] [CrossRef]
- Hjelholt, T.J.; Johnsen, S.P.; Brynningsen, P.K.; Knudsen, J.S.; Prieto-Alhambra, D.; Pedersen, A.B. Development and validation of a model for predicting mortality in patients with hip fracture. Age Ageing 2022, 51, afab233. [Google Scholar] [CrossRef] [PubMed]
- Murthy, S.; Clapp, J.T.; Burson, R.C.; Fleisher, L.A.; Neuman, M.D. Physicians’ perspectives of prognosis and goals of care discussions after hip fracture. J. Am. Geriatr. Soc. 2022, 70, 1487–1494. [Google Scholar] [CrossRef] [PubMed]
- Brent, L.; Ferris, H.; Sorensen, J.; Valentelyte, G.; Kelly, F.; Hurson, C.; Ahern, E. Impact of COVID-19 on hip fracture care in Ireland: Findings from the Irish Hip Fracture Database. Eur. Geriatr. Med. 2022, 13, 425–431. [Google Scholar] [CrossRef]
- Challoner, T.; Vesel, T.; Dosanjh, A.; Kok, K. The risk of pressure ulcers in a proned Covid population. Surgeon 2022, 20, e144–e148. [Google Scholar] [CrossRef]
- Sleiwah, A.; Nair, G.; Mughal, M.; Lancaster, K.; Ahmad, I. Perioral pressure ulcers in patients with COVID-19 requiring invasive mechanical ventilation. Eur. J. Plast. Surg. 2020, 43, 727–732. [Google Scholar] [CrossRef]
- Bonazzetti, C.; Morena, V.; Giacomelli, A.; Oreni, L.; Casalini, G.; Galimberti, L.R.; Bolis, M.; Rimoldi, M.; Ballone, E.; Colombo, R.; et al. Unexpectedly high frequency of enterococcal bloodstream infections in Coronavirus disease 2019 patients admitted to an Italian ICU: An observational study. Crit. Care Med. 2021, 49, e31–e40. [Google Scholar] [CrossRef]
- Cataldo, M.A.; Tetaj, N.; Selleri, M.; Marchioni, L.; Capone, A.; Caraffa, E.; Caro, A.D.; Petrosillo, N. INMICOVID-19 Co-infection Group Incidence of bacterial and fungal bloodstream infections in COVID-19 patients in intensive care: An alarming “collateral effect”. J. Glob. Antimicrob. Resist. 2020, 23, 290–291. [Google Scholar] [CrossRef] [PubMed]
- Pitiriga, V.; Kanellopoulos, P.; Bakalis, I.; Kampos, E.; Sagris, I.; Saroglou, G.; Tsakris, A. Central venous catheter-related bloodstream infection and colonization: The impact of insertion site and distribution of multidrug-resistant pathogens. Antimicrob. Resist. Infect. Control 2020, 9, 189. [Google Scholar] [CrossRef]
- Pérez-Granda, M.J.; Carrillo, C.S.; Rabadán, P.M.; Valerio, M.; Olmedo, M.; Muñoz, P.; Bouza, E. Increase in the frequency of catheter-related bloodstream infections during the COVID-19 pandemic: A plea for control. J. Hosp. Infect. 2022, 119, 149–154. [Google Scholar] [CrossRef]
- Heidempergher, M.; Sabiu, G.; Orani, M.A.; Tripepi, G.; Gallieni, M. Targeting COVID-19 prevention in hemodialysis facilities is associated with a drastic reduction in central venous catheter-related infections. J. Nephrol. 2021, 34, 345–353. [Google Scholar] [CrossRef]
- Narayan, S.W.; Gad, F.; Chong, J.; Chen, V.M.; Patanwala, A.E. Preventability of venous thromboembolism in hospitalised patients. Intern. Med. J. 2021, 53, 577–583. [Google Scholar] [CrossRef] [PubMed]
- Nyquist, P.; Bautista, C.; Jichici, D.; Burns, J.; Chhangani, S.; DeFilippis, M.; Goldenberg, F.D.; Kim, K.; Liu-DeRyke, X.; Mack, W.; et al. Prophylaxis of venous thrombosis in neurocritical care patients: An evidence-based guideline: A statement for healthcare professionals from the Neurocritical Care Society. Neurocrit. Care 2016, 24, 47–60. [Google Scholar] [CrossRef]
- Sauro, K.M.; Soo, A.; Kramer, A.; Couillard, P.; Kromm, J.; Zygun, D.; Niven, D.J.; Bagshaw, S.M.; Stelfox, H.T. Venous thromboembolism prophylaxis in neurocritical care patients: Are current practices, best practices? Neurocrit. Care 2019, 30, 355–363. [Google Scholar] [CrossRef]
- Schulman, S. Is venous thromboembolism a preventable cause of death? Lancet Haematol. 2020, 7, e555–e556. [Google Scholar] [CrossRef]
- Middeldorp, S.; Coppens, M.; van Haaps, T.F.; Foppen, M.; Vlaar, A.P.; Müller, M.C.A.; Bouman, C.C.S.; Beenen, L.F.M.; Kootte, R.S.; Heijmans, J.; et al. Incidence of venous thromboembolism in hospitalized patients with COVID-19. J. Thromb. Haemost. 2020, 18, 1995–2002. [Google Scholar] [CrossRef] [PubMed]
- Porfidia, A.; Valeriani, E.; Pola, R.; Porreca, E.; Rutjes, A.W.; Di Nisio, M. Venous thromboembolism in patients with COVID-19: Systematic review and meta-analysis. Thromb. Res. 2020, 196, 67–74. [Google Scholar] [CrossRef] [PubMed]
- Baboudjian, M.; Mhatli, M.; Bourouina, A.; Gondran-Tellier, B.; Anastay, V.; Perez, L.; Proye, P.; Lavieille, J.P.; Duchateau, F.; Agostini, A.; et al. Is minor surgery safe during the COVID-19 pandemic? A multi-disciplinary study. PLoS ONE 2021, 16, e0251122. [Google Scholar] [CrossRef] [PubMed]
- Donnelly, J.P.; Wang, X.Q.; Iwashyna, T.J.; Prescott, H.C. Readmission and death after initial hospital discharge among patients with COVID-19 in a large multihospital system. JAMA 2021, 325, 304–306. [Google Scholar] [CrossRef] [PubMed]
- Wolkewitz, M.; Zortel, M.; Palomar-Martinez, M.; Alvarez-Lerma, F.; Olaechea-Astigarraga, P.; Schumacher, M. Landmark prediction of nosocomial infection risk to disentangle short-and long-stay patients. J. Hosp. Infect. 2017, 96, 81–84. [Google Scholar] [CrossRef]
- Tellapragada, C.; Giske, C.G. The Unyvero Hospital-Acquired pneumonia panel for diagnosis of secondary bacterial pneumonia in COVID-19 patients. Eur. J. Clin. Microbiol. Infect. Dis. 2021, 40, 2479–2485. [Google Scholar] [CrossRef]
- Sibert, N.T.; Pfaff, H.; Breidenbach, C.; Wesselmann, S.; Kowalski, C. Different approaches for case-mix adjustment of patient-reported outcomes to compare healthcare providers—Methodological results of a systematic review. Cancers 2021, 13, 3964. [Google Scholar] [CrossRef]
- Ferreira, D.C.; Marques, R.C. Should inpatients be adjusted by their complexity and severity for efficiency assessment? Evidence from Portugal. Health Care Manag. Sci. 2016, 19, 43–57. [Google Scholar] [CrossRef]
- Herr, A. Cost and technical efficiency of German hospitals: Does ownership matter? Health Econ. 2008, 17, 1057–1071. [Google Scholar] [CrossRef]
- Cherchye, L.; Moesen, W.; Rogge, N.; Puyenbroeck, T.V. An introduction to ‘benefit of the doubt’ composite indicators. Soc. Indic. Res. 2007, 82, 111–145. [Google Scholar] [CrossRef]
- Cherchye, L.; Moesen, W.; Rogge, N.; Van Puyenbroeck, T. Constructing composite indicators with imprecise data: A proposal. Exp. Syst. Appl. 2011, 38, 10940–10949. [Google Scholar] [CrossRef]
- Rogge, N. On aggregating benefit of the doubt composite indicators. Eur. J. Oper. Res. 2018, 264, 364–369. [Google Scholar] [CrossRef]
- Bernini, C.; Guizzardi, A.; Angelini, G. DEA-like model and common weights approach for the construction of a subjective community well-being indicator. Soc. Indic. Res. 2013, 114, 405–424. [Google Scholar] [CrossRef]
- Greco, S.; Ishizaka, A.; Tasiou, M.; Torrisi, G. On the methodological framework of composite indices: A review of the issues of weighting, aggregation, and robustness. Soc. Indic. Res. 2019, 141, 61–94. [Google Scholar] [CrossRef] [Green Version]
- Decancq, K.; Lugo, M.A. Weights in multidimensional indices of wellbeing: An overview. Econom. Rev. 2013, 32, 7–34. [Google Scholar] [CrossRef] [Green Version]
- Tourinho, M.; Santos, P.R.; Pinto, F.T.; Camanho, A.S. Performance assessment of water services in Brazilian municipalities: An integrated view of efficiency and access. Socio-Econ. Plan. Sci. 2021, 79, 101139. [Google Scholar] [CrossRef]
- Ferreira, D.C.; Caldas, P.; Varela, M.; Marques, R.C. A geometric aggregation of performance indicators considering regulatory constraints: An application to the urban solid waste management. Exp. Syst. Appl. 2023, 218, 119540. [Google Scholar] [CrossRef]
- Matos, R.; Ferreira, D.; Pedro, M.I. Economic analysis of Portuguese public hospitals through the construction of quality, efficiency, access, and financial related composite indicators. Soc. Indic. Res. 2021, 157, 361–392. [Google Scholar] [CrossRef]
- Ferreira, D.C.; Marques, R.C. Malmquist and Hicks–Moorsteen productivity indexes for clusters performance evaluation. Int. J. Inf. Technol. Decis. Mak. 2016, 15, 1015–1053. [Google Scholar] [CrossRef]
- Portela, M.C.A.S.; Thanassoulis, E. Malmquist indexes using a geometric distance function (GDF). Application to a sample of Portuguese bank branches. J. Product. Anal. 2006, 25, 25–41. [Google Scholar] [CrossRef] [Green Version]
- Portela, M.C.; Thanassoulis, E. Developing a decomposable measure of profit efficiency using DEA. J. Oper. Res. Soc. 2007, 58, 481–490. [Google Scholar] [CrossRef] [Green Version]
- Hale, T.; Angrist, N.; Goldszmidt, R.; Kira, B.; Petherick, A.; Phillips, T.; Webster, S.; Cameron-Blake, E.; Hallas, L.; Majumdar, S.; et al. A global panel database of pandemic policies (Oxford COVID-19 Government Response Tracker). Nat. Hum. Behav. 2021, 5, 529–538. [Google Scholar] [CrossRef] [PubMed]
- Nunes, A.M.; Ferreira, D.C.; Campos Fernandes, A. Financial crisis in Portugal: Effects in the health care sector. Int. J. Health Serv. 2019, 49, 237–259. [Google Scholar] [CrossRef] [PubMed] [Green Version]
- Nunes, A.M.; Ferreira, D.C. Reforms in the Portuguese health care sector: Challenges and proposals. Int. J. Health Plan. Manag. 2019, 34, e21–e33. [Google Scholar] [CrossRef] [Green Version]
- Nunes, A.M.; Ferreira, D.C. The health care reform in Portugal: Outcomes from both the New Public Management and the economic crisis. Int. J. Health Plan. Manag. 2019, 34, 196–215. [Google Scholar] [CrossRef] [Green Version]
- Ferreira, D.C.; Nunes, A.M. Technical efficiency of Portuguese public hospitals: A comparative analysis across the five regions of Portugal. Int. J. Health Plan. Manag. 2019, 34, e411–e422. [Google Scholar] [CrossRef] [PubMed] [Green Version]
- Ferreira, D.C.; Nunes, A.M.; Marques, R.C. Doctors, nurses, and the optimal scale size in the Portuguese public hospitals. Health Policy 2018, 122, 1093–1100. [Google Scholar] [CrossRef] [PubMed]
- Ferreira, D.; Marques, R.C. Did the corporatization of Portuguese hospitals significantly change their productivity? Eur. J. Health Econ. 2015, 16, 289–303. [Google Scholar] [CrossRef] [PubMed]
- Ferreira, D.C.; Marques, R.C.; Nunes, A.M. Economies of scope in the health sector: The case of Portuguese hospitals. Eur. J. Oper. Res. 2018, 266, 716–735. [Google Scholar] [CrossRef]
- Ferreira, D.; Marques, R.C. Identifying congestion levels, sources and determinants on intensive care units: The Portuguese case. Health Care Manag. Sci. 2018, 21, 348–375. [Google Scholar] [CrossRef]
- Cook, W.D.; Ramón, N.; Ruiz, J.L.; Sirvent, I.; Zhu, J. DEA-based benchmarking for performance evaluation in pay-for-performance incentive plans. Omega 2019, 84, 45–54. [Google Scholar] [CrossRef] [Green Version]
- Nunes, A.M.; Ferreira, D. Evaluating Portuguese Public Hospitals Performance: Any Difference before and during COVID-19? Sustainability 2023, 15, 294. [Google Scholar] [CrossRef]
- Afonso, G.P.; Ferreira, D.C.; Figueira, J.R. A Network-DEA model to evaluate the impact of quality and access on hospital performance. Ann. Oper. Res. 2023, 1–31. [Google Scholar] [CrossRef] [PubMed]
- Plank, P.A.; Gomes, L.F.; Caldas, P.; Varela, M.; Ferreira, D.C. Assessing the Traveling Risks Perceived by South African Travelers during Pandemic Outbreaks: The Case of COVID-19. Sustainability 2023, 15, 9267. [Google Scholar] [CrossRef]
- Ibrahim, M.D.; Alola, A.A.; Ferreira, D.C. Assessing sustainable development goals attainment through energy-environmental efficiency: The case of Latin American and Caribbean countries. Sustain. Energy Technol. Assess. 2023, 57, 103219. [Google Scholar] [CrossRef]
- Amaral, C.; Pedro, M.I.; Ferreira, D.C.; Marques, R.C. Performance and its determinants in the Portuguese municipal solid waste utilities. Waste Manag. 2022, 139, 70–84. [Google Scholar] [CrossRef] [PubMed]
- Pereira, M.A.; Nunes, A.M.; Ferreira, D.C. Do the Resilience and Adaptive Capacity to Climate-Related Disasters Help Explain Human Health and Well-Being? In Climate Change and Health Hazards: Addressing Hazards to Human and Environmental Health from a Changing Climate; Springer Nature: Cham, Switzerland, 2023; pp. 309–329. [Google Scholar]
- Ferreira, D.C.; Figueira, J.R.; Greco, S.; Marques, R.C. Data envelopment analysis models with imperfect knowledge of input and output values: An application to Portuguese public hospitals. Exp. Syst. Appl. 2023, 231, 120543. [Google Scholar] [CrossRef]
Figure 1.
COVID-19 daily new infections and deaths in Portugal (source: DGS, Status Report no. 763|16 August to 22 August 2022). (a) COVID-19 daily number of new cases in Portugal. (b) COVID-19 related deaths per million inhabitants in Portugal.
Figure 1.
COVID-19 daily new infections and deaths in Portugal (source: DGS, Status Report no. 763|16 August to 22 August 2022). (a) COVID-19 daily number of new cases in Portugal. (b) COVID-19 related deaths per million inhabitants in Portugal.

Figure 2.
Hospital and Intensive Care Units’ admissions because of COVID-19 in Portugal (source: DGS, Status Report no. 763|16 August to 22 August 2022).
Figure 2.
Hospital and Intensive Care Units’ admissions because of COVID-19 in Portugal (source: DGS, Status Report no. 763|16 August to 22 August 2022).

Figure 3.
Hospital efficiency and productivity evolution, per group. (a) Evolution of static performance, P, for the efficiency–productivity group of variables. (b) Evolution of dynamic performance, T, for the efficiency–productivity group of variables.
Figure 3.
Hospital efficiency and productivity evolution, per group. (a) Evolution of static performance, P, for the efficiency–productivity group of variables. (b) Evolution of dynamic performance, T, for the efficiency–productivity group of variables.

Figure 4.
Access performance evolution per group. (a) Evolution of static performance, P, for the access group of variables. (b) Evolution of dynamic performance, T, for the access group of variables.
Figure 4.
Access performance evolution per group. (a) Evolution of static performance, P, for the access group of variables. (b) Evolution of dynamic performance, T, for the access group of variables.

Figure 5.
Hospital safety and care appropriateness performance evolution, per group. (a) Evolution of static performance, P, for the safety and appropriateness of care group of variables. (b) Evolution of dynamic performance, T, for the safety and appropriateness of care group of variables.
Figure 5.
Hospital safety and care appropriateness performance evolution, per group. (a) Evolution of static performance, P, for the safety and appropriateness of care group of variables. (b) Evolution of dynamic performance, T, for the safety and appropriateness of care group of variables.


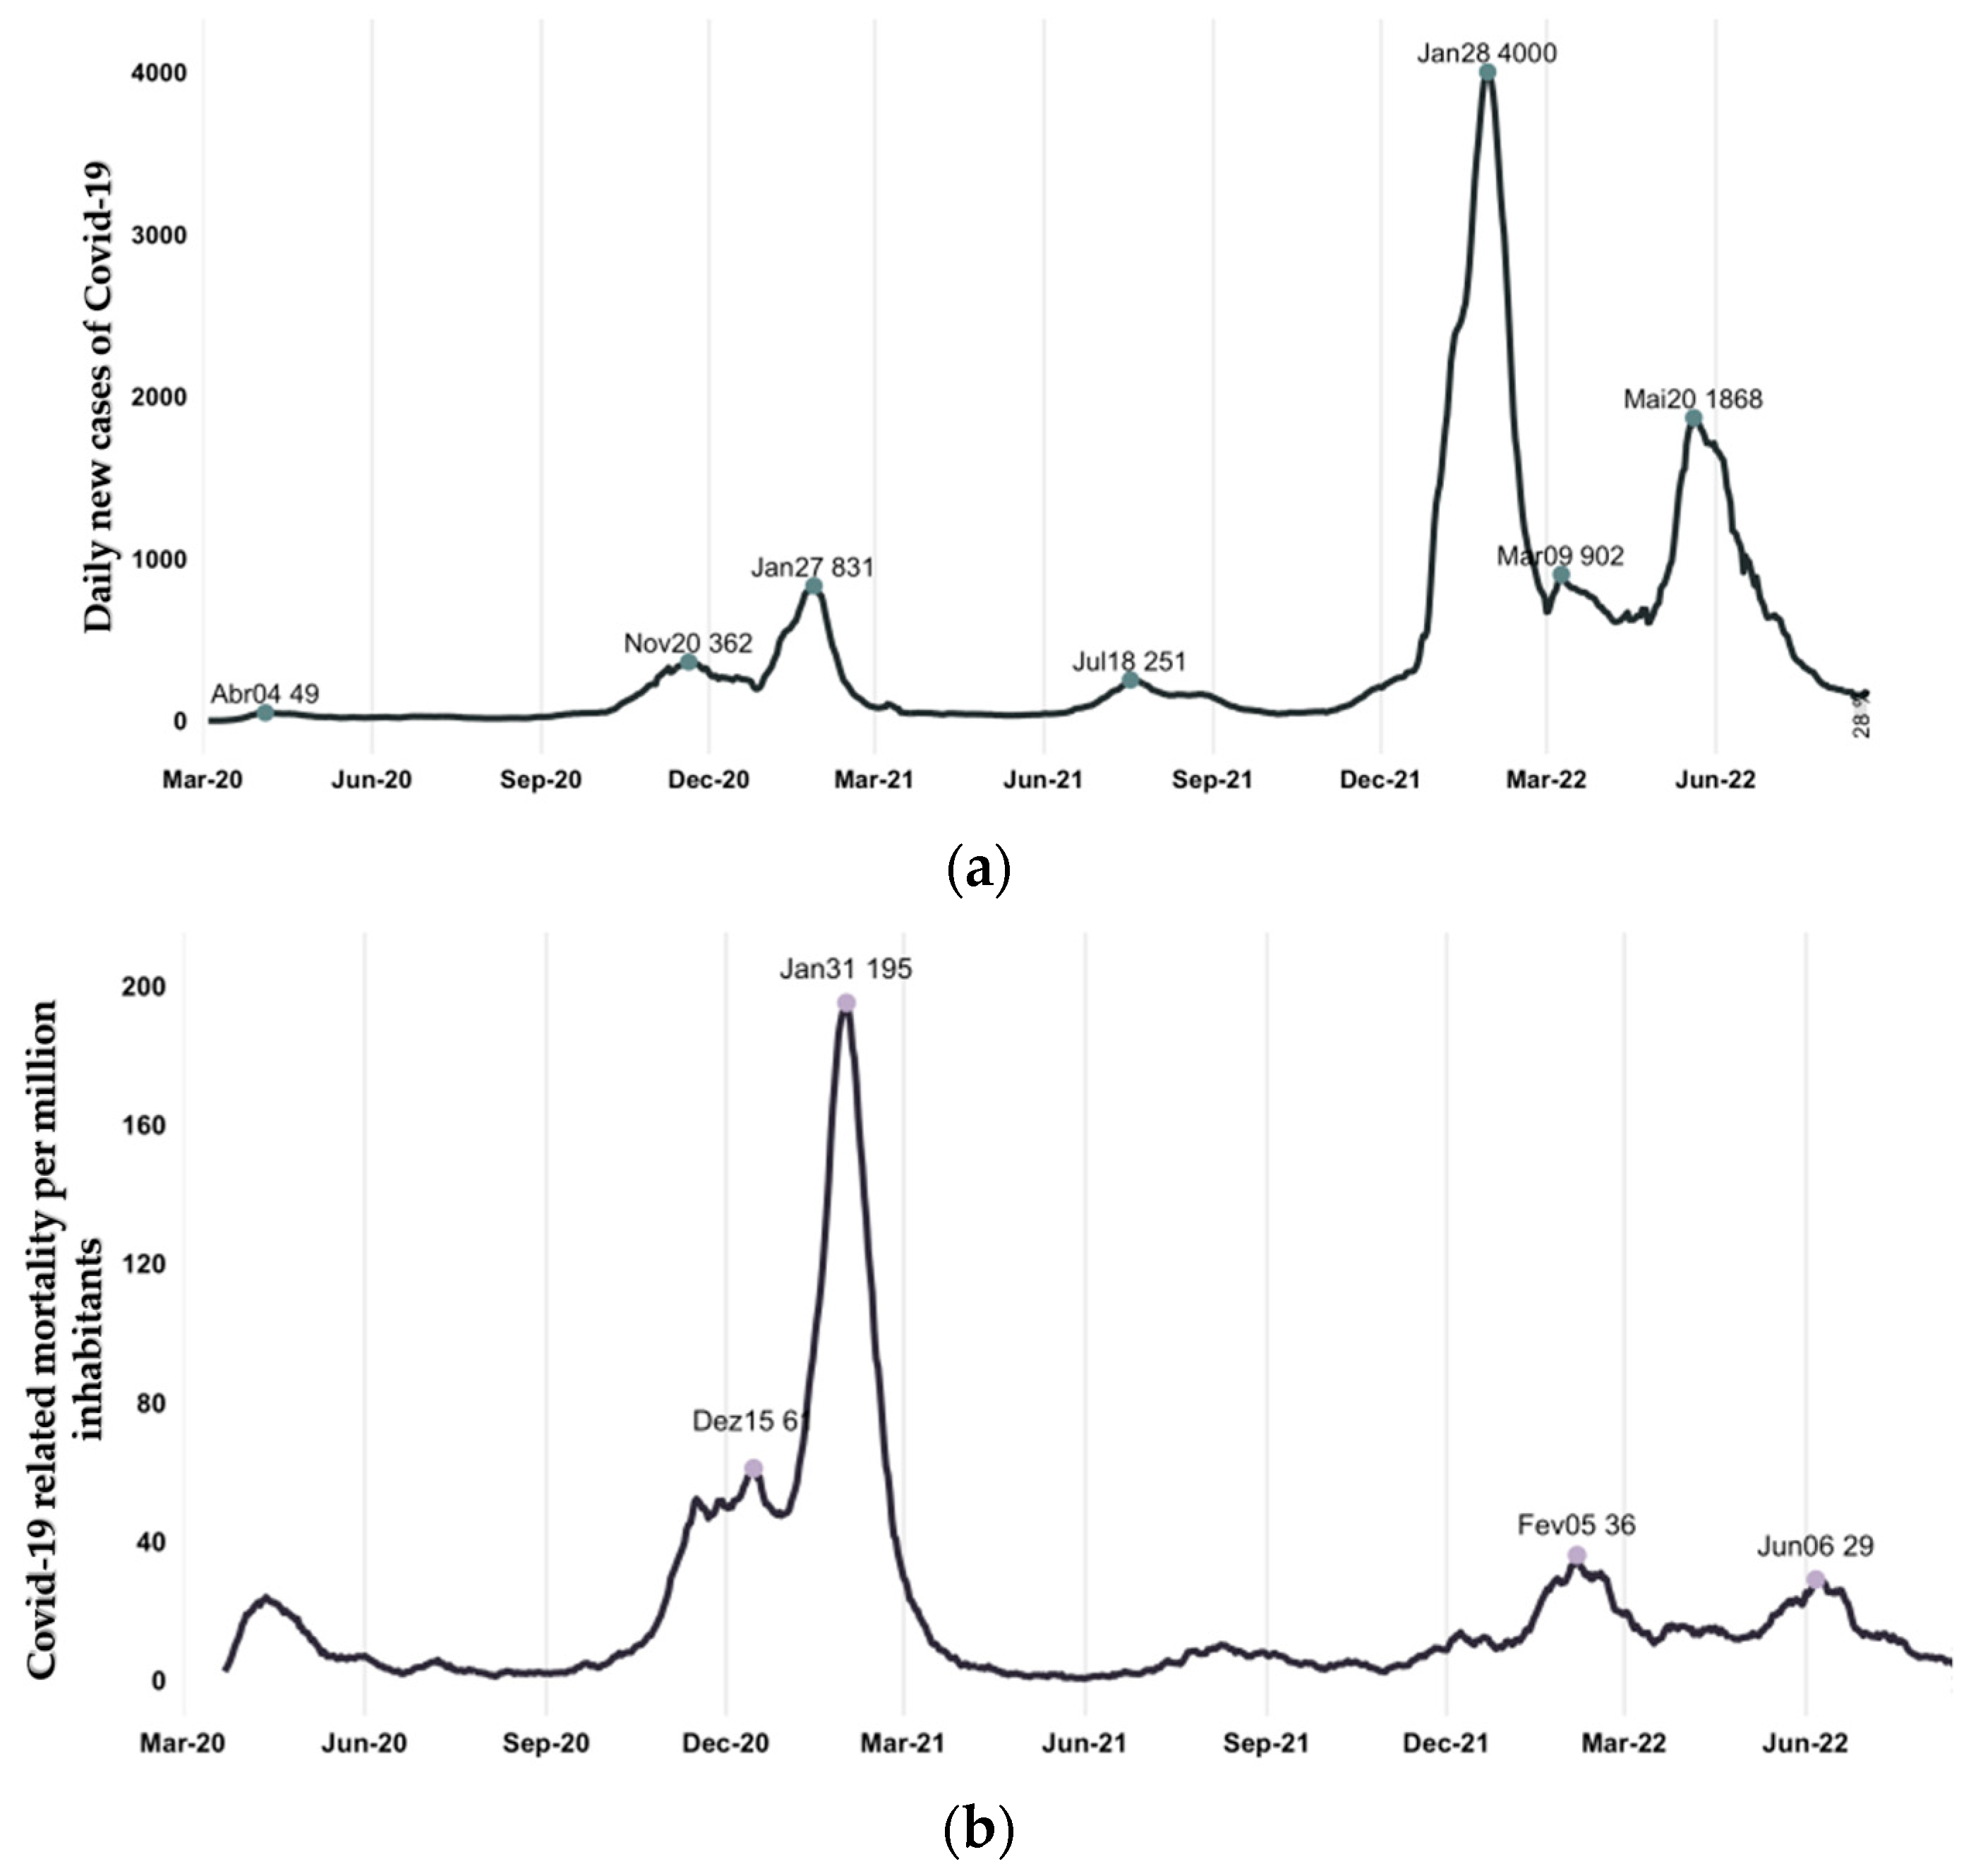
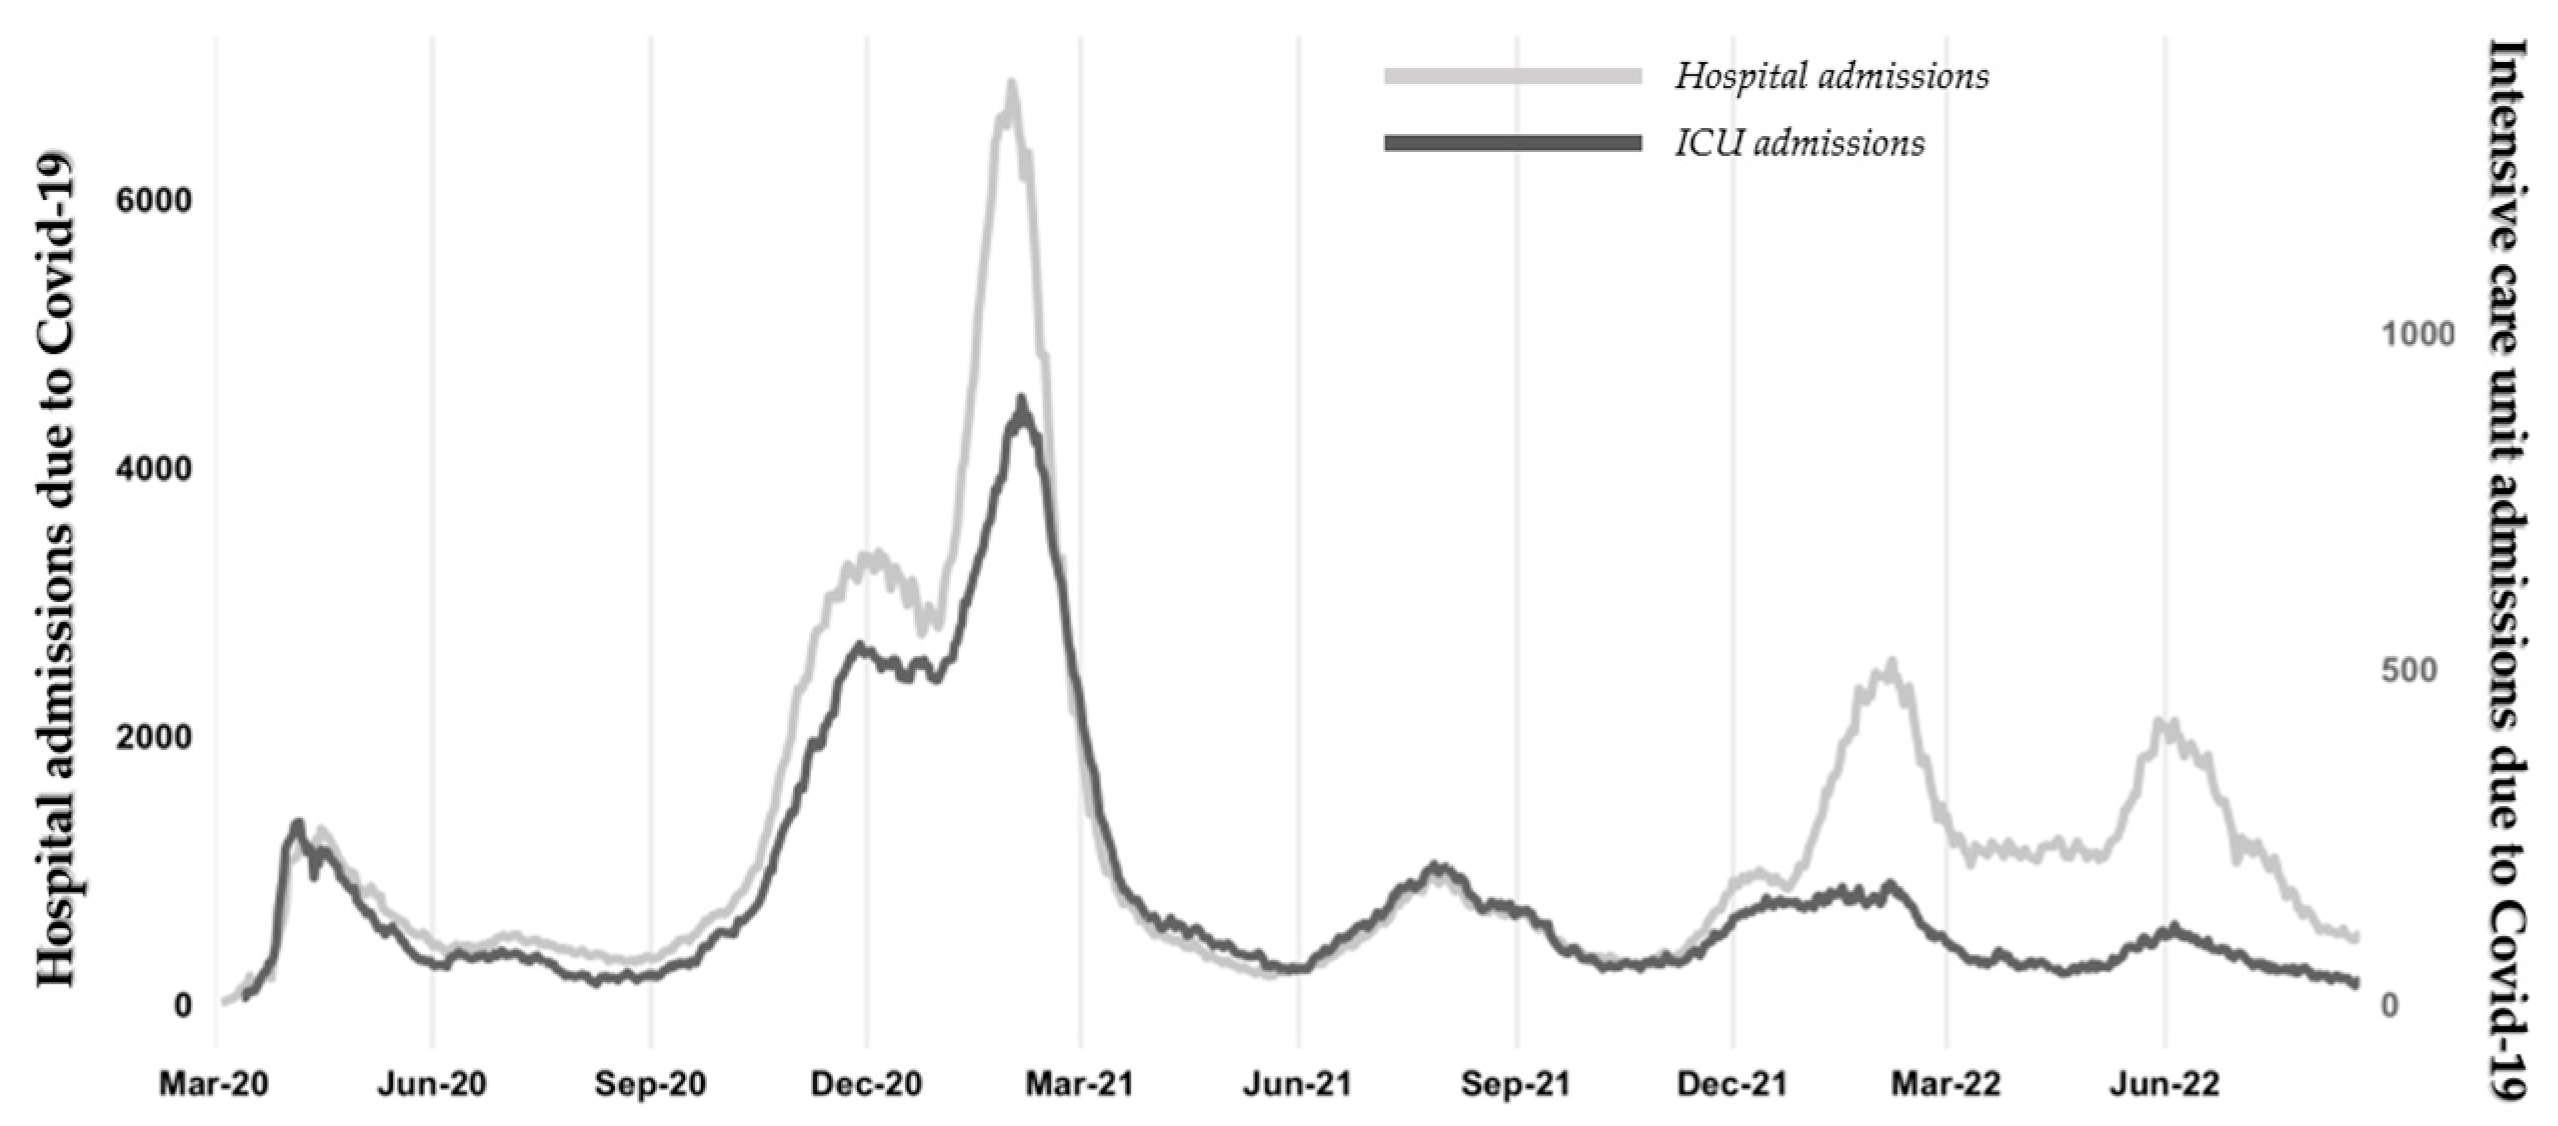
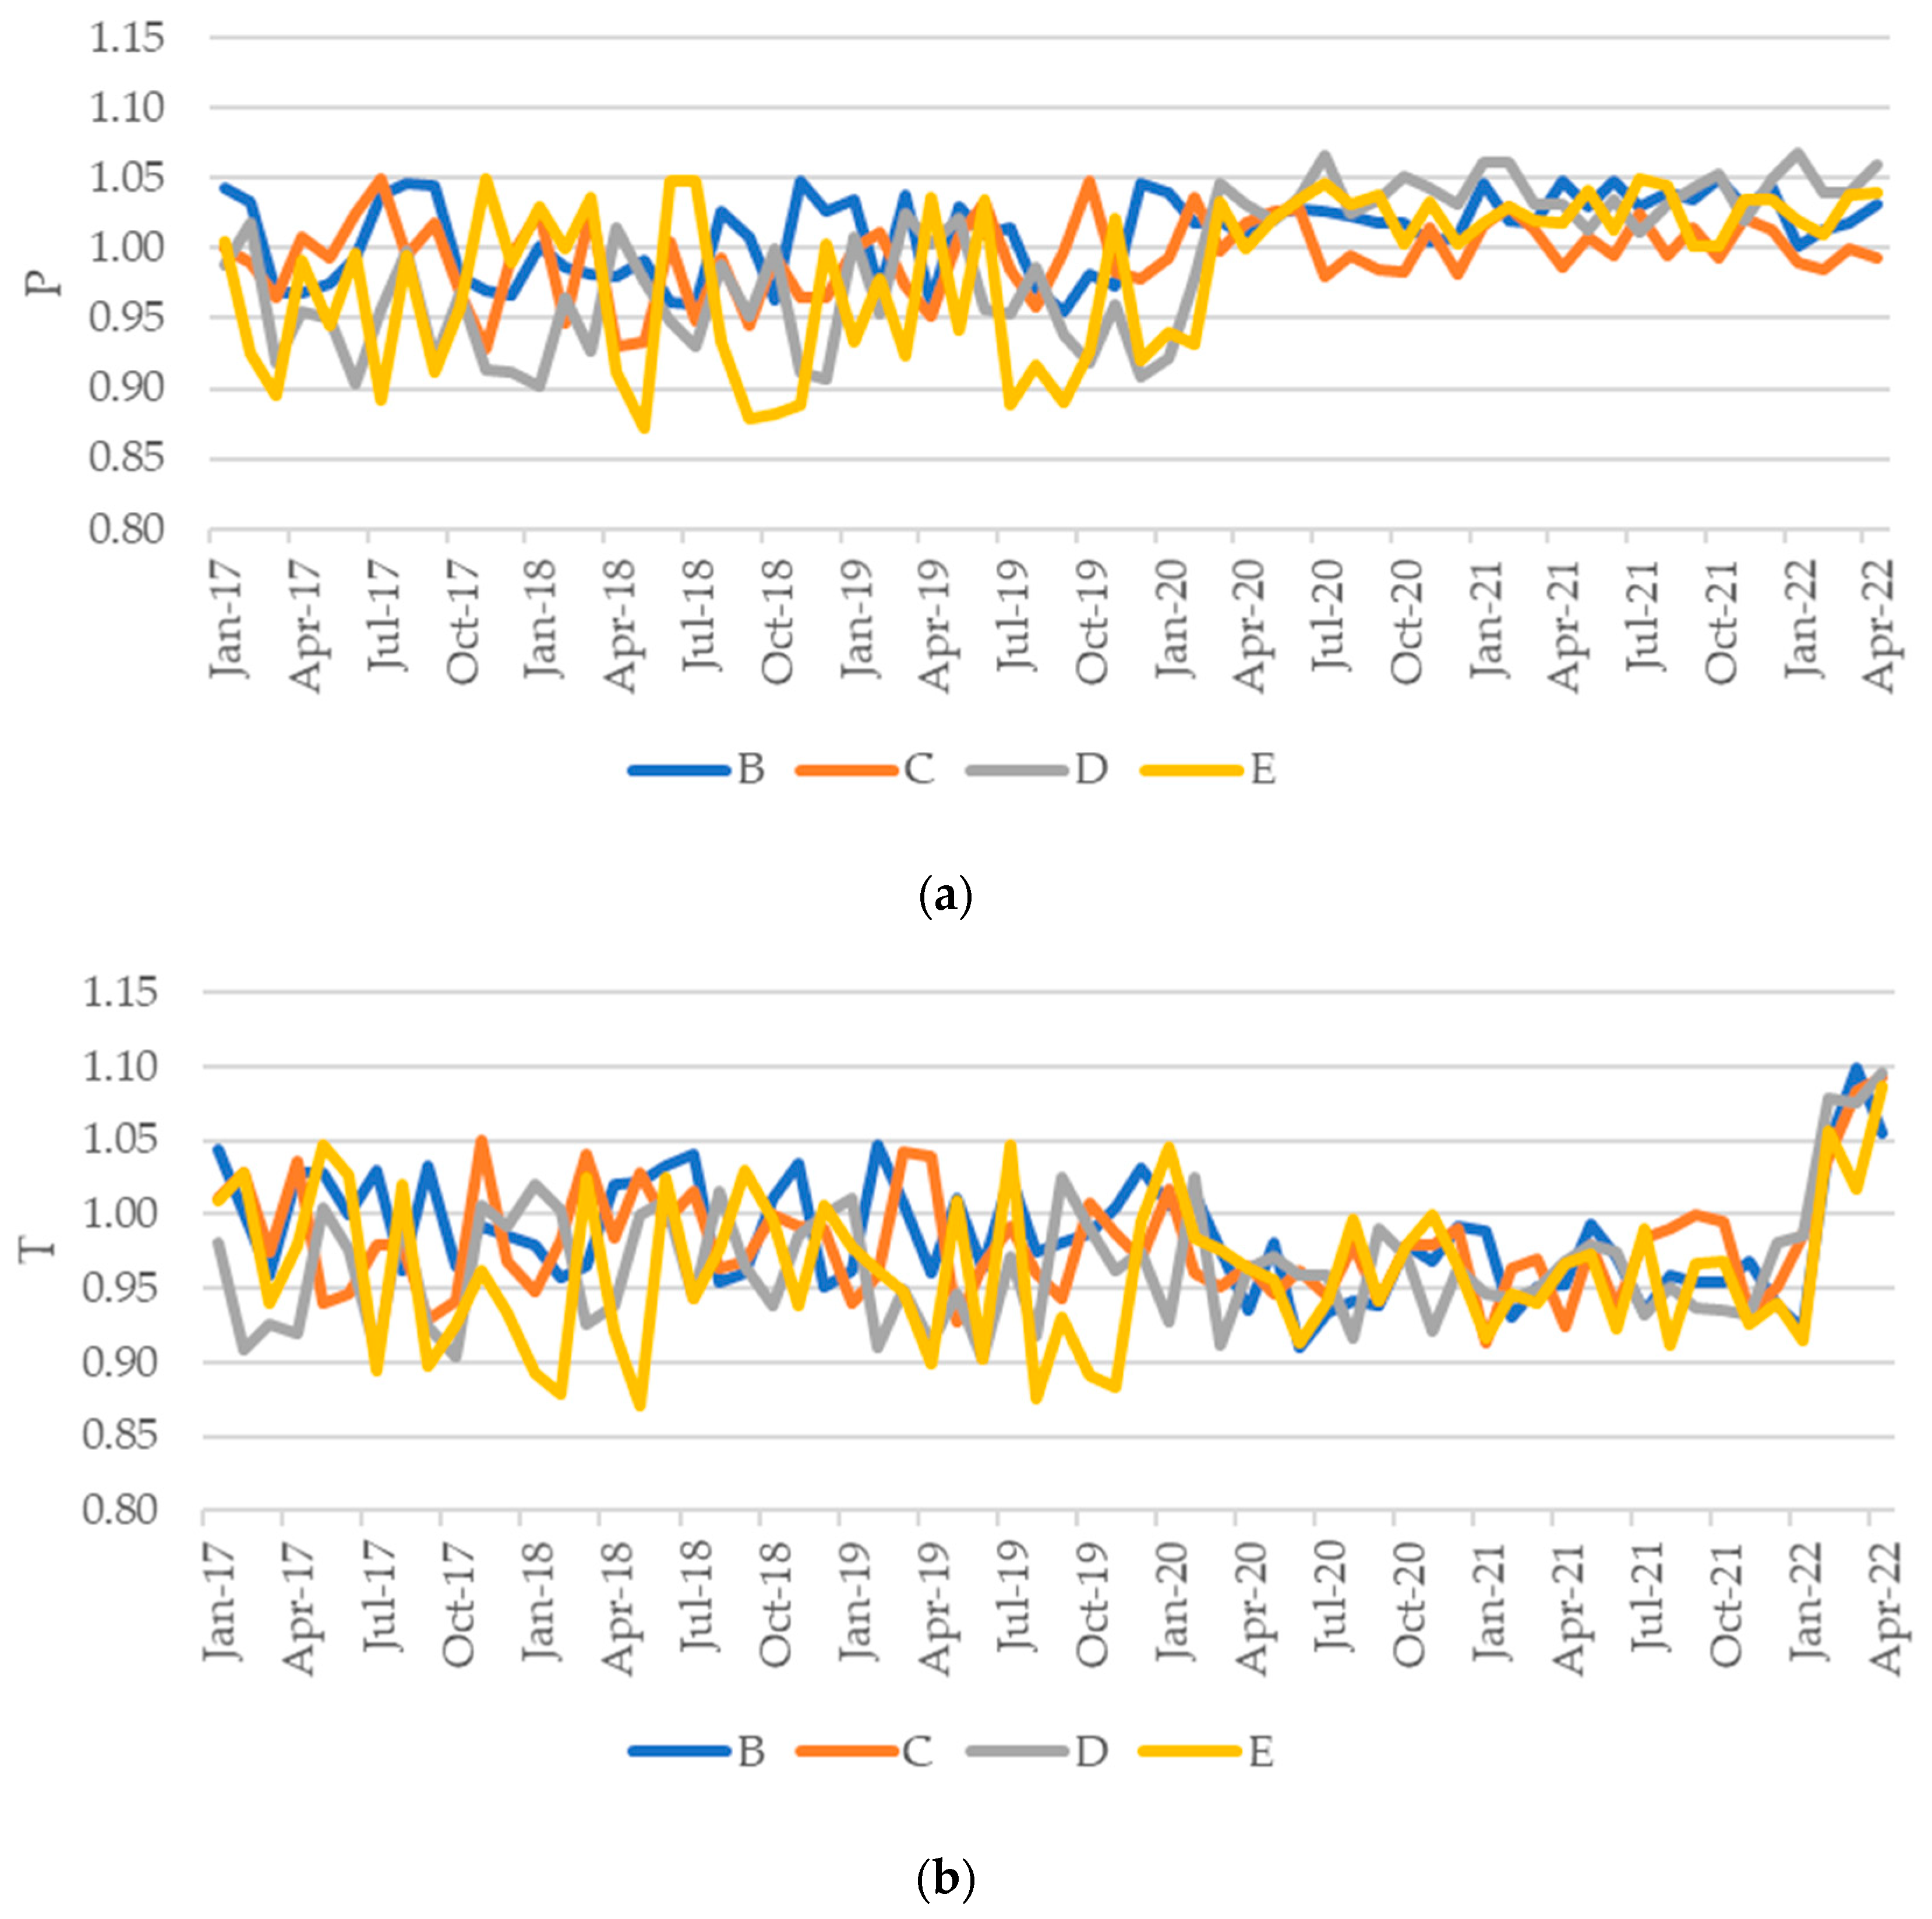
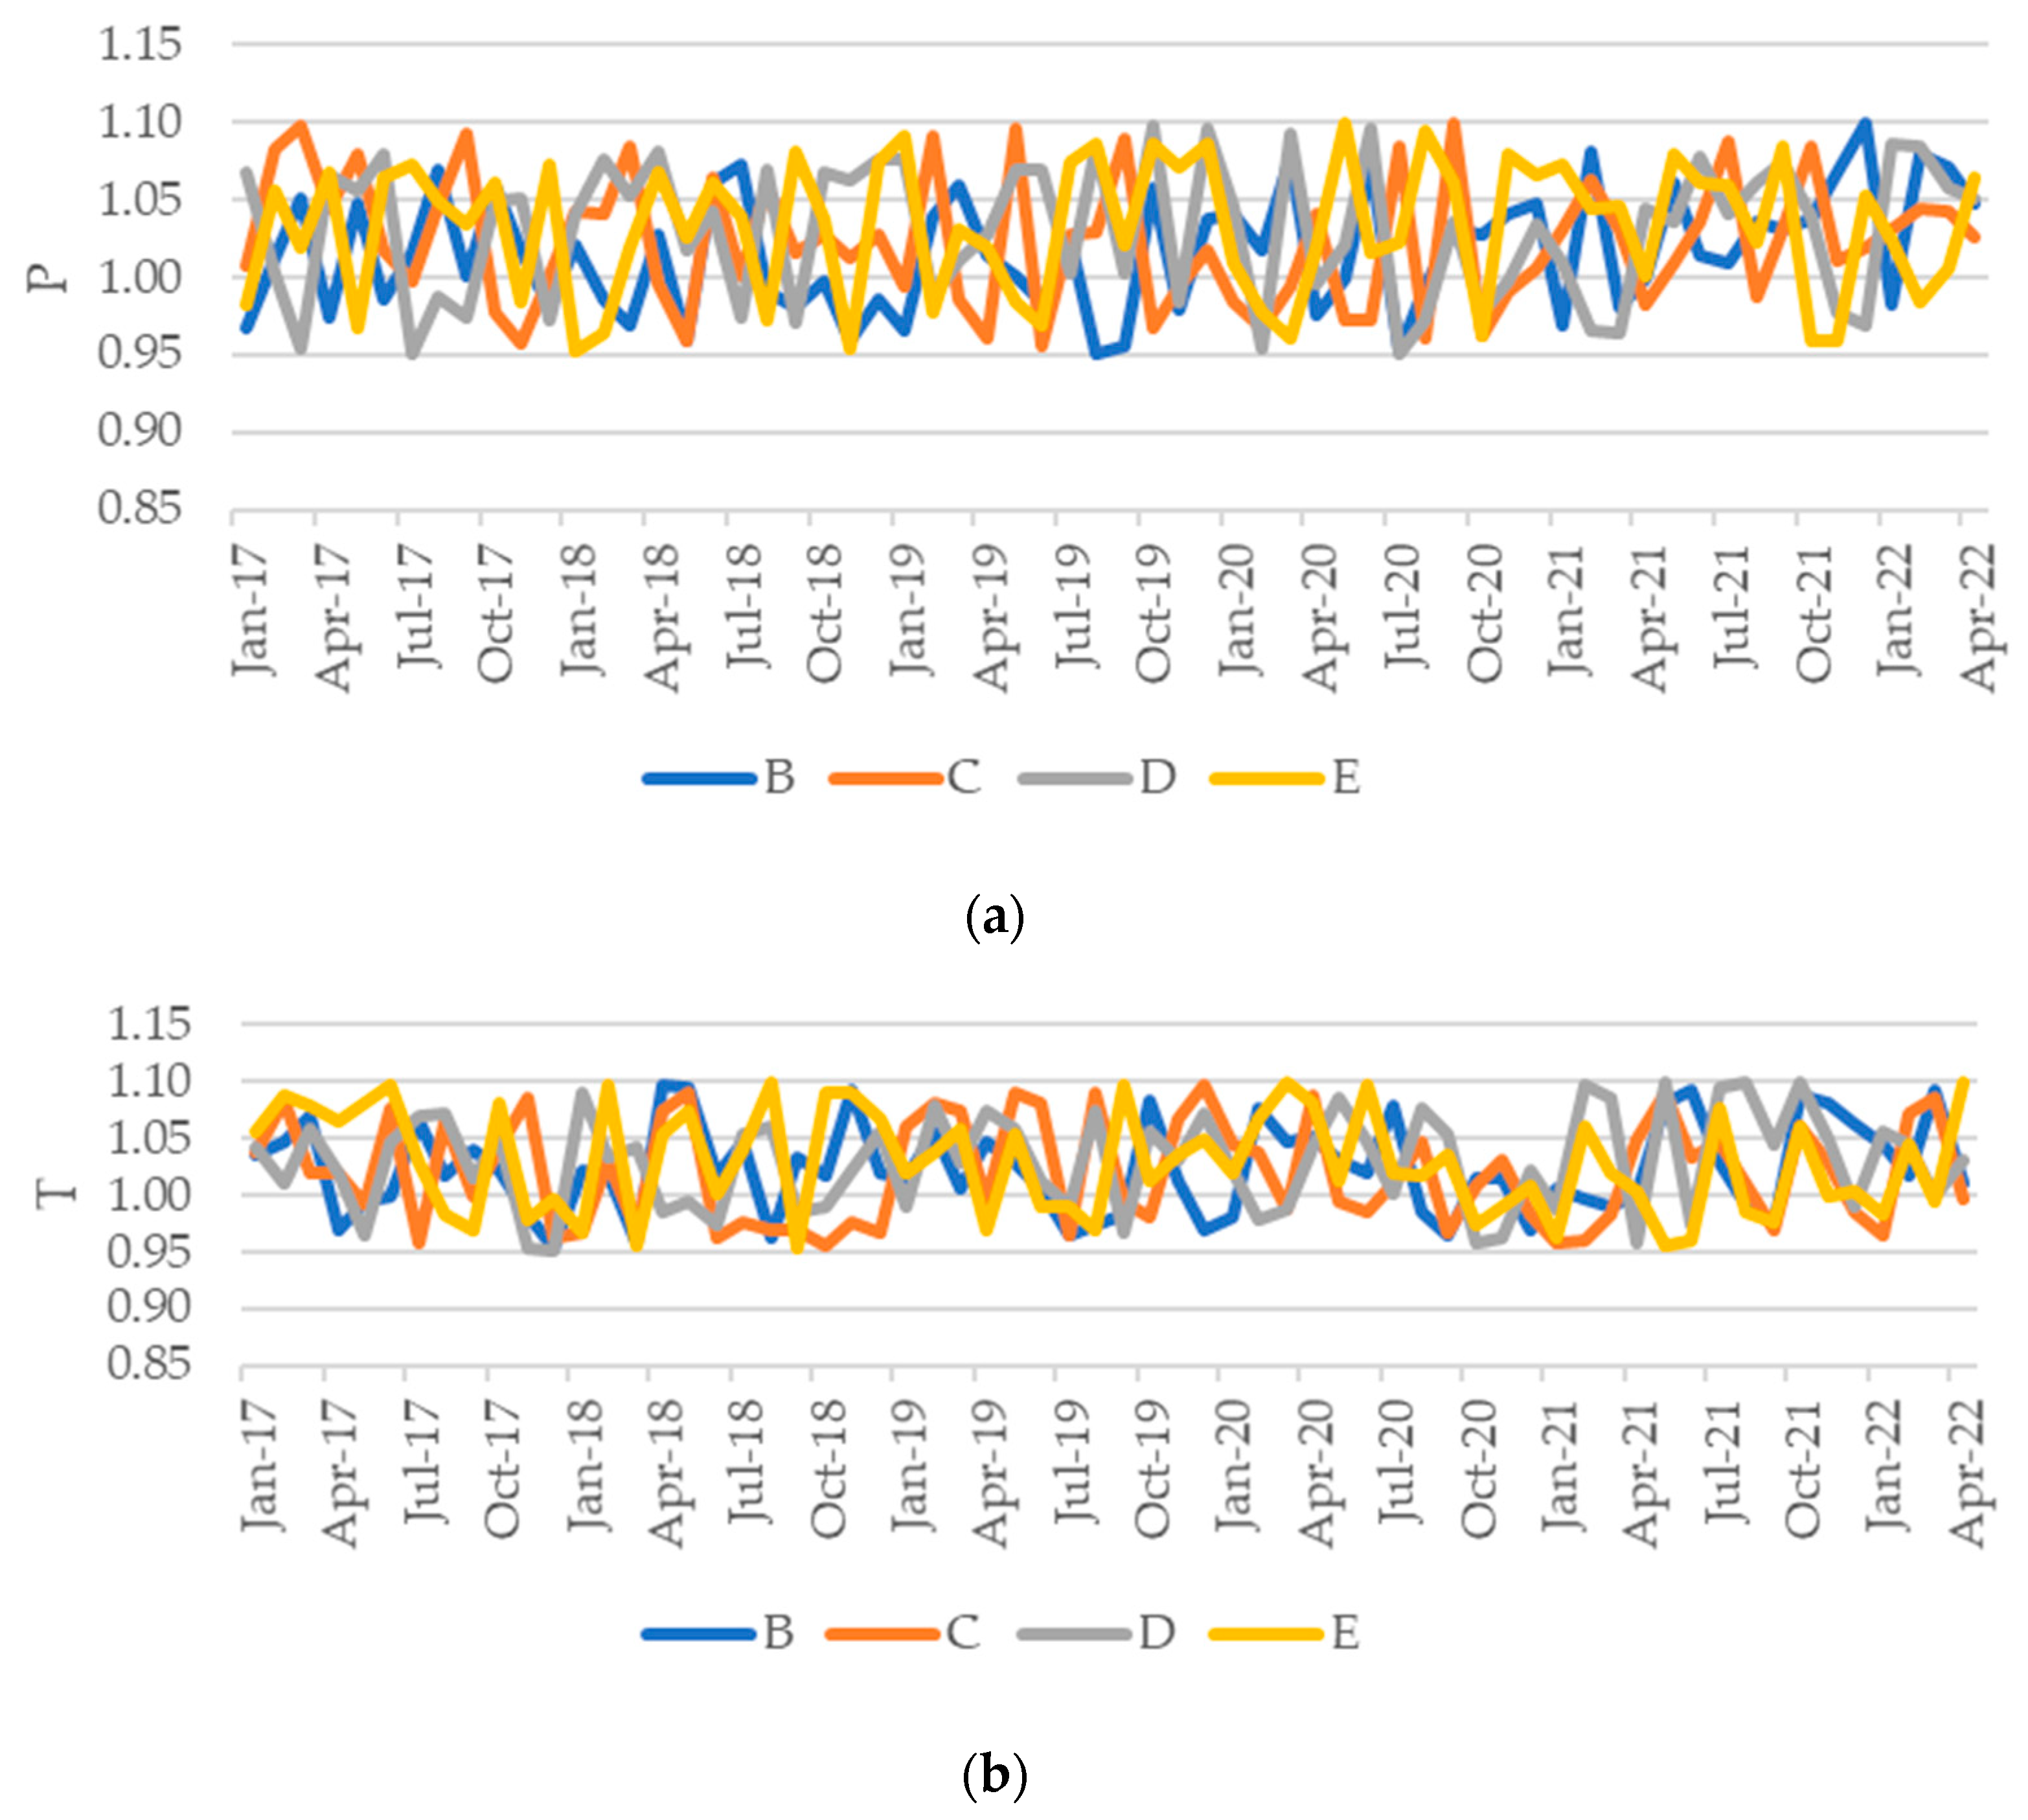
Table 1.
Correspondence between quality domains identified in the literature.
| Institute of Medicine | Donabedian [38,39,40] | Ferreira and Marques [35], Ferreira, Marques, Nunes and Figueira [37,41] |
|---|---|---|
| Safety | Process | Safety |
| Effectiveness | Results | Patient satisfaction, quality of life improvement, care appropriateness |
| Patient-centeredness | Process | Care appropriateness |
| Timeliness | Attributes | Access |
| Efficiency (and productivity) | Attributes | Efficiency and productivity |
| Equity | Attributes | Access |
Table 2.
Hospital efficiency and productivity evolution, per group and period.
| Group | 01/2017–02/2020 | 03/2020–05/2022 | 03/2020–02/2021 | 03/2021–05/2022 | Global |
|---|---|---|---|---|---|
| Static performance | |||||
| B | 0.9995 | 1.0261 | 1.0205 | 1.0309 | 1.0102 |
| C | 0.9882 | 1.0033 | 1.0047 | 1.0021 | 0.9943 |
| D | 0.9559 | 1.0396 | 1.0421 | 1.0374 | 0.9890 |
| E | 0.9554 | 1.0252 | 1.0244 | 1.0259 | 0.9832 |
| Dynamic performance | |||||
| B | 0.9977 | 0.9674 | 0.9559 | 0.9774 | 0.9853 |
| C | 0.9835 | 0.9752 | 0.9594 | 0.9889 | 0.9801 |
| D | 0.9626 | 0.9676 | 0.9508 | 0.9823 | 0.9646 |
| E | 0.9591 | 0.9633 | 0.9573 | 0.9684 | 0.9608 |
| Total Factor Productivity | |||||
| B | 0.9972 | 0.9927 | 0.9755 | 1.0076 | 0.9954 |
| C | 0.9719 | 0.9784 | 0.9639 | 0.9910 | 0.9745 |
| D | 0.9201 | 1.0059 | 0.9908 | 1.0190 | 0.9540 |
| E | 0.9164 | 0.9876 | 0.9806 | 0.9935 | 0.9446 |
Table 3.
Beta coefficients for the multiple regression analysis over the hospital efficiency and productivity.
Table 3.
Beta coefficients for the multiple regression analysis over the hospital efficiency and productivity.
| Variables | P | T | TFP | |
|---|---|---|---|---|
| Intercept | 1.041 | 0.967 | 0.999 | |
| x1. | Infected people per million inhabitants | * | 0.300 | 0.159 |
| x2. | COVID-19-related deaths per million inhabitants | * | * | * |
| x3. | Reproduction rate | * | 0.689 | 0.314 |
| x4. | Intensive care unit admissions (because of COVID-19) per million inhabitants | * | 0.188 | 0.254 |
| x5. | Hospital admissions (because of COVID-19) per million inhabitants | * | 0.963 | 0.216 |
| x6. | Vaccination (complete) rate | * | * | * |
| x7. | Stringency index | * | −0.252 | −0.141 |
| Coefficient of determination, R2 | 0.039 | 0.561 | 0.211 | |
| Does the model violate the residuals’ normality? (Kolmogorov–Smirnov test) | No | No | No | |
| Does the model violate the residuals’ homoskedasticity? | Yes | No | Yes | |
| Does the model violate the residuals’ independence? (Durbin–Watson test) | Yes | No | Yes | |
Note: P—static performance change; T—dynamic performance change; TFP—total factor productivity. * Not statistically meaningful at the 5% significance level.
Table 4.
Access performance evolution per group and period.
| Group | 01/2017–02/2020 | 03/2020–05/2022 | 03/2020–02/2021 | 03/2021–05/2022 | Global |
|---|---|---|---|---|---|
| Static performance | |||||
| B | 1.0392 | 0.8990 | 0.8777 | 0.9176 | 0.9797 |
| C | 0.9543 | 0.8617 | 0.7957 | 0.9225 | 0.9155 |
| D | 0.9164 | 0.8638 | 0.7421 | 0.9838 | 0.8947 |
| E | 1.0001 | 0.8516 | 0.8054 | 0.8933 | 0.9368 |
| Dynamic performance | |||||
| B | 1.0195 | 0.8799 | 0.8588 | 0.8984 | 0.9603 |
| C | 0.9372 | 0.8494 | 0.7529 | 0.9420 | 0.9005 |
| D | 0.9069 | 0.8341 | 0.7450 | 0.9190 | 0.8766 |
| E | 1.0299 | 0.8757 | 0.7872 | 0.9595 | 0.9642 |
| Total Factor Productivity | |||||
| B | 1.0594 | 0.7910 | 0.7538 | 0.8244 | 0.9408 |
| C | 0.8943 | 0.7319 | 0.5991 | 0.8690 | 0.8244 |
| D | 0.8311 | 0.7205 | 0.5529 | 0.9040 | 0.7843 |
| E | 1.0299 | 0.7457 | 0.6340 | 0.8571 | 0.9033 |
Table 5.
Beta coefficients for the multiple regression analysis over the access to hospital care.
| Variables | P | T | TFP | |
|---|---|---|---|---|
| Intercept | 0.875 | 0.859 | 0.755 | |
| x1. | Infected people per million inhabitants | * | * | * |
| x2. | COVID-19-related deaths per million inhabitants | * | * | * |
| x3. | Reproduction rate | * | * | * |
| x4. | Intensive care unit admissions (because of COVID-19) per million inhabitants | −0.567 | −0.828 | −0.549 |
| x5. | Hospital admissions (because of COVID-19) per million inhabitants | −0.440 | −0.323 | −0.624 |
| x6. | Vaccination (complete) rate | * | * | * |
| x7. | Stringency index | −0.927 | −0.840 | −0.757 |
| Coefficient of determination, R2 | 0.725 | 0.668 | 0.590 | |
| Does the model violate the residuals’ normality? (Kolmogorov–Smirnov test) | No | No | No | |
| Does the model violate the residuals’ homoskedasticity? | No | No | No | |
| Does the model violate the residuals’ independence? (Autocorrelation test) | No | No | No | |
Note: P—static performance change; T—dynamic performance change; TFP—total factor productivity. * Not statistically meaningful at the 5% significance level.
Table 6.
Hospital safety and care appropriateness performance evolution, per group and period.
| Group | 01/2017–02/2020 | 03/2020–05/2022 | 03/2020–02/2021 | 03/2021–05/2022 | Global |
|---|---|---|---|---|---|
| Static performance | |||||
| B | 1.0074 | 1.0292 | 1.0215 | 1.0359 | 1.0162 |
| C | 1.0223 | 1.0221 | 1.0133 | 1.0297 | 1.0222 |
| D | 1.0315 | 1.0262 | 1.0113 | 1.0392 | 1.0294 |
| E | 1.0294 | 1.0335 | 1.0403 | 1.0276 | 1.0310 |
| Dynamic performance | |||||
| B | 1.0192 | 1.0269 | 1.0141 | 1.0380 | 1.0223 |
| C | 1.0223 | 1.0140 | 1.0004 | 1.0257 | 1.0189 |
| D | 1.0244 | 1.0346 | 1.0252 | 1.0428 | 1.0286 |
| E | 1.0342 | 1.0185 | 1.0281 | 1.0104 | 1.0278 |
| Total Factor Productivity | |||||
| B | 1.0267 | 1.0569 | 1.0359 | 1.0753 | 1.0389 |
| C | 1.0452 | 1.0364 | 1.0138 | 1.0562 | 1.0416 |
| D | 1.0567 | 1.0618 | 1.0367 | 1.0837 | 1.0588 |
| E | 1.0646 | 1.0526 | 1.0696 | 1.0383 | 1.0597 |
Table 7.
Beta coefficients for the multiple regression analysis over the hospital safety and care appropriateness.
Table 7.
Beta coefficients for the multiple regression analysis over the hospital safety and care appropriateness.
| Variables | P | T | TFP | |
|---|---|---|---|---|
| Intercept | 1.001 | 1.015 | 1.056 | |
| x1. | Infected people per million inhabitants | * | * | * |
| x2. | COVID-19-related deaths per million inhabitants | * | * | * |
| x3. | Reproduction rate | * | * | * |
| x4. | Intensive care unit admissions (because of COVID-19) per million inhabitants | * | * | * |
| x5. | Hospital admissions (because of COVID-19) per million inhabitants | * | * | * |
| x6. | Vaccination (complete) rate | * | * | * |
| x7. | Stringency index | * | * | * |
| Coefficient of determination, R2 | 0.002 | 0.000 | 0.000 | |
| Does the model violate the residuals’ normality? (Kolmogorov–Smirnov test) | No | No | No | |
| Does the model violate the residuals’ homoskedasticity? | Yes | Yes | Yes | |
| Does the model violate the residuals’ independence? (Autocorrelation test) | Yes | Yes | Yes | |
Note: P—static performance change; T—dynamic performance change; TFP—total factor productivity. * Not statistically meaningful at the 5% significance level.
Disclaimer/Publisher’s Note: The statements, opinions and data contained in all publications are solely those of the individual author(s) and contributor(s) and not of MDPI and/or the editor(s). MDPI and/or the editor(s) disclaim responsibility for any injury to people or property resulting from any ideas, methods, instructions or products referred to in the content. |
© 2023 by the authors. Licensee MDPI, Basel, Switzerland. This article is an open access article distributed under the terms and conditions of the Creative Commons Attribution (CC BY) license (https://creativecommons.org/licenses/by/4.0/).
Share and Cite
MDPI and ACS Style
Caldas, P.; Varela, M. The Portuguese Public Hospitals Performance Evolution before and during the SARS-CoV-2 Pandemic (2017–2022). Sustainability 2023, 15, 11572. https://0-doi-org.brum.beds.ac.uk/10.3390/su151511572
AMA Style
Caldas P, Varela M. The Portuguese Public Hospitals Performance Evolution before and during the SARS-CoV-2 Pandemic (2017–2022). Sustainability. 2023; 15(15):11572. https://0-doi-org.brum.beds.ac.uk/10.3390/su151511572
Chicago/Turabian StyleCaldas, Paulo, and Miguel Varela. 2023. "The Portuguese Public Hospitals Performance Evolution before and during the SARS-CoV-2 Pandemic (2017–2022)" Sustainability 15, no. 15: 11572. https://0-doi-org.brum.beds.ac.uk/10.3390/su151511572
Note that from the first issue of 2016, this journal uses article numbers instead of page numbers. See further details here.