
The Compound Response Relationship between Hydro-Sedimentary Variations and Dominant Driving Factors: A Case Study of the Huangfuchuan basin

 ,
, 
Abstract
:1. Introduction
2. Data and Methods
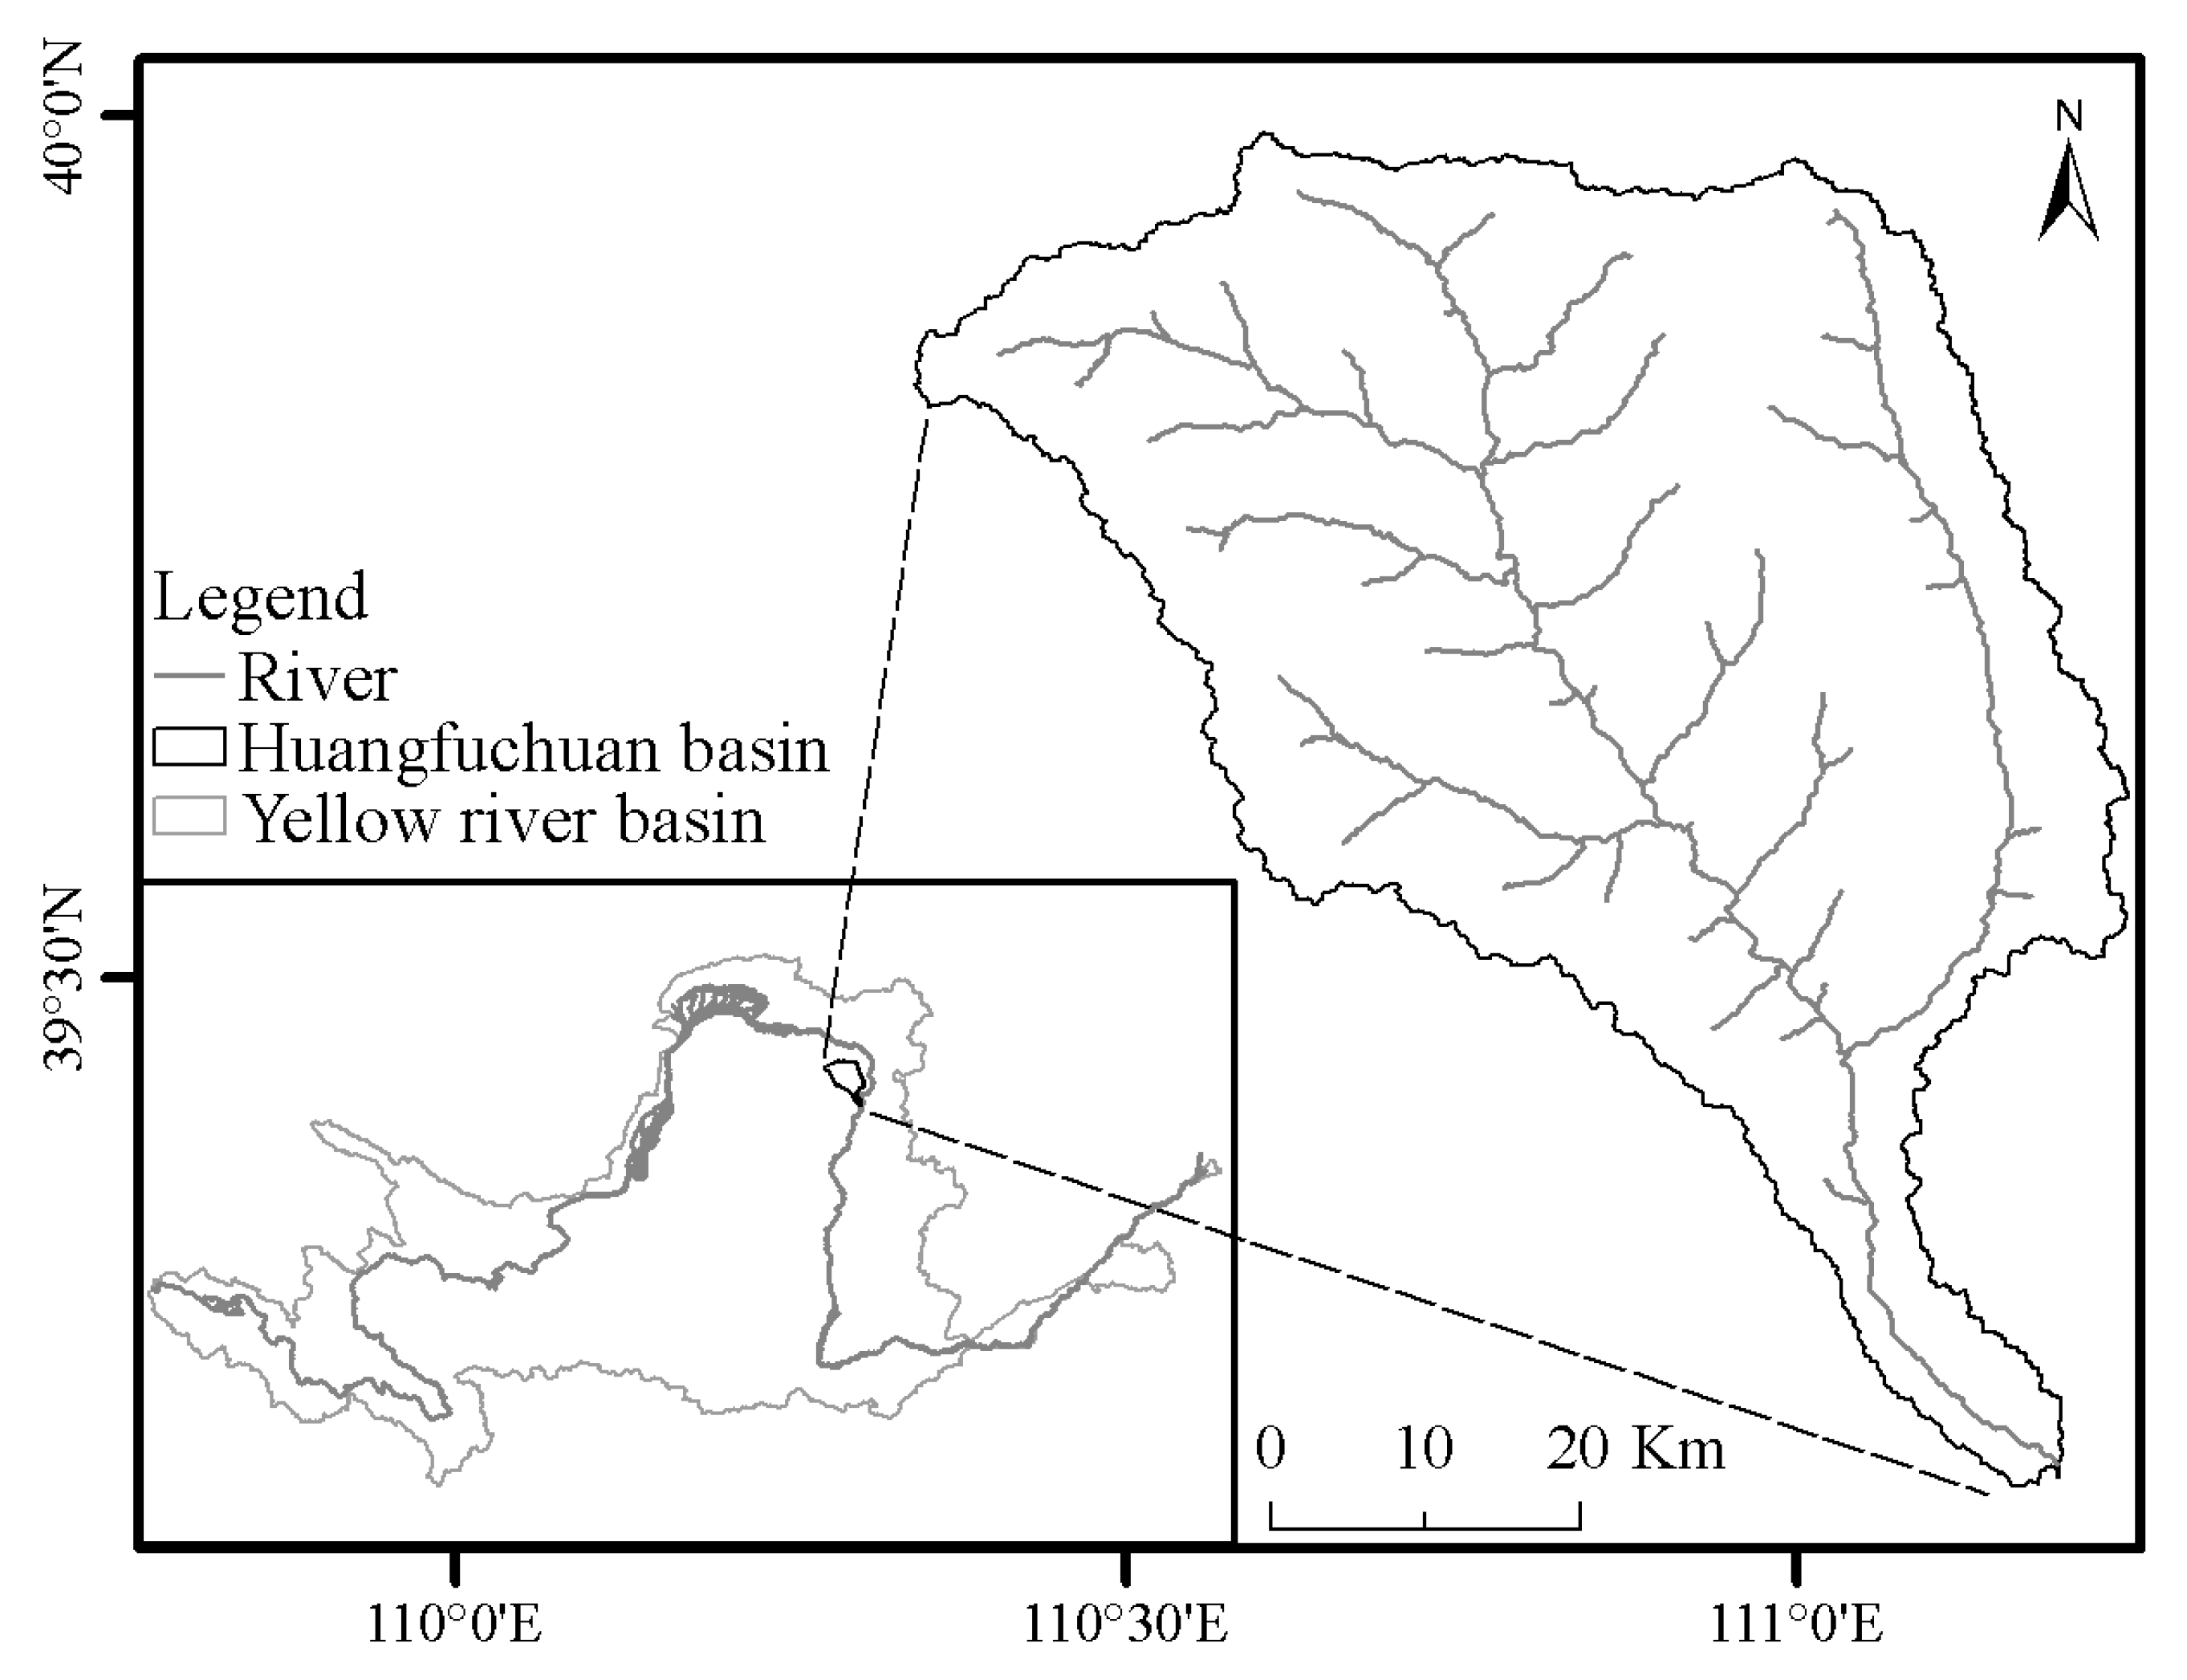
2.1. Study Area
2.2. Data Source and Processing
2.2.1. Vegetation Data
2.2.2. Temperature Data
2.2.3. Precipitation Data
2.2.4. Runoff and Sediment Data
2.2.5. Soil and Water Conservation Data
2.3. Research Method
2.3.1. Mann–Kendall Trend Test
2.3.2. Sen’s Slope Estimation Method
2.3.3. Pettitt Change-Point Test
2.3.4. Principal Component Analysis
3. Results
3.1. Variation Characteristics of the Water and Sediment in the Huangfuchuan basin
3.1.1. Trends in Water–sediment Dynamics and Meteorological Elements, and Identification of Mutation Points
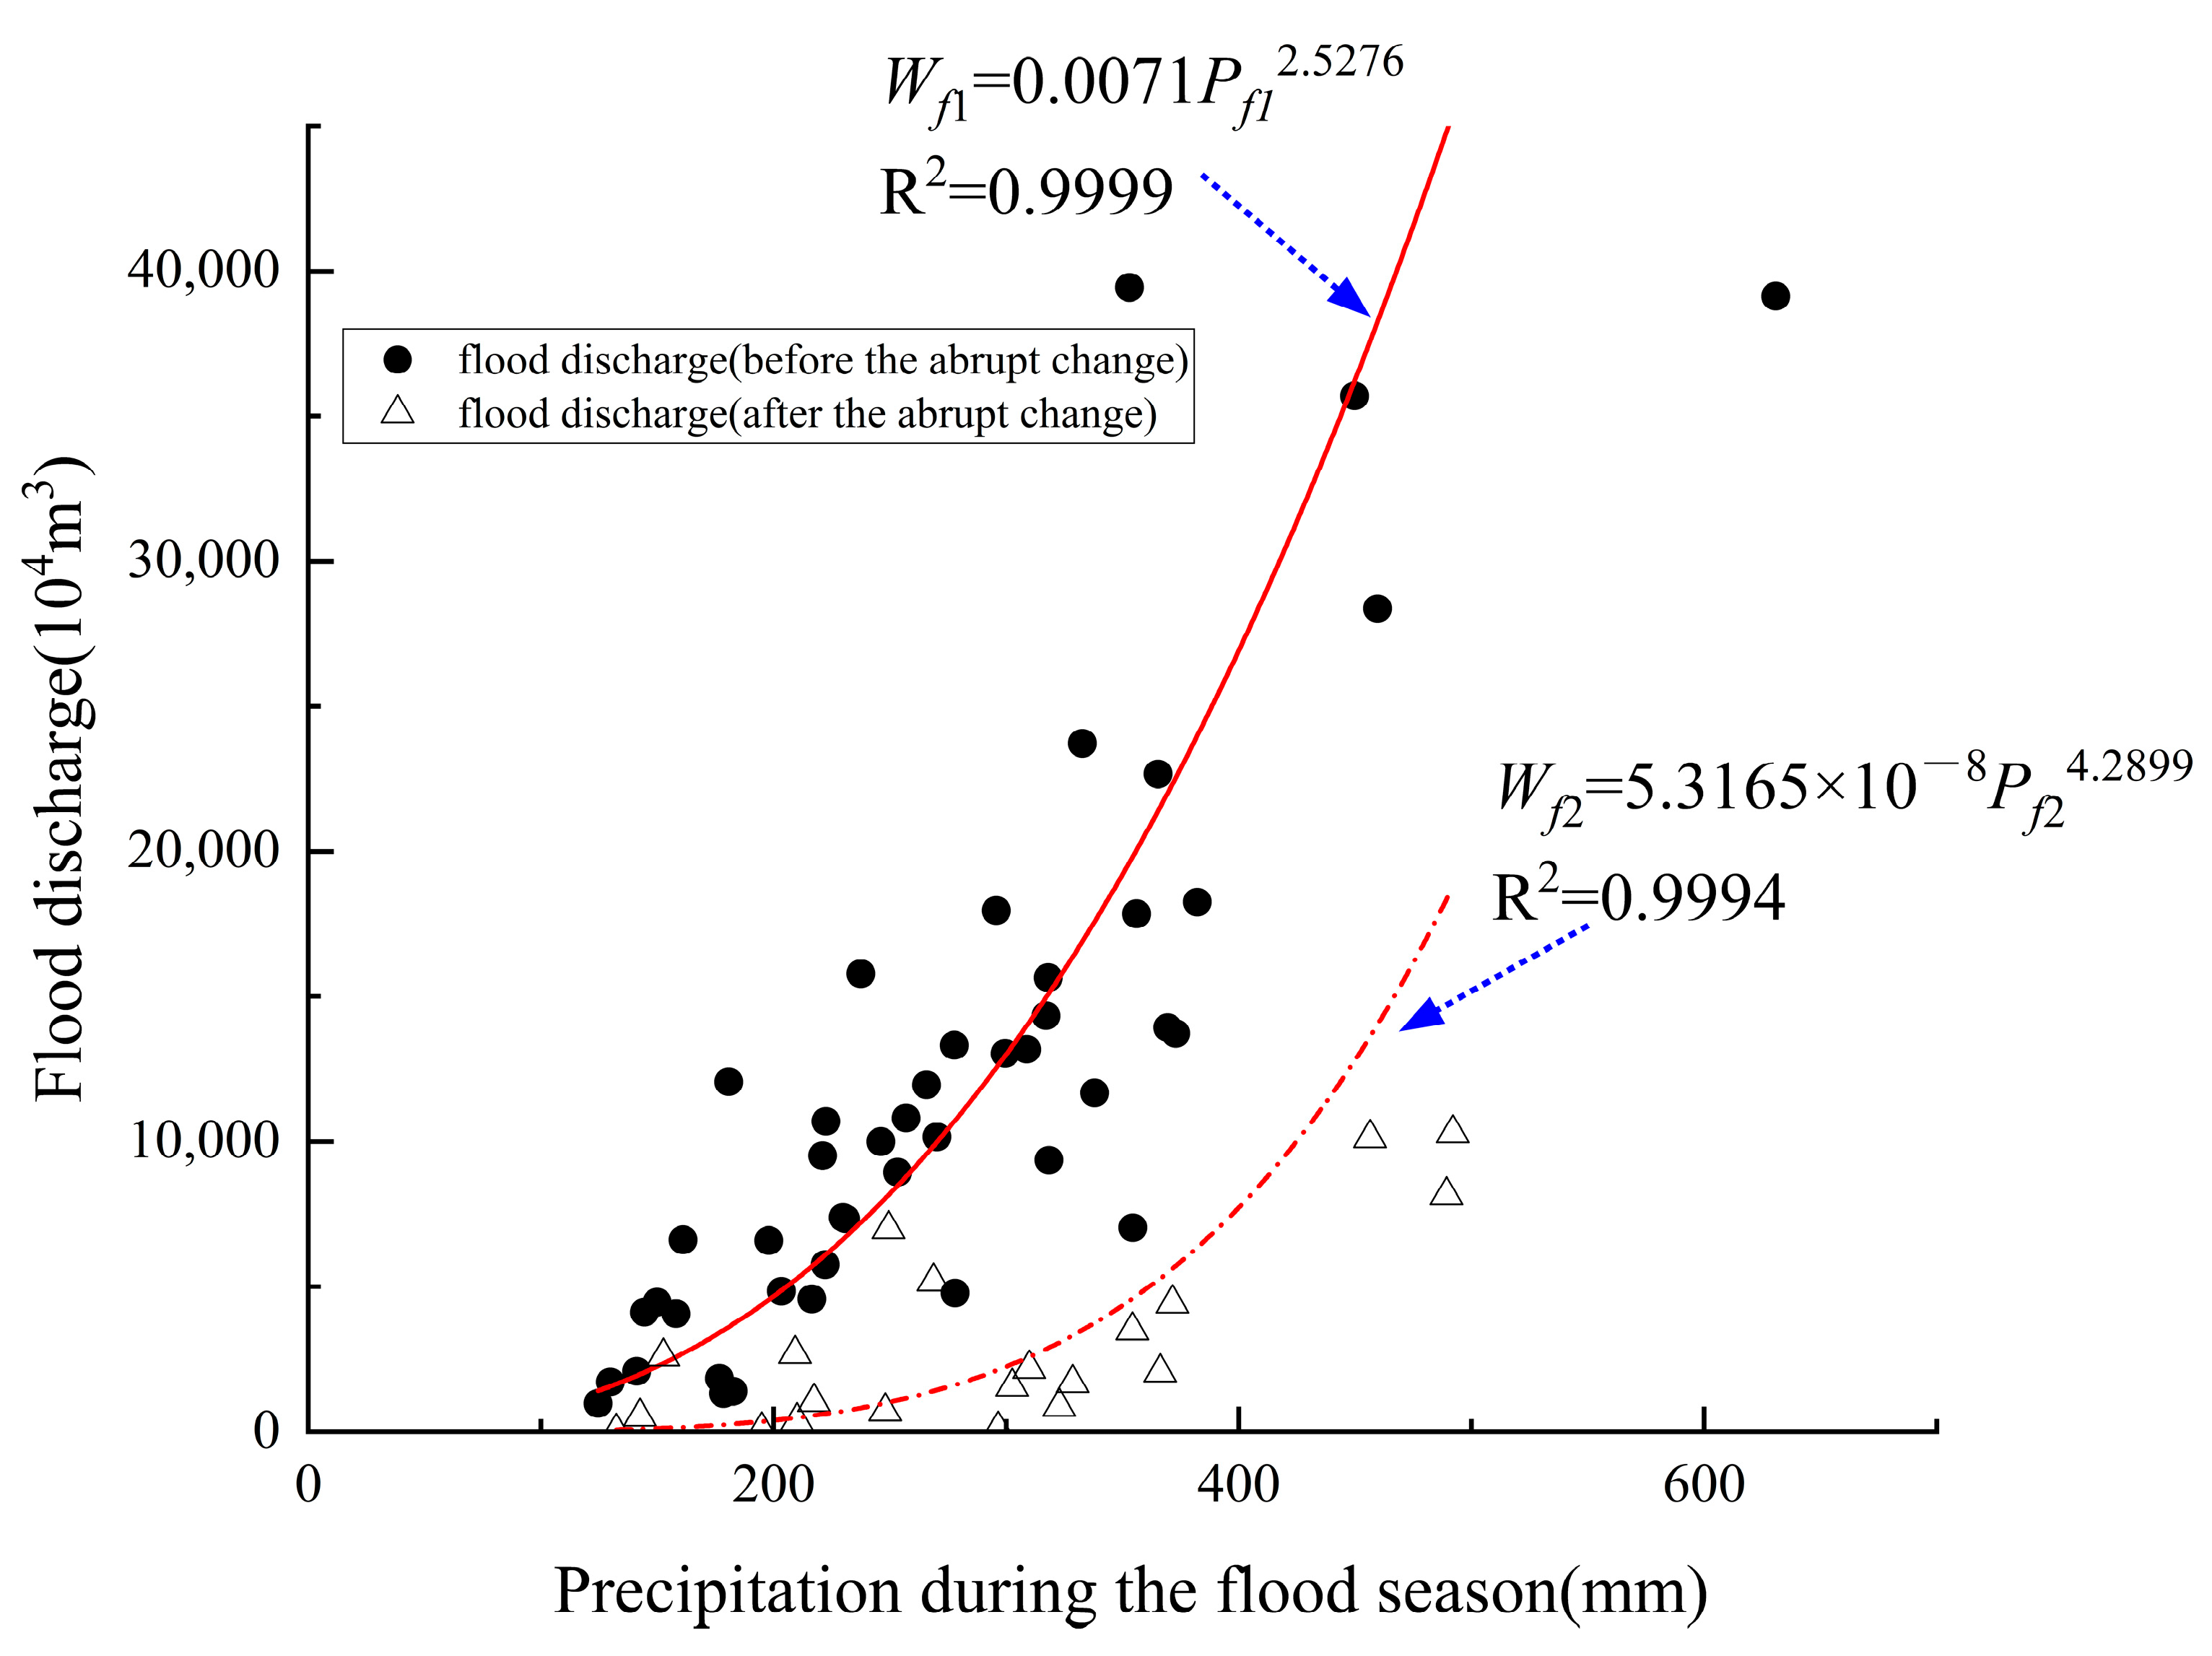
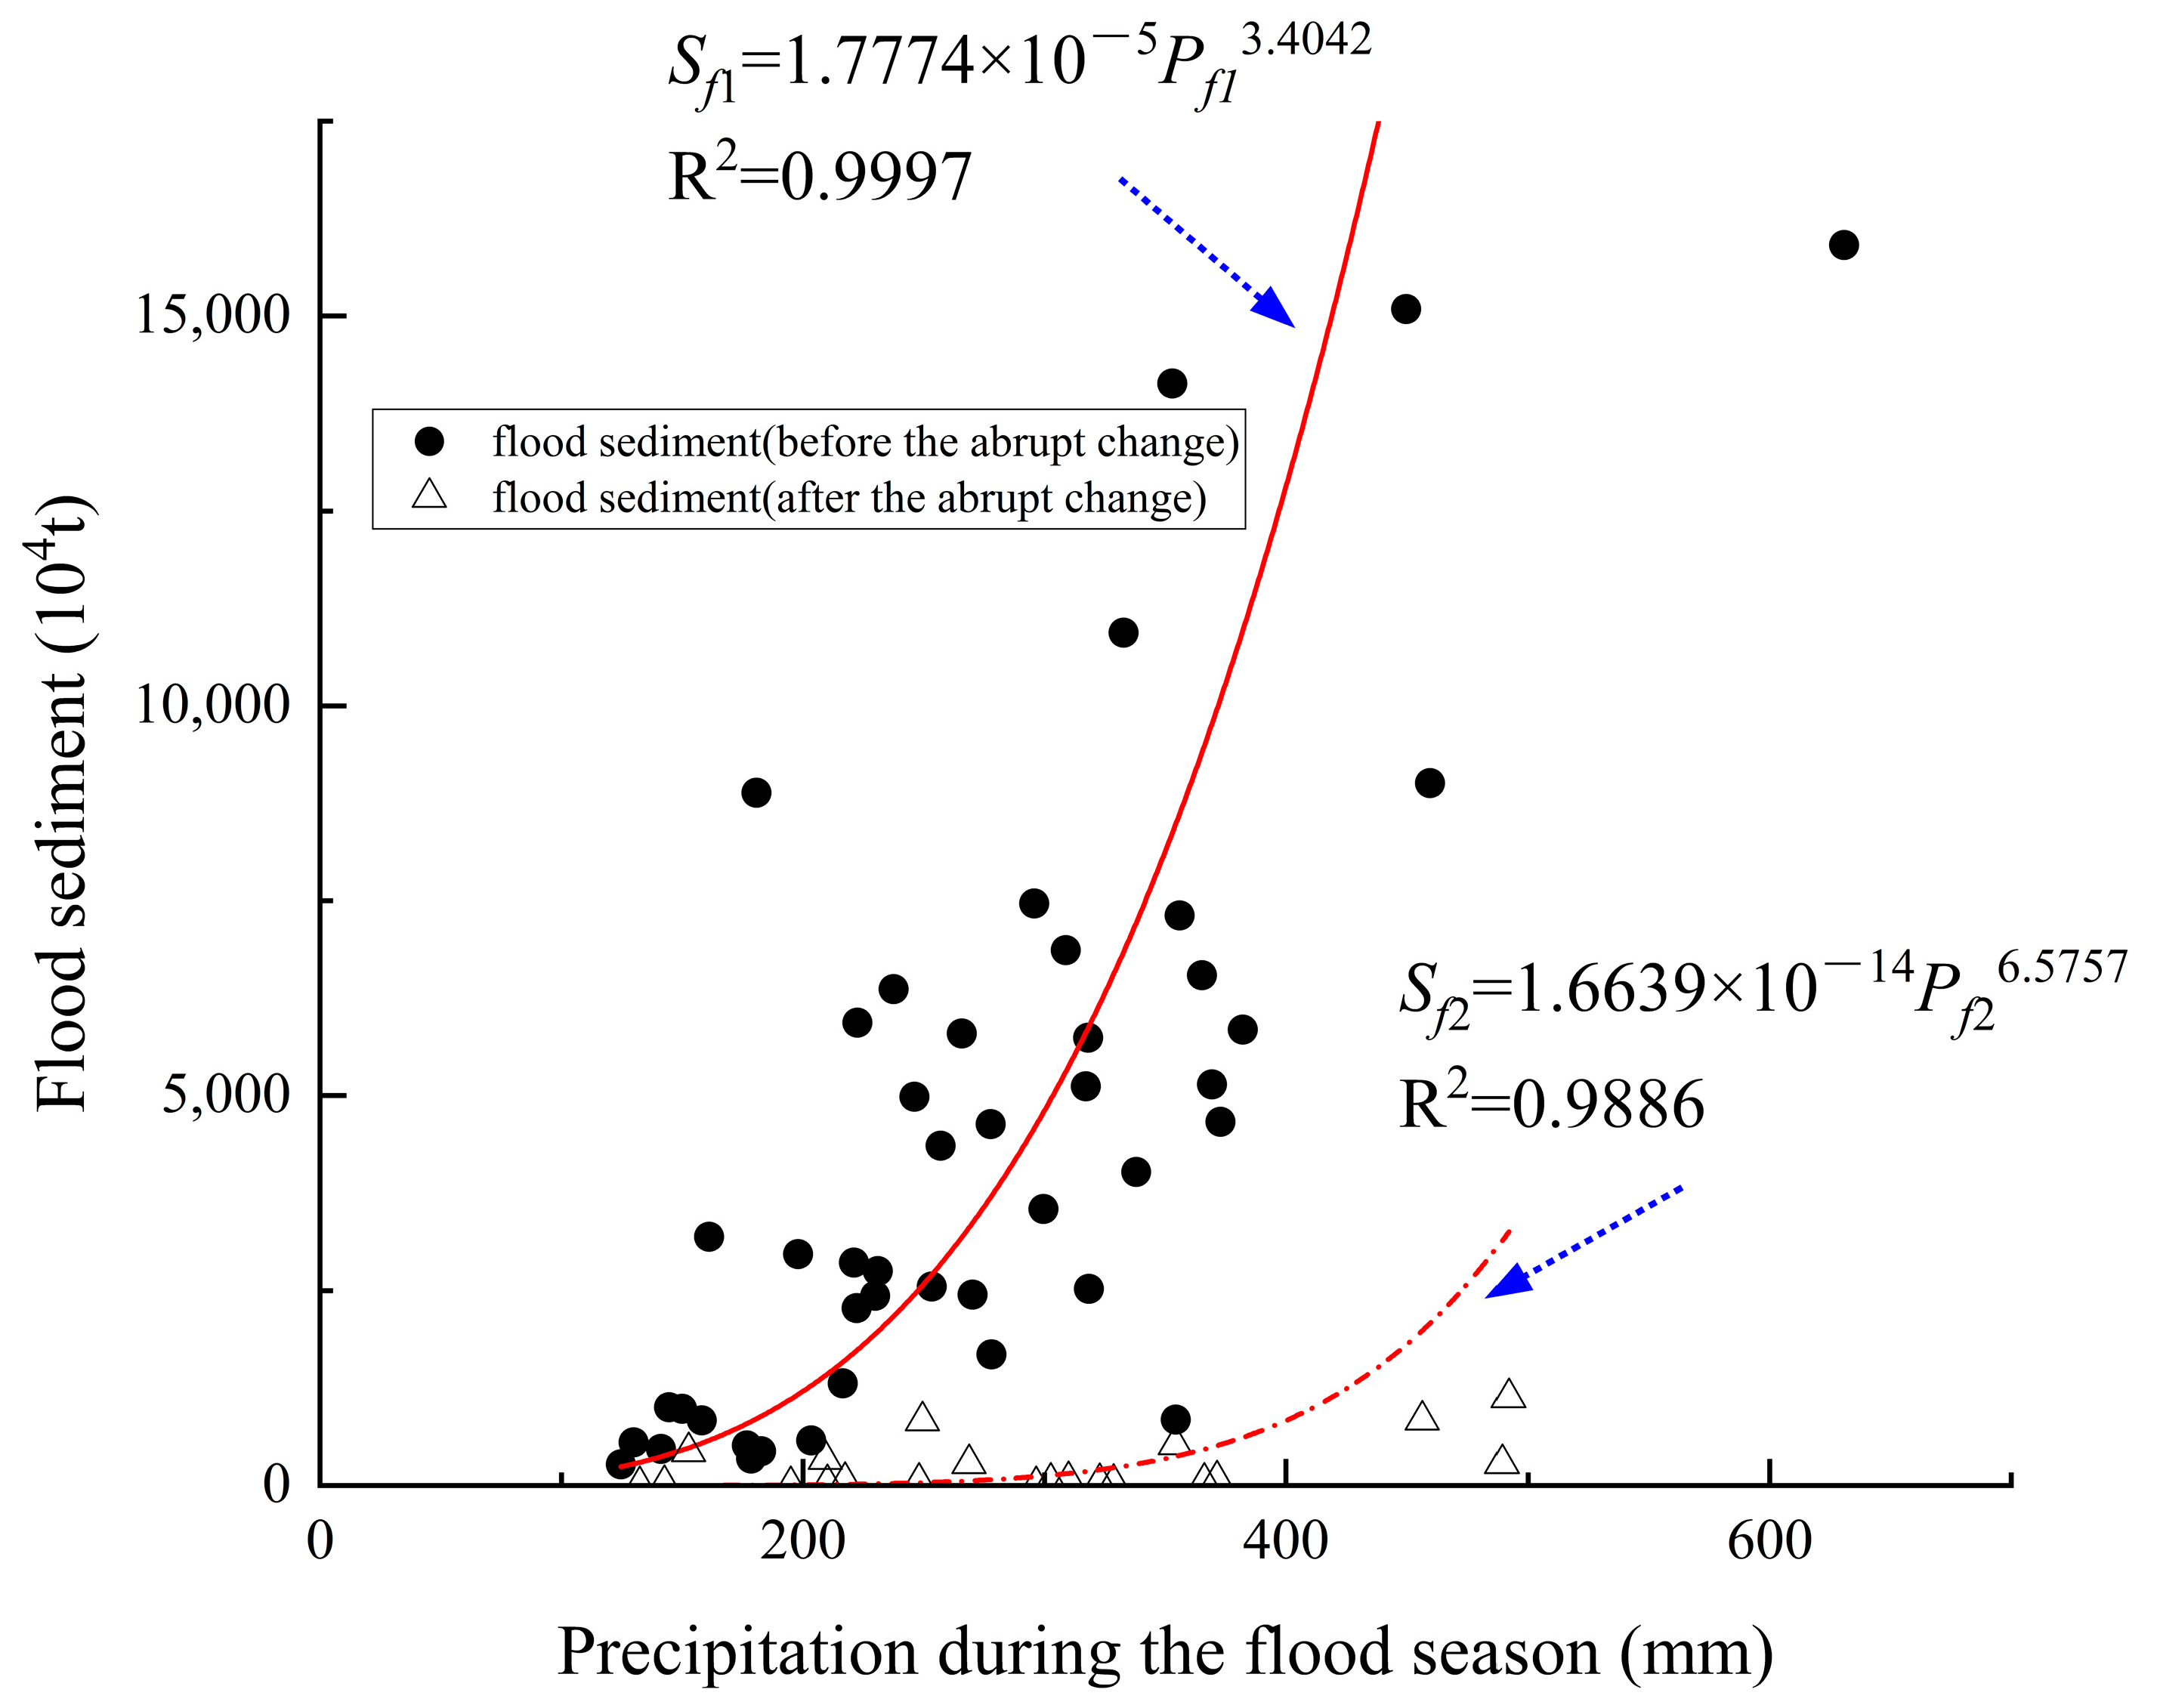
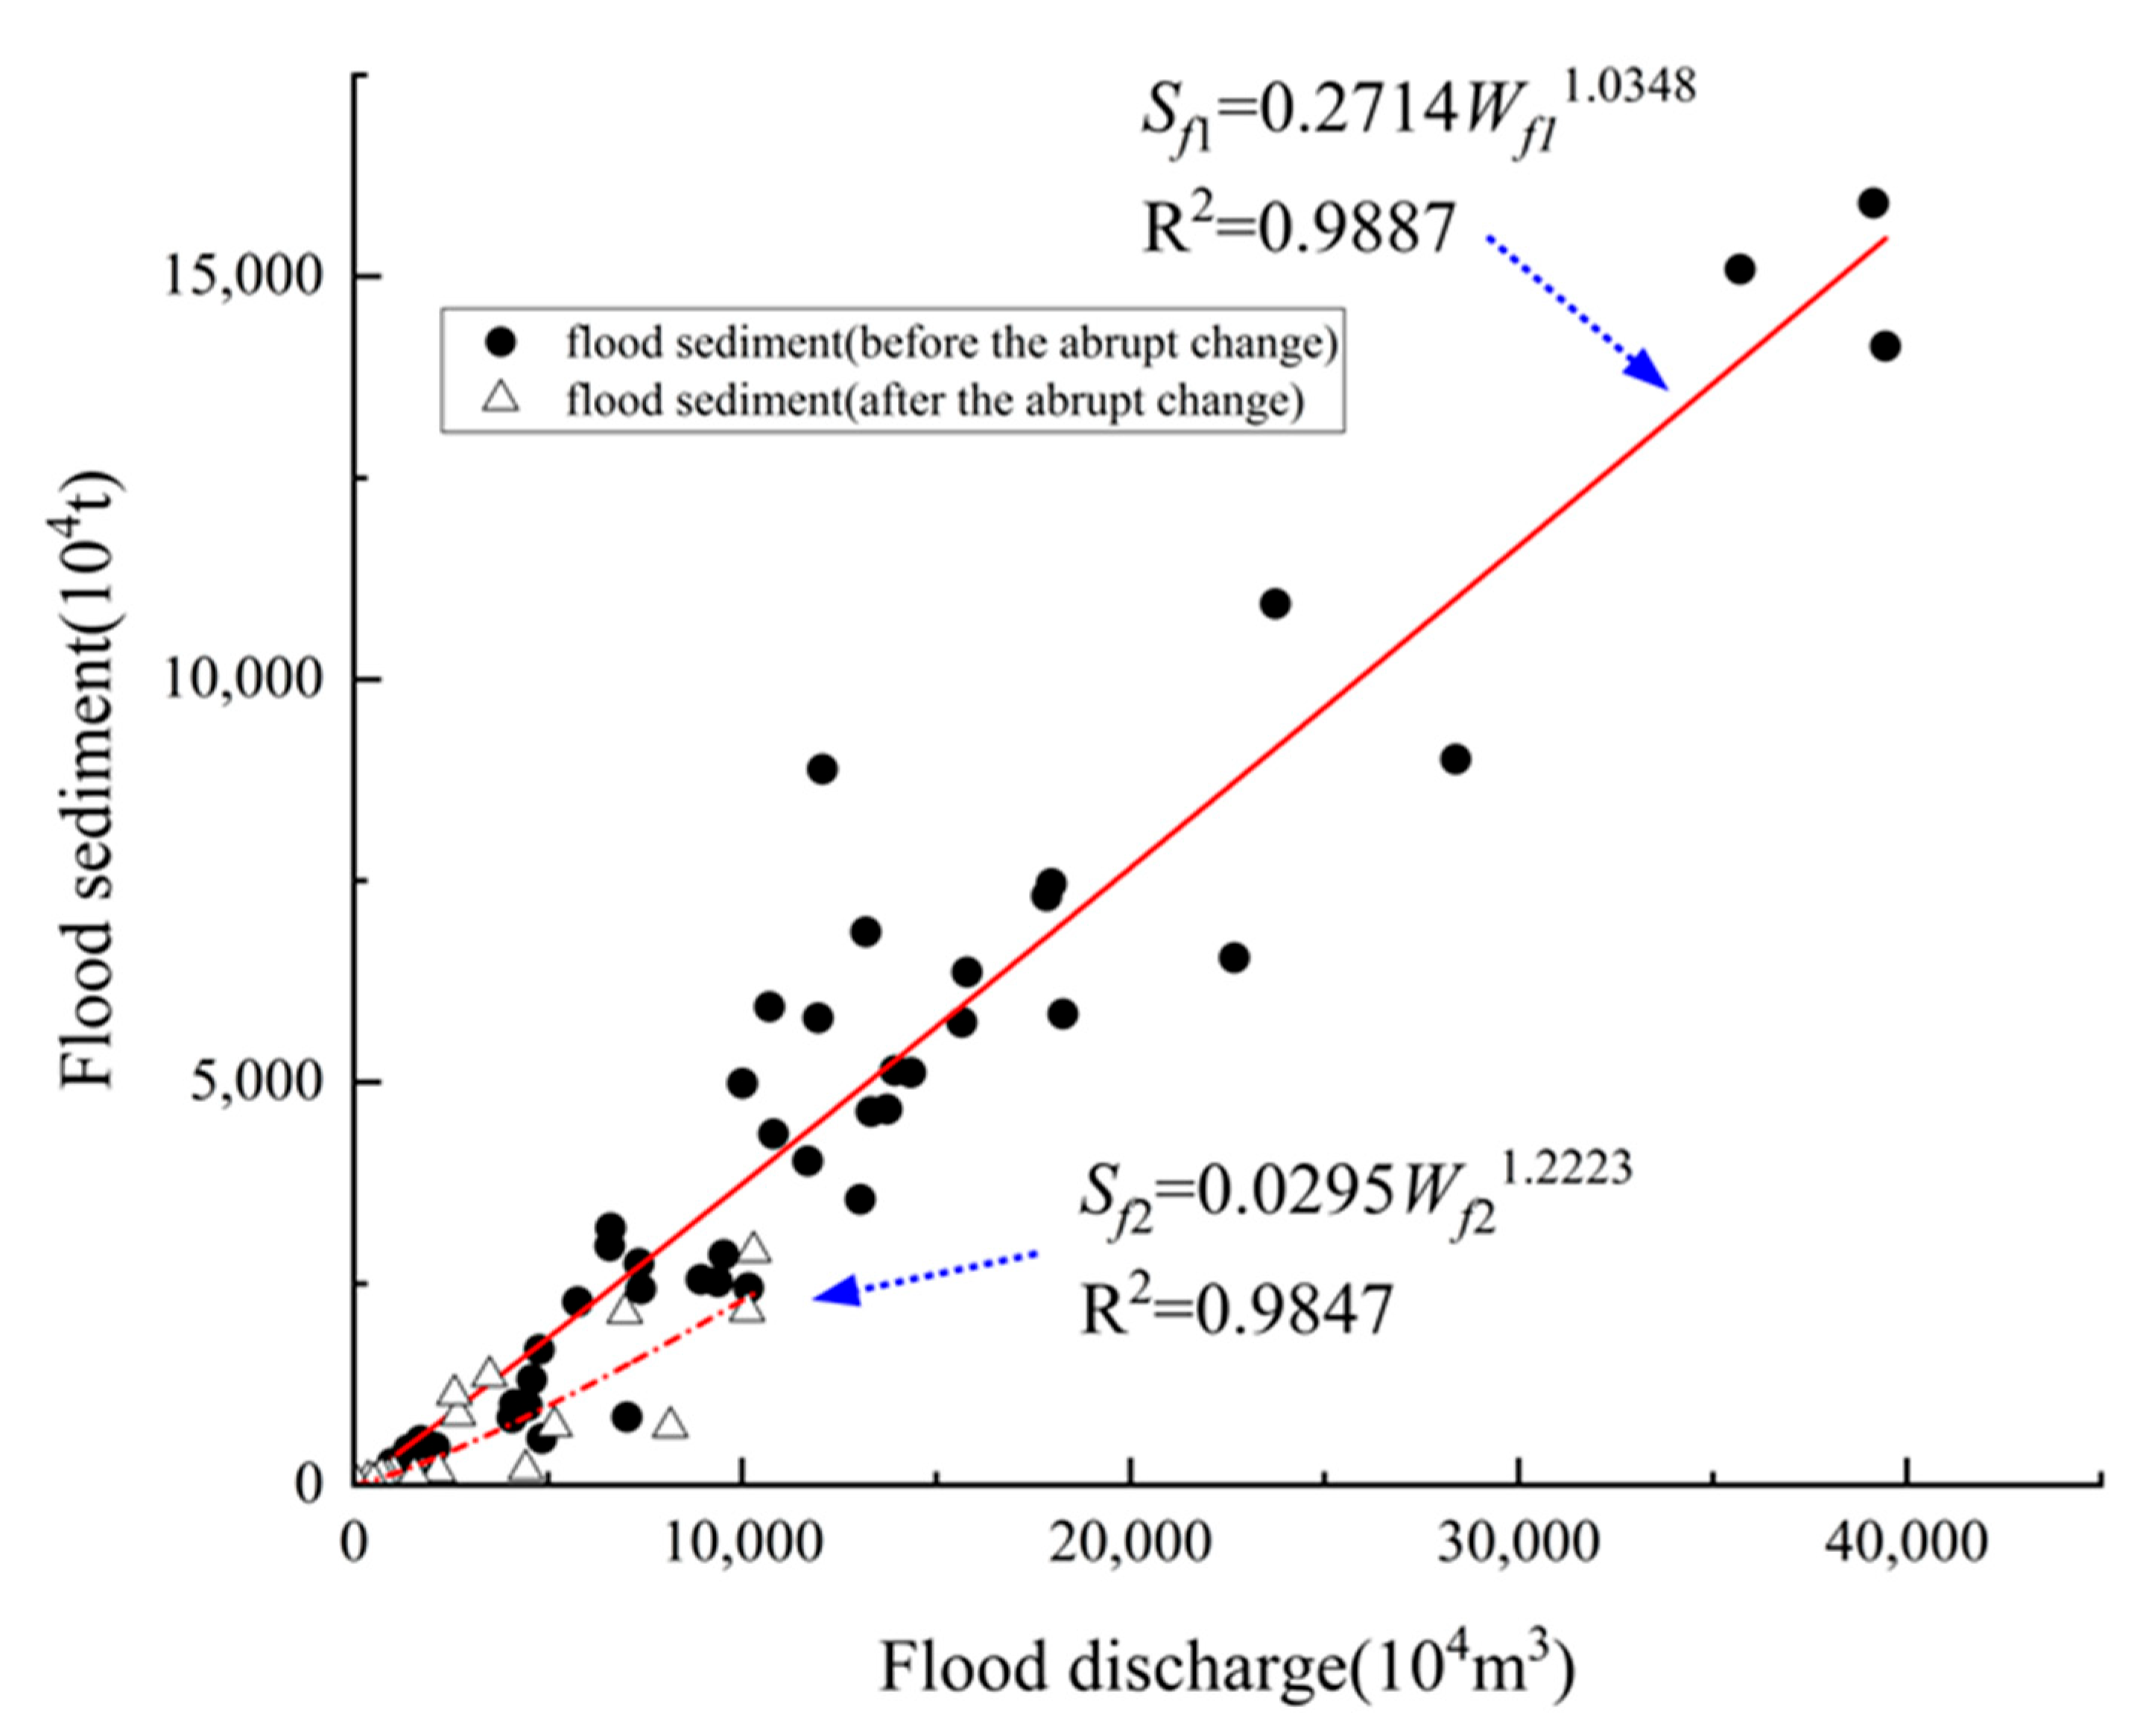
3.1.2. The Relationship between Water and Sediment and Precipitation Response
3.2. The Relationship between Dominant Driving Factors and Their Response
4. Discussion
5. Conclusions
Author Contributions
Funding
Data Availability Statement
Conflicts of Interest
References
- Murphy, J.C. Changing Suspended Sediment in United States Rivers and Streams: Linking Sediment Trends to Changes in Land Use/Cover, Hydrology and Climate. Hydrol. Earth Syst. Sci. 2020, 24, 991–1010. [Google Scholar] [CrossRef]
- Wei, X.; Cai, S.; Ni, P.; Zhan, W. Impacts of Climate Change and Human Activities on the Water Discharge and Sediment Load of the Pearl River, Southern China. Sci. Rep. 2020, 10, 16743. [Google Scholar] [CrossRef] [PubMed]
- Dunn, F.E.; Darby, S.E.; Nicholls, R.J.; Cohen, S.; Zarfl, C.; Fekete, B.M. Projections of Declining Fluvial Sediment Delivery to Major Deltas Worldwide in Response to Climate Change and Anthropogenic Stress. Environ. Res. Lett. 2019, 14, 084034. [Google Scholar] [CrossRef]
- Wang, H.; Ma, Y.; Yang, H.; Hong, F.; Guo, W. Quantitative Evaluation of the Impact of Climate Change and Human Activities on Jialing River Runoff Changes in the Past 60 Years, China. J. Water Clim. Change 2023, 14, 590–609. [Google Scholar] [CrossRef]
- Omer, A.; Elagib, N.A.; Zhuguo, M.; Saleem, F.; Mohammed, A. Water Scarcity in the Yellow River Basin under Future Climate Change and Human Activities. Sci. Total Environ. 2020, 749, 141446. [Google Scholar] [CrossRef]
- Song, X.; Zhang, J.; Zhan, C.; Liu, C. Review for impacts of climate change and human activities on water cycle. J. Hydraul. Eng. 2013, 44, 779–790. [Google Scholar] [CrossRef]
- Tian, P.; Lu, H.; Feng, W.; Guan, Y.; Xue, Y. Large Decrease in Streamflow and Sediment Load of Qinghai–Tibetan Plateau Driven by Future Climate Change: A Case Study in Lhasa River Basin. CATENA 2020, 187, 104340. [Google Scholar] [CrossRef]
- Santos, J.Y.G.D.; Montenegro, S.M.G.L.; Silva, R.M.D.; Santos, C.A.G.; Quinn, N.W.; Dantas, A.P.X.; Ribeiro Neto, A. Modeling the Impacts of Future LULC and Climate Change on Runoff and Sediment Yield in a Strategic Basin in the Caatinga/Atlantic Forest Ecotone of Brazil. CATENA 2021, 203, 105308. [Google Scholar] [CrossRef]
- Wang, L.; Wang, Y.; Gao, P.; Zhang, X.; Mu, X. Changing Characteristics and Trend of Water and Sediment in Coarse sand Source Regions of Loess Plateau. Bull. Soil Water Conserv. 2008, 28, 11–16. [Google Scholar] [CrossRef]
- Liu, Q.; Wei, F.; Chang, K.; Wang, R.; Jing, Y.; Mu, X. Characteristics of water and sediment variation in the Huangfuchuan basin and its influencing factors. Arid Zone Res. 2021, 38, 1506–1513. [Google Scholar] [CrossRef]
- Ning, Y.; Yang, X.; Sun, W.; Mu, X.; Gao, P.; Zhao, G.; Song, X. The trend of runoff change and its attribution in the middle reaches of the Yellow River. J. Nat. Resour. 2021, 36, 256–269. [Google Scholar] [CrossRef]
- Liu, B.; Li, P.; Yang, Y.; Ren, Z.; Long, S. Response of variation of runoff and sediment to landscape pattern in Huangfuchuan basin. Res. Soil Water Conserv. 2021, 28, 102–107+120. [Google Scholar] [CrossRef]
- Feng, J.; Zhao, G.; Mu, X.; Tian, P. Characteristics and mechanism of sediment transport in the Middle Yellow River. J. Sediment Res. 2020, 45, 34–41. [Google Scholar] [CrossRef]
- Wang, C.; Gao, F.; Sun, W.; Mu, X.; Gao, P.; Zhao, G.; Song, X. Rainfall infiltration processes and characteristics of slope-gully systems in the hilly and gully region of the Loess Plateau. Acta Ecologica Sinica 2021, 41, 3111–3211. [Google Scholar]
- Jiang, K.; Yu, K.; Cao, W.; Zhang, X.; Li, P.; Sun, Q.; Liu, Y. Attributional comparative analysis of runoff and sediment change in typical basin of Loess Plateau. Trans. Chin. Soc. Agric. Eng. 2020, 36, 143–149. [Google Scholar]
- Zhang, P.; Yao, W.; Liu, G.; Xiao, P.; Sun, W. Quantitative Analysis of Environmental Driving Factors of Vegetation Coverage in the Pisha Sandstone Area Based on Geodetector. Int. Soil Water Conserv. Res. 2020, 363, 137–146. [Google Scholar] [CrossRef]
- Wei, Y.; Jiao, J. Variation tendency and periodic characteristics of streamflow and sediment discharge in Huangfuchuan Watershed from 1955 to 2013. Soil Water Conserv. Res. 2017, 24, 1–6. [Google Scholar] [CrossRef]
- Liu, Q.; Mu, X.; Zhao, G.; Gao, P.; Sun, W.; Nan, L. Runoff and sediment changes and their responses to precipitation and land use change in the Yanhe river basin. J. Arid Land Resour. Environ. 2021, 35, 129–135. [Google Scholar] [CrossRef]
- Wang, B.; Fu, X. Intra-and Inter-annual Variations in the Relationship Between Suspended Sediment Concentration and Discharge of the Huangfuchuan Watershed. J. Basic Sci. Eng. 2020, 28, 642–651. [Google Scholar] [CrossRef]
- Wang, G.; Zhong, D.; Wu, B. Future trend of Yellow River sediment changes. China Water Resour. 2020, 1, 9–12. [Google Scholar]
- Zhang, H.; Hou, L.; Li, L. Great achievements in sediment reduction and water demand of sediment transport in the feature of the Yellow River management. China Water Resour. 2021, 21, 17–20. [Google Scholar]
- Yin, B.; Su, P.; Zhang, J.; Cao, X. Dynamic Changes of Soil and Water Loss in Rich and Coarse Sediment Areas of the Middle Yellow River Basin from 1985 to 2020. Bull. Soil Water Conserv. 2021, 41, 123–126. [Google Scholar]
- Gu, C.; Mu, X.; Gao, P.; Zhao, G.; Sun, W. Changes in Run-off and Sediment Load in the Three Parts of the Yellow River Basin, in Response to Climate Change and Human Activities. Hydrol. Process. 2019, 33, 585–601. [Google Scholar] [CrossRef]
- Wan, X.; Zhou, X.; Zhao, L.; Li, X.; Wang, S.; Su, J. An Analysis of the Trend of Water and Sediment Change and Its Influencing Factors in Huangfuchuan River Basin. China Rural Water Hydropower 2019, 12, 90–93. [Google Scholar]
- Zhao, G.; Mu, X.; Wen, Z.; Wang, F.; Gao, P. Impacts of precipitation and human activities on streamflow and sediment load in the Huangfuchuan Watershed. Sci. Soil Water Conserv. 2013, 11, 1–8. [Google Scholar] [CrossRef]
- Liu, J.; Li, Z.; Zhang, X.; Li, R.; Liu, X.; Zhang, H. Responses of vegetation cover to the Grain for Green Program and their driving forces in the He-Long region of the middle reaches of the Yellow River. J. Arid Land 2013, 5, 511–520. [Google Scholar] [CrossRef]
- Wang, S.; Fu, B.; Liang, W.; Liu, Y.; Wang, Y. Driving forces of changes in the water and sediment relationship in the Yellow River. Sci. Total Environ. 2017, 576, 453–461. [Google Scholar] [CrossRef]
- Wang, X.; Cai, H.; Zhang, X.; Wang, J.; Zhai, J. Analysis of Changing Characteristics and Tendency of Runoff and Sediment Transport in Huangfuchuan River Watershed. Res. Soil Water Conserv. 2009, 16, 222–226. [Google Scholar]
- Feng, J.; Zhao, G.; Mu, X.; Tian, P.; Tian, X. Analysis on runoff regime in middle Yellow River and its driving factors. J. Hydroelectr. Eng. 2020, 39, 90–103. [Google Scholar]
- Shao, G.; Guan, Y.; Guan, Z.; Sha, Z.; Zhang, D. Analysis of variation trend of runoff and driving factors in Huangfuchuan. J. Water Resour. Water Eng. 2014, 25, 53–56. [Google Scholar]
- Xu, J. Trend of Sediment Yield in the Coarser Sediment-producing Area in the Middle Yellow River Basin in the Period 1997–2007 and the Formative Cause. J. Soil Water Conserv. 2010, 24, 1–7. [Google Scholar] [CrossRef]
- Shang, H.; Hu, C.; Xia, J.; Zhou, M. Contributions of Rainfall and Soil Water Conservation to the Variation in Sediment Discharge of the Huangfuchuan River Basin. J. Soil Water Conserv. 2023, 37, 199–207. [Google Scholar] [CrossRef]
- Ran, D.; Gao, J.; Zhao, A.; Wang, Y. Analysis on runoff and sediment characteristics and harnessing measure in Huangfuchuan river watershed. J. Hydraul. Eng. 2003, 34, 122–128. [Google Scholar]
- Dong, W.; Cao, X. Variation of Soil and Water Conservation Rate and Threshold Prediction in Huangfuchuan Watershed. Yellow River. 2022, 44, 131–134. [Google Scholar]
- Yang, J.; Huang, X. The 30 m Annual Land Cover Dataset and Its Dynamics in China from 1990 to 2019. Earth Syst. Sci. Data 2021, 13, 3907–3925. [Google Scholar] [CrossRef]
- Sang, Y.-F.; Wang, Z.; Liu, C. Comparison of the MK Test and EMD Method for Trend Identification in Hydrological Time Series. J. Hydrol. 2014, 510, 293–298. [Google Scholar] [CrossRef]
- Kumar, P.; Chandniha, S.K.; Lohani, A.K.; Nema, A.K.; Krishan, G. Trend Analysis of Groundwater Level Using NON-Parametric Tests in Alluvial Aquifers of Uttar Pradesh, INDIA. Curr. World Environ. 2018, 13, 44–54. [Google Scholar] [CrossRef]
- Xie, H.; Li, D.; Xiong, L. Exploring the Ability of the Pettitt Method for Detecting Change Point by Monte Carlo Simulation. Stoch. Environ. Res. Risk Assess. 2014, 28, 1643–1655. [Google Scholar] [CrossRef]
- Lei, C.; Mao, Y. Random Forest Algorithm Based on PCA and Hierarchical Selection Under Spark. Comput. Eng. Appl. 2022, 58, 118–127. [Google Scholar]
- Zhang, P.; Zhang, X. Elementary Analysis on Characteristics of “8.18” Storm Flood in Huangfuchuan Watershed. Shaanxi Water Resour. 2017, 5, 32–34. [Google Scholar] [CrossRef]
- Jin, S.; Lin, C.; Zhang, Z.; Chen, Y. Effect of Underlying Surface Change on the “July 21” Flood in Huangfuchuan basin. Yellow River 2013, 35, 19–21. [Google Scholar]
- Zhao, M.; Liu, Y.; Cui, D. Analysis of Hydrological Conditions in Huangfuchuan River Basin. Northeast. Water Conserv. Hydropower 2015, 33, 41–42+59. [Google Scholar] [CrossRef]
- Gao, P.; Li, P.; Zhao, B.; Xu, R.; Zhao, G.; Sun, W.; Mu, X. Use of Double Mass Curves in Hydrologic Benefit Evaluations. Hydrol. Process. 2017, 31, 4639–4646. [Google Scholar] [CrossRef]
- Liu, Q.; Wei, F.; Chang, K.; Li, Y.; Liang, X.; Mu, X.; Du, M. Variation Character of Water and Sediment and Its Response to Rainfall and Human Activities in Longtong Region of the Middle Yellow River. J. Basic Sci. Eng. 2023, 31, 555–568. [Google Scholar] [CrossRef]
- Li, E. Response of Runoff and Sediment to Climate and Human Activities in the Huangfuchuan Watershed of the Middle Reaches of the Yellow River. Ph.D. Dissertation, Northwest A&F University, Xi’an, China, 2016. [Google Scholar]


| Station Code | Station Name | East Longitude | North Latitude | Altitude (m) | Monitoring Period (Years) |
|---|---|---|---|---|---|
| 53545 | Yijinhuoluo Banner | 109°43′ | 39°34′ | 1330.5 | 1955–2019 |
| 53564 | Hequ | 111°09′ | 39°22′ | 861.5 | 1955–2019 |
| 53651 | Shenmu | 110°25′ | 38°49′ | 941.1 | 1955–2019 |
| Station Code | Station Name | East Longitude | North Latitude | Monitoring Period (Years) |
|---|---|---|---|---|
| 40623350 | Wulangou | 110°41′ | 39°57′ | 1955–2019 |
| 40623500 | Deshengxi | 110°35′ | 39°51′ | 1955–2019 |
| 40623600 | Kuidongbula | 110°48′ | 39°43′ | 1955–2019 |
| 40623650 | Shagedu | 110°52′ | 39°38′ | 1955–2019 |
| 40623700 | Xiyingzi | 110°43′ | 39°37′ | 1955–2019 |
| 40623750 | Gucheng | 110°59′ | 39°32′ | 1955–2019 |
| 40623450 | Houshanshenmiao | 110°56′ | 39°56′ | 1955–2019 |
| 40623800 | Liujiata | 111°04′ | 39°52′ | 1955–2019 |
| 40623900 | Haizita | 111°07′ | 39°47′ | 1955–2019 |
| 40623950 | Changtan | 111°10′ | 39°36′ | 1955–2019 |
| 40624050 | Erdaohewan | 111°02′ | 39°23′ | 1955–2019 |
| 40624100 | Huangfu | 111°05′ | 39°17′ | 1955–2019 |
| Station Code | Station Name | East Longitude | North Latitude | Monitoring Period (Years) | Monitoring Parameters |
|---|---|---|---|---|---|
| 40600900 | Huangfu | 111°05′ | 39°17′ | 1955–2019 | Daily flow Daily sediment transport rate |
| Hydrometeorological Variables | ZMK | Sen’s Estimation Quantity | Significance Level (p) |
|---|---|---|---|
| Flood season discharge (108 m3) | −5.94 | −0.027 | 0.001 |
| Flood season sediment transport (108 t) | −5.72 | −0.008 | 0.001 |
| Flood season precipitation (mm) | −0.60 | −0.567 | >0.1 |
| Annual average temperature(°C) | 0.80 | 0.004 | >0.1 |
| Hydrometeorological Parameters | Pre-Mutation Period (1955–1999) | Post-Mutation Period (2000–2019) | Magnitude of Change | Rate of Change (%) |
|---|---|---|---|---|
| Flood season discharge (108 m3) | 1.560 | 0.364 | −1.196 | −76.7 |
| Flood season sediment transport (108 t) | 0.510 | 0.076 | −0.434 | −85.1 |
| Flood season precipitation (mm) | 411.6 | 365.0 | −46.6 | −11.3 |
| Annual average temperature(°C) | 8.2 | 8.9 | 0.7 | 8.5 |
| Indicator | Precipitation during the Flood Season | Sediment Transport during the Flood Season | Vegetation Coverage | Degree of Water and Soil Conservation Measures |
|---|---|---|---|---|
| Precipitation during the flood season | 1.00 | 0.45 *** | 0.33 *** | 0.18 *** |
| Sediment transport during the flood season | 0.45 *** | 1.00 | −0.34 *** | −0.48 *** |
| Vegetation coverage | 0.33 *** | −0.34 *** | 1.00 | 0.89 ** |
| Degree of water and soil conservation measures | 0.18 *** | −0.48 *** | 0.89 ** | 1.00 |
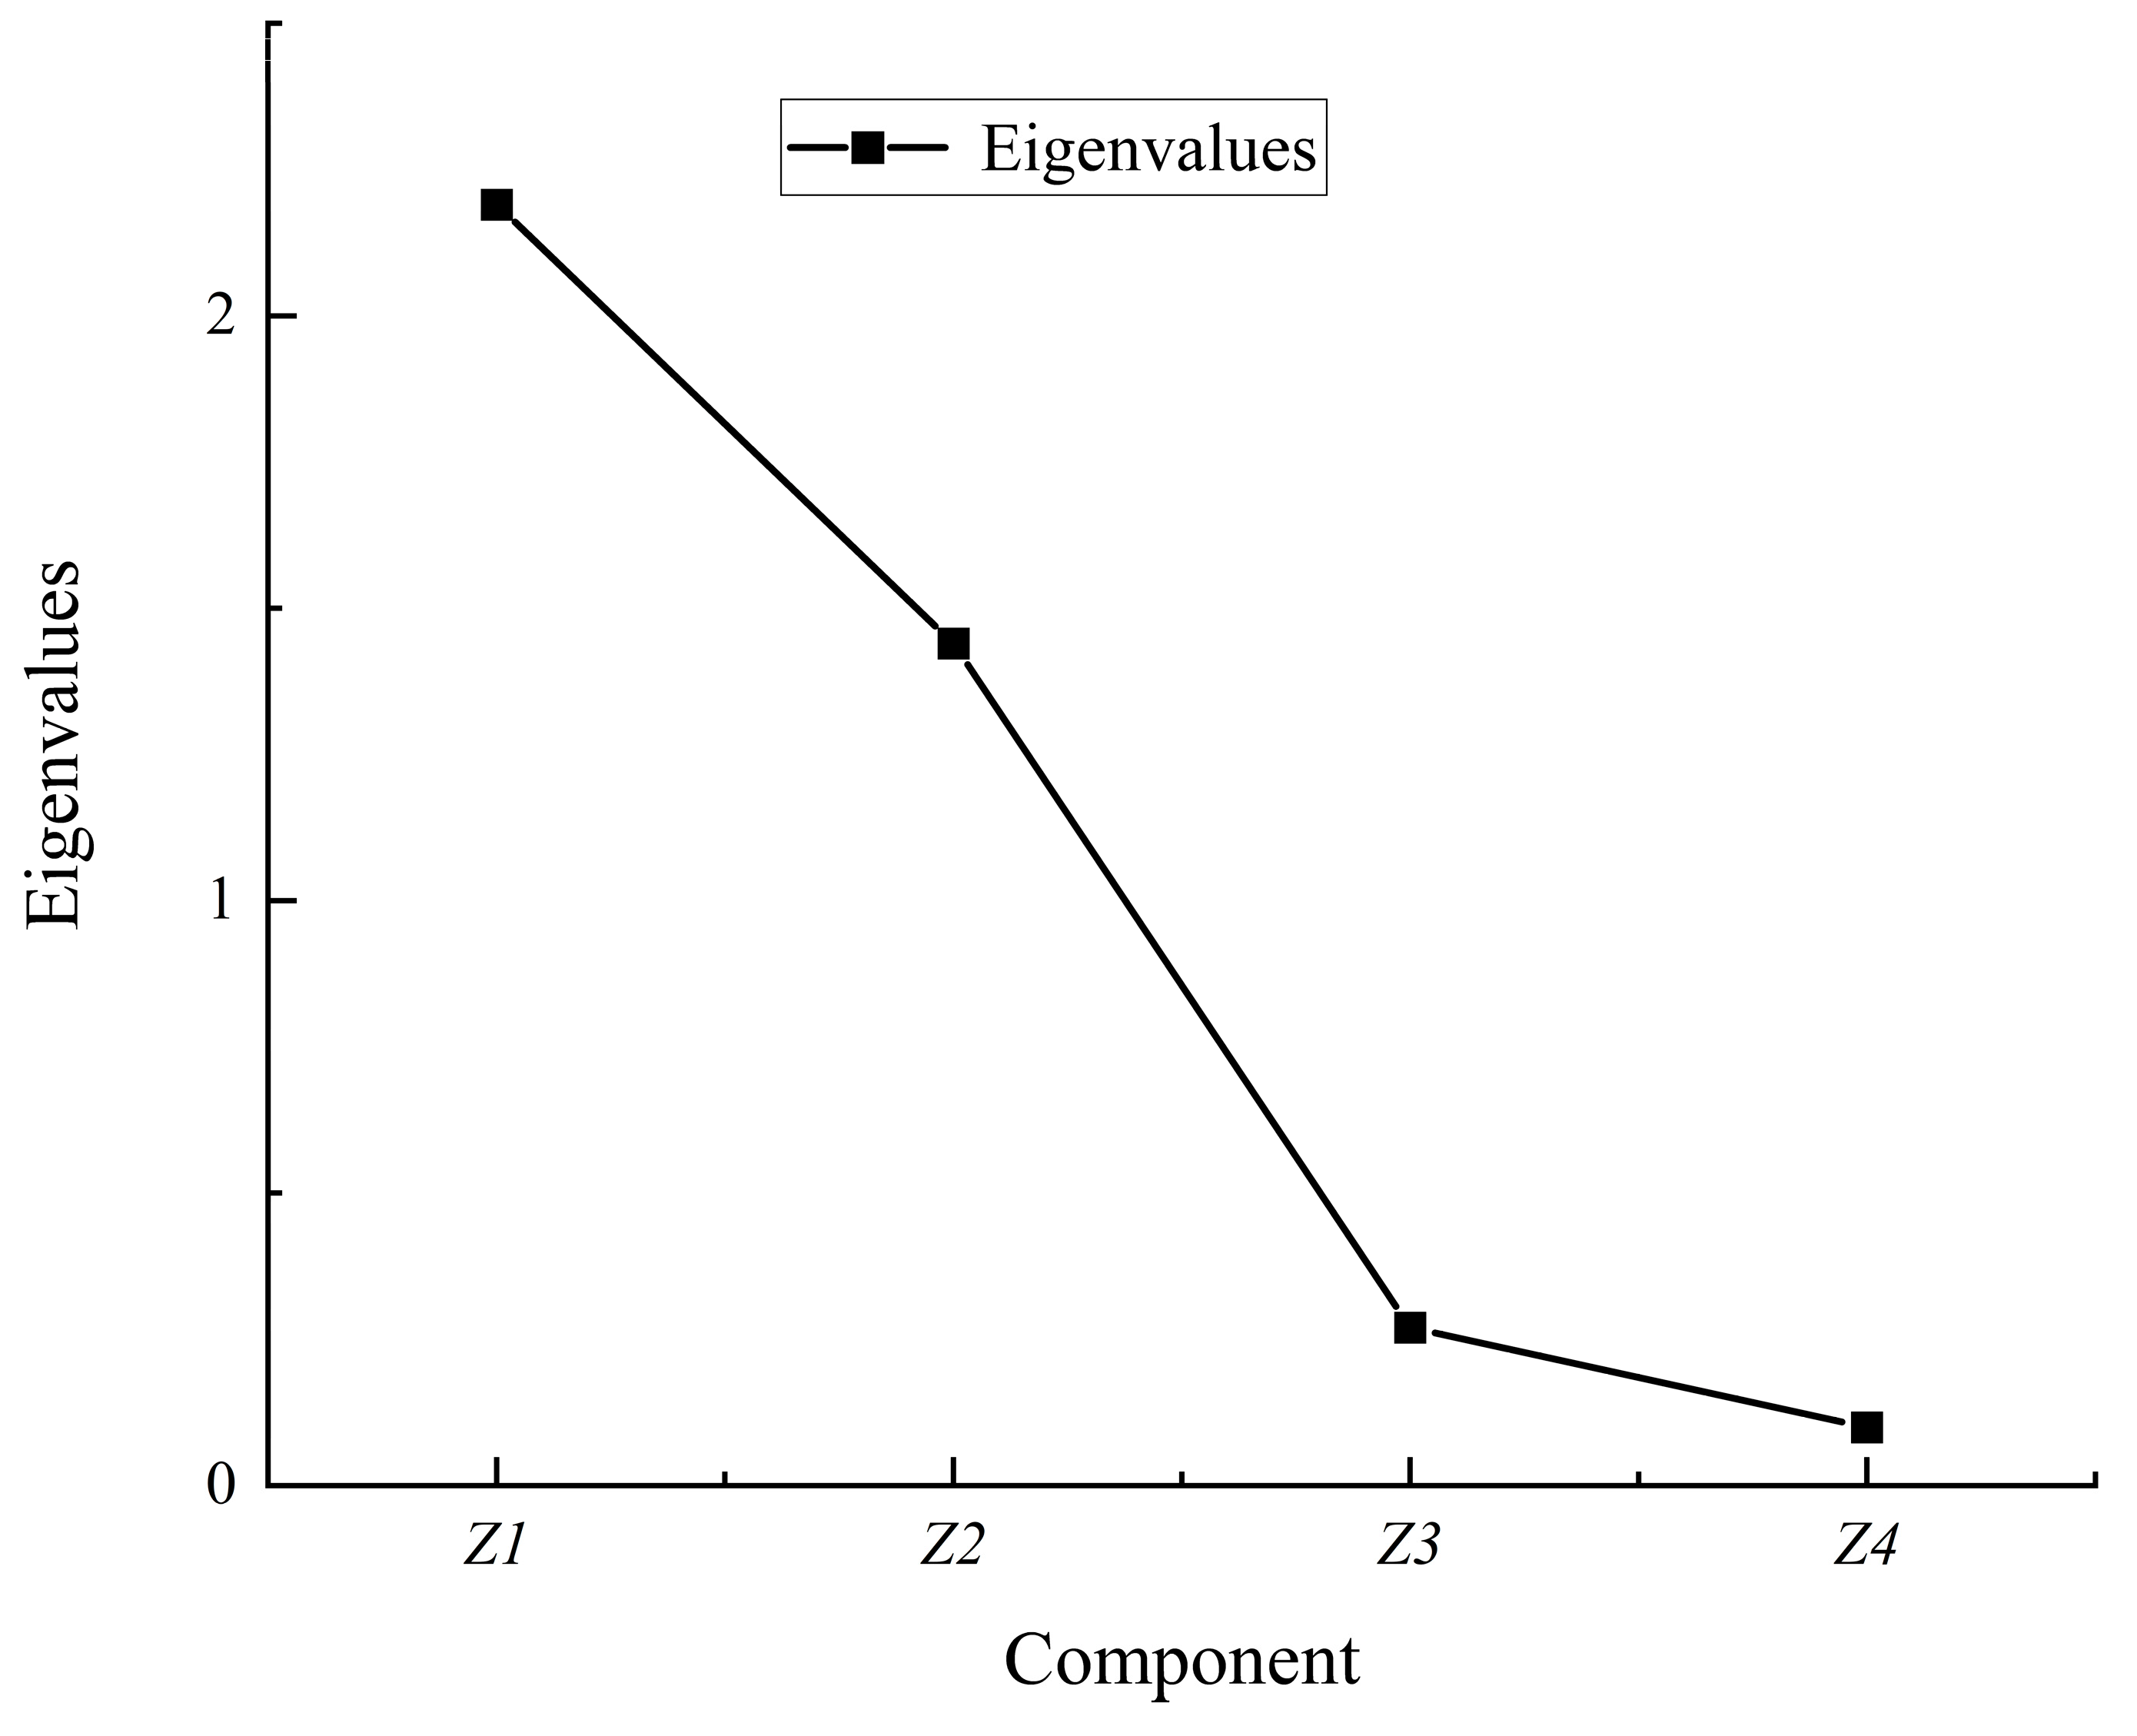
| Initial Characteristic Values | Extraction of Squared Sum of Loadings | |||||
|---|---|---|---|---|---|---|
| Components | Eigenvalues | Variance Percentage | Cumulative Percentage | Eigenvalues | Variance Percentage | Cumulative Percentage |
| Z1 | 2.19 | 54.83 | 54.83 | 2.19 | 54.83 | 54.83 |
| Z2 | 1.44 | 35.92 | 90.75 | 1.44 | 35.92 | 90.75 |
| Z3 | 0.27 | 6.79 | 97.54 | |||
| Z4 | 0.10 | 2.46 | 100.00 | |||
| Principal Components | Flood Season Precipitation | Flood Season Sediment Transport | Vegetation Coverage | Degree of Water and Soil Conservation Management |
|---|---|---|---|---|
| Z1 | 0.189 | −0.59 | 0.938 | 0.964 |
| Z2 | 0.928 | 0.723 | 0.226 | - |
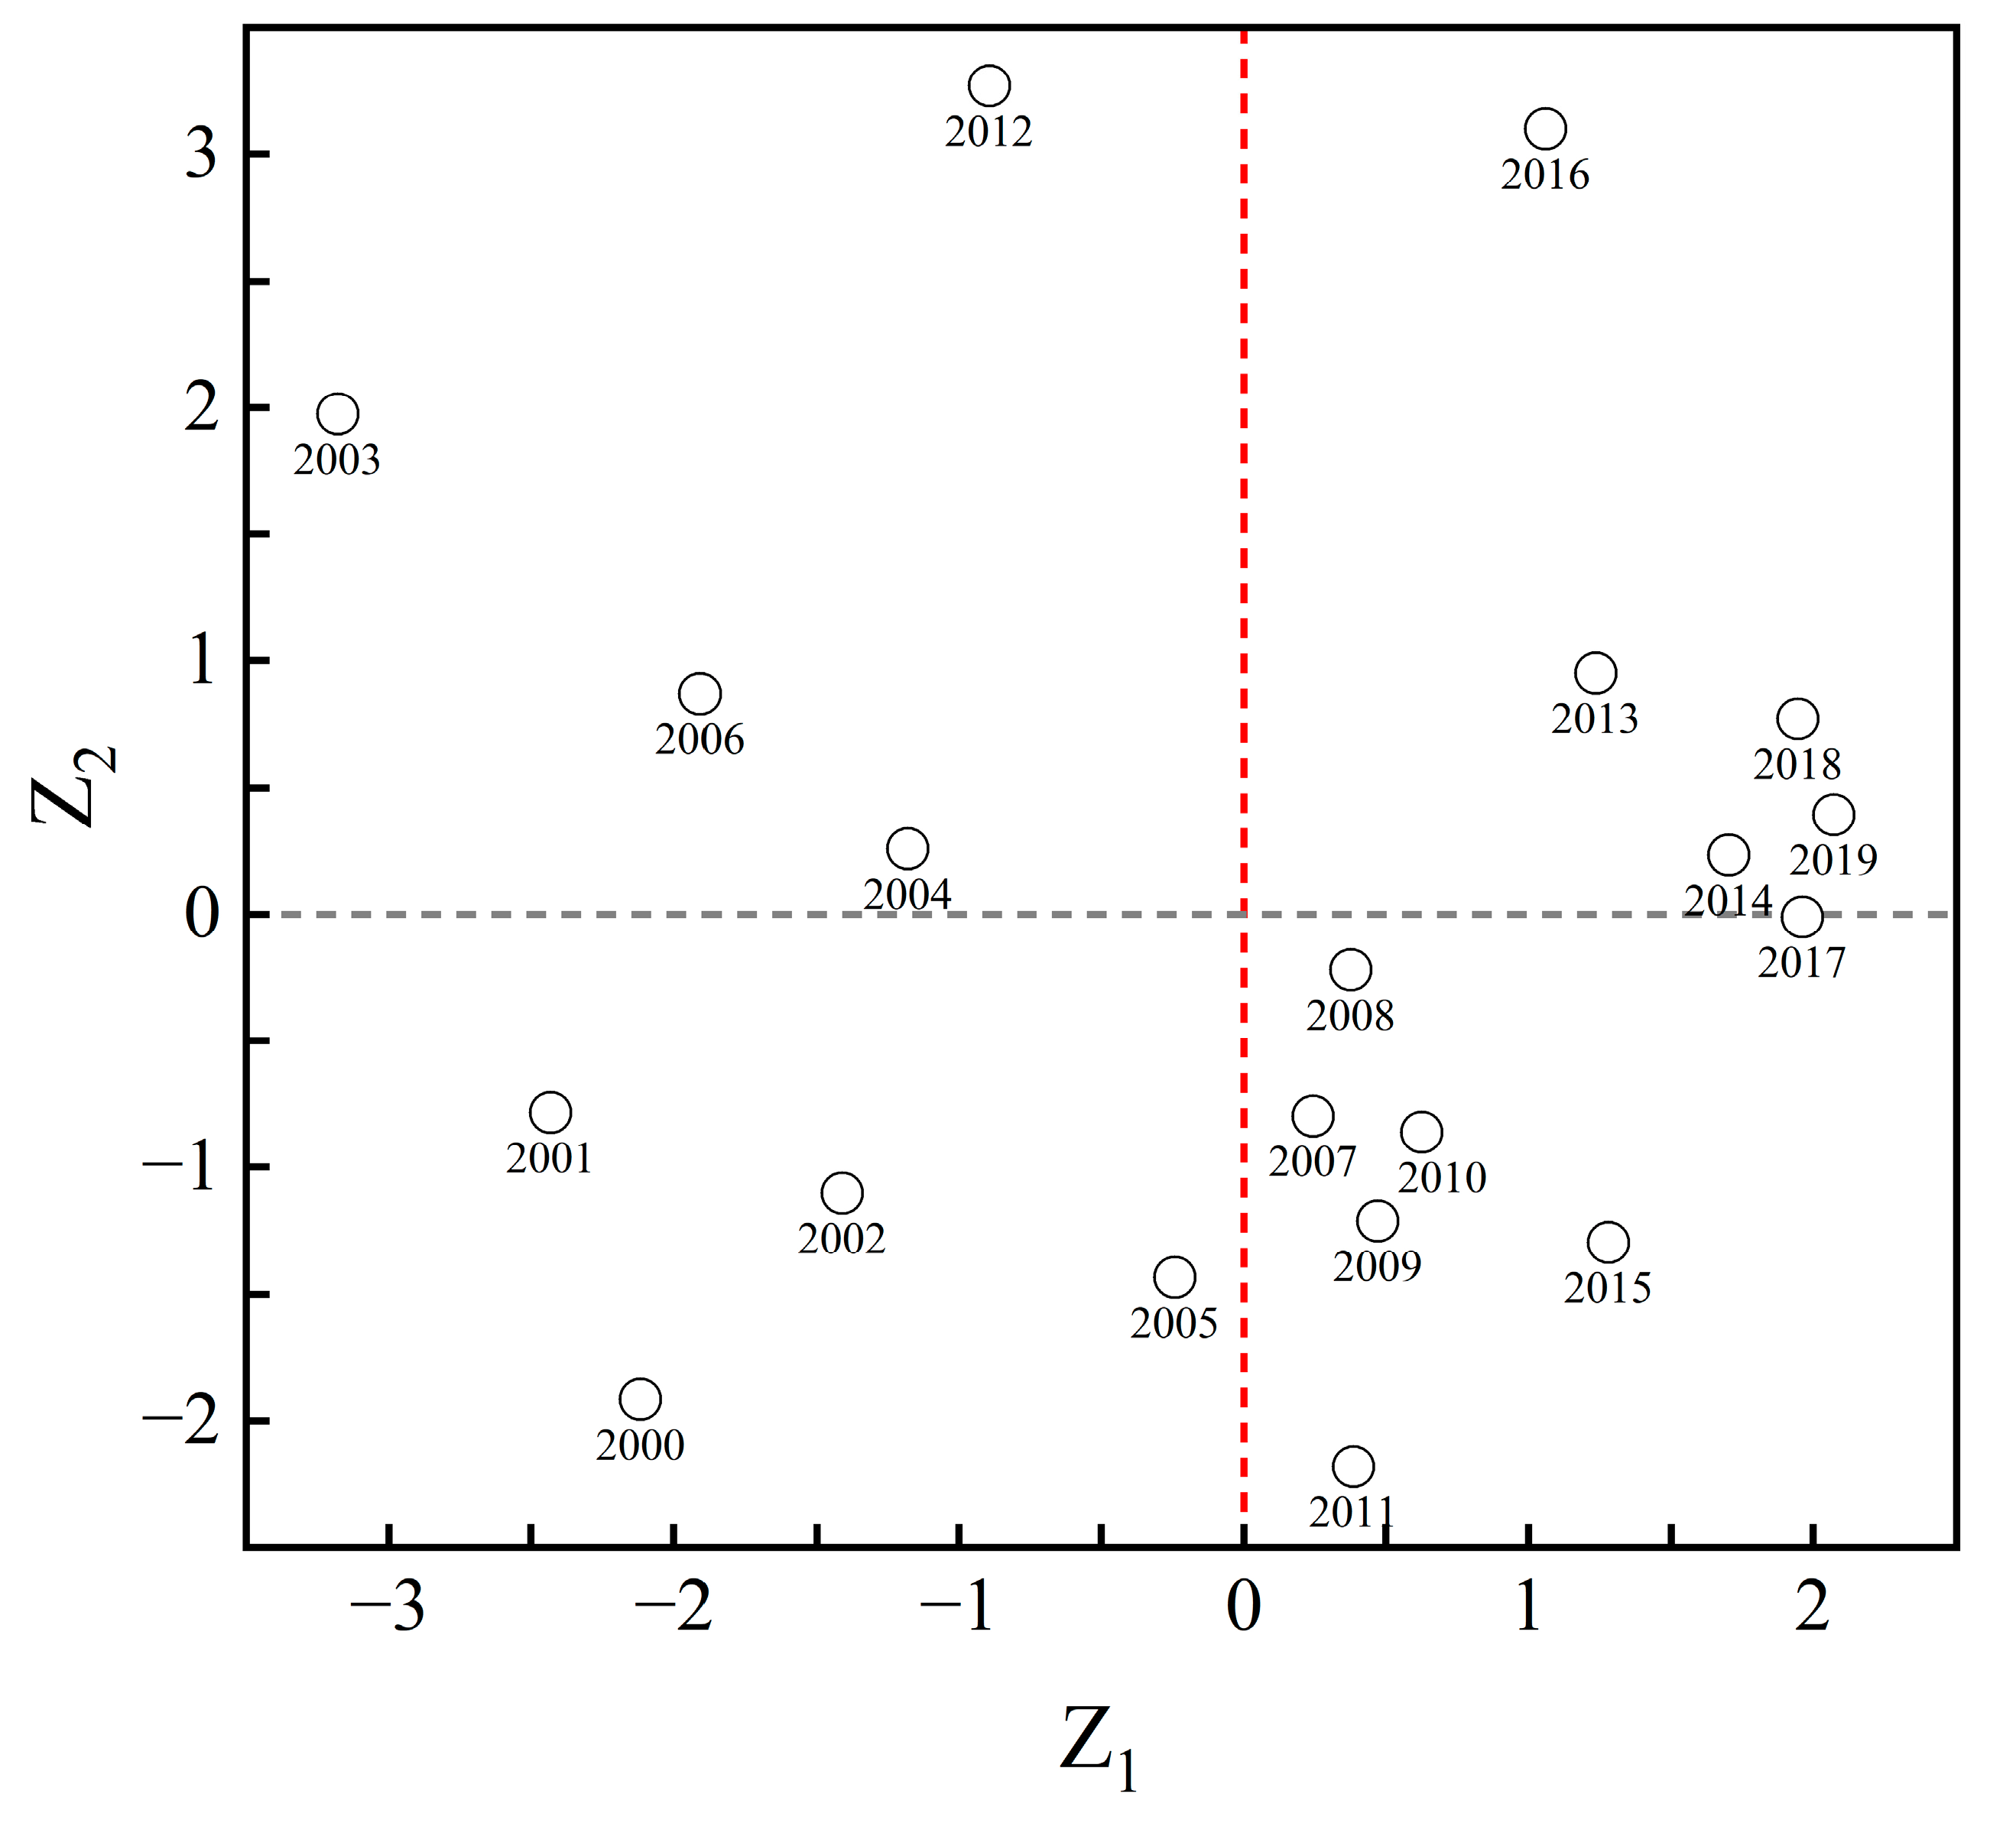
| Year | Z1 | Z2 | Scores | Rank |
|---|---|---|---|---|
| 2016 | 1.061 | 3.101 | 2.031 | 1 |
| 2018 | 1.945 | 0.772 | 1.386 | 2 |
| 2019 | 2.072 | 0.391 | 1.272 | 3 |
| 2013 | 1.237 | 0.951 | 1.097 | 4 |
| 2012 | −0.894 | 3.269 | 1.085 | 5 |
| 2017 | 1.961 | −0.012 | 1.025 | 6 |
| 2014 | 1.703 | 0.234 | 1.002 | 7 |
| 2008 | 0.376 | −0.222 | 0.088 | 8 |
| 2015 | 1.279 | −1.298 | 0.049 | 9 |
| 2010 | 0.624 | −0.86 | −0.083 | 10 |
| 2007 | 0.245 | −0.799 | −0.252 | 11 |
| 2009 | 0.471 | −1.211 | −0.328 | 12 |
| 2004 | −1.182 | 0.257 | −0.496 | 13 |
| 2006 | −1.909 | 0.87 | −0.583 | 14 |
| 2003 | −3.177 | 1.976 | −0.724 | 15 |
| 2005 | −0.243 | −1.434 | −0.805 | 16 |
| 2011 | 0.384 | −2.181 | −0.836 | 17 |
| 2002 | −1.410 | −1.103 | −1.263 | 18 |
| 2001 | −2.432 | −0.783 | −1.645 | 19 |
| 2000 | −2.116 | −1.917 | −2.021 | 20 |
Disclaimer/Publisher’s Note: The statements, opinions and data contained in all publications are solely those of the individual author(s) and contributor(s) and not of MDPI and/or the editor(s). MDPI and/or the editor(s) disclaim responsibility for any injury to people or property resulting from any ideas, methods, instructions or products referred to in the content. |
© 2023 by the authors. Licensee MDPI, Basel, Switzerland. This article is an open access article distributed under the terms and conditions of the Creative Commons Attribution (CC BY) license (https://creativecommons.org/licenses/by/4.0/).
Share and Cite
Yao, J.; Li, Z.; Yao, W.; Xiao, P.; Zhang, P.; Xie, M.; Wang, J.; Mei, S. The Compound Response Relationship between Hydro-Sedimentary Variations and Dominant Driving Factors: A Case Study of the Huangfuchuan basin. Sustainability 2023, 15, 13632. https://0-doi-org.brum.beds.ac.uk/10.3390/su151813632
Yao J, Li Z, Yao W, Xiao P, Zhang P, Xie M, Wang J, Mei S. The Compound Response Relationship between Hydro-Sedimentary Variations and Dominant Driving Factors: A Case Study of the Huangfuchuan basin. Sustainability. 2023; 15(18):13632. https://0-doi-org.brum.beds.ac.uk/10.3390/su151813632
Chicago/Turabian StyleYao, Jingwei, Zhanbin Li, Wenyi Yao, Peiqing Xiao, Pan Zhang, Mengyao Xie, Jingshu Wang, and Shasha Mei. 2023. "The Compound Response Relationship between Hydro-Sedimentary Variations and Dominant Driving Factors: A Case Study of the Huangfuchuan basin" Sustainability 15, no. 18: 13632. https://0-doi-org.brum.beds.ac.uk/10.3390/su151813632