Article

Analysis of Spatial and Temporal Characteristics of Runoff Erosion Power in Fujiang River Basin Based on the SWAT Model

1
State Key Laboratory of Eco-Hydraulics in Northwest Arid Region, Xi’an University of Technology, Xi’an 710048, China
2
Shaanxi Electric Power Design Institute Co., Ltd., China Energy Engineering Group, Xi’an 710054, China
*
Author to whom correspondence should be addressed.
Sustainability 2023, 15(21), 15642; https://0-doi-org.brum.beds.ac.uk/10.3390/su152115642
Submission received: 25 September 2023 / Revised: 31 October 2023 / Accepted: 2 November 2023 / Published: 6 November 2023
(This article belongs to the Special Issue Soil Erosion and Water and Soil Conservation)

Abstract

:
As an erosion dynamic index considering the three elements of flood, runoff erosion power (REP) can better reflect the influence of precipitation, underlying surface, and other factors on the erosion and sediment transport (ST) of flood events. Therefore, it is of great significance to study the variation characteristics of the REP and its relationship with ST in the basin for soil erosion control. In this paper, the Fujiang River Basin (FRB) was selected to analyze the characteristics of runoff and ST at four hydrological stations in the basin from 2009 to 2018, including Santai, Jiangyou, Shehong, and Xiaoheba. Combined with the concept of the REP, six kinds of water–sediment relationship were compared and analyzed. Furthermore, by constructing the SWAT model, the spatial distribution characteristics of runoff, ST, and REP in the FRB were analyzed in depth, and the spatial scale effect of the REP in the basin was explored. The conclusions are as follows: (1) The power function relationship between REP and sediment transport modulus (STM) is better than the other five kinds of water–sediment relationship. (2) Based on the SWAT model, the evaluation indexes of the monthly runoff and ST of the four hydrological stations are credible, good, and excellent in the rating period (RP) and the validation period (VP). (3) The annual REP in the main stream from upstream to downstream is mostly a single change trend, while in each primary tributary, the overall value is larger than that of the main stream and the interannual difference is obvious. The average annual REP generally shows the distribution characteristics of ‘large at the junction of the upper and middle reaches and small in the rest of the area’. With the increase in the control area, the multi-year average REP has a decreasing trend, especially when the catchment area above the sub-watershed is >7318 km2; the change of the multi-year average REP is single and obviously slows down, with an average value of 23.8 mm·m3·s−1·km−2.

1. Introduction

On a global scale, soil erosion is identified as the biggest threat to soil function, which seriously damages land resources, causes water resources loss, causes land degradation and river sediment deposition in the basin, leads to the deterioration of the ecological environment in the basin, and affects the survival and life of human beings [1,2]. The dynamic process of soil erosion mainly includes three basic sub-processes: soil particle stripping, transport, and deposition. In essence, it is the reshaping of the surface topography of the basin during the dissipation and conversion of energy in the basin. The amount of sediment transport (ST) in the river channel is an important basis for the study of soil erosion control in the basin. The change in water and sediment relationship is a comprehensive reflection of the natural conditions and human activities in the basin [3]. In particular, in recent years, the reduction in ST in most rivers around the world has led to significant changes in the spatial and temporal distribution of erosion and the process of sediment production and transport in the basin [4,5]. Therefore, the study of the changes of water and sediment in the basin and the relationship between them is of great significance to understand the characteristics of water and sediment changes, to understand the spatial and temporal distribution of soil and water loss, and to improve the prediction ability of sediment yield and transport in the basin. The slope runoff energy consumption theory [6], which has been developed at present, has shown certain advantages in describing the process of soil erosion. In particular, the concept of runoff erosion power (REP) is proposed [7], which is defined as the product of runoff depth and flood peak flow modulus of the flood process. Compared with rainfall erosivity, it can better characterize the erosion power of slope and basin flood events. Follow-up studies also show that REP is a dynamic index of erosion of flood events in the basin that can comprehensively consider the three elements of flood [8], which can better reflect the influence of precipitation and underlying surface on the erosion and ST of flood events in the basin. Based on the theory of REP, Liu et al. [9] systematically analyzed the characteristics of sub-flood ST in the main tributaries of the Upper Yangtze River. The results showed that the overall downward trend of sub-flood ST was related to soil and water conservation and the construction of large reservoirs. Further analysis shows that the variation in sediment transport modulus (STM) under low flow conditions is greater than that under high flow conditions in different periods of each station.
In view of the superiority of the REP in reflecting ST in the basin, it is necessary to analyze the relationship between REP and ST and the spatial and temporal distribution of the REP in the basin. Wang et al. [10] analyzed the spatial distribution of the REP in the Xihe River Basin based on the SWAT model. The results showed that the spatial distribution of REP showed the characteristics of ‘strong in the north and weak in the south, strong in the west and weak in the east’, and that the topography was the dominant factor of upstream REP. Yang et al. [11] found that the REP in the Qingshuihe River Basin showed that the tributary REP was larger than the main stream. Liu et al. [12] selected the measured data of four hydrological stations in Beibei, Sanheba, Wusheng and Luoduxi in the Jialing River Basin, and found that there was a good power function relationship between STM and REP. However, the current research on the REP is almost entirely concentrated in the Yellow River Basin in China. In addition, the analysis of the spatial and temporal distribution characteristics of REP is relatively simple. It is common to analyze the REP of the sub-watershed and the catchment area above the corresponding outlet section without distinction. In addition, there is a lack of sufficient research on the variation characteristics of REP and its relationship with ST.
As one of the most serious areas of soil erosion in China, the Upper Yangtze River was approved by the State Council of China in 1988 as the key prevention and control area of soil and water conservation in China [13]. Since then, the problem of soil and water loss in this area has been paid attention to and treated. In this paper, the FRB, a secondary tributary of the Upper Yangtze River in China, was selected as the research object. Based on the measured runoff and sediment data from 2008 to 2018, the advantages and disadvantages of different expression relationships of six kinds of water–sediment relationship were compared and analyzed. Secondly, based on the SWAT model, the spatial and temporal distribution of REP and its scale effect in recent years were analyzed, in order to clarify the good expression relationship between REP and ST and the spatial and temporal variation characteristics of REP in the basin, so as to provide a reference basis for soil erosion control and ST prediction in the basin.

2. Materials and Methods
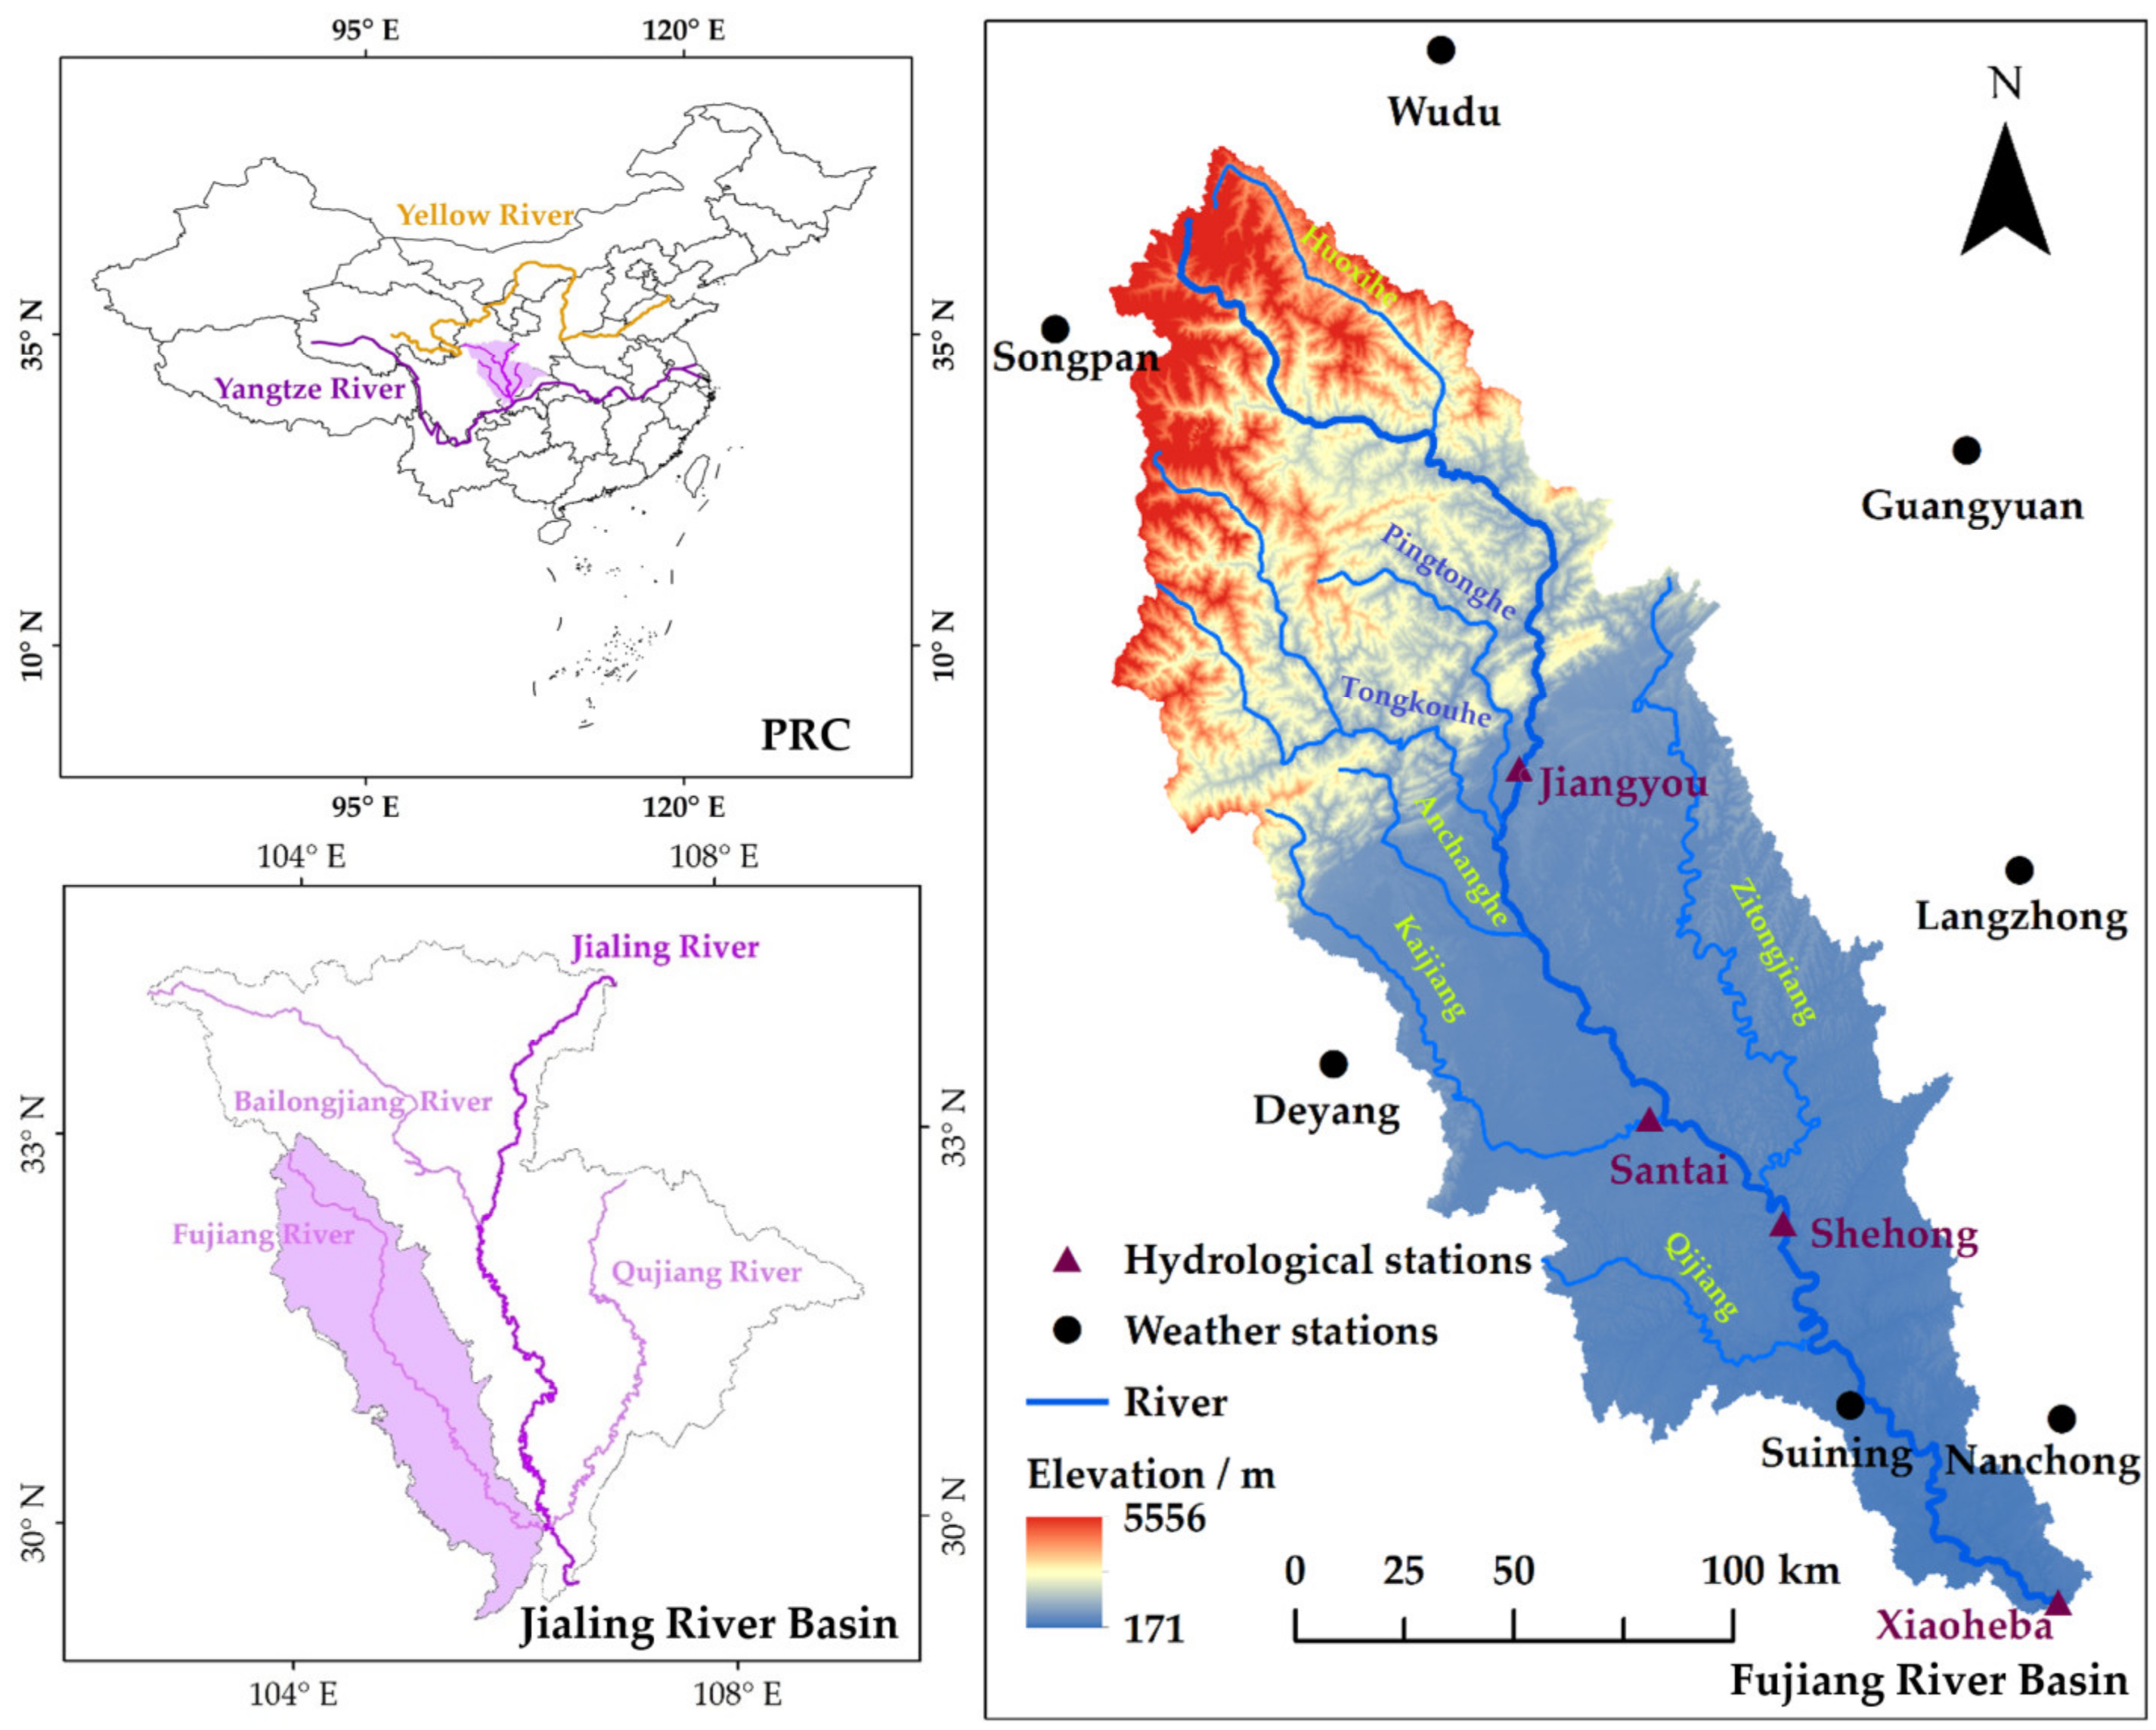
2.1. Study Area

The Fujiang River is a secondary tributary of the Upper Yangtze River (Figure 1). It is one of the three major water systems of the Jialing River. It originated on the northern slope of the Xuebaoding, the highest peak of the Minshan Mountains. The main stream flows through Jiangyou City from northwest to southeast, enters the hilly area of the Sichuan Basin, and joins the Jialing River in Chongqing City [14]. The FRB is 670 km long and the basin area is 35,881 km2. The shape of the basin is long and narrow, and there are many tributaries, most of which are distributed on the right bank. The distribution of tributaries makes the FRB system present an asymmetric feathery water system [15].
The upper reaches are mainly the Hengduan Mountains. The valleys in this area are narrow, and the altitude is mostly between 4500 and 5000 m. There is a clear terrain junction between the upper and middle reaches of the basin. Precipitation is extremely abundant, and the average annual precipitation is between 1000 and 1400 mm [16]. The middle and lower reaches are mostly shallow hills and flatlands, with an altitude of 600~200 m. The FRB is one of the main sources of sediment in the Jialing River [17].

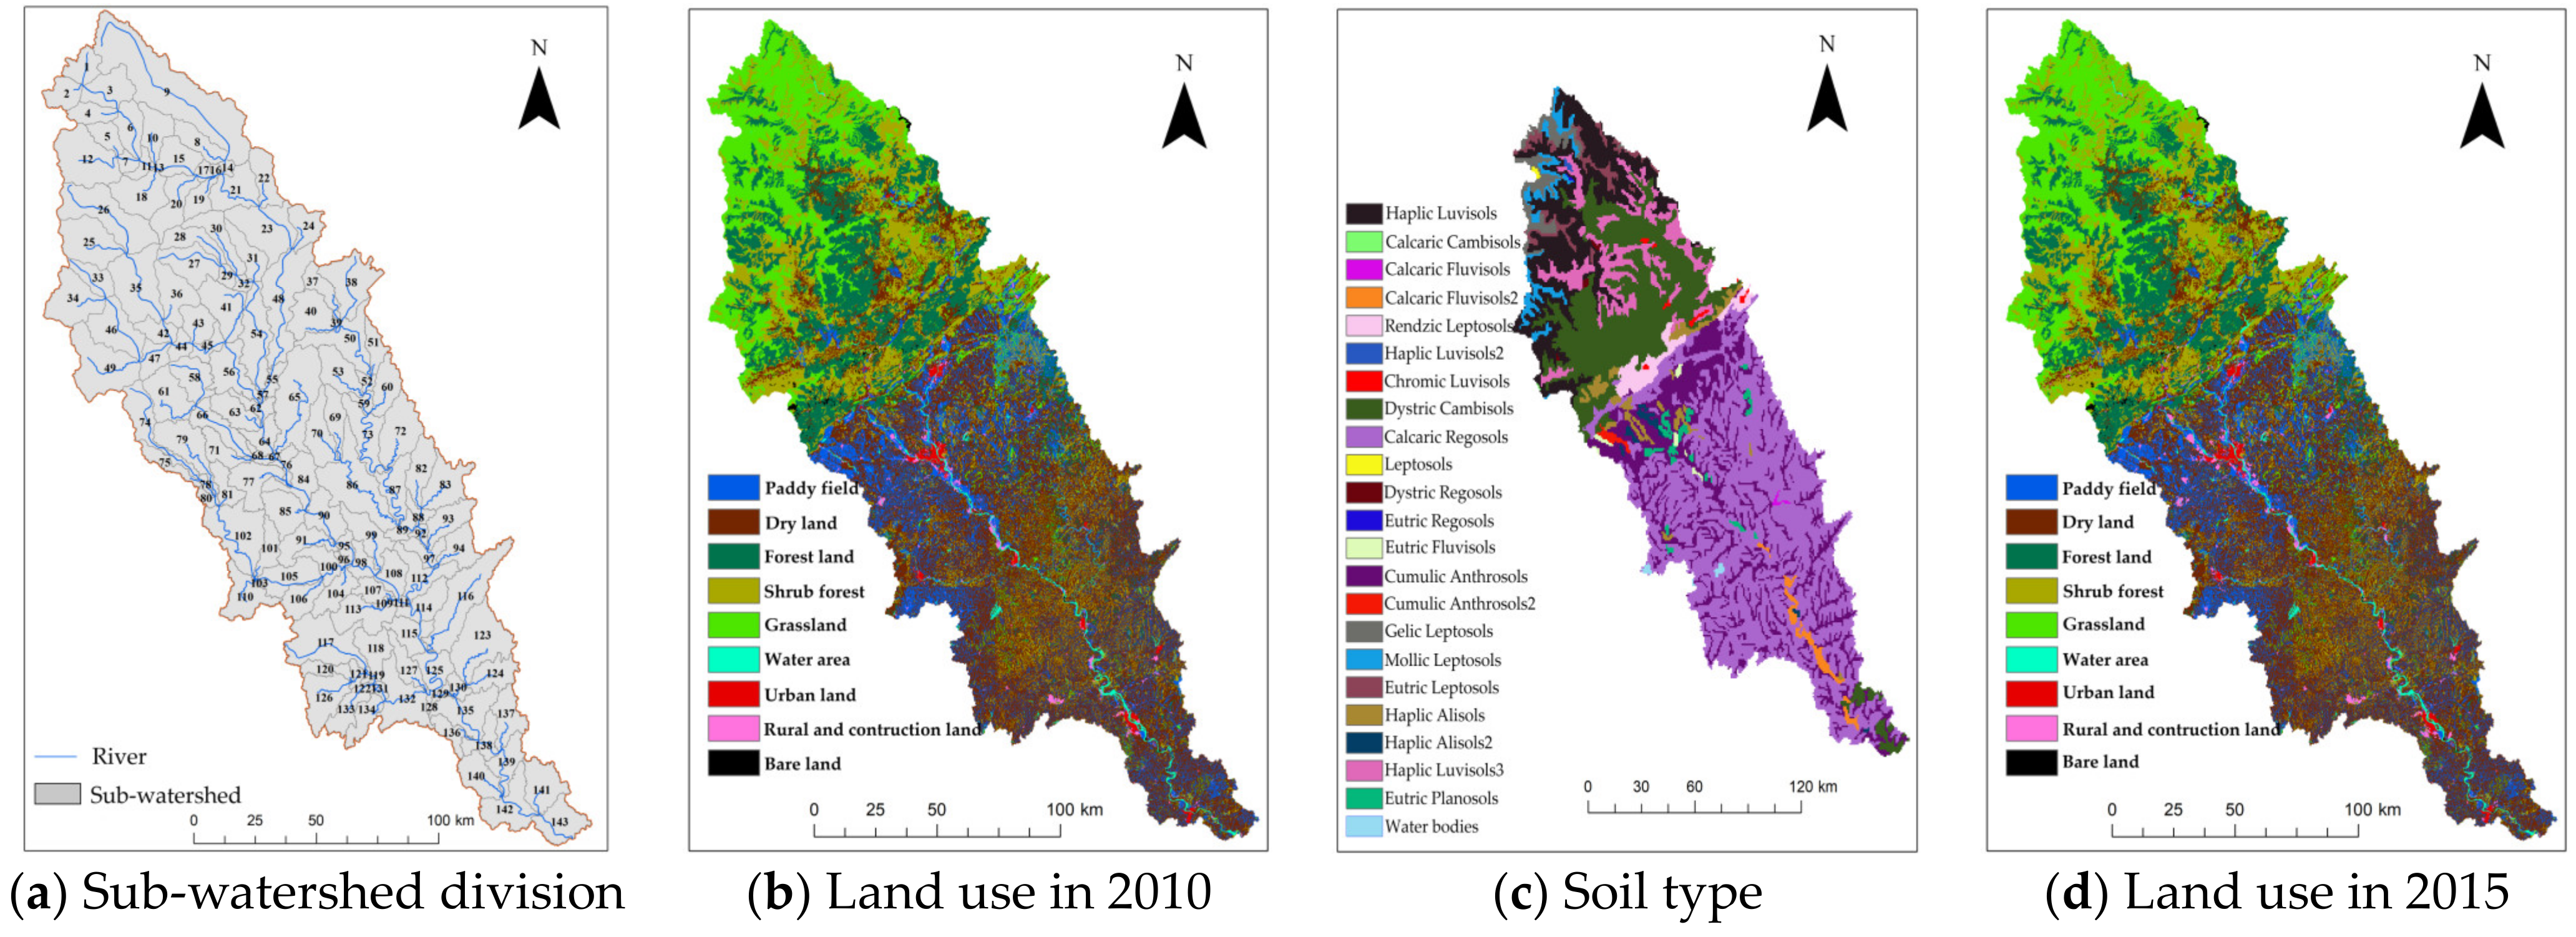
2.2. Data Requirement and Preprocessing

The daily average flow and sediment concentration data of four hydrological stations in Jiangyou, Santai, Shehong, and Xiaoheba in the FRB from 2008 to 2018 are from the sixth volume of the Hydrological Yearbook of the People’s Republic of China’s ‘Hydrological Data of the Yangtze River Basin’. The meteorological data in the basin from 2008 to 2018 are from the China Meteorological Data Network (http://Data.cma.cn/ (accessed on 22 January 2022)). A total of seven meteorological stations were selected from Songpan, Deyang, Guangyuan, Langzhong, Suining, Gaoping, and Wudu (Figure 1).
The terrain data are the ASTER GDEM DEM with 30 m resolution obtained from the Geospatial Data Cloud (http://www.gscloud.cn/ (accessed on 12 January 2022)). The land cover data are the land use data with 30 m resolution obtained from the remote sensing image interpretation of the data center of the Chinese Academy of Sciences. The soil data are the digital soil map with 1 km resolution of the World Soil Database (HWSD). The meteorological data used the China Atmospheric Assimilation Driven Dataset (CMADS V1.2), mainly including daily cumulative precipitation, daily average pressure, daily maximum/average/minimum temperature, relative humidity, daily average wind speed data, and daily average solar radiation.

2.3. Data Analysis

2.3.1. Runoff Erosion Power

In this paper, combined with the idea of the REP and its generalization on different time scales proposed by Li et al. [18], the REP is calculated as follows:
E = H Q max
Q max = Q max A
H = i = 1 n Q i Δ t d A
where E represents the REP of the period, and the unit is mm·m3·s−1·km−2; H is the runoff depth of the period, mm; Q max is the flood peak flow modulus corresponding to the maximum flow in the period, m3/(s·km2); Q max is the maximum flow of the period, m3/s; Q i is the average flow of each period, m3/s; n is the number of time periods ; A is the catchment area above the corresponding outlet, km2; and Δ t d is the calculation time, s.

2.3.2. Different Expressions of Water–Sediment Relationship

The water–sediment relationship selected in this paper is as follows:
S = b 1 R + a 1
M = b 2 H + a 2
M = b 3 E + a 3
ln S = b 4 ln R + ln a 4
ln M = b 5 ln H + ln a 5
ln M = b 6 ln E + ln a 6
R = t 1 t 2 Q ( t ) d t = Q ¯ ( t 2 t 1 )
S = t 1 t 2 S ( t ) Q ( t ) d t = Q S ¯ ( t 2 t 1 )
M = S / A
where S represents the annual sediment transport, 108 t; R is the annual runoff, 108 m3; M is annual sediment transport modulus, t/km2. Q ( t ) and S ( t ) represent instantaneous flow and average flow, respectively, m3/s. S ( t ) represents instantaneous sediment concentration, kg·m−3; Q S ¯ represents the average sediment transport rate during the period, kg·m−1; and t1 and t2 represent the beginning and end of the period, respectively. In this study, the period is selected as the year. The rest is the same as above.

2.3.3. SWAT Model

The SWAT model, a distributed hydrological model, runs at a daily time step and divides the basin into different sub-watersheds. Based on different soil, land use, and meteorological distribution in different regions, different basin physical processes can be simulated [19].
The model operation process can be roughly divided into the following three steps: (1) Delineating the watershed boundary, that is, the study area is discretized into several sub-watersheds of different types of underlying surface according to the sub-watershed area threshold. (2) According to the land use grid map, soil grid map and climate data, the hydrological response units (HRUs) of the sub-watershed are divided, and the conceptual model is used to calculate the net rain, runoff, sediment yield, and pollutant production on HRUs. (3) The river confluence calculation is carried out to calculate the discharge of the outlet section, the amount of sediment carried, the amount of pollutants, etc., and the final result is output.
(1)
Model construction
The SWAT model in this paper took the Xiaoheba Station as the outlet control section of the basin. Based on ArcGIS 10.2, after extracting the river network, the slope was divided, and the basin was divided into 143 sub-watersheds by setting the catchment area threshold to 10,000 ha (Figure 2a). Then, the corresponding model database file was generated. The soil database of SWAT model was constructed by using the cut LUCC map (Figure 2b) and HWSD soil type map (Figure 2c) of the FRB in 2010. After inputting land use, soil type, and watershed slope classification according to the model requirements, the threshold of removing secondary land use, soil type, and slope terrain was set to 10%, and the area percentage of other land use, soil type, and slope terrain was redistributed to cover the whole area of each sub-watershed, and 143 sub-watersheds were further divided into 1943 HRUs. Finally, the meteorological data set of the above CMADS V1.2 version was cropped using ArcGIS and the boundary file of the FRB, and 292 meteorological stations were selected to fully cover the study area and import the model.
In this paper, the model rate regularly uses the 2010 land use type (Figure 2b), and the verification period uses the 2015 land use type (Figure 2d).
(2)
SWAT model validation
The Nash–Sutcliffe efficiency coefficient (NSE), coefficient of determination (CD), and percent bias (PBIAS) were used to evaluate the calibration effect. The closer CD and NSE were to 1, the closer the simulated value is to the measured value [20]. When PBIAS is 0, it indicates that the simulated value is completely consistent with the observed value. When PBIAS is positive, it indicates that the simulated value is higher than the observed value. When PBIAS is negative, it means that the simulated value is lower than the observed value.
The calculation formulas of CD, NSE, and PBIAS are shown in Formulas (13)–(15), and the evaluation criteria are shown in Table 1.
R 2 = i = 1 T ( O i O ¯ ) ( S i S ¯ ) i = 1 T ( O i O ¯ ) 2 i = 1 T ( S i S ¯ ) 2
N S = 1 i = 1 T ( O i S i ) 2 i = 1 T ( O i O ¯ ) 2
P b i a s = i = 1 T O i S i i = 1 T O i × 100
R2, NS and Pbias represent CD, NSE, and PBIAS, respectively. T represents the sequence length of hydrological elements; O i is the measured value; O ¯ is the mean of the measured value; S i is the simulation value; and S ¯ is the mean of the simulation value.

3. Results

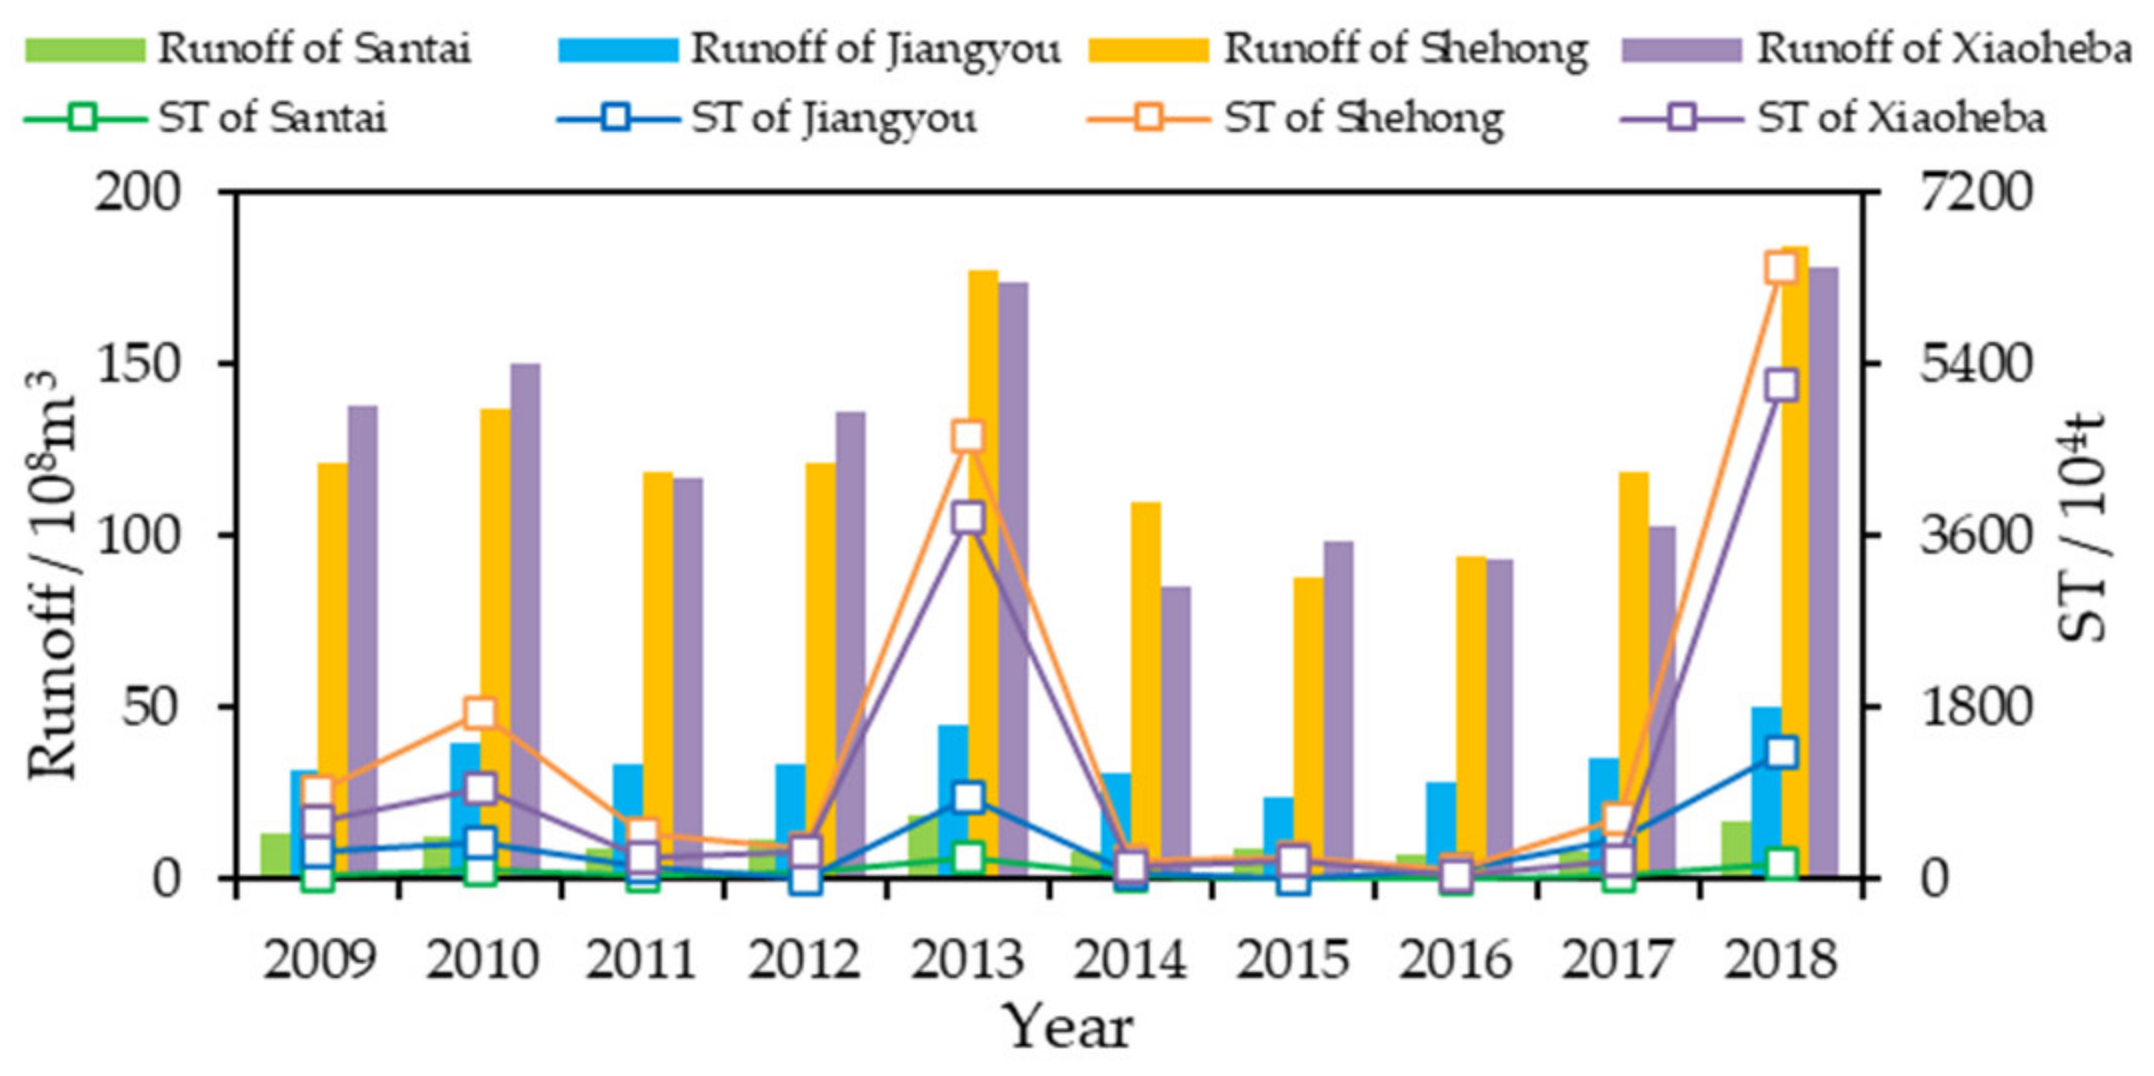
3.1. Analysis of Water–Sediment Relationship in the FRB

From 2009 to 2018, the annual runoff and ST changes of four hydrological stations in Santai, Jiangyou, Shehong, and Xiaoheba in the FRB and the proportion of runoff and ST in Santai, Jiangyou, and Shehong to the runoff and ST of Xiaoheba are shown in Figure 3 and Table 2. In general, the proportion of ST in each hydrological station is larger than that of runoff. Specifically, the contribution of Santai station to the runoff and ST of Xiaoheba station is relatively small. The contribution of Jiangyou station to the runoff of the Xiaoheba station is about 30%, and the contribution of ST is 31.4% except for 2016 and 2017. The Shehong station contributes almost all the runoff of the Xiaoheba station, and the contribution of ST even exceeds 100%. In addition, it can also be found that compared with 2009–2013, ST in the Santai–Jiangyou section increased in 2014–2018, the incoming runoff and ST in the Jiangyou–Shehong section decreased, and there was sediment deposition in the Shehong–Santai section.
By dividing hydrological sequences from 2009 to 2018 into the rating period (RP, 2009–2013) and the validation period (VP, 2014–2018), the calculation results were obtained, as shown in Table 3. The Formulas (6) and (9) are relatively better in six kinds of water–sediment relationship. In particular, the p-value of Formula (9) is basically less than 0.01 in RP. During VP, the evaluation indexes CD, NSE, and PBIAS of Santai, Jiangyou, Shehong, and Xiaoheba all meet R2 > 0.6, NS > 0.5, and Pbias ≤ ±25%.

3.2. Simulation of Runoff and ST in the FRB Based on SWAT Model

3.2.1. The Calibration Results of Parameters

The period from 2008 to 2018 was selected as the simulation period of the SWAT model. Among them, 2008 was the preheating period of the model, 2009–2013 was RP of the model, and 2014–2018 was VP of the model. Based on the model, the basin was divided into 143 sub-watersheds and further divided into 1943 HRUs. After the sensitivity analysis and calibration of SWAT-CUP, 19 runoff sensitive parameters and 8 sediment sensitive parameters were selected for calibration. The calibration results of the parameters are shown in Table 4.

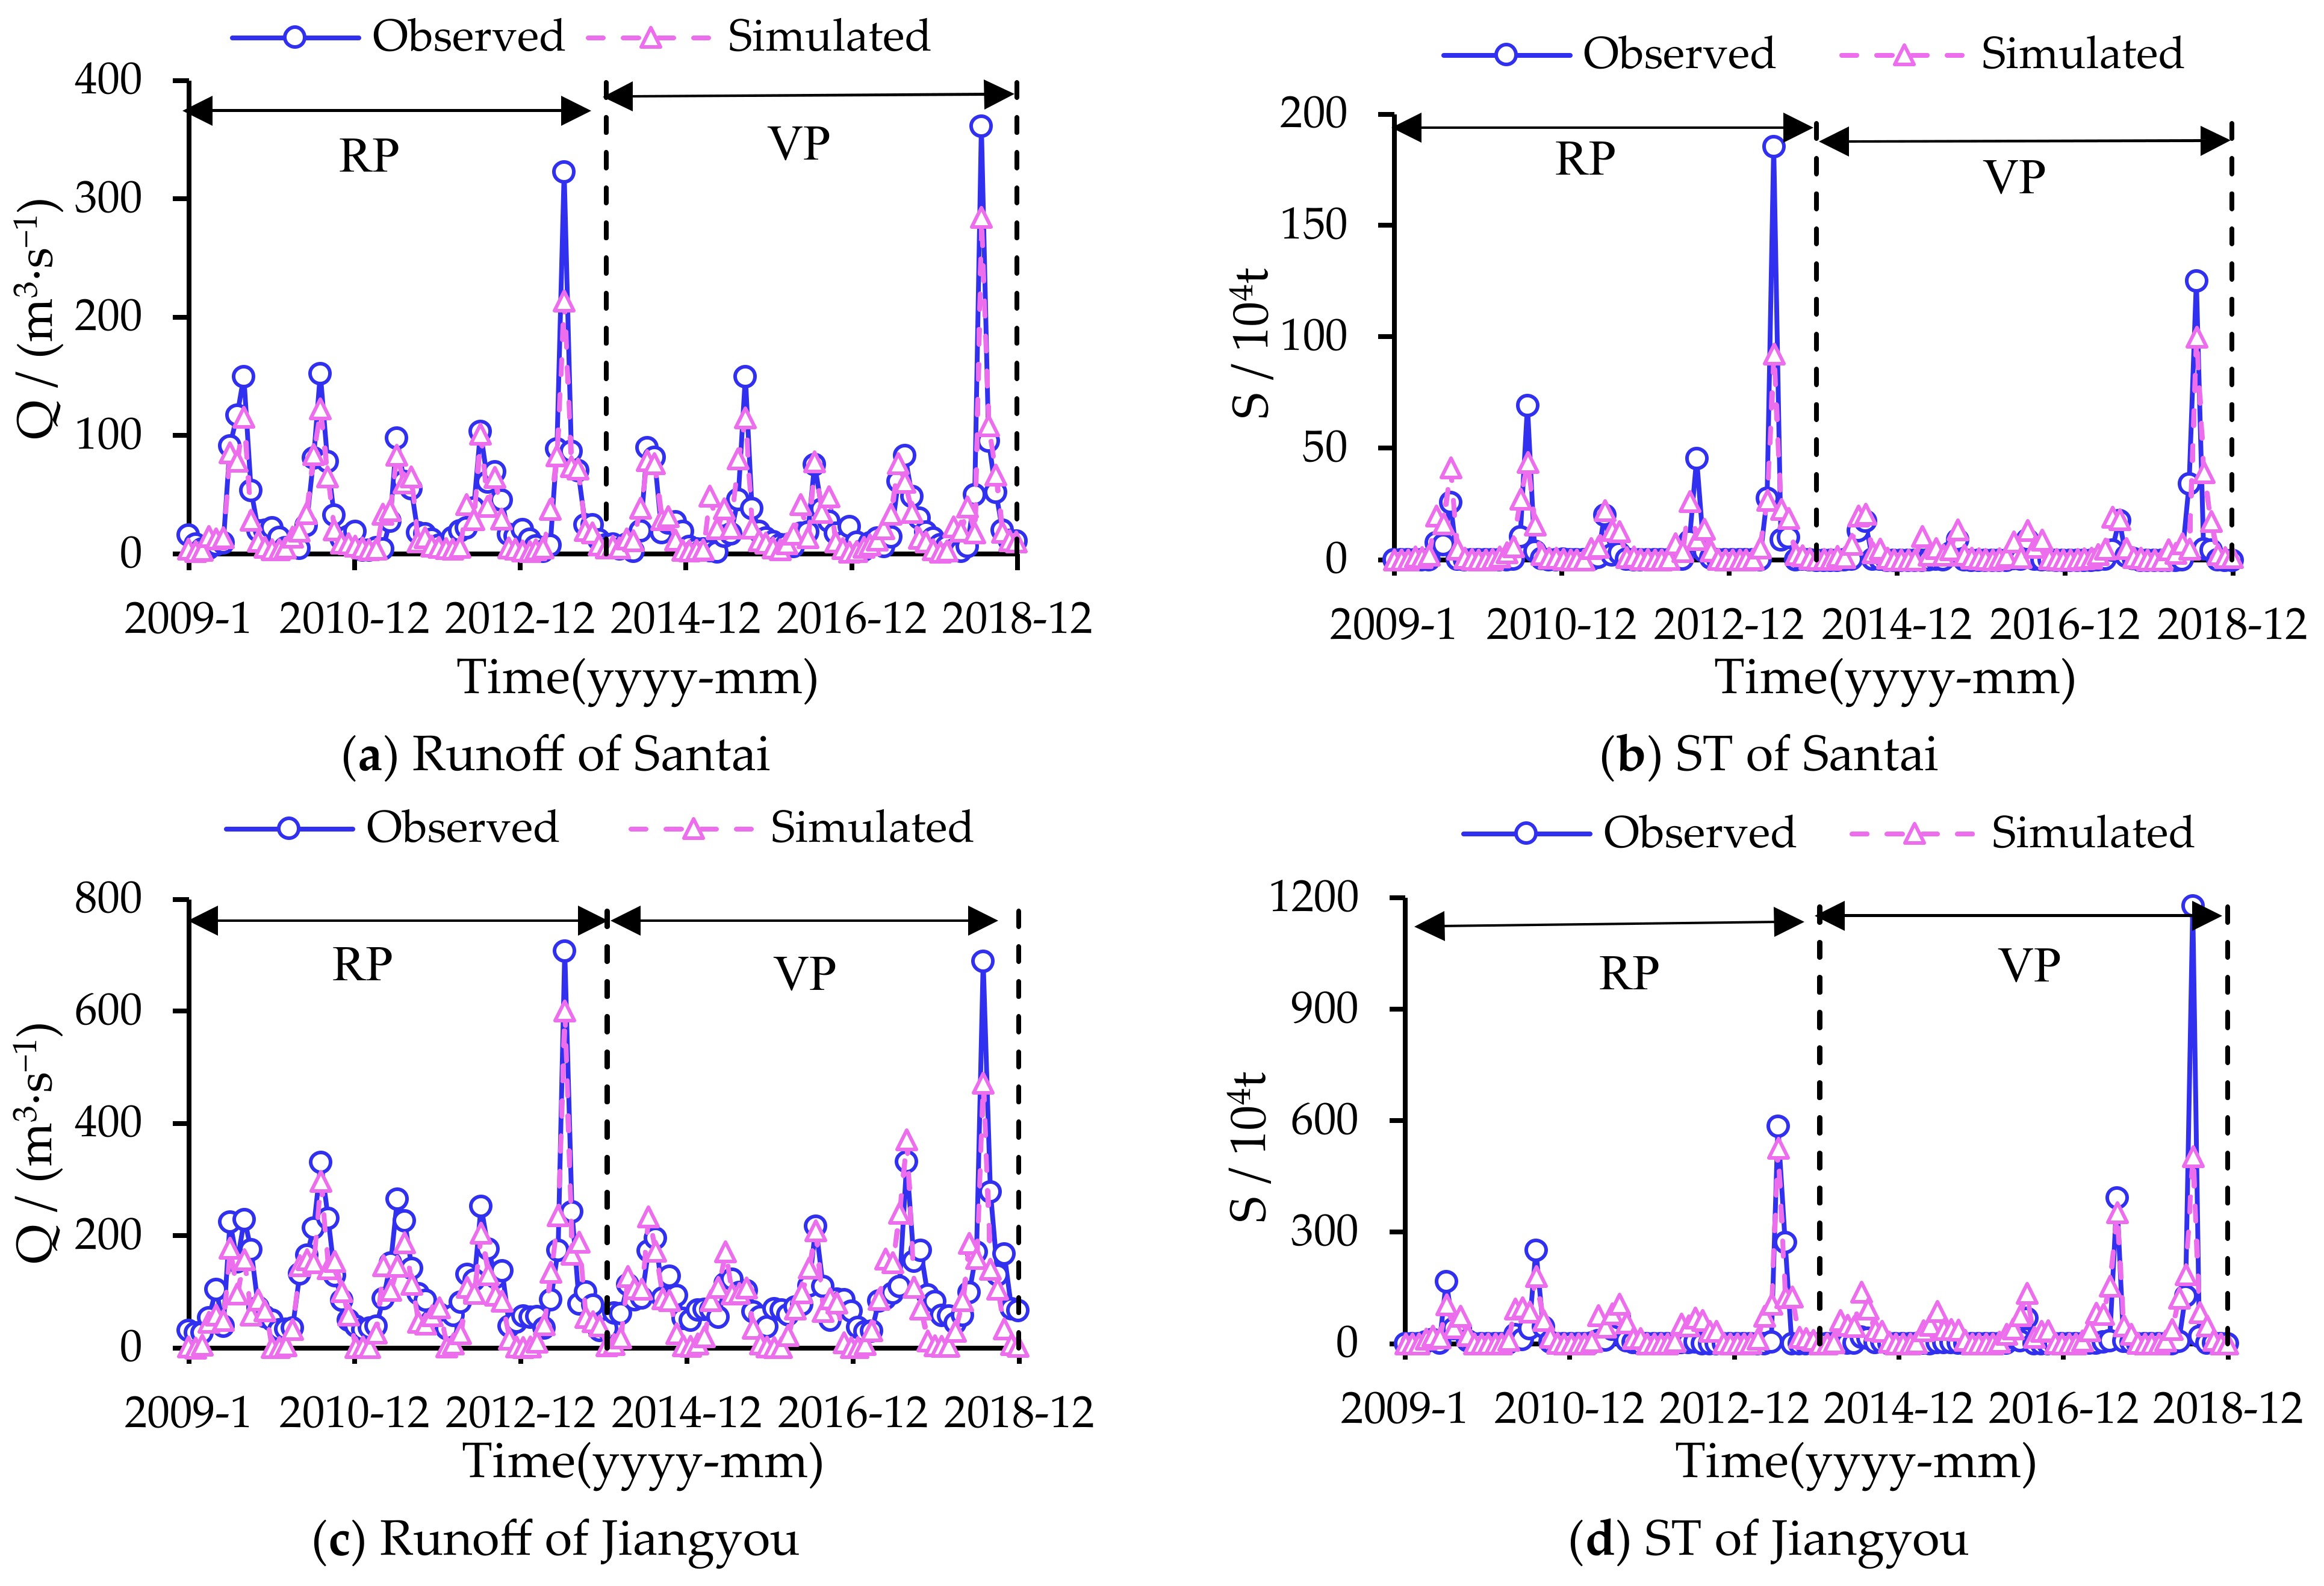
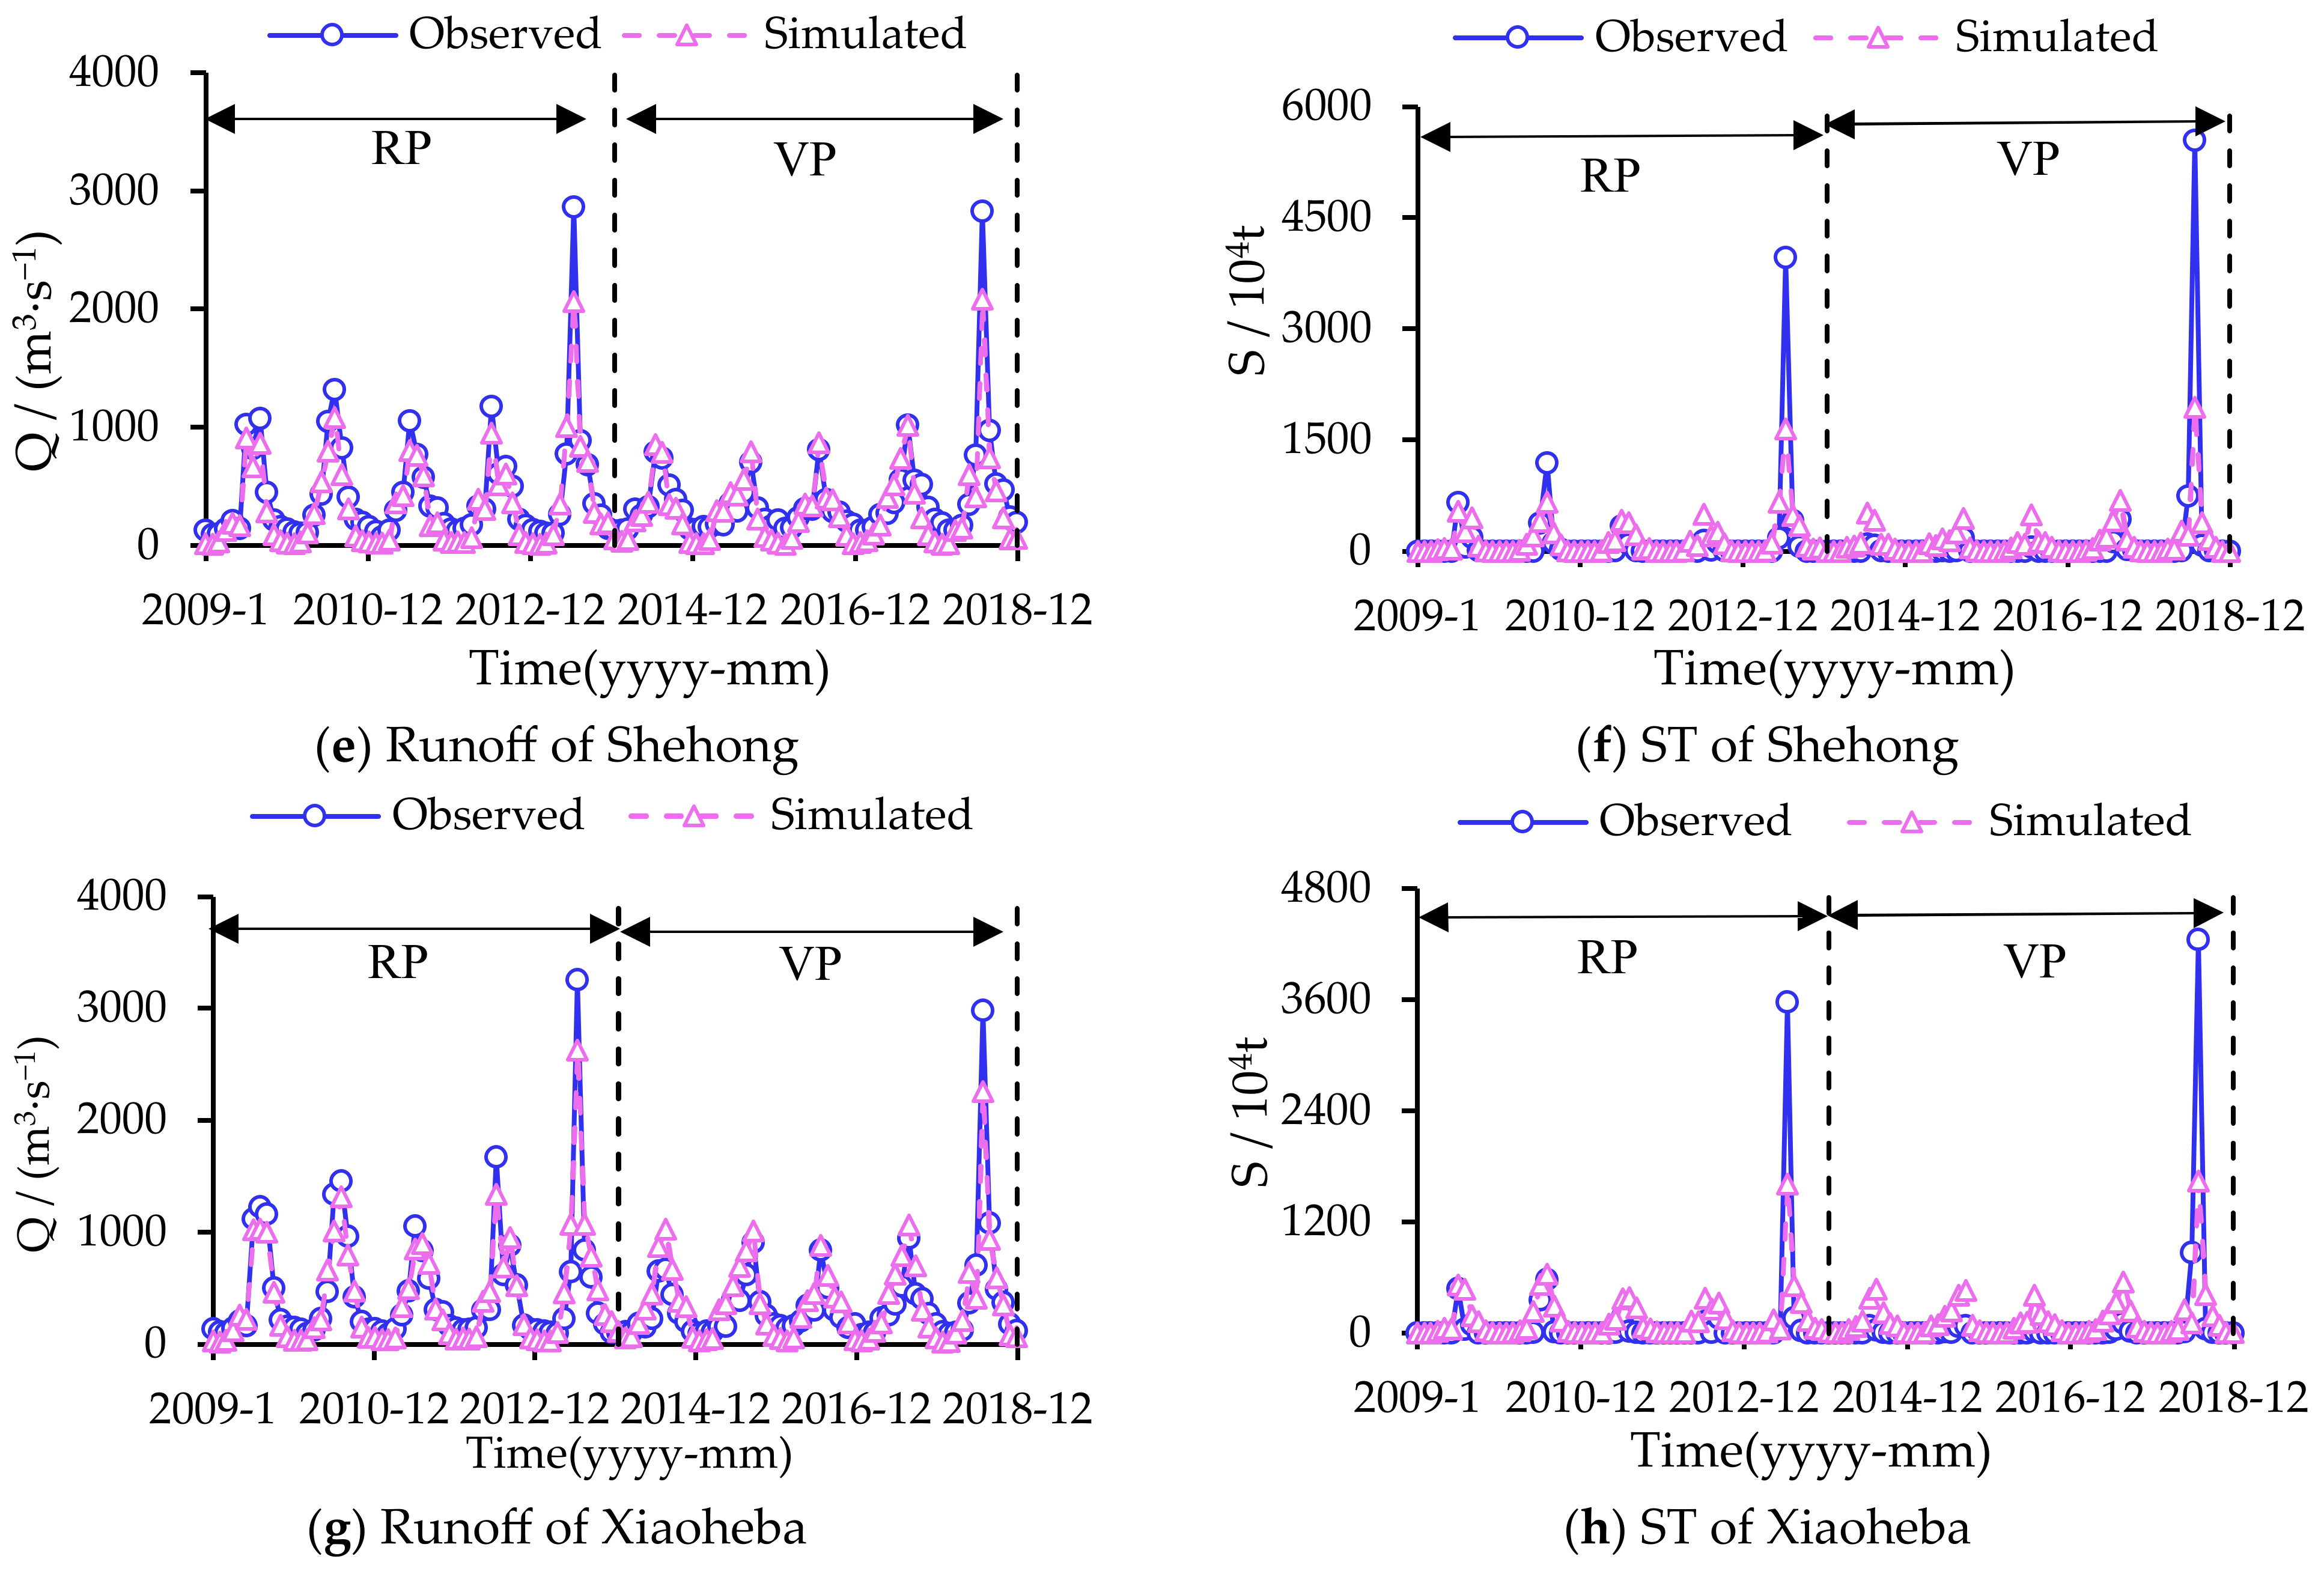
3.2.2. Simulation Results of Runoff and ST in the FRB

The monthly runoff and monthly ST in Santai, Jiangyou, Shehong, and Xiaoheba are shown in Figure 4. The variation trend of monthly runoff and ST at the four stations is basically consistent with the measured values. Specifically, it was found that the SWAT model has a small simulation result for the maximum value of the period (July 2013 and July 2018) and a large simulation result for the common general value.
The results of the monthly runoff and monthly ST of the four hydrological stations in RP and VP are shown in Table 5. For the runoff simulation results, the CD of each station is higher than 0.85, NSE is higher than 0.75, and PBIAS is less than ±25%. During VP, the CD of Jiangyou is 0.66, NSE is 0.58, and the CD and NSE of other three stations are higher than 0.85 and 0.75, respectively. For the simulation results of ST, the CD and NSE of each hydrological station are lower than those of the runoff simulation, but the results of CD, NSE and PBIAS are credible.
Combined with Table 1, this shows that the simulation results are credible. It is considered that the SWAT model has strong applicability in the basin, and the selected stations are evenly distributed, which reflects the hydrological process of the FRB.

3.3. Temporal and Spatial Variation Characteristics of the REP in the FRB

3.3.1. Time Variation Characteristics of the REP

Combined with the distribution of 143 sub-watersheds divided by the SWAT model and the actual distribution of each primary tributary in the basin (Table 6), the REP of the main stream and the primary tributary was obtained year by year (Figure 5). The REP of each section of the main stream of the basin is mostly a single change trend from upstream to downstream, showing a slow increase or slow decrease, while the REP of each primary tributary is larger than that of the main stream as a whole and the interannual difference is obvious. At the same time, it can be found that the change range of the REP of the primary tributary decreases with the increase in the catchment area.
The Pingtong River and the Anchang River in the first-level tributaries are located at the junction of high mountainous areas and low hilly areas in the middle and lower reaches of the basin. The abundant precipitation in the upper reaches has a faster runoff generation and confluence process under the action of mountainous terrain, which makes its REP significantly larger than other regions.

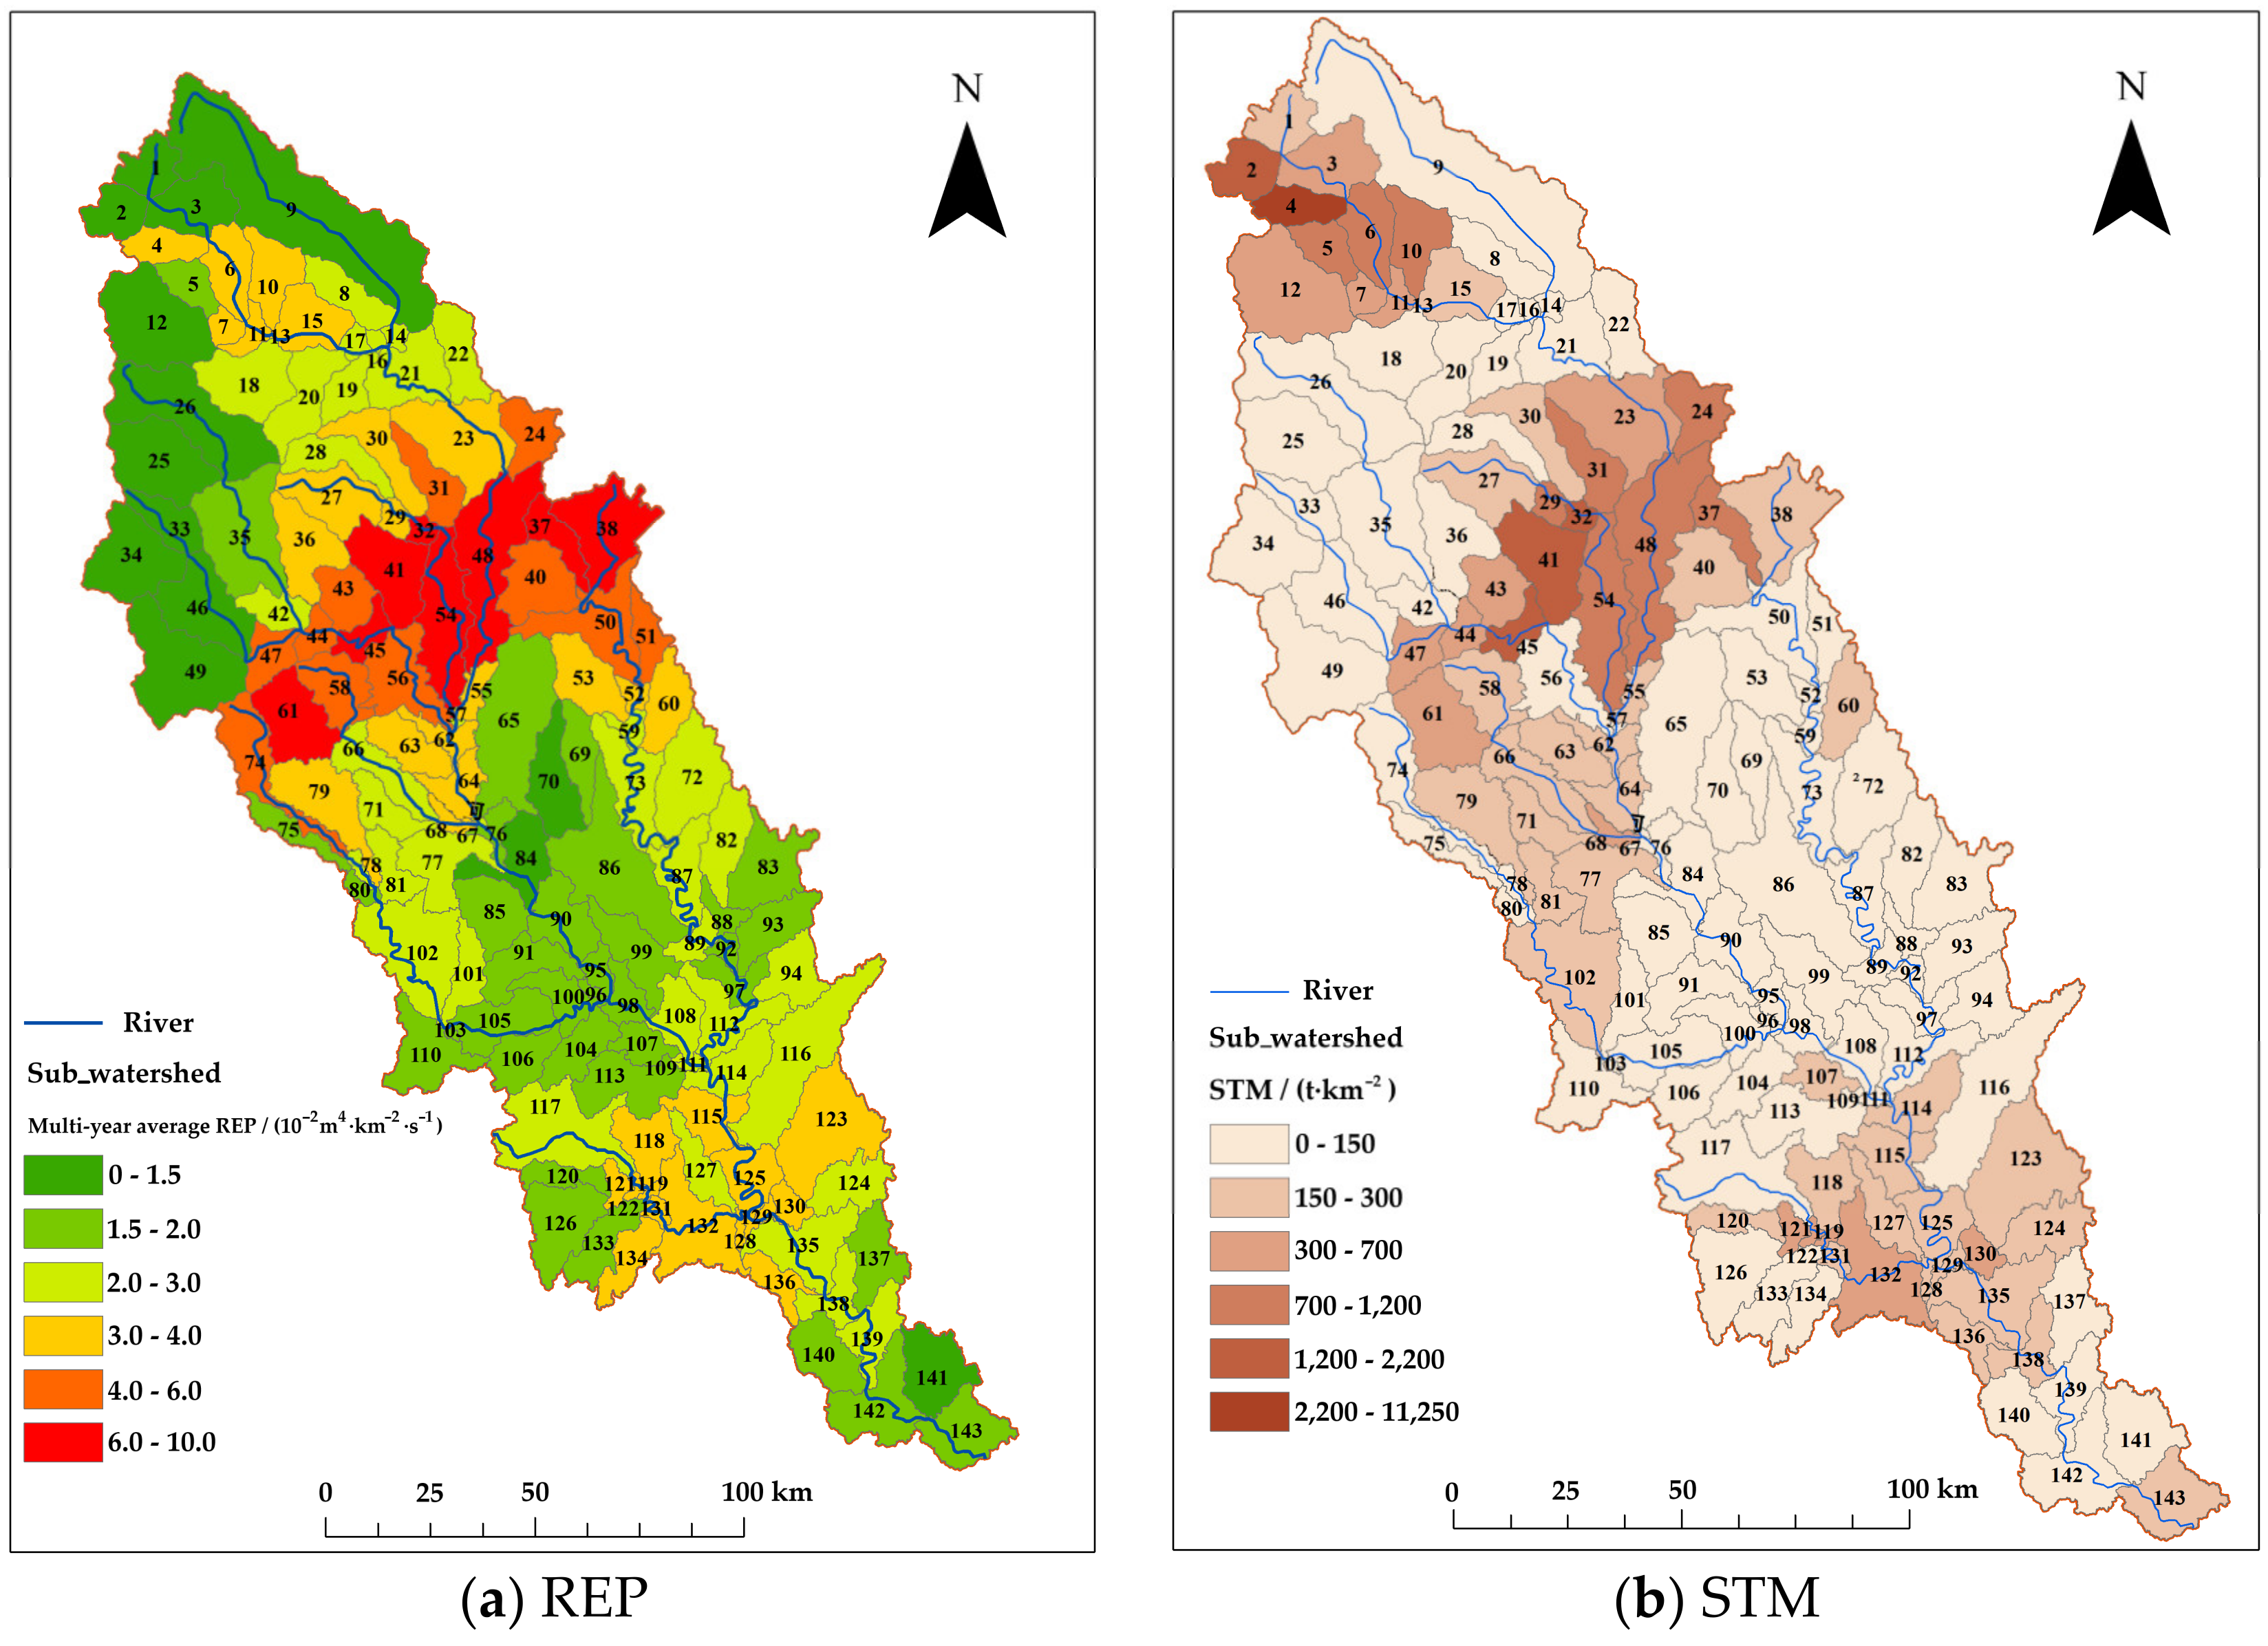
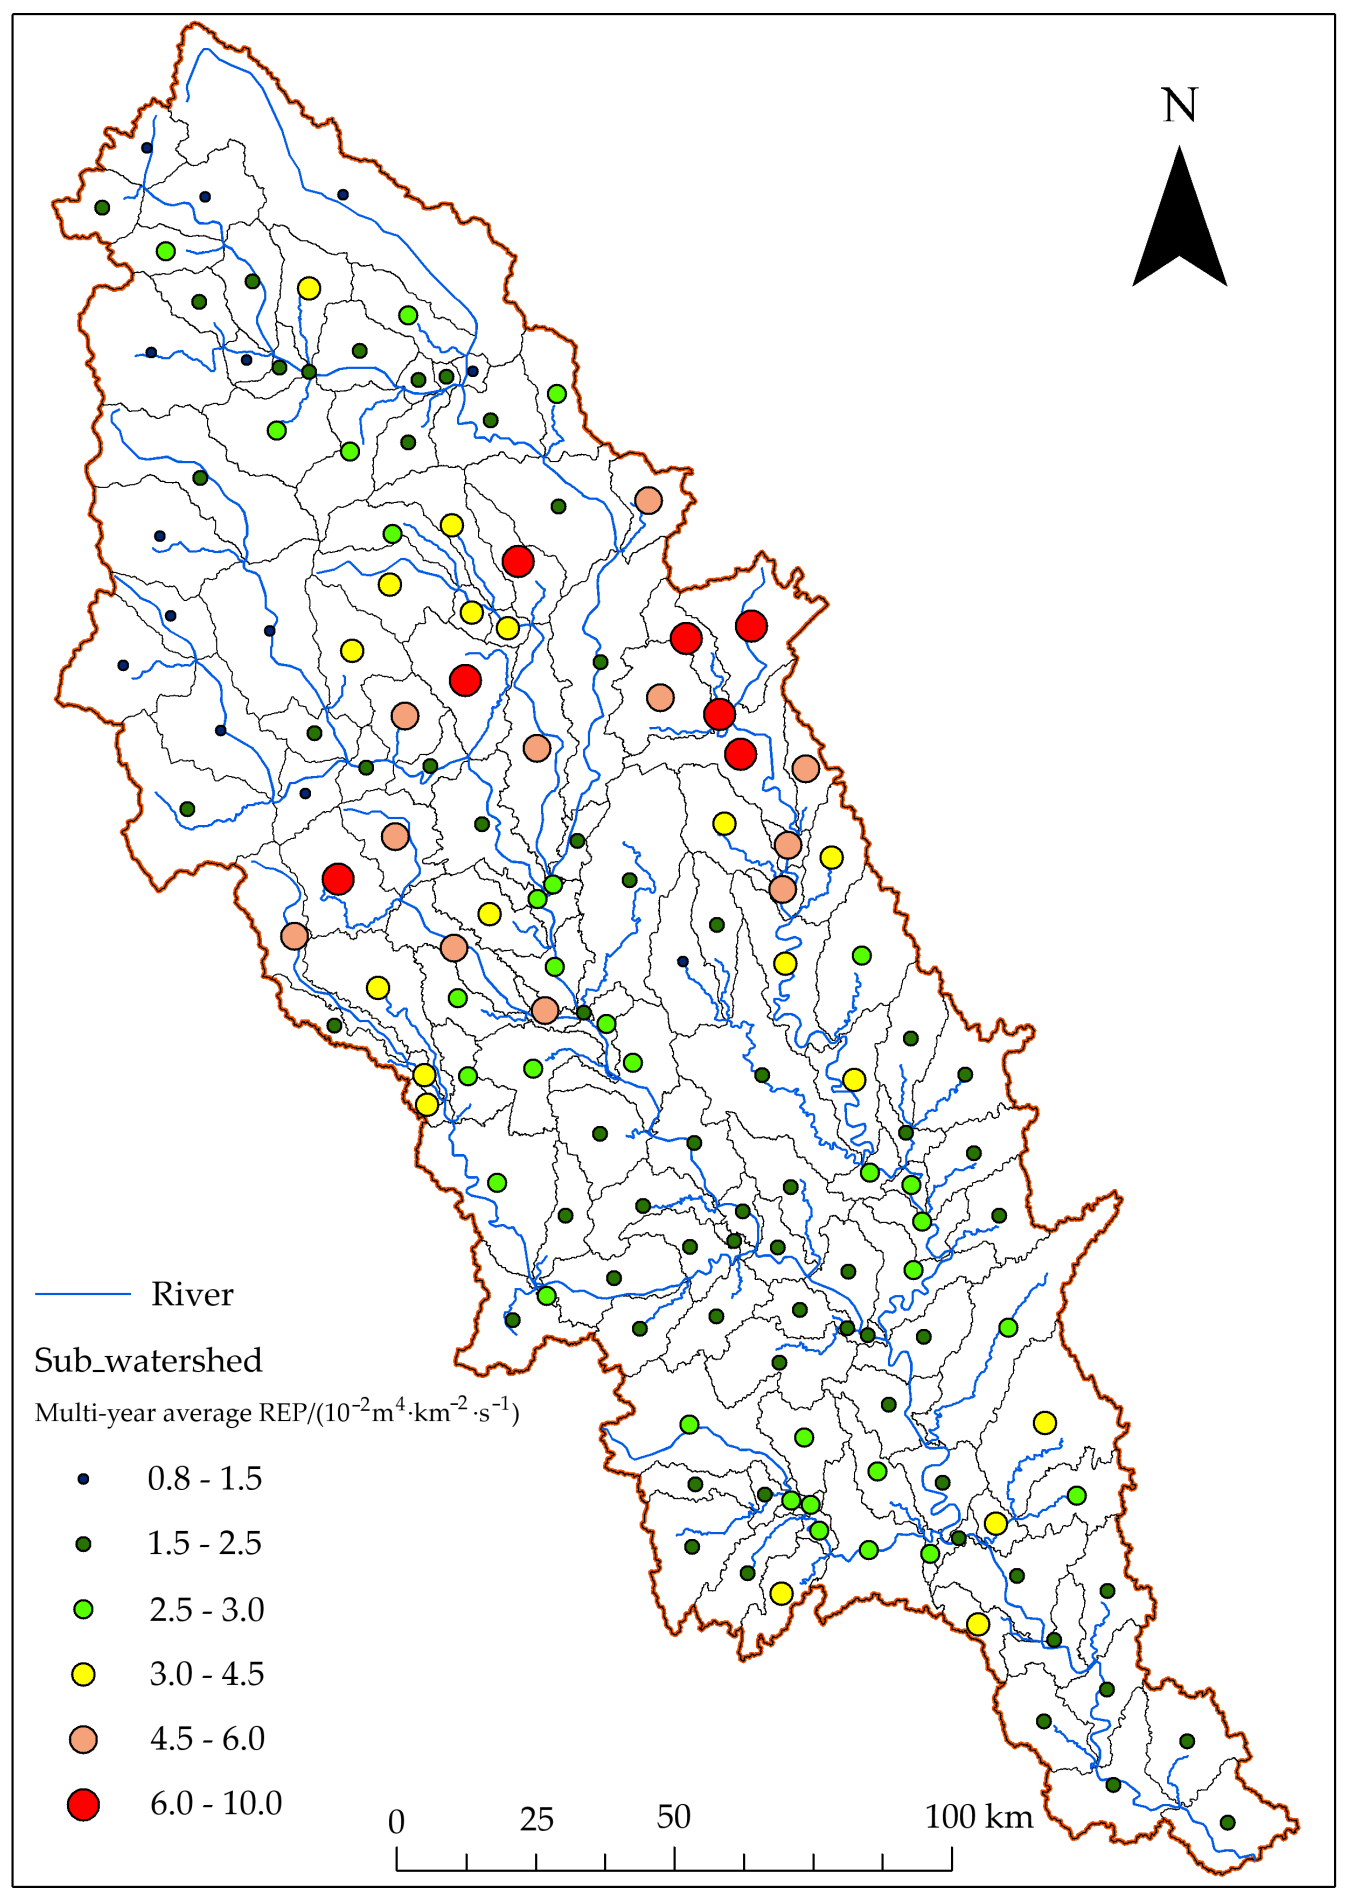
3.3.2. Spatial Distribution Characteristics of the REP

The REP characterizes the ability of runoff to carry sediment, and its spatial distribution can reflect the erosion distribution and erosion intensity in the basin. The spatial distribution of multi-year average REP and STM in 143 sub-watersheds of the basin from 2009 to 2018 are shown in Figure 6a,b, respectively.
The spatial distribution of multi-year average REP in the basin is similar to the STM. The erosion and sediment yield areas in the basin are mainly distributed in the junction area of the upper reaches of high mountains and the middle and lower reaches of low hills. The catchment area with multi-year average REP > median (26.0 mm·m3·s−1·km−2) in the sub-watershed of the FRB is 13,558 km2, accounting for 46.9% of the total area of the basin, and the junction area of the upper reaches of high mountains and the middle and lower reaches of low hills is the main erosion and sediment-production area. The multi-year average REP in this area is between 47.1~99.2 mm·m3·s−1·km−2.

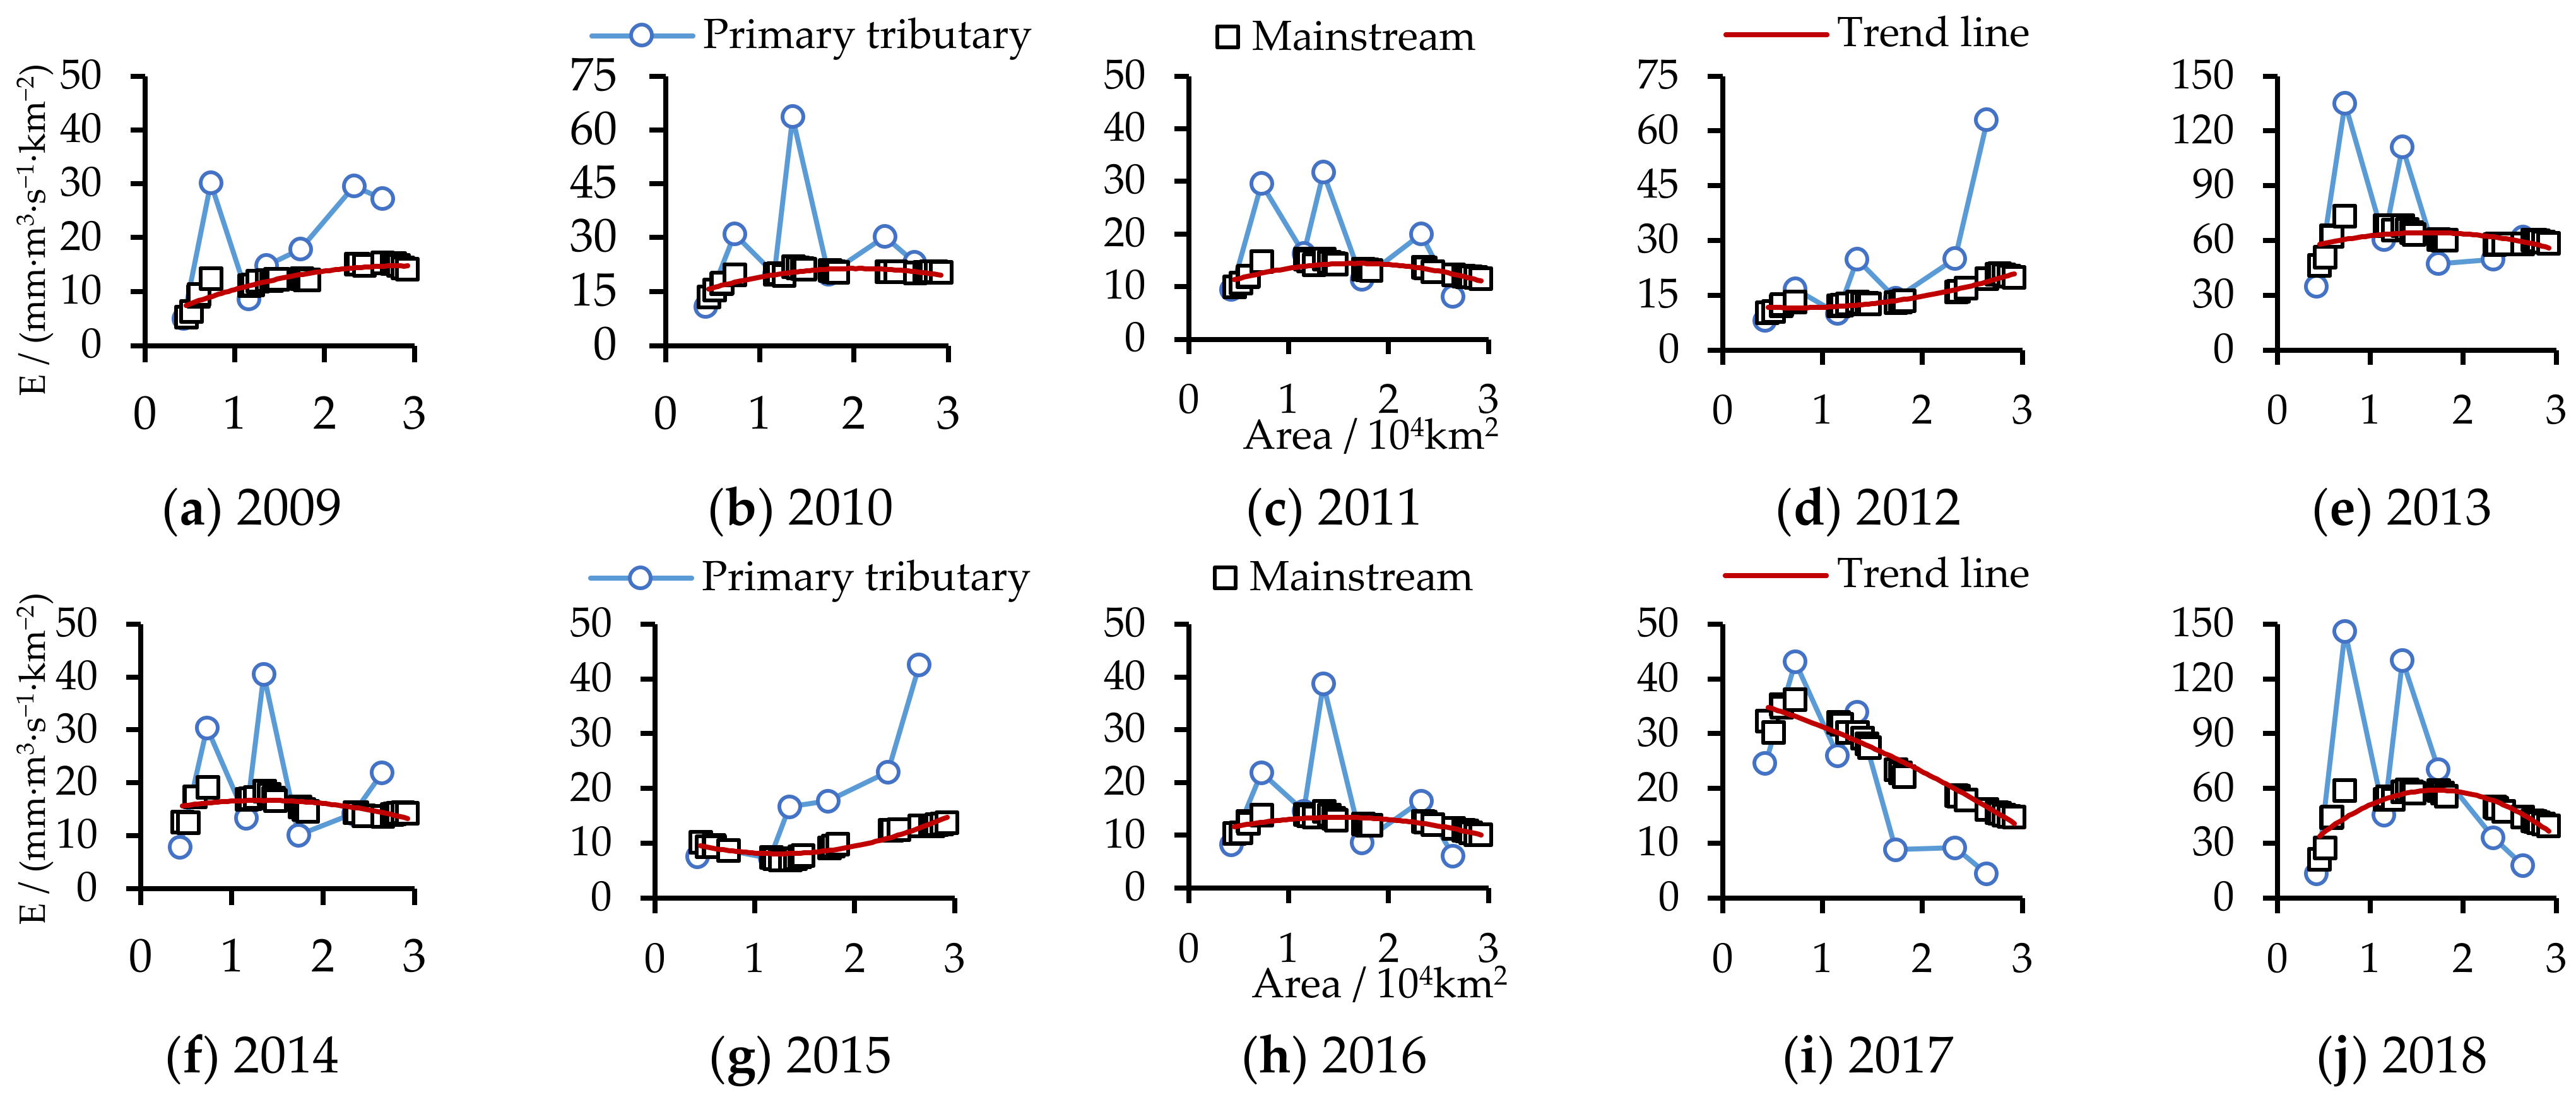
3.3.3. Scale Effect of the REP

The spatial distribution of multi-year average REP of 143 sub-watershed outlet sections and above control areas in the FRB is drawn, as shown in Figure 7. Combined with Figure 1 and Figure 7, it can be seen that the multi-year average REP of the outlet section and above the control area of each sub-watershed of the FRB generally shows the distribution characteristics of ‘large at the junction of the upper and middle reaches and small in the rest’. The control area above the section of 143 sub-watersheds and the corresponding multi-year average REP are plotted. As shown in Figure 8a, it can be seen that in the FRB, with the increase in the control area, the multi-year average REP has a decreasing trend. Specifically, with the watershed area of 7318 km2 as the dividing point, when the catchment area above the sub-watershed is less than 7318 km2, that is, in the upstream area of most mainstreams and tributaries, the multi-year average REP changes from the catchment area above the sub-watershed <500 km2. The range of [8.6,98.6] mm·m3·s−1·km−2 becomes 23.2 mm·m3·s−1·km−2 when the catchment area above the sub-watershed is 5970 km2, and its range of variation becomes smaller as the control watershed area becomes larger. When the catchment area above the sub-watershed is more than 7318 km2, the average annual REP change is single and obviously slow, and the average value is 23.8 mm·m3·s−1·km−2.
The outlet sections of the main stream and the first tributary in the basin are further selected, and the multi-year average REP of the catchment area above each outlet section from the upstream to the downstream is plotted, as shown in Figure 8b. Combining Figure 8b and Table 6, it can be seen that when the catchment area above the sub-watershed is 7318 km2, although Tongkouhe, Anchanghe, Kaijianghe, Zitonghe, and Qijianghe flow into FRB from upstream to downstream, their multi-year average runoff erosion power has no significant effect on the main stream.

4. Discussion

4.1. The Relationship between REP and Sediment Transport

The REP in this paper refers to the product of the flood peak modulus and the runoff depth of the total flood. It can be found that the definition of REP eliminates the impact of watershed area, which makes REP comparable between watersheds at different spatial scales, and also consistent with the concept of STM. In other words, REP and STM are the results and reflections of the combined effects of topography, ground composition, climate, vegetation coverage, and human activities on runoff and sediment in the basin. Meanwhile, not all of the basin is a serious soil erosion area, so this may cause the REP to decrease when the basin area becomes larger.
In fact, the development of a river is also a process of mutual restriction between water erosion and siltation, and in the long-term evolution, it reaches a dynamic balance between river sediment transport and river morphology [21]. This also shows that there is a significant correlation between REP and sediment transport, which can effectively characterize the erosion power of the water erosion process. It can also be considered that the area with relatively large REP in the basin we found that compared with the common expression of precipitation–runoff–sediment transport relationship [22], the relationship between REP and STM, which can comprehensively consider the flood intensity and magnitude and can effectively characterize the erosion energy of water erosion process, is obviously superior [8,23]. The power function relationship between sediment concentration or sediment transport rate and flow is the most common [24,25,26,27]. In this paper, the power function relationship between STM and REP is also relatively optimal, which is consistent with the results of Liu et al. on the sediment transport law of field floods in the Jialing River [12], and also shows that the REP in YRB have good applicability.
In addition, scientifically explaining the physical meaning of the parameters a and b in the power function of the best relationship between STM and REP is of great significance for explaining the water–sediment relationship. This study is also advancing related work. Combined with related research, such as sediment rating curve, this paper preliminarily believes that the potential influencing factors of coefficient a should come from the outside of the river, that is, the underlying surface of the basin, and that the potential influencing factors of index b should come from the change of hydraulic conditions in the river.

4.2. Simulation of Runoff and ST in Watershed Based on SWAT Model

Based on the SWAT model, this paper simulates the hydrological process of the FRB from 2009 to 2018. The results show that the evaluation indexes corresponding to runoff and sediment transport have reached the level of credibility and above. At the same time, it was found that runoff simulation is better than sediment simulation. In this paper, it can be seen that the simulated values of runoff in the extreme events of the basin are significantly smaller than the measured values, and the sediment transport is even worse. The simulated values of small and medium-sized runoff and sediment transport with higher frequency in the basin are larger than the measured values, which also exists in similar studies [28].
This shows that the SWAT model, as a concept-based semi-distributed model, still has certain limitations and defects in simulating the hydrological process of the basin, such as inaccurate parameters and lack of details. The SWAT model requires a large number of parameters to describe soil properties, vegetation characteristics, hydrological characteristics, etc. However, the estimation of these parameters usually depends on empirical formulas or statistical inferences, and is usually the average of the basin as a whole. This parameterization method may not fully consider the differences of different terrains, land use types, and soil properties in the basin, resulting in limited accuracy of the simulation results. In addition, the SWAT model simulates hydrological processes at the basin scale, and cannot capture details such as small-scale geomorphological features, land use changes, and local water resource management measures, which may lead to insufficient understanding of sediment production and transport processes, especially in basins with complex landforms and human activities [29,30].
Despite these limitations, the SWAT model is still a useful tool for preliminarily understanding watershed-scale runoff and sediment processes [31,32]. It should also be noted that in its specific application, it is necessary to combine the actual situation to reasonably explain and evaluate the model results.

4.3. Temporal and Spatial Distribution of REP

The existing research on the REP in the basin is mostly focused on the Yellow River Basin, and most of it provides a general description of the law. In order to study the variation characteristics of REP in other watersheds, this study analyzed the variation in REP along the course by subdividing the corresponding relationship between different sub-watersheds and the actual mainstream and tributaries of the FRB, and obtained the REP along the mainstream from top to bottom. The change trend is divided by a certain section, and the left side has a large difference and is susceptible to the influence of the first-order tributary, while the right side changes slowly and is difficult to be affected by the first-order tributary.
It should be noted that through the topographic map (Figure 1) and land use map (Figure 2b) of the FRB, it can be found that there is not a terrain transition zone at the junction of the upper and middle reaches described in this paper. That is to say, the high mountain area with an altitude of thousands of meters above the upper reaches stands like a high wall in the low mountain and hilly area with an altitude of 300 m to 500 m in the middle and lower reaches. With the change of altitude, grassland, shrub, and forest land are distributed in high mountainous areas, while paddy field and dry land are mostly distributed in low hilly areas. The area with higher REP in this study is located in the area where the junction of high mountain area and low mountain hilly area is biased towards low mountain hilly area. The upper reaches of the FRB are located in the transition zone between the Chengdu Plain and the Western Sichuan Plateau. The region belongs to the famous Longmen Mountain Rainstorm Area of the “Rainy Area of West China” [33,34]. The climate type is subtropical monsoon climate. In this area, the water vapor carried by the Western Pacific Subtropical High [35], the southwest low-level jet [36,37], and the southwest vortex [38] under the action of airflow encounters the Qionglai Mountains, the Daxiangling Mountains, the Xiaoxiangling Mountains, the Longmen Mountains, and the Qinba Mountains during its movement over the Sichuan Basin, and then the water vapor carried during the uplift process accelerates condensation due to the decrease in high-altitude temperature and forms high-frequency and high-intensity rainfall. The high-intensity and high-frequency heavy rainfall in the upper reaches of the FRB, coupled with strong rock weathering and frequent earthquakes in some areas, can easily induce geological disasters such as flash floods, mudslides, and landslides [39]. In addition, after crossing the Longmen Mountains, the FRB carried a large amount of debris material to accumulate in the front of the Longmen Mountains in the northwest of the Sichuan Basin to form a number of alluvial fans of varying sizes, which laid a good foundation for soil and water loss in the basin, and this also shows that the REP can better reflect the soil and water loss in the basin.
The heterogeneity and randomness of water and heat conditions in the basin lead to differences in soil erosion at different scales [40]. The temporal distribution of REP shows that the larger the area above the outlet section of the basin, the smaller the interannual variation in REP. In terms of spatial distribution, the REP shows the distribution characteristics of large upstream and small downstream and large tributary and small main stream. In this paper, it can be found that when the catchment area above the sub-watershed is >7318 km2, the change in multi-year average runoff erosion power is single and obviously slow. This is because more runoff in a river comes from the upstream area, that is, more precipitation in the basin occurs in the upstream area in the actual situation. Through the constraints of mountainous terrain, the flood water volume from different tributaries can be concentrated, the flow velocity becomes larger, and the erosion damage becomes stronger. When these floods march along the main stream to the middle and lower reaches, they are affected by factors such as slower river gradient and larger water cross-section, resulting in a decrease in water speed and a decrease in sediment carrying capacity.

5. Conclusions

In this paper, the FRB in the Upper Yangtze River was selected as the research area. Combined with the concept of the REP, different expressions of water–sediment relationship in the basin are compared and analyzed. Based on the SWAT model, the spatial and temporal variation characteristics of REP and its scale effect are analyzed. The main conclusions are as follows:
(1)
Formula (9) (power function expression relationship between REP and STM) is used to simulate ST in the basin. The evaluation indexes of R2, NSE and PBIAS in RP and VP meet R2 > 0.6, NSE > 0.5, PBIAS ≤ ±25%, respectively. Formula (9) is better than the other five kinds of water–sediment relationship at four hydrological stations, including Santai, Jiangyou, Shehong, and Xiaoheba from 2009 to 2018.
(2)
Based on the SWAT model, the evaluation index ratings of the monthly runoff and ST of the four hydrological stations in the basin are credible, good, and excellent in RP and VP. It shows that the runoff and ST simulated by the SWAT model are more applicable in the basin.
(3)
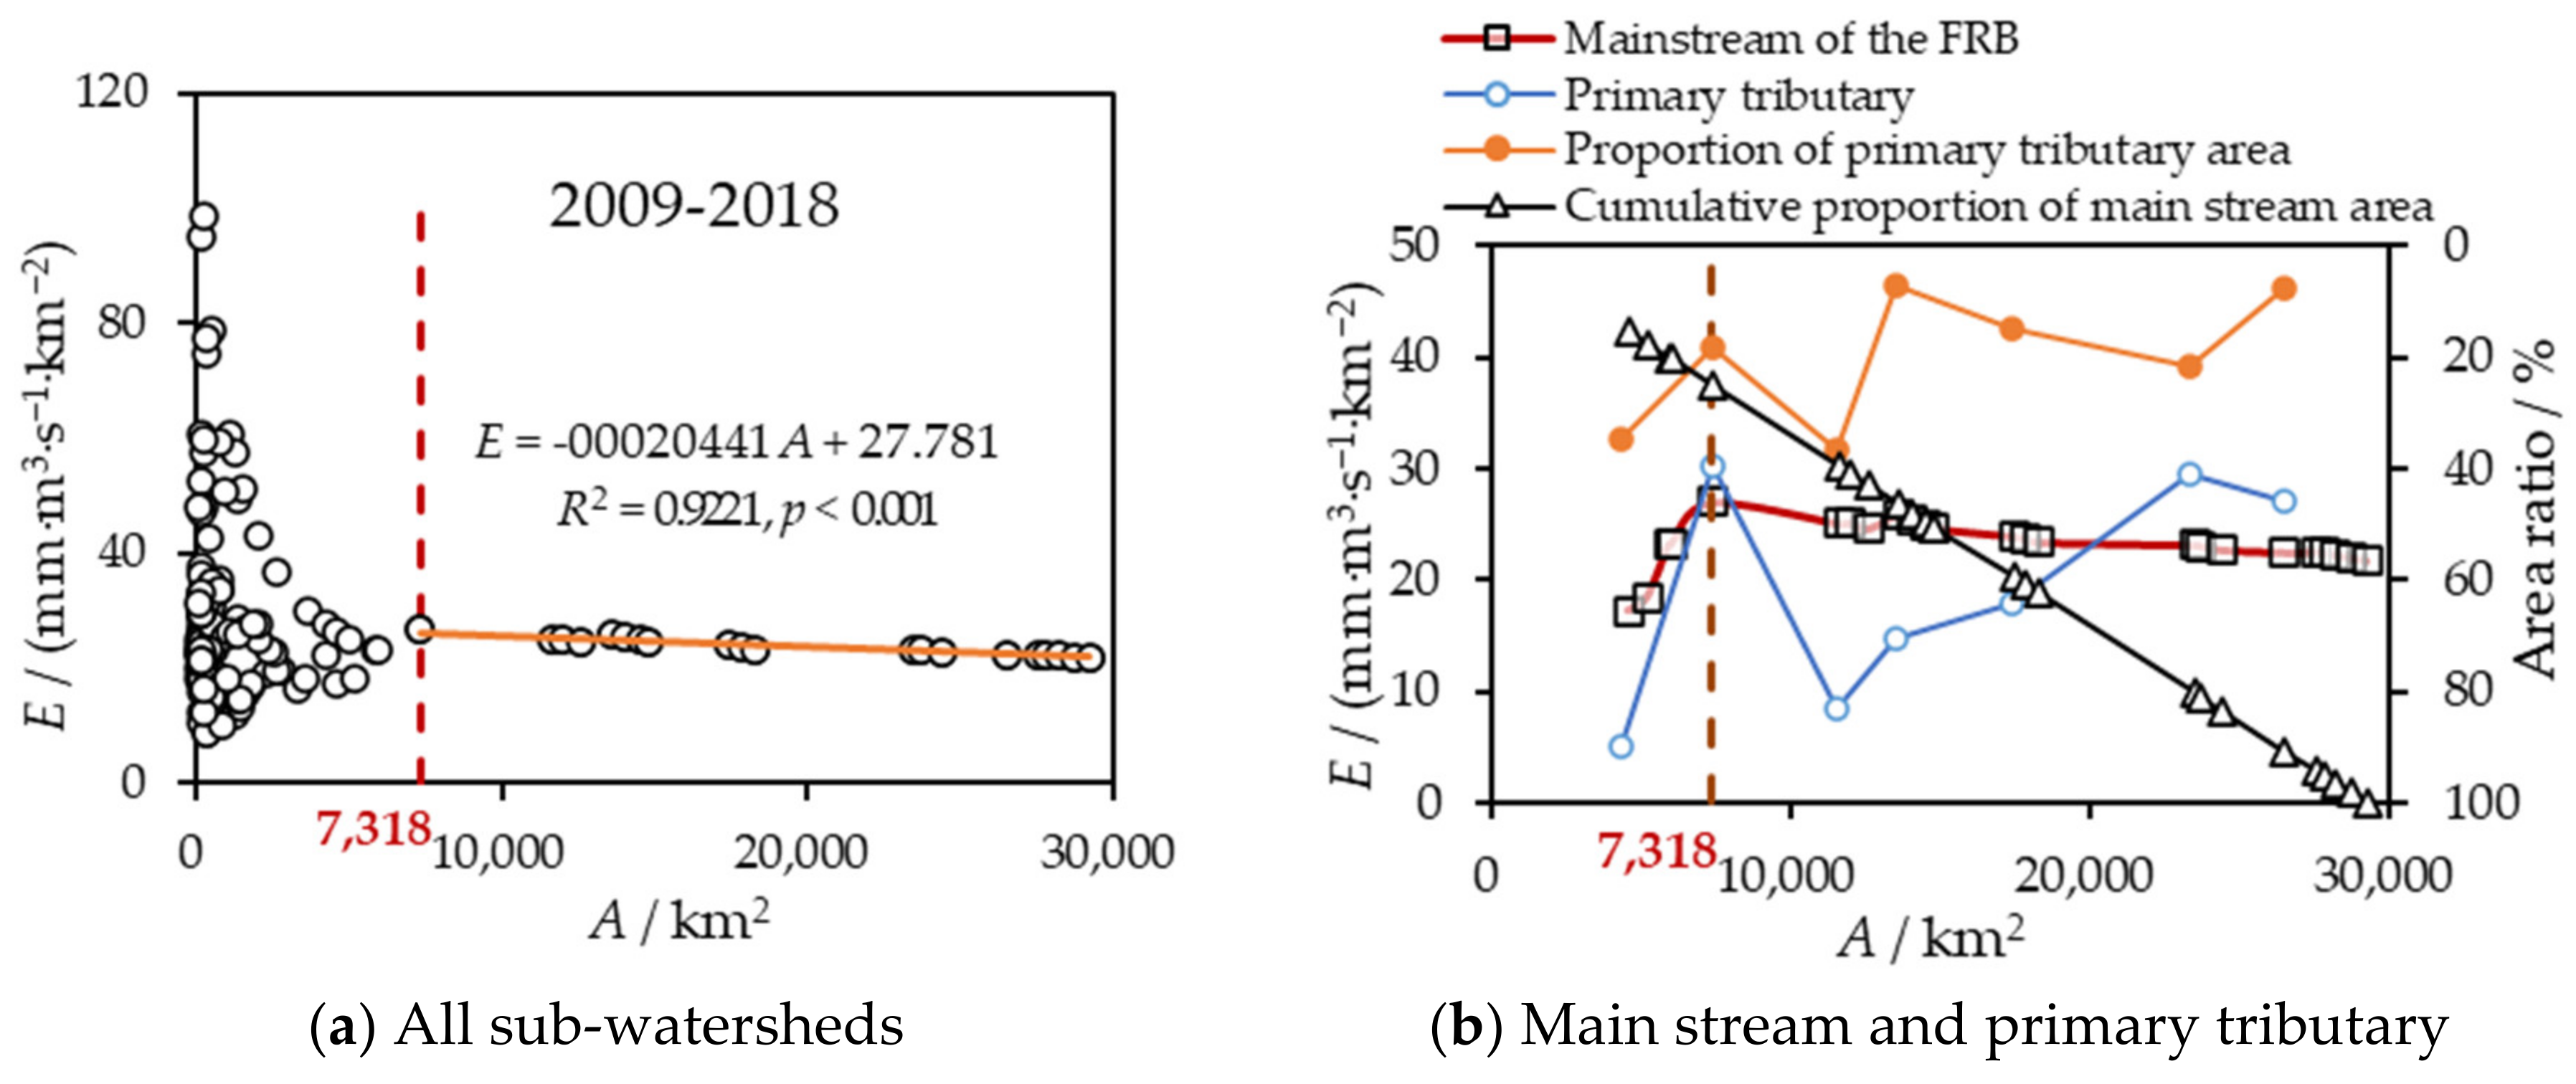
The annual REP of the main stream is mostly a single change trend from upstream to downstream, while the REP of each primary tributary is larger than that of the main stream and the interannual difference is obvious. From the perspective of multi-year average scale, REP and STM of 143 sub-watersheds in the FRB are similar in spatial distribution, and the areas with larger values are concentrated in the junction area of the upper reaches of high mountains and the middle and lower reaches of low hills. With the increase in catchment area, the multi-year average REP has a decreasing trend. In particular, when the catchment area is greater than 7318 km2, the REP is single and obviously slows down, with an average value of 23.8 mm·m3·s−1·km−2. It can be found that the average annual REP of the primary tributary has no significant effect on the main stream.

Author Contributions

Conceptualization, K.J. and Z.L.; methodology, K.J.; formal analysis, K.J.; data curation, K.J.; supervision, S.M. and K.Y.; project administration, S.M.; writing—original draft preparation, K.J.; writing—review and editing, K.J. and P.L. All authors have read and agreed to the published version of the manuscript.

Funding

This research was supported by the National Natural Science Foundation of China (Grant No. U2040208, 52179024).

Institutional Review Board Statement

Not applicable.

Informed Consent Statement

Not applicable.

Data Availability Statement

The data presented in this study are available on request from the corresponding author.

Conflicts of Interest

The authors declare no conflict of interest.

References

  1. Turner, B.L.; Lambin, E.F.; Reenberg, A. The emergence of land change science for global environmental change and sustainability. Proc. Natl. Acad. Sci. USA 2007, 104, 20666–20671. [Google Scholar] [CrossRef]
  2. Luca, M.; Jon, P.D.; Neil, M.K.; Mohamed, B.; Victor, C.; Isaurinda, B.; Tekalign, M.; Matrin, Y.; Mikha, S.A.; Kazuyuki, Y. World’s soils are under threat. Soil 2016, 2, 79–82. [Google Scholar] [CrossRef]
  3. Zhang, Y.T.; Tian, P.; Yang, L.; Zhao, G.J.; Mu, X.M.; Wang, B.; Du, P.F.; Gao, P.; Sun, W.Y. Relationship between sediment load and climate extremes in the major Chinese rivers. J. Hydrol. 2023, 617, 128962. [Google Scholar] [CrossRef]
  4. Li, L.; Ni, J.R.; Chang, F.; Yue, Y.; Frolova, N.; Magritsky, D.; Borthwick, A.G.L.; Ciais, P.; Wang, Y.C.; Zheng, C.M.; et al. Global trends in water and sediment fluxes of the world’s large rivers. Sci. Bull. 2020, 65, 62–69. [Google Scholar] [CrossRef]
  5. Peng, T.; Tian, H.; Singh, V.P.; Chen, M.; Liu, J.; Ma, H.B.; Wang, J.B. Quantitative assessment of drivers of sediment load reduction in the Yangtze River basin, China. J. Hydrol. 2020, 580, 124242. [Google Scholar] [CrossRef]
  6. Li, Z.B.; Lu, K.X.; Ding, W.F. Study on the dynamic process of rill erosion of loess slope surface. Int. J. Soil Water Conserv. 2002, 16, 5–7, (In Chinese with English abstract). [Google Scholar]
  7. Lu, K.X. Study on Runoff-Sediment Response Simulation in Watershed Eco-Enviromental Rehabilitation on Loess Plateau. Ph.D. Thesis, Xi’an University of Technology, Xi’an, China, 2006. (In Chinese with English abstract). [Google Scholar]
  8. Wang, L.L.; Yao, W.Y.; Tang, J.L.; Wang, W.L.; Hou, X.X. Identifying the driving factors of sediment delivery ratio on individual flood events in a long-term monitoring headwater basin. J. Mt. Sci. 2018, 15, 1825–1835. [Google Scholar] [CrossRef]
  9. Liu, S.W.; Wang, D.Y.; Miao, W.; Wang, Z.L.; Zhang, P.; Li, D.X. Characteristics of runoff and sediment load during flood events in the Upper Yangtze River, China. J. Hydrol. 2023, 620, 129433. [Google Scholar] [CrossRef]
  10. Wang, N.; Yao, Z.H.; Liu, W.Q.; Lv, X.Z.; Ma, M.D. Spatial Variabilities of Runoff Erosion and Different Underlying Surfaces in the Xihe River Basin. Water 2019, 11, 352. [Google Scholar] [CrossRef]
  11. Yang, G.; Lu, K.X.; Li, P.; Liu, H.L.; Liu, G.H.; Cao, F.H.; Ma, T.W.; Wang, D.J.; Wen, M.X.; Sun, J.M. Spatial Distribution of Annual Runoff Erosion Power in Qingshuihe River Basin Based on SWAT Model. Res. Soil Water Conserv. 2022, 29, 90–96+103, (In Chinese with English abstract). [Google Scholar]
  12. Liu, S.W.; Zhang, P.; Miao, W.; Wang, Z.L.; Li, D.X. Study on sediment transport law of flood event in different areas of the Jialingjiang River basin. Adv. Water Sci. 2022, 33, 38–47, (In Chinese with English abstract). [Google Scholar]
  13. Guo, K.; Niu, X.; Wang, B. A GIS-based study on the layout of the ecological monitoring system of the grain for Green Project in China. Forests 2022, 14, 70. [Google Scholar] [CrossRef]
  14. Pan, X.J.; Huang, C.F.; Pu, C.Y. Comprehensive disposal plan design & polymerization disaster risk assessment based on information diffusion technology in Fujiang River basin in Sichuan. Environ. Res. 2020, 188, 109744. [Google Scholar] [CrossRef] [PubMed]
  15. Zhou, Y.J.; Li, D.F.; Lu, J.Y.; Yao, S.M.; Yan, X.; Jin, Z.W.; Liu, L.; Lu, X.X. Distinguishing the Multiple Controls on the Decreased Sediment Flux in the Jialing River Basin of the Yangtze River, Southwestern China. Catena 2020, 193, 104593. [Google Scholar] [CrossRef]
  16. Shen, Z.Y.; Hong, Q.; Chu, Z.; Gong, Y.W. A framework for priority non-point source area identification and load estimation integrated with Appi and PLOAD model in Fujiang watershed, China. Agric. Water Manag. 2011, 98, 977–989. [Google Scholar] [CrossRef]
  17. Zhang, X.M.; Du, H.M.; Wang, Y.; Chen, Y.; Ma, L.; Dong, T.X. Watershed landscape ecological risk assessment and landscape pattern optimization: Take Fujiang river basin as an example. Hum. Ecol. Risk Assess. Int. J. 2021, 27, 2254–2276. [Google Scholar] [CrossRef]
  18. Gong, J.F.; Li, Z.B.; Li, P.; Ren, Z.P.; Sun, Q. Spatial distribution of runoff erosion power based on swat model in yanhe river basin. Trans. Chin. Soc. Agric. Eng. 2017, 33, 120–126, (In Chinese with English abstract). [Google Scholar]
  19. Arnold, J.G.; Srinivasan, R.; Muttiah, R.S.; Williams, J.R. Lager area hydrologic modeling and assessment part I: Modeling development. J. Am. Water Resour. Assoc. 1998, 34, 73–89. [Google Scholar] [CrossRef]
  20. Nash, J.E.; Sutcliffe, J.V. River flow forecasting through conceptual models part I—A discussion of Principles. J. Hydrol. 1970, 10, 282–290. [Google Scholar] [CrossRef]
  21. Lai, X.H.; Hou, Y.B.; Jia, J.P.; Chen, C.; Su, Y.; Jiang, J.; Chen, J.; Li, M.T.; Liu, Y. Rapid change of erosion-deposition evolution in the Minjiang Estuary, Southeast China. Ocean Coast. Manag. 2023, 238, 106574. [Google Scholar] [CrossRef]
  22. Han, J.Q.; Gao, J.E.; Han, L. Changes and implications of the relationship between rainfall, runoff and sediment load in the Wuding River basin on the Chinese Loess Plateau. Catena 2019, 175, 228–235. [Google Scholar] [CrossRef]
  23. Zhang, L.T.; Li, Z.B.; Wang, H.; Xiao, J.B. Influence of intra-event-based flood regime on sediment flow behavior from a typical agro-catchment of the Chinese Loess Plateau. J. Hydrol. 2016, 538, 71–81. [Google Scholar] [CrossRef]
  24. Müller, G.; Förstner, U. General relationship between suspended sediment concentration and water discharge in the alpenrhein and some other rivers. Nature 1968, 217, 244–245. [Google Scholar] [CrossRef]
  25. Asselman, N.E.M. Fitting and interpretation of sediment rating curves. J. Hydrol. 2000, 234, 228–248. [Google Scholar] [CrossRef]
  26. Syvitski, J.P.; Morehead, M.D.; Bahr, D.B.; Mulder, T. Estimating fluvial sediment transport: The rating parameters. Water Resour. Res. 2000, 36, 2747–2760. [Google Scholar] [CrossRef]
  27. Wu, C.S.; Ji, C.C.; Shi, B.W.; Wang, Y.P.; Gao, J.H.; Yang, Y.; Mu, J.B. The impact of climate change and human activities on streamflow and sediment load in the Pearl River Basin. Int. J. Sediment Res. 2019, 34, 307–321. [Google Scholar] [CrossRef]
  28. Melaku, N.D.; Renschler, C.S.; Holzmann, H.; Strohmeier, S.; Bayu, W.; Zucca, C.; Ziadat, F.; Klik, A. Prediction of soil and water conservation structure impacts on runoff and erosion processes using SWAT model in the northern Ethiopian Highlands. J. Soils Sediments 2017, 18, 1743–1755. [Google Scholar] [CrossRef]
  29. Wang, Q.R.; Liu, R.M.; Men, C.; Guo, L.J.; Miao, Y.X. Effects of dynamic land use inputs on improvement of SWAT model performance and uncertainty analysis of outputs. J. Hydrol. 2018, 563, 874–886. [Google Scholar] [CrossRef]
  30. Wang, Q.R.; Liu, R.M.; Jiao, L.J.; Li, L.; Wang, Y.F.; Cao, L.P. Significance of using dynamic land-use data and its threshold in hydrology and water quality simulation models. Environ. Monit. Assess. 2022, 194, 108. [Google Scholar] [CrossRef] [PubMed]
  31. dos Santos, F.M.; de Souza Pelinson, N.; de Oliveira, R.P.; Di Lollo, J.A. Using the SWAT model to identify erosion prone areas and to estimate soil loss and sediment transport in Mogi Guaçu River basin in Sao Paulo State, Brazil. Catena 2023, 222, 106872. [Google Scholar] [CrossRef]
  32. Gashaw, T.; Dile, Y.T.; Worqlul, A.W.; Bantider, A.; Zeleke, G.; Bewket, W.; Alamirew, T. Evaluating the effectiveness of best management practices on soil erosion reduction using the SWAT model: For the case of Gumara watershed, Abbay (Upper Blue Nile) basin. Environ. Manag. 2021, 68, 240–261. [Google Scholar] [CrossRef] [PubMed]
  33. Chen, Y.R.; Li, Y.Q. Convective characteristics and formation conditions in an extreme rainstorm on the eastern edge of the Tibetan Plateau. Atmosphere 2021, 12, 381. [Google Scholar] [CrossRef]
  34. Zhu, Z.W.; Lu, R.; Yan, H.P.; Li, W.K.; Li, T.; He, J.H. Dynamic origin of the interannual variability of West China Autumn Rainfall. J. Clim. 2022, 33, 9643–9652. [Google Scholar] [CrossRef]
  35. Xie, Q.X.; Gu, X.P.; Li, G.; Tang, T.R.; Li, Z.Y. Variation characteristics of rainstorms and floods in southwest China and their relationships with atmospheric circulation in the summer half-year. Atmosphere 2022, 13, 2103. [Google Scholar] [CrossRef]
  36. Liu, X.Y.; Chen, G.X.; Zhang, S.J.; Du, Y. Formation of Low-Level Jets over Southern China in the Mei-yu Season. Adv. Atmos. Sci. 2023, 40, 1731–1748. [Google Scholar] [CrossRef]
  37. Wu, A.N.; Li, G.P. Roles of the topographically-affected boundary layer low-level jet in the moisture transport process of nocturnal rainstorms in mountainous areas around the western Sichuan basin. Atmosphere 2022, 14, 84. [Google Scholar] [CrossRef]
  38. Mai, Z.; Fu, S.M.; Sun, J.H.; Hu, L.; Wang, X.M. Key statistical characteristics of the mesoscale convective systems generated over the Tibetan Plateau and their relationship to precipitation and southwest vortices. Int. J. Climatol. 2021, 41, E875–E896. [Google Scholar] [CrossRef]
  39. Jin, W.; Cui, P.; Zhang, G.T.; Wang, J.; Zhang, Y.X.; Zhang, P. Evaluating the post-earthquake landslides sediment supply capacity for debris flows. Catena 2023, 220, 106649. [Google Scholar] [CrossRef]
  40. Gao, G.Y.; Fu, B.J.; Zhang, J.J.; Ma, Y.; Sivapalan, M. Multiscale temporal variability of flow-sediment relationships during the 1950s–2014 in the Loess Plateau, China. J. Hydrol. 2018, 563, 609–619. [Google Scholar] [CrossRef]
Figure 1. Location of the study area.
Sustainability 15 15642 g001
Figure 2. Construction of SWAT model.
Sustainability 15 15642 g002
Figure 3. Changes of runoff and ST in main hydrological stations in the FRB.
Sustainability 15 15642 g003
Figure 4. Comparison of observed and simulated values of runoff and ST at each hydrological station.
Sustainability 15 15642 g004aSustainability 15 15642 g004b
Figure 5. The REP of the main stream and the first tributary in the basin changes year by year along the way. Note: The corresponding abscissa area value of the first-order tributaries in the diagram is the catchment area above the confluence point after the first-order tributaries from the upstream to the downstream flow into the main stream.
Sustainability 15 15642 g005
Figure 6. The spatial distribution of multi-year average REP and STM in 143 sub-watersheds in the FRB.
Sustainability 15 15642 g006
Figure 7. The spatial distribution of multi-year average REP of the catchment area above the outlet section of 143 sub-watersheds in the FRB.
Sustainability 15 15642 g007
Figure 8. The multi-year average REP of main stream and first tributary changes along the way. Note: The corresponding abscissa area value of the first-order tributaries in the diagram is the catchment area above the confluence point after the first-order tributaries from the upstream to the downstream flow into the main stream of FRB.
Sustainability 15 15642 g008
Table 1. Final performance evaluation for recommended statistical performance measure for SWAT model.
Rating of ResultsR2NSPbias
RunoffSediment
ExcellentR2 > 0.850.75 < NS ≤ 1Pbias < ±10%Pbias < ±15%
Good0.75 < R2 ≤ 0.850.65 < NS ≤ 0.75±10% ≤ Pbias < ±15%±15% ≤ Pbias < ±30%
Credible0.5 < R2 ≤ 0.750.5 < NS ≤ 0.65±15% ≤ Pbias < ±25%±30% ≤ Pbias < ±55%
Not credible0 ≤ R2 ≤ 0.5NS ≤ 0.5Pbias ≥ ±25%Pbias ≥ ±55%
Table 2. The proportion of measured runoff and ST in each hydrological station to Xiaoheba station (%).
Hydrological ElementsProportion of Measured RunoffProportion of Measured ST
SantaiJiangyouShehongXiaohebaSantaiJiangyouShehongXiaoheba
Catchment area/km22343591523,54528,9012343591523,54528,901
8.120.581.5100.08.120.581.5100.0
Annual20099.722.887.6100.06.744.8150.1100.0
20107.926.191.2100.09.040.2183.3100.0
20117.428.3101.1100.013.266.0228.9100.0
20128.224.689.1100.020.44.7107.1100.0
201310.426.0102.3100.06.122.7122.2100.0
20149.836.6129.6100.025.539.1161.6100.0
20158.524.289.0100.07.57.9124.0100.0
20167.530.4100.7100.035.5319.0315.6100.0
20178.133.8115.8100.013.7231.7342.3100.0
20189.428.1103.8100.03.325.9124.2100.0
Period2009–20138.725.694.3100.011.135.7158.3100.0
2014–20188.730.6107.8100.017.1124.7213.5100.0
2009–20188.728.1101.0100.014.180.2185.9100.0
Table 3. Summary of statistical characteristics of water–sediment relationships.
PeriodsParametersHydrological
Stations
Water–Sediment Relationships
(4)(5)(6)(7)(8)(9)
RPslopeSantai21.422.149.382.602.600.98
Jiangyou52.035.2017.576.446.441.63
Shehong71.057.1024.935.705.701.57
Xiaoheba64.826.4824.117.517.511.78
interceptSantai−180.54−770.54−14.16−2.30−10.612.21
Jiangyou−1563.49−2643.27−129.68−17.94−35.63−0.02
Shehong−7969.50−3384.80−288.21−20.96−30.060.57
Xiaoheba−8093.83−2800.54−345.37−30.68−41.06−0.41
R2Santai0.800.800.930.750.750.80
Jiangyou0.800.800.880.370.370.39
Shehong0.980.980.950.830.830.75
Xiaoheba0.810.810.950.920.920.80
p-valueSantai0.070.400.07<0.010.16<0.01
Jiangyou0.080.850.070.050.34<0.05
Shehong0.100.740.09<0.010.61<0.01
Xiaoheba0.160.720.14<0.050.18<0.01
VPR2Santai0.980.980.960.900.900.74
Jiangyou0.940.940.990.880.880.95
Shehong0.920.921.000.900.900.92
Xiaoheba0.970.971.000.850.850.84
NSSantai0.780.780.660.870.870.57
Jiangyou0.780.780.860.820.820.91
Shehong0.750.750.92−19.000.890.88
Xiaoheba−0.03−0.030.810.830.430.83
PbiasSantai−43.6−43.641.73.72.68.4
Jiangyou−52.1−52.1−25.4−7.7−7.0−4.2
Shehong−68.1−68.1−23.3107.0−0.43.4
Xiaoheba−176.7−176.7−62.84.7−23.3−2.7
Table 4. Results of calibration of sensitive parameters in the FRB.
TypeRankParameterDefinitionMethodValue
Runoff-related
parameters
1SOL_BDSoil wet bulk densityV2.062
2SOL_ZSoil depthR−0.137
3REVAPMNEnsure the depth of shallow groundwater
where re-evaporation occurs
V48.497
4GWQMNThreshold depth of water in the shallow
aquifer required for return flow to occur
V4648.452
5ALPHA_BFBaseflow alpha factorV0.338
6ESCOSoil evaporation compensation factorV0.745
7SURLAGSurface runoff lag coefficientV15.23
8SOL_AWCAvailable soil moistureR−0.456
9SMFMXMaximum snowmelt rateV11.193
10RCHRG_DPGroundwater infiltration coefficientV0.729
11SMFMNThe minimum snowmelt rateV4.728
12CH_N2Main channel Manning coefficientV0.054
13GW_REVAPGroundwater reevaporation coefficientV0.112
14SOL_ALBMoist soil albedoV0.075
15GW_DELAYThe delay timeV20.065
16EPCOPlant absorption compensation factorV0.558
17CANMXMaximum canopy storageV1.159
18CH_K2Effective hydraulic conductivity of main streamV232.577
19CN2Initial SCS runoff curve number for moisture conditionR−0.342
Sediment-related
parameters
1CH_Cov1River coverage factorV0.329
2SPEXPThe exponential parameter characterizing the
maximum concentration of sediment in rivers
V1.303
3CH_Cov2River erosion factorV0.773
4PRF_BSNPeak flow adjustment factor of
main channel sediment calculus
V1.426
5ADJ_PKRMaximum velocity adjustment factor of
sediment calculus in sub-watershed
V1.561
6USLE_PSupport coefficient of USLE equationV0.906
7SPCONLinear parameters characterizing the
maximum concentration of sediment in rivers
V0.002
8USLE_KSoil and water conservation measures
factor in USLE equation
V0.111
Table 5. Evaluation index of simulation results of hydrological stations in the FRB.
Hydrological ElementsHydrological StationsRPVP
R2NSPbias/%R2NSPbias/%
RunoffSantai0.910.86−16.50.890.871.2
Jiangyou0.850.79−22.90.660.58−21.5
Shehong0.930.88−21.20.850.82−17.1
Xiaoheba0.920.91−6.00.840.838.5
STSantai0.780.6910.60.800.6753.4
Jiangyou0.800.7754.10.740.6254.2
Shehong0.750.6216.70.760.5315.7
Xiaoheba0.720.6154.60.660.5151.6
Table 6. Statistics of the distribution of primary tributaries from upstream to downstream in the basin.
Primary TributaryBasin Area/km2Catchment Area above River Confluence/km2Ratio/%
Huoxihe1490427534.9
Pingtonghe1341731118.3
Tongkouhe421911,53736.6
Anchanghe93913,4897.0
Kaijiang255417,32414.7
Zitongjiang504323,29321.7
Qijiang203926,4497.7
Disclaimer/Publisher’s Note: The statements, opinions and data contained in all publications are solely those of the individual author(s) and contributor(s) and not of MDPI and/or the editor(s). MDPI and/or the editor(s) disclaim responsibility for any injury to people or property resulting from any ideas, methods, instructions or products referred to in the content.

