
Occupants’ Decision-Making of Their Energy Behaviours in Office Environments: A Case of New Zealand


School of Built Environment, Massey University, Auckland 0745, New Zealand
*
Author to whom correspondence should be addressed.
Sustainability 2023, 15(3), 2305; https://0-doi-org.brum.beds.ac.uk/10.3390/su15032305
Submission received: 13 December 2022
/
Revised: 12 January 2023
/
Accepted: 24 January 2023
/
Published: 27 January 2023
(This article belongs to the Special Issue Workplace and Facility Management Perspectives on Sustainability)
Abstract
:Understanding how occupants behave and interact with building systems is vital to energy efficiency in buildings. The building occupants’ behaviours are complex and influenced by diverse factors. A deep understanding of the underlying environmental, contextual, social, and psychological factors is the first step of many in establishing the relationship between the indoor environment and occupants’ behaviours. The current study investigates the influence of occupants’ perceived indoor environmental comfort, the availability of control, and the social-psychological impacts on occupant behaviours in a New Zealand context. The data were collected through online surveys, and 99 office occupants responded. A machine learning technique was applied to identify the critical factors influencing the decision-making of occupant behaviours. Of the occupant behaviours considered in the study, adjusting windows, doors, shades and blinds, and drinking beverages were mostly practised (>70%) while adjusting lighting, personal fans, thermostats/heaters, and computers (40–70%) was moderately practised by occupants. The availability of specific user controls was the main predictor of most occupant behaviours, followed by social-psychological factors such as actual knowledge, perceived knowledge, behavioural interventions, subjective norms, organisational support, personal norms, attitudes, and perceived behavioural control. The indoor environmental parameters such as indoor temperature, indoor air quality, natural light, and inside noise were highlighted as most influential in decision-making for occupant behaviours. Additionally, the demographic factors: gender, work duration, days at work, and permanence/temporariness of workspace, were also impactful. Knowing the complexity of occupants’ decision-making with respect to their behaviours helps building managers use this sensitive information to enhance building energy performance and enable more energy feedback to the occupants to raise their awareness. Such information is helpful for creating an intelligent environmental control system loop with eco-feedback and establishing occupant-centric buildings or features.
1. Introduction
Over the years, building energy consumption has increased intensely due to increased floor area to accommodate the growing population and improved indoor environmental quality standards, with people spending more time indoors for various purposes [1]. The requirements set in numerous energy policies and building regulations to improve energy performance in the built environment are yet to be met at national and international levels [2]. Therefore, plenty of opportunities exist to reduce energy consumption in buildings. Research efforts have discovered the primary contributors to building energy consumption where accomplishing the most energy efficiencies are possible, including climate, indoor environmental quality (IEQ), building envelope, building systems and equipment, operation and maintenance of the building, and occupant behaviours [3]. The predicted and actual building energy performance discrepancies are caused mainly by the uncertainty introduced by occupant behaviours [4,5].
Occupant behaviours are characterised by occupants’ presence, movement, and interaction with building energy systems and equipment [6]. As the intended users of buildings, the human factor is evidenced through numerous actions, including windows, shading and blinds, lighting, thermostats, appliances, and clothing adjustments [7]. Therefore, incorporating occupant behaviour information into building performance simulation (BPS) enhances the accuracy of energy simulation by reducing the uncertainties involved in BPS and is also helpful in better managing building operations for optimal systems and behaviour interventions [5]. However, occupant behaviours are conventionally treated as fixed schedules in building simulation tools, simplifying their complex nature [8]. Significant energy consumption variations result from diverse and dynamic interactions and energy use patterns among building occupants [9]. Researchers worldwide emphasise the importance of thoroughly understanding how occupants behave and interact with building systems.
Different types of occupant behaviour models are being developed for use in BPS, including schedules, profiles or rule-based, deterministic or statistical, non-probabilistic or data-based, probabilistic or stochastic, agent-based or object-oriented, and virtual models [10]. Given the stochastic manner of occupant behaviours, data-driven behavioural models based on non-probabilistic (i.e., data mining, machine learning), probabilistic (i.e., Markov chain, logit analysis, survival analysis), and agent-based modelling are widely known for their ability to provide valid, practical, and easy to understand behaviour patterns [11,12]. Recently, studies have focused on moving from deterministic schedules or rule-based BPS models [13]. Such data-driven models can predict occupant behaviour and energy consumption from the available data without detailed building information [14]. On the other hand, data mining techniques such as clustering, Bayesian network, decision tree, artificial neural networks (ANN), and support vector machines (SVM) overcome the shortcomings of traditional techniques for BPS [11]. The applicability of different models can vary according to the availability of input data, purpose, complexity, and implementation [15,16].
However, Franceschini and Neves explained that the existing occupant behaviour models mainly focus on one single behaviour, and they should simultaneously include multiple behaviours to accurately represent the interconnections among a few behaviours [10]. For example, reviewing the research on occupant behaviour simulation, Hong et al. (2015a) and Hong et al. (2015b) identified that most of the existing research focuses on one or a few behaviours relating to windows, shades and blinds, lighting, thermostats, plug-in equipment, and occupant presence and movement in buildings [17,18]. Another major hindrance is that many studies focus on the drivers of occupant behaviours that are easier to measure and quantify (i.e., environmental, context, and time-related factors). At the same time, the influence of physiological and social-psychological factors is also essential but usually ignored [10]. Similarly, Santangelo et al. argued that the results derived from stochastic models are hard to replicate; instead, those provide the potential insights to assess the impact of occupant behaviour on energy consumption [2]. Furthermore, the existing models must undergo rigorous validation to evaluate their reliability and application [10,11]. Therefore, the studies report that the existing BPS tools integrated with occupant behaviour models are not at full potential to support energy decision-making [2].
Occupants may be exposed to variable environmental conditions based on how the building is designed and operated [19,20]. Moreover, during building operations, the interactions between occupants and the environment directly affect the building’s performance [21]. Discussing the effects of perceived IEQ satisfaction on occupant behaviours is crucial as the human–building interactions are more apparent with dissatisfaction [22,23]. Increased energy consumption is expected if these interactions are oversimplified at the design stage [24,25]. Furthermore, Day et al. emphasised assessing how occupants use different building systems through knowledge of multi-domain comfort stimuli by combining a few or all indoor environmental parameters [26]. The occupant behaviours that lead to positive energy savings or excessive energy consumption are evident with user control [27,28,29]. If given control by building management, the occupants may adjust the building systems, for example, lighting and HVAC systems, to reach their desired comfort preferences [27]. For example, the occupants tend to initially adjust the desk fans in no-discomfort situations while adjusting the shades and blinds first in a situation where thermal and visual discomfort occur concurrently [30]. Correspondingly, Bavaresco et al. highlighted that behaviours such as opening windows and lifting blinds depend on occupants’ desire to have more daylight in their space and closing them occurs when the occupants want to reduce overheating, especially during the summer season [31]. Hence, occupant comfort preferences and user-centred control are essential contributors when developing occupant behaviour models.
Along these lines, significant interest was given to investigating IEQ satisfaction, availability of controls, and multi-domain comfort preferences [31]. However, the scope of these studies is limited only to a few of the selected behaviours, such as operating windows, shades and blinds, adjusting thermostats, and switching on/off artificial lights [31,32]. Deme Belafi et al. also suggested adjusting fans, doors, clothing, and drinking beverages, especially for the office environment [33]. Although these studies focus on seasonal variance and its influence on IEQ satisfaction and comfort preferences, the focus is not on particular time-related factors that are being highlighted in the empirical research.
At the same time, the previous studies emphasise the influence of extending these investigations to different geographic locations (i.e., countries and regions) and building typologies (i.e., office, school, residential). A significant set of studies emphasises the subjective aspects, including social-psychological constructs and personal factors (i.e., age, gender, ethnicity) relating to human–building interactions [23]. However, recent investigations into social-psychological theories unveiled that most studies applied a limited number of constructs that can be easily collected using quantitative research methods in social science (i.e., survey methodologies) [23,28]. This questions whether the specific constructs can accurately explain the observed occupant behaviours or interactions with different building systems. Among the many social-psychological constructs, the studies primarily highlight the influence of the theory of planned behaviour (TPB) constructs: attitudes, subjective norms, and perceived behavioural control (PBC) [34,35,36]. Other mainstream theories include the norm activation model (NAM), which focuses on awareness of consequence, the ascription of responsibility, and personal norms [37,38], and the social cognitive theory (SCT), offering knowledge and group dynamics [39,40]. Additionally, some frameworks extended or modified these theories, such as drivers, needs, actions, and systems (DNAS) [6] and motivation-opportunity-ability (MOA) [41] frameworks. These frameworks combine social-psychological constructs from several theories and contribute to a more accurate representation of occupant behaviours. For example, Li et al. combined the constructs from TPB and NAM theories and added new constructs, namely, accessibility to control, organisational support, actual knowledge, and perceived knowledge [28]. These include organisational support, rewards for energy-saving, and behavioural interventions such as energy feedback and awareness that positively drive pro-environmental behaviours of the employees to promote energy-saving [42]. That said, additional research is necessary to evaluate the applicability of these frameworks on occupant behaviours in different geographic locations and building typologies.
The research has yet to present a more comprehensive study filling the above gaps. Occupant behaviour-related models and tools can provide essential feedback to optimise the energy performance of buildings and the respective simulation and modelling. However, these potentials are not yet fully realised due to the lack of informed models on occupant-behaviour-related data. The dynamic and diverse nature of occupant behaviours creates vagueness in building energy simulations, thus, the discrepancies between predicted and operational energy consumption. The existing occupant behaviour frameworks do not fully integrate the subjective aspects, such as occupants’ comfort preferences and social-psychological thinking, along with environmental, contextual, physiological, and time-related parameters. However, developing such a framework focused on specific subjective and objective drivers of each behaviour could enhance occupant behaviour-related data monitoring and collection to optimise the operational performance of existing buildings and to improve the future designs of buildings. Specifically, in the New Zealand context, the lack of research on occupant energy behaviours brings down the potential energy savings from commercial office buildings. In this panorama, the current study aimed to evaluate the decision-making path flow of the occupants before raising a specific behaviour in the New Zealand office building context. Unlike the previous studies, the focus is given to investigating multiple occupant behaviours, including windows, doors, lighting, shades and blinds, fans, thermostats, computers, drinking beverages, adjusting clothing levels, and moving through spaces with the influence of multi-domain aspects relating to the indoor environment, building user control, social-psychological factors, and demographics of the occupants. The specific questions that the study tried to answer were:
- RQ1. What do occupants perceive about their indoor environment and the availability of control?
- RQ2. What are the specific social-psychological impacts on occupant behaviours?
- RQ3. What triggers the specific occupant behaviours?
The forthcoming sections of this paper are organised to discuss the research methods in Section 2. Section 3 explains the research and discussion regarding perceived comfort in IEQ, availability of user control, social-psychological factors, decision tree analysis, and excluded behaviours from the analysis. Section 4 concludes the study with a summary of key research findings, practical implications, limitations, and further studies.
2. Materials and Methods
2.1. Survey Approach
The current study evaluated the combined influence of the multi-domain aspects: indoor environment, building user control, social-psychological factors, and demographics of the occupants on specific occupant behaviours. The research design of the study is a case study survey conducted in a simple descriptive manner (one-time-only survey) in which a survey is administered to the case [43]. The study selected a small sample from the selected case to describe the occupant behaviours and the specific drivers influencing these behaviours in the particular population. This is a primary method employed in occupant-behaviour-related research [30,44]. A questionnaire was distributed online through the Qualtrics Survey platform from August 2021 to January 2022. Individual links were sent to 1258 office occupants of three office building blocks in a university with the most participants during the COVID and post-lockdown period in New Zealand. However, there were only 266 participants who were the primary (occupants in a designated office space) occupants of the selected offices. Ninety-nine (99) valid responses were collected, excluding the incomplete responses and the responses from occupants who did not work in the office space. The response rate was 37% from the 266 primary occupants.
2.2. Characteristics of the Buildings
The study purposively selected three medium-rise (5 to 12 floors) buildings in the selected case with different office settings, including open-plan, shared, and single offices. The selected buildings mostly followed similar building characteristics. Table 1 presents the profile of these buildings, categorising the characteristics into environmental, building-related, social, and time-related factors. The buildings exhibited similar environmental characteristics, except that the year of completion varied from 1968 to 1981, and the outdoor temperature ranged from 9–18 °C, while the indoor temperature was variable. The contextual building factors primarily varied for building size and the number of floors. The buildings’ usable floor area ranged from 3671 m² to 5590 m², and the number of floors was between 4 to 8. Building shapes were rectangular and square, oriented in northwest and northeast directions, with single glazing on every side of the buildings. The buildings were equipped with split A/C in some office spaces, mixed mode ventilation including natural and mechanical ventilation, and heating provided through shared boilers with radiators/convectors/AHU/ FCU. The number of occupants in the dedicated office spaces varied from 137 to 321. Additionally, the buildings had equipment use schedules for ventilation and heating systems; most systems operated between 7 a.m. to 5 p.m. and 6.30 a.m. to 6 p.m.
2.3. Demographic Profile of Participants
Table 2 presents the participants’ demographics considering their physiological and work-related factors. The survey participants included mostly males (53%) and females (47%). Ethnicity-wise, the majority were NZ European (70%), with Asian (10%), Māori or Pacific (3%), and other ethnicities (17%). The participants were a diverse set of occupants in New Zealand. The majority were 30 years old or older (93%), while occupants under 30 years old comprised only 7%. In the selected building, most occupants worked in single offices (54%), the occupants who worked in shared offices comprised another 33%, and 13% worked in open-plan offices. Additionally, most (77%) worked in the building for a year or more, and 67% worked in the current workplace for a year or more. Among the occupants, 52% worked five days or more every week, while 47% worked less than five days. These higher percentages on work durations in terms of building, current workspace, and the number of days working provide evidence that most occupants are familiar with their surroundings.
2.4. Variables of the Study
The study surveyed the occupant behaviours and multi-domain aspects relating to the indoor environment, building user control, and social-psychological factors. The appropriate occupant behaviours were identified, referring to knowledge from IEA EBC annexe 66 on the definition of occupant behaviours [8] and the classification given for occupant behaviours in [11]. For example, Yan et al. explained that occupant behaviour includes occupant presence, movement, and interaction with building energy devices and systems [6]. The survey included a list of behaviours in a nominal and categorical variable (yes/no) format, and the authors asked the occupants to select their behaviours.
The multi-domain aspects that influence occupant behaviours were identified according to the classification given by Fabi et al., where the factors were divided into five categories: physical environmental, contextual, psychological, physiological, and social [45]. This classification was later adopted in a few studies [3,46]. Furthermore, D’Oca et al. developed an occupant behaviour motivational survey framework that considers the physical environment, physiological, psychological, social, and contextual factors shaped by geographical context, driving occupant motivations of different social groups and cultures and norms [47]. Relating to physical environmental factors, Asadi et al. reviewed the influence of IEQ parameters on occupant behaviours highlighting the main parameters of temperature, air quality, lighting, and noise [48]. These parameters were measured according to a unique five-point Likert-type (1 to 5) scale for each parameter;
- Indoor temperature: Too cold, cold, about right, hot, too hot
- Indoor air quality: Too stuffy, stuffy, about right, draughty, too draughty
- Natural/artificial light: Too dark, dark, about right, bright, too bright
- Inside/outside noise: Too quiet, quiet, about right, noisy, too noisy
Contextual factors are mainly discussed in terms of building-related factors. For instance, O’Brien and Gunay categorised nine contexts where building designers have the most significant control over occupant energy behaviour, where the availability and accessibility of individual/user control are highlighted [46]. The control available for workplace appliances and building systems was measured using a three-point Likert-type scale (no control, somewhat control, full control). If any appliance and system were unavailable at the workplace, occupants could select “not available.”
The study adopted the MOA framework introduced by Li et al. to evaluate the influence of social-psychological factors [28]. The factors surveyed include attitude, personal norms, subjective norms, behavioural interventions, organisational support, accessibility to control, PBC, actual knowledge, and perceived knowledge. These factors were measured using a five-point Likert scale (1 to 5) for strongly disagree, disagree, undecided, agree, and strongly agree.
2.5. Data Analysis
2.5.1. Reliability of the Survey Data
The reliability of the collected data was analysed using Cronbach’s alpha (α) value relating to the independent variables, the acceptable level of α value is 0.70, which measures the internal consistency [49]. Regarding the indoor environment, building user control, and social-psychological measures, 37 variables were considered for this analysis. The α value of these variables is 0.713, which is greater than the acceptable level. Therefore, the survey responses are acceptable and sufficiently reliable for further analysis.
2.5.2. Evaluation of Multi-Domain Aspects
The collected data were first analysed using descriptive analysis concerning the indoor environment, building user control, and social-psychological factors. Notably, the responses received concerning the indoor environment and building user control were analysed using frequencies for variability. The responses received for social-psychological factors were analysed by calculating the mean for central tendency and standard deviation (SD) for variability [50].
2.5.3. Decision Tree Analysis
This study adopted a decision tree-based approach to evaluate the predictors of occupant behaviours in office buildings based on the indoor environment, building user control, social-psychological factors, and demographic factors. Decision tree analysis is a non-parametric supervised machine learning method used for tree-based classification or predictions of a dependent variable (target attribute) based on values of independent variables (predictors) [51,52]. As the decision tree is non-parametric, no prior assumptions are needed considering the probability distributions of predictive variables [53]. In the decision tree, various predefined groups or categories are developed based on the data set and given a top-down branched graphical classification model or rule expressions [54]. The target attribute is the root node of the tree diagram, and the nodes after splitting the root nodes are called decision nodes. The nodes that cannot split further are identified as the leaf node or terminal node.
Decision tree models can handle data and regular attributes and are insensitive to missing values. Compared to other machine learning models, such as artificial neural networks (ANN) and support vector machine (SVM), decision tree models provide highly efficient forecasting by faster calculations and easy interpretations. Furthermore, the decision trees do not need prior assumptions on probability distributions of predictive variables [51,53].
Decision trees are suitable for analysing the data of the current study as it naturally supports nominal and categorical variables [55]. The target attributes (occupant behaviours) were collected as nominal and categorical variables assigning “yes” if a particular occupant checked the behaviour and “no” if they did not select that behaviour. Predictor variables relating to the user control were assigned “yes” if they responded somewhat control/full control and “no” if they chose no control/not available. Regarding IEQ and social-psychological factors, no changes were made. All categories of the Likert scale were used when creating decision tree models, and the model decided on a floating-point number classifying the occupants’ responses into two groups.
Various classification algorithms were used in previous studies when forming decision trees. The most common types of algorithms are Chi-squared automatic interaction detection (CHAID); classification and regression trees (CART); quick, unbiased, efficient statistical trees (QUEST); and C4.5 and C5.0 [51,52]. The CART algorithm was selected to predict an occupant showing particular behaviour using IEQ, user control, social-psychological, and demographic factors. CART uses historical data to construct the decision tree, which is suitable for categorical data and robust to outliers [56]. CART transforms the independent variables from one set of numbers into another without changing the tree structure [56]. CART considers splitting the data based on maximum homogeneity, where all cases have the same value in a terminal node for the target attribute. The impurity measure defines the predictor nodes in maximum homogeneity [54]. The study used the Gini index, most broadly used in the research in this field [31]. Gini considers squared relationship probabilities for each dependent variable classification using the following splitting rule [31].
V represents the Gini index, n is the number of class labels, is the proportion of ith class label.
Kim empirically compared the performance of decision trees, ANN, and linear regression under varying sample sizes [57]. Their study highlighted that linear regression and the decision tree performed better when the sample size was small (100 or 500), while ANN was better when it was 1000 or 10,000. Therefore, the sample size of the current study is enough for the decision tree analysis. Validation assesses how well the developed tree model performs when generalising to a much larger population. Due to the small sample size in the current study, cross-validation was considered by dividing the sample into 10 subsamples of equal size (k-folds). This method treats the first fold as a validation set, and the model is fit on the remaining k − 1 folds and produces a single final tree model calculating the average risk of all trees [52,58]. Tree models in the present study were developed using the IBM SPSS Statistics 28.0.0.0 software version.
2.5.4. Scope of Analysis
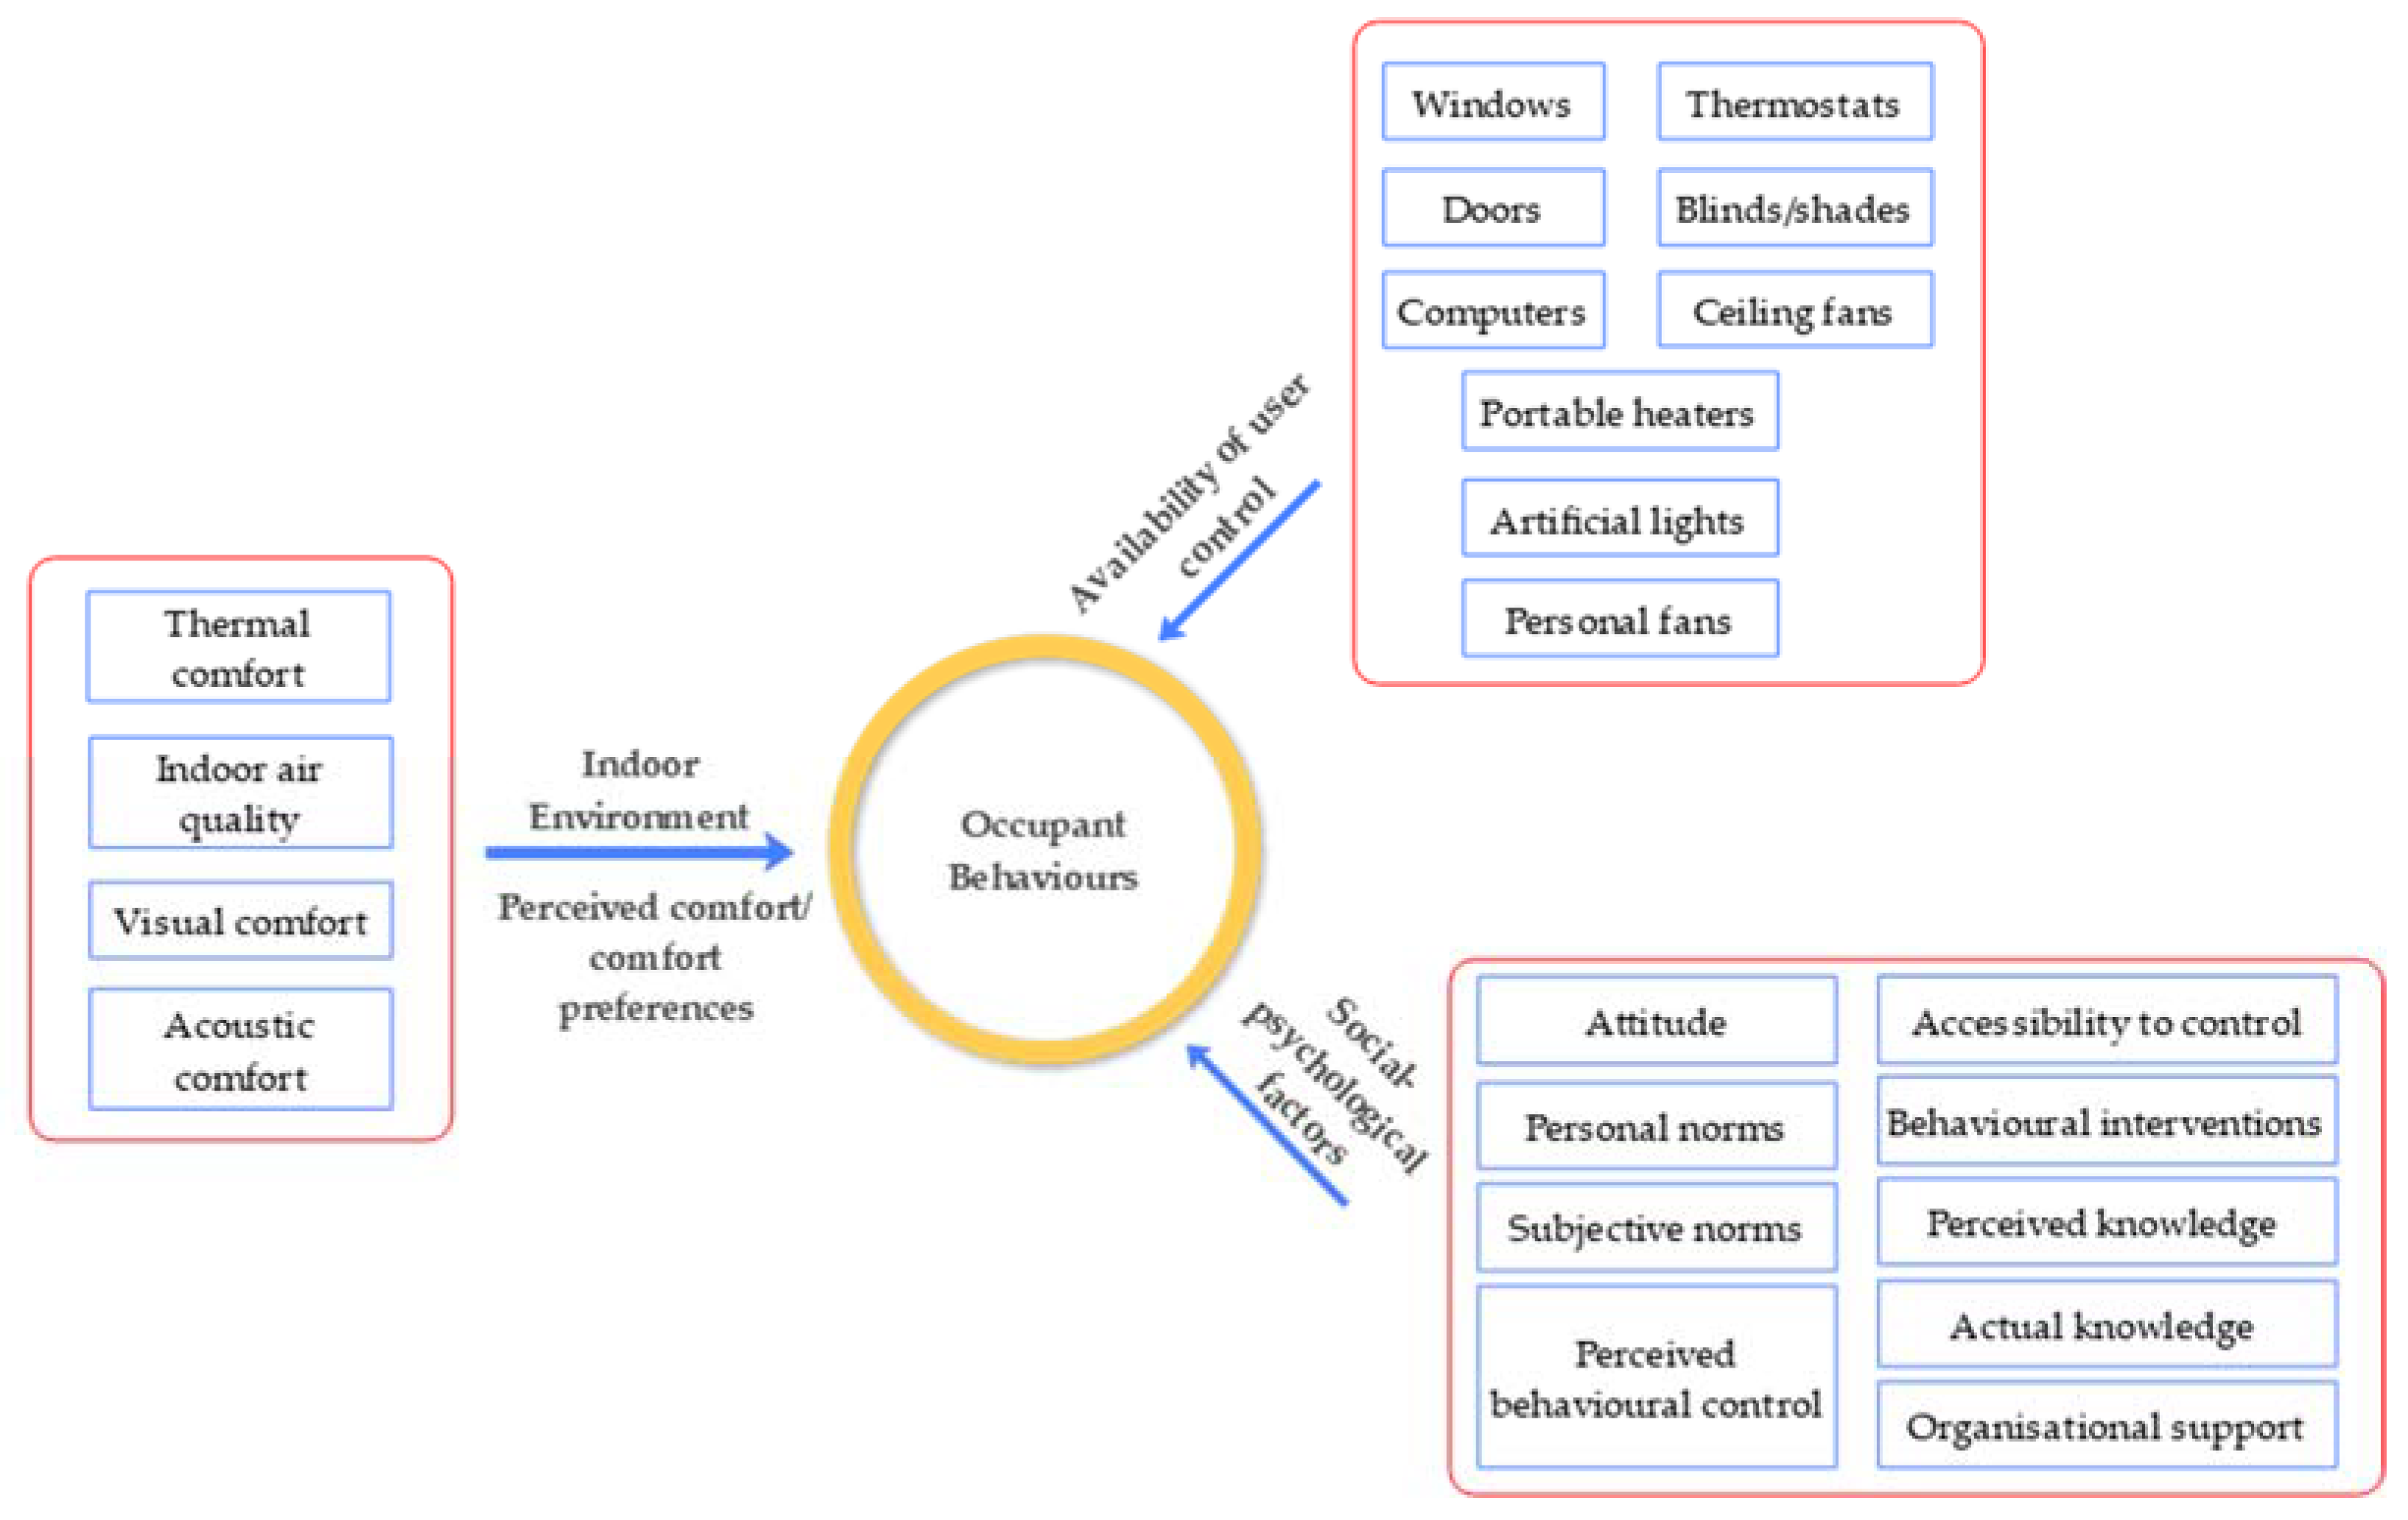
The study surveyed multi-domain aspects relating to the indoor environment, building user control, social-psychological factors, and demographics of the occupants. First, the occupants’ perceived beliefs on IEQ, the availability of individual control over building systems and appliances, the social-psychological insights, and the conduct of occupant behaviours were evaluated to understand the occupants’ perception and belief on these constructs. The developed conceptual framework for the drivers of occupant behaviours is illustrated in Figure 1. Second, a machine learning algorithm was used to evaluate the combined influence of all these constructs and to identify the significant triggers/drivers of occupant behaviours. A substantial portion of studies relating to occupant behaviour modelling are being conducted in countries such as the USA, the UK, Europe, and China. This is the first research that focuses on deepening the evaluation of drivers for occupant behaviours in the context of New Zealand in order to broaden the geographical spectrum. The study selected the case of a University in New Zealand to achieve this aim. The current study identifies behaviour triggers and quantifies occupant behaviours within the scope of occupant behaviour modelling [5]. The information enabled in the decision path algorithms created in the current study can be linked to future occupant behaviour models and BPS tools for specific behaviours [12]. Furthermore, Table A1, Table A2, Table A3, Table A4, Table A5, Table A6 and Table A7 in the Appendix A present the previous research on each behaviour and summarise the factors they considered influencing each behaviour.
3. Results and Discussion
3.1. Perceived Comfort in IEQ
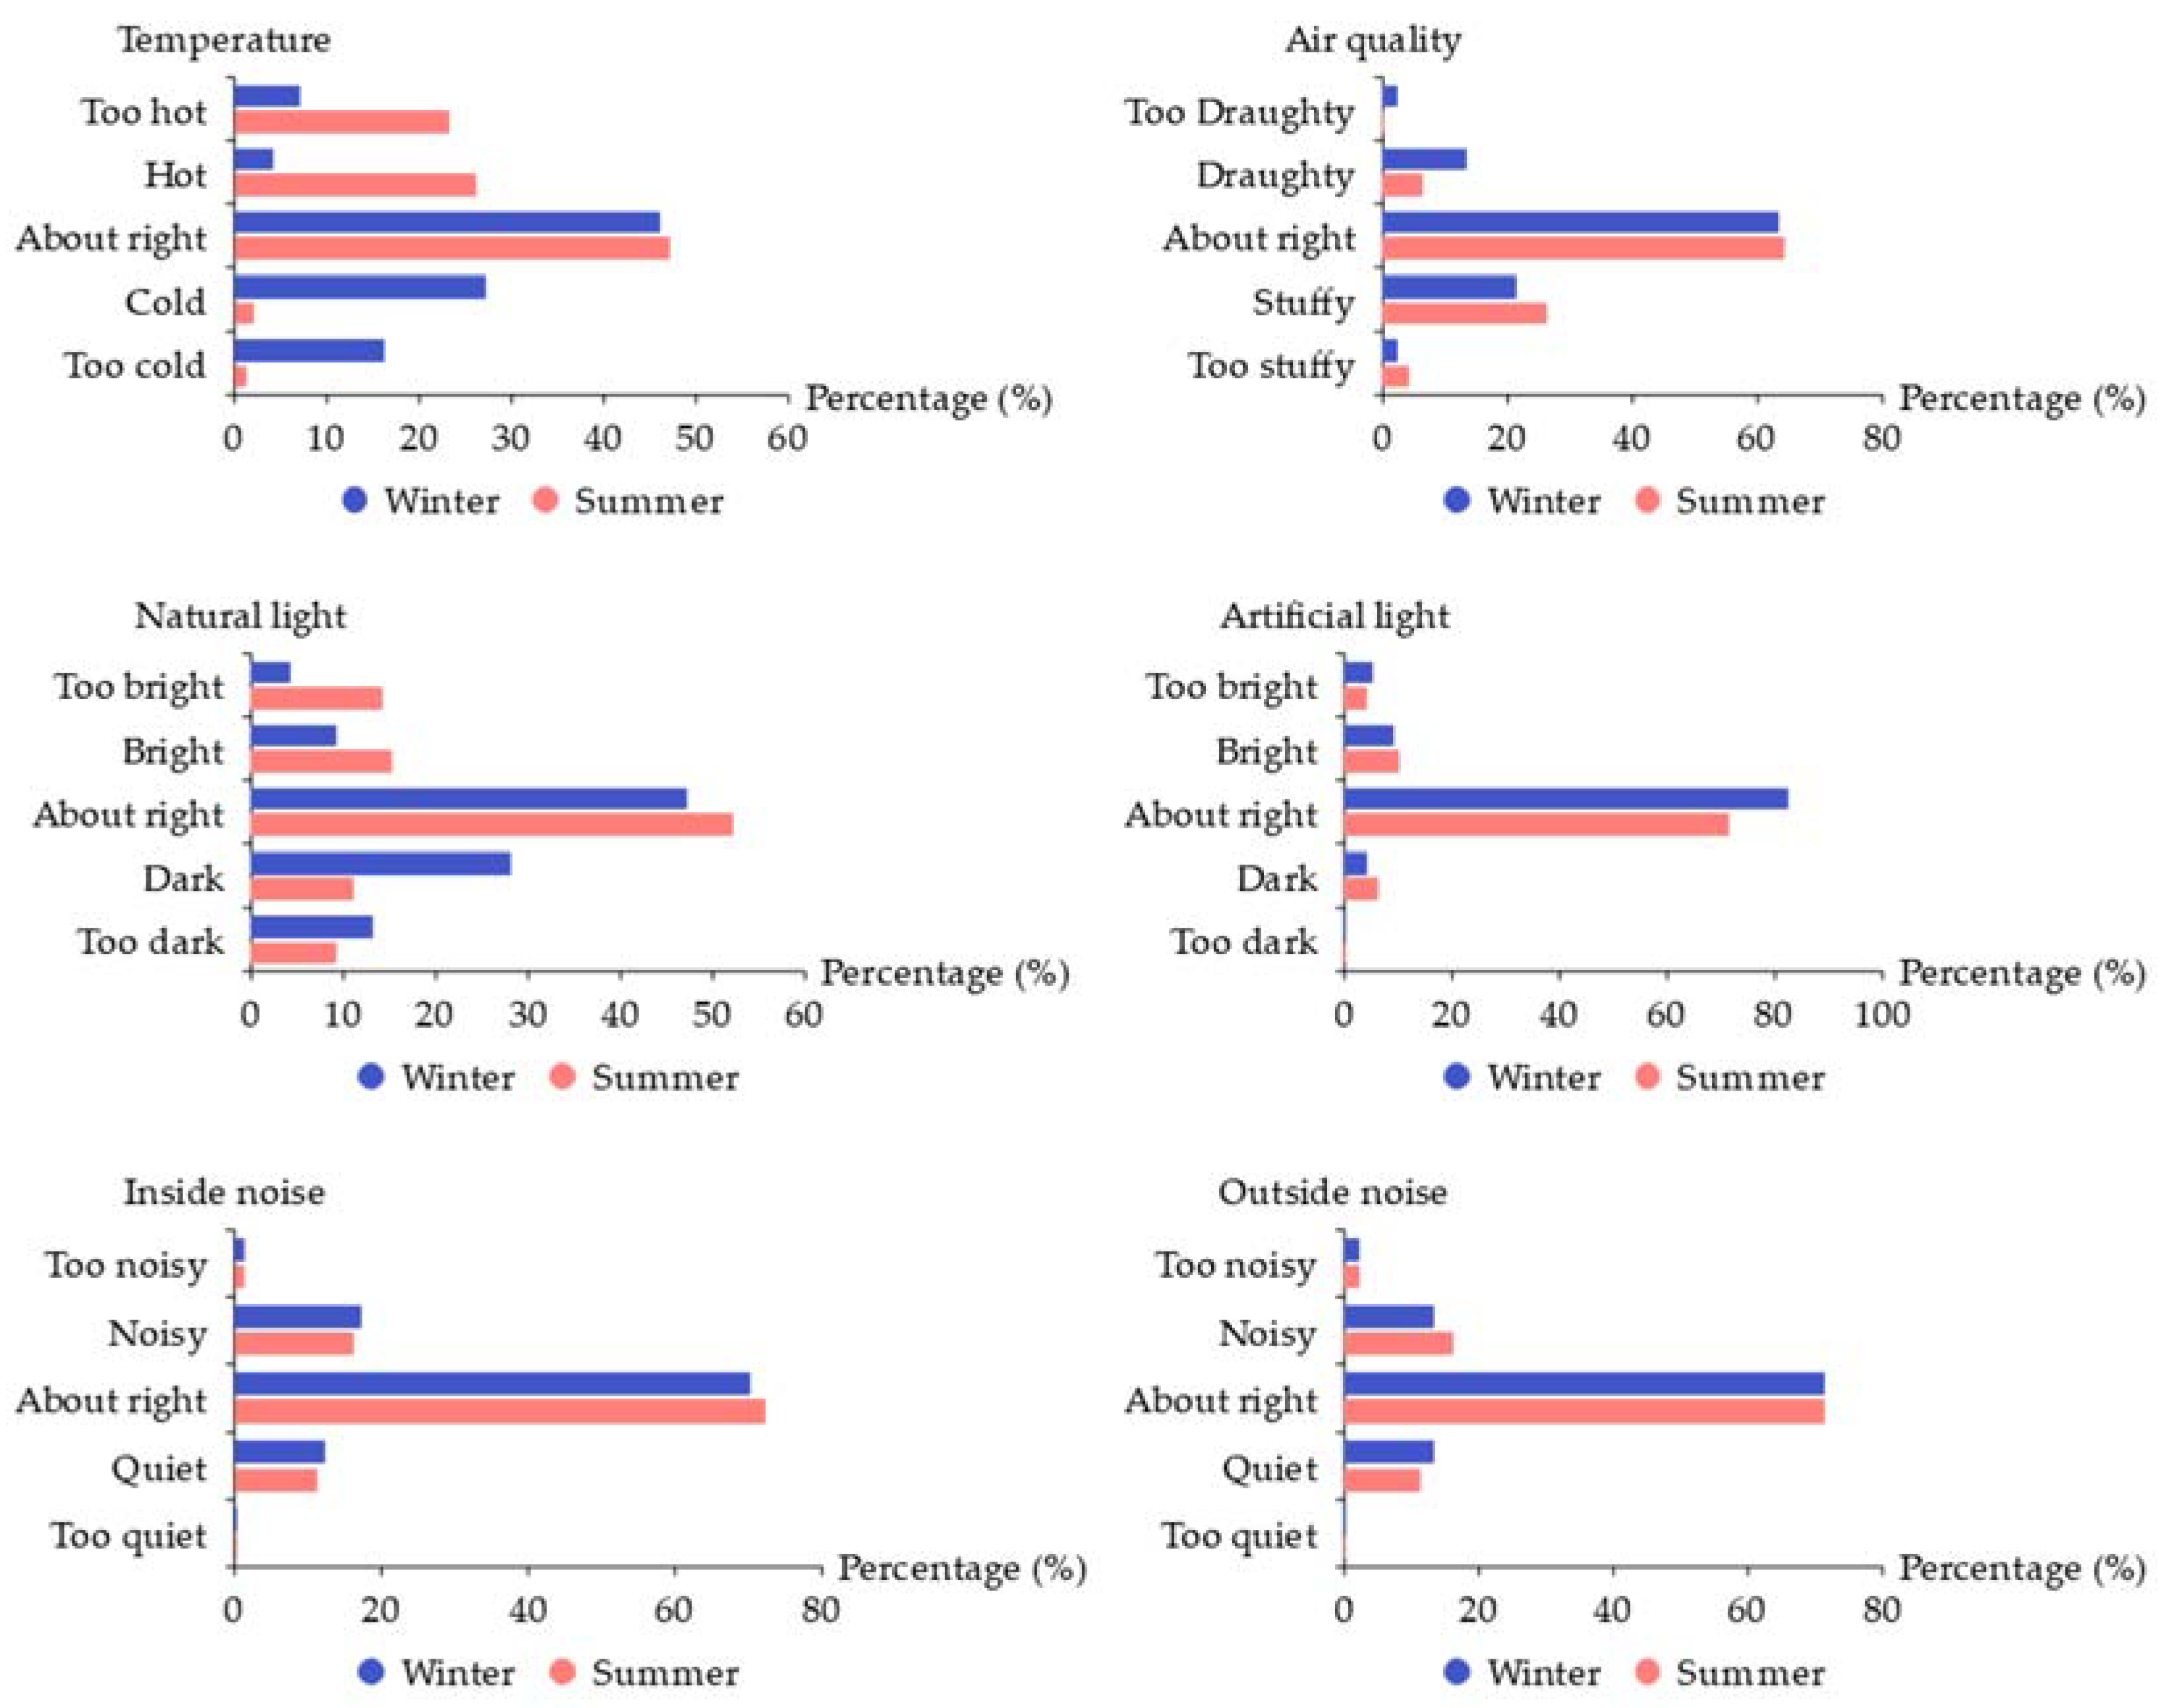
Figure 2 summarises the percentage of occupants’ perceived IEQ comfort on the six parameters: temperature, air quality, natural light, artificial light, inside noise, and outside noise. A glance at the graphs shows that most occupants believe the conditions are “about right” for all parameters. However, in most cases, this revolves around 50% of responses, while another 50% of occupants responded with discomfort within their environment considering the two extremes of the parameters (too cold/hot, too stuffy/draughty, too dark/bright, too quiet/noisy).
Considering the office temperature, 43% of occupants responded, “too cold” or “cold” in winter. In comparison, 49% responded “too hot” and “hot” in summer, highlighting the seasonal influence on indoor temperature. Therefore, building managers need to estimate heating/cooling loads in buildings, accurately considering the occupants’ expectations. In both seasons, an average of 45% perceived that the indoor temperature was “about right”, indicating that they may meet their thermal comfort expectations. Another parameter, air quality, shows that many occupants perceived that the air quality did not reach the extremes—“too stuffy” or “too draughty”. While a majority, approximately 63%, perceived the air quality was “about right”, only approximately 20–30% of participants indicated that the environment was “too stuffy” or “stuffy” in winter and summer. Fewer than 20% perceived “draughty” and “too draughty” in winter, whereas only 13% indicated “draughty” in summer. Compared to the temperature, more occupants were satisfied with their indoor air quality expectations, and the seasonal variance less influenced the air quality.
Regarding lighting, the discomforts are highlighted much more in natural light than in artificial light. An average of 52% indicated that the natural lighting level inside the offices was “about right” during summer and winter. However, natural lighting is influenced by the season, and 40% of occupants indicated the natural lighting was “too dark” or “dark” during winter, whereas 21% indicated it was “too bright” or “bright” in summer. These estimations are considerably higher than the other extremes in both seasons. Considering artificial lighting, the majority, 80%, indicated the lighting was “about right”, highlighting that the artificial lighting was designed to meet the office space requirements irrespective of the seasonal variance. The last parameter, noise, indicated that 71% of respondents believed inside and outside noise conditions we “about right” in both seasons. Fewer than 20% of occupants indicated “quiet” or “noisy” in both seasons. Therefore, the inside and outside noise levels only affected some occupants, who were possibly most sensitive to the noise around them and easily distracted.
The above results revealed that most occupants perceived discomfort in temperature, air quality, and natural light. The indoor environment’s temperature and natural lighting conditions were also mainly influenced by seasonal variance. However, most occupants perceived comfort in other parameters: artificial light and inside and outside noise. Weerasinghe et al. (2022a) identified that the discomforts arose due to the lack of building management improvements, and occupant comfort satisfaction was observed with their timely approach to services-related and building controls-related matters [27]. On the one hand, study results support the claims of Cheung et al., who reported the least satisfaction with the stuffiness and air movement and the most satisfaction with artificial lighting [19]. As the selected buildings have split AC and mixed-mode ventilation, occupants may be exposed to variable temperatures (i.e., too cold and too warm) in different seasons [20]. Accordingly, occupants may respond to comfort sensations and environmental discomfort through occupant energy behaviours [22,23]. Looking into the above insights, all these environmental parameters can influence more or less the decision-making of occupants regarding their energy behaviours. Therefore, these parameters are considered in the decision tree analysis.
3.2. Availability of User Control
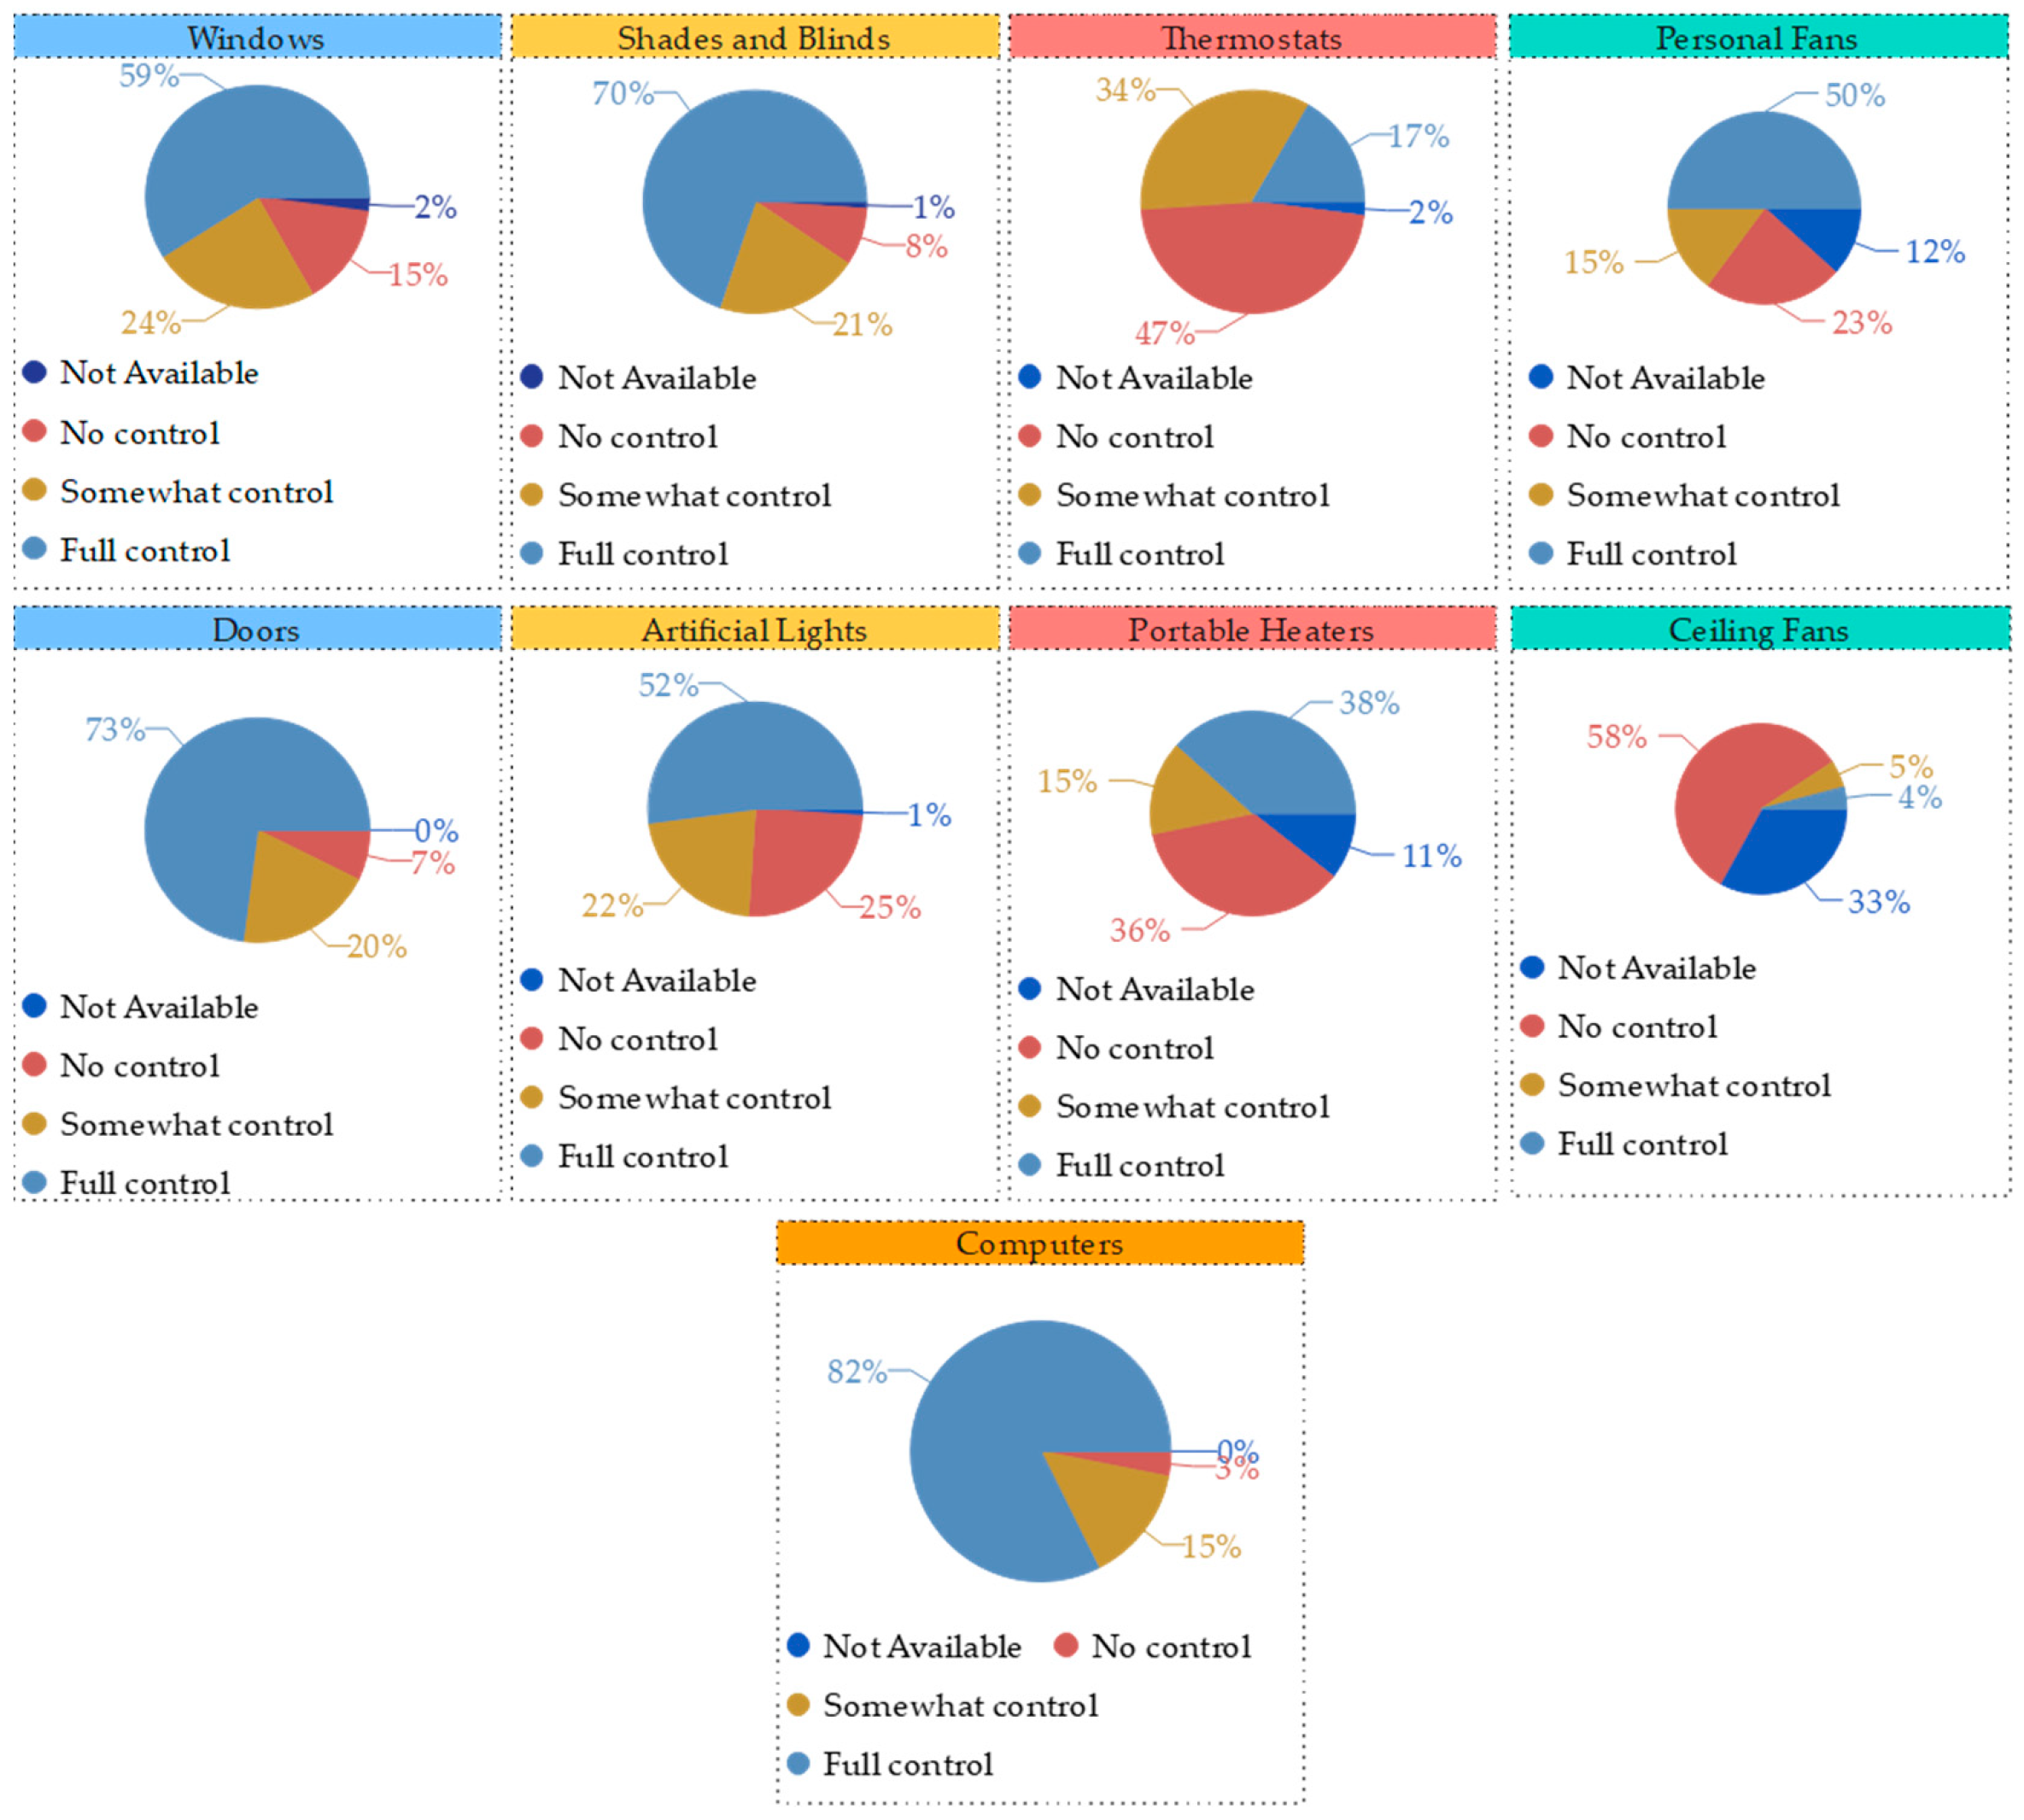
Figure 3 shows the pie charts for each building system and appliance based on the occupants’ rating of the availability of individual control over those systems and appliances at their workspace. Overall, most occupants had full control over the building systems and appliances in the current study. Specifically, 70% or more than 70% had full control over computers, doors, shades, and blinds, while more than 50% could fully control windows, artificial lights, and personal fans. However, considering the portable heaters and thermostats, only 38% and 17% indicated full control, respectively, which is significantly less. However, some participants have somewhat control over portable heaters and thermostats; therefore, overall control over these two items was slightly higher than 50% but comparably less than the other systems. Therefore, more than 30−50% of occupants had no control over portable heaters and thermostats. Considering ceiling fans, only 4% indicated full control, and many (57%) indicated no control. Compared to other systems, occupants had the least control over the ceiling fans.
Given the percentage of control availability, this explains the perceptions of occupants on indoor environmental parameters. For example, the lack of control over thermostats and portable heaters may link to perceived thermal discomfort. Ventilation is a good source of ensuring indoor air quality. The access to open windows and doors and operating air conditioners and personal fans improved the occupants’ perception of air quality. As most occupants have control over windows, doors, and personal fans, the perceived discomfort in air quality may be reduced. The perceived discomfort with natural lighting may link to increased control over shades and blinds and the lack of control over artificial lighting. This view is supported by Vellei et al., who explained: when perceived user control increases, the thermal and air quality satisfaction levels increase [29]. Many studies highlighted that the availability of user control is relevant to addressing occupants’ random behaviours [28]. If given control, occupants promote energy-saving adaptive behaviours, such as controlling the windows more effectively [29]. Weerasinghe et al. (2022a) brought attention to the fact that occupants’ interactions with windows, doors, and portable heaters when the air-conditioning system is in operation could massively change the set-point temperature and lead to high energy consumption [27]. However, lack of control is only one factor attributing to perceived discomfort, and there can be other factors (i.e., poor environmental conditions and physiological factors).
Therefore, the amount of control available on building appliances and systems can subsequently influence the occupants’ behaviours, or it can be the most influential over other factors and may negatively or positively affect the energy. Along these lines, the availability of user control over the said systems and equipment was brought forward for the decision tree analysis.
3.3. Social-Psychological Factors
This subsection synthesises occupants’ social-psychological expectations relating to occupant energy behaviours. Social-psychological factors were evaluated using a five-point Likert scale coding negative options: strongly disagree = 1 and positive options: strongly agree = 5. Nine factors were considered: attitude, personal norms, subjective norms, behavioural interventions, organisational support, accessibility to control, PBC, actual knowledge, and perceived knowledge. The mean score of these factors was calculated, and the summary of the results is presented in Table 3. The mean values are higher for actual knowledge, accessibility to control, perceived knowledge, attitude, personal norms, and PBC. Compared to these factors, the mean score of subjective norms, organisational support, and behavioural interventions is <3. Therefore, the occupants showed negative perceptions of the latter three factors. In terms of SD values, all SD values are <2, indicating all the responses are close to the respective mean values of each factor.
The above results revealed that the occupants have the highest agreement on actual knowledge, accessibility to control, and perceived knowledge. Knowledge constructs indicate the occupants’ relatively strong mental ability and awareness to save energy and perform energy-saving behaviours [35]. Attitude, personal norms, and PBC are the other constructs that most occupants agreed upon. The occupants are more likely to save energy when occupants have a positive attitude towards energy-saving, self-obligation to commit energy-saving behaviours, and perceived control in saving energy [35]. Occupants with a positive attitude are most likely to commit energy-saving behaviours [35,36]. Regarding subjective norms, the occupants have a lower agreement if social pressure exists to save energy. Chen et al. support that subjective norms may not significantly predict occupants’ intentions to save energy [34]. The constructs that received the lowest agreement were organisational support and behavioural interventions, which indicates occupants do not receive enough support and intervention from their organisations to save energy, although these positively drive occupant energy behaviours [29,42].
3.4. Decision Tree Analysis
Figure 4, Figure 5, Figure 6, Figure 7, Figure 8, Figure 9, Figure 10, Figure 11, Figure 12 and Figure 13 were drawn based on the results of the decision tree analysis. The dependent variable of each decision tree model is occupant behaviour, which has two classes, “Yes” or “No”. The root of these models contains all 99 observations in this dataset. Figure 4 summarises the results of decision tree models of opening and closing windows.
As seen in Figure 4, 80% of occupants responded that they open windows, while 76% responded to closing windows. Availability of window control is the main predictor of both opening and closing window behaviours. Most of the participants who had the window controls interacted with windows, while only 3% of occupants did not open windows, and 6% did not engage with closing windows, although the control was available. This is similar to the risk of misclassifying an occupant into these behaviours, and the prediction accuracy is consistent with the risk estimate. The overall prediction accuracy of models reached 96.9% for opening windows and 93.8% for closing windows. According to the current models, control availability is far more important than all the other predictors and improves the purity of all nodes with the most homogeneity. Similarly, Bavaresco et al. identified the availability of window control as the main predictor of adjusting windows [31].
Additionally, the authors identified environmental, personal, and social-psychological factors influencing the occupants’ decision-making on windows, such as IEQ satisfaction, attitudes, frequency of negotiation, age, IEQ productivity, and satisfaction: indoor temperature, indoor air, and daylighting. For example, occupants who are least satisfied with the indoor environmental conditions open the windows more, while those who are more satisfied tend to close the windows more. Environmental conditions influence is widely studied regarding occupants’ window behaviour. For example, the temperature [33], indoor CO2 concentration, and relative humidity [59] were the main highlights in the previous literature.
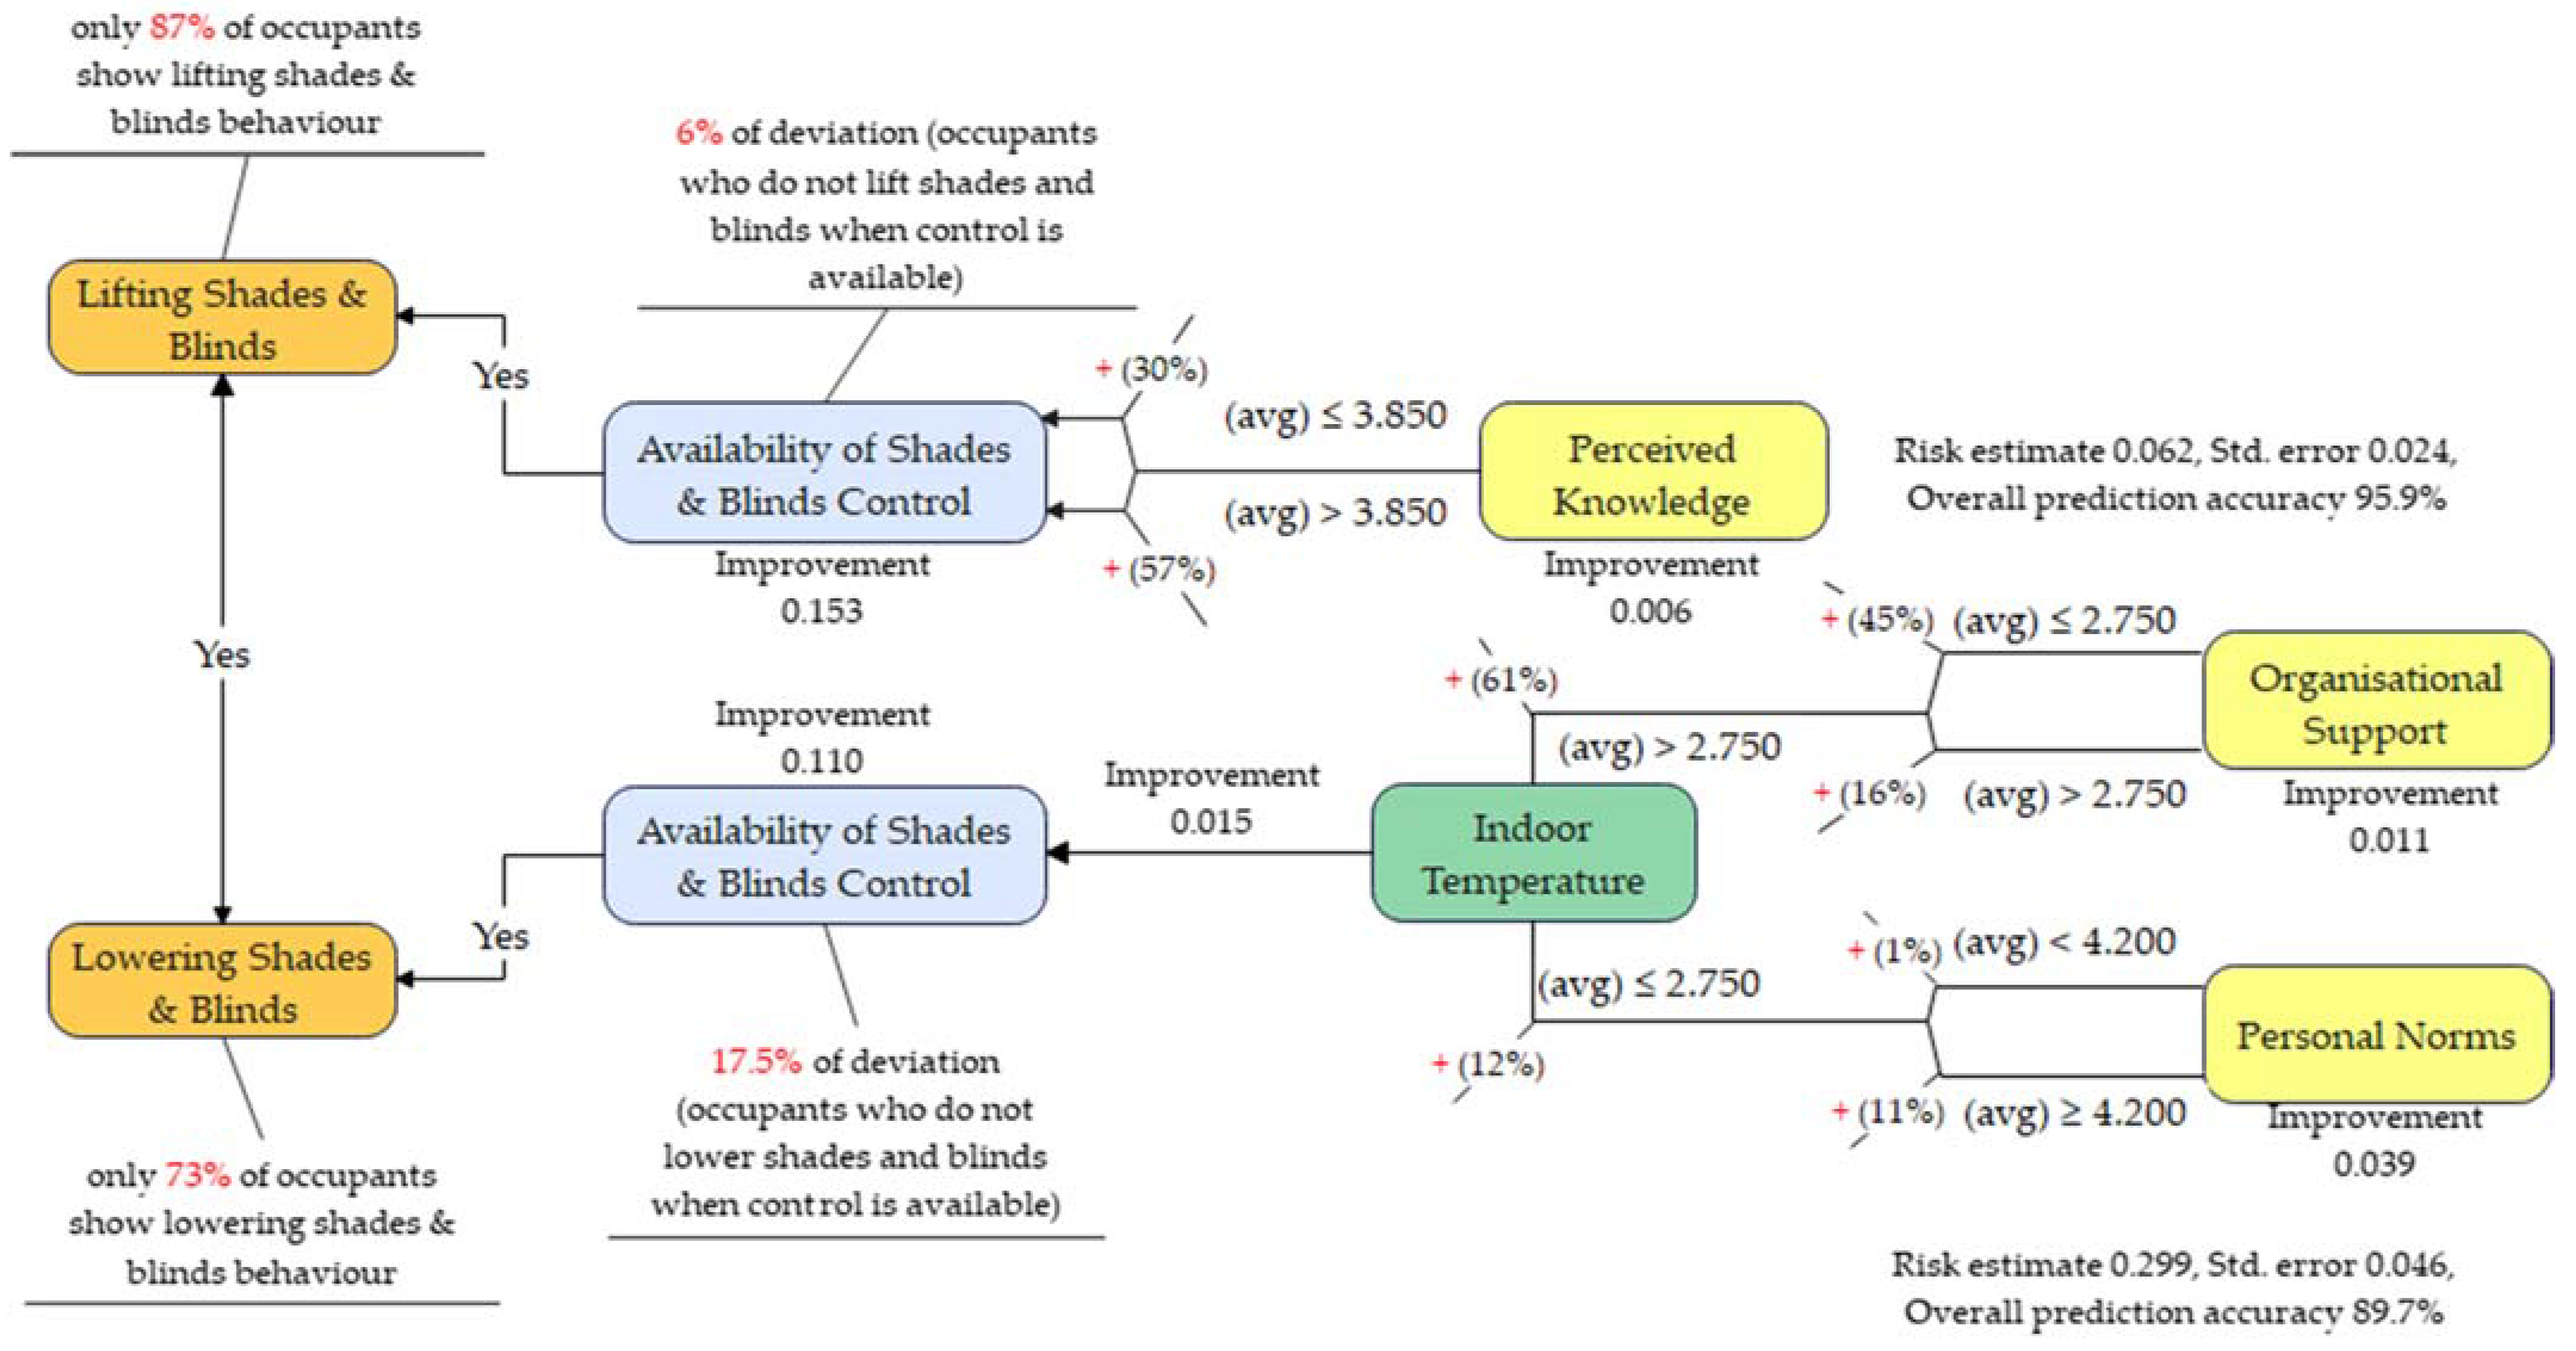
Figure 5 illustrates the summary results of the decision tree models of adjusting shades and blinds. As shown in Figure 5, 87% of occupants indicated lifting shades and blinds in their workplace, while 73% responded to lowering shades and blinds. The most influential predictor of shades and blinds behaviour is the availability of shades and blind control, followed by the occupants’ perceived knowledge. The occupants who use their knowledge of energy-saving more tend to lift shades and blinds more. This model achieved a 95.9% prediction accuracy, with a 6% risk of misclassification per the cross-validation. The other predictors for lowering shades and blinds are indoor temperature conditions, organisational support, and personal norms. The model, including these three predictors and the availability of control, achieved an 89.7% of prediction accuracy. When occupants perceive the indoor temperature discomfort, the organisation’s encouragement to save energy and reward for savings is less, and the occupants’ responsibility to save energy is more; the majority lower the shades and blinds. Although the observed deviation of occupants who did not engage in lowering shades and blinds was 17.5%, a risk estimate of 30% was given from the model, indicating misclassifying an occupant into this behaviour driven by the model predictors. Our findings aligned with the fact that the adjustment of shades and blinds is influenced by the availability of controls [36]. Another factor that influences the lowering of shades and blinds is the indoor temperature [36]. According to the authors, most occupants close the shades and blinds when satisfied with the indoor temperature. Furthermore, the authors highlighted other significant predictors: IEQ satisfaction, intention, attitudes, ease of sharing control, and the frequency of negotiation, where authors showed the inverse relationship between IEQ satisfaction and adjusting shades and blinds. However, our study highlights the influence of other social-psychological factors: perceived knowledge, organisational support, and personal norms. Zhang et al. supported that when the organisational support is weak, the occupants’ obligation/responsibility strongly influences energy-saving behaviour [60]. Similar to window behaviour, the influence of environmental conditions was widely highlighted in the existing literature regarding shades and blinds. For instance, solar radiation [61], building occupancy, illuminance, and glare [62] influence the adjustment of shades and blinds.
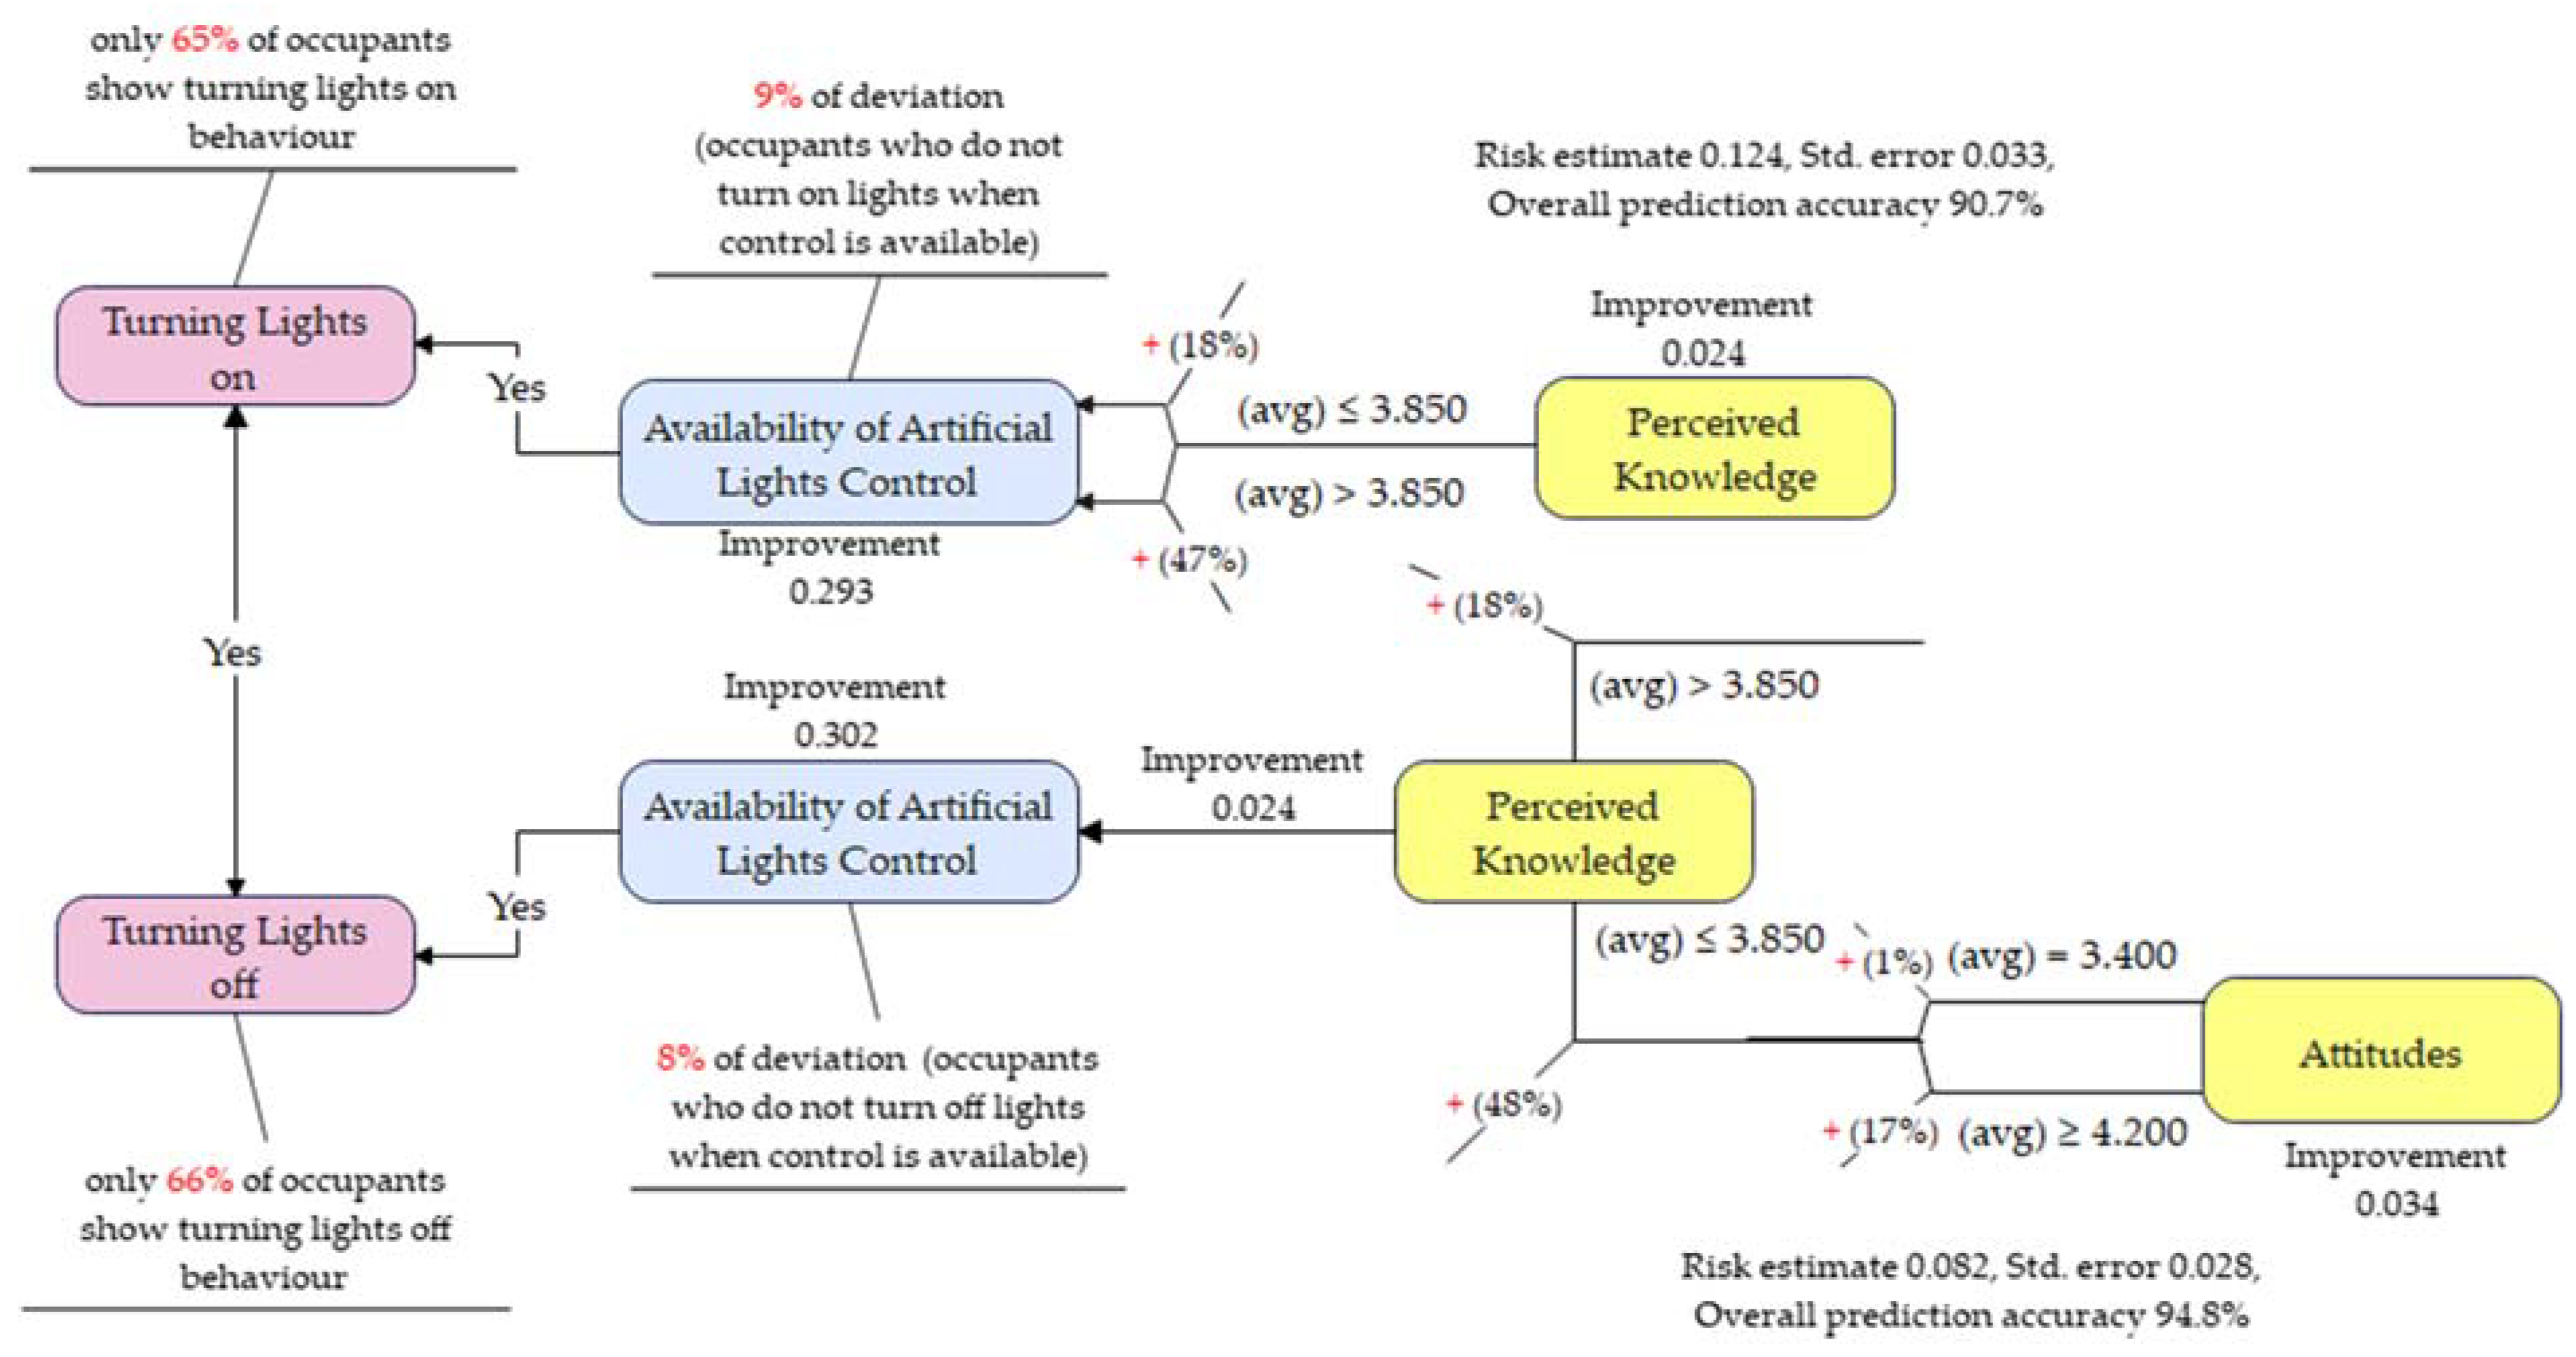
Figure 6 summarises the decision tree analysis results on occupants’ lighting behaviours. According to Figure 6, the lighting behaviour is relatively lower than the behaviours relating to windows, shades, and blinds. Overall, 65% of occupants turned lights on at their workplace, and 66% turned them off. The main predictors of these behaviours include the availability of artificial lighting control, while other factors are perceived knowledge and attitudes. According to the model, the occupants who use their energy-saving knowledge more turn on the artificial lights if the control is available, while the turning-on behaviour is expected but much lower when this knowledge is less. However, an inverse relationship between perceived knowledge was observed considering the turning off lights. The occupants with strong energy-saving attitudes but who utilise energy-saving knowledge less would turn off lights more if the control is available. Even though the risk estimates of turning lights on (12.5%) and turning lights off (8%) are lower, the models are counterintuitive. Bavaresco et al. highlighted the availability of lighting control as the main predictor of adjusting the lighting in the buildings [31]. Unlike the study by Bavaresco et al., our study highlights attitude as a contributing factor for turning off lights, not turning them on. However, more focus was given to the related environmental factors such as illuminance level [63] and time-related factors (i.e., upon arrival, upon leaving) [64], while our study highlighted the influence of social-psychological factors on occupants’ lighting behaviour, which was supported by [28]. Even an occupant with lower energy-saving knowledge may turn off the lights if the control is available, and a strong energy-saving attitude is also a factor. Furthermore, occupants’ strong perceived knowledge was reflected when 91% of lighting adjustments occurred soon after the occupants’ arrival and shortly before the occupants left [65].
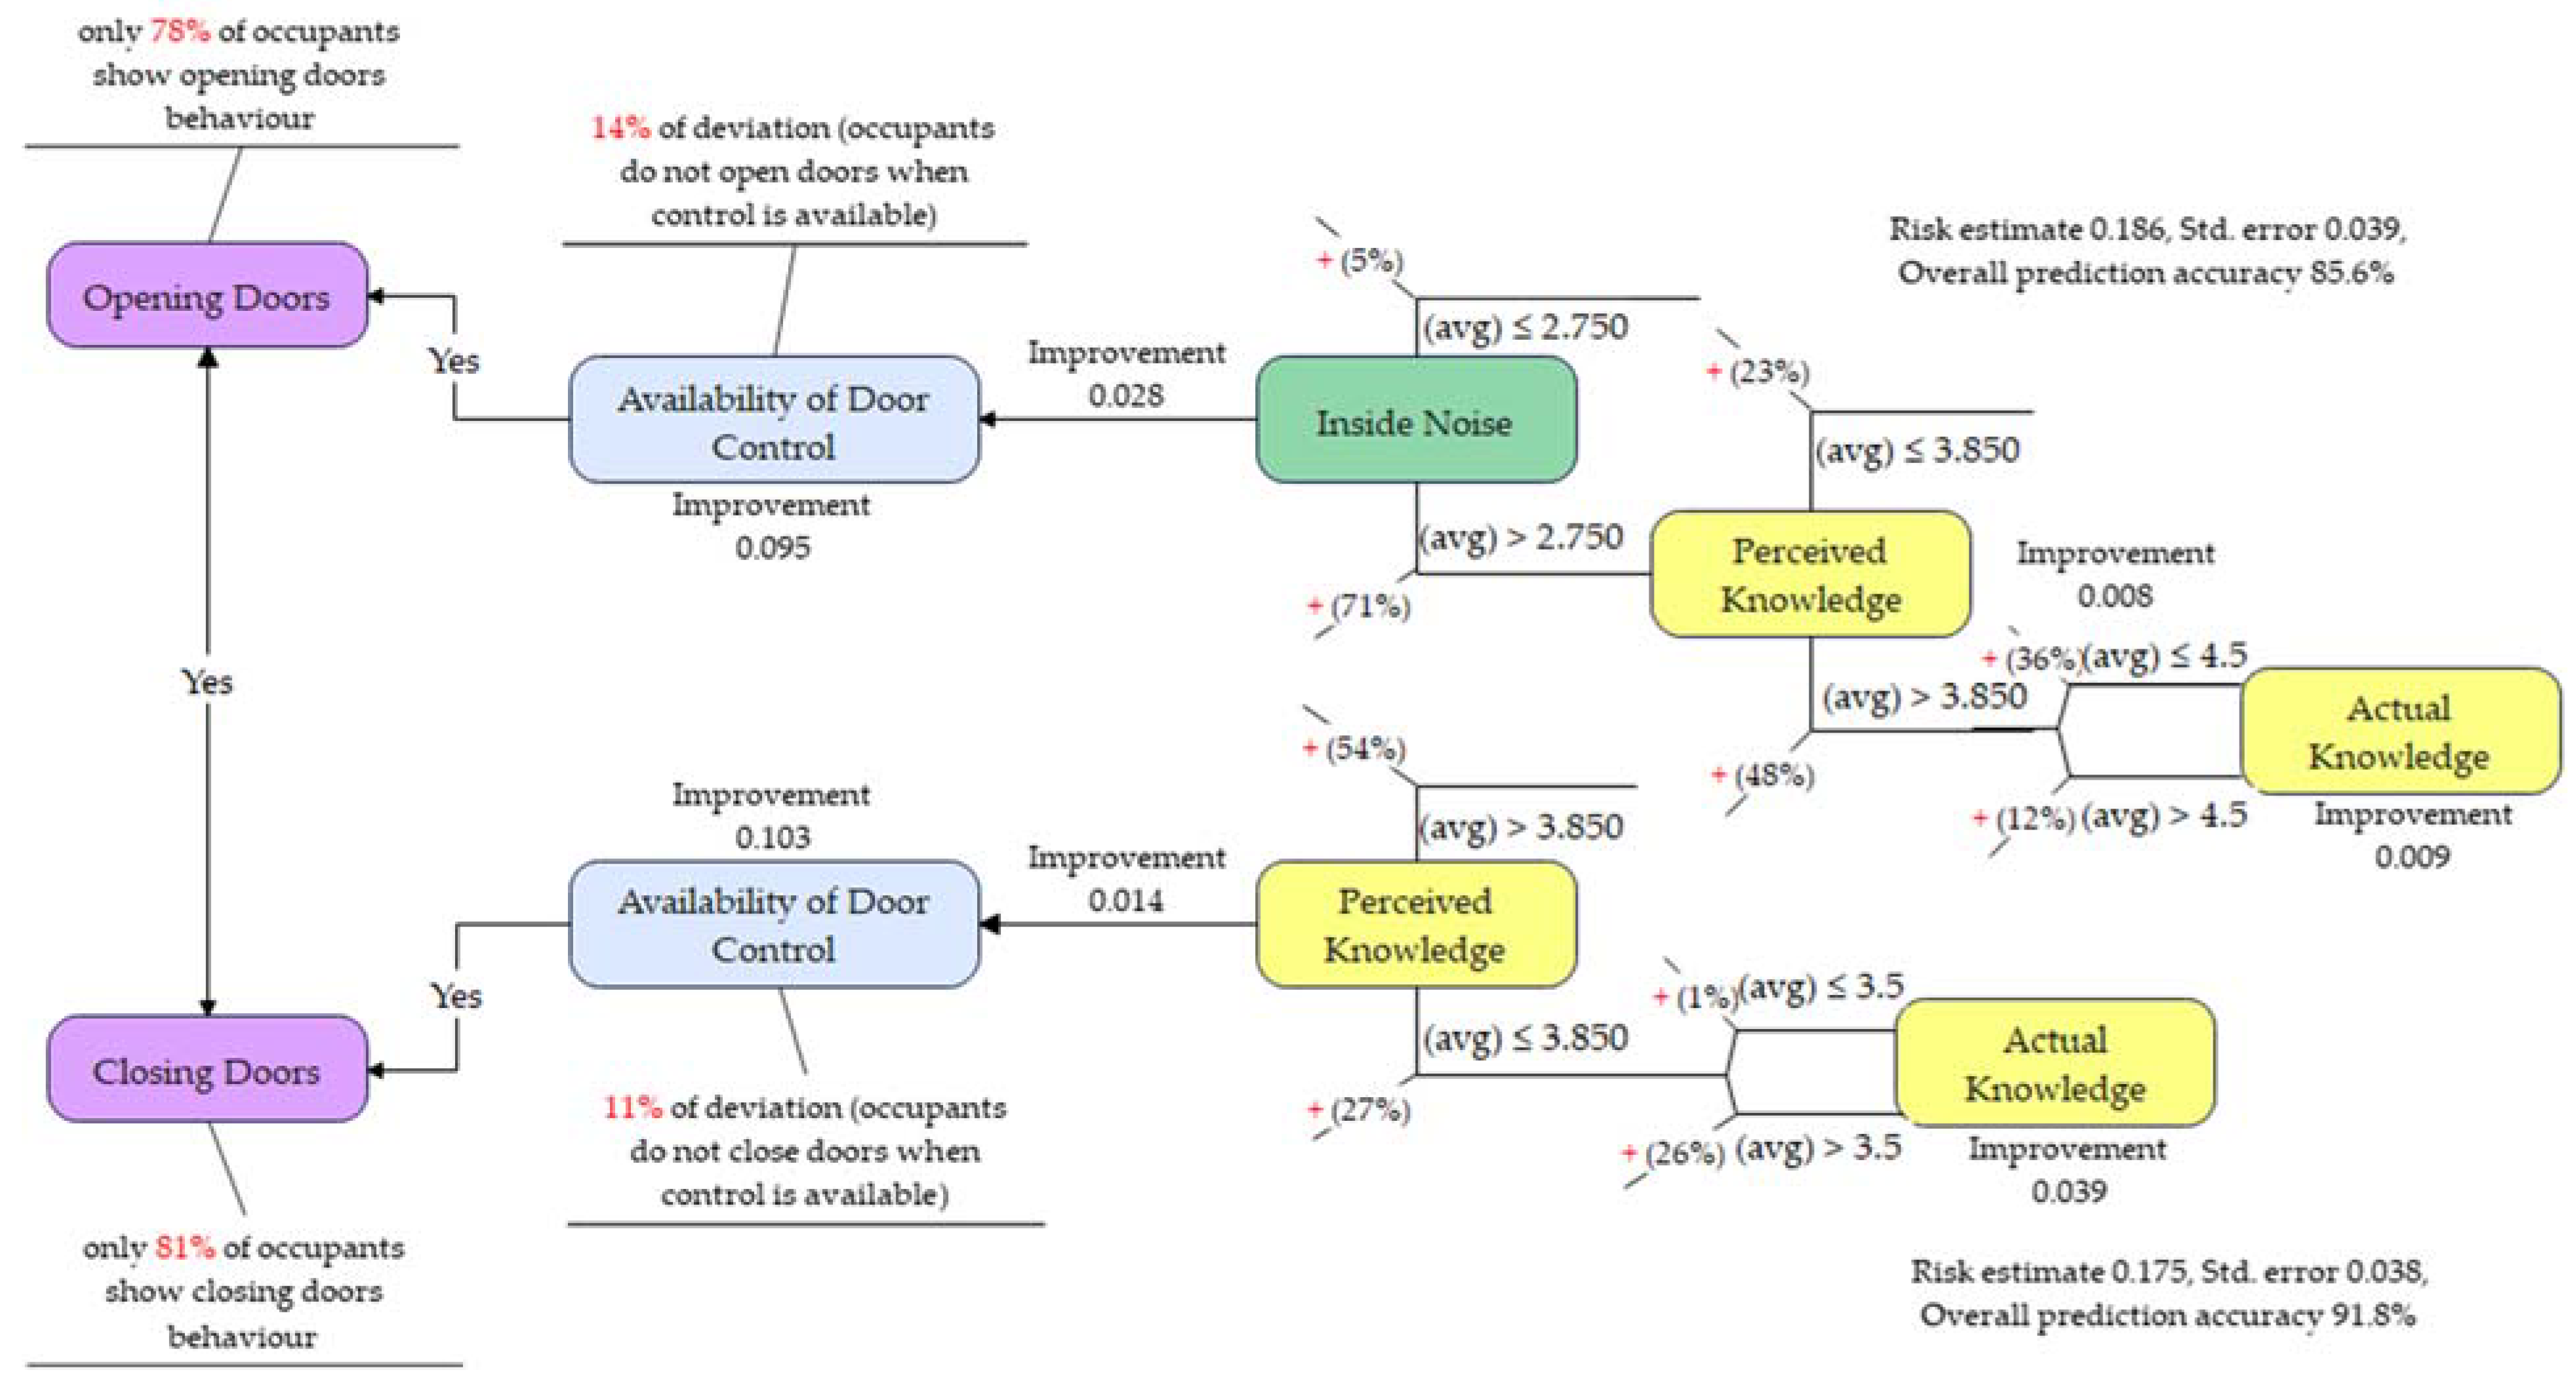
The decision tree models of the opening and closing doors are presented in Figure 7. As seen in Figure 7, 78% of occupants show opening doors behaviour, while 81% show closing behaviour. The control availability for the doors is the main predictor for both models. Other common predictors of both models are perceived knowledge and actual knowledge. However, opening doors depend on the inside noise level, and most opening occurs on the noisy side. This could be the noise inside their office space (i.e., single, shared, open-plan), from corridors, and the following office spaces. Most opening doors are also linked to occupants who use their energy-saving knowledge more and lack awareness of energy-saving benefits. The risk estimate of this model is 18.6%, with a prediction accuracy of 85.6%. Similarly, most closing actions occur when occupants use their energy-saving knowledge more. However, the closing can also occur when they do not use energy-saving knowledge much and have more awareness of energy-saving benefits. Such a model provides a prediction accuracy of 91.8% with a risk estimate of 17.5%. Our study is the first to evaluate the factors influencing the occupants’ door behaviour. Similarly, Deme Belafi et al. suggested that the adjustment of doors influences energy consumption [33]. For example, if occupants keep doors open in an air-conditioned space, that will fluctuate the indoor temperature, and more energy will be required to cool down the space. Future research can further evaluate this behaviour.
The fan adjustment behaviour of occupants was evaluated by considering ceiling fans and personal fans. Figure 8 illustrates the decision tree models for these two behaviours. As shown in Figure 8, only 4% of occupants adjust ceiling fans, as most of the 99 observations responded that the ceiling fans are not available in their workspace or have no control. The prediction accuracy of this model is 99%, with a 4.1% risk estimate. Availability of ceiling fan control is the main predictor, followed by behavioural interventions by the organisation. Regarding personal fans, the study observed that 45% of occupants adjust their personal fans, and the main predictor is the availability of personal fan control. Other predictors contributing to this behaviour are occupants’ actual knowledge, indoor temperature, gender, and the number of days at work per week. These predictors further indicate that occupants should be more aware of energy-saving benefits, perceive that the indoor temperature is uncomfortable, and work more than five days per week if they are a male. The model has a prediction accuracy of 88.7%; however, the risk estimate is 27.8%. He et al. identified that indoor or outdoor temperatures are the primary triggers of fan usage, and accordingly, numerous models were established to estimate fan use behaviour in buildings [66]. However, our study highlights the availability of fan control as the primary trigger and the indoor temperature as another essential factor. Other social-psychological factors: behavioural interventions and actual knowledge, and demographic factors: gender and no. of days at work per week, are also important considering the occupants’ fan behaviour. Behavioural interventions such as plug strips to turn off the power when the sensor does not detect any occupancy and sending emails to turn off equipment when unoccupied are often used to reduce plug load profiles, including fans [67].
Figure 9 indicates the decision tree model developed for thermostat/portable heaters adjustment behaviour. Similar to lighting and personal fan behaviour, thermostats and portable heaters show only 50% of occupants’ responses. Of the majority, the main predictor of adjusting the thermostat is the availability of thermostat control, while adjusting portable heaters occurs when the thermostat control is not available but the occupants can operate a portable heater. Gender is another predictor linked to the availability of control over portable heaters, and most females tend to adjust portable heaters. The prediction accuracy of this model is 84.5%, with a higher risk estimate of 33%. Our study aligns with the findings of Bavaresco et al., which identified the availability of thermostat control as the primary predictor. In another study, Park and Nagy introduced HVACLearn, an occupant-centric controller (OCC) for thermostats where occupants could express the thermal sensation as too cold or too hot [68]. Additionally, the same authors highlighted the influence of other factors, frequency of negotiation of control, knowledge to control, IEQ satisfaction, productivity beliefs, and the no. of hours spent in the office. On the other hand, our study highlights the influence of the availability of portable heater control and gender. Similarly, Sintov et al. examined the gender influence on interactions with thermostat adjustments [69]. Their results suggested that women report conflicts while men report agreements and compromises engaging in thermostat adjustments. However, both men and women will adjust a thermostat on a given day.
Figure 10 presents the decision tree analysis of another behaviour, the occupants’ computer adjustment behaviour. This behaviour evaluates whether occupants turn off the computers when they leave and put them into sleep mode when unattended for an extended period. The model shows that only 47% of respondents adjust their computers, and the main predictor of this behaviour is the occupants’ actual knowledge or awareness of energy-saving benefits. If the occupants have more knowledge of these energy-saving benefits, they tend to adjust the computers more. Other predictors of this behaviour are perceived ease/difficulty in saving energy, pressure from co-workers’ to save energy, and permanence/temporariness of the workspace. The model predicts the behaviour with an accuracy of 73.2%, and the estimated risk is 26.8%. Unlike our study, previous studies highlighted the influence of the behavioural intervention on occupants’ computer adjustment and related savings [70]. Another factor considered necessary was occupancy schedules Zhao et al., whereas Kwong et al. showed that plug load of computers after working hours contributes substantially to the energy demand [71]. However, our study highlighted how social-psychological factors primarily influence this behaviour, and the influence of actual knowledge, PBC, and subjective norms was supported by [28]. Research elsewhere supported that PBC and perceived substantial expectations from others about occupant energy-related behaviours increase energy-saving behaviours [72].
As shown in Figure 11, the occupants were evaluated for their behaviour of drinking cold and hot beverages at the workspace. Accordingly, 87% of occupants drink beverages during work. Decision tree analysis only provided the model for drinking hot beverages. According to this model, the main predictor is actual knowledge linked to other predictors, availability of personal fan control, and window control. The availability of window control is then linked with personal control, indoor air quality, and the permanence/temporariness of the workspace. The majority of behaviour occurs if occupants’ actual knowledge is high, the window control is available, indoor air quality is on the draughty side, and the occupants have been in the same workspace for more than a year or more. The model predicts the drinking hot beverages behaviour with an accuracy of 86.6%, and the risk estimate is considerably lower (11.5%). The previous research also has not evaluated this behaviour to a great extent. However, Day and Gunderson and Deme Belafi et al. emphasised the importance of including beverage-drinking behaviour in the office environment [33]. In a recent study, Rupp et al. explained the influence of indoor and outdoor air temperature, thermal sensation, and clothing insulation on beverage-drinking behaviour along with the other behaviours: windows, thermostats, portable fans, and clothing adjustments [73]. Therefore, our study adds a new set of factors influencing occupants’ hot/cold beverage-drinking behaviour.
The occupants reporting discomfort behaviour are illustrated in Figure 12. However, this behaviour has only an 18% response out of the total observations. Similarly, a low response was reported by Weerasinghe et al. (2022b) in their study of tertiary institutional offices [74]. The main predictor is the natural light, which is followed by the permanence/temporariness of the workspace. A majority showcase this behaviour when natural light is dark. However, some even report discomfort when the natural light is bright and they have been in the workspace for a year or more. The accuracy of this model is 87.6%, and the estimated risk is 19.6%. Although discomfort can be reported in any environmental conditions, a majority in our selected case study show this behaviour considering the natural light conditions in the workplace. Therefore, this behaviour depends on the building characteristics, IEQ satisfaction, and the occupants’ personal and physiological characteristics.
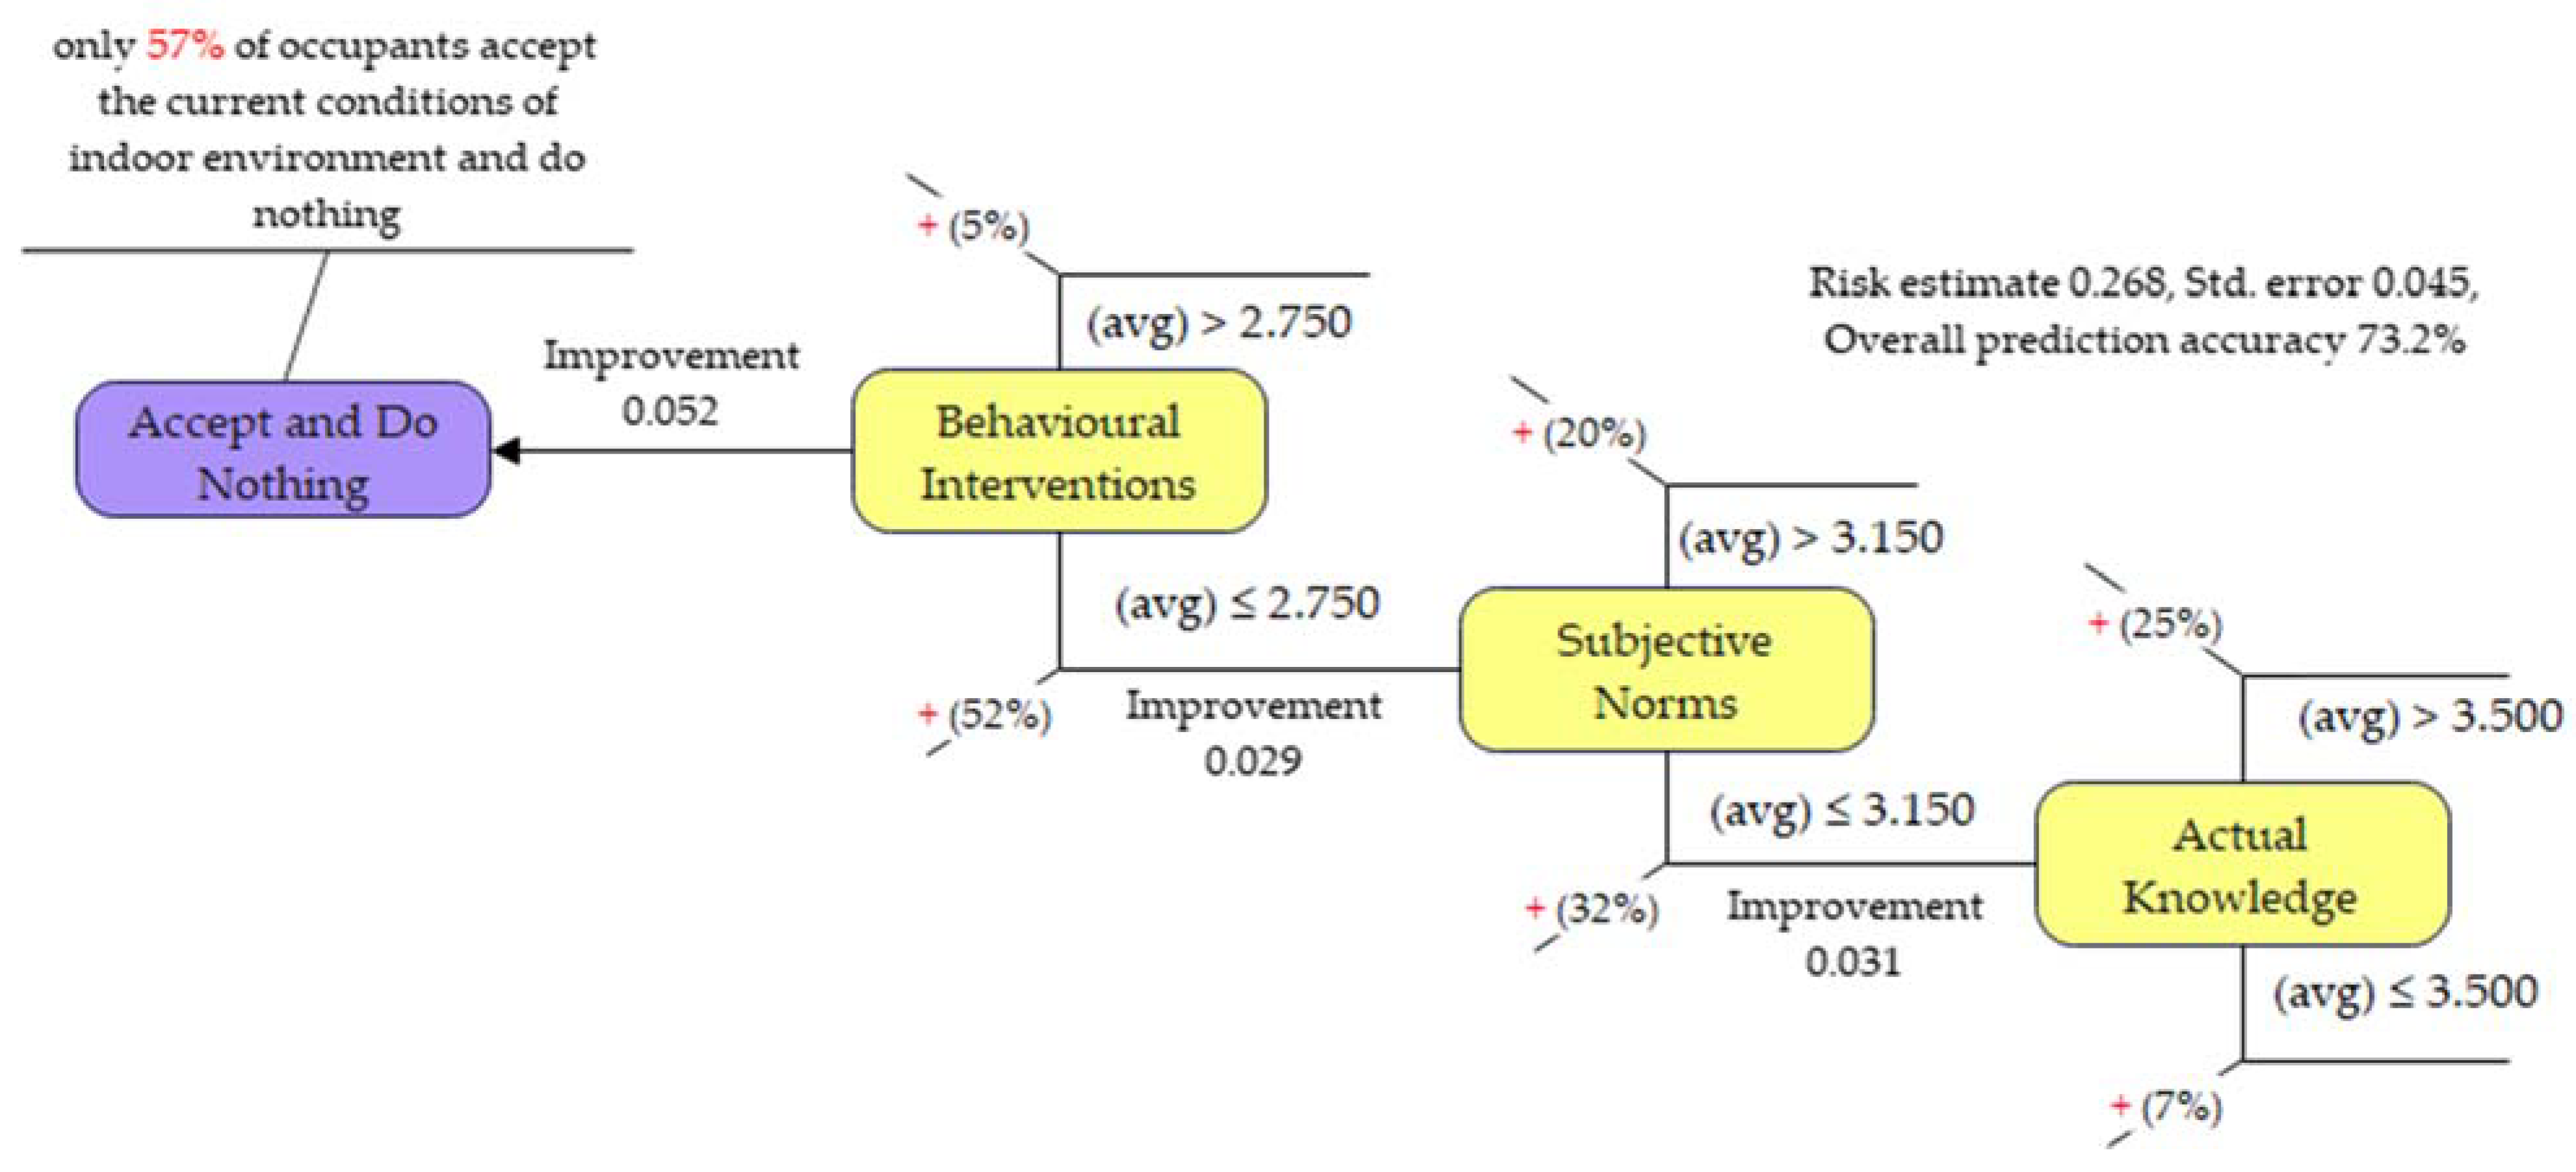
The last behaviour modelled by decision trees is accepting the workspace’s current condition and doing nothing. This behaviour was shown by 57% of occupants, where a majority was predicted when the behavioural interventions were lower, had lower pressure from the co-workers to save energy, and had high actual knowledge. The prediction accuracy is 73.2% with a risk estimate of 26.8%. Accordingly, most accept and do nothing about the existing conditions, while only a small percentage report discomfort. Looking at the influential factors, this behaviour depends on the occupants’ social-psychological drivers. In our scenario, the behavioural intervention to save energy from the organisation side is very low, and the occupants tend to accept whatever the conditions in the workspace. This is further influenced by when their co-workers give little attention to energy-saving. However, many occupants aware of energy-saving benefits tend to accept the existing environmental conditions.
Overall, our results suggested that the availability of control and the impacts of social-psychological factors are prominent in each behaviour, and the indoor environment-related and demographic factors are also impactful.
3.5. Excluded Behaviours from the Analysis
The study also considered two behaviours: adjusting clothing and moving through spaces. However, the analysis did not produce decision tree models for these two behaviours due to the inadequate number of nodes. The occupants who practised these two behaviours were 92% for adjusting clothing and 66% for moving through spaces. In the existing literature, the studies on clothing adjustment are somewhat limited compared to other occupant behaviours. In the recent past, von Grabe explained that the occupants are expected to adapt their clothing according to the seasonal climate [75]. Highlighting the influence of indoor temperature and local climate, Chen and Chang studied office buildings with poorly operated air conditioning and mechanical ventilation system in tropical climates [76]. The study exposed how long-term exposure to the hot and humid climate changes occupants’ thermal and clothing preferences. Further discussed, introducing a significant amount of cool air into the building might elevate the occupants’ clothing adjustments. Unlike the above studies, Mustapa et al. found that clothing adjustment was inversely related to the outdoor temperature in office buildings [77]. Therefore, this behaviour is not identical due to the influence of other characteristics. For instance, metabolic activity, gender, relative humidity, and air velocity are other factors highlighted in studies [78].
Additionally, occupant presence (i.e., where, when and by whom a building is occupied) often indicates occupants’ random walk patterns or moving from one space to another in buildings [79]. Similarly, moving through spaces was significantly motivated by occupants’ preference to take short breaks during work [80]. Therefore, it is not easy to estimate accurately. However, the researchers have produced occupancy models for accurate building simulations [81]. Studies suggested incorporating occupant schedules and thermal set points to improve the predictions. Moreover, Das et al. introduced occupancy presence and trajectory data captured by 3D Stereo Vision Cameras for occupant presence and behaviour modelling [81]. This dataset helps to explore the relationships between trajectory and indoor localisation problems related to the spatial design layouts of a building.
4. Conclusions
The current study evaluated the occupant decision-making behaviour of the New Zealand office building context, considering occupants’ perceived IEQ comfort, the availability of control, and the social-psychological impacts on occupant behaviours. The study investigated the influence of these factors on multiple occupant behaviours, including windows, doors, lighting, shades and blinds, fans, thermostats, computers, drinking beverages, adjusting clothing levels, and occupant presence through spaces, to identify the decision-making patterns of occupants. Amongst all behaviours, adjusting windows, doors, shades and blinds, and drinking beverages were mostly practised, while adjusting lighting, personal fans, thermostats/heaters, and computers were moderately practised by occupants. However, a considerably smaller number of occupants practised non-adaptive behaviours such as reporting discomfort and accepting and doing nothing about indoor environmental conditions. Although adjusting clothing and moving through spaces are practised by most occupants, the driving factors of these two behaviours were not revealed in the current study.
The study revealed perceived discomfort in temperature, air quality, and natural light while perceived comfort in artificial light and inside and outside noise. However, only the indoor temperature, indoor air quality, natural light, and inside noise parameters were highlighted as most influential towards decision-making on occupant behaviours. Furthermore, the direct relationship between the amount of control available on building appliances and systems and the individual occupant behaviours was identified and highlighted as the main predictor of most behaviours.
Considering the social-psychological factors, the occupants indicated the highest agreement on actual knowledge, accessibility to control, and perceived knowledge, while the lowest was on organisational support. Amongst the nine social-psychological factors considered in the study, actual knowledge and perceived knowledge were related to two or more behaviours, behavioural interventions and subjective norms to two behaviours, and organisational support, personal norms, attitudes, and PBC were linked to only one behaviour. Additionally, the demographic factors are also impactful, and such factors were gender, work duration within the building, no. of days at work per week, and permanence/temporariness of workspace.
The above findings enabled in the current study can enhance future occupant energy monitoring, modelling, and decision-making approaches. Knowing how complex the occupants’ decision-making will be on their behaviours will help building managers (i.e., facilities managers, energy managers) to use this sensitive information to enhance building energy performance and enable more energy feedback to the occupants to raise their awareness. Furthermore, it will be valuable for creating an intelligent environmental control system loop with eco-feedback and establishing occupant-centric buildings or features. Implications can also enhance the rating tools introduced by the International WELL Building Institute (IWBI) and the National Australian Built Environment Rating System (NABERSNZ) by taking in many complex variables and producing a simple score to inform occupants. The current study is limited to data collected from three selected buildings in one case study. Therefore, the energy culture and other characteristics of the selected case study could affect the occupant behaviours. Accordingly, further research is recommended with increased cases and analyses specific to the different buildings or their characteristics.
Author Contributions
Conceptualisation, A.S.W.; methodology, A.S.W. and J.O.B.R.; software, A.S.W.; writing—original draft preparation, A.S.W.; writing—review and editing, A.S.W., E.O.R. and J.O.B.R.; visualisation, A.S.W.; supervision, J.O.B.R. and E.O.R. All authors have read and agreed to the published version of the manuscript.
Funding
This research received no external funding.
Institutional Review Board Statement
The study was evaluated by peer review and judged low risk. The Ethics notification number for this project is 4000022597, and the low-risk notification is valid for three years, effective from May 2020.
Informed Consent Statement
Informed consent was obtained from all subjects involved in the study.
Data Availability Statement
The data presented in this study are available on request from the corresponding author. The data are not publicly available due to the research ethics policy of Massey University.
Acknowledgments
The authors highly acknowledge Massey University, New Zealand, for providing the Doctoral Scholarship. The authors would like to thank all participants who participated in this study.
Conflicts of Interest
The authors declare no conflict of interest.
Appendix A

Table A1.
Factors influencing window opening and closing.
| Source | Influential/Driving Factors | Type of Building | |||
|---|---|---|---|---|---|
| Office | Residential | Other | |||
| [33] | Deme Belafi et al. (2018) | Outdoor temperatures | School | ||
| Indoor air quality | |||||
| [59] | Park and Choi (2019) | Indoor and outdoor air temperature | ✓ | ||
| Indoor relative humidity | |||||
| CO2 concentration | |||||
| Season | |||||
| Occupancy | |||||
| Time of the day | |||||
Table A2.
Factors influencing lowering/lifting shading and blinds.
| Source | Influential/Driving Factors | Type of Building | |||
|---|---|---|---|---|---|
| Office | Residential | Other | |||
| [61] | Bavaresco and Ghisi (2018) | Solar radiation | ✓ | ||
| Building orientation | |||||
| [62] | Gunay et al. (2017) | Workplane illuminance | ✓ | ||
| Glare sensitivity | |||||
| Outdoor view | |||||
Table A3.
Factors influencing turning lighting on/off.
| Source | Influential/Driving Factors | Type of Building | |||
|---|---|---|---|---|---|
| Office | Residential | Other | |||
| [63] | Park et al. (2019) | Occupancy | ✓ | ||
| Workplace illuminance | |||||
| Lighting state | |||||
| [64] | Norouziasl et al. (2019) | Occupancy | ✓ | ||
| No. of occupants | |||||
Table A4.
Factors influencing use of plug-ins.
| Source | Plugins | Influential/Driving Factors | Type of Building | |||||
|---|---|---|---|---|---|---|---|---|
| Fans | Thermostat | Computers | Office | Residential | Other | |||
| [66] | He at al. (2019) | ✓ | Indoor and outdoor temperature | |||||
| [67] | Acker et al. (2012) | ✓ | ✓ | Behavioural intervention | ✓ | |||
| [68] | Park and Nagy (2020) | ✓ | Indoor air temperature | ✓ | ||||
| Occupancy | ||||||||
| Thermal vote | ||||||||
| [69] | Sintov et al. (2019) | ✓ | Gender | ✓ | ||||
| [70] | Zhao et al. (2014) | ✓ | ✓ | ✓ | Occupancy schedules | ✓ | ||
| [71] | Kwong et al. (2014) | ✓ | Working hours | ✓ | ||||
Table A5.
Factors influencing drinking hot/cold beverages.
| Source | Influential/Driving Factors | Type of Building | |||
|---|---|---|---|---|---|
| Office | Residential | Other | |||
| [73] | Rupp et al. (2021) | Indoor and outdoor air temperature | ✓ | ||
| Thermal sensation | |||||
| Clothing insulation | |||||
Table A6.
Factors influencing adjusting clothing.
| Source | Influential/Driving Factors | Type of Building | |||
|---|---|---|---|---|---|
| Office | Residential | Other | |||
| [75] | von Grabe (2020) | Thermal perception | ✓ | ||
| [76] | Chen and Chang (2012) | Indoor temperature | ✓ | ||
| Local climate | |||||
| [77] | Mustapa et al. (2016) | Outdoor air temperature | University | ||
| [78] | Schiavon and Lee (2013) | Outdoor air temperatures | ✓ | ||
| Relative humidity | |||||
| Indoor operative temperature | |||||
| Air velocity | |||||
| Metabolic activity | |||||
References
- Gaetani, I.; Hoes, P.-J.; Hensen, J.L.M. A stepwise approach for assessing the appropriate occupant behaviour modelling in building performance simulation. J. Build. Perform. Simul. 2020, 13, 362–377. [Google Scholar] [CrossRef]
- Santangelo, A.; Yan, D.; Feng, X.; Tondelli, S. Renovation strategies for the Italian public housing stock: Applying building energy simulation and occupant behaviour modelling to support decision-making process. Energy Build. 2018, 167, 269–280. [Google Scholar] [CrossRef]
- Yoshino, H.; Hong, T.; Nord, N. IEA EBC annex 53: Total energy use in buildings–Analysis and evaluation methods. Energy Build. 2017, 152, 124–136. [Google Scholar] [CrossRef] [Green Version]
- Jia, M.; Srinivasan, R.S.; Ries, R.; Weyer, N.; Bharathy, G. A systematic development and validation approach to a novel agent-based modeling of occupant behaviors in commercial buildings. Energy Build. 2019, 199, 352–367. [Google Scholar] [CrossRef]
- Lee, Y.S.; Malkawi, A.M. Simulating multiple occupant behaviors in buildings: An agent-based modelling approach. Energy Build. 2014, 69, 407–416. [Google Scholar] [CrossRef]
- Yan, D.; Hong, T.; Dong, B.; Mahdavi, A.; D’Oca, S.; Gaetani, I.; Feng, X. IEA EBC Annex 66: Definition and simulation of occupant behavior in buildings. Energy Build. 2017, 156, 258–270. [Google Scholar] [CrossRef] [Green Version]
- Carlucci, S.; De Simone, M.; Firth, S.K.; Kjærgaard, M.B.; Markovic, R.; Rahaman, M.S.; van Treeck, C. Modeling occupant behavior in buildings. Build. Environ. 2020, 174, 106768. [Google Scholar] [CrossRef]
- Yan, D.; O’Brien, W.; Hong, T.; Feng, X.; Burak Gunay, H.; Tahmasebi, F.; Mahdavi, A. Occupant behavior modeling for building performance simulation: Current state and future challenges. Energy Build. 2015, 107, 264–278. [Google Scholar] [CrossRef] [Green Version]
- Chen, J.; Taylor, J.E.; Wei, H.-H. Modeling building occupant network energy consumption decision-making: The interplay between network structure and conservation. Energy Build. 2012, 47, 515–524. [Google Scholar] [CrossRef]
- Franceschini, P.B.; Neves, L.O. A critical review on occupant behaviour modelling for building performance simulation of naturally ventilated school buildings and potential changes due to the COVID-19 pandemic. Energy Build. 2022, 258, 111831. [Google Scholar] [CrossRef]
- Hong, T.; Yan, D.; D’Oca, S.; Chen, C.F. Ten questions concerning occupant behavior in buildings: The big picture. Build. Environ. 2017, 114, 518–530. [Google Scholar] [CrossRef] [Green Version]
- Malik, J.; Mahdavi, A.; Azar, E.; Chandra Putra, H.; Berger, C.; Andrews, C.; Hong, T. Ten questions concerning agent-based modeling of occupant behavior for energy and environmental performance of buildings. Build. Environ. 2022, 217, 109016. [Google Scholar] [CrossRef]
- O’Brien, W.; Gaetani, I.; Carlucci, S.; Hoes, P.J.; Hensen, J.L.M. On occupant-centric building performance metrics. Build. Environ. 2017, 122, 373–385. [Google Scholar] [CrossRef]
- Amasyali, K.; El-Gohary, N.M. A review of data-driven building energy consumption prediction studies. Renew. Sustain. Energy Rev. 2018, 81, 1192–1205. [Google Scholar] [CrossRef]
- Dong, B.; Yan, D.; Li, Z.; Jin, Y.; Feng, X.; Fontenot, H. Modeling occupancy and behavior for better building design and operation—A critical review. Build. Simul. 2018, 11, 899–921. [Google Scholar] [CrossRef]
- Jia, M.; Srinivasan, R.S.; Raheem, A.A. From occupancy to occupant behavior: An analytical survey of data acquisition technologies, modeling methodologies and simulation coupling mechanisms for building energy efficiency. Renew. Sustain. Energy Rev. 2017, 68, 525–540. [Google Scholar] [CrossRef]
- Hong, T.; D’Oca, S.; Turner, W.J.N.; Taylor-Lange, S.C. An ontology to represent energy-related occupant behavior in buildings. Part I: Introduction to the DNAs framework. Build. Environ. 2015, 92, 764–777. [Google Scholar] [CrossRef] [Green Version]
- Hong, T.; D’Oca, S.; Taylor-Lange, S.C.; Turner, W.J.N.; Chen, Y.; Corgnati, S.P. An ontology to represent energy-related occupant behavior in buildings. Part II: Implementation of the DNAS framework using an XML schema. Build. Environ. 2015, 94, 196–205. [Google Scholar] [CrossRef] [Green Version]
- Cheung, T.; Graham, L.T.; Schiavon, S. Impacts of life satisfaction, job satisfaction and the Big Five personality traits on satisfaction with the indoor environment. Build. Environ. 2022, 212, 108783. [Google Scholar] [CrossRef]
- De Vecchi, R.; Candido, C.; de Dear, R.; Lamberts, R. Thermal comfort in office buildings: Findings from a field study in mixed-mode and fully-air conditioning environments under humid subtropical conditions. Build. Environ. 2017, 123, 672–683. [Google Scholar] [CrossRef]
- Yang, R.; Wang, L. Development of multi-agent system for building energy and comfort management based on occupant behaviors. Energy Build. 2013, 56, 1–7. [Google Scholar] [CrossRef]
- Heydarian, A.; McIlvennie, C.; Arpan, L.; Yousefi, S.; Syndicus, M.; Schweiker, M.; Mahdavi, A. What drives our behaviors in buildings? A review on occupant interactions with building systems from the lens of behavioral theories. Build. Environ. 2020, 179, 106928. [Google Scholar] [CrossRef]
- Yun, G.Y.; Steemers, K.; Baker, N. Natural ventilation in practice: Linking facade design, thermal performance, occupant perception and control. Build. Res. Inf. 2018, 36, 608–624. [Google Scholar] [CrossRef]
- Schakib-Ekbatan, K.; Çakici, F.Z.; Schweiker, M.; Wagner, A. Does the occupant behavior match the energy concept of the building? Analysis of a German naturally ventilated office building. Build. Environ. 2015, 84, 142–150. [Google Scholar] [CrossRef]
- Schweiker, M.; Carlucci, S.; Andersen, R.K.; Dong, B.; O’Brien, W. Occupancy and Occupants’ Actions. In Exploring Occupant Behavior in Buildings: Methods and Challenges; Wagner, A., O’Brien, W., Dong, B., Eds.; Springer Cham: New York, NY, USA, 2018; pp. 7–38. [Google Scholar]
- Day, J.K.; McIlvennie, C.; Brackley, C.; Tarantini, M.; Piselli, C.; Hahn, J.; Pisello, A.L. A review of select human-building interfaces and their relationship to human behavior, energy use and occupant comfort. Build. Environ. 2020, 178, 106920. [Google Scholar] [CrossRef]
- Weerasinghe, A.S.; Rasheed, E.O.; Rotimi, J.O.B. A facilities management approach to rationalising occupants’ energy behaviours. Facilities 2022, 40, 774–792. [Google Scholar] [CrossRef]
- Li, D.; Xu, X.; Chen, C.-f.; Menassa, C. Understanding energy-saving behaviors in the American workplace: A unified theory of motivation, opportunity, and ability. Energy Res. Soc. Sci. 2019, 51, 198–209. [Google Scholar] [CrossRef]
- Vellei, M.; Natarajan, S.; Biri, B.; Padget, J.; Walker, I. The effect of real-time context-aware feedback on occupants’ heating behaviour and thermal adaptation. Energy Build. 2016, 123, 179–191. [Google Scholar] [CrossRef] [Green Version]
- Ozcelik, G.; Becerik-Gerber, B.; Chugh, R. Understanding human-building interactions under multimodal discomfort. Build. Environ. 2019, 151, 280–290. [Google Scholar] [CrossRef]
- Bavaresco, M.V.; Ghisi, E.; D’Oca, S.; Pisello, A.L. Triggering occupant behaviour for energy sustainability: Exploring subjective and comfort-related drivers in Brazilian offices. Energy Res. Soc. Sci. 2021, 74, 101959. [Google Scholar] [CrossRef]
- Bavaresco, M.V.; D’Oca, S.; Ghisi, E.; Pisello, A.L. Assessing underlying effects on the choices of adaptive behaviours in offices through an interdisciplinary framework. Build. Environ. 2020, 181, 107086. [Google Scholar] [CrossRef]
- Deme Belafi, Z.; Naspi, F.; Arnesano, M.; Reith, A.; Revel, G.M. Investigation on window opening and closing behavior in schools through measurements and surveys: A case study in Budapest. Build. Environ. 2018, 143, 523–531. [Google Scholar] [CrossRef]
- Chen, C.f.; Xu, X.; Day, J.K. Thermal comfort or money saving? Exploring intentions to conserve energy among low-income households in the United States. Energy Res. Soc. Sci. 2017, 26, 61–71. [Google Scholar] [CrossRef]
- Gao, L.; Wang, S.; Li, J.; Li, H. Application of the extended theory of planned behavior to understand individual’s energy saving behavior in workplaces. Resour. Conserv. Recycl. 2017, 127, 107–113. [Google Scholar] [CrossRef]
- Obaidellah, U.H.; Danaee, M.; Mamun, M.A.A.; Hasanuzzaman, M.; Rahim, N.A. An application of TPB constructs on energy-saving behavioural intention among university office building occupants: A pilot study in Malaysian tropical climate. J. Hous. Built Environ. 2019, 34, 533–569. [Google Scholar] [CrossRef]
- Fu, W.; Zhou, Y.; Li, L.; Yang, R. Understanding household electricity-saving behavior: Exploring the effects of perception and cognition factors. Sustain. Prod. Consum. 2021, 28, 116–128. [Google Scholar] [CrossRef]
- Rissetto, R.; Rambow, R.; Schweiker, M. Assessing comfort in the workplace: A unified theory of behavioral and thermal expectations. Build. Environ. 2022, 216, 109015. [Google Scholar] [CrossRef]
- Cornelius, M.; Armel, K.C.; Hoffman, K.; Allen, L.; Bryson, S.W.; Desai, M.; Robinson, T.N. Increasing energy- and greenhouse gas-saving behaviors among adolescents: A school-based cluster-randomised controlled trial. Energy Effic. 2014, 7, 217–242. [Google Scholar] [CrossRef]
- Deme Bélafi, Z.; Reith, A. Interdisciplinary survey to investigate energy-related occupant behavior in offices-The Hungarian case. Pollack Period. 2018, 13, 41–52. [Google Scholar] [CrossRef]
- Li, D.; Menassa, C.C.; Karatas, A. Energy use behaviors in buildings: Towards an integrated conceptual framework. Energy Res. Soc. Sci. 2017, 23, 97–112. [Google Scholar] [CrossRef] [Green Version]
- Xu, X.; Maki, A.; Chen, C.-f.; Dong, B.; Day, J.K. Investigating willingness to save energy and communication about energy use in the American workplace with the attitude-behavior-context model. Energy Res. Soc. Sci. 2017, 32, 13–22. [Google Scholar] [CrossRef]
- Mills, A.J.; Durepos, G.; Wiebe, E. Encyclopedia of Case Study Research; SAGE Publications Inc.: Thousand Oaks, CA, USA, 2010; pp. 124–126. [Google Scholar]
- Du, J.; Pan, W. Examining energy saving behaviors in student dormitories using an expanded theory of planned behavior. Habitat Int. 2021, 107, 102308. [Google Scholar] [CrossRef]
- Fabi, V.; Andersen, R.V.; Corgnati, S.; Olesen, B.W. Occupants’ window opening behaviour: A literature review of factors influencing occupant behaviour and models. Build. Environ. 2012, 58, 188–198. [Google Scholar] [CrossRef]
- O’Brien, W.; Gunay, H.B. The contextual factors contributing to occupants’ adaptive comfort behaviors in offices–A review and proposed modeling framework. Build. Environ. 2014, 77, 77–87. [Google Scholar] [CrossRef]
- D’Oca, S.; Chen, C.F.; Hong, T.; Belafi, Z. Synthesising building physics with social psychology: An interdisciplinary framework for context and occupant behavior in office buildings. Energy Res. Soc. Sci. 2017, 34, 240–251. [Google Scholar] [CrossRef] [Green Version]
- Asadi, I.; Mahyuddin, N.; Shafigh, P. A review on indoor environmental quality (IEQ) and energy consumption in building based on occupant behavior. Facilities 2017, 35, 684–695. [Google Scholar] [CrossRef]
- Cronbach, L.J. Coefficient alpha and the internal structure of tests. Psychometrika 1951, 16, 297–334. [Google Scholar] [CrossRef] [Green Version]
- Boone, H.N.; Boone, D.A. Analysing Likert Data. J. Ext. 2012, 50, 1–5. [Google Scholar]
- Lu, H.; Ma, X. Hybrid decision tree-based machine learning models for short-term water quality prediction. Chemosphere 2020, 249, 126169. [Google Scholar] [CrossRef]
- Rizvi, S.; Rienties, B.; Khoja, S.A. The role of demographics in online learning; A decision tree based approach. Comput. Educ. 2019, 137, 32–47. [Google Scholar] [CrossRef]
- Han, J.; Kamber, M.; Pei, J. Classification: Basic Concepts. In Data Mining, 3rd ed.; Morgan Kaufmann: Waltham, MA, USA, 2012; pp. 327–391. [Google Scholar]
- Ryu, S.H.; Moon, H.J. Development of an occupancy prediction model using indoor environmental data based on machine learning techniques. Build. Environ. 2016, 107, 1–9. [Google Scholar] [CrossRef]
- Farrelly, C.M. Deep vs. Diverse Architectures for Classification Problems. arXiv 2017. [Google Scholar] [CrossRef]
- Shao, Y.; Lunetta, R.S. Comparison of support vector machine, neural network, and CART algorithms for the land-cover classification using limited training data points. ISPRS J. Photogramm. Remote Sens. 2012, 70, 78–87. [Google Scholar] [CrossRef]
- Kim, Y.S. Comparison of the decision tree, artificial neural network, and linear regression methods based on the number and types of independent variables and sample size. Expert Syst. Appl. 2008, 34, 1227–1234. [Google Scholar] [CrossRef]
- Khalifa, R.M.; Yacout, S.; Bassetto, S. Developing machine-learning regression model with Logical Analysis of Data (LAD). Comput. Ind. Eng. 2021, 151, 106947. [Google Scholar] [CrossRef]
- Park, J.; Choi, C.S. Modeling occupant behavior of the manual control of windows in residential buildings. Indoor Air 2019, 29, 242–251. [Google Scholar] [CrossRef]
- Zhang, Y.; Wang, Z.; Zhou, G. Antecedents of employee electricity saving behavior in organisations: An empirical study based on norm activation model. Energy Policy 2013, 62, 1120–1127. [Google Scholar] [CrossRef]
- Bavaresco, M.V.; Ghisi, E. Influence of user interaction with internal blinds on the energy efficiency of office buildings. Energy Build. 2018, 166, 538–549. [Google Scholar] [CrossRef]
- Gunay, H.B.; O’Brien, W.; Beausoleil-Morrison, I.; Gilani, S. Development and implementation of an adaptive lighting and blinds control algorithm. Build. Environ. 2017, 113, 185–199. [Google Scholar] [CrossRef]
- Park, J.Y.; Dougherty, T.; Fritz, H.; Nagy, Z. LightLearn: An adaptive and occupant centered controller for lighting based on reinforcement learning. Build. Environ. 2019, 147, 397–414. [Google Scholar] [CrossRef]
- Norouziasl, S.; Jafari, A.; Wang, C. Analysis of lighting occupancy sensor installation in building renovation using agent-based modeling of occupant behavior. In Proceedings of the ASCE International Conference on Computing in Civil Engineering 2019, Atlanta, GA, USA, 17–19 June 2019. [Google Scholar]
- Yao, J. Determining the energy performance of manually controlled solar shades: A stochastic model based co-simulation analysis. Appl. Energy 2014, 127, 64–80. [Google Scholar] [CrossRef]
- He, Y.; Chen, W.; Wang, Z.; Zhang, H. Review of fan-use rates in field studies and their effects on thermal comfort, energy conservation, and human productivity. Energy Build. 2019, 194, 140–162. [Google Scholar] [CrossRef] [Green Version]
- Acker, B.; Duarte, C.; Van Den Wymelenberg, K. Office space plug load profiles and energy saving interventions. In Proceedings of the ACEEE 2012 Summer Study on Energy Efficiency in Buildings-Fueling our future with efficiency, Pacific Grove, CA, USA, 12–17 August 2012. [Google Scholar]
- Park, J.Y.; Nagy, Z. HVACLearn: A reinforcement learning based occupant-centric control for thermostat set-points. In Proceedings of the 11th ACM International Conference on Future Energy Systems, Virtual, 22–26 June 2020. [Google Scholar]
- Sintov, N.D.; White, L.V.; Walpole, H. Thermostat wars? The roles of gender and thermal comfort negotiations in household energy use behavior. PLoS ONE 2019, 14, e0224198. [Google Scholar] [CrossRef] [Green Version]
- Zhao, J.; Lasternas, B.; Lam, K.P.; Yun, R.; Loftness, V. Occupant behavior and schedule modeling for building energy simulation through office appliance power consumption data mining. Energy Build. 2014, 82, 341–355. [Google Scholar] [CrossRef]
- Kwong, Q.J.; Goh, S.H.; Adam, N.M.; Raghavan, V.R. A study on energy efficiency improvement opportunities for plug loads in buildings in the equatorial region. Energy Procedia 2014, 56, 621–633. [Google Scholar] [CrossRef] [Green Version]
- Xie, C.; Ding, H.; Zhang, H.; Yuan, J.; Su, S.; Tang, M. Exploring the psychological mechanism underlying the relationship between organisational interventions and employees’ energy-saving behaviors. Energy Policy 2021, 156, 112411. [Google Scholar] [CrossRef]
- Rupp, R.F.; Andersen, R.K.; Toftum, J.; Ghisi, E. Occupant behaviour in mixed-mode office buildings in a subtropical climate: Beyond typical models of adaptive actions. Build. Environ. 2021, 190, 107541. [Google Scholar] [CrossRef]
- Weerasinghe, A.S.; Rasheed, E.O.; Rotimi, J.O.B. Environmental and socio-psychological drivers of building users’ behaviours: A case study of tertiary institutional offices in Auckland. J. Facil. Manag. 2022. ahead-of-print. [Google Scholar] [CrossRef]
- von Grabe, J. Using the Instance-Based Learning Paradigm to Model Energy-Relevant Occupant Behaviors in Buildings. Cogn. Comput. 2020, 12, 71–99. [Google Scholar] [CrossRef]
- Chen, A.; Chang, W. Human health and thermal comfort of office workers in Singapore. Build. Environ. 2012, 58, 172–178. [Google Scholar] [CrossRef]
- Mustapa, M.S.; Zaki, S.A.; Rijal, H.B.; Hagishima, A.; Sukri, M.; Ali, M. Thermal comfort and occupant adaptive behaviour in Japanese university buildings with free running and cooling mode offices during summer. Build. Environ. 2016, 105, 332–342. [Google Scholar] [CrossRef]
- Schiavon, S.; Lee, K.H. Dynamic predictive clothing insulation models based on outdoor air and indoor operative temperatures. Build. Environ. 2013, 59, 250–260. [Google Scholar] [CrossRef] [Green Version]
- Ahn, K.-U.; Kim, D.-W.; Park, C.-S.; de Wilde, P. Predictability of occupant presence and performance gap in building energy simulation. Appl. Energy 2017, 208, 1639–1652. [Google Scholar] [CrossRef]
- Weerasinghe, A.S.; Rasheed, E.O.; Rotimi, J.O.B. Self-rated Motivational Drivers for Occupant Behaviours: A Case Study of Tertiary Office Buildings. In Proceedings of the 45th Australasian Universities Building Education Association (AUBEA) Conference, Sydney, Australia, 23–25 November 2022. [Google Scholar]
- Das, A.; Schwee, J.H.; Kolvig-Raun, E.S.; Kjærgaard, M.B. Dataset: Occupancy presence and trajectory data from an instrumented public building. In Proceedings of the DATA 2019-Proceedings of the 2nd ACM Workshop on Data Acquisition To Analysis, Part of SenSys 2019, New York, NY, USA, 10 November 2019. [Google Scholar]
Figure 1.
Conceptualising the drivers of occupant behaviours.

Figure 2.
Perceived comfort in temperature, air quality, lighting, and noise.

Figure 3.
Availability of user control in building systems and equipment.

Figure 4.
The decision-making path diagram of occupants’ window behaviours.

Figure 5.
The decision-making path diagram of occupants’ shades and blinds behaviours.

Figure 6.
The decision-making path diagram of occupants’ lighting behaviours.

Figure 7.
The decision-making path diagram of occupants’ doors behaviours.

Figure 8.
The decision-making path diagram of occupants’ fan behaviours.

Figure 9.
The decision-making path diagram of occupants’ thermostat/portable heater behaviours.

Figure 10.
The decision-making path diagram of occupants’ computer behaviours.

Figure 11.
The decision-making path diagram of occupants’ drinking beverage behaviours.

Figure 12.
The decision-making path diagram of occupants’ reporting discomforts behaviours.

Figure 13.
The decision-making path diagram of occupants’ accept and do nothing behaviours.

Table 1.
Profile of Buildings.
| Building Characteristics | Building A | Building B | Building C | ||||
|---|---|---|---|---|---|---|---|
| C1 | C2 | C3 | C4 | ||||
| Environmental factors | Year of completion | 1971 | 1974 | 1968 | 1968 | 1968 | 1981 |
| Life cycle (years) | 80 | ||||||
| Site/Location | Palmerston North | ||||||
| Outdoor temperature (avg.) | 9–18 °C | ||||||
| Indoor temperature | Variable | ||||||
| Wind velocity | 7 m/s | ||||||
| RH | 80% | ||||||
| Building factors | Size (UFA, GFA) | 5590 m² UFA 6285 m² GFA | 4074 m² UFA 4496 m² GFA | 3671 m² UFA 4088 m² GFA | 3631 m² UFA 4041 m² GFA | 4543 m² UFA 4982 m² GFA | 4547 m² UFA 4969 m² GFA |
| No. of floors | 8 useable floors + basement and roof plant | 5 useable floors and roof plant | 4 useable floors and roof plant | 4 useable floors and roof plant | 5 useable floors and roof plant | 5 useable floors and roof plant | |
| Storey height (m) (avg) | 3.350 m | 3.658 m | 3.658 m | 3.658 m | 3.658 m | 3.658 m | |
| Building height (m) | 27.356 m | 18.29 m | 18.59 m | 18.59 m | 22.24 m | 22.24 m | |
| Shape | Rectangular | Square | |||||
| Building orientation | NW | NE | |||||
| Glazing type | Single | ||||||
| Glazing orientation | N, S, E, W | ||||||
| Air conditioning (AC) system | Some Split AC | ||||||
| Ventilation type | Mixed mode | ||||||
| Heating system/appliances | Shared Boiler with Radiators/FCU | Shared Boiler with convectors/AHU/FCU | |||||
| Office type | Open plan, shared and single offices, and meeting rooms | Open plan, shared and single offices, meeting and consulting rooms | Single offices, meeting rooms, and teaching/research labs | ||||
| Social factors | No. of occupants (dedicated office spaces) | 321 | 198 | 137 | 172 | 174 | 256 |
| Energy feedback | Nil | ||||||
| Time factors | Equipment use schedules | Yes. Ventilation and heating | |||||
| Air changes per hour | Variable | ||||||
| Switch on times and events | 7 a.m. to 5 p.m. | 6.30 a.m. to 6 p.m. | |||||
Table 2.
Demographics of the Participants.
| Demographic | Count | Percentage (%) | |
|---|---|---|---|
| Gender | Male | 52 | 53% |
| Female | 47 | 47% | |
| Ethnicity | NZ European | 69 | 70% |
| Asian | 10 | 10% | |
| Māori or Pacific | 3 | 3% | |
| Other | 17 | 17% | |
| Age | 30 or older | 92 | 93% |
| Under 30 | 7 | 7% | |
| Office Type | Single | 53 | 54% |
| Shared | 33 | 33% | |
| Open-plan | 13 | 13% | |
| Work Duration in the Building | A year or more | 76 | 77% |
| Less than a year | 22 | 22% | |
| Work Duration Present Workspace | A year or more | 66 | 67% |
| Less than a year | 32 | 32% | |
| Days of Work | 5 days or more | 51 | 52% |
| Less than 5 days | 47 | 47% | |
Table 3.
Mean and SD of each social-psychological aspect relating to the occupant behaviours.
| Factor | Description | Mean | SD |
|---|---|---|---|
| Actual knowledge | Awareness of energy-saving benefits | 3.979 | 0.964 |
| Accessibility to control | Individual’s degree of actual controllability over building systems | 3.953 | 0.850 |
| Perceived knowledge | Use of knowledge on energy-saving | 3.942 | 0.985 |
| Attitude | Energy-saving attitudes | 3.872 | 0.901 |
| Personal norms | Responsibility/obligation to save energy | 3.563 | 0.984 |
| Perceived behavioural control (PBC) | Perceived ease/difficulty in saving energy | 3.160 | 1.168 |
| Subjective norms | Co-workers’ expectations of their peers saving energy and sharing control with co-workers | 2.678 | 1.133 |
| Organisational support | Organisation encouragement in saving energy and rewarding for savings | 1.932 | 1.121 |
| Behavioural interventions | Organisation or the building managers providing energy feedback to occupants | 1.899 | 1.255 |
Disclaimer/Publisher’s Note: The statements, opinions and data contained in all publications are solely those of the individual author(s) and contributor(s) and not of MDPI and/or the editor(s). MDPI and/or the editor(s) disclaim responsibility for any injury to people or property resulting from any ideas, methods, instructions or products referred to in the content. |
© 2023 by the authors. Licensee MDPI, Basel, Switzerland. This article is an open access article distributed under the terms and conditions of the Creative Commons Attribution (CC BY) license (https://creativecommons.org/licenses/by/4.0/).
Share and Cite
MDPI and ACS Style
Weerasinghe, A.S.; Rasheed, E.O.; Rotimi, J.O.B. Occupants’ Decision-Making of Their Energy Behaviours in Office Environments: A Case of New Zealand. Sustainability 2023, 15, 2305. https://0-doi-org.brum.beds.ac.uk/10.3390/su15032305
AMA Style
Weerasinghe AS, Rasheed EO, Rotimi JOB. Occupants’ Decision-Making of Their Energy Behaviours in Office Environments: A Case of New Zealand. Sustainability. 2023; 15(3):2305. https://0-doi-org.brum.beds.ac.uk/10.3390/su15032305
Chicago/Turabian StyleWeerasinghe, Achini Shanika, Eziaku Onyeizu Rasheed, and James Olabode Bamidele Rotimi. 2023. "Occupants’ Decision-Making of Their Energy Behaviours in Office Environments: A Case of New Zealand" Sustainability 15, no. 3: 2305. https://0-doi-org.brum.beds.ac.uk/10.3390/su15032305
Note that from the first issue of 2016, this journal uses article numbers instead of page numbers. See further details here.