1. Introduction
Agriculture represents a very important sector of the Romanian economy, which was confronted with a severe crisis in 2022, induced by the Ukraine war blockages, generating significant increases in the price of fuels, fertilizers and medicines for plants and aggravated by the severe pedological drought and high temperatures. In the context of climatic changes and of a tense geopolitical situation, securing the food supply for the population has become of outmost importance. The Strategic National Plan for the 2023–2027 period envisions enhancing Romanian farmers’ resilience and competitiveness to ensure food security. This goal can be achieved only through investments, made available for the majority of potential beneficiaries (associated in cooperative companies or groups of producers) which jointly use the fixed assets, under a previously established schedule, ensuring a full and efficient use of those assets and a proper amortization of the initial investment.
Collective investments have been implemented, providing higher value-added, integrated production and processing chains and quality products at accessible prices for the final consumers.
The agricultural sector is confronted with a series of economic, environmental and social challenges, and a possible solution to overcome these challenges is the increase in resilience, an objective supported by the European Union through its specific policies [
1]. The predictability of agriculture revenues is affected by the Ukraine war and by the exaggerated increase in energy, fuel, fertilizers and plants protection products’ costs, as well as by the unfavorable climate and environmental conditions, which call for better instruments for managing the catastrophic and other specific agricultural risks. At the same time, this calls for improving the European legislation regarding modern amelioration techniques to have plants with a better drought and heat tolerance and improved resistance to specific bio-pests, which appear only in some EU regions or states, and providing efficient alternatives in terms of the price-quality ratio prior to forbidding the substances which were used previously and bypassed the rigors of EU regulations. Resilience in agriculture also encompasses preparing farmers to deal with external shocks by securing their minimal living standards and capacity to cultivate plants [
2]. Some of these shocks can be predictable whilst some are not, and they can manifest in the short or long term, whereas governments have an essential role in providing a favorable environment for continuing and developing agricultural activity [
3]. In this context of mitigating the risks generated by natural hazards, an ex ante approach is recommended, which prevents and limits the effects of disasters [
4].
Increased poverty leads many consumers to buy the cheapest, lower quality products, which somehow contradicts the declarations of European leaders. To avoid double standards, an equal treatment in terms of quality and use of phytosanitary products should be applied for both EU and third countries’ food products. Moreover, at the European level, viable alternatives in terms of quality–price ratio for pesticides should be offered, and only after that the pesticides which previously met the rigors of EU legislation and were deemed as safe for humans should be forbidden; each member state, as well between states correlating to the European level, has an obligation of setting up and maintaining protective forest curtains for the agricultural crops, creating and maintaining the microclimate, increasing the population living standards to be able to consume eco and bio products, increasing the share of ecological products into total agricultural production, increasing the association of farmers in economic entities (cooperative companies and producers groups) and developing and consolidating the economic cooperation forms via strategic investments at regional and national level to support competitiveness, capitalization and sustainability of member farmers in the single market competition.
By means of associative forms with an economic role and as a key factor in the horizontal coordination with the role of collecting production and ensuring a continuous flow within the distribution chains, the foundations of transport and processing networks can be laid [
5]. At the same time, they also contribute to the development of vertical supply chains, eliminating competition imbalances and strengthening farmers’ market power [
6].
The integration of collaboration structures within supply chains to adapt production processes to consumers’ demand, the increase in accessibility and the reduction of costs related to production, storage and delivery can be achieved by implementing technological and innovative processes [
7].
At the European level, according to the Global Index of food security (GSI), high levels are registered by countries such as Finland (first place in 2022 in the ranking of the 113 countries considered, with a score of 83.7 points) [
8], followed by Ireland (second best place with 81.7 points), France (80.2 points, fourth place), Holland (80.1 points, fifth place) and Sweden (seventh place, 78.7 points). Romania is in 23rd place with 68.8 points and ranks last within EU member countries in terms of accessibility, sustainability and adaptation. In what concerns availability, Romania with 60.6 points outranks Greece and Slovenia, being third in the end of the rankings. This situation is due to the decline in the domestic industrial capacity, which made Romania a net importer in almost every sector (for many inputs), although it has a high potential and considerable natural resources. In what concerns food quality and food safety, Romania ranks 17th out of 26, before Slovakia, Czech Republic, Hungary and Italy. Also compared to Ukraine, Romania has a better standing for all monitored categories of accessibility, availability, quality and safety, sustainability and adaptation. The data regarding Romania’s position according to the GSI were summarized in
Table 1.
In dynamics, in the ranking realized by The Economist Intelligence Unit, part of The Economist Group, Romania has vulnerabilities, compared to the EU average, regarding the change in average price of food items (with 84 points compared to 88 points, the EU average [
9]), with 95.8 points as a share of the population affected by absolute poverty (people living with less than 3.2 USD per day), as compared to 99.2 points, the EU average. Romania also displays an unfavorable index of the inequality adjusted income, with a 66.4 point index compared to 76.3 points, the European average. In the agricultural trade chapter, Romania stands above the average of European countries, with 76 points in its 2022 score, with import tariffs for agricultural products also higher than the European average (data from World Trade Organization). In the same chapter of agricultural trade (from the point of commercial freedom, quantified through the tariff and non-tariff barriers to trade), the global index of food security, according to Heritage Index of Freedom [
10,
11], placed Romania around the European average (79.2 points compared to 79.5 points, the European average score).
Concerning food safety programs, Romania is well represented, with an index of 100 points compared to the European average of 96 points and stands out in financing food security programs, the nation-wide coverage and functionality of the programs implemented by the Romanian government [
8].
In the availability chapter, the measure of access to agricultural inputs, as a composite index of measuring the resources available for farmers [
8], places Romania a little above the European average (73.8 points against the European average of 72.9 points). Romania stands in the upper echelon concerning access to basic financial services, annual variation of farmers’ prices and access to consultancy and agricultural development services. In research and innovation in agriculture, there is a deficit of governmental financing (the proxy index of agricultural evaluation), of technology access, of education and of agricultural resources which could promote agricultural production by ensuring an integrated use of land, labor and investments [
8]. According to the same source, Romania is above the European average with policies facilitating the development of innovating agricultural technologies (with a score of 100 points compared to 75.6 points, the European average) [
12].
To improve Romania’s position to the European Union’s level, the authors consider investments in agricultural cooperatives as the main solution. The methods of improving Romania’s position to the European Union’s level refer to supporting, creating and increasing added value, reducing specific risks and consolidating the role and status of agricultural producers in the food chain. In 1990, all Romanian agricultural cooperatives were dissolved or transformed into agricultural societies. Until 1st January of 2005, no agricultural cooperatives were established. Starting with this date, modern cooperatives were founded, operating according to the International Alliance of Agricultural Cooperatives’ principles. They are currently in full reform, development and efficiency of activity. In Romania, according to National Trade Registry Office, in 2021, 2641 agricultural cooperatives were established [
13]. In 2021, a number of 1152 agricultural cooperatives generated a turnover of 588 million euros. Of the total 2641 cooperatives registered at the National Trade Office, 170 appeared as deregistered and 2389 in operation. In the last 5 years, the number of agricultural cooperatives that submit their financial statements (and hence prove interest for continuing their activity) increased at an annual average of 17.4% during the 2015–2021 period [
13]. As such, in 2021 the number of cooperatives submitting their financial statements increased by 153.7%, compared to 2015. Also, almost half (46.9%) of the profitable cooperatives carry out agricultural activity or auxiliary activities, while 48% carry out trading activities.
The overall table of agricultural cooperatives’ financial indicators indicates a favorable evolution, yet there is a need for increasing the capitalization via new investments.
These considerations require improving investments’ financing methods, which is the object of the current research, with the following specific objectives:
Identifying the current context’s vulnerabilities for Romanian farmers and cooperative agricultural companies;
Identifying the opportunities for development and for limiting Romanian agricultural sector’s vulnerabilities;
Creating an econometric model for optimizing Romanian agricultural cooperatives’ access to financial funds;
Creating a balanced scorecard with viable solutions for agricultural development and leveling Romania’s agricultural food products’ trade balance in accordance with the needs of the current unfavorable context.
The study continues with presenting a review of the reference literature, the research methodology and the logical scheme, the results and the discussions, whilst the final section is dedicated to presenting the relevant conclusions with an impact upon national level decision makers.
2. Literature Review
The interest of specialists for agricultural sector’s sustainable development increased significantly starting with the 2010s, especially in areas such as food security and climate change, global food crisis, sustainable development, agricultural management, ecological agriculture, funding micro-farms, agricultural management systems, agriculture value-added and agriculture under uncertain conditions.
Studying the 1953 sector articles published by the Web of Science platform during the 1975–2022 period, we find that over 900 articles pertain to the last 5 years (2018–2022); the Hirsch index of the publications was of 64 points, whereas the average citation for one article is of 11.34.
Using the 1.6.18 version of the Vosviewer software, we have realized a diagram which groups the 1953 articles in clusters of research interests such as agricultural investments, agricultural credit, agricultural markets, the management of agricultural entities, food security and agriculture in Romania from the efficiency, European funds financing, sustainable agriculture and Common Agricultural Policies (
Figure 1).
The analysis of the specialized literature regarding agriculture financing options in the European Union highlighted a concern of researchers for this field through 158 articles published in the specialized literature and included on the Web of Science platform, with a Hirsch index of 14 points and a citation rate of 3.69 citations per item. This proves this issue is of interest for the academic and scientific environment, responding to the need for the efficiency of the agricultural sector through adequate financing (
Figure 2).
Based on the analysis carried out, the areas of interest were grouped according to the competition criteria, 22 in number, and their financing through government aid financing programs and the economic financing conditions that have an effect on regional and rural development and make more effective the agricultural sector. Also, the researchers’ interest was directed towards investment mechanisms, agricultural financing, agricultural banks and agricultural cooperatives for agricultural support, agricultural structural funds, the multiannual financing framework, direct payments in agriculture, the development of green agriculture, the common agricultural policy and the financing of this European policy, the support mechanisms for financing agriculture, agricultural cooperatives, conservation practices, agricultural investments, European funds for agriculture, dedicated financing programs, the level of allocating funds for agriculture and the absorption rates for agriculture, the degree of implementation of the reforms, structural and investment funds, programs for farmers, co-financing in agriculture, agricultural development strategies, costs in agriculture, agricultural management and agribusiness.
In the paper [
14] Territorial differences in agricultural investments co-financed by the European Union in Poland, the authors identified the relationship between the support investments of the European programs for the development of agriculture and economic development in Poland, based on the fragmentation and heterogeneity of agricultural land and by comparisons with the agricultural conditions and the structure of the Polish agricultural sector. The authors showed that the agricultural development and financing are in a direct proportional relationship for agricultural farms with more than 10 hectares in operation, this being supported by much previous research, as the authors show in the conclusions of their study. Access to European funds for support investments was mostly achieved by large farms with high productive potential, which led to production concentration and specialization, respectively, to technological progress in agriculture. Another interesting conclusion of the study was that investing in capital resources reduced labor demand, which bolstered labor force’s specialization and access to better paid sectors of support services and maintenance, an aspect appreciated by the authors as essentially positive for economic development.
The research of Paun C. and Ivascu C. [
15] analyzes the impact of European financial support measures on the agricultural sector’s development, highlighting that the financial instruments related to the common agricultural policy will focus ever more on rewarding innovation, the efficient and profitable development of the sector minimizing the state’s aids and subsidies and on increasing agriculture’s resilience and sustainability in the global market. The authors show that there are some very important aspects that require innovative solutions, these being dependent on the pedoclimatic conditions and the climatic changes in relation to the geographic location. The current use of expensive climate change forecasting technologies could make the difference in the efficiency of agricultural policies, land improvement and optimizing the profitability indicators needed in a global competition. According to the study, at a historical level, a direct relationship was determined between net subsidies and the volume of agricultural production in the European Union. The authors believe that the future agriculture policies and reforms should stimulate investments and the adoption of revolutionary technologies so that the common agricultural market and the common agricultural policy are completely reformed and prepared for global competition. Another significant aspect discussed by the authors is the flexibility of the investment programs, considered too rigid and not very sensitive by farmers.
According to Kiryluk-Dryjska E. et al. [
16], the financial support for investments in agriculture increases the structural homogeneity of agricultural holdings and the consolidation of operators that manage to attract financing. The key factors resulting from the study in Poland are represented by access to financing, the size of the agricultural entity and the level of efficiency of the agricultural management. The authors reveal that the efficient use of investments requires a balance between the primary factors, namely land ownership and the size of the capital. As such, the investment balance ensures, under conditions of continuity, managerial efficiency, while the imbalance of these elements weakens agricultural entities and decreases their ability to use funds, reducing the effects of the financing. In the conclusions, the authors show that the application for the pro-investment measure is differentiated according to the farmers’ interest in the program, based on the geo-spatiality criterion. The results suggest that investment financing programs increase disparities between the agricultural entities, depending on the availability of labor resources and geo-climatic conditions (geospatial differentiation).
In another approach [
17], the authors show that significant additional capital is needed to achieve a sustainable agricultural production, with an appropriate quality and affordable prices for consumers, capital that cannot be attracted solely from financial markets, but through a combination of public funds and private dissociated funds. In this sense, the financing from the concessional development-oriented fund can be the solution to ensure the additional financing to achieve the objectives of sustainable development in agriculture. These funds are usually grants, concessional loans, subordinated loans or financing tranches between affiliated entities, but they usually add risks regarding the perception of private investors, guarantee risks and require technical support measures, including a feasible and efficient development plan. During mixed financing, it is important to follow the investments’ impact on the entity and the regional socio-economic development through key monitoring items such as: socio-economic performance, development of investment strategies, improvement of the structure of agricultural entities, reduction of risks and control of intermediate transactions. According to the authors, there are four levels of mixed financing, respectively: permanent mixed financing whereby the financing requirement is provided only from the combination of public-private financing with additional surplus from concessional loans; transitional mixed financing whereby some government agencies partially guarantee for agricultural investment funds (government backed guarantees); adjustable mixed financing of the Social Impact Incentives type; mixed impact financing whereby the concessional capital covers the monitoring or impact costs (agricultural risk management tools).
Rolfe, J. et. al. [
5] show that accessing public funds requires consistency (achieving the proposed goal), demonstrating the compliance with the access guidelines through plan documents and confirming the legitimacy of access to financing and the traceability of the activity (control). Instead, accessing private financing requires compliance with the principles of efficiency (transfer of funds), equal access to financing, mutual solidarity and legitimacy.
According to some authors [
18], agriculture financing represents an essential factor for sector development, especially in underdeveloped countries. The authors showed that agriculture investments are the guarantee of food security and sustainable agriculture, securing the food sources for the population of underdeveloped countries. Other authors [
19] showed that technological development represents the key for reaching agricultural efficiency, and blockchain technology could be key for improving credit access and reducing the informational asymmetry, lowering the cost of agricultural financing.
In financing small farms [
20], the authors of a study called Rural Finance, Capital Constrained Small Farms, and Financial Performance: Findings from a Primary Survey showed that financial constraints and capital access limitations reduce entities’ capacity to use optimally their resources and hinder small agricultural entities’ sales increase.
Financing through government agricultural policies [
21] generates conditions for sustainable economic growth, especially for emergent markets, where limited funding access impairs agricultural efficiency by reducing market opportunities of sector companies. As such, the authors appreciate that governmental financial policies can reduce the pressure of food security especially by reducing creditors’ risk aversion and supporting agricultural insurance. A study realized for ASEAN countries for the 2009–2020 period [
22] highlighted the role of agricultural financing for rural sustainable development. This study used a fixed-effects model (FEM) to prove that the congruence of adequate agricultural financing and of rural development has a significant positive role in sustainable development and generates durable economic growth.
The authors of this study [
23] used the scenarios method to analyze four agriculture financing schemes for the 2025 horizon, showing that a multidimensional and complex agricultural sector, including agricultural financing, using technology and innovation in agriculture, financial chains, configuring markets and institutional innovation, support agricultural sector’s development by increasing convergence and economic diversification, especially for rural economies, which are fully dependent upon the agricultural sector.
A group of authors [
24] examined US agricultural cooperatives’ financial performances and proved that reducing or eliminating financial stress increases their rate of return on equity (ROE) and rate of return on assets (ROA) and decreases interest rates over time.
By decomposing the risk function, the authors concluded that the financial stress appears because assets have a reduced efficiency, and the profitability is low. The authors [
25] used an equation system to analyze US agricultural cooperatives’ financial performances according to their dimensions and specialization and concluded that risks are influenced by the diversification of the cooperative company production, such as that profitability, indebtedness degree and size of debt positively influence financial performances.
Another study [
26] analyzes the effect of capital constraints upon agricultural cooperatives’ economic growth, using a data panel with 669 US sector companies. The authors of this study show that long-term debt funding and company size had a positive influence upon agricultural companies’ economic growth and that free cash flows and reinvested equity had a critical contribution for small and medium agricultural cooperatives’ assets increase. The authors concluded that large agricultural cooperatives are less financially exposed and have a lower cash flow pressure.
A study based on a literature review [
27] analyzed agricultural entities’ performance, governance and financing, revealing that the causal evidence of the relations between these units’ management and governance determines performances, even under long-term debt constraints, whilst the heterogenous component of members’ objectives and attitudes in terms of commitment and participation leads to inefficiency.
Marcis, J. et al. [
28], using the meta-analysis method to evaluate the sustainability of agricultural cooperatives’ performances, showed that the context of performances’ evaluation has not reached a scientific consensus in the reference literature, as there are many evaluation models based on different items, most of them focusing on the values and preferences of decision factors which are then incorporated into assessing the sustainability. The authors propose all three dimensions of sustainability to be included in the evaluation model in an integrative way, preserving a balance between the economic, social and environmental aspects.
Other authors [
29] show that agricultural supply chains impact the small agricultural farms’ capital constraints, forcing the usage of intermediary platforms to secure the economic flows. This aspect creates a financial strain, which directly threatens the supply of resources needed for the primary production cycle and generates high financing fees, which significantly increase the overall costs, even though production costs are not very high. The use of intermediary platforms supports efficiency increase for small companies, whilst intermediaries’ social responsibility could become essential in providing a win–win situation for farmers, platforms and the entire supply chain.
Markus Hannish [
30] claims that economic association forms, respectively, the agricultural cooperatives which keep the private domestic sector fair and strong. The author states there are significant economic size differences between the ten biggest Romanian agricultural cooperatives (they are about 100 times smaller) and their EU counterparties. These differences manifest themselves also in what concerns the average number of members of an agricultural cooperative company, with Romania recording 100 to 500 times fewer members in an association (the biggest agricultural cooperative from UE-27 counts in excess of 8000 members).
Romania needs to increase the weight of profitable agricultural cooperatives, which requires a significant increase in their sales revenues to become more attractive for investors/financing entities.
Programs of supporting the investments “to create rural infrastructure services, such as supply, warehouses, post-harvesting services, logistic and marketing services for the development, professionalizing, integrating the production of small, middle and also big farmers provided they associate into cooperatives and comply with the cooperative principles” are also needed.
To secure strong agricultural cooperatives in Romania, Hannish [
30] suggested the following lines of actions:
Identifying the main obstacles for the growth and integration of cooperative companies inside the chain;
Setting up a chain of “test cooperatives” for which to secure the financing of research and development activities;
Building a statistical data management system to have a long-term analysis of cooperatives’ economic and financial activity;
Analyzing the registration procedure and the follow-up procedures. In many EU-27 countries, the sectorial/federations of cooperatives accompany this process with the verifications of business plans and standardized documents;
Consolidating the reporting activities and centralizing the data, as a first step toward a cooperative auditing organization, as in most EU-27 countries.
The specialized literature shows that the impact of agricultural financing is significant; the financing action is necessary and useful for the development of the agricultural sector based on professional investment opportunity analyses. However, in the conditions of the global orientation of European agricultural trade, a reprioritization of financing is required in the sense of supporting the innovative act and the contribution of technology in the field which should balance the link between the need for labor and capital, with an emphasis on the efficiency of productive processes, increasing profitability and ensuring production sustainability.
3. Methodology
The research is based on the logical schematic presented in
Figure 3.
To evaluate the Romanian agricultural investments’ typology, the research used a questionnaire investigating the available investment options, which was send to 230 agricultural cooperatives in the January 2021–March 2022 period. The sample is representative, as verified by the Cohran test, with a 2% error margin and a 98% significance threshold (the minimum required sample was of 188 agricultural cooperatives).
At the time of the questionnaire’s release, 2641 agricultural cooperatives were registered in Romania, of which only 1200 had submitted their financial statements.
The selection criteria imposed active agricultural cooperatives, with a positive sales turnover of more than 20,000 euros, profit of more than 5000 euros and with fully Romanian private property in the last three years. A number of 230 agricultural cooperatives met these conditions.
The interrogation was performed via e-mail, with confirmation of receival and with returning in cases of no initial response. The questionnaire was addressed to managers of the cooperatives, and after sending the questionnaire, they were also contacted by phone. An online questionnaire (via Google Forms) was also sent, with the respondent having the opportunity to fill it in either in written or electronic format. Of the total 230 selected cooperatives, 219 offered complete responses to all the items from the questionnaire and were included in the sample. Three cooperatives did not answer, whereas eight were excluded as they offered incomplete answers to questionnaire items.
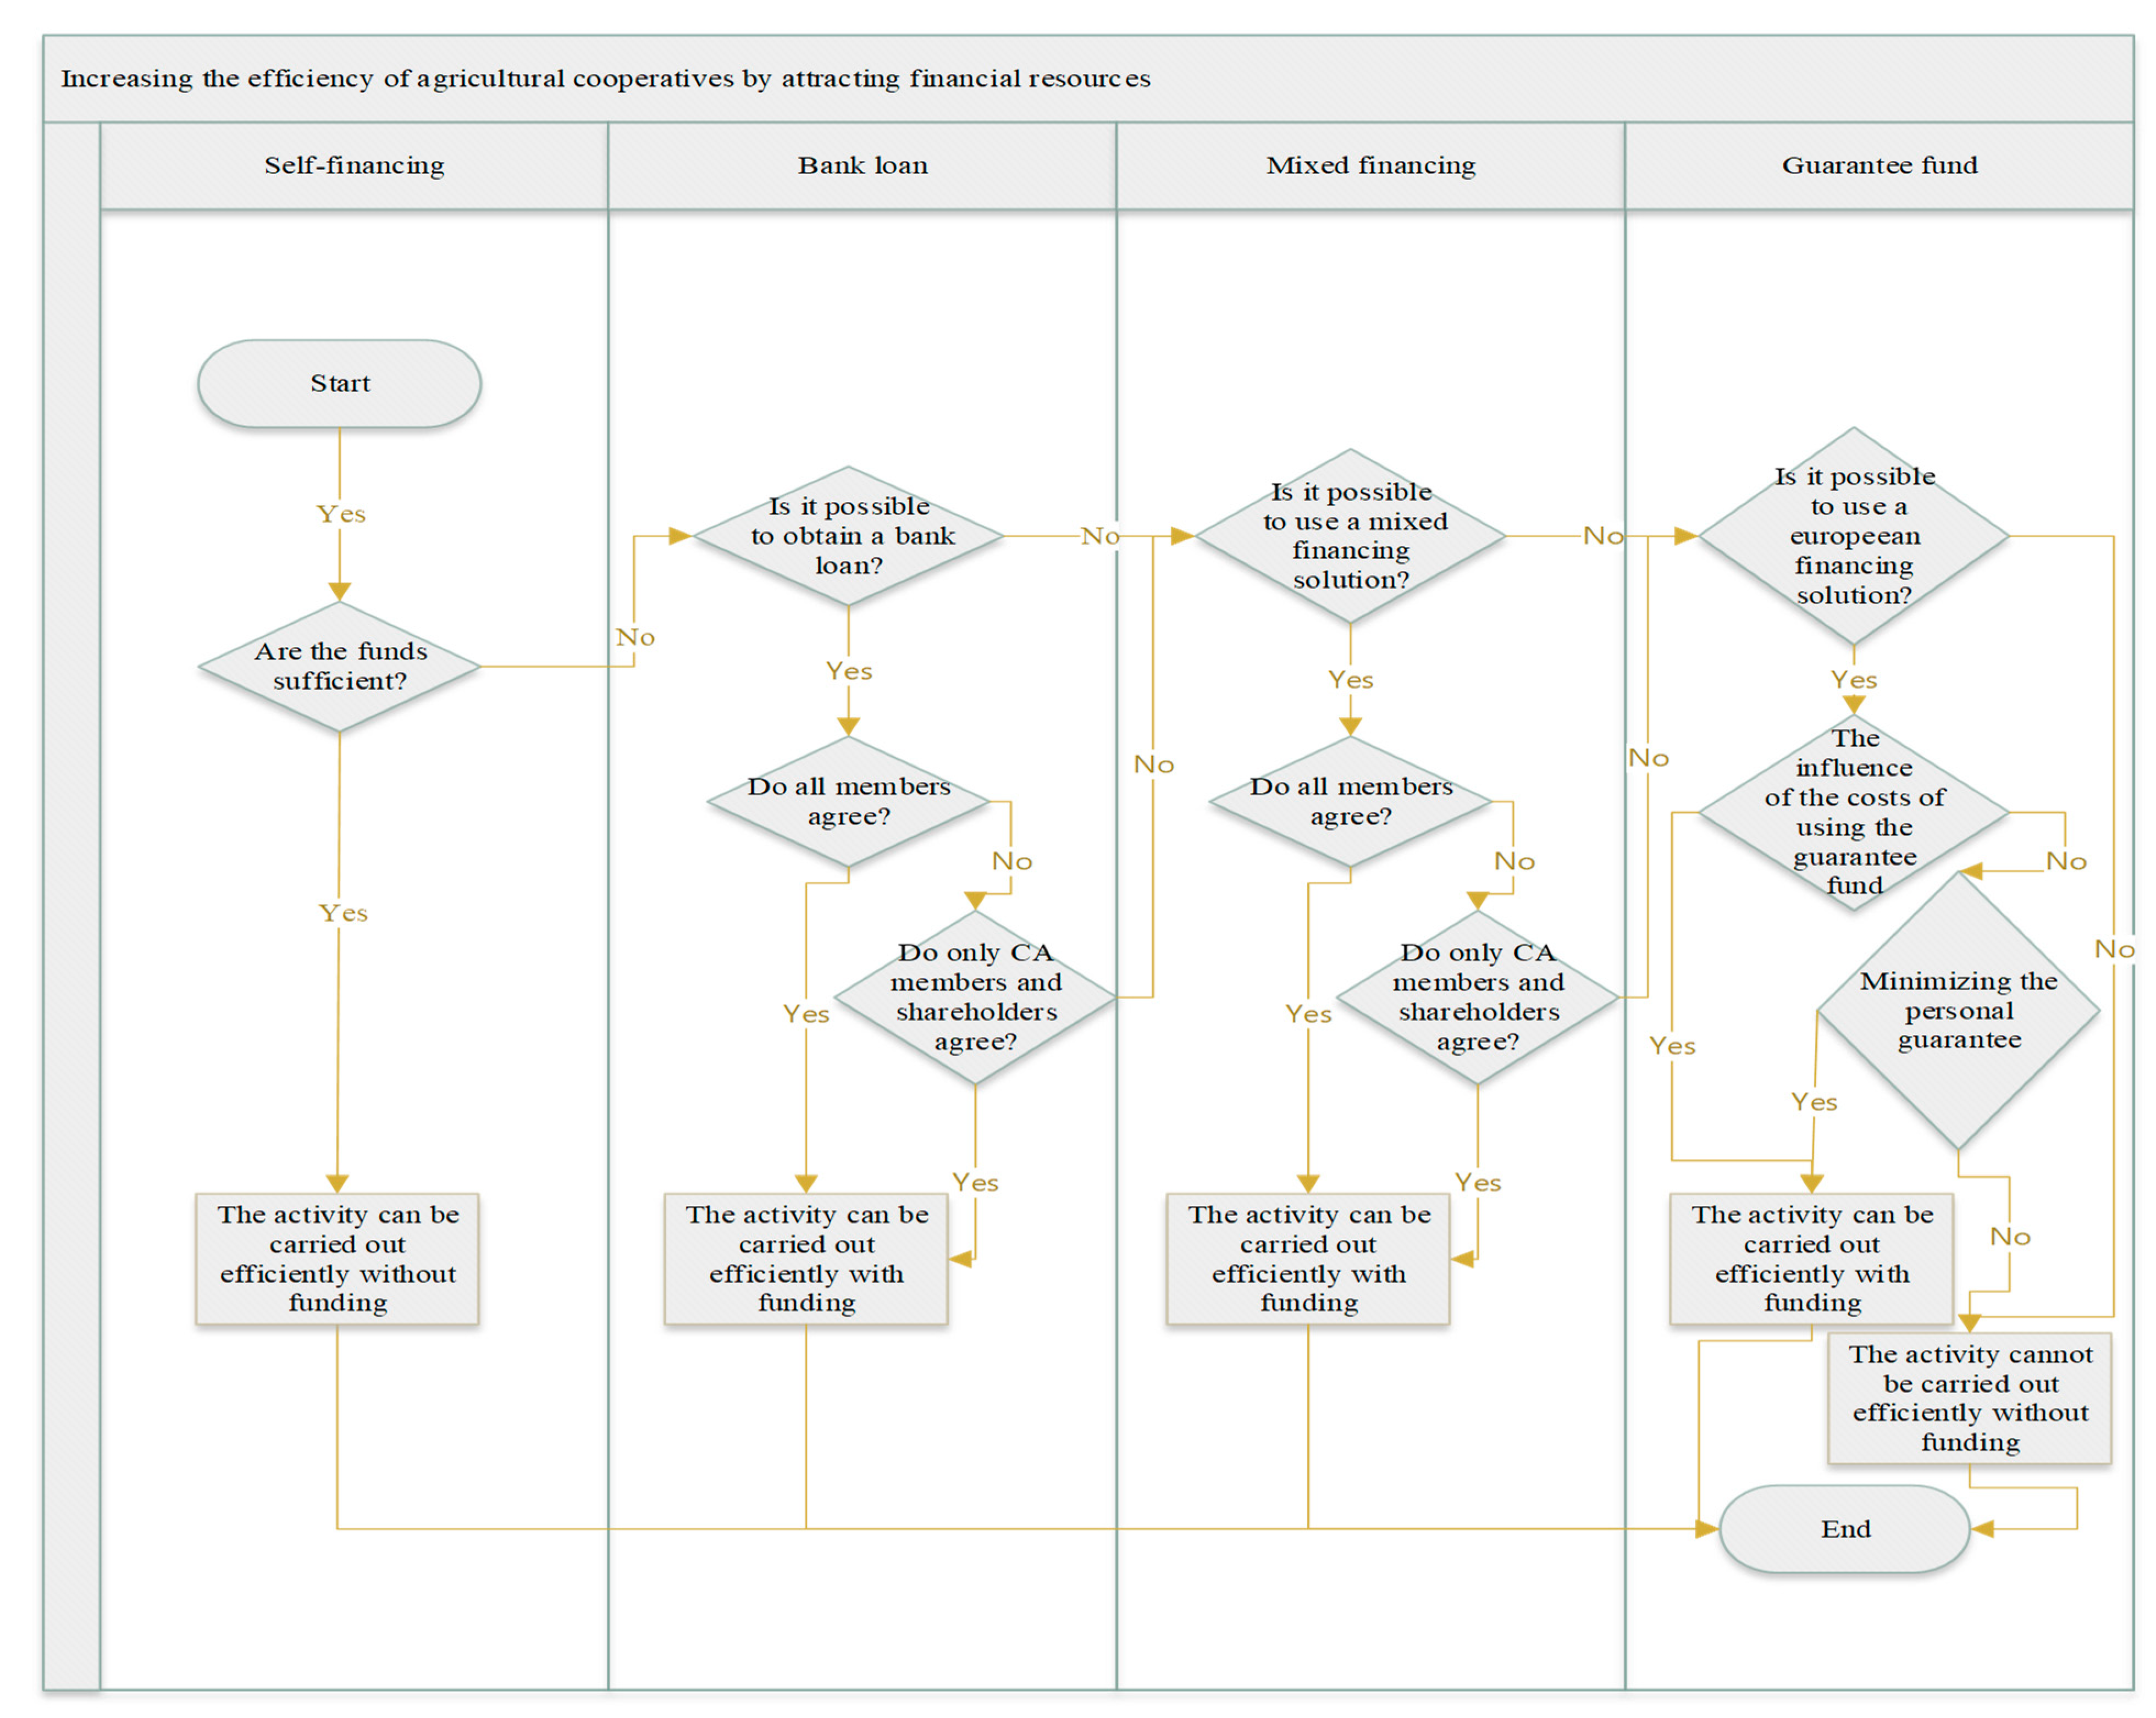
The structure of the questionnaire was developed based on the most used financing options available in Romania. It started from the idea of quantifying the investment directions of the cooperatives and the selected sources of financing. The questionnaire was structured starting from the need for investment and identifying the appropriate funding sources. Accordingly, the possibility of financing (
Figure 3) from own funds, from bank loans, from mixed funds (bank loans–own funds, European funds–bank loans or European funds–own funds) and European funds (the identification of the funds to cover own contribution and the need to call on guarantee funds was included in the questionnaire) had been identified.
The variables included in the questionnaire and subsequently used in the modeling are presented in
Table 2.
The following working hypotheses were formulated to test the investment typology:
H1: Financing the agricultural cooperative via the Guarantee Fund is accepted by the producers only if the financing entails no supplementary costs and if it is useful for developing the main activity sectors, ensuring technological development or developing the key sectors of warehousing/conditioning/processing/selling as the market registers deficits in these areas;
H2: Financing the agricultural cooperative via the Guarantee Fund is accepted by the producers in view of minimizing the personal guarantees, allocating the funds only to the base activity or to the warehousing/conditioning/processing/selling sectors, following the investment priorities toward technologization and development to enhance social equity inside the cooperative;
H3: In the absence of the access to the Guarantee Fund or after it was spent, the easiest financing solution is covering the guarantee by other means, aspect which covers the basic economic needs of the cooperative and ensures the efficient use of the loan, corelated with co-financing from already collected funds.
The model of evaluating the investment typology is based on measures’ correlations, using the Pearson coefficient after applying the correlation testing procedures.
We hereby define the intensity of the correlation of the model measures using the Equation (1):
where:
—Pearson coefficient;
cov—covariance;
Fx, Fy—the models’ variable, correlated via Pearson test
—variables standard deviation
—expected value
—average values of the measures.
The qualitative variables of the model were transformed into dichotomic variables, each Yes option being assigned the value of 1, whereas the No option received the value of 0. A database resulted, which was subsequently tested on a regression using the Pearson correlation test from equation 1.
The values were interpreted using a structural matrix, which responded to the following correlation intensity tests (see Equations (2)–(5)).
After applying the hierarchy algorithm, the representation diagram from
Figure 4 emerged:
Figure 4 shows that a number of items have a higher frequency in the agricultural cooperatives’ options, allowing the prioritization of investment options, according to a cumulative scheme of frequencies in the correlation matrix.
The representation diagram has generated the variables from the first echelon of interest of Romania’s agricultural cooperative’s investments, according to the data from
Figure 5.
By applying the frequency calculation methodology, a diagram on the maximum correlations of investment interest in the agricultural sector was obtained in
Figure 5. This diagram shows that the options: covering the loan guarantees according to the share in the agricultural cooperative; co-financing from previously gathered funds; clear and certain intention to appeal to the Guarantee Fund; covering the loan guarantees by other means; not appealing to the Guarantee Fund due to supplementary costs, represent the main orientation directions in the investment field of the agricultural entities’ management.
The results of the study confirm Romanian farmers’ interest for financing collective investments realized by agricultural cooperatives, using a combination of equity/internal generated funds and banking loans, co-financing the investment from previously collected funds, providing credit collaterals with money from the Guarantee Fund and financing investment by other means than banking credit. The detailed aspects are approached in the
Section 4.
4. Results and Discussions
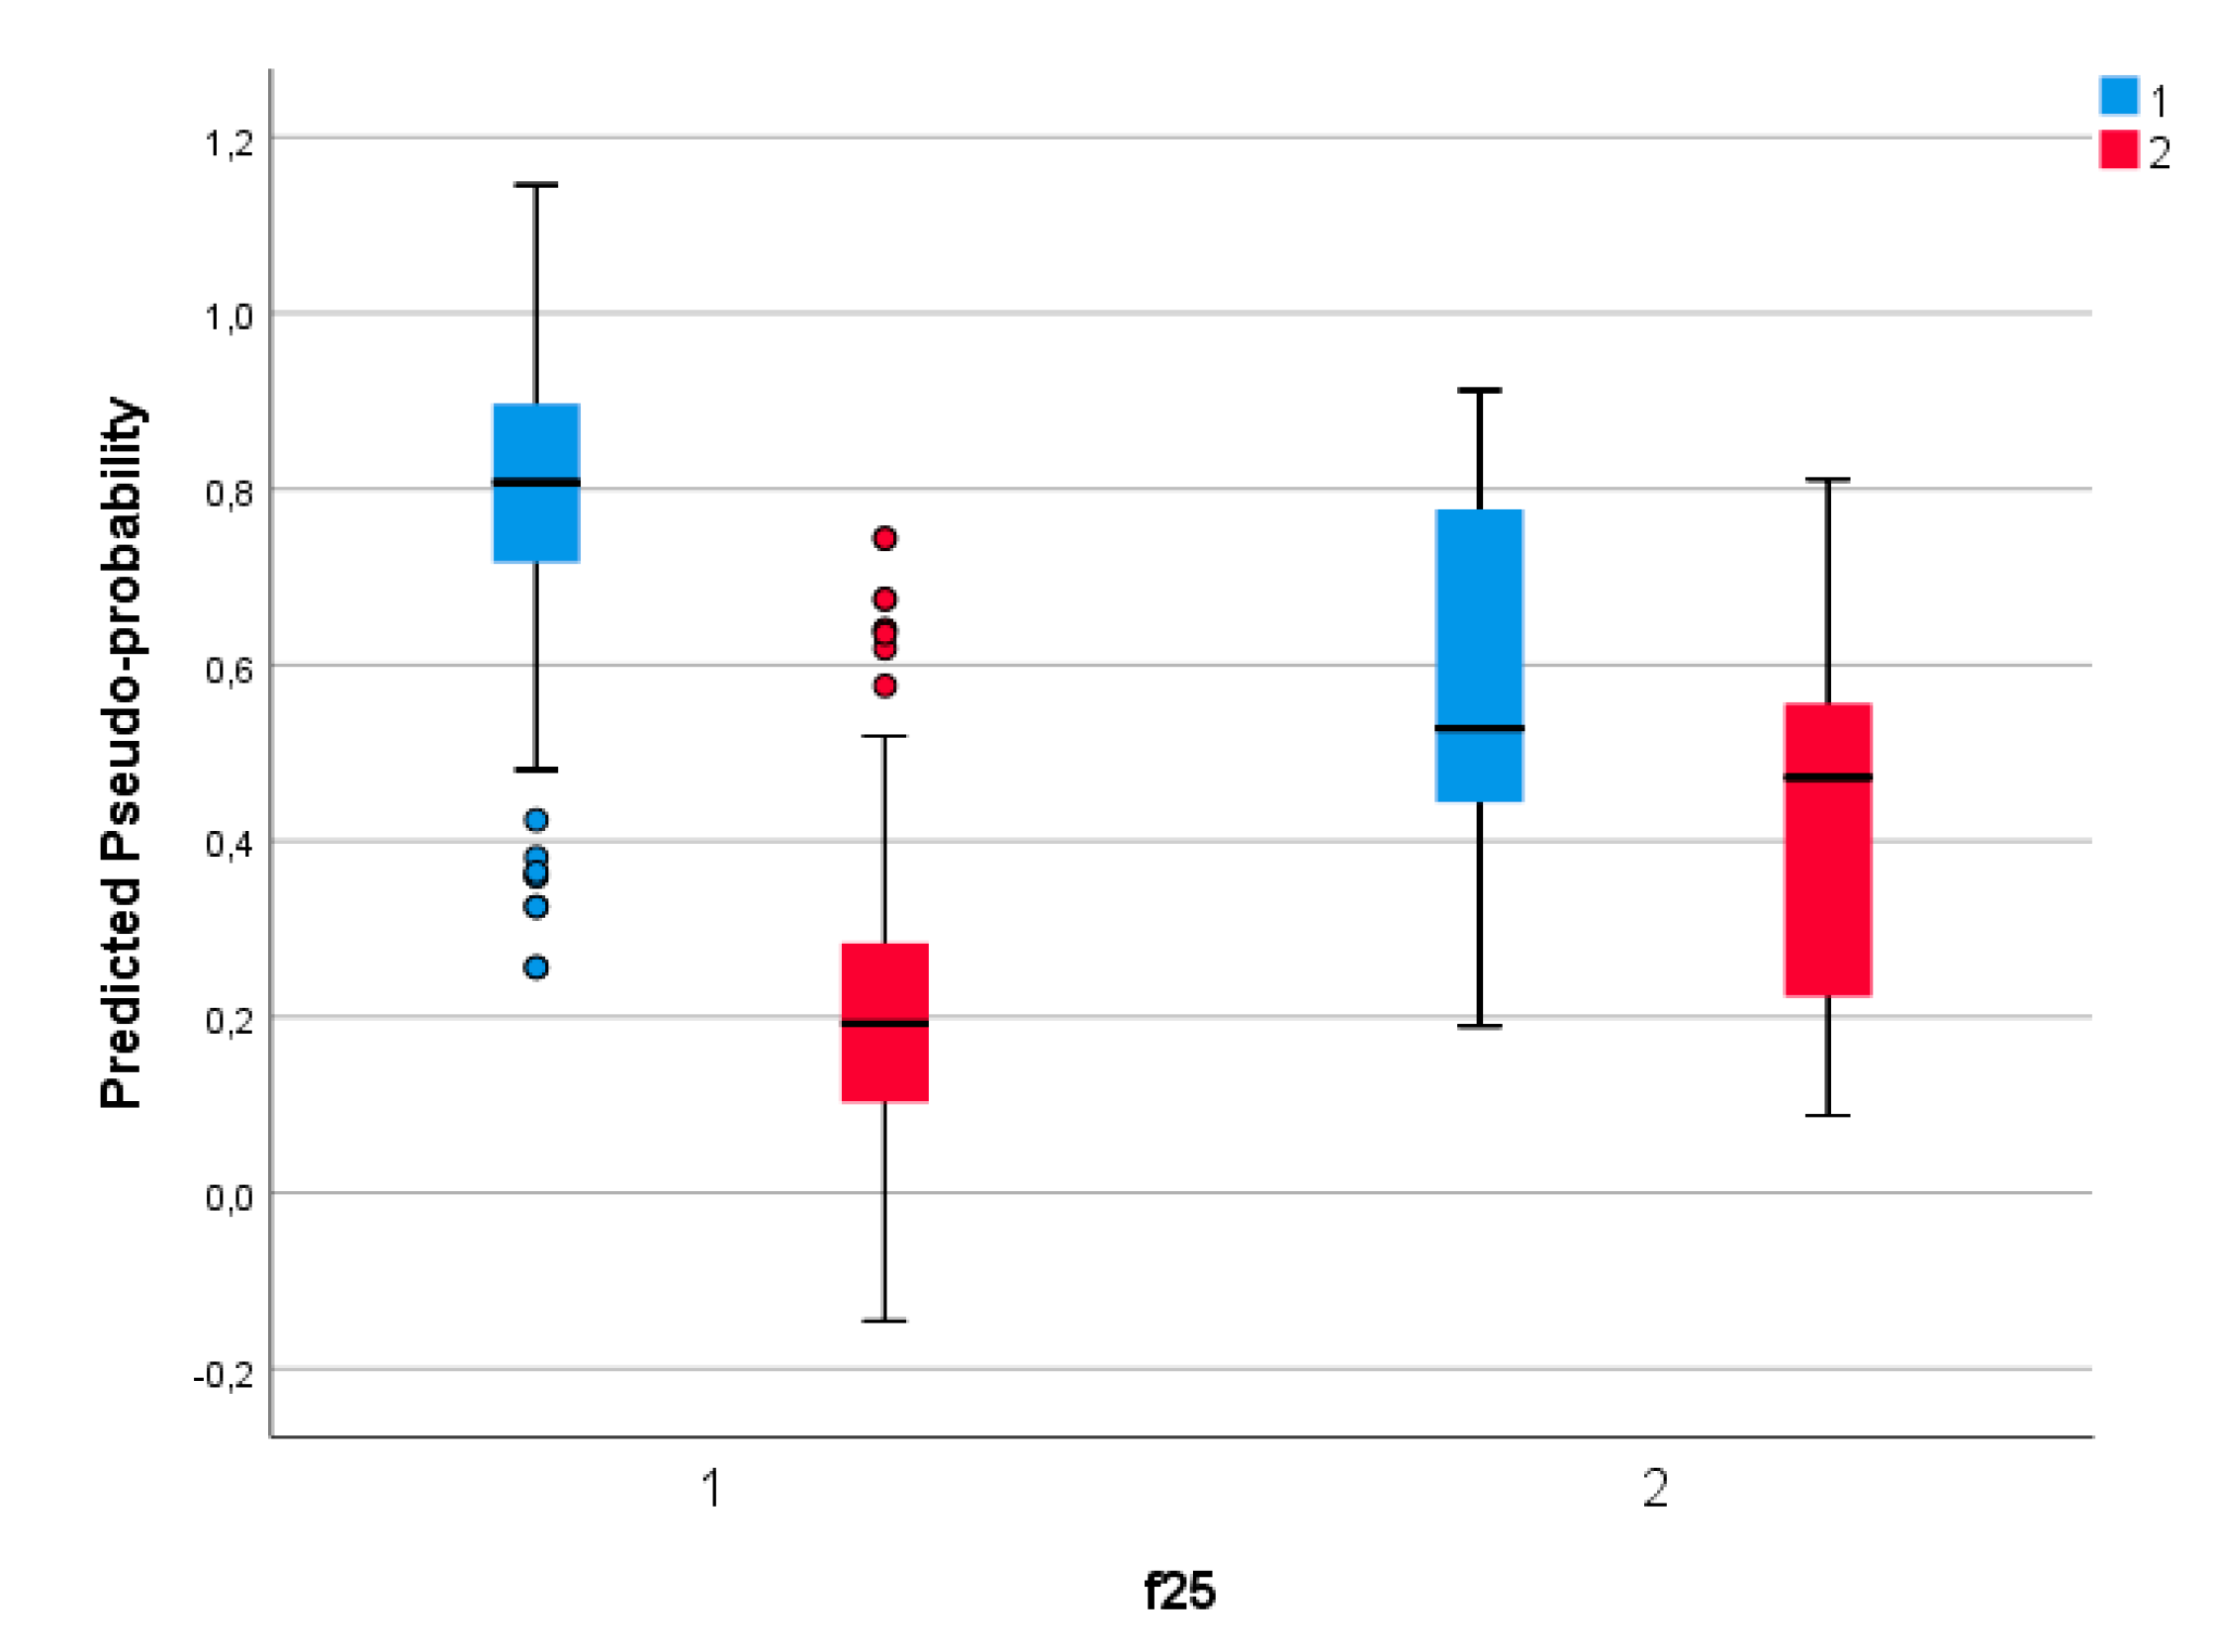
To demonstrate the H1 hypothesis (financing the agricultural cooperative by appealing to the Guarantee Fund is accepted by the producers only if the financing entails no supplementary costs and it is useful for developing the main activity sectors, ensuring technological development or developing the key sectors of warehousing/conditioning/processing/selling as the market registers deficits in these areas), we have conceived a neuronal model with a basis radial function with six testing units and 14 factors (f1; f2; f3; f4; f5; f6; f11; f12; f15; f16; f19; f21; f23; f24) in connection with the dependent variable (f25), using the statistical identification function and error testing with the sum of squares residuals (SSE = 34.113).
After running the model, the incorrect predictive percentage was of 29%, the estimated parameters being presented in the
Table 3.
Table 3 reveals that the prediction variable covering the loan collaterals according to existing share into the agricultural cooperative is represented at the predictors level (14 factors) at 96.2% in prediction layer no. 5 and at 76.1% in the prediction layer no. 2, which favors the prediction of the variable in the higher than one variation of the NO category. The results of the neuronal model also show a 78.1% percentage associated to the variation layer no. 2 of YES, whilst 82.2% associated to the layer 1 of NO. The value of the correction is of 78.1%, according to
Figure 6.
The sensitivity analysis of the function shows a favorable distribution of the financing decision by using guarantee funds, under the H1 hypothesis, according to
Figure 7.
According to the sequential analysis method based on the Pearson correlations resulted that the size of the distribution gaps (lags) for the variable financing using the guarantee funds is the maximum of the analyzed financing possibilities, being net superior to the general sample inside the sample with declared financing pre-disposition, which confirms that the main challenge for the agricultural producers is the necessity of covering the support costs from the financing line, during the financing period. Thereby, the producers have to temporary provide financing from their own funds, which discourages access to financing and indirectly the agricultural production.
Superior correlations on the subsample favorable opinion for financing were registered for economic supported investments, the most representative of the entity, as well as in the warehousing/conditioning/processing/selling sectors, considering the growing experience accumulated by the producers in the market in each year.
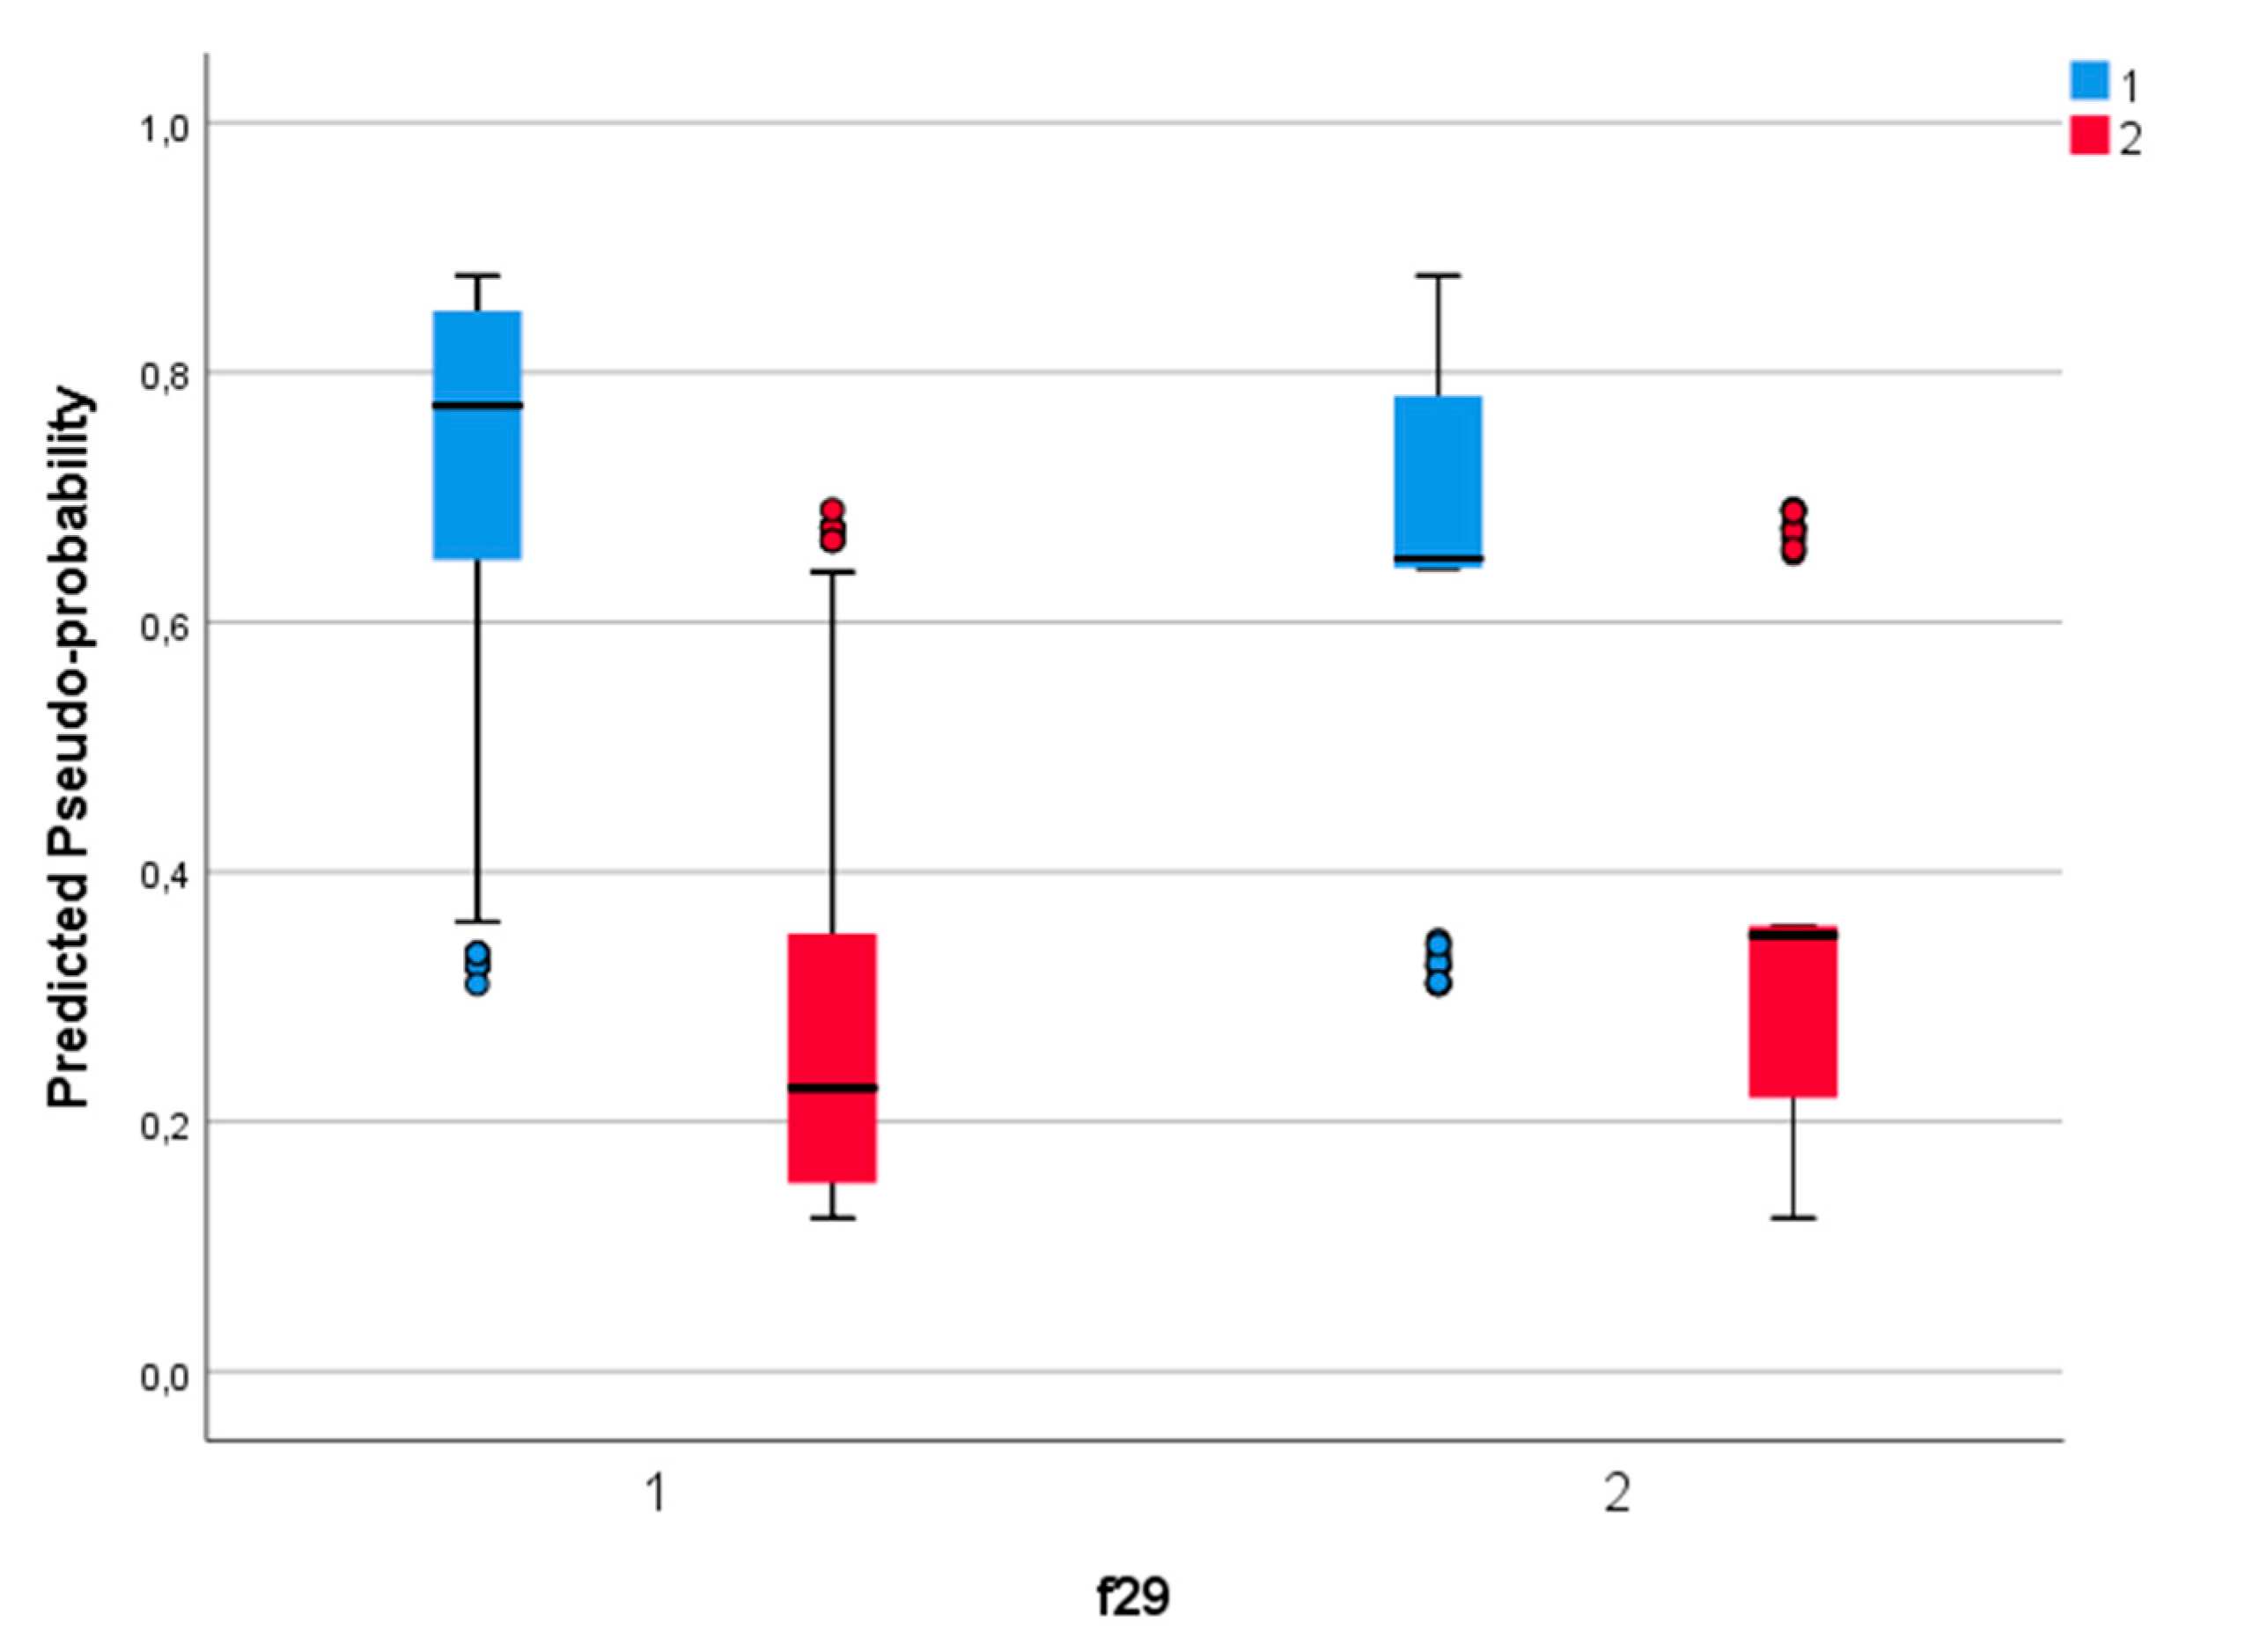
To demonstrate the H2 hypothesis (financing the agricultural cooperative by appealing to the Guarantee Fund is accepted by the producers in view of minimizing the personal guarantees, allocating the funds only to the base activity or to the warehousing/conditioning/processing/selling sectors, following the investment priorities toward technologization and development to enhance social equity inside the cooperative), we have conceived a neuronal model with a basis radial function with six testing units and 12 factors (f1; f12; f13; f15; f19; f20; f21; f22; f23; f24; f25; f26) in connection with the dependent variable (f29), using the statistical identification function and error testing with the sum of squares residuals (SSE=13.825). After running the model, the incorrect predictive percentage was of 24.7%, the estimated parameters being presented in the
Table 4.
Table 4 reveals that the prediction variable not appealing to Guarantee Fund because of supplementary costs is represented at predictors’ level (14 factors) at 85.7% on the fourth prediction layer and at 41.4% on sixth prediction layer, which favors the location of the variable in the NO floor with a lower than one variation. The results of the neuronal model show a 12.4% percentage for the variation layer of 2—YES and 87.6% percentage for the 1—NO layer. The value of the correction is of 78.1%, according to
Figure 8.
The sensitivity analysis shows a favorable distribution of the financing decision by appealing to guarantee funds under the H2 hypothesis, according to
Figure 9 from.
According to the sequential analysis method based on the Pearson correlations, the size of the distribution gaps (lags) for the variable financing using the guarantee funds is a priority, resulting a declared predisposition on financing of the deciding entities in relation to the general sample. This confirms that minimizing the personal collaterals can be quintessential in the context of the growing financial and fiscal pressures, as otherwise the producers have to temporarily provide financing from their own funds, which discourages the access to financing and indirectly the agricultural production.
From the lag distribution perspective, superior correlations on the subsample favorable opinion for financing were registered for economic supported investments, the most representative of the entity, as well as in the warehousing/conditioning/processing/selling sectors, considering the growing experience accumulated by the producers in the market in each year.
This proves the H2 hypothesis.
To demonstrate the H3 hypothesis (in the absence of the access to the Guarantee Fund or after it was spent, the easiest financing solution is covering the guarantee by other means, aspect which covers basic economic needs of the cooperative and ensures the efficient use of the loan, corelated with co-financing from already collected funds), we have conceived a neuronal model with a basis radial function with six testing units and 12 factors (f1; f4; f5; f6; f13; f15; f18; f19; f20; f21; f22; f23) in connection with the dependent variable (f26), using the statistical identification function and error testing with the sum of squares residuals (SSE=16.521). After running the model, the incorrect predictive percentage was of 32%, the estimated parameters being presented in the
Table 5.
Table 5 reveals that the prediction variable covering loan collaterals by other solutions is represented at predictors’ level (14 factors) at 83.5% on the sixth prediction layer and at 69.6% on the third prediction layer, which favors the location of the variable in the NO floor with a lower than one variation. The results of the neuronal model show a 21.7% percentage for the variation layer of 2—YES and 78.3% percentage for the 1—NO layer. The value of the correction is of 63.6%, according to
Figure 10.
The sensitivity analysis shows a favorable distribution of the financing decision by appealing to financing by other means under the H3 hypothesis, according to
Figure 11.
According to the sequential analysis method based on the Pearson correlations the size of the distribution gaps (lags) for the variable financing using attracted funds—loans has a principal representation on the base economic segment of the entity, following the cover of supplementary need for guarantees after the exhaustion of the guarantee fund.
The distribution is realized in relation to the base economic sector, respectively; its technologization at the same time shows the vulnerabilities resulting from non-applying due to lack of equity and capital.
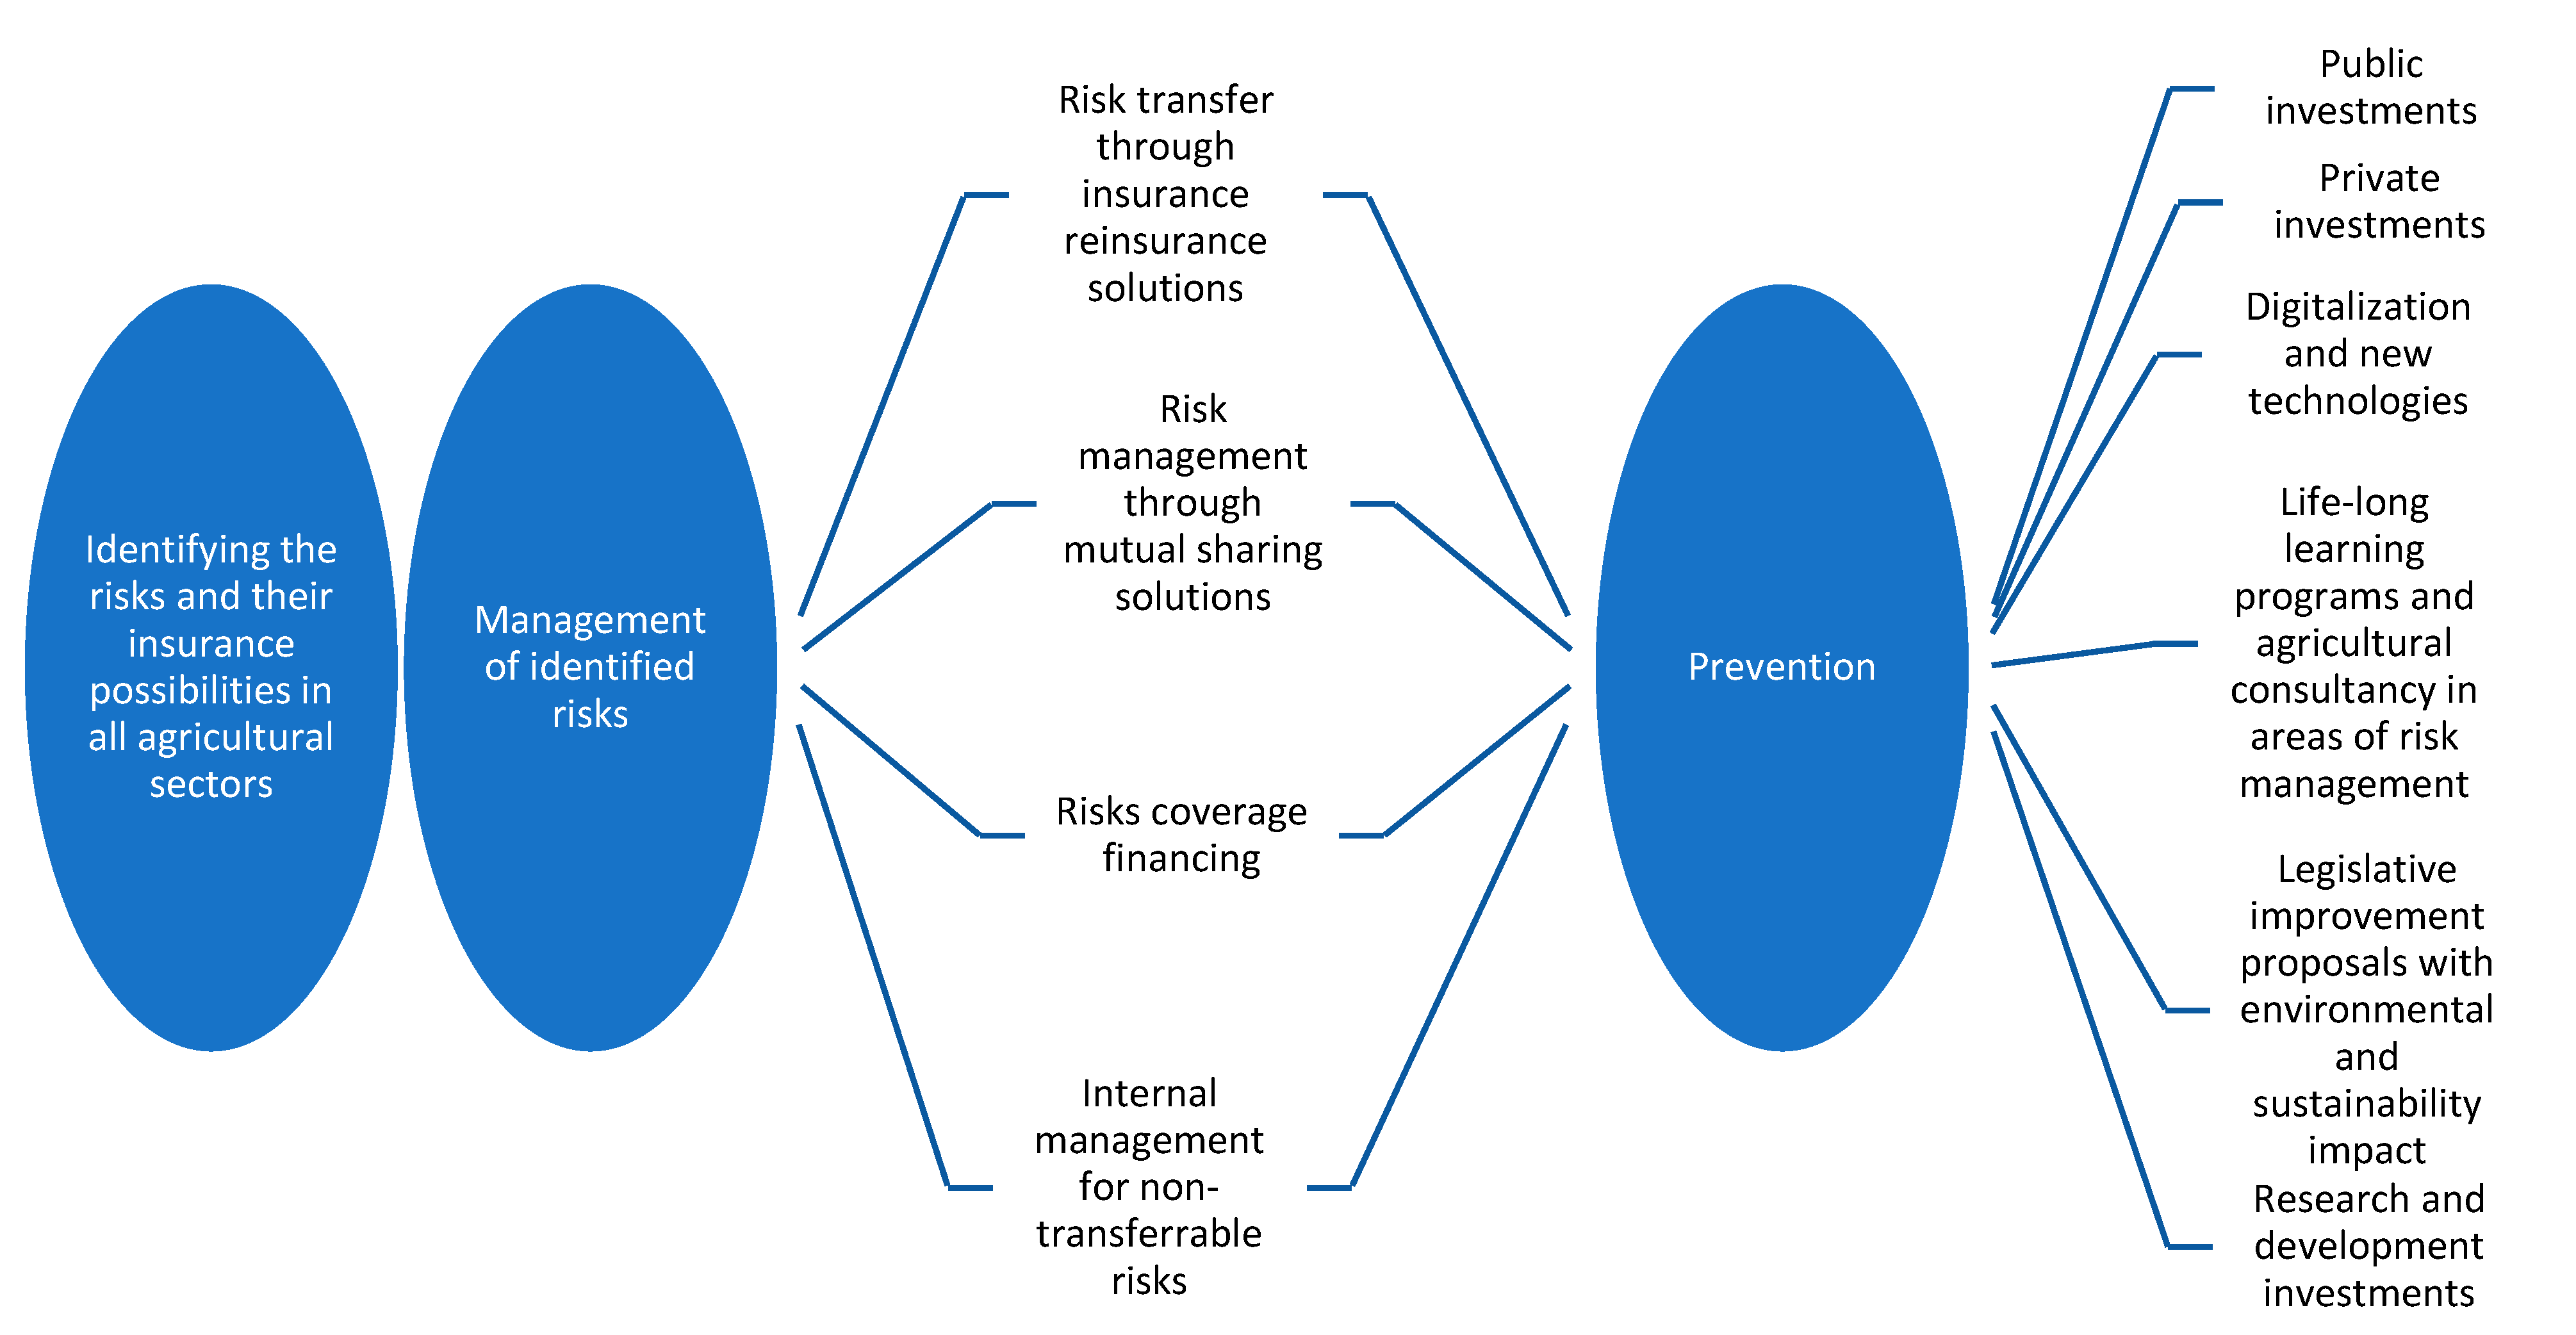
The solutions proposed for reaching the objective of the program are presented in
Figure 12.
At the European level, the strategic Common Agricultural Policy (CAP) Plans approach agriculture in an efficient manner, based on 10 objectives, which are individually developed, according to EU agricultural entities’ specific needs. From the strategic plans we can mention the orientation towards sustainable development, protecting the environment, social protection, sustainability of the agriculture and agri-food sectors, ensuring food security and safety, using innovation and digitalization and encouraging the exchange of information within the common agricultural policy.
In the economic field, the support offered to farmers refers to ensuring the functionality of the producing enterprises in the context of the challenges regarding food security, which requires supporting local production to ensure quality food at accessible prices, at the expense of products originating from countries which do not observe the same quality and environmental standards and pollute much more than the local products coming from short supply chains. In the authors’ opinion, the subsidy represents short-term aid elements to compensate for the losses and continue the production activity, after natural calamities or crisis situations; the viable long-term solution is represented by the prioritization of investments of the producers’ association forms with economic roles. European agriculture has met many transformations in the last 7 years, due to crises and differences in the approach of cultivation of genetically improved plants, their import and use for animal and human consumption and the corresponding objectives assumed by the European bodies.
Predictability is currently affected by exogenous events (the economic, geopolitical, pedoclimatic, sanitary and war induced crises, conditions imposed on European Union farmers and their products, such as halving of pesticides’ use in agriculture, although non-EU imports do not comply with the same requirements).
Romania is confronted with a dependence of agricultural production on weather conditions, which leads to high fluctuations in revenues from one year to another [
31]. The impact of unfavorable phenomena, either climatic, represented by pedological drought, extreme heat waves or sole erosion or ones caused by pests, leads in many instances to stopping the activities or insolvency for some farmers, as there is not yet in place a National System of Integrated Management and Control of Agricultural Catastrophic Risks.
In the general context of increasing the impact of climate and environmental changes, of the socio-economic and political changes, of pest and disease proliferation and in the specific Romanian context and of including the food and agricultural sector as a strategic component, the system is based upon the development and implementation of some complementary risk management instruments, such as assuming and creating the National Program of Agriculture Catastrophic Risks Management, the introduction of an integrated national scheme of insurance–reinsurance in agriculture to cover predefined risks, support for optional insurance schemes, supporting financial stability instruments including independent mutual funds and support for using financial instrument to prevent and mitigate risks.
Finally, this can enhance the risk management, improve transparency and increase competitiveness of agricultural companies, making full use of digitalization promoted through the National Program of Recovery and Resilience. It is important to realize a European and national strategy for the creation and maintenance of protective forest curtains, to create a favorable microclimate for agricultural production, which should be interconnected with the ones from neighboring countries, and to limit or stop the climate changes’ negative effects [
32,
33].
At the same time, the agricultural policies promoted by EU, even if they promote sustainability and durability, at least in the short term lower the competitiveness of European agriculture and indirectly encourage the cheap imports of agricultural and food products that do not comply with same quality rules and criteria as the EU produced ones.
It seems essential to update the legal framework to permit the use of modern amelioration techniques and allow modern science to make an objective analysis, granting decision making ability for the European Authority for Food Safety (EFSA) to reduce the use of pesticides and fertilizers, inclusively for the countries which have consumptions well below the European average. At the same time, the imports of non-conformant agricultural products and fertilizers, low quality and replacements of meat, milk and vegetables, which are falsely labeled using deceiving marketing practices, should be prohibited.
Simultaneously, of utmost importance is speeding up the civil works of the National Program of Irrigation and Drainages and attracting funding through the National Program of Recovery and Resilience, as well as attracting European funds to gradually increase the irrigated areas in Romania to about 3 million hectares in 2035. Attaining this objective will allow Romania to become the main producer of soy and soy derivatives from the EU so that the internal EU consumption is secured and phases out the 85% imports from the total vegetable protein necessary to secure the feeding sources for the European zootechnical sector.
On the basis of
Figure 12, a balanced scoreboard of viable solutions for Romanian agriculture development in accordance with the needs generated by the current unfavorable context was realized, as in
Table 6 below.
Romania needs to plan and implement an ambitious agricultural strategy to become the biggest soy producer in Europe. The European Union is a big importer of protein crops, of which 70% are soy and soy derivatives. The Romanian agricultural potential is very big, and it can hold supremacy in Europe for soy production and ensure the vegetal protein for the entirety of Europe. The EU’s high demand of soy and soybean products is a guarantee that this objective can help level the Romanian trade balance.
5. Conclusions
The current research showed that the lack of national policies and strategies in the field of natural disasters and climate changes’ risk management (
Figure 12) are the main sources of vulnerabilities for Romanian agriculture producers in the current context, amplified by a low technology level, low resources for research and agricultural development and limited access to mobile banking services and to diversified financial products (
Table 6).
Also, the poor infrastructure of the supply chain represents a barrier for the economic growth of agricultural entities, hindering the sustainable economic performance of these units.
The research showed that the financing needs of agricultural cooperatives are scarcely represented at stakeholders’ interest level, the macroeconomic impediments hindering their preferential or easier access to financing.
The research extracted valuable information from the poll of the 219 Romanian agricultural cooperatives, identifying the development opportunities and limiting the vulnerabilities faced by the Romanian agricultural cooperatives. The authors of this study have realized a panel of discussions, which generated a series of solutions for increasing efficiency, improving the level of economic and financial measures and helping the Romanian farmers to become significant actors, with negotiation power in the European single market, in accordance with the current global and regional trends.
The Romanian agricultural cooperatives have experienced a significant growth starting with 2019, inclusively as a result of active implication of the Sector Union of Vegetal Cooperatives, yet this should be accompanied by investments to support the increase in value added, the creation of a national level union of cooperatives for each sector, mandated to negotiate supply of inputs, integrate strategic investments at regional and national level and trading the products at fair prices for farmers and accessible for consumers.
The study demonstrated the proposed objectives of the research in the sense of identifying the vulnerabilities of farmers and agricultural cooperatives in Romania by referring to the current situation presented in the research. Investment directions were identified, and the econometric model was created to optimize access to financing for Romanian agricultural cooperatives. Within the model, three working hypotheses were elaborated, tested and validated according to which: financing using the guarantee funds is the maximum of the analyzed financing possibilities (H1); financing using the guarantee funds is a priority, resulting in a declared predisposition on financing of the deciding entities in relation to the general sample (H2); in the absence of the access to the Guarantee Fund or after it was spent, the easiest financing solution is covering the guarantee by other means, aspect which covers basic economic needs of the cooperative and ensures the efficient use of the loan, correlated with co- financing from already collected funds (H3).
The economic model of optimizing the financing is a novelty brought about by this study, which analyzed the financing decision via the three working hypotheses, from both the financing sources and the final goals’ perspectives. An important aspect revealed is that the lack of proper warehousing/processing facilities represent the main vulnerability, which impede achieving maximum efficiency of the primary production.
Other lagging chapters are the production integration chain to obtain high value-added products and the current low market share of agricultural cooperatives for the main food items, which all require targeted investments at regional and national levels and increase the economic exchanges between the cooperatives.
Based on the above topic, the main public policies proposed through this study are: updating the legal framework to facilitate access to innovation; technologies and modern science throughout the European Union; compliance with the manufacturers’ instructions on the labels regarding the use of pesticides; the application of the technologies regarding the improvement of the resistance of plant species to drought, to the attack of pests or diseases, under the conditions of maintaining the biological characteristics and the quality imposed at the European level; the adoption of integrated and flexible instruments for risk management in agriculture adapted to the specific needs of each state of the European Union; establishing a framework of good practices for European agricultural enterprises and measures to develop sustainable and sustainable agricultural cooperatives.
The authors have not identified any other similar studies in the specialized literature from Romania, aimed at reducing the risks that threaten the smooth running of the activity of agricultural cooperatives by means of an integrated financing model. Previous studies show the need for financing and some vulnerabilities regarding the absorption of European funds, or the maintenance of cohesion between members of associative forms [
2,
30,
33].
As future research directions, the authors propose extrapolating the study to the European Union level but weighted by a series of variables that reflect the level of development of agricultural cooperatives in each state and its influence on investment options and directions.

 ,
, 


