Article

Synthesis of Floral-Shaped Nanosilica from Coal Fly Ash and Its Application for the Remediation of Heavy Metals from Fly Ash Aqueous Solutions

by
Virendra Kumar Yadav
1,2,*,
Abdelfattah Amari
3,4,*,
Shivraj Gangadhar Wanale
5,*,
Haitham Osman
3 and
M. H. Fulekar
5,6,7
1
Department of Biosciences, School of Liberal Arts & Sciences, Mody University of Science and Technology, Sikar 332311, India
2
School of Nanosciences, Central University of Gujarat, Gandhinagar 382030, India
3
Department of Chemical Engineering, College of Engineering, King Khalid University, Abha 61411, Saudi Arabia
4
Research Laboratory of Processes, Energetics, Environment and Electrical Systems, National School of Engineers of Gabes, Gabes University, Gabes 6072, Tunisia
5
School of Chemical Sciences, Swami Ramanand Teerth Marathwada University, Nanded 431603, India
6
Centre of Research for Development, Parul University, Vadodara 391760, India
7
School of Environment and Sustainable Development, Central University of Gujarat, Gandhinagar 382030, India
*
Authors to whom correspondence should be addressed.
Sustainability 2023, 15(3), 2612; https://0-doi-org.brum.beds.ac.uk/10.3390/su15032612
Submission received: 13 November 2022 / Revised: 22 January 2023 / Accepted: 22 January 2023 / Published: 1 February 2023
(This article belongs to the Topic Solid Waste Management)

Abstract

:
Every year a large amount of coal fly ash (CFA) is generated and dumped in fly ash ponds. Fly ash has numerous toxic heavy metals, which leads to water pollution due to the percolation of these heavy metals. Heavy metal toxicity has become a major issue for the whole globe. Moreover, CFA has several value-added minerals, such as silica, alumina, and ferrous in large amounts. Therefore, the synthesis of silica nanoparticles from CFA and their application for the removal of toxic heavy metals from fly ash aqueous solution will prove to be an economical and efficient approach. Here, in the present research work, investigators synthesized nanosilica from CFA by alkali dissolution and sol-gel methods and applied them for heavy metal removal. Firstly, CFA was treated with high molar NaOH, along with stirring and heating. Further, the sodium silicate leachate from CFA was treated with dilute HCl till the formation of a white gel at neutral pH. Purification of the nanosilica was achieved by treating with 1M HCl along with stirring followed by calcination at 400 °C for 4 h. The synthesized nanosilica was characterized by UV-Vis, Fourier transform infrared (FTIR), particle size analyzer (PSA), X-ray diffraction (XRD), field emission scanning electron microscopy (FESEM), electron diffraction spectroscopy (EDS), and high-resolution transmission electron microscope (HR-TEM). The sizes of the floral-shaped nanosilica particles were 20–70 nm, and the purity was 90–95%, as confirmed by microscopy and EDS, respectively. The XRD and FTIR revealed the amorphous nature of nanosilica. Finally, the potential of the nanosilica was assessed for the removal of heavy metals from 20% CFA aqueous solutions in batch experiments. The nanosilica showed about 40–90% removal of heavy metals (Al, Pb, Cd, Cu, Cr, Ni, Co, Zn, Mn) from the fly ash aqueous solution.

1. Introduction

Water pollution and heavy metal toxicity are of major concern for the whole world, and have increased in recent years due to industrialization [1]. Heavy metals are not only toxic to living organisms but may also create a potential threat to the environment due to their non-biodegradable nature [2]. Among various sources of heavy metals, coal fly ash (CFA) pollutes the surface and groundwater [3]. CFA is a by-product of thermal power plants (TPPs) that are produced from the burning of pulverized coal during the generation of electricity [4]. Currently, the majority of the CFA are dumped off in fly ash ponds in the vicinity of the TPPs. From the literature, it is evident that CFA has traces of numerous toxic heavy metals, which may leach out or percolate after coming into contact with water or rain from these fly ash ponds into the surrounding water bodies and groundwater. The presence of heavy metals in water bodies may lead to several side effects in aquatic organisms, such as heavy metal accumulation and diseases [5]. Therefore, there is an immediate requirement to remove these toxic heavy metals before they enter the ecosystem. The removal of heavy metals is possible through adsorption, electroplating, precipitation, coagulation, flocculation, etc. [6]. The adsorption process is arguably one of the most popular methods of heavy metal removal and has attracted greater interest because of its simplicity and efficiency [7,8]. Among all the available techniques for the removal of heavy metals from wastewater, adsorption is the most preferable due to its simplicity. Moreover, if an adsorbent is nanosized then there is more efficient adsorption due to its large surface area to volume ratio (SVR) [9]. Moreover, if the nano adsorbents are derived or synthesized from waste material such as CFA, then the synthesis process not only becomes a greener approach but also lowers the whole expenditure involved in remediation [10]. The utilization of nano adsorbents derived from CFA for the removal of heavy metals makes the whole process very economical.
CFA is a rich source of silica that can be used as a precursor for the synthesis of nanosilica adsorbents. Silica is present in CFA in the form of sillimanites, quartz, and glass amorphous phase [11], which can be extracted by the alkali-treatment method. Silica is a polymer of silicic acid that consists of interlinked SiO4 units in a tetrahedron fashion with a general formula of SiO2 [12]. In nature, silica is present in the crystalline form, while synthesized silica is present in the amorphous form. Bulk silica is a conventional adsorbent that has been used for a very long time to remove odors, etc. Silica is commercially produced from quartz rock and sodium silicates in the industries. The sodium silicates are produced from tetraethyl orthosilicate (TEOS) and tetramethyl orthosilicate (TMOS), which are metal alkoxides-alkyl silicates for silica synthesis. Both of these alkyl silicates are expensive inorganic salts that utilize a high temperature of 1300 °C for the smelting of quartz. The use of costly precursors and high temperature makes this an energy-intensive and expensive process [13]. Silica gels have been used since ancient times as traditional adsorbents. Nanosilica could act as a potential adsorbent because of its high SVR, which increases its capacity for the adsorption and desorption of molecular and ionic species [14].
Nanosilica has always been in demand in research, industries, and medicine due to its innumerable technological and biomedical applications. Due to its unique and remarkable properties, nanosilica is used for electronics, storage media, solar devices, medicine, healthcare, drug-delivery medicine, cancer therapy i.e., cancer cell imaging, DNA and microarray detection, barcoding tags separation, purification of biological molecules and cells, agriculture, wastewater treatment, and in chemistry for catalysis and molecular sieves, resins, catalysts, molecular sieves, and other chemical reactions [15,16]. In addition to this, they are also used in building construction, ceramics, and glass industries. Until now, they have been most exploited in biology and medicine as drug carriers.
Several investigators have reported the synthesis of silica nanoparticles (SiNPs) from CFA; for instance, Yadav and Fulekar, 2018, synthesized nanosilica from CFA. The authors also reported the biosynthesis of nanosilica from CFA using bacteria and fungi. In addition to this, Yadav et al., 2019, reported the synthesis of nanosilica from the fly ash tiles. In addition to this, the most recent attempt by Imoisili and Jen (2022) reported microwave-assisted sol-gel template-free production of nanosilica 48–87 nm in size with an average diameter of 67 nm from South African CFA. In another experiment, Imoisili and their colleagues tried to synthesize spherical nanosilica particles averaging 60 nm in size. The nanosilica was synthesized by sol-gel hydrothermal approach using CFA as a precursor from one of the South African TPPs [17]. A team led by Liang synthesized spherical nanosilica particles 20–40 nm in size from CFA collected from one of the TPPs in China [18]. Further, investigators have used synthesized nanosilica for the remediation of Pb2+ ions from aqueous solutions [19]. In addition to these authors, Uda and their team also reported the synthesis of nanosilica from RHA. Previously, several authors tried to remediate the heavy metals from CFA aqueous solutions. In one approach Yadav and Fulekar (2018) remediated Pb and Cd ions from 20% CFA aqueous solutions by using maghemite nanoparticles of size 20–40 nm [20]. Another approach by Yadav et al., 2020, used 20% CFA aqueous solution as a source of heavy metals and tried to remediate Pb and Cd by using sonochemically synthesized iron oxide nanoparticles [21].
In the present work, CFA was firstly collected from TTP and treated with 8 M NaOH at 95 °C for 90 min at 400–500 rpm in a round bottom flask under a reflux system. The sodium silicate (Na2SiO3) rich leachate was titrated with the dilute 2 M HCl to obtain a white silica gel. The gel was converted into powders by calcination at 400 °C for 4 h. The synthesized SiNPs were analyzed by a series of characterization techniques for detailed morphological and elemental properties. Finally, the SiNP applicability was assessed for the removal of heavy metals from 20% aqueous solutions of CFA against contact time and dosage in batch experiments in an incubator shaker. Considering this, the current study, where the CFA was procured free of cost from TPPs and which demonstrated the potential utilization of waste for the synthesis of SiNPs showed the method to be an economical and green approach.

2. Materials and methods

2.1. Materials

Fly ash from Gandhinagar thermal power plants (GTPPs), NaOH Pellets (RENKEM, Gurugram, India), 100 mL round bottom flask, Ethanol (Shenzhen, China), Conc. HCl (RENKEM, Gurugram, India)

2.2. Method

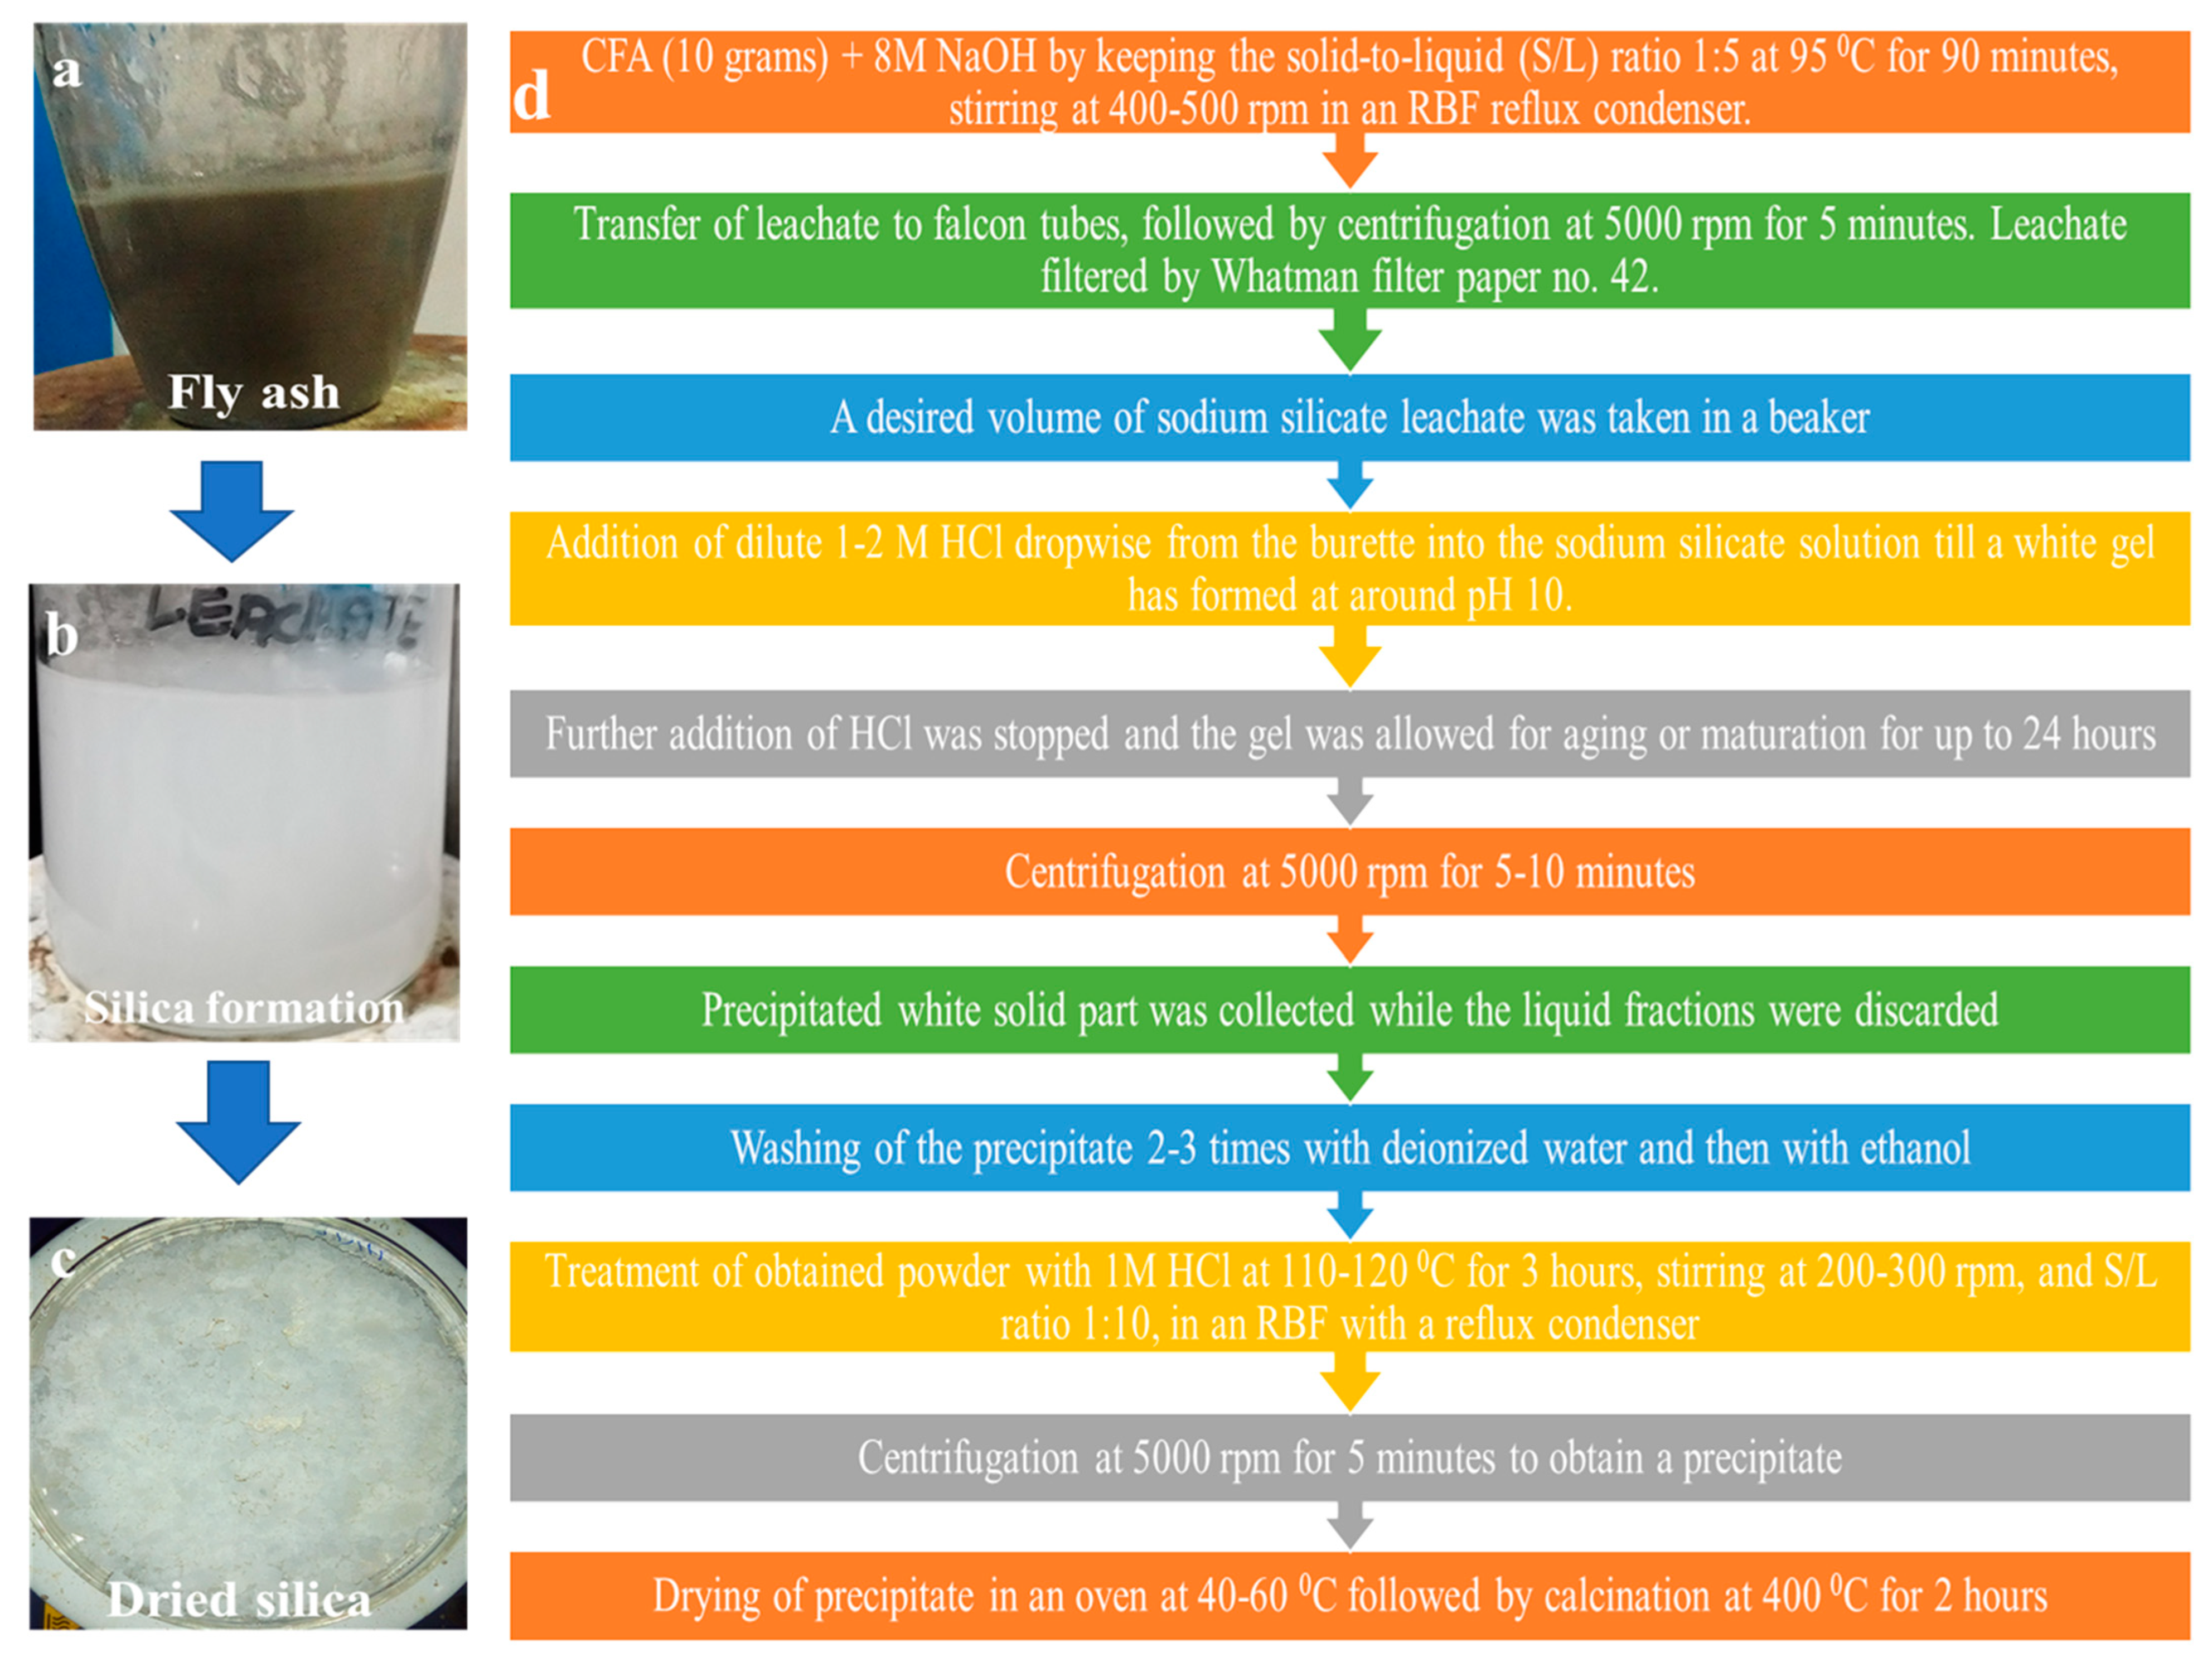
2.2.1. Chemical Synthesis of Silica Nanoparticles from Fly Ash

About 10 g of CFA was mixed with 8 M NaOH by keeping the solid-to-liquid ratio at 1:5 at 95 °C for 90 min, stirring at 400–500 rpm in a 100 mL round-bottom flask with a reflux condenser. After the completion of the reaction, the leachate was allowed to cool at room temperature. The residue was separated from the leachate by centrifugation at 5000 rpm for 5 min and then filtration by Whatman filter paper no. 42. A transparent solution of sodium silicate (Na2SiO3) was obtained and was used for the synthesis of silica, whose pH was ~13–14. The diluted 1–2 M HCl was prepared for the neutralization of the extracted sodium silicate. The dilute HCl was added to the burette and the sodium silicate was taken in a beaker. The HCl was added continuously to the solution, and at around pH 10, a white gel started to form. Further addition of HCl was stopped and the gel was allowed to mature for up to 24 h and left undisturbed after covering it with aluminum foil. After maturation, it was centrifuged at 5000× g rpm for 5–10 min. The precipitated white solid part was collected while the liquid fractions were discarded [22,23]. The precipitate was washed 2–3 times again with deionized water and then with ethanol. Further, the obtained powder was treated with 1M HCl at 110–120 °C for three hours along with stirring at 200–300 rpm, keeping a solid-to-liquid ratio of 1:10, in a round-bottom flask with a reflux condenser. After the completion of the reaction, the particles were obtained by centrifugation at 5000× g rpm for 5 min [24]. Finally, collected particles were dried in an oven at 40–60 °C, and further calcination was conducted at 400 °C for two hours. Figure 1a–d shows the steps involved in the synthesis of nanosilica from CFA [25]. Figure 1a shows a mixture of CFA and NaOH with heating, while Figure 1b shows the formation of gel after titration with HCl, Figure 1c shows the partially dried nanosilica after washing, and Figure 1d shows all the steps involved in the nanosilica formation.

2.2.2. Preparation of 20% Fly Ash Solution

For making a 20% aqueous solution of CFA, 200 g of CFA was added to one liter of distilled water. The containers containing the fly ash and distilled water were sealed and shaken in a horizontal shaker at 150 rpm at room temperature (25–26 °C). The duration of mixing was 24 h, after which the samples were allowed to stand for 12 h before the leachates were collected [14]. The collected leachate was immediately acidified using 10 drops of analytical-grade nitric acid, before major and trace element determination. After acidification, the containers were kept in a refrigerator at 4 °C to prevent any additional chemical reactions. Previously, Yadav and Fulekar (2018) and Yadav et al. (2019) used similar types of CFA aqueous solutions as sources of heavy metals.

2.2.3. Remediation of CFA Heavy Metals Using SiNPs

The remediation of heavy metals by the adsorption process in a multi-component system (Cd, Mn, Zn, Pb, Al, Cu, Co, Cr, Mo, and Ni) was performed using the shake-flask batch process. In a typical batch, 50 mg of SiNPs was dispersed in 150 mL of 20% CFA solution w/v in a 250 mL Erlenmeyer flask. The sample was shaken thoroughly on a rotary shaker at 150 rpm under specified conditions at 30 °C. After selective incubation times, i.e., 0, 10, 30, 60, 90, and 120, minutes, the supernatant samples were analyzed for the residual (Mn, Zn, Pb, Al, Co, Cr, and Ni) concentrations in the final medium. Further, the effect of the dosage was also seen by just doubling the concentration of silica nanoparticles, i.e., 100 mg dispersed in 150 mL of 20% CFA solution. The collected samples were analyzed by ICP-OES for the detection of heavy metals. The operating conditions for the 100 mg SiNPs dose were similar to the 50 mg. The adsorption of CFA heavy metals by CFA-synthesized SiNPs was studied by batch adsorption at room temperature. The batch mode study was selected due to its simplicity.

3. Characterization of the SiNPs

UV-Vis spectroscopy measurement was carried out by dispersing the final purified silica nanoparticles in the distilled water, and analysis was performed using a Shimadzu, UV-1800 double Beam spectrophotometer (Columbia, MD, USA). Fourier transform infrared spectroscopy (FTIR) analysis was performed using a Spectrum SP 65 (Perkin Elmer, Rodgau, Germany) instrument with a solid pellet of nanosilica and KBr formed using a mechanical press. The transmission measurement of the nanosilica and residues was performed from the mid-IR region 400–4000 cm−1 at a resolution of 2 cm−1. A field emission scanning electron microscope (FESEM) was used for the morphological features and shape of SiNPs and residue, by using Nova NanoSEM, FEI 450 (Eindhoven, The Netherlands). The elemental composition of the SiNPs and residue was analyzed using Oxford-made, electron diffraction spectroscopy (EDS) attached to the FESEM. The XRD pattern was measured by using a D-8 Advance Bruker (Bremen, Germany) instrument in powder form. The XRD patterns were recorded in the 2-theta range of 5–70°, with a step size of 0.02 and a time of 2 s per step at 30 kV and a current of 30 mA. Transmission electron microscope (TEM) was used for the internal morphology of the synthesized SiNPs. Moreover, high-resolution TEM (HRTEM) was used to obtain the d-spacing of the SiNPs, while the scattering area electron diffraction (SAED) pattern was used for the identification of the crystalline or amorphous nature of the NPs. SiNPs dispersed in distilled water under sonication for 10 min (from the UV-Vis analysis) were loaded on carbon-coated copper grids by drop cast techniques. The sample was dried in an oven prior to imaging under different resolutions using FEI Model Technai G2 S Twin (200 kV, FEI, Lexington, KY, USA).

4. Results and Discussion

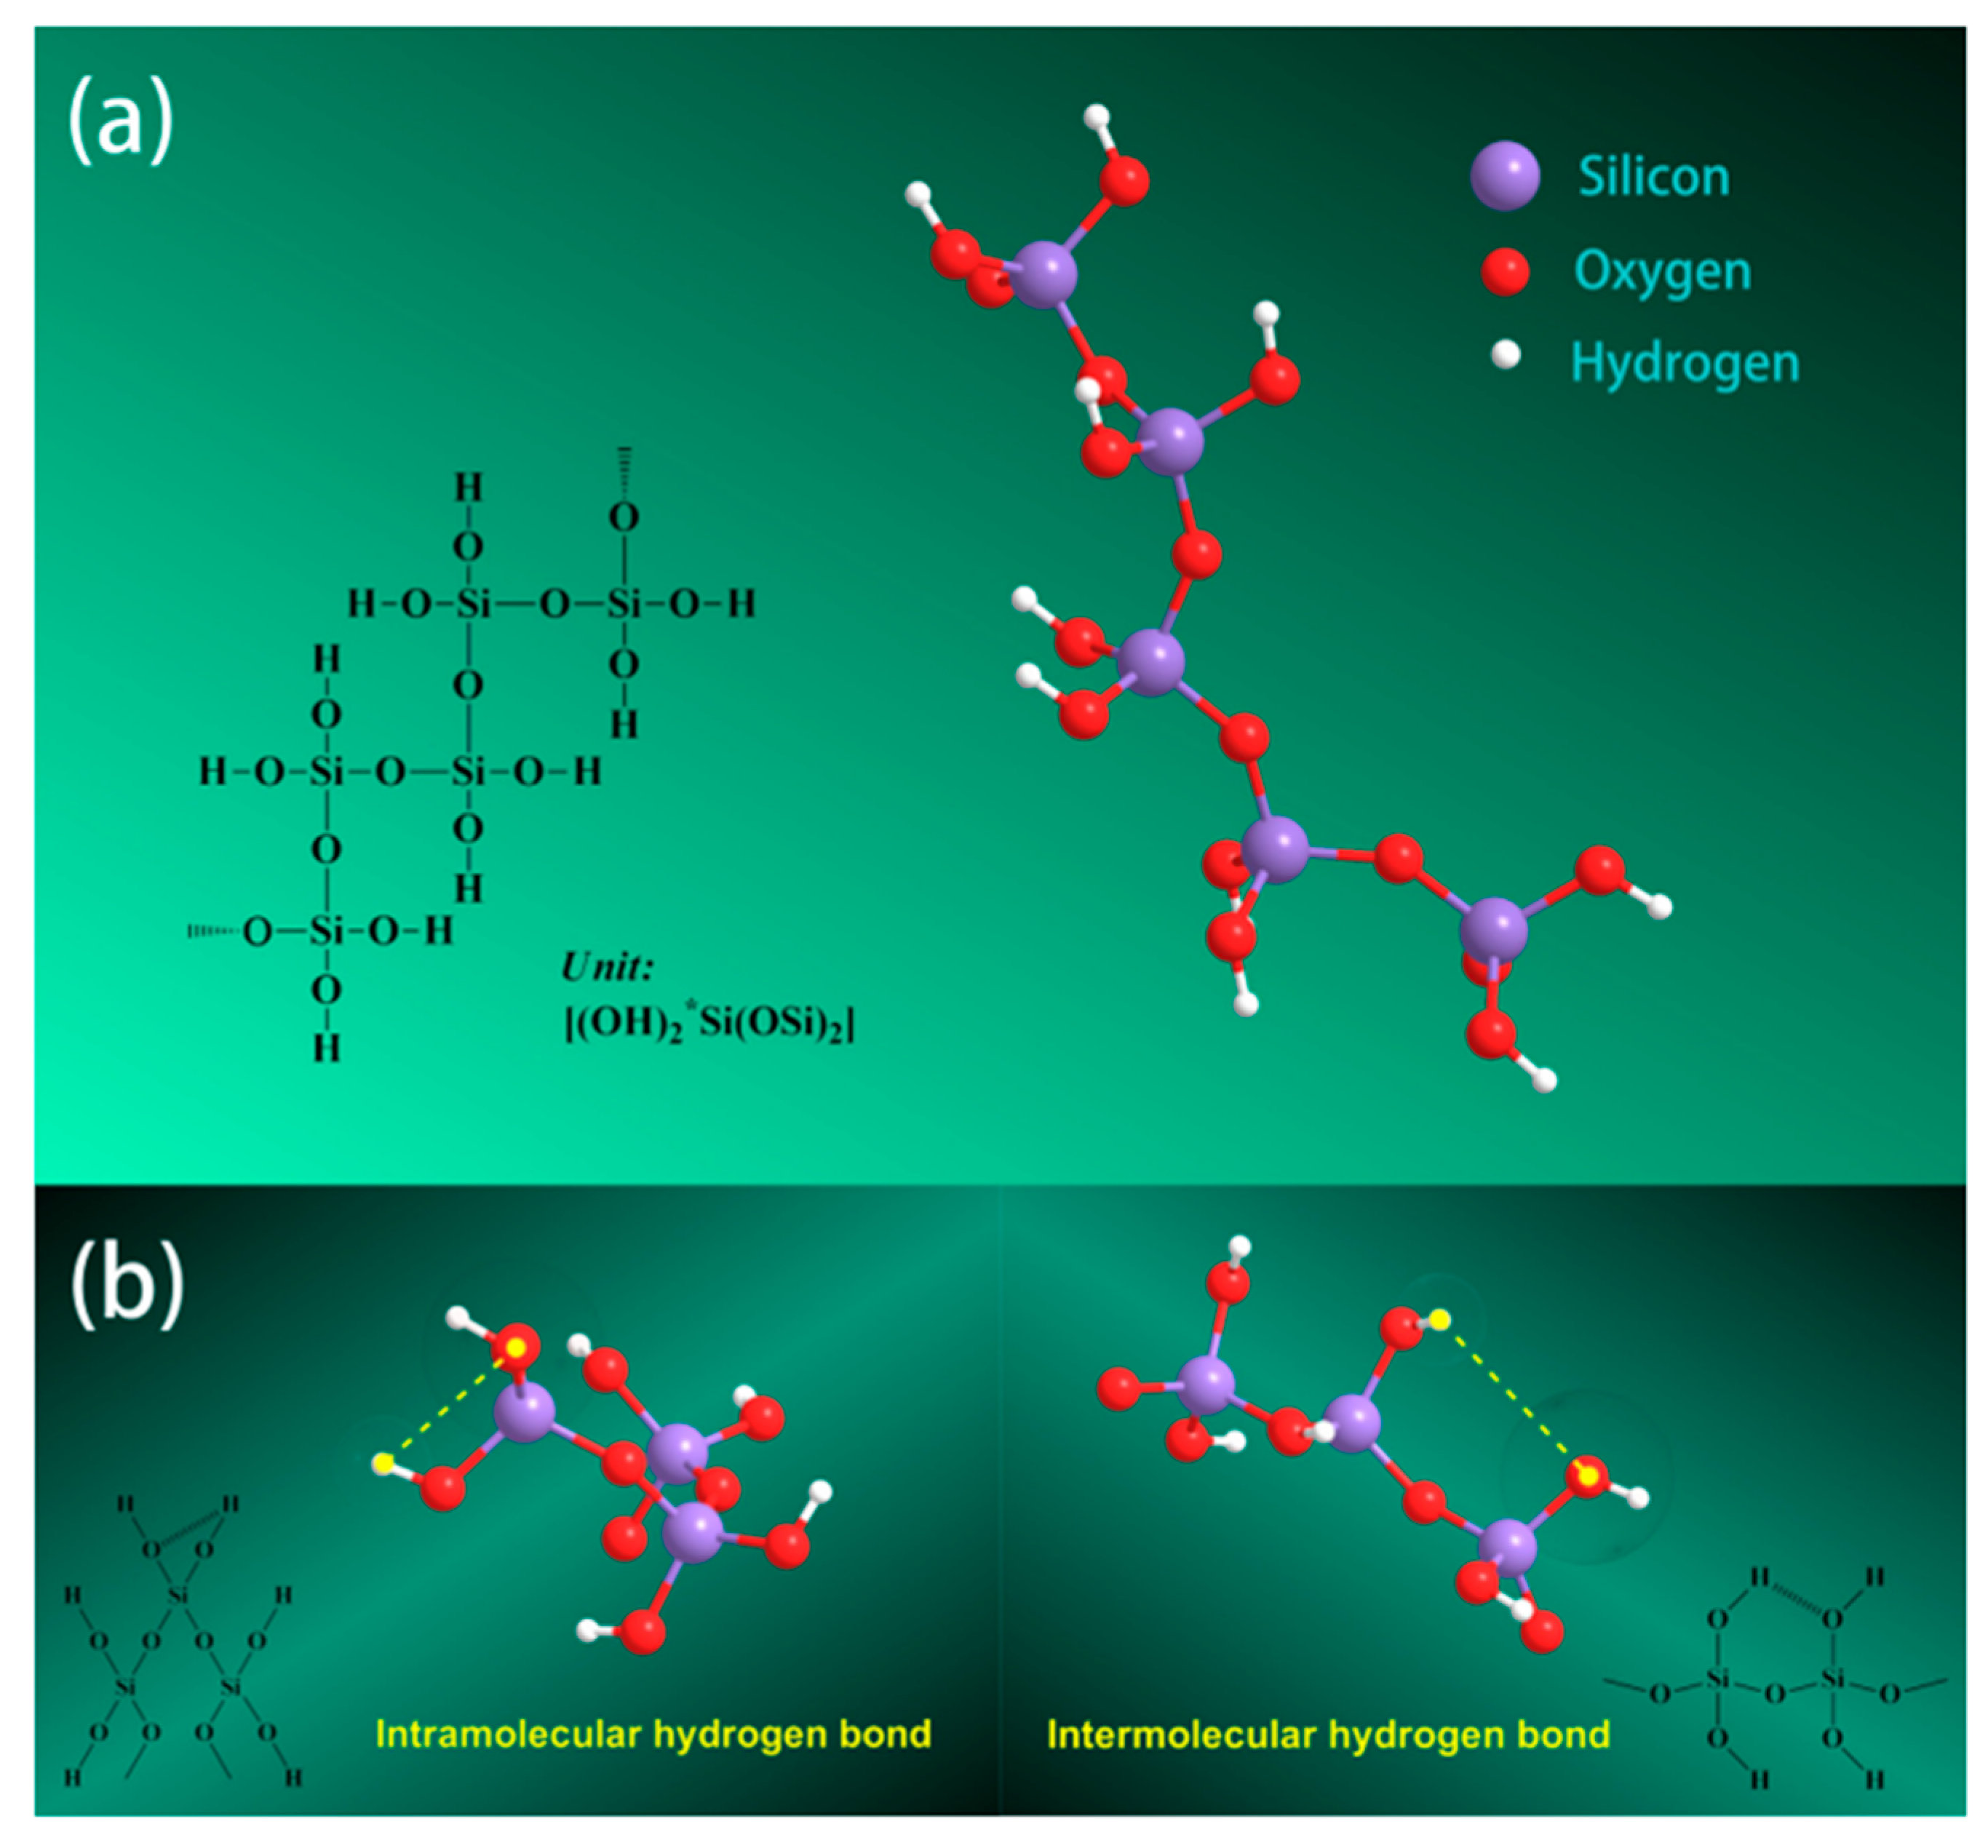
4.1. Mechanism of Silica Nanoparticle Extraction Process

The silica content in CFA was about 40–60%, followed by alumina, ferrous and traces of rutile phases, and Mn, Ca, K, P, etc. Silica is acid-insoluble and could react easily with strong hydroxides (NaOH) at 90–95 °C for 90 min along with stirring by the alkali–dissolution method. Such an approach has three basic steps; firstly, extraction of silicates from the source, i.e., CFA; secondly, condensation, followed by drying to obtain powdered silica. The obtained alkaline sodium silicate was filtered and when titrated with dilute HCl (1 M) as a precipitating agent. A transparent gel was formed at the top of the beaker. The silicate was extracted from the CFA in the form of crude sodium silicate, then the silicon hydroxides formed in the presence of HCl, and finally, after condensation and drying, nanosilica was obtained, as shown in the Reactions (1–3):
SiO 2   CFA + 2 NaOH   Na 2 SiO 3   Sodium   silicate + H 2 O
Na 2 SiO 3   Sodium   silicate + 2 H 2 O + 2 HCl Si   OH 4 Silicon   hydroxides + 2 NaCl = Si OH + = Si OH = Si O Si   Silica   nanoparticle + H 2 O
Reactions (1) and (2) show that the silicate from CFA reacts with NaOH and forms crude sodium silicate, which on acidic treatment or acidification with dilute HCl leads to the formation of gel at a pH of around 7–8, which is a most important factor for silica synthesis using sol-gel technique. During this step, the silicon hydroxide species condenses to form a siloxane bond (Si-O-Si). A team led by Zhang [26] and Zulkifli independently reported a similar observation during silica production from rice husk ash [27]. Zhang showed the formation of nanosilica by titrating sodium silicate with sulphuric acid at a pH of around 7–9. In another approach, Liang and their team showed a similar scheme for the synthesis of nanosilica from CFA from one of the TPPs located in China in Reactions (3) and (4). Figure 2a shows the hypothetical molecular structure of hydroxylated silica, while Figure 2b shows H-bonds between silanols.
SiO 2   S + 2 NaOH   aq Na 2 SiO 3   aq + H 2 O
Na 2 SiO 3   aq + 2 H 2 O + 2 HCl   aq SiO 2 s + 2 NaCl   aq + H 2 O

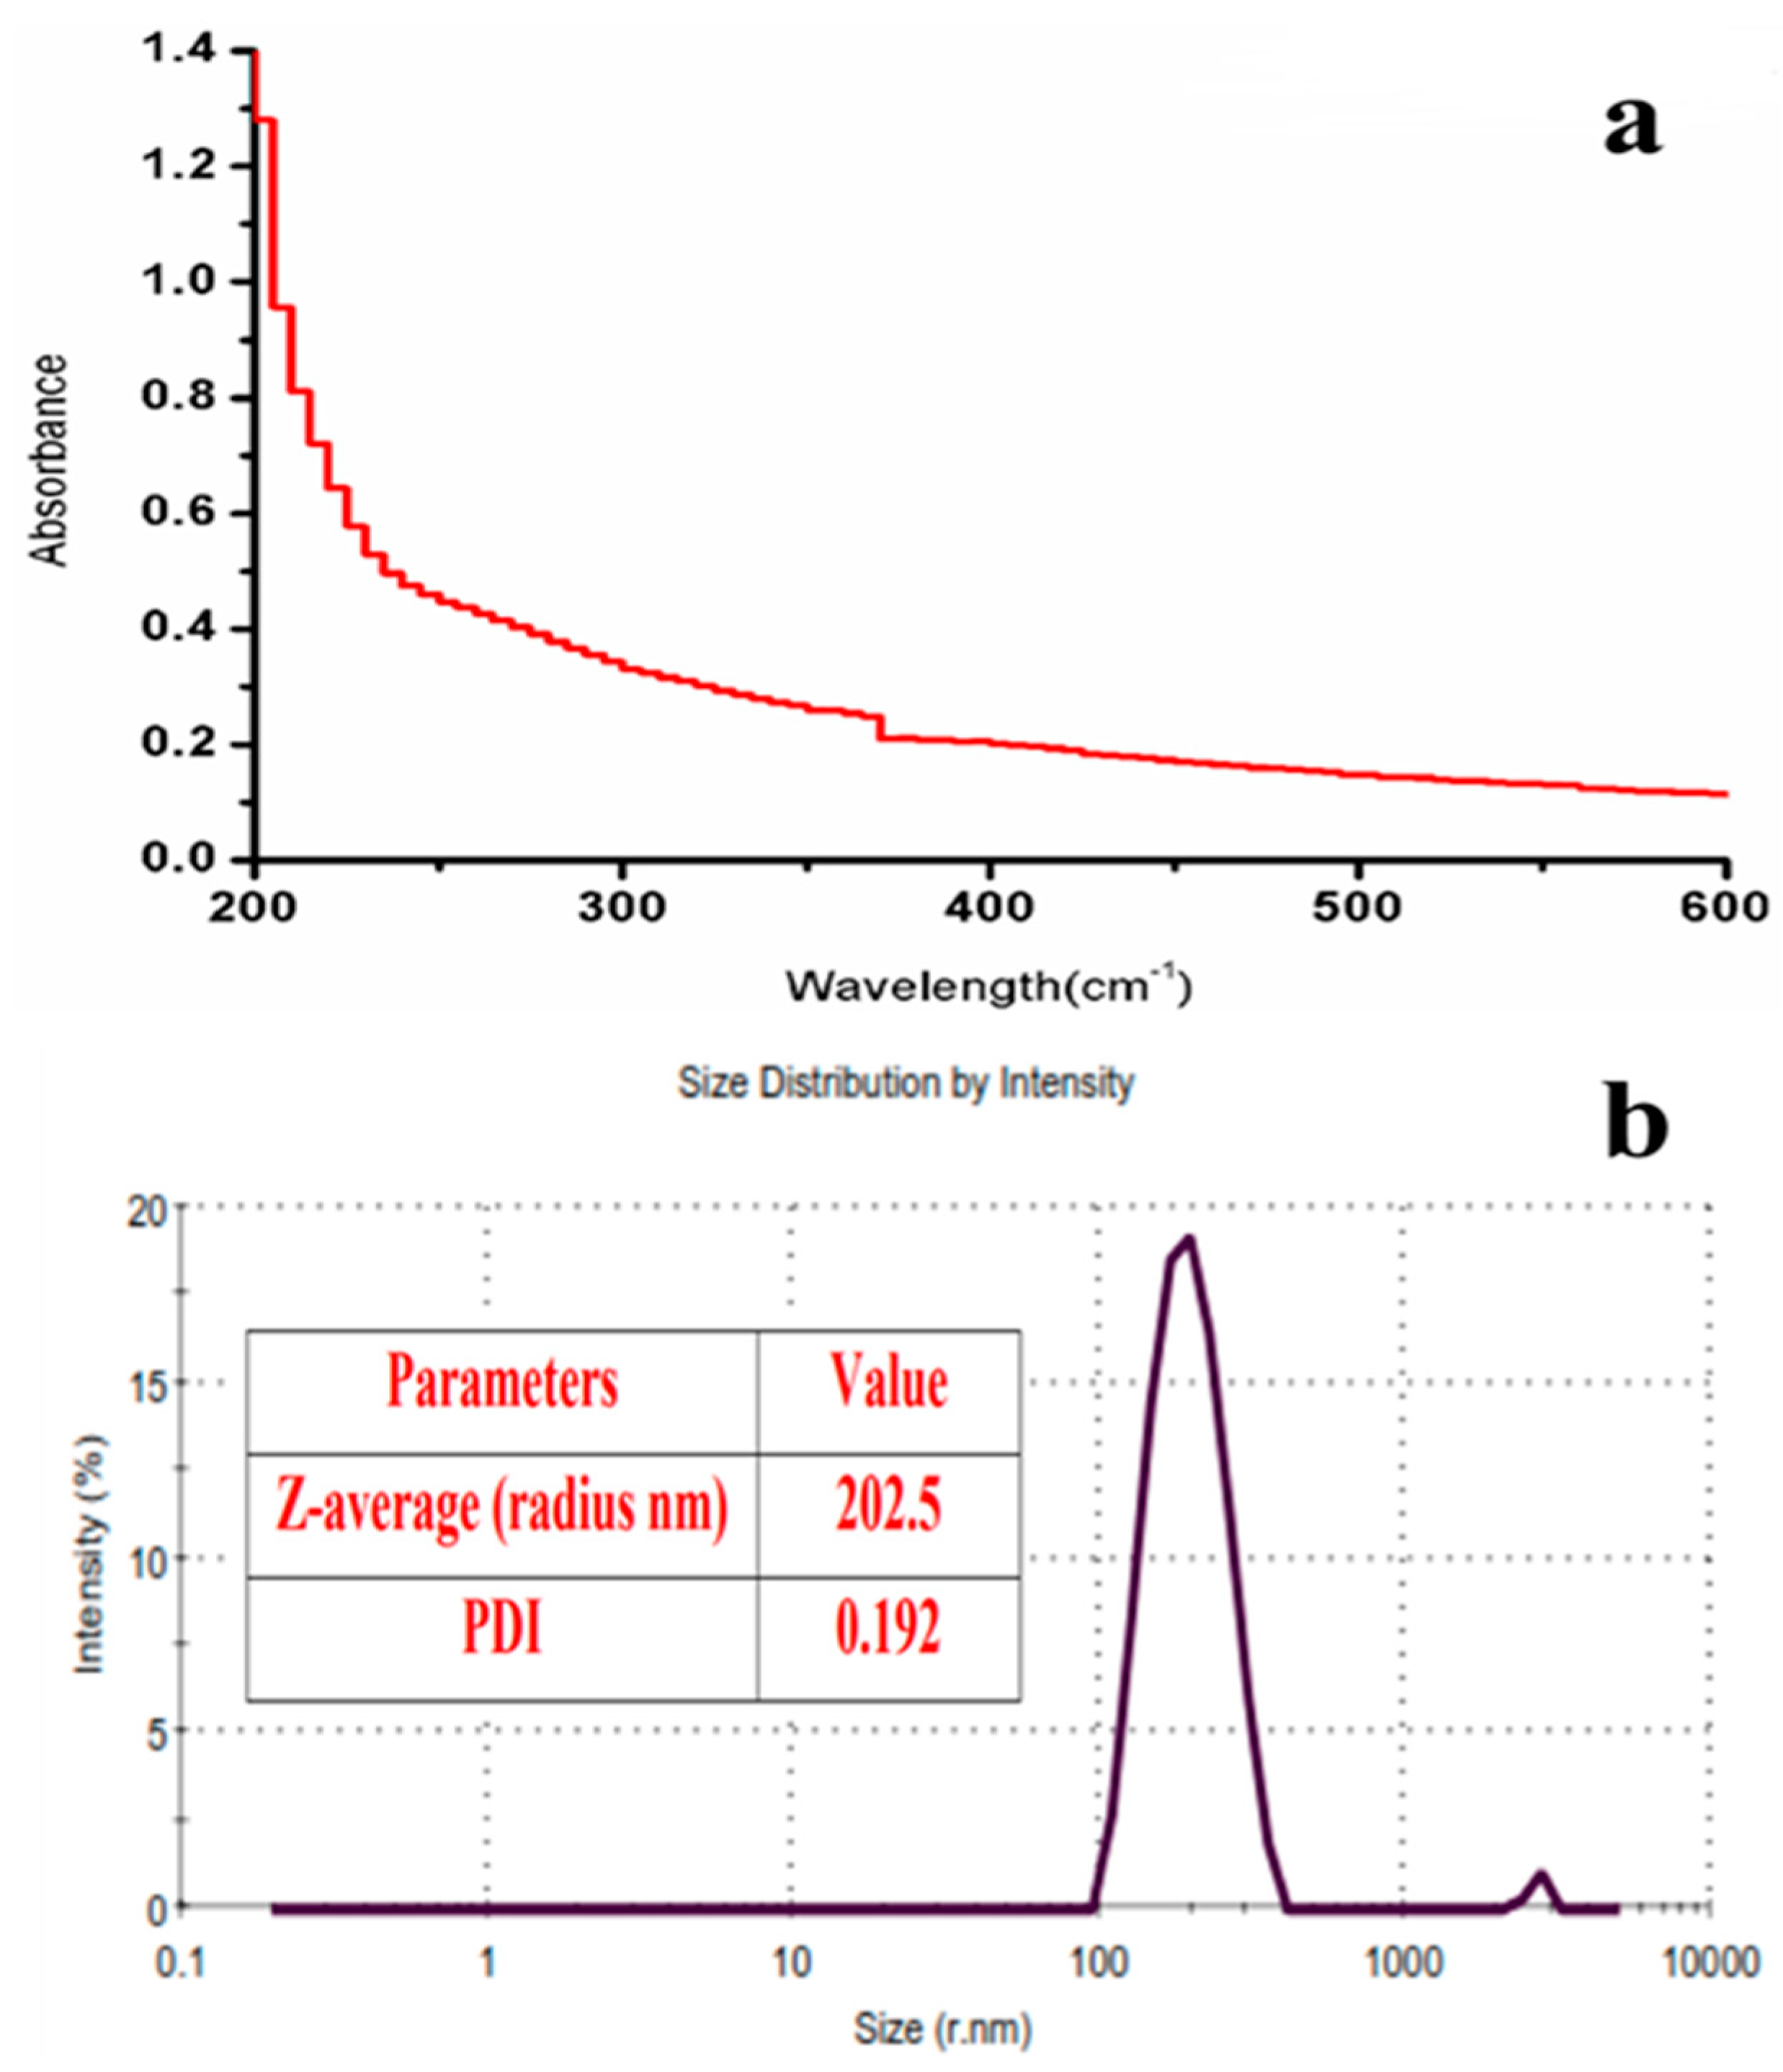
4.2. UV-Vis and PSA Measurements

The as-synthesized SiNPs were dispersed in deionized water, and after 10 min of sonication at 40 kHz (Sonar, 40 kHz), the sample was divided into two parts; one part was used for the UV–Vis measurement in the range of 200–600 nm, while the second part was used for the PSA analysis at room temperature. The UV–Vis absorbance peak at 360 nm indicated the synthesis of SiNPs from the CFA in Figure 3a. The particle size distribution of the SiNPs, shown in the PSA graph in Figure 3b, reveals that the average size of the particle was 202.5 nm, and the polydispersity index (PDI) was 0.192.

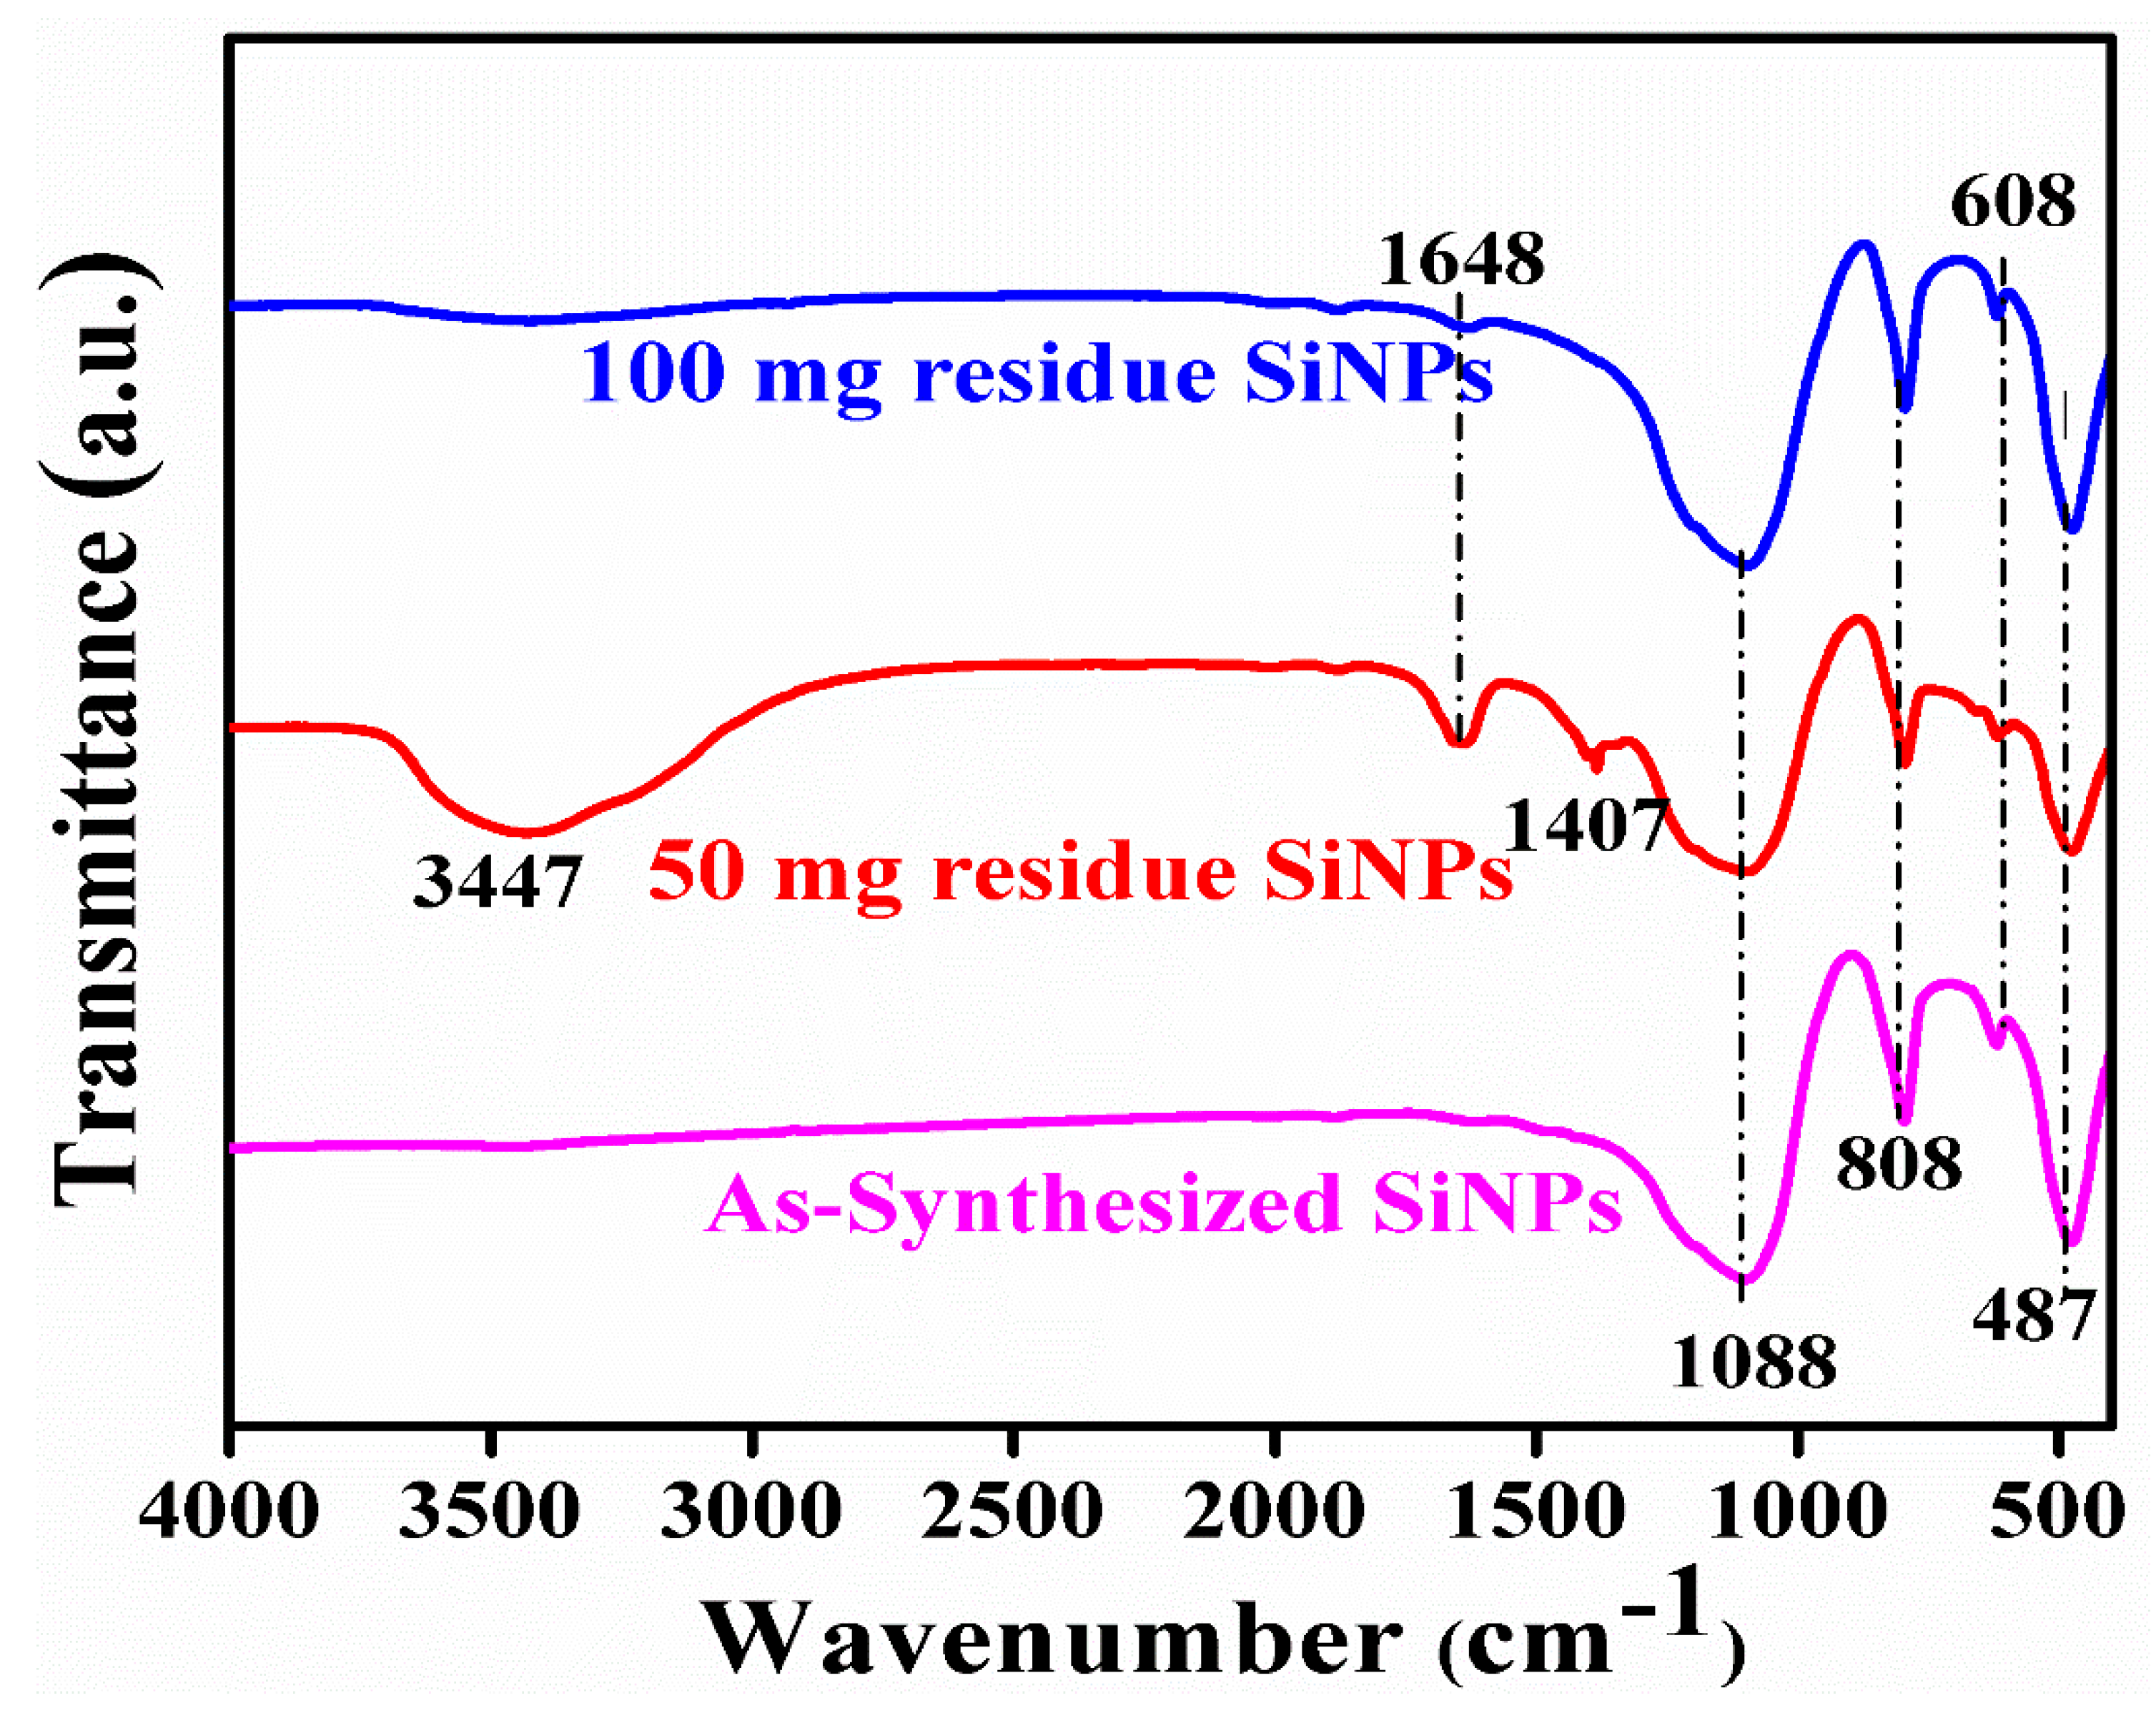
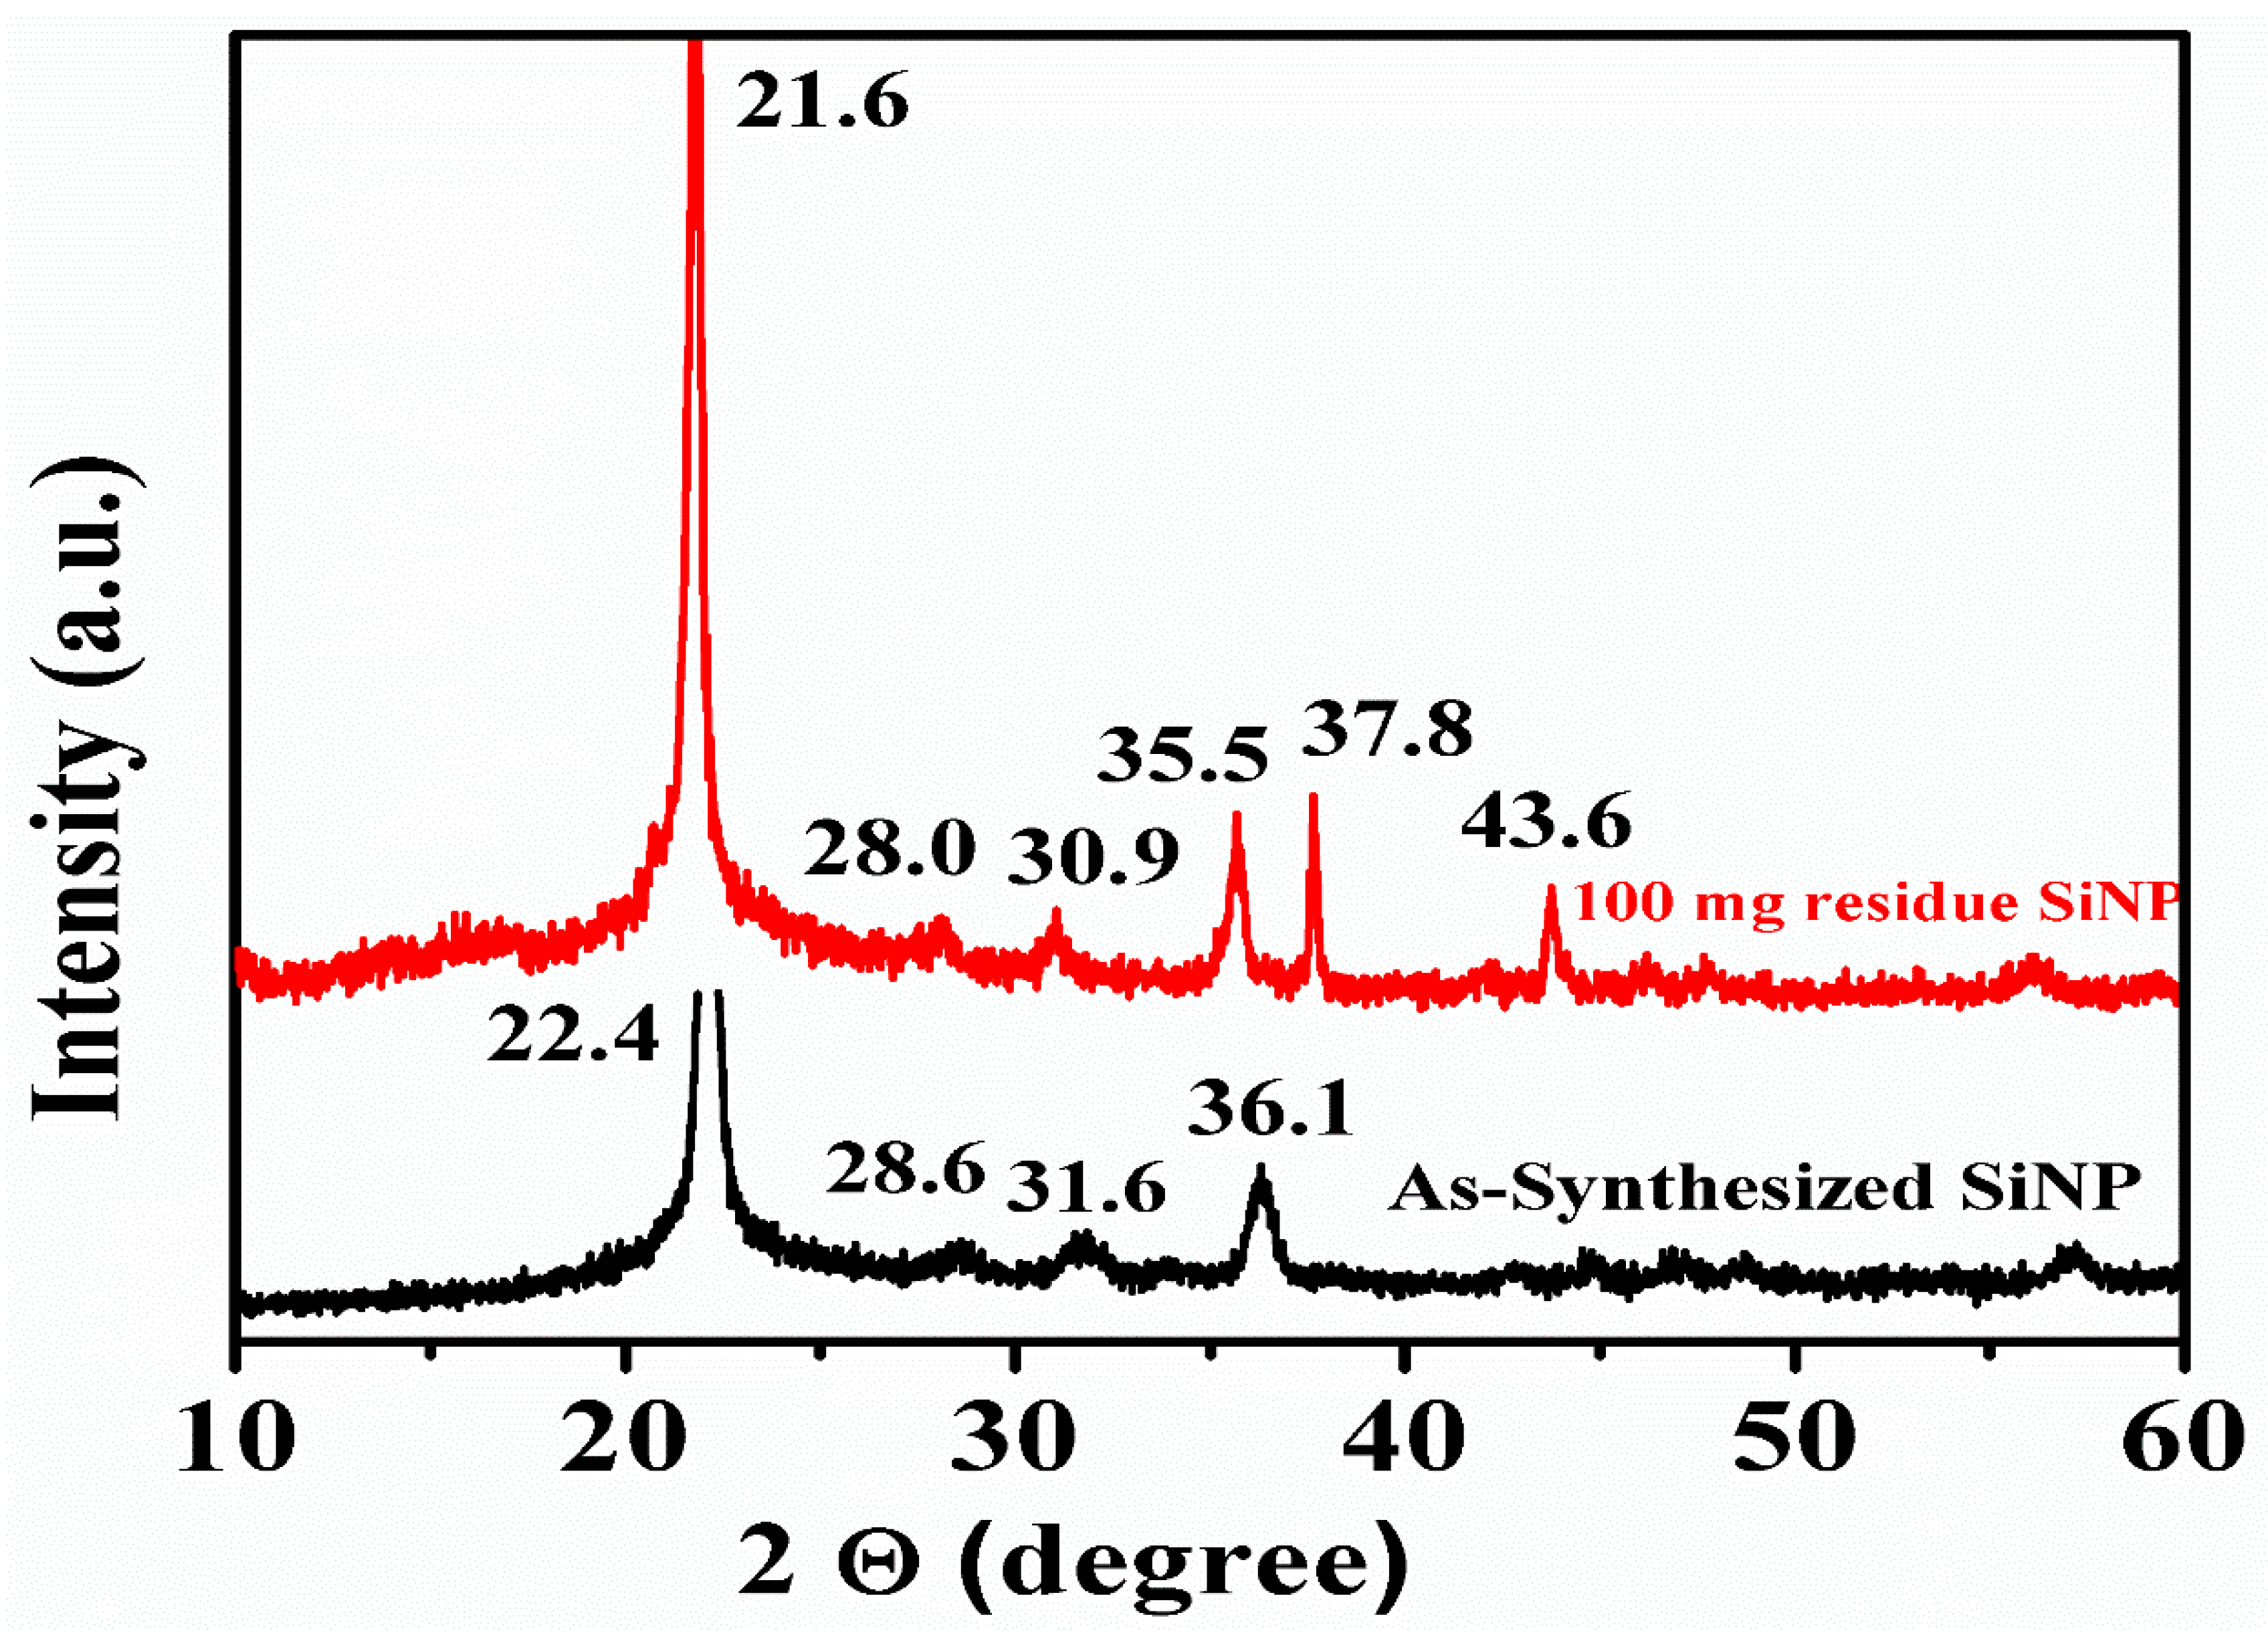
4.3. Mineralogy of SiNPs: FTIR and XRD

A typical FTIR spectrum of SiNPs in Figure 4 shows the three characteristic bands at 487 cm−1, 608 cm−1, 808 cm−1, and 1088 cm−1. The sharp band at 487 cm−1 is attributed to the bending vibrations of Si-O-Si, while the band at 808 cm−1 is due to the symmetric vibrations of Si-O-Si, and a broad band at 1088 cm−1 is attributed to the asymmetric vibrations of Si-O-Si of silica [27,28]. Several investigators have obtained similar results with nanosilica synthesized from RHA, CFA, or other agricultural waste. For instance, Zhang and their team showed bands at 480, 800, 1087 1426, 1631, and 3425 cm−1 for the obtained nanosilica from RHA [26]. Yadav and Fulekar (2019) also obtained nanosilica from CFA and obtained bands in the same regions [25]. Imoisili and Jen (2022) also obtained bands at 471.4, 580.2, 805.4, 1070.4, 1429.2, 1650.3, and 2920.4 cm−1 for nanosilica from CFA obtained from one of the South African TPPs [19]. Liang et al. also obtained bands for nanosilica from fly ash at 466, 789, 1085, 1635, and 3440 cm−1, which is in agreement with the result obtained by the current and previous authors [18].
The XRD pattern in Figure 5 shows the amorphous nature of synthesized SiNPs with a peak at 22.4°. A peak starts near 20° and ends at 24.5°, which confirms the amorphous nature of SiNPs. Besides this, it also has small peaks at 36.1°, which could be due to the quartz. In addition to this, it has also two small intensity peaks at 28.6° and 31.6°. Zhang and their team also obtained similar peaks for the crystalline nanosilica obtained from RHA. The investigators obtained peaks at 29, 32, 38, 50, 55, 60, and 74°, while in our case a peak was obtained at 29 and 36°, which confirms that it was due to silica. The only difference is that Zhang and the team obtained crystalline nanosilica, while in our case, it was amorphous nanosilica. Imoisili and Jen (2022) also obtained a broad peak at 2Θ = 19–25°, which confirms the amorphous nature of the synthesized nanosilica, which is consistent with the ICDD database PDF# 01-089-8935 [19,25]. Liang and their team also obtained a broad hump (20–30 two theta degree) for the amorphous nanosilica and reported the absence of any crystalline phase in the nanosilica [18].
The synthesized SiNPs were amorphous and free from impurities, a result further supported by the XRD and EDS.

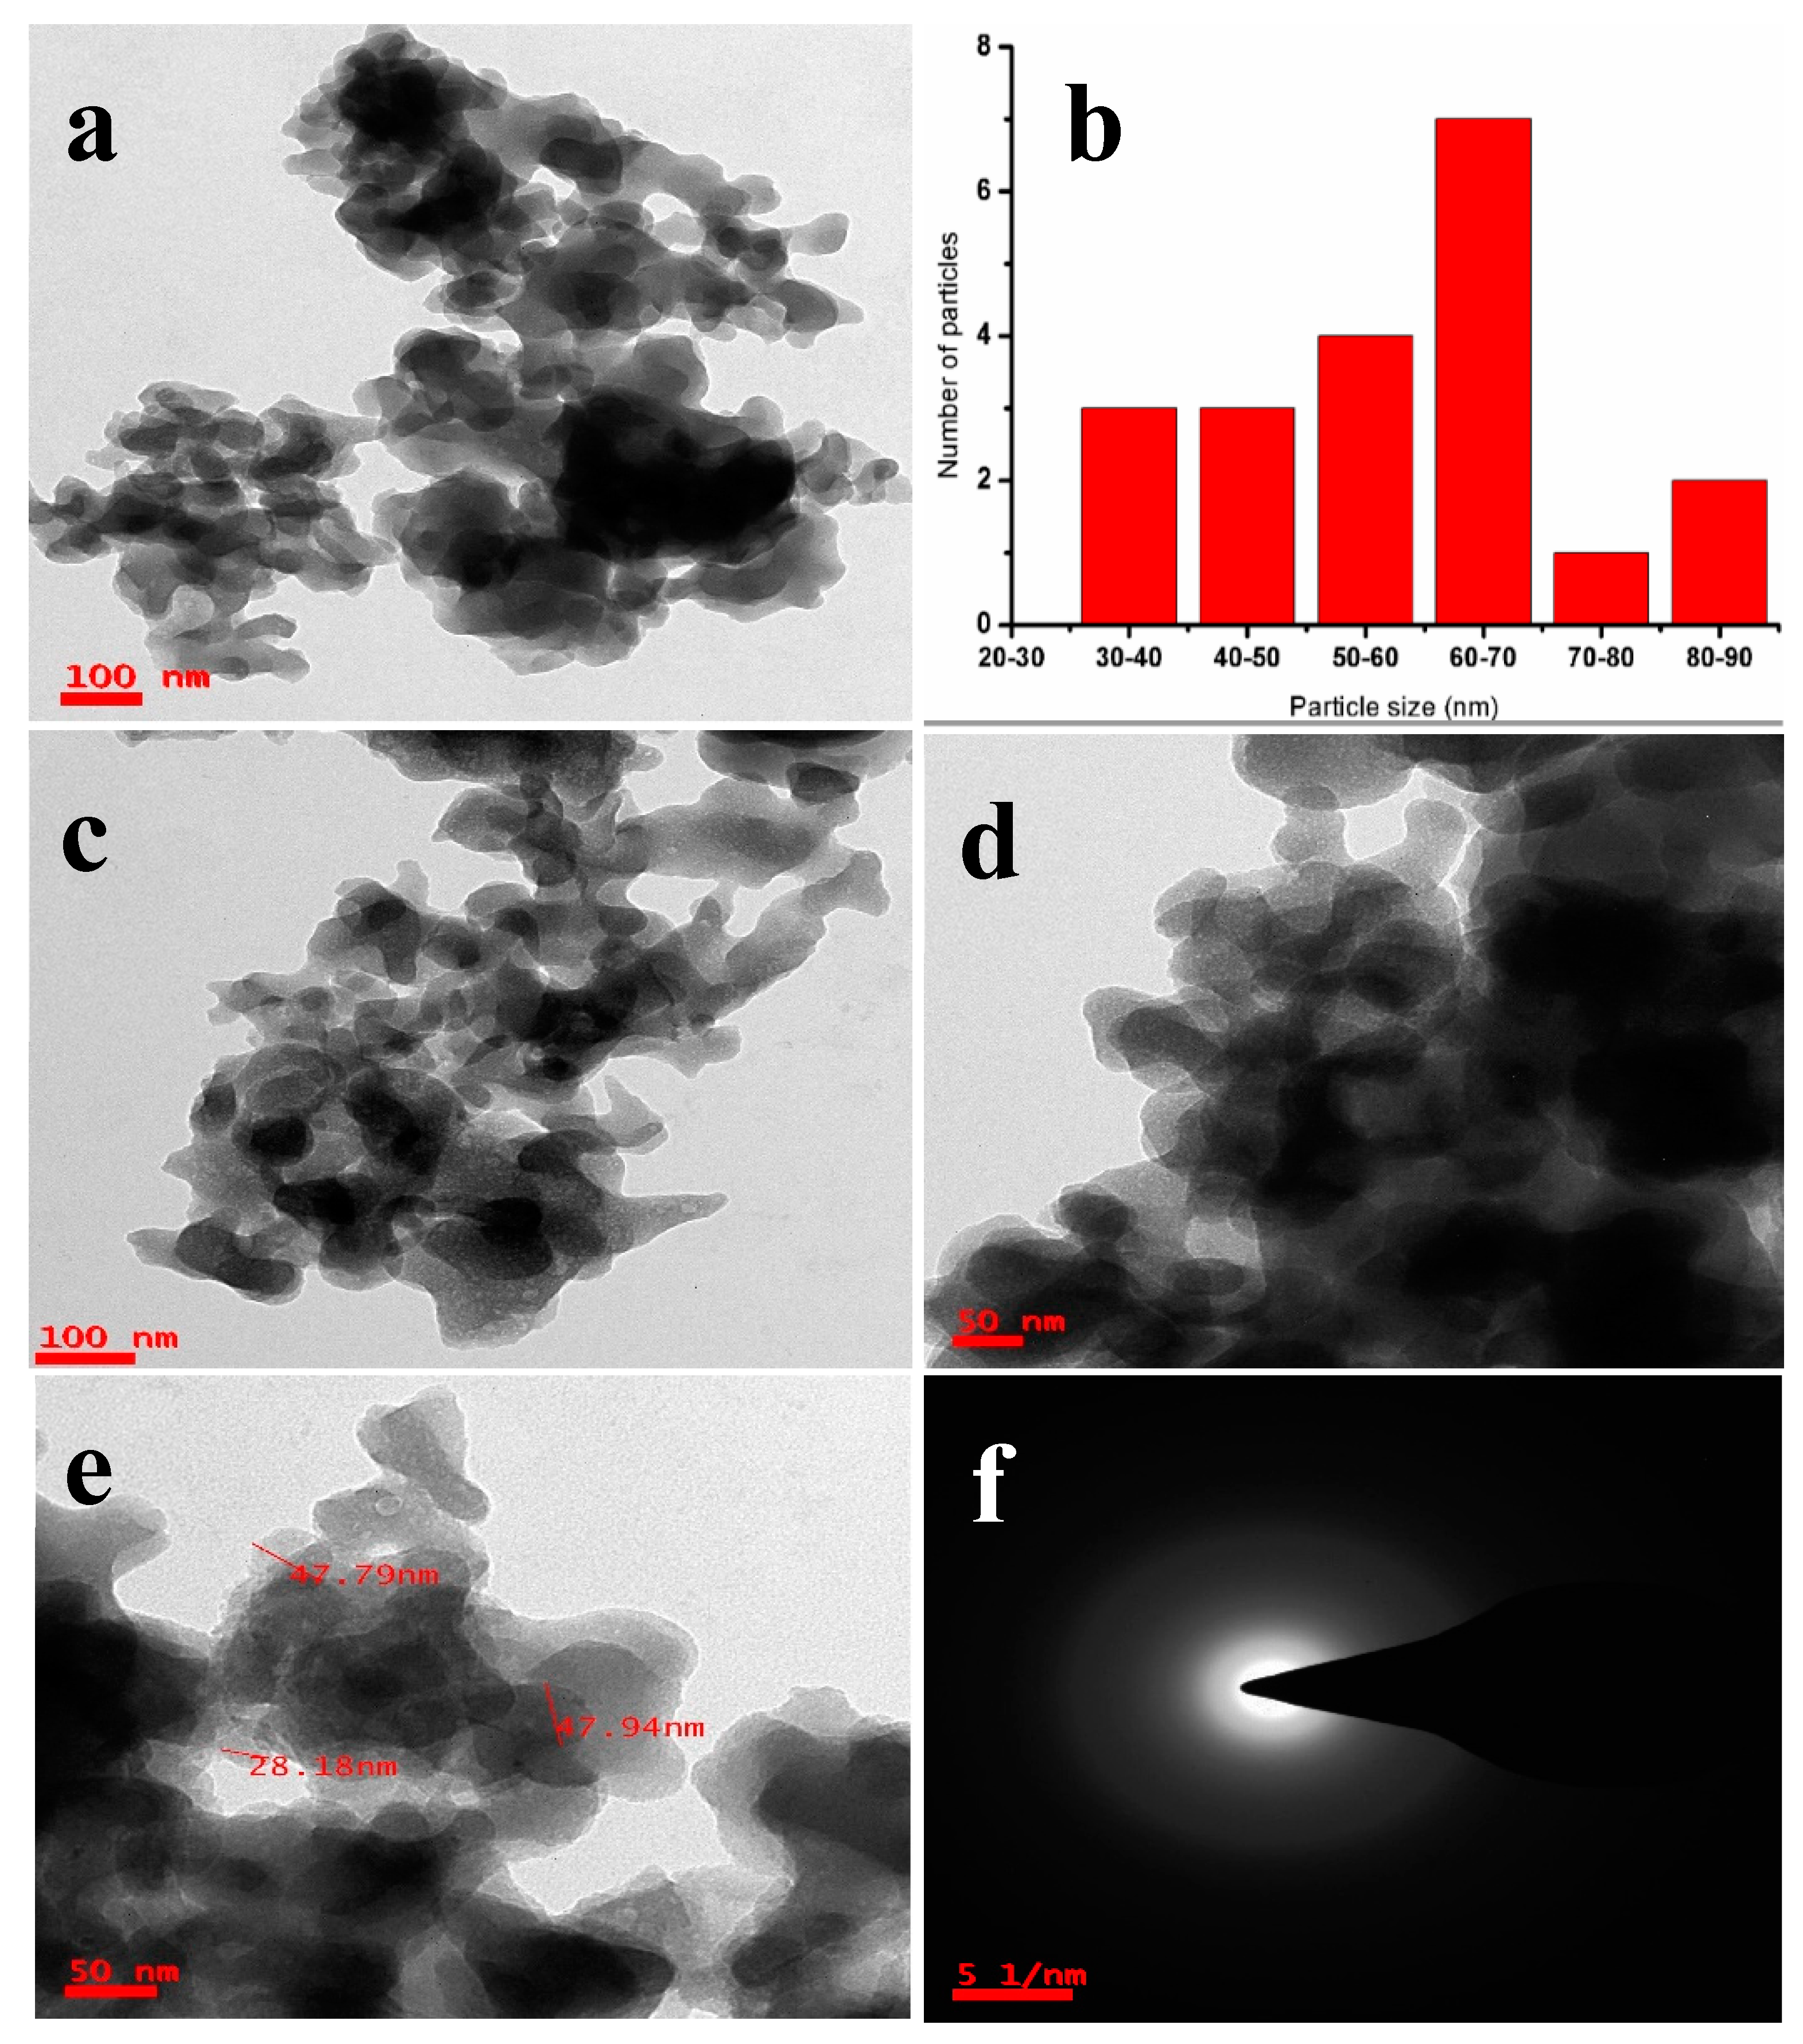
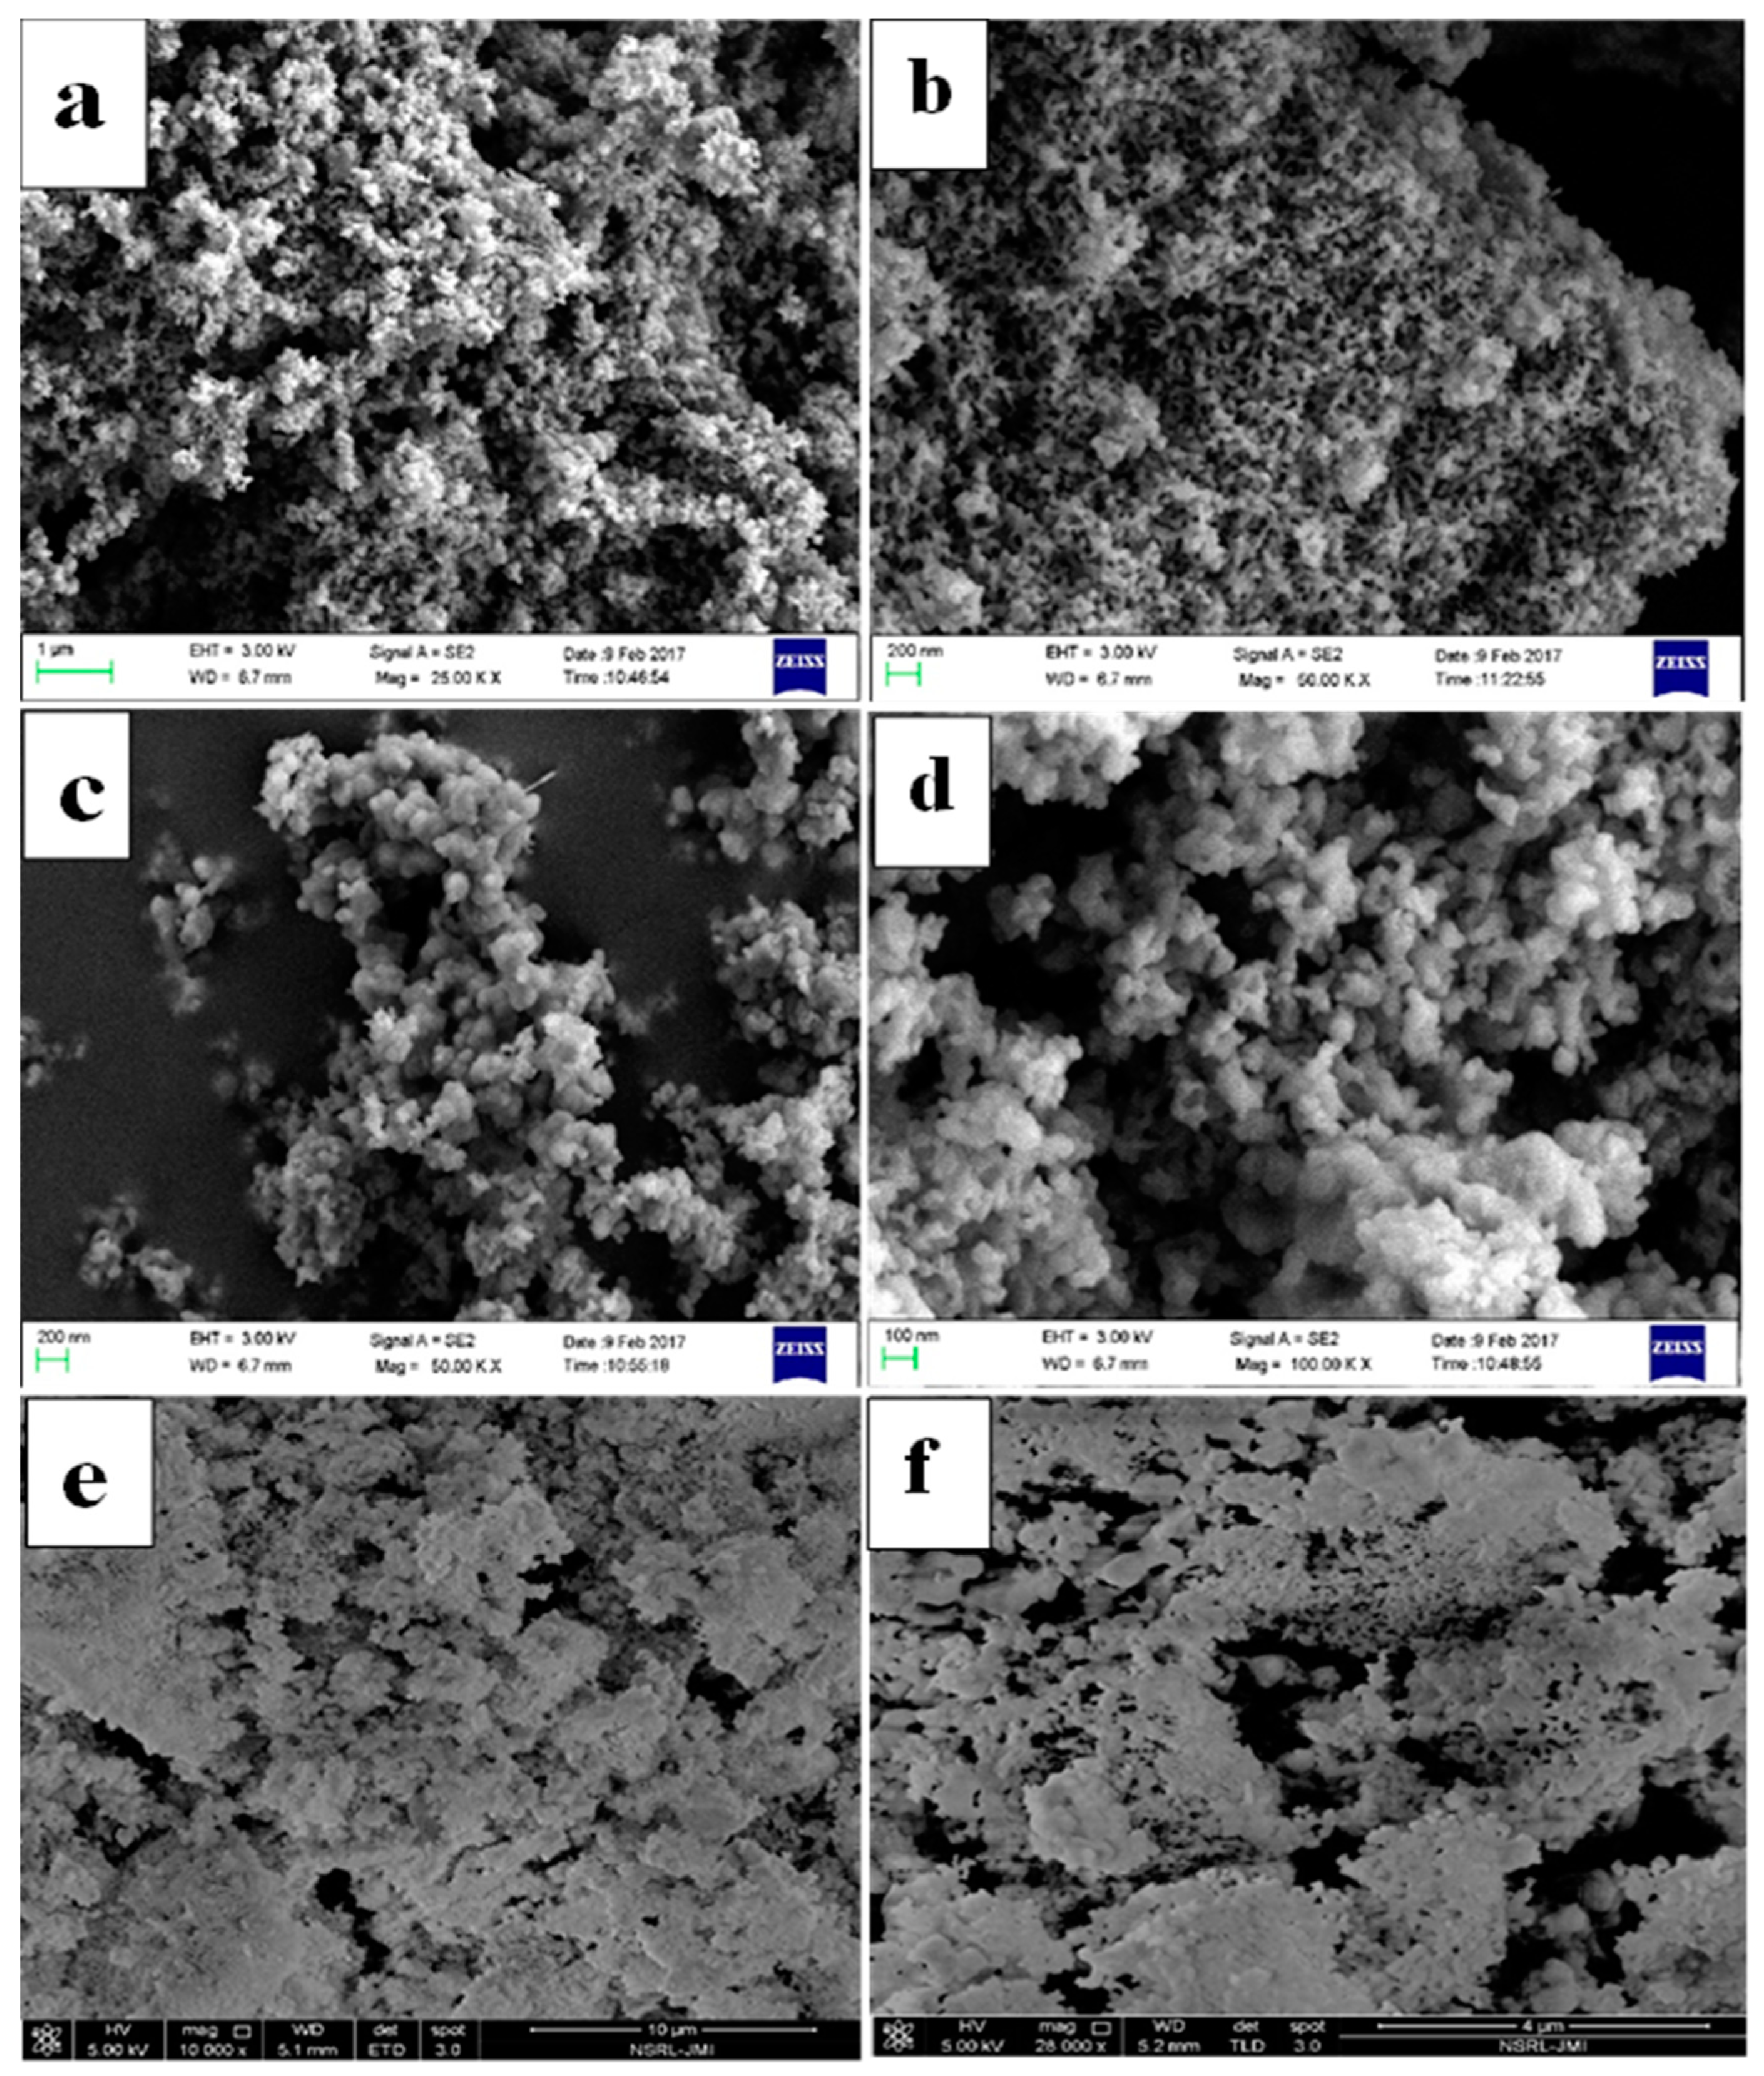
4.4. Morphology of Silica Nanoparticles: FESEM, TEM, and AFM

The TEM images in Figure 6a,c (at 100 nm scale) reveal the aggregated, network-like structure whose size varies from 28–70 nm. While Figure 6d,e show nanosilica at a resolution of 50 nm that is mesoporous in structure, spherically shape, and fused together to form a large structure. Imoisili and Jen (2022) reported the synthesis of spherical nanosilica that was highly aggregated and attained a size of about <200 nm [19]. Yadav and Fulekar (2019) also reported the synthesis of nanosilica of similar dimensions, along with aggregation from CFA [25]. Liang et al. also reported spherical nanosilica particles 20–40 nm in size from the fly ash from China province [18]. Figure 6b shows histograms of nanosilica with sizes varying in the range 30–90 nm, with the average size and majority of the particles in the range of 60–70 nm. The SAED pattern in Figure 6f shows its mesoporous and amorphous nature, which was also evidenced by the FESEM and XRD data.
The FESEM micrographs of the synthesized SiNPs in Figure 7a at 1 micron and Figure 7b at 200 nm scale reveals spherical particles aggregated together to form a network with a final floral shape. The sizes of the individual particles varied in the range 10–60 nm. Figure 7c shows FESEM images of spherical and floral-shaped nanosilica at 200 nm scale. The spherical and floral shapes and the fusion forming a network-like structure is clearly evident from Figure 7d at 100 nm scale. Even after calcination and purification, the morphology and size of the synthesized nanosilica remained more or less the same, i.e., spherical. The floral shape and aggregation of the SiNPs remained intact even after the purification. Imoisili and Jen (2022) obtained spherical, aggregated nanosilica of sizes varying in the range 48–87 nm with an average diameter of 67 nm. Thus, the obtained result was consistent with the reported work. However, the EDS showed the presence of only Si and O in the sample in the case of Imoisili and Jen (2022). The only difference was that the nanosilica synthesized by Imoisili and Jen (2022) was larger than that in the present study [19]. The obtained result was also consistent with the result shown by Yadav and Fulekar 2019 [25]. Uda et al. also obtained similar morphology for the nanosilica synthesized from RHA [29].

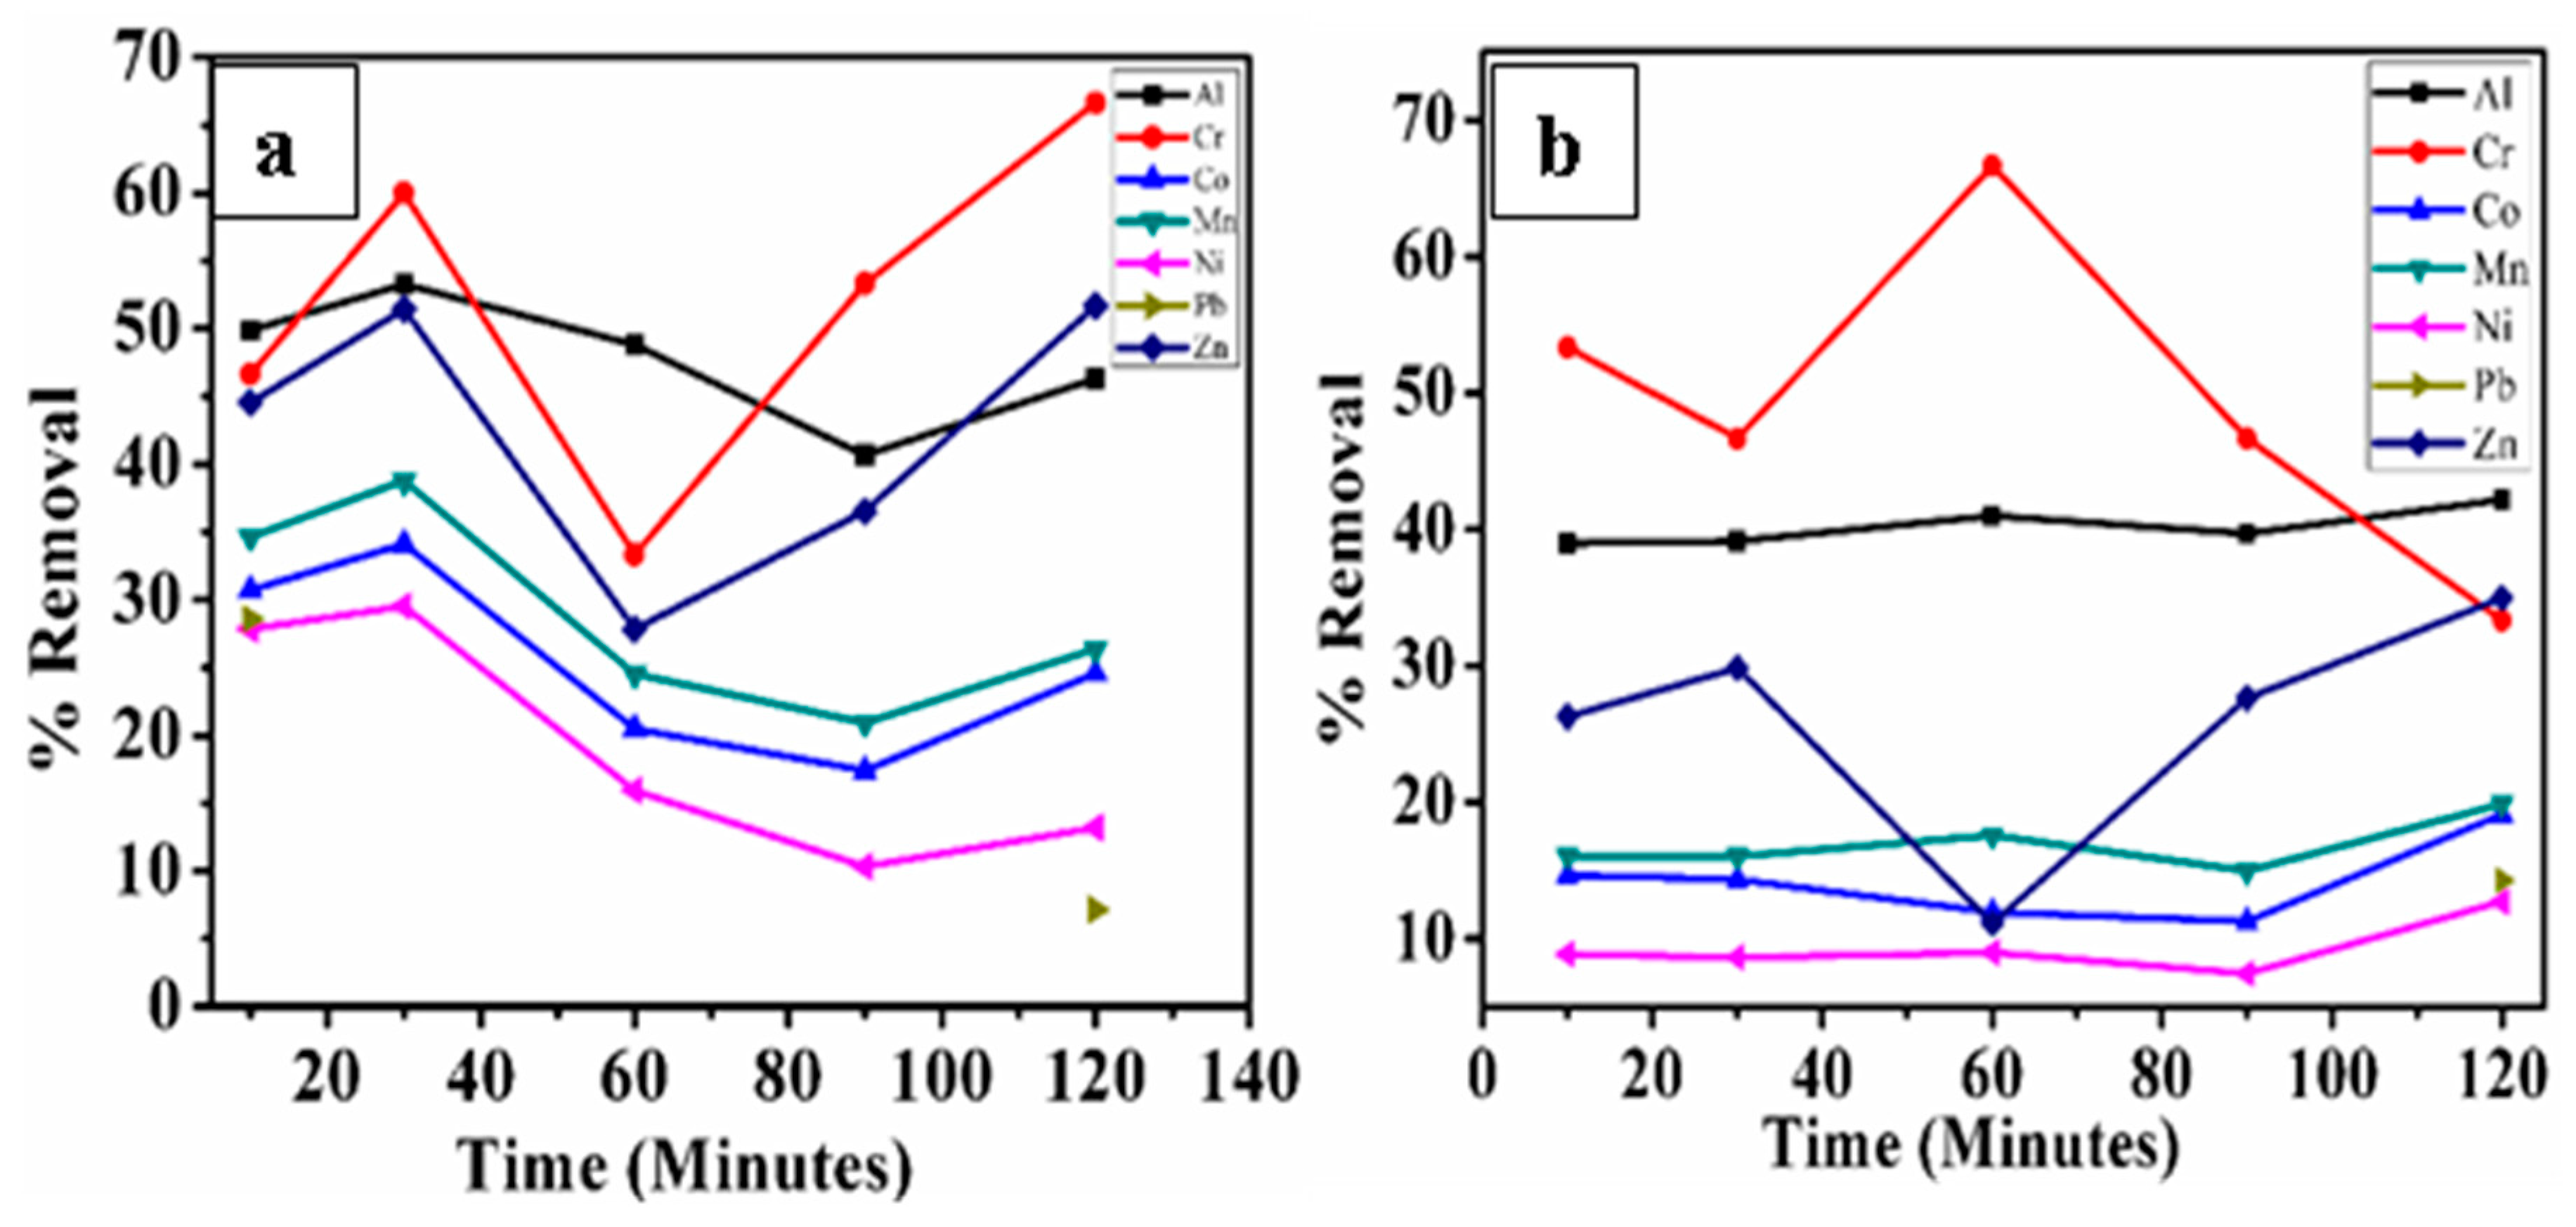
5. Remediation of Heavy Metals by Batch Adsorption Study

An aliquot of about 5 mL was taken after every regular interval and analyzed by the ICP-OES. The per cent removal of heavy metals was calculated by the following formula:
R e m o v a l   e f f i c i e n c y   % = C o C t C o × 100
where
Co = initial concentration
Ct = concentration at a particular time
Unit of the value is (mg L−1)
(i)
Removal of Al ions
The percent removal of Al with both 50 mg and 100 mg increased at 10 min, then decreased at 30 min; after that, at 60 min, a slight decrease occurred with 50 mg and an increase occurred with 100 mg; the percent removal reached the same level at 90 min, after which there was an increase in the value at 120 min with both the dosages. The maximum removal of Al reached 50 mg at 30 min, as shown in Figure 8.
(ii)
Removal of Cr ions
The percent removal of Cr in both doses increased at 10 min and then decreased at 30 min after which the % increased at 60 min with 100 mg silica, but decreased gradually at 90 and 120 min. With 50 mg, the removal percentage decreased at 60 min and then increased gradually at 90 and 120 min, where it reached the highest removal percentage of Cr at 120 min. Cr removal by silica nanoparticles or silica nanocomposites was performed by a team led by Choi [30].
(iii)
Removal of Co ions
The percentage removal of Co increased at 10 min with both the dosages, and then decreased at 30 min and kept on decreasing with 50 mg until 90 min, and finally an increase was noticed at 120 min. With 100 mg, a slight increase at 60 min remained constant at 90 min, and finally, an increase at 120 min. The highest removal percentage of Co was at 30 min with 50 mg of silica.
(iv)
Removal of Mn ions
The percentage removal of Mn increased with both at 10 min but increased at 30 min in both, after which the value gradually decreased at 60 and 90 min with 50 mg, and increased slightly at 120 min. With 100 mg, there was an increase in the concentration of Mn at 60 min, with a slight decrease at 90 min and finally an increase at 120 min. The highest removal percentage of Mn reached 50 mg at 30 min.
(v)
Removal of Ni ions
The percentage removal of Ni with both the dosages increased at 10 min, after which it decreased at 30 min in both. After this, the value continuously decreased at 60 and 90 min with 50 mg, and finally there was a minor increase at 120 min. With 100 mg, an increase was seen at 60 min and a decrease at 90 min, and finally a minor increase at 120 min. The highest removal percentage of Ni was reached at 30 min with 50 mg of silica.
(vi)
Removal of Pb ions
The percentage removal of Pb continuously increased with both the dosages at 10 and 30 min, and then there was a gradual decrease in both at 60, 90, and 120 min. The highest percentage removal of Pb was reached at 60 min with 50 mg of silica. pH level has an effect on the remediation of heavy metals in the multi-component system; certain heavy metals, such as lead (Pb2+), precipitate from pH 5, and therefore the study of adsorption was masked by the phenomena of precipitation.
(vii)
Removal of Zn ions
The percentage removal of Zn with both 50 mg and 100 mg increased at 10 min, then there was a gradual decrease at 30 and 60 min, after which there was a gradual increase at 90 and 120 min in both. The highest removal percentage of Zn was reached with reached 50 mg of silica at 30 and 120 min. Initially, there was an increase in the percent removal of heavy metals by the SiNPs, because initially, all the adsorption sites were vacant and were gradually occupied by the metal ions. After that, once the adsorption reached the equilibrium, there was desorption of metal ions from the SiNP surface, and consequently, there was an increase in the concentration of the heavy metals in the solution. Therefore, due to this phenomenon, there was a fluctuation in the concentrations of the metal ions.
Previously Yadav and Fulekar (2020) used 20% CFA aqueous solutions for the removal of Pb2+ ions and Cd2+ ions in batch experiments. Here the investigators used maghemite NPs synthesized by sonochemical method using ferrous precursors and Tridax plant extract as a reducing agent. The maghemite NPs were 20–40 nm, spherical to rod-shaped, and highly aggregated. The synthesized maghemite NPs had Fe, O, and C as the elements, whereas carbon was from the Tridax plant extract. Here, about 0.3 mg/100 mL nano adsorbent was used for the remediation of Pb2+ ions and Cd2+ ions under similar experimental conditions (pH = 7, rpm = 150). The authors achieved up to 90.85% removal efficiency with Pb and 67.8% with Cd [20].
Another approach by Yadav et al. remediated the Pb2+ and Cr ions from the 20% CFA aqueous solutions under similar experimental conditions in batch experiments. Here the nano adsorbent was sonochemically synthesized IONPs of size 9–70 nm with an average size of 38.9 nm which was spherical to cuboidal in shape. The dosage of the IONPs was 0.6mg/100 mL of 20% CFA aqueous solutions. The authors found that the removal efficiency was 97.96% (Pb2+) and 82.8% (Cr4+) for Pb2+ and Cr4+ ions [21]. A team led by Chen demonstrated approaches for the remediation of disinfection byproduct precursors and chlorinated and chloraminated water by applying ozonation and up-flow biologically active carbon [31].
In the current approach and in previously reported work, there was adsorption as well as desorption of heavy metals after reaching equilibrium. Previously, authors have aimed to remove only two heavy metals, i.e., Pb, Cd, or Cr from the 20% aqueous solutions, whereas here, the authors targeted the remediation of 6–7 heavy metals. Thus, the current approach was efficient and economical.

6. Morphological and Elemental Changes in Nanosilica after Adsorption

6.1. XRD for Mineralogy Identification

The XRD pattern in Figure 3 of the as-synthesized and residue SiNPs after heavy metal removal did not have any significant changes. The prominent peaks remained the same before and after use, and there was only a change in the intensity of the peaks. There were a few small-intensity peaks at 37.8° and 43.6°, which could have been due to the depositions of elements from the fly ash aqueous solution on the surface of SiNP residue.

6.2. FTIR Analysis of the Residue

The bands of SiNPs remained as such in all the samples, i.e., the as-synthesized, 50 mg, and 100 mg residues, as shown in Figure 4. All these three samples have the characteristic bands of nanosilica, as mentioned above [29]. The only difference was a minor shift in the position of wavelength and the intensity of the peaks. The minor shifts in the peaks of SiNP spectra could also be due to the adsorption of heavy metals during the reaction. These peaks might be due to the resultants of the adsorbed heavy metals on the surfaces of SiNPs. These shifts may also indicate that there were strong binding processes taking place on the surfaces of SiNPs. The FTIR spectra and 50 mg residual SiNPs revealed the presence of water molecules on their surfaces, which was confirmed from the band around 3447 cm−1. The sharp peak at 1648 cm−1 may be assigned to the bending vibration of water molecules (H–O–H) [32], and the peak around 1407 cm−1 is attributed to the carbon molecules or carbonates. These bands were not there in the as-synthesized SiNPs, which indicates that carbon molecules or carbonates was adsorbed on the surface during the remediation of heavy metals. This is also further supported by the FESEM-EDS data. The other bands remained more or less the same, with minor changes in the intensity of the peaks. In the FTIR spectra of 100 mg SiNP residue, there were no significant changes in the bands and peaks except a slight increase and decrease in the intensity of the peaks, as shown in Table 1. Therefore, it is possible that 100 mg nanosilica was not effective as an adsorbent, as there was no positive response of higher doses on the adsorption rates or efficiency of heavy metal removal.

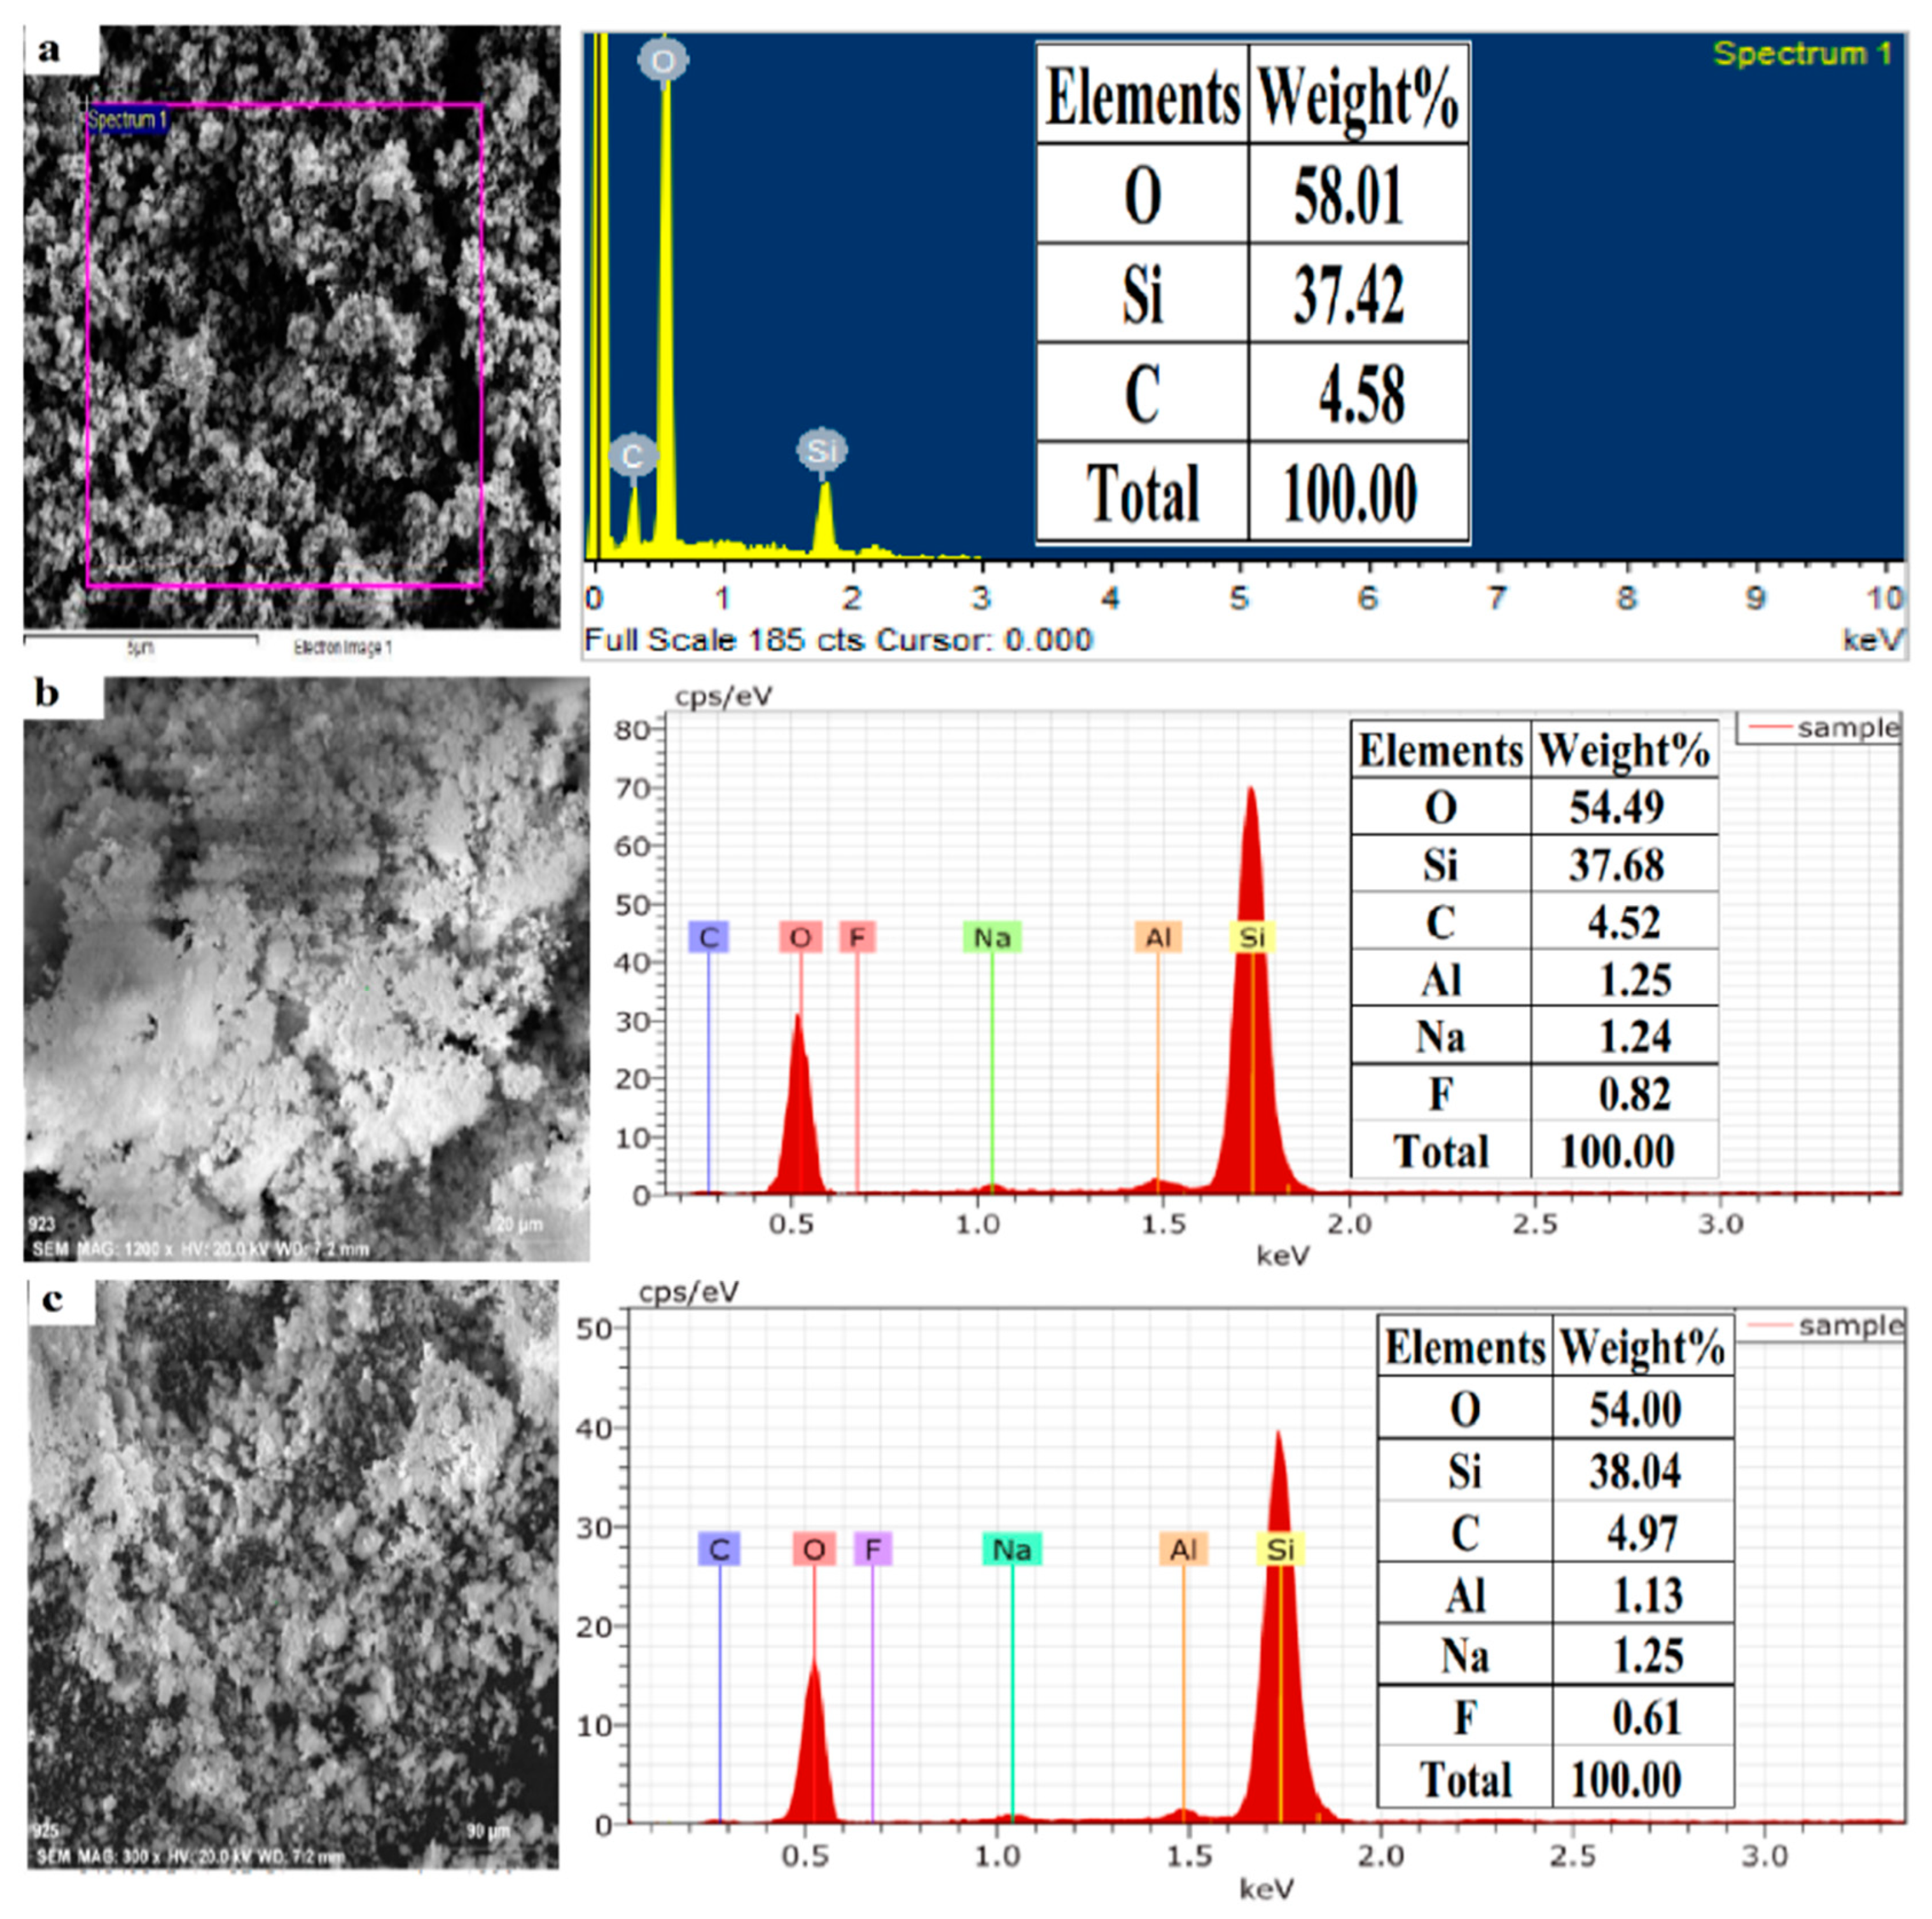
6.3. Change in Elemental Composition

The EDS spectra (Figure 9a) of as-synthesized SiNPs show peaks for Si, O, C, and Na. The presence of Si and O confirmed the synthesis of silica nanoparticles from the fly ash with high purity. However, the presence of Na was due to the impurities associated with it due to improper washing, and C was due to the fly ash carbon and adhesive tape. The purity of SiNPs was ~94–97%, which was due to purification and calcination. The 1 M HCl treatment removed the alkali metal impurities, such as Na, Mg, and Al. As silica is insoluble in acids, it remained unaffected, while these alkali metals were easily soluble in the diluted HCl. Moreover, in the final step, calcination removed the carbon content of the synthesized silica. Figure 9b,c shows the EDS spectra of the 50 mg and 100 mg residue silica nanoparticles after remediation of heavy metals. Both the samples have peaks for Al, Na, and F, which were initially not there in the as-synthesized SiNPs. This indicates the adsorption of these three elements along with the heavy metals from the CFA solution. The adsorption of these elements was in a higher amount than the heavy metals. It also indicates that SiNPs are better adsorbents for Al, Na, and F. Between both, the 50 mg residue SiNPs had slightly higher adsorption of these three elements on the surface.
The FESEM micrographs shown above in Figure 7e,f reveal that there were no significant morphological changes in the silica nanoparticles before and after use. The shapes of the nanosilica particles remained intact after the adsorption.

6.4. Elemental Analysis on the Used Adsorbent by ICP-OES

For the detection of elements adsorbed on the surface of 100 mg nanosilica, about 3 mg of nanosilica was digested with 10 mL of aqua regia at 220 °C. About 10 mL of deionized water was added as a make-up volume that was filtered by Whatman 42. The sample was analyzed by inductively coupled plasma-optical emission spectroscopy ICP-OES (Optima 2500, Perlin Elmer, Waltham, MA, USA), and the following elements were detected: Al, Fe, Na, F, P, K, Mg, Ca, Cd, Cr, Co, Pb, Ni, Zn, Mn, and Cu in Table 2.
Not all of these were present initially in the original sample, i.e., SiNPs, which indicates that the source of these elements was the aqueous solutions of fly ash. All these elements were adsorbed on the surface of the nanosilica after the completion of the reaction. The maximum adsorption occurred with Al, Mg, Ca, Na, etc., as all these elements were present in the maximum concentration in the fly ash.
Earlier, Wang also highlighted the adverse effects of coal fly ash, such as the leaching of heavy metals, the effects of CFA on the human body, its magnetic properties, and its disposal problems [36].

7. Conclusions

  • Being a class F coal fly ash, it has a high percentage of silica and is a potential precursor material for the synthesis of nanosilica.
  • Sol-gel is the most reliable and widely applied technique for nanosilica synthesis. The synthesis of nanosilica from CFA was carried out in four steps; alkali dissolution of CFA; neutralization with dilute mineral acid; dilution of mineral; acid-based purification and calcination.
  • The characterization of the nanosilica revealed that it was spherical, floral-shaped and 20–70 nm in size with high purity.
  • For the remediation of heavy metals along with alkali metals, a lower dose of nano silica was more efficient.
  • The 50 mg nanosilica was more effective for the removal of all the heavy metals except for Co and Cr.
  • The synthesized nanosilica showed the potential for the remediation of toxic heavy metals from 20% CFA aqueous solutions to be performed much more efficiently than with other methods.
  • The utilization of such industrial waste for the synthesis of value-added material such as nanosilica will lower the burden on the current commercial industries for silica production.

Author Contributions

Conceptualization, V.K.Y., A.A. and S.G.W.; data curation, S.G.W., H.O., M.H.F. and V.K.Y.; methodology, V.K.Y., A.A. and S.G.W.; validation, V.K.Y., A.A., S.G.W. and H.O.; formal analysis, V.K.Y., A.A. and M.H.F.; resources, A.A., M.H.F. and S.G.W.; writing—original draft preparation, S.G.W., V.K.Y. and H.O.; writing—review and editing, V.K.Y., A.A. and M.H.F.; supervision, V.K.Y., A.A. and M.H.F.; project administration V.K.Y., A.A. and H.O.; funding acquisition, S.G.W., H.O. and A.A.; investigation, V.K.Y., A.A. and H.O.; software, V.K.Y., A.A., M.H.F. and S.G.W.; visualization, V.K.Y., A.A. and M.H.F. All authors have read and agreed to the published version of the manuscript.

Funding

This research was funded by the Deanship of Scientific Research at King Khalid University under grant number RGP.2/182/43.

Institutional Review Board Statement

Not applicable.

Informed Consent Statement

Not applicable.

Data Availability Statement

Not applicable.

Acknowledgments

The authors extend their appreciation to the Deanship of Scientific Research at King Khalid University for funding this work through Research Groups Program under grant number RGP.2/182/43. The authors acknowledge the infrastructure provided by the Central University of Gujarat, Gandhinagar, Gujarat. Mody University of Science and Technology, Sikar, Rajasthan and Parul University, Baroda.

Conflicts of Interest

The authors declare that no relevant financial or non-financial competing interests are associated with the publication of this manuscript.

References

  1. Briffa, J.; Sinagra, E.; Blundell, R. Heavy metal pollution in the environment and their toxicological effects on humans. Heliyon 2020, 6, e04691. [Google Scholar] [CrossRef] [PubMed]
  2. Yadav, V.K.; Choudhary, N.; Ali, D.; Gnanamoorthy, G.; Inwati, G.K.; Almarzoug, M.H.A.; Kumar, G.; Khan, S.H.; Solanki, M.B. Experimental and Computational Approaches for the Structural Study of Novel Ca-Rich Zeolites from Incense Stick Ash and Their Application for Wastewater Treatment. Adsorpt. Sci. Technol. 2021, 2021, 6066906. [Google Scholar] [CrossRef]
  3. Choudhary, N.; Yadav, V.K.; Yadav, K.K.; Almohana, A.I.; Almojil, S.F.; Gnanamoorthy, G.; Kim, D.-H.; Islam, S.; Kumar, P.; Jeon, B.-H. Application of green synthesized MMT/Ag nanocomposite for removal of methylene blue from aqueous solution. Water 2021, 13, 3206. [Google Scholar] [CrossRef]
  4. Rafieizonooz, M.; Khankhaje, E.; Rezania, S. Assessment of environmental and chemical properties of coal ashes including fly ash and bottom ash, and coal ash concrete. J. Build. Eng. 2022, 49, 104040. [Google Scholar] [CrossRef]
  5. Kumar, P.; Singh, N. Influence of recycled concrete aggregates and Coal Bottom Ash on various properties of high volume fly ash-self compacting concrete. J. Build. Eng. 2020, 32, 101491. [Google Scholar] [CrossRef]
  6. Khan, S.H.; Yadav, V.K. Advanced oxidation processes for wastewater remediation: An overview. In Removal of Emerging Contaminants through Microbial Processes; Springer: Singapore, 2021; pp. 71–93. [Google Scholar]
  7. Qasem, N.A.A.; Mohammed, R.H.; Lawal, D.U. Removal of heavy metal ions from wastewater: A comprehensive and critical review. NPJ Clean Water 2021, 4, 36. [Google Scholar] [CrossRef]
  8. Mehdizadeh, S.; Sadjadi, S.; Ahmadi, S.J.; Outokesh, M. Removal of heavy metals from aqueous solution using platinum nanopartcles/Zeolite-4A. J. Environ. Health Sci. Eng. 2014, 12, 7. [Google Scholar] [CrossRef]
  9. Puri, N.; Gupta, A.; Mishra, A. Recent advances on nano-adsorbents and nanomembranes for the remediation of water. J. Clean Prod. 2021, 322, 129051. [Google Scholar] [CrossRef]
  10. Jain, A.; Gupta, R.; Chaudhary, S. Sustainable development of self-compacting concrete by using granite waste and fly ash. Constr. Build. Mater. 2020, 262, 120516. [Google Scholar] [CrossRef]
  11. Yadav, V.K.; Gacem, A.; Choudhary, N.; Rai, A.; Kumar, P.; Yadav, K.K.; Abbas, M.; Ben Khedher, N.; Awwad, N.S.; Barik, D.; et al. Status of Coal-Based Thermal Power Plants, Coal Fly Ash Production, Utilization in India and Their Emerging Applications. Minerals 2022, 12, 1503. [Google Scholar] [CrossRef]
  12. Aini, S.; Nizar, U.K.; Nst, A.A.; Efendi, J. Identification and Purification of Nyalo River Silica Sand as Raw Material for the Synthesis of Sodium Silicate. IOP Conf. Ser. Mater. Sci. Eng. 2018, 335, 012025. [Google Scholar] [CrossRef]
  13. Raturi, G.; Sharma, Y.; Rana, V.; Thakral, V.; Myaka, B.; Salvi, P.; Singh, M.; Dhar, H.; Deshmukh, R. Exploration of silicate solubilizing bacteria for sustainable agriculture and silicon biogeochemical cycle. Plant Physiol. Biochem. 2021, 166, 827–838. [Google Scholar] [CrossRef] [PubMed]
  14. Mohammed, T.; Ellateif, A.; Maitra, S. Some studies on the surface modification of sol-gel derived hydrophilic Silica nanoparticles. Int. J. Nano Dimens. 2017, 8, 97–106. [Google Scholar] [CrossRef]
  15. Riccò, R.; Meneghello, A.; Enrichi, F. Signal enhancement in DNA microarray using dye doped silica nanoparticles: Application to Human Papilloma Virus (HPV) detection. Biosens. Bioelectron. 2011, 26, 2761–2765. [Google Scholar] [CrossRef] [PubMed]
  16. Yan, F.; Jiang, J.; Li, K.; Liu, N.; Chen, X.; Gao, Y.; Tian, S. Green Synthesis of Nanosilica from Coal Fly Ash and Its Stabilizing Effect on CaO Sorbents for CO2 Capture. Environ. Sci. Technol. 2017, 51, 7606–7615. [Google Scholar] [CrossRef]
  17. Imoisili, P.E.; Nwanna, E.C.; Jen, T.-C. Facile Preparation and Characterization of Silica Nanoparticles from South Africa Fly Ash Using a Sol–Gel Hydrothermal Method. Processes 2022, 10, 2440. [Google Scholar] [CrossRef]
  18. Liang, G.; Li, Y.; Yang, C.; Zi, C.; Zhang, Y.; Hu, X.; Zhoa, W. Production of biosilica nanoparticles from biomass power plant fly ash. Waste Manag. 2020, 105, 8–17. [Google Scholar] [CrossRef]
  19. Imoisili, P.E.; Jen, T.-C. Microwave-assisted sol–gel template-free synthesis and characterization of silica nanoparticles obtained from South African coal fly ash. Nanotechnol. Rev. 2022, 11, 3042–3052. [Google Scholar] [CrossRef]
  20. Yadav, V.K.; Fulekar, M.H. Biogenic synthesis of maghemite nanoparticles (γ-Fe2O3) using Tridax leaf extract and its application for removal of fly ash heavy metals (Pb, Cd). Mater. Today Proc. 2018, 5, 20704–20710. [Google Scholar] [CrossRef]
  21. Yadav, V.K.; Ali, D.; Khan, S.H.; Gnanamoorthy, G.; Choudhary, N.; Yadav, K.K.; Thai, V.; Hussain, S.; Manhrdas, S. Synthesis and characterization of amorphous iron oxide nanoparticles by the sonochemical method and their application for the remediation of heavy metals from wastewater. Nanomaterials 2020, 10, 1551. [Google Scholar] [CrossRef]
  22. Hasim, A.M.; Shahid, K.A.; Ariffin, N.F.; Nasrudin, N.N.; Zaimi, M.N.S.; Kamarudin, M.K. Coal bottom ash concrete: Mechanical properties and cracking mechanism of concrete subjected to cyclic load test. Constr. Build. Mater. 2022, 346, 128464. [Google Scholar] [CrossRef]
  23. Kamarudin, R.A.; Matlob, A.S.; Jubri, Z.; Ramli, Z. Extraction of silica and alumina from coal fly ash for the synthesis of zeolites. In Proceedings of the 2009 3rd International Conference on Energy and Environment (ICEE), Malacca, Malaysia, 7–8 December 2009; pp. 456–461. [Google Scholar] [CrossRef]
  24. Mourhly, A.; Khachani, M.; El Hamidi, A.; Kacimi, M.; Halim, M.; Arsalane, S. The Synthesis and Characterization of Low-Cost Mesoporous Silica SiO2 from Local Pumice Rock. Nanomater. Nanotechnol. 2015, 5, 35. [Google Scholar] [CrossRef]
  25. Yadav, V.K.; Fulekar, M.H. Green synthesis and characterization of amorphous silica nanoparticles from fly ash. Mater. Today Proc. 2019, 18, 4351–4359. [Google Scholar] [CrossRef]
  26. Zhang, X.; Zhao, Z.; Ran, G.; Liu, Y.; Liu, S.; Zhou, B.; Wang, Z. Synthesis of lignin-modified silica nanoparticles from black liquor of rice straw pulping. Powder Technol. 2013, 246, 664–668. [Google Scholar] [CrossRef]
  27. Zulkifli, N.S.C.; Ab Rahman, I.; Mohamad, D.; Husein, A. A green sol–gel route for the synthesis of structurally controlled silica particles from rice husk for dental composite filler. Ceram. Int. 2013, 39, 4559–4567. [Google Scholar] [CrossRef]
  28. Yadav, V.K.; Suriyaprabha, R.; Khan, S.H.; Singh, B.; Gnanamoorthy, G.; Choudhary, N.; Yadav, A.K.; Kalasariya, H. A novel and efficient method for the synthesis of amorphous nanosilica from fly ash tiles. Mater. Today Proc. 2020, 26, 701–705. [Google Scholar] [CrossRef]
  29. Uda, M.N.A.; Gopinath, S.C.B.; Hashim, U.; Halim, N.H.; Parmin, N.A.; Uda, M.N.A.; Anbu, P. Production and characterization of silica nanoparticles from fly ash: Conversion of agro-waste into resource. Prep. Biochem. Biotechnol. 2021, 51, 86–95. [Google Scholar] [CrossRef]
  30. Choi, Y.Y.; Baek, S.R.; Kim, J.I.; Choi, J.W.; Hur, J.; Lee, T.U.; Park, C.-J.; Lee, B.J. Characteristics and biodegradability of wastewater organic matter in municipal wastewater treatment plants collecting domestic wastewater and industrial discharge. Water 2017, 9, 409. [Google Scholar] [CrossRef]
  31. Chen, H.; Lin, T.; Chen, W.; Tao, H.; Xu, H. Removal of disinfection byproduct precursors and reduction in additive toxicity of chlorinated and chloraminated waters by ozonation and up-flow biological activated carbon process. Chemosphere 2019, 216, 624–632. [Google Scholar] [CrossRef]
  32. Nicola, R.; Costişor, O.; Ciopec, M.; Negrea, A.; Lazău, R.; Ianăşi, C.; Picioruş, E.-M.; Len, A.; Almásy, L.; Szerb, E.I.; et al. Silica-coated magnetic nanocomposites for Pb2+ removal from aqueous solution. Appl. Sci. 2020, 10, 2726. [Google Scholar] [CrossRef]
  33. Yadav, V.K.; Singh, B.; Gacem, A.; Yadav, K.K.; Gnanamoorthy, G.; Alsufyani, T.; Hussein, H.S.; Awwad, N.S.; Verma, R.; Inwati, G.K.; et al. Development of Novel Microcomposite Materials from Coal Fly Ash and Incense Sticks Ash Waste and Their Application for Remediation of Malachite Green Dye from Aqueous Solutions. Water 2022, 14, 3871. [Google Scholar] [CrossRef]
  34. Samrot, A.V.; Bavanilatha, M.; Krithika Shree, S.; Sathiyasree, M.; Vanjinathan, J.; Shobana, N.; Thirugnanasambandam, R.; Kumar, C.; Wilson, S.; Rajalakshmi, D.; et al. Evaluation of Heavy Metal Removal of Nanoparticles Based Adsorbent Using Danio rerio as Model. Toxics 2022, 10, 742. [Google Scholar] [CrossRef] [PubMed]
  35. Gorbatsevich, O.B.; Kholodkov, D.N.; Kurkin, T.S.; Malakhova, Y.N.; Strel’tsov, D.R.; Buzin, A.I.; Kazakova, V.V.; Muzafarov, A.M. Synthesis and properties of waterrsoluble silica nanoparticles. Russ. Chem. Bull. 2017, 66, 409–417. [Google Scholar] [CrossRef]
  36. Wang, N.; Sun, X.; Zhao, Q.; Yang, Y.; Wang, P. Leachability and adverse effects of coal fly ash: A review. J. Hazard. Mater. 2020, 396, 122725. [Google Scholar] [CrossRef] [PubMed]
Figure 1. (ad) Steps involved in the synthesis of nanosilica from coal fly ash.
Sustainability 15 02612 g001
Figure 2. Hypothetical molecular structure of hydroxylated silica (a) and hydrogen bonds between silanols (b) adopted from with permission [18].
Sustainability 15 02612 g002
Figure 3. UV–Vis spectrum (a) and particle size distribution (b) of SiNPs.
Sustainability 15 02612 g003
Figure 4. FTIR spectra of as-synthesized silica nanoparticles and silica residue after remediation of heavy metals.
Sustainability 15 02612 g004
Figure 5. XRD spectra of as-synthesized nanosilica and nanosilica residue after remediation of heavy metals.
Sustainability 15 02612 g005
Figure 6. TEM images ((a,c) at 100 nm scale), (b) histogram, TEM images at 50 nm scale (d,e), and (f)SAED pattern of SiNPs.
Sustainability 15 02612 g006
Figure 7. FESEM micrographs of as-synthesized nanosilica at 1 µ scale (a), 200 nm scale (b,c), at 100 nm scale (d) and nanosilica residue (e,f).
Sustainability 15 02612 g007
Figure 8. Effect of contact time on the adsorption of Al, Cr, Co, Mn, Ni, Pb, and Zn by (a) 50 mg (b) 100 mg silica nanoparticles.
Sustainability 15 02612 g008
Figure 9. EDS spectra of as-synthesized (a) 50 mg (b) and 100 mg (c) residue SiNPs.
Sustainability 15 02612 g009
Table 1. FTIR assignments peaks of as-synthesized and residual silica nanoparticles.
SamplesSi-O-Si Symmetric Si-O/Bending
Vibrations
C=O/C-HO-HReferences
As-synthesized1088808 cm−1608487 cm−1 [33]
50 mg residue1088808 cm−1608487 cm−11407 cm−11648, 3447 cm−1[34]
100 mg residue1088808 cm−1608487 cm−1 [35]
Table 2. Elemental analysis of 100 mg silica nanoparticles residue by ICP-OES.
Elementsmg/L
Be0.10
Ca0.226
Cr0.032
Cd0.002
Co0.150
Cu0.164
Fe0.076
Li1.029
Mg32.54
Mn10.06
Mo0.075
Ni0.469
Pb0.156
Sb0.050
Se0.014
Sr0.250
Tl0.122
V0.115
Disclaimer/Publisher’s Note: The statements, opinions and data contained in all publications are solely those of the individual author(s) and contributor(s) and not of MDPI and/or the editor(s). MDPI and/or the editor(s) disclaim responsibility for any injury to people or property resulting from any ideas, methods, instructions or products referred to in the content.

