

Speed Display Radars’ Impact on Speed Reduction on District Roads at Settlement Entrances


1
Faculty of Transport and Traffic Sciences, University of Zagreb, Vukelićeva 4, 10000 Zagreb, Croatia
2
European Institute of Road Assessment, Dunajska 128, 1000 Ljubljana, Slovenia
3
Ministry of Infrastructure and Transportation, Kole Lleshi b.b., 10000 Priština, Kosovo
*
Author to whom correspondence should be addressed.
Sustainability 2023, 15(4), 3099; https://0-doi-org.brum.beds.ac.uk/10.3390/su15043099
Submission received: 5 November 2022
/
Revised: 26 January 2023
/
Accepted: 7 February 2023
/
Published: 8 February 2023
(This article belongs to the Collection Emerging Technologies and Sustainable Road Safety)
Abstract
:Speed is one of the main causes of severe traffic accidents, especially of those involving vulnerable road users. Speed display radars are one of the engineering solutions that aim to reduce the speed of traffic flow at locations where it is crucial. A before and after study was conducted at six locations on district roads in the Republic of Croatia. As part of the research, vehicles’ speeds were measured for two weeks, during which the devices’ displays were switched off for one week and switched on for another, however, the devices’ radars recorded and collected the speeds of all vehicles which passed during the research period. The research collected a total of 182,352 speeds of recorded vehicles. The test was performed to determine the effect of speed display radar on the potential vehicles’ speed reduction. The results did not show a statistically significant difference in average hourly speeds at most locations, however, they showed a statistically significant difference in 85th percentile hourly speeds of approximately 1 to 3 km/h. Therefore, it can be concluded that the speed display radars at the locations had a positive effect on reducing the vehicles’ speeds. Additionally, at some locations a decrease in the number of speed limit violators was found which proved to be a statistically significant difference between the share of speed limit violators in total traffic flow.
1. Introduction
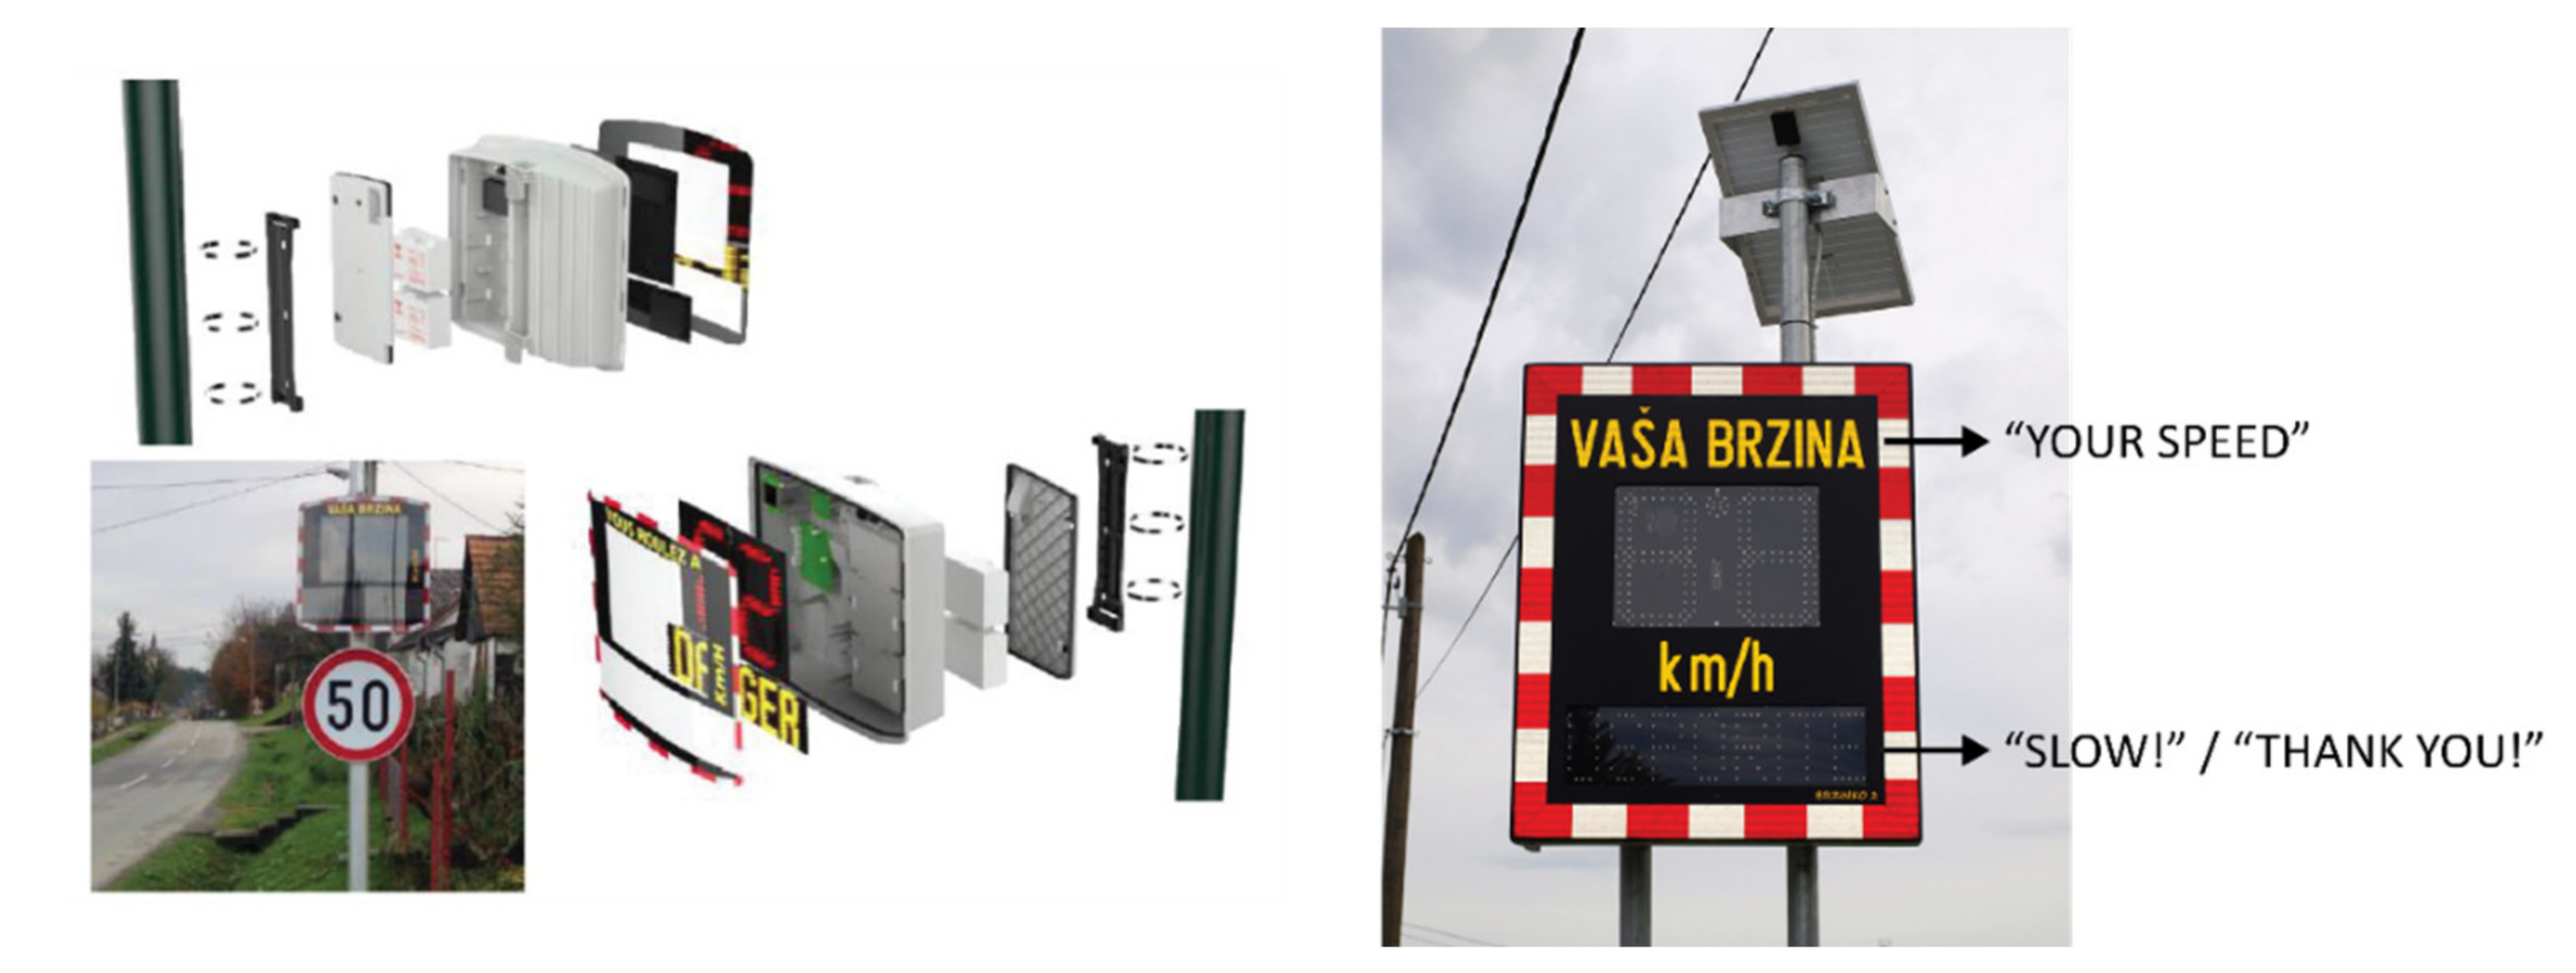
The National Road Safety Plan of the Republic of Croatia for the Period of 2021–2030 (2021) [1] analysis of the circumstances that preceded the occurrence of severe traffic accidents found that in 39% of cases the speed was one of the potential causes of severe traffic accidents in the Republic of Croatia, with speed itself being a potential cause in about 17% of those. There can be various methods for reducing vehicles’ speed of which the most significant ones are education, enforcement and engineering solutions, such as speed humps, being the most common, however, according to Vaitkus et al. (2017) [2], not always promising in reducing speed. One of the devices that can be used in the engineering solution is speed display radar—an interactive sign displaying a vehicle’s speed as it approaches the sign. The most usual ones display the speed of a vehicle with or without the words “Your speed”. In their paper, Gehlert et al. (2012) [3] researched the ones which leave messages such as “Slow down!” or a sad face emoticon when a vehicle is speeding and “Thank you!” or a happy face emoticon if a vehicle is driving within the speed limit. According to Dadić et al. (2003) [4], these devices can be particularly useful since timely information about significant traffic events plays a very important role in traffic safety.
Speed display radars are very often used as a traffic calming measure in school zones, zones where there are many pedestrians and other vulnerable road users, as well as in work zones, especially those on highways. According to the above, the application of speed display radar and its effect at the previously mentioned locations have already been covered through the relevant literature.
This research was conducted in accordance with the Ministry of the Interior because at many entrances to settlements in Croatia the police noticed more frequent and significant speed limit violations. Accordingly, many road traffic accidents were recorded as a result of higher speeds, such as vehicle collisions, hitting a pedestrian or cyclist, etc. Hence, speed display radars started to be used by police as a measure to reduce speeds at such locations.
Since speed display radars started to be used more and more often it was important to determine the effectiveness of such a measure. Accordingly, the aim of this research was to examine the speed display radars’ effect on speed reduction in the zones of the entrance to settlements where a change in speed limit is present.
Nevertheless, prior to the research, previous research analysis was carried out which, as is shown in the following section, mostly dealt with construction zones, schools zones, urban areas and high-speed roads (highways). This research, on the other hand, focuses on the transition zone—from a non-residential area to a residential area. The assumption was that speed display radars would have a more significant impact on slowing down traffic due to the change in traffic environment and to additional warning.
Therefore, a before and after study was conducted at six locations for two weeks, during one week of which the device’s display was switched off while in the second week it was switched on. Despite the device’s display being switched off, the device’s radar recorded and collected the speeds of all vehicles which passed during the research period. Using inferential statistics, the null hypothesis was tested on the impact of speed display radars on speed reduction. The aim of the research was to determine the impact of speed display radars on the operating speed reduction. Accordingly, a statistical analysis of the collected data was conducted with the aim of discovering the impact of speed display radar on the speed reduction.
2. Literature Review
In his paper, Bloch (1998) [5] compared two speed reduction systems: photo-radar and speed display radar. Photo-radar is a device which detects a speeding vehicle and informs the owner of the vehicle about the violation via data from the license plates, i.e., sends driver a warning or a penalty. On the other hand, speed display radars, which appeared in the 1980s, only show the speed at which the vehicle is driving, thus trying to draw the driver’s attention to possible speeding. A comparative analysis of these two systems, conducted in Riverside, California, showed that speed display radars are somewhat more effective in reducing the speed than photo-radar with a reduction of 9.3 km/h and 6.6 km/h depending on the location of the vehicle in relation to the device.
A study of the effectiveness of speed display radars at four locations in urban areas was conducted by Stern et al. (2010) [6] who carried out research 1 month before and up to 9 months after speed display radar installation. The results of the research indicate an average speed reduction between 1.8 km/h and 4.2 km/h, while the 85th percentile speed reduction was from 2 to 6 km/h.
A similar before and after study by Malin and Louma (2020) [7] was conducted at pedestrian crossings in urban streets with low speed limits (40 km/h). The results showed a mean speed reduction from 5 to 2.9 km/h. It should be noted that the speed display radars were installed for 5 months and the speed reduction persisted over time. On the other hand, in their work, Ardeshiri and Jeihani (2014) [8] analyzed the observance of speed limits in the presence of speed display radars at locations where speeds are limited to 25, 35 and 45 mph (40.2, 56.3 and 72.4 km/h). The results showed a positive effect on speed reduction but only as a temporary, short-term solution. This information was also previously confirmed by McCoy et al. (1995), Cruzado and Donnell (2009), Walter and Broughton (2011) [9,10,11] and others.
In their paper, Mattox et al. (2007) [12] listed two categories of measures for vehicles’ speed control on roads: (a) standard strategies such as visual narrowing of the road, sound or vibration lines, etc. and (b) technological strategies or new, innovative solutions which, among other things, include speed display radars. As part of their 2004 research in Nebraska, the authors investigated the long-term impact of speed display radars in rural work zones by setting up the device (with the message “You are speeding if flashing”) at three locations with speed being measured at one position before the device and at two positions after the device. The results of the research showed a statistically significant decrease in vehicles’ speeds at positions after the device, while no statistically significant decrease in speed was recorded at the position before the device. On the other hand, Garber and Srinivasan (1998), Fontaine et al. (2000) and McCoy and Pesti (2002) [13,14,15] have concluded that the use of speed display radars reduced speeds in highway work zones.
In addition to work zones and urban areas, research was also conducted in school zones. Lee et al. (2006) [16] state that speed display radars have a positive effect on speed reduction in school zones, with a recorded average speed reduction of 8.2 km/h. However, the scope of the research was limited to only one location. Similar, but smaller, speed decreases in school zones can be found in Rose and Ullman’s (2008) [17] study which also included pedestrian zones and work zones.
A recent study by Vlakveld et al. (2022) [18] shows the impact of road signs’ displaying children’s book illustrations on speed reduction on urban roads. The idea was to evoke feelings of caution and care in drivers and therefore to initiate lower driving speeds. In the study, speeds were measured during seven weeks on five experimental roads, on which the road signs displaying children’s book illustrations were placed, and five comparison roads without the signs. The results showed that the 85th percentile speed and the number of speed violators were significantly lower in the first week after placement of the signs.
The positive impact of speed display radars on speed reduction can be found in Karimpour et al.’s (2020) [19] study of high-speed roads in Arizona where the devices were installed. Furthermore, the results of research by Zineddin et al. (2016) [20] who implemented speed display radars on 20 rural roads showed reductions in average and 85th percentile speeds.
It is also worth mentioning that speed limit reduction showed environmental benefits. In the study conducted by Madireddy et al. (2011) [21] on several roads in the city of Antwerp, speed limits were reduced from 100 to 70 km/h, from 70 to 50 km/h and from 50 to 30 km/h. The speed limit reduction results showed not only smoother traffic flow in residential areas, but also reductions in CO2 and NOx emissions, especially where speed limits were lowered from 50 to 30 km/h. Another similar study by Gressai et al. (2021) [22] analyzed parts of the Budapest road network using microscopic traffic simulations with the aim to determine the impacts of the speed limit on traffic and on emission parameters. The results showed that the effect of the speed limit is less significant on the average speeds under dense traffic conditions, however, contrary to the previously mentioned study, the results of this study showed that the speed limit reduction from 50 to 30 km/h increased CO, HC, CO2 and NOx emissions, whereas the speed limit reduction from 70 to 50 km/h showed a slight emission reduction.
Unlike previous research which included urban zones, work zones, school zones, highways, etc., this research covered specific locations—entrances to smaller settlements where speeds are limited to 40 or 50 km/h. Indeed, according to Croatian legislation, the speed limit on roads outside settlements is 90 km/h, which is why operating speeds on roads outside settlements are often even higher than that. Due to the latter high entering speeds being common, traffic safety in such entrances to the smaller settlements can be jeopardized, especially for pedestrians and cyclists (due to insufficiently built infrastructure for non-motorized traffic) and local vehicles moving at speeds adapted to the speed limit within the settlement.
The aforementioned problem, which is a common case in rural areas in the Republic of Croatia, triggered usage of speed display radars as one of the measures for speed reduction at the settlements’ entrances. Therefore, this research was conducted to examine the effectiveness of speed display radars as a measure to reduce speed on district roads in the smaller settlements’ entrance zones.
3. Methodology
Speed display radars are devices usually placed on road sections where frequent speed limit violations can be found, with the aim of lowering speeds and therefore achieving a higher level of traffic safety. When exceeding the speed limit, the device activates a display which flashes a message (“SLOW!”) and therefore indicates to the driver the need for reducing the speed and increasing caution while driving. The speed display radar is shown in Figure 1.
To determine the impact of speed display radars on speed reduction, a statistical analysis of relevant traffic safety indicators and basic traffic flow parameters at the locations where they are installed was performed.
The methodology of research on the impact of speed display radars on speed reduction consisted of four steps:
- Step 1—Selection of suitable locations regarding the period of speed display radars’ installation.
- Step 2—Data collection (field research).
- Step 3—Statistical analysis.
- Step 1
In the first step, the area in which the research was conducted was defined—central Croatia. The motive was to reduce the potential negative impact of different driver behavior patterns in different parts of the country on the research results. In addition, the implementation of speed display radars has also started in central Croatia, where the largest number of them have been installed. After defining the area, the road infrastructure operator was asked to submit data on the locations where speed display radars were installed, provided that the locations are not on transit routes. Transit routes were not taken into account due to the higher proportion of non-everyday users who may potentially have a different perception of speed display radars. Therefore, the road infrastructure operator provided five locations that are not on transit routes, and where speed display radars have been installed. For each of the locations, the traffic load, speed limit, positions in relation to the settlement, traffic lane widths and the period of installation were analyzed, based on which it was assumed that the locations are comparable and all were included in the research (Table 1).
After the analysis of the submitted locations, it was affirmed that all speed display radars have been installed for more than 12 months. Considering the assumption that during 12 months the users got used to the speed display radars’ working mode, in cooperation and in accordance with the road infrastructure operators and the Ministry of the Interior, a temporary installation of the speed display radar at a new location was agreed upon for research purposes. It should be noted that the new location matches the existing five locations with its traffic and technical characteristics.
It is worth noting that the selected six locations where speed display radars were installed are positioned on district roads at the entrances to smaller settlements. At those locations, speed is limited to 40 or 50 km/h (depending on location), however, on longer sections of the district roads preceding the speed display radar, speed limits are significantly higher (80, 90 km/h) and, accordingly, the operating speeds preceding the speed display radar are higher. Therefore, higher incoming vehicles’ speeds are expected at those settlement entrances.
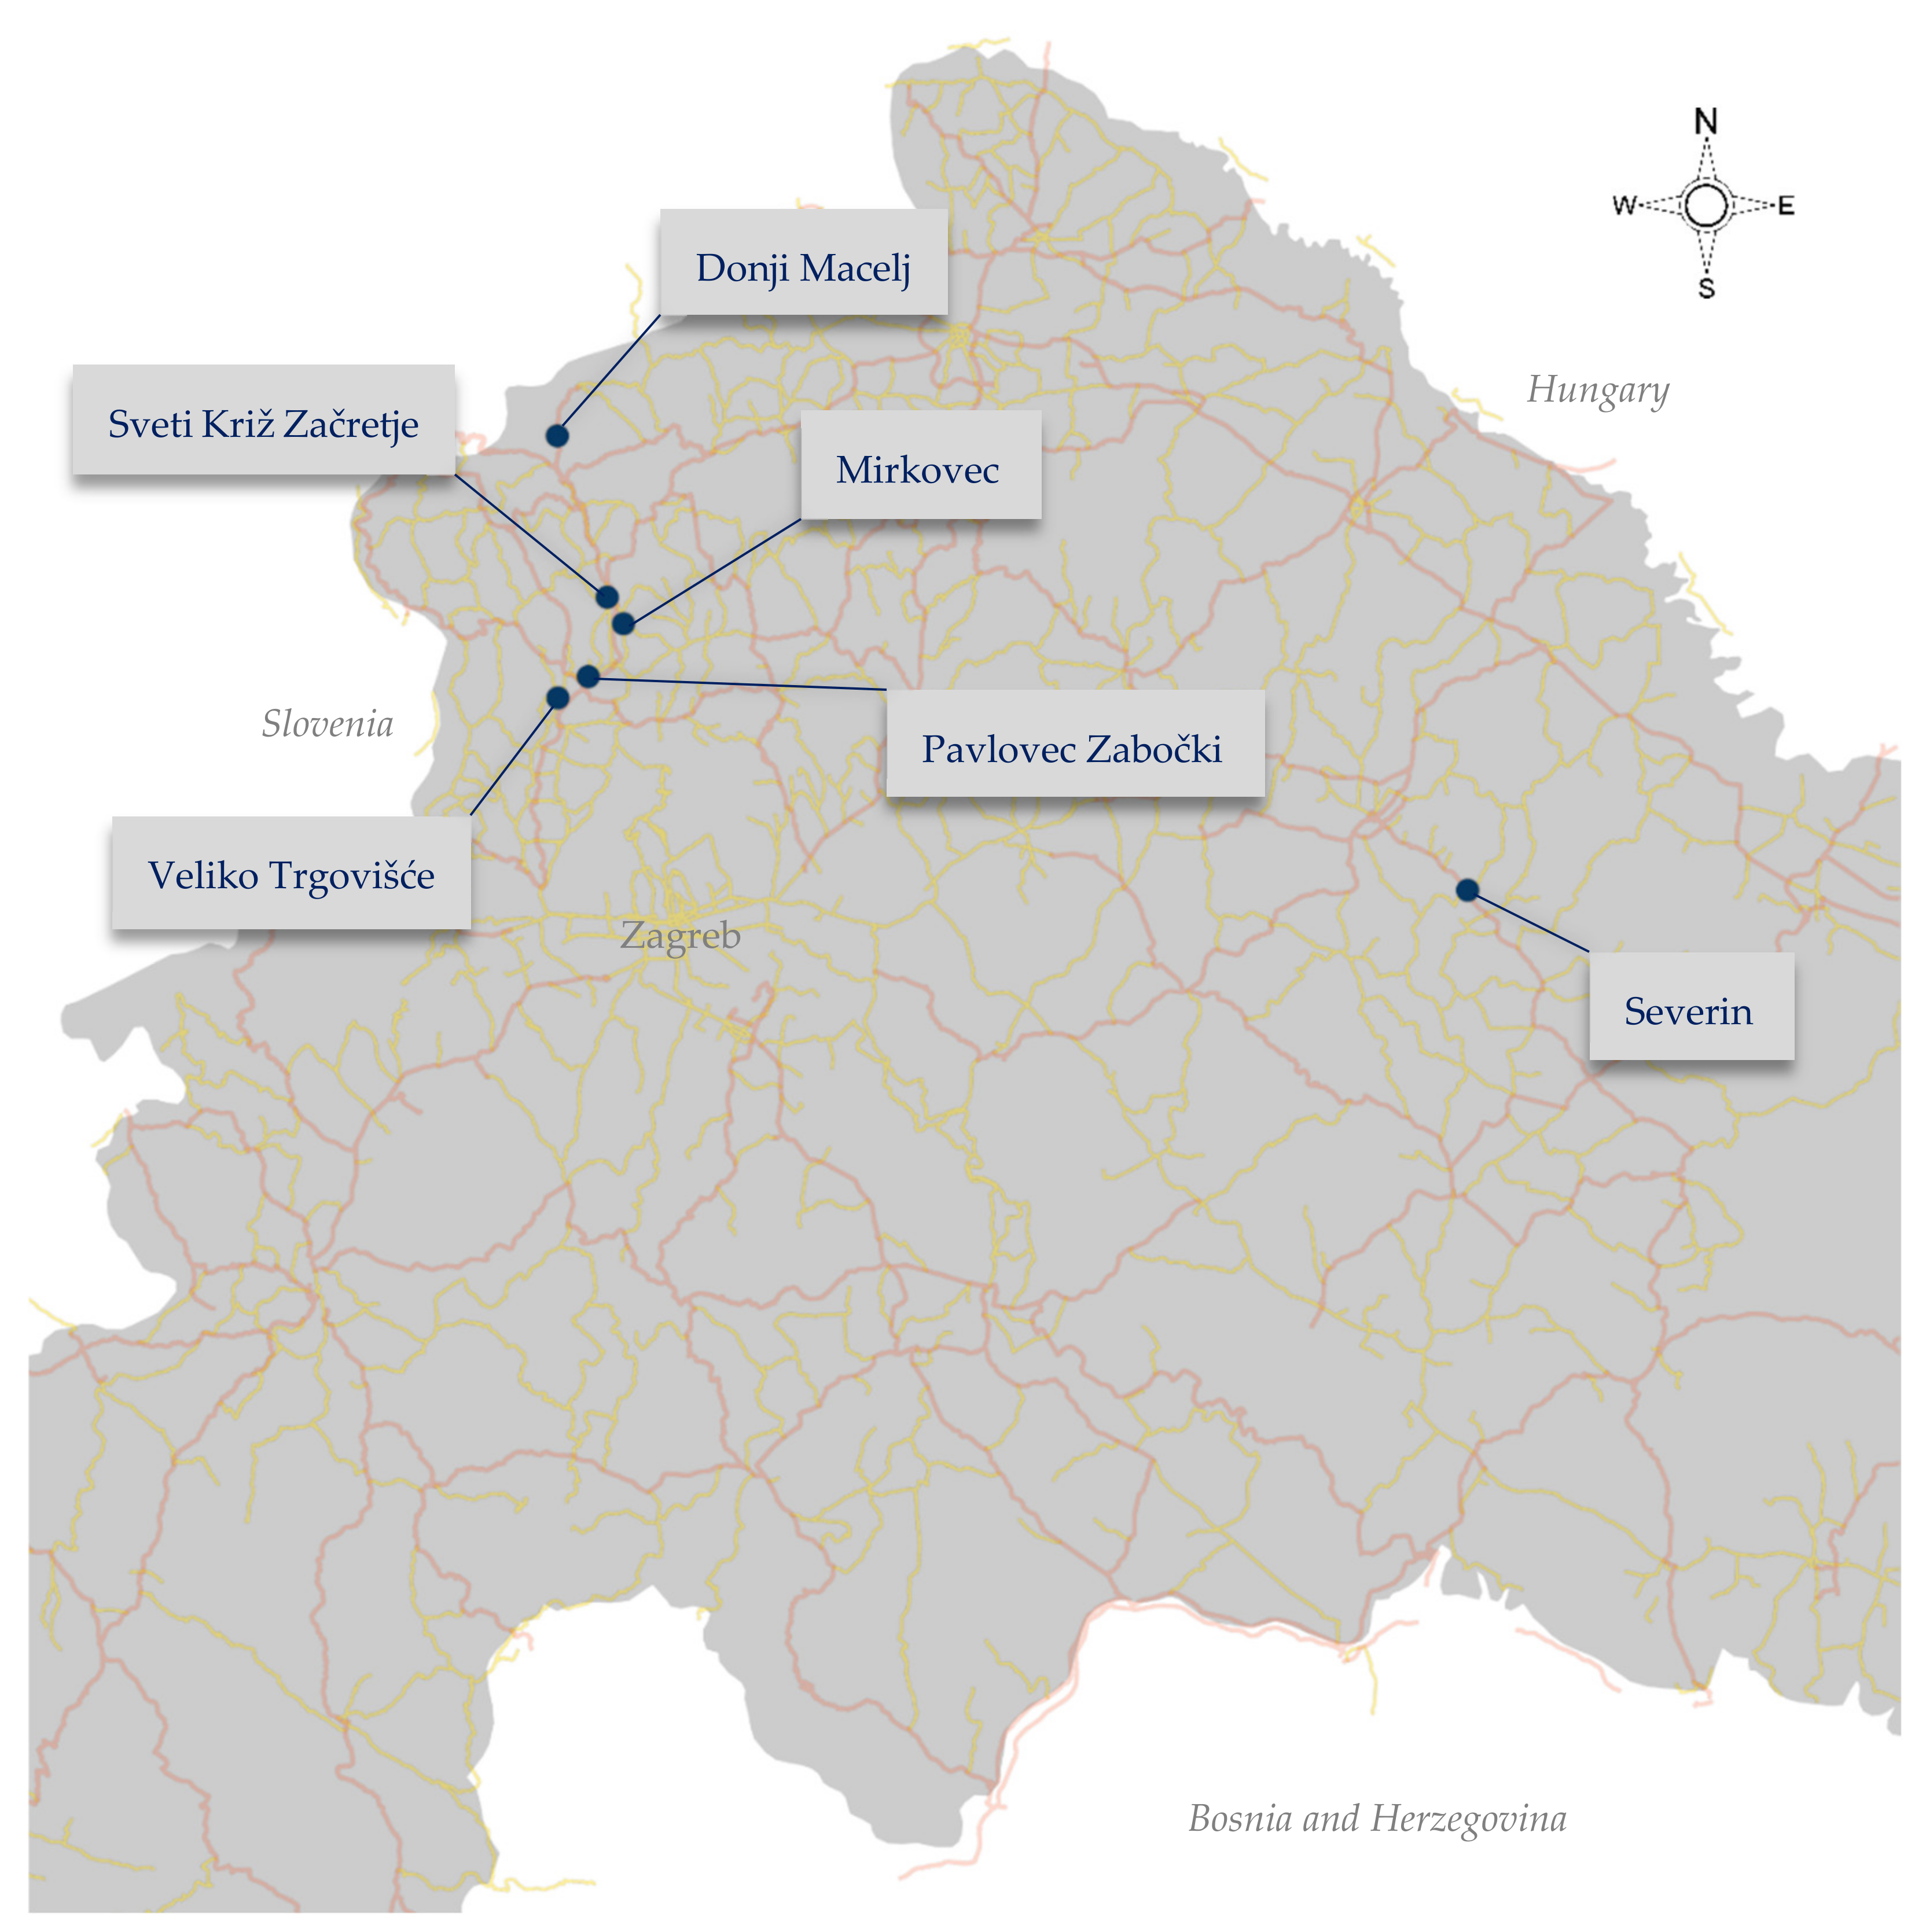
It should also be emphasized that the five speed display radars used for data collection had been installed on roads for a period of about one year or longer at the locations, while at one location for the purpose of this research the speed display radar had been installed temporarily (two weeks) only during the field research period. In this way, in addition to the learned reactions of the driver to the already known locations of the speed display radars, the research also included those reactions to the new traffic situation, i.e., traffic regulation. The locations at which the field research was conducted are listed below and shown in Figure 2.
- Severin, Bjelovar-Bilogora County (road D28)—temporarily installed.
- Mirkovec, Krapina-Zagorje County (road D1).
- Donji Macelj, Krapina-Zagorje County (road D1).
- Veliko Trgovišće, Krapina-Zagorje County (road Ž2195).
- Sveti Križ Začretje, Krapina-Zagorje County (road Ž2160).
- Pavlovec Zabočki, Krapina-Zagorje County (road Ž2195).
- Step 2
After the selection of research area and locations, in cooperation with the road infrastructure operator and the Ministry of the Interior, the field research part and data collection started. With the aim of covering all days of the week and all periods during the day, the data were collected for two weeks (14 days).
Since the reliability of the statistical analysis results significantly depends on the quality of the collected data on which they are based, special attention was paid to the process of data collection. Considering that the characteristics of the traffic flow significantly depend on the period of the year as well as the days of the week, i.e., the hours of the day, data collection was carried out in the working part of the year by continuous recording throughout the week. Data collection for the purpose of this research included all characteristic days of the week as well as hours during the day for a characteristic period of the year.
At the five locations with existing speed display radars, the data were collected according to the following methodology:
- during the first week (7 days) of the research, the traffic flow speed data were stored, and the operation of the speed display radar was normal (the device would show warning signs to drivers in case of exceeding the speed limit or thanking in case of compliance with it);
- during the second week (7 days) of the research, the traffic flow speed data were stored, and the speed display radar’s display was turned off, i.e., it did not display warning or thank you signs, but only stored the speed data.
This data collection approach was chosen since the speed display radars at these locations had been installed and operating for over 12 months. Therefore, the point was not to change the current situation in the first week of measurement in order to have as little impact on the traffic flow as possible and therefore to obtain the highest quality traffic flow speed data.
At the location with a temporarily installed speed display radar, the data were collected according to the following methodology:
- during the first week (7 days) of the research, the traffic flow speed data were stored, and the speed display radar’s display was turned off, i.e., it did not display warning or thank you signs, but only stored the speed data;
- during the second week (7 days) of the research, the traffic flow speed data were stored, and the operation of the speed display radar was normal (the device would show warning signs to drivers in case of exceeding the speed limit or thanking in case of compliance with it).
This data collection approach was chosen since the speed display radar was not previously implemented and operating at this location. Therefore, the device’s display was initially (in the first week of measurement) turned off (however, the data on vehicle speeds were collected) in order to have as little influence as possible on drivers’ behavior, and thus on traffic flow speeds.
Considering that all locations differ significantly in their technical and road design characteristics, as well as in the traffic environment itself, the statistical analysis was conducted separately for each location. Based on all conducted descriptive and inferential statistical analyses for each location, conclusions were made on the speed display radars’ impact on speed reduction.
All devices are able to store traffic flow characteristics data and save them to various file types. Data processing for statistical analysis was performed with the Excel tool.
- Step 3
Statistical analysis of the impact of speed display radars on speed reduction was based on descriptive and inferential statistical analysis. All analyses were performed based on average speed during each full hour. Through descriptive statistics, the basic statistical data of the collected data are presented in tabular and graphical terms. Furthermore, measures of central tendency as well as measures of variability were calculated. Based on graphical representations and data exploration, the basic characteristics and trends of the collected data were expressed, which served as a basis for the implementation of inferential statistics techniques. It is important to note that based on the data obtained through the field research of the locations, differences in mean hourly speeds, differences in maximum speeds, differences in the share of users violating speed limits and differences in 85th percentile hourly speeds were determined by a Tukey–Kramer test (the Tukey–Kramer test is a multiple comparisons test that can be used to find means which are significantly different [23]). The significance level used for all statistical tests performed is 95%.
4. Results and Discussion
Table 2 shows the analyzed data of each location where the field research was conducted, including number of measuring hours, speed limit at every location, number of vehicles recorded while the display was switched on and off, average hourly speeds while the display was switched on and off, as well as the average value differences of recorded hourly speeds.
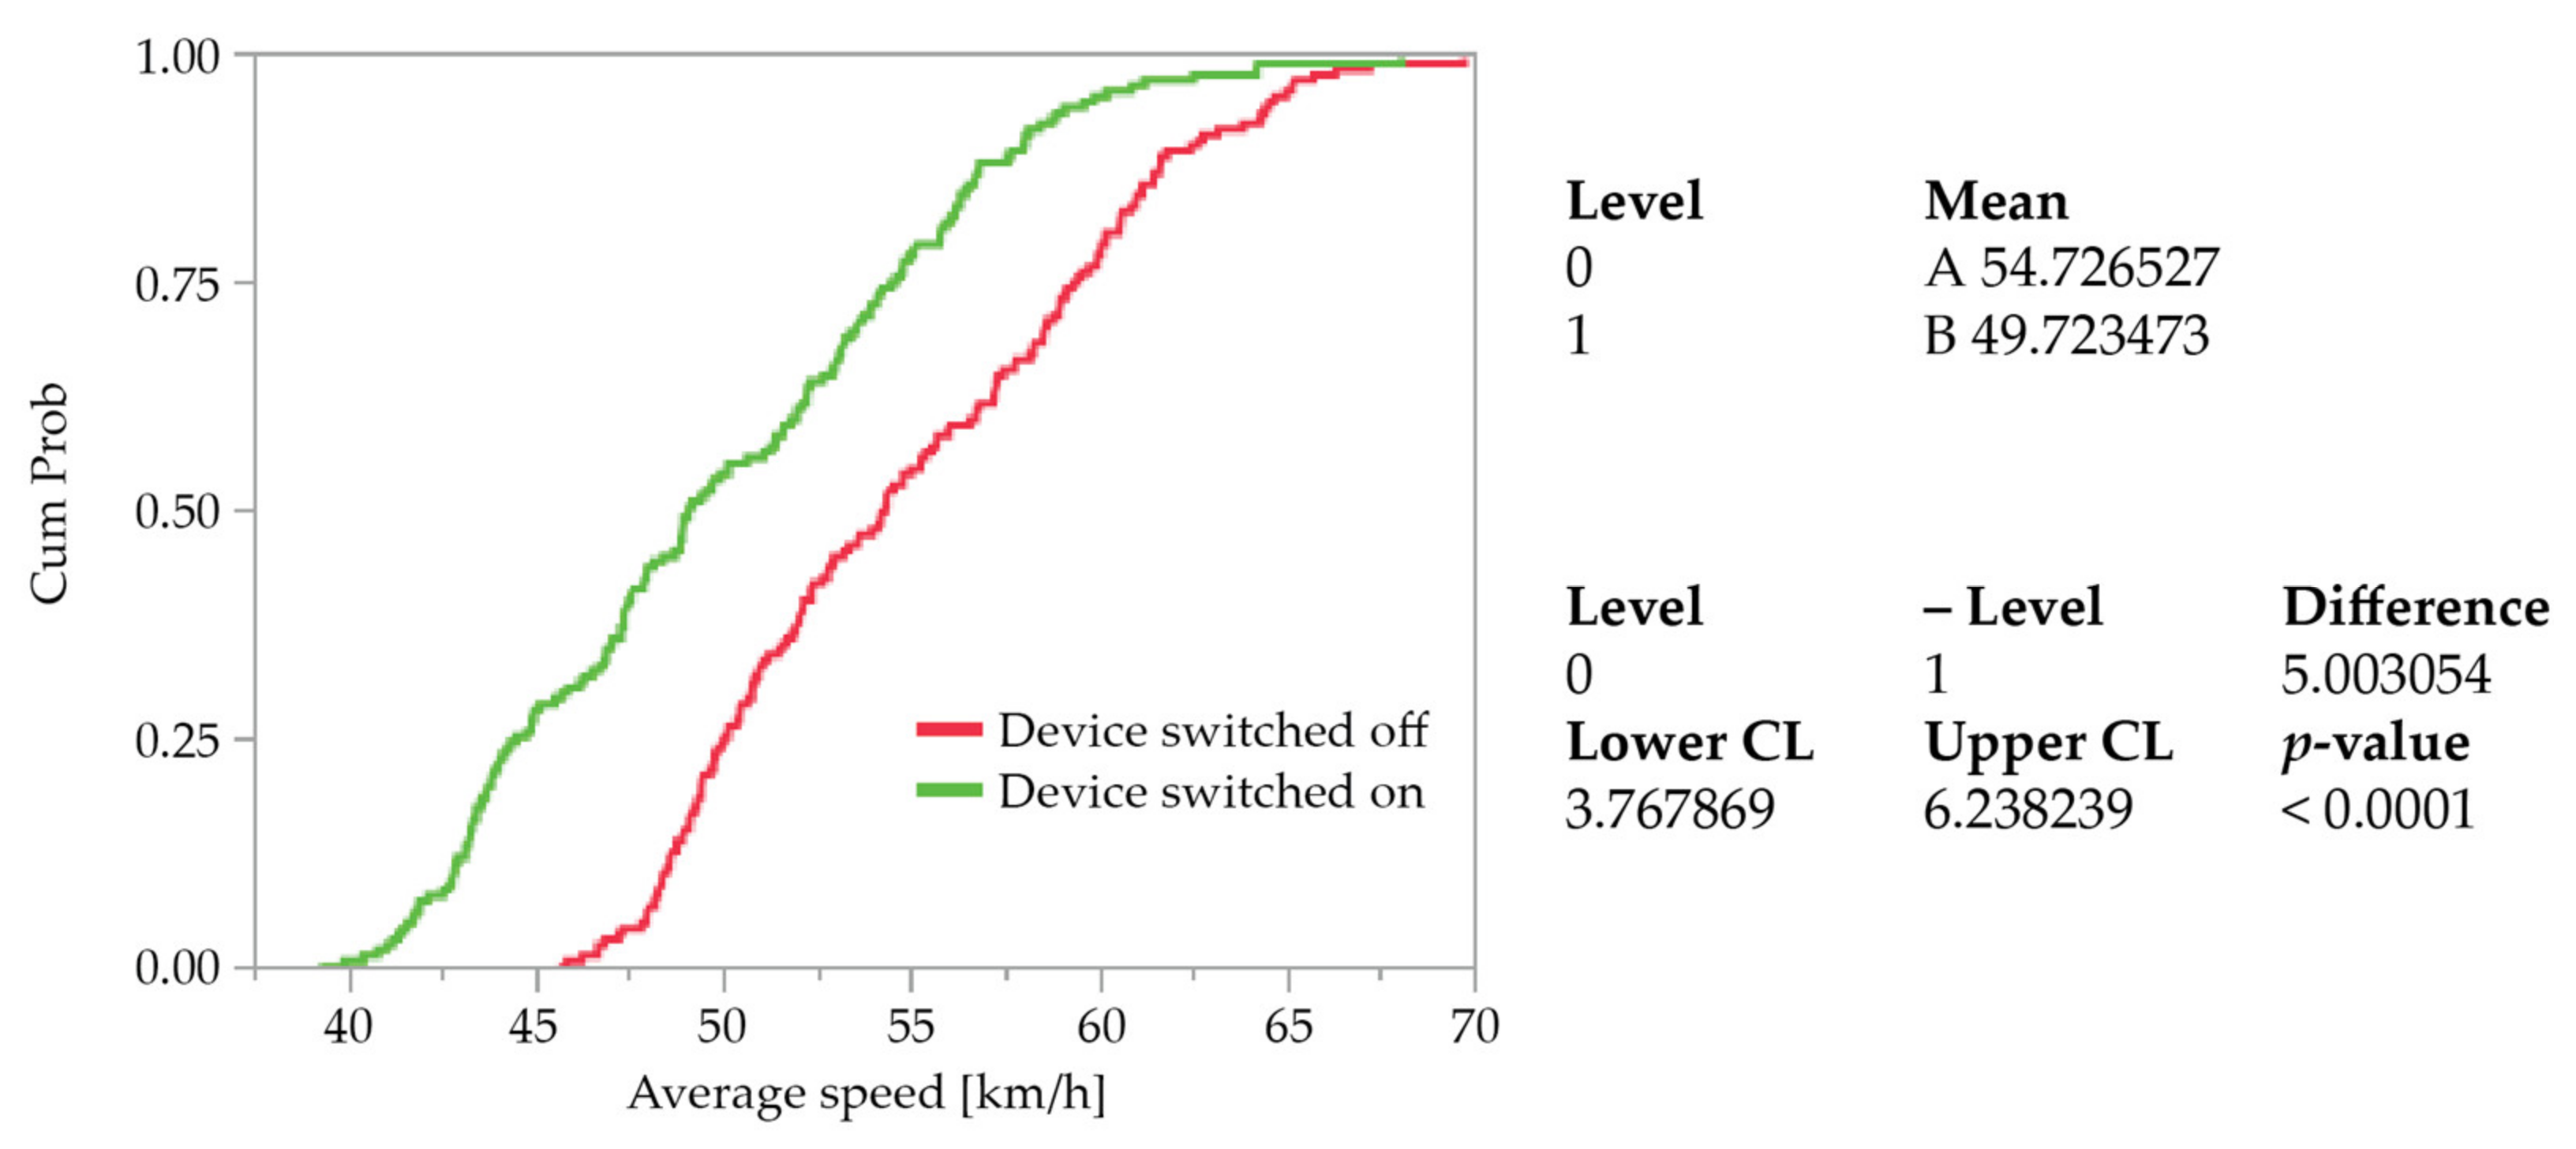
- Severin, Bjelovar-Bilogora County (Road D28)
During the week when the device’s display was switched off, 13,363 vehicles were recorded, while during the week when it was switched on, 14,303 vehicles were recorded. By comparing the number of vehicles, it can be noted that the difference in the number of recorded vehicles during the measurements is not large, about 6%.
Analysis of the average speeds during each hour showed that there was a statistically significant difference (p-value < 0.0001) between the means in the week when the device’s display was switched off compared to the week when it was switched on.
The average hourly speed of all measurements when the device’s display was switched on was 49.72 km/h, while the average hourly speed of all measurements when it was switched off was 54.72 km/h. Based on the above, it can be concluded that the difference between the average hourly speeds is 5 km/h, i.e., in the week when the device’s display was switched on the average hourly speed at the location was 5 km/h lower compared to the week when it was switched off (Figure 3).
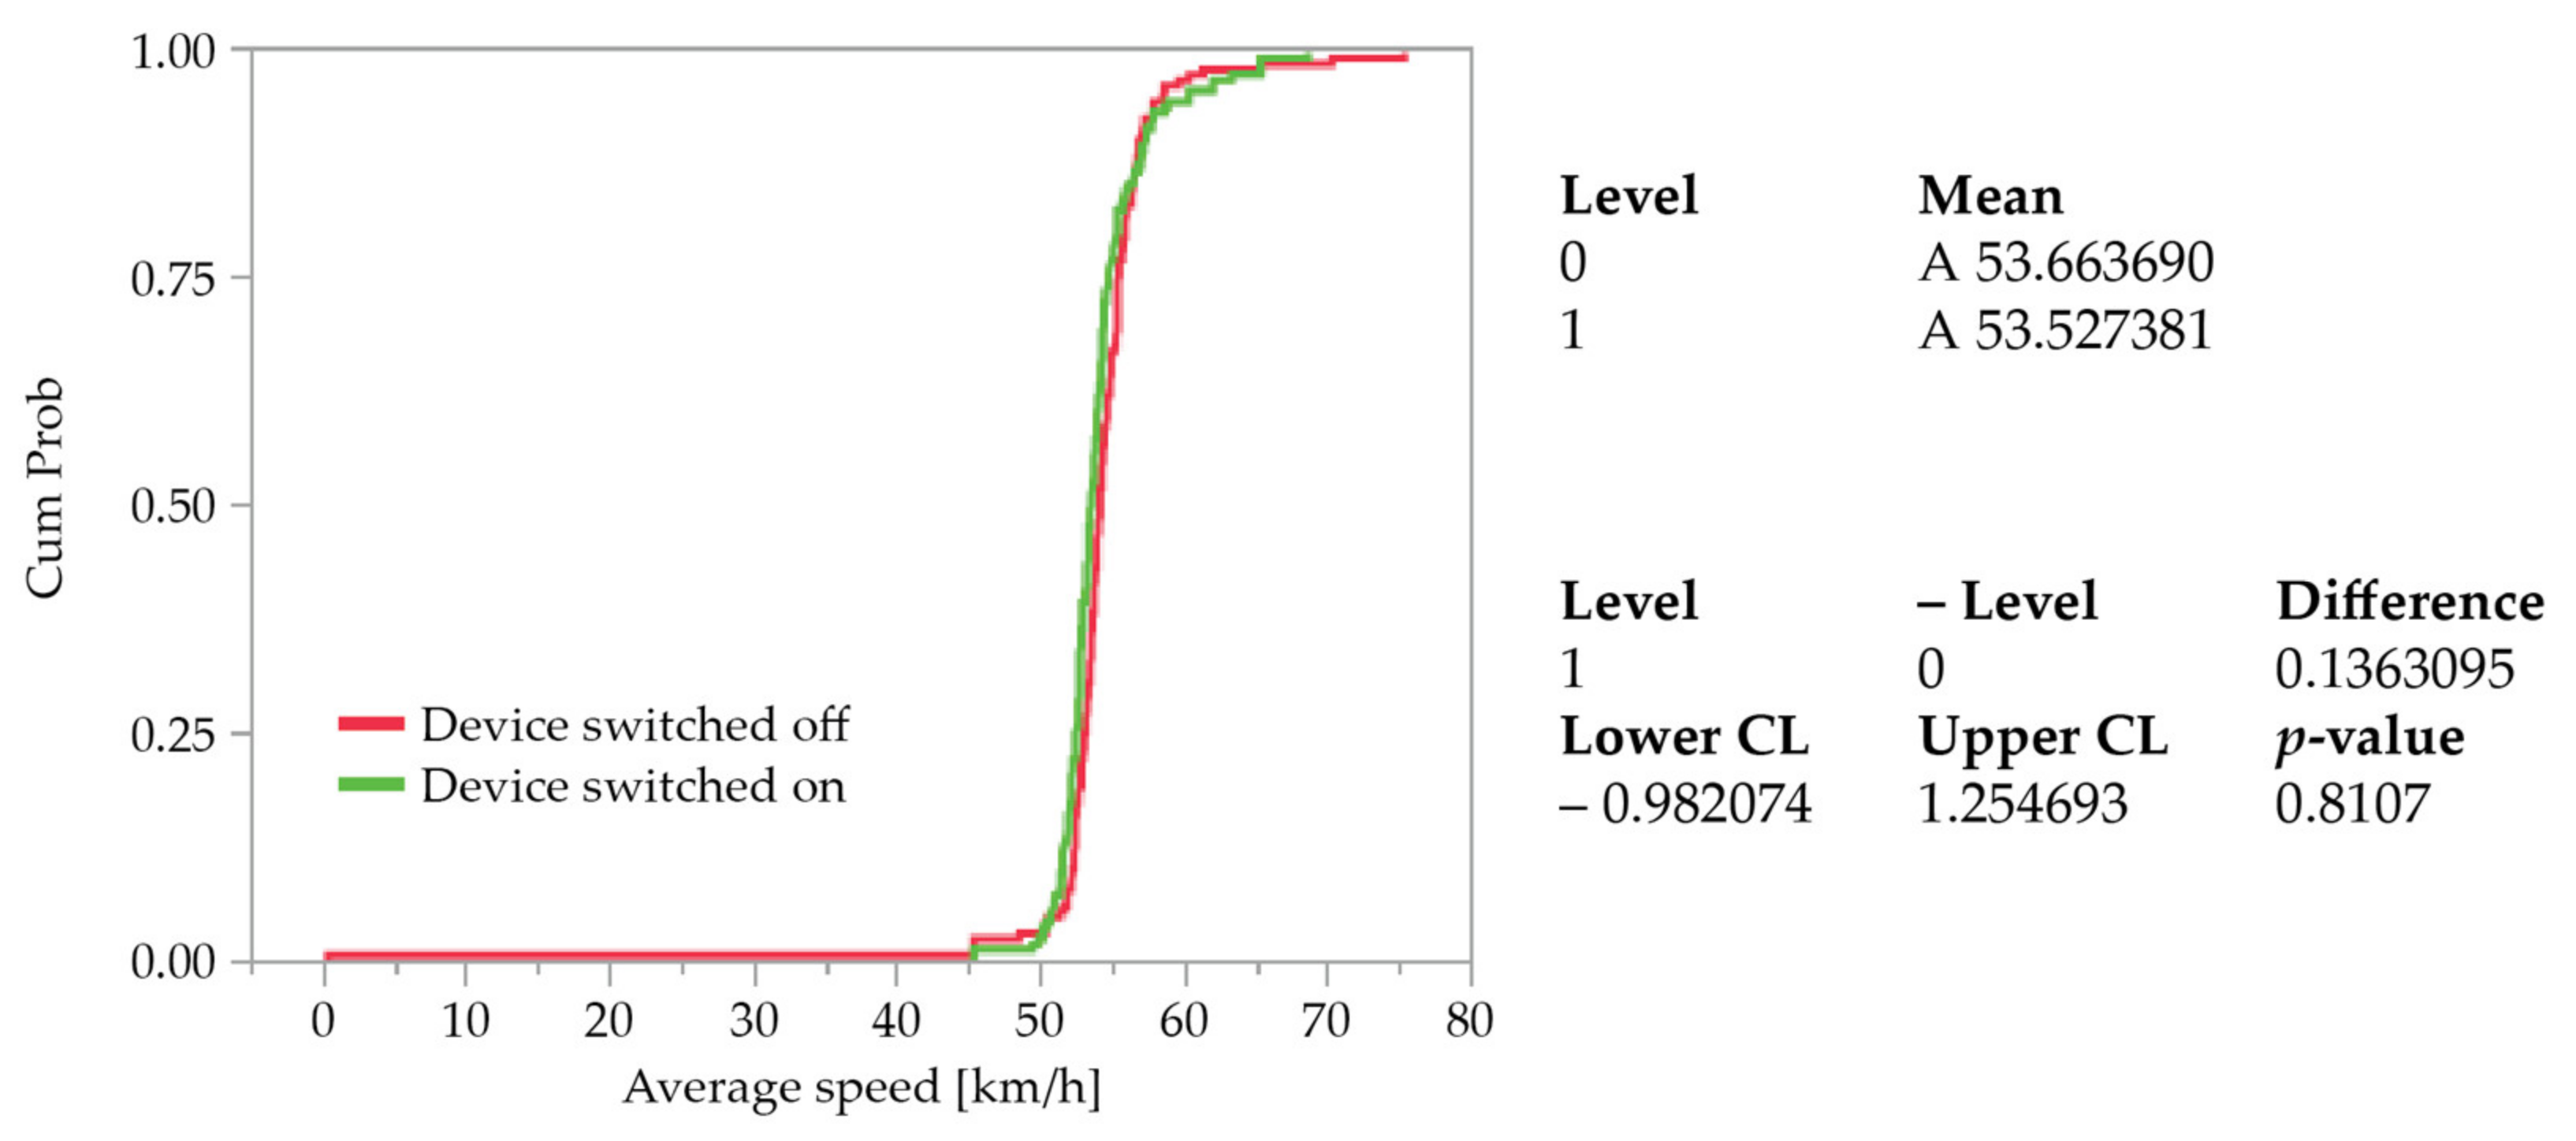
- Mirkovec, Krapina-Zagorje County (Road D1)
During the week when the device’s display was switched off, 15,424 vehicles were recorded, while during the week when it was switched on, 14,951 vehicles were recorded. By comparing the number of vehicles, it can be noted that the difference in the number of recorded vehicles during the measurements is not large, about 3%.
Analysis of the average speeds during each hour showed that there was no statistically significant difference (p-value 0.8107) between the mean speeds in the week when the device’s display was switched off compared to the week when it was switched on.
The average hourly speed of all measurements when the device’s display was switched on was 53.66 km/h, while the average hourly speed of all measurements when it was switched off was 53.52 km/h. Based on the above, it can be concluded that the differences in average hourly speeds are almost non-existent, i.e., in the week when the device’s display was switched on the average hourly speed at the location was almost the same as in the week when it was switched off (Figure 4).
Further statistical analysis of the collected data showed a decrease in the mean share of users in the hour whose speed is higher than speed limit of about 1%, however, the difference did not show statistical significance.
Since descriptive statistics showed that most of the maximum speeds occur at night, a test of the average speed differences during each hour in the daytime, 06:00 h–19:00 h, was performed. Analysis of 85th percentile speeds during each hour of the day found that there was a statistically significant difference in the mean speeds during the week when the device’s display was switched off compared to the week when it was switched on. In the week when the display was switched on, the 85th percentile speed at the location was reduced by approximately 1 km/h.
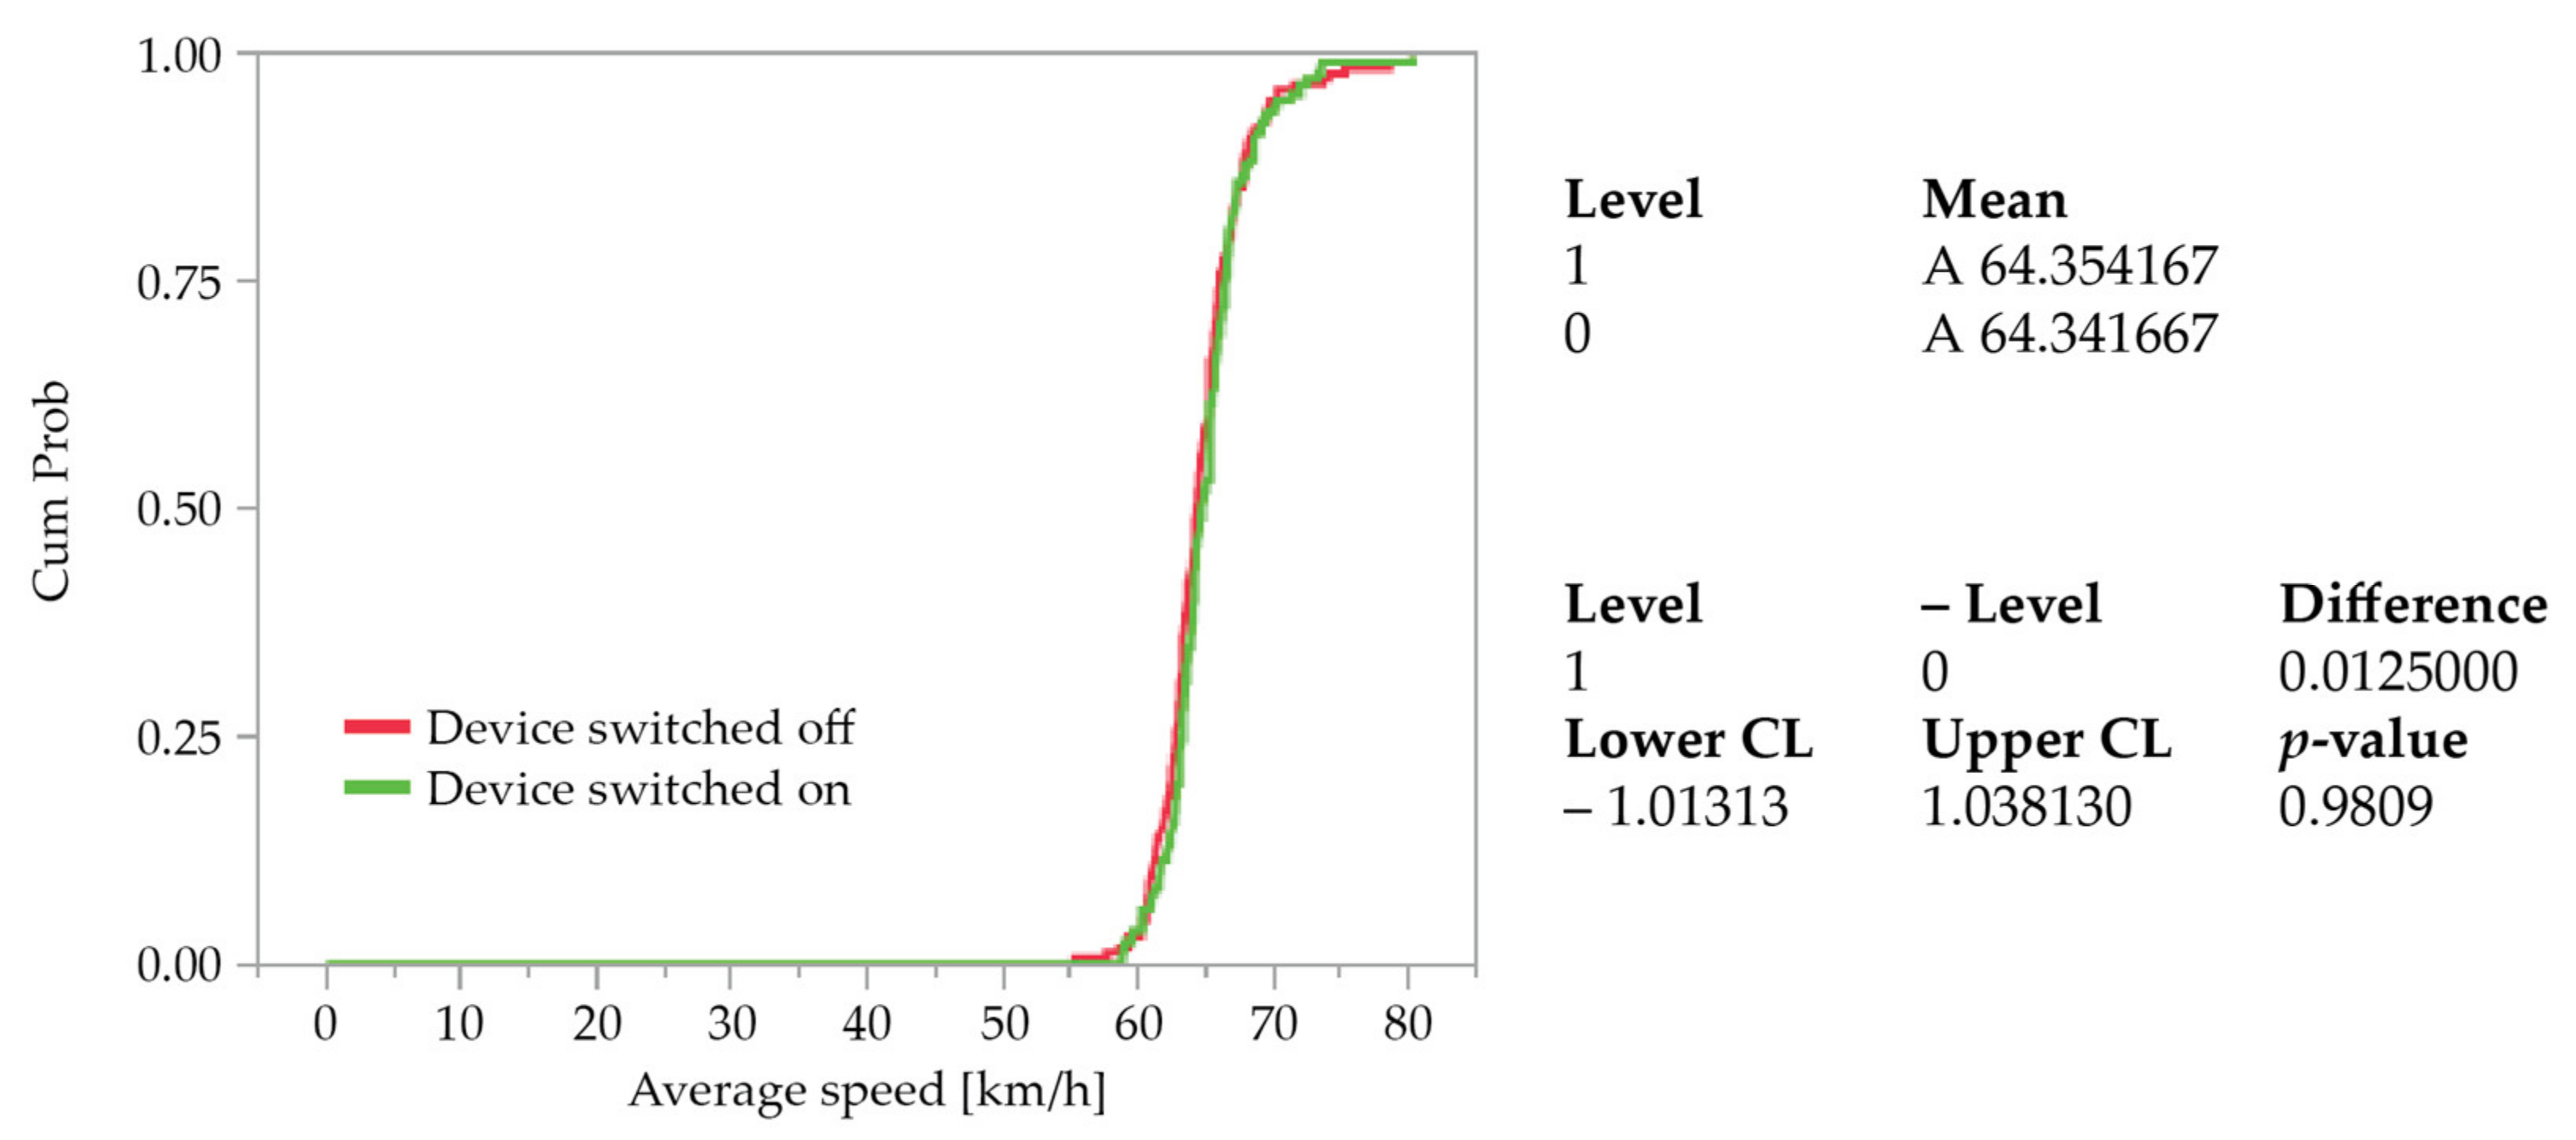
- Donji Macelj, Krapina-Zagorje County (Road D1)
During the week when the device’s display was switched off, 8107 vehicles were recorded, while during the week when it was switched on, 8984 vehicles were recorded. By comparing the number of vehicles, it can be noted that the difference in the number of recorded vehicles during the measurements is not large, about 9%.
Analysis of the average speeds during each hour showed that there was no statistically significant difference (p-value 0.9809) between the mean speeds in the week when the device’s display was switched off compared to the week when it was switched on.
The average hourly speed of all measurements when the device’s display was switched on was 64.35 km/h, while the average hourly speed of all measurements when it was switched off was 64.34 km/h. Based on the above, it can be concluded that the differences in average hourly speeds are almost non-existent, i.e., in the week when the device’s display was switched on the average hourly speed at the location was almost the same as in the week when it was switched off (Figure 5).
Further statistical analysis of the collected data showed a statistically significant difference in the mean share of users in the hour whose speed is higher than speed limit. In the week when the device’s display was switched on, the share of users who did not comply with the speed limit on the section was reduced by approximately 16%.
Since descriptive statistics showed that most of the maximum speeds occur at night, a test of the average speed differences during each hour in the daytime, 06:00 h–19:00 h, was performed. Analysis of 85th percentile speeds during each hour of the day found that there was a statistically significant difference in the mean speeds during the week when the device’s display was switched off compared to the week when it was switched on. In the week when the device’s display was switched on, the 85th percentile speed at the location was reduced by approximately 2 km/h.
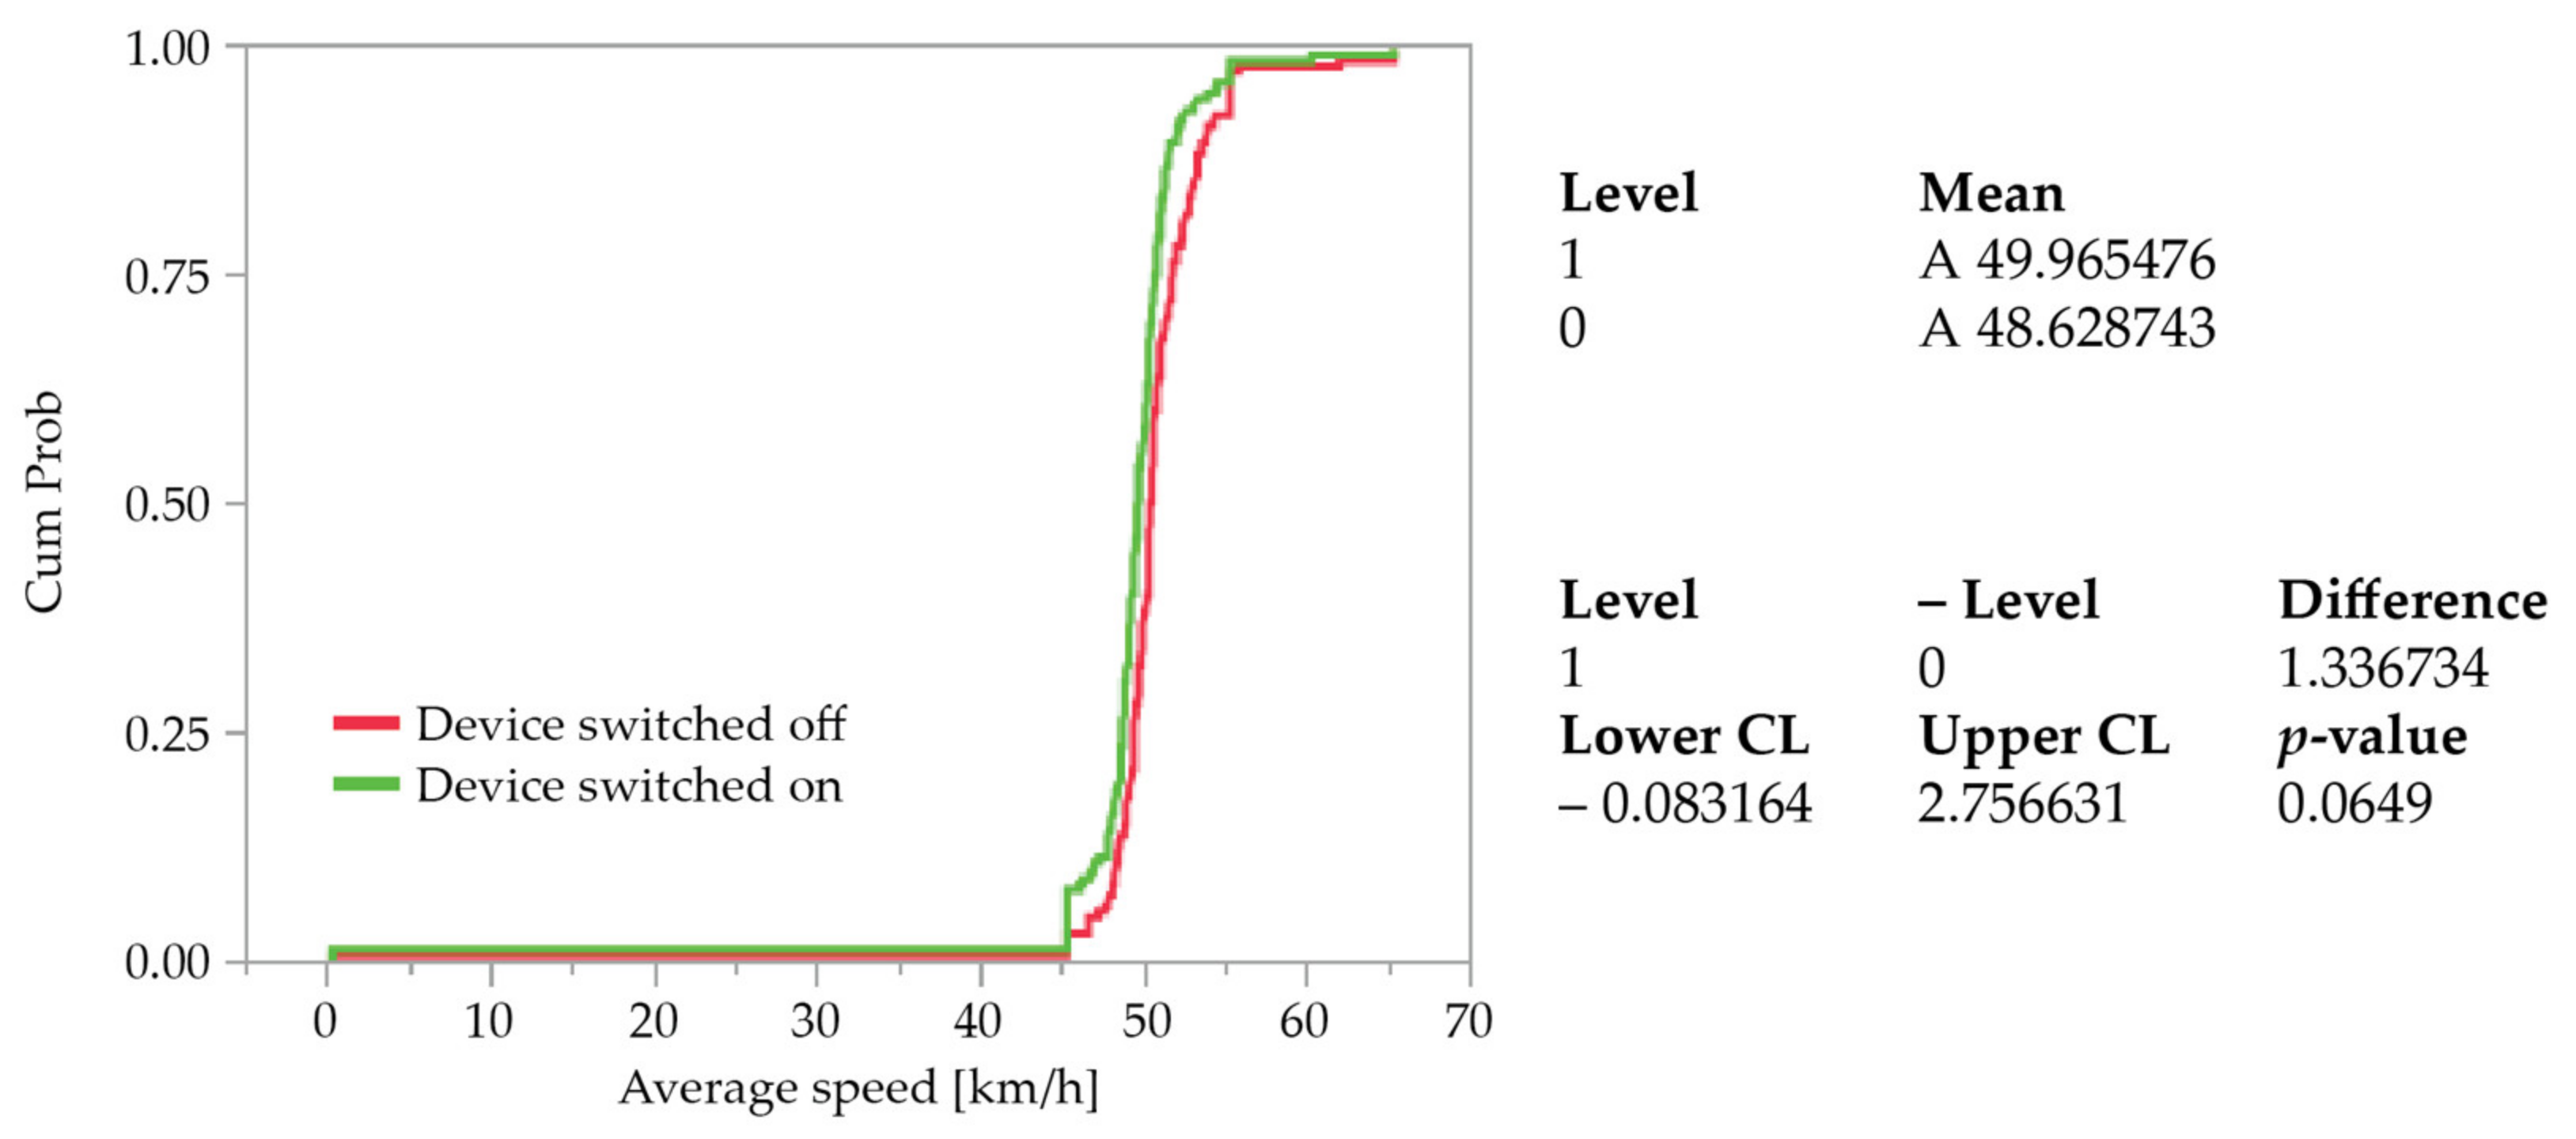
- Veliko Trgovišće, Krapina-Zagorje County (Road Ž2195)
During the week when the device’s display was switched off, 14,670 vehicles were recorded, while during the week when it was switched on, 15,731 vehicles were recorded. By comparing the number of vehicles, it can be noted that the difference in the number of recorded vehicles during the measurements is not large, about 6%.
Analysis of the average speeds during each hour showed that there was no statistically significant difference (p-value 0.0649) between the mean speeds in the week when the device’s display was switched off compared to the week when it was switched on.
The average hourly speed of all measurements when the device’s display was switched on was 48.63 km/h, while the average hourly speed of all measurements when it was switched off was 49.97 km/h. Based on the above, it can be concluded that the differences in average hourly speeds are small, i.e., in the week when the device’s display was switched on the average hourly speed at the location was only about 1 km/h lower than the week when it was switched off (Figure 6).
Further statistical analysis of the collected data showed a statistically significant difference in the mean share of users in the hour whose speed is higher than the speed limit. In the week when the device’s display was switched on, the share of users who did not comply with the speed limit on the section was reduced by approximately 8%.
Since descriptive statistics showed that most of the maximum speeds occur at night, a test of the average speed differences during each hour in the daytime, 06:00 h–19:00 h, was performed. Analysis of 85th percentile speeds during each hour of the day found that there was a statistically significant difference in the mean speeds during the week when the device’s display was switched off compared to the week when it was switched on. In the week when the device’s display was switched on, the 85th percentile speed at the location was reduced by approximately 2 km/h.
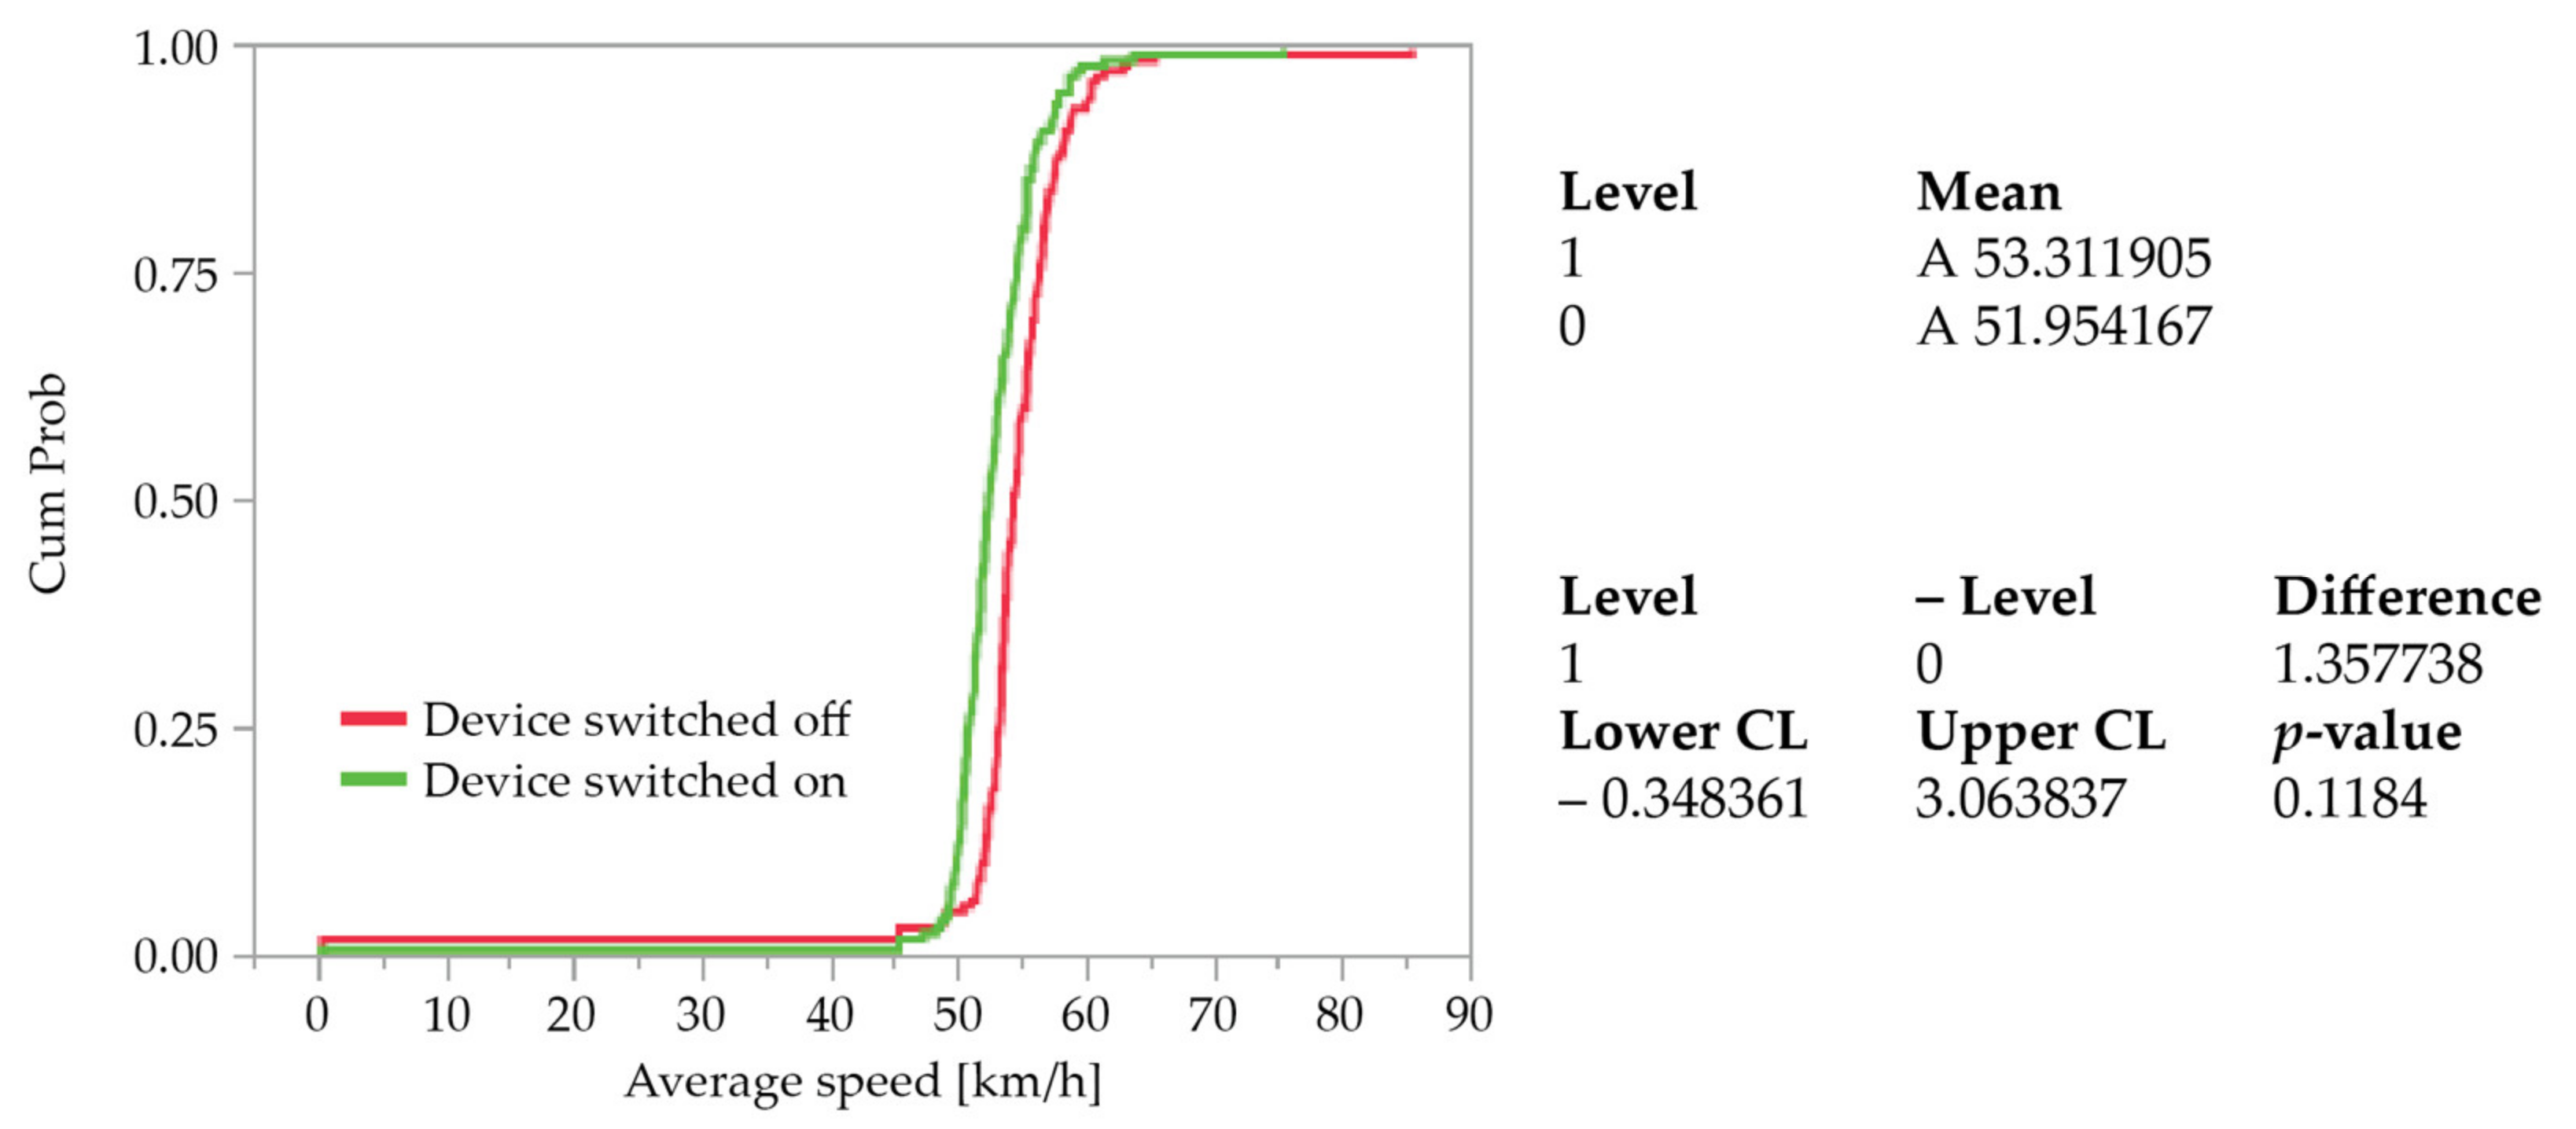
- Sveti Križ Začretje, Krapina-Zagorje County (Road Ž2160)
During the week when the device’s display was switched off, 17,143 vehicles were recorded, while during the week when it was switched on, 19,648 vehicles were recorded. By comparing the number of vehicles, it can be noted that the difference in the number of recorded vehicles during the measurements is slightly higher compared to other measurements, but still not too high, about 12%. In order to determine whether there are significant irregularities, the correlation of the number of vehicles per hour over two weeks was examined and a coefficient of determination of 0.96 was obtained which indicates a high level of correlation between the hourly number of vehicles in the week when the device’s display was switched off and the week it was switched on.
Analysis of the average speeds during each hour showed that there was no statistically significant difference (p-value 0.1184) between the mean speeds in the week when the device’s display was switched off compared to the week when it was switched on.
The average hourly speed of all measurements when the device’s display was switched on was 51.95 km/h, while the average hourly speed of all measurements when it was switched off was 53.31 km/h. Based on the above, it can be concluded that the differences in average hourly speeds are small, i.e., in the week when the device’s display was switched on the average hourly speed at the location was only about 1 km/h lower than the week when it was switched off (Figure 7).
Further statistical analysis of the collected data showed a decrease in the mean share of users in the hour whose speed is higher than speed limit of about 2%, however, the difference did not show statistical significance.
Since descriptive statistics showed that most of the maximum speeds occur at night, a test of the average speed differences during each hour in the daytime, 06:00 h–19:00 h, was performed. Analysis of 85th percentile speeds during each hour of the day found that there was a statistically significant difference in the mean speeds during the week when the device’s display was switched off compared to the week when it was switched on. In the week when the device’s display was switched on, the 85th percentile speed at the location was reduced by approximately 2 km/h.
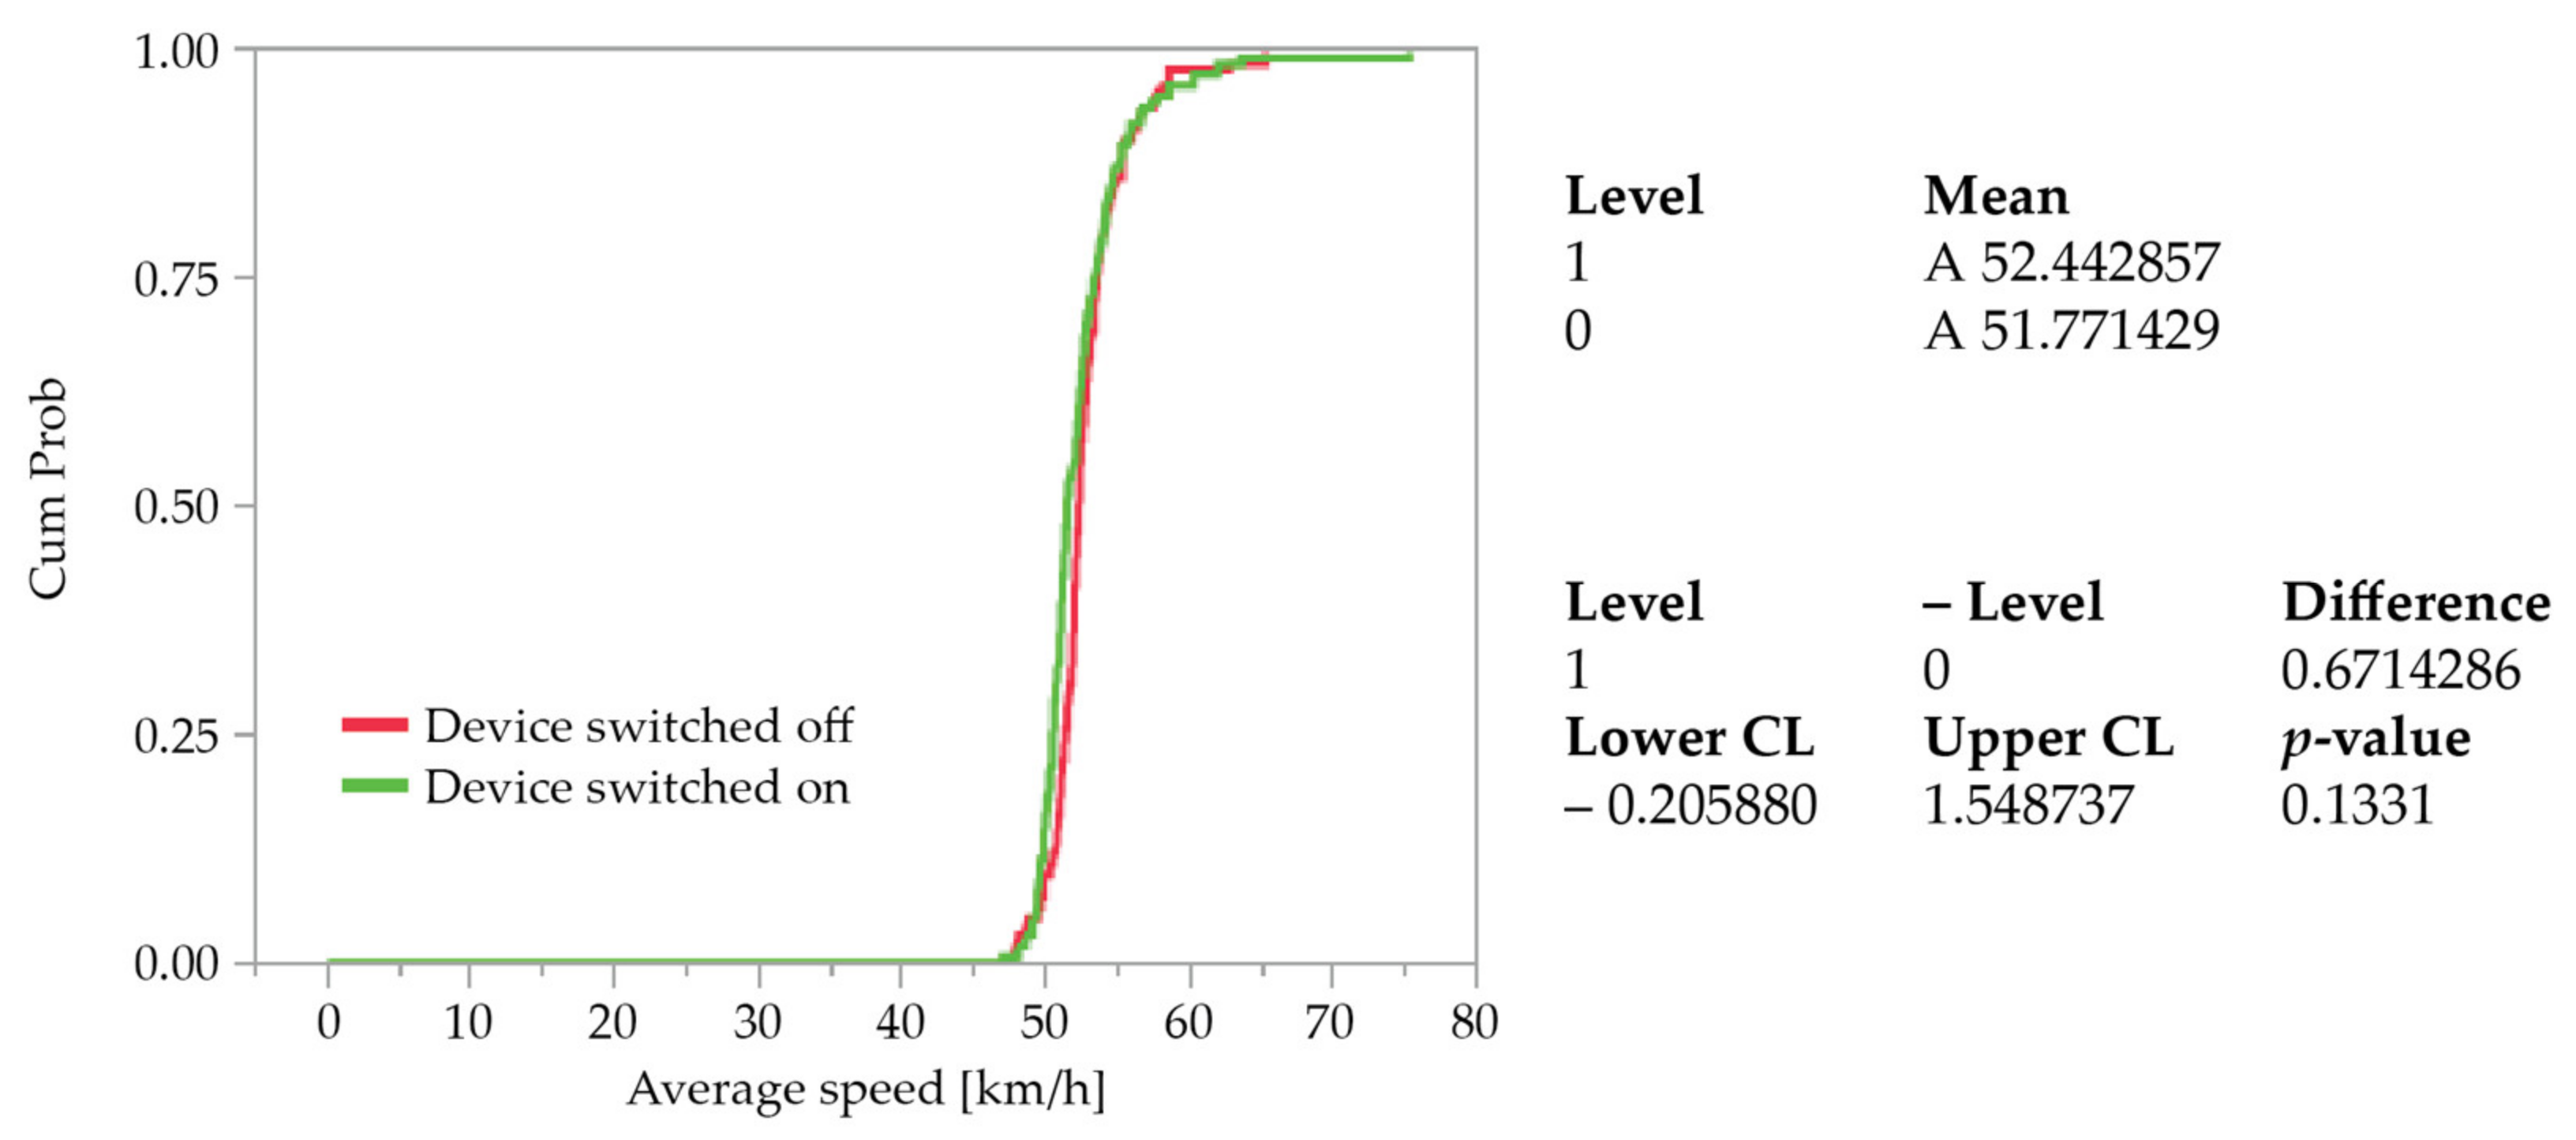
- Pavlovec Zabočki, Krapina-Zagorje County (Road Ž2195)
During the week when the device’s display was switched off, 20,365 vehicles were recorded, while during the week when it was switched on, 19,663 vehicles were recorded. By comparing the number of vehicles, it can be noted that the difference in the number of recorded vehicles during the measurements is not large, about 3%.
Analysis of the average speeds during each hour showed that there was no statistically significant difference (p-value 0.1331) between the mean speeds in the week when the device’s display was switched off compared to the week when it was switched on.
The average hourly speed of all measurements when the device’s display was switched on was 51.77 km/h, while the average hourly speed of all measurements when it was switched off was 52.44 km/h. Based on the above, it can be concluded that the differences in average hourly speeds are small, i.e., in the week when the device’s display was switched on the average hourly speed at the location was only about 1 km/h lower than the week when it was switched off (Figure 8).
Further statistical analysis of the collected data showed an increase in the mean share of users in the hour whose speed is higher than speed limit of about 1%, however, the difference did not show statistical significance.
Since descriptive statistics showed that most of the maximum speeds occur at night, a test of the average speed differences during each hour in the daytime, 06:00 h–19:00 h, was performed. Analysis of the average speeds during each hour in the day period found that there was a statistically significant difference in the mean speeds in the week when the device’s display was switched off compared to the week when it was switched on. In the week when the device’s display was switched on, the average speed at the location was lower by about 1 km/h.
The results of the statistical analysis show that the speeds at the settlement entrances are relatively high, which can certainly have a negative impact on traffic safety, especially if vulnerable road users are present on the road within settlements. According to Wramborg (2005) [24], the average chance of survival of a pedestrian in the event of a vehicle running into him at a speed of 30 km/h is 90%, at a speed of 40 km/h it is 60%, and at a speed of 50 km/h only 10%. The stopping distance is also significantly longer at different speeds, so at a speed of 30 km/h the stopping distance is on average 19 m, at a speed of 40 km/h 27 m, at a speed of 50 km/h 37 m and at a speed of 60 km/h 56 m. It should be taken into account that it is often the case in settlements in Croatia that there is a lack of adequate infrastructure for vulnerable road users, which forces them to use the road when walking, cycling, etc. The aforementioned fact points to the necessity of implementing adequate measures to reduce vehicles’ speeds when entering settlement areas where vulnerable users also use the road. Therefore, at such locations the speed display radars were found to be a relatively acceptable measure, but only as a temporary one.
Furthermore, although it was expected that the speed display radar installed at the new location would have an impact on speed reduction, the data obtained are not in accordance with this assumption because, even though the speed reductions are statistically significant, from a point of view of traffic safety, the obtained reductions can be interpreted as insufficient, raising the question about the use of speed display radars for the purpose of increasing traffic safety. The main argument for questioning the justification of installing the device is the stopping distance, which, according to Klomp et al. (2019) [25], if the recorded reductions and 85th percentile speeds are taken into consideration, does not decrease significantly.
It is important to emphasize that the researched speed display radars do not have the penalty function, but only that of providing information to drivers. At the locations where speed display radars have been installed for a longer period (more than 12 months), it can be concluded that most drivers are already familiar with how the device works and are aware that they will not be penalized in case of speeding. For this reason, the research showed that there is no statistically significant difference in vehicles’ speeds at locations where the radars have been installed for a longer period. On the other hand, at the location where the speed display radar was installed as a new but temporary solution (Severin), a statistically significant vehicles’ speed difference was found. This is the reason why the initial speed measurement was started without the displayed messages in order to determine the traffic flow speed of the current state, after which the display was switched on and the speeds were measured again. If the locations where speed display radars have been installed for a longer period are compared with the location where a speed display radar has been installed temporarily (without previously being installed at the location), it can be concluded that such measures have only a temporary effect on speed reduction. At the same time, it should be emphasized that the research of this solution at a “new” location was carried out at only one location, and so further research should to be expanded to more locations. Further research should also be expanded to roads of other categories with the aim of collecting a larger sample. Additionally, it would be fruitful to conduct research on other types of speed display radars with other light-changing signs that have the speed reduction function. Additionally, it should be pointed out that such measures are usually relatively financially expensive, and since their efficiency is questionable for a longer period, through further research it is necessary to consider them as mobile devices, not fixed ones.
If the previous studies, which were carried out in urban zones, work zones, school zones, highways, etc., are taken into account, it can be concluded that the effectiveness of speed display radars is affected not only by the location and its environment, but also by the driver’s mentality and behavioral patterns. Accordingly, in future research it would be interesting to make a comparison of speeds at locations with the same infrastructural characteristics but with groups of drivers with different mentalities and behavioral patterns.
5. Conclusions
Statistical analysis of the field research results showed a statistically significant difference in average hourly speeds at only one location (Severin, road D28), which was also a temporary location of the speed display radar used only for this research, with a difference of 5 km/h. At the remaining locations (where speed display radars were installed for a year or longer), no statistically significant differences in mean hourly average speeds were found, however, statistically significant differences of 85th percentile speeds during the day, when the device’s display was switched off compared to the week when it was switched on, were found at all locations. At the location Donji Macelj (road D1), a decrease in the number of speed limit violators by 16% was also found, which was confirmed as statistically significant. In addition, at the locations Sveti Križ Začretje (road Ž2160), Pavlovec Zabočki (road Ž2195) and Veliko Trgovišće (road Ž2195), a decrease in the number of speed limit violators by 1% to 2% and 8% was found which proved to be a statistically significant difference between the share of speed limit violators in total traffic flow. It is also important to note that the statistical analysis showed the average share of hourly speed limit violators ranged from 62% to as much as 96% at all three previously mentioned locations. This result also indicates the possible existence of speed limits which are not in line with actual traffic conditions.
A more detailed statistical analysis of the maximum hourly speeds on the road D28 also found that there was no statistically significant difference in the mean of the maximum hourly speeds when the device’s display was switched on compared to the period when it was switched off. The fact that there is no statistically significant difference in the mean hourly maximum speeds, and that there is a statistically significant difference in the mean hourly average speeds, shows that the standard deviation of the traffic flow speed increases, i.e., the oscillations between minimum and maximum speeds increase.
Taking into account that a decrease in average hourly speeds of up to 5 km/h was found, i.e., that the number of speed limit violators was reduced by up to 16% at some locations (more than 1200 vehicles in Donji Macelj during the week), a positive side of speed display radars from the point of view of traffic safety should not be ignored.
Additionally, given that almost no changes in traffic flow characteristics were found at certain locations (reduction of average speeds and the share of speed limit violators in the total traffic flow), it can be concluded that more detailed research of traffic flow characteristics should be conducted when selecting locations for speed display radars. By conducting a more detailed analysis of traffic flows as well as the analysis of the traffic safety situation, it is possible to determine with much higher probability what is the cause of excessive driving speed at a particular location.
Author Contributions
Conceptualization, J.V. and M.J.; methodology, M.J. and M.Š.; validation, M.J. and M.Š.; formal analysis, M.J.; investigation, M.J.; resources, M.Š.; data curation, M.J.; writing—original draft preparation, J.V.; writing—review and editing, J.V. and M.J.; supervision, M.J.; project administration, M.Š. and K.S.; funding acquisition, M.Š. and K.S. All authors have read and agreed to the published version of the manuscript.
Funding
This study was a part of the project entitled “Investigating the expediency of speed display radars” funded by the Ministry of the Interior of the Republic of Croatia (National Road Safety Program of the Republic of Croatia for the Period of 2011–2020).
Institutional Review Board Statement
Not applicable.
Informed Consent Statement
Not applicable.
Data Availability Statement
The data used to support the findings of this study are available from the corresponding author upon request.
Conflicts of Interest
The authors declare no conflict of interest.
References
- National Road Safety Programme. National Road Safety Plan of the Republic of Croatia for the Period of 2021–2030; National Road Safety Programme: Zagreb, Croatia, 2021.
- Vaitkus, A.; Čygas, D.; Jasiūnienė, V.; Jateikienė, L.; Andriejauskas, T.; Skrodenis, D.; Ratkevičiūtė, K. Traffic Calming Measures: An Evaluation of the Effect on Driving Speed. Promet Traffic Transp. 2017, 29, 275–285. [Google Scholar] [CrossRef]
- Gehlert, T.; Schulze, C.; Schlag, B. Evaluation of different types of dynamic speed display signs. Transp. Res. Part F Traffic Psychol. Behav. 2012, 15, 667–675. [Google Scholar] [CrossRef]
- Dadić, I.; Kos, G.; Brlek, P. Application of Changeable Message Signs in Traffic. Promet-Traffic Transp. 2003, 15, 307–314. [Google Scholar]
- Bloch, S.A. Comparative Study of Speed Reduction Effects of Photo-Radar and Speed Display Boards. Transp. Res. Rec. J. Transp. Res. Board 1998, 1640, 27–36. [Google Scholar] [CrossRef]
- Stern, S.; Schlag, B.; Schulze, C.; Butterwegge, P.; Degener, S.; Gehlert, T. Evaluation of the dialog-display-Berlin studies. Z. Verk. 2010, 56, 115–122. [Google Scholar]
- Malin, F.; Luoma, J. Effects of speed display signs on driving speed at pedestrian crossings on collector streets. Transp. Res. Part F Traffic Psychol. Behav. 2020, 74, 433–438. [Google Scholar] [CrossRef]
- Ardeshiri, A.; Jeihani, M. A speed limit compliance model for dynamic speed display sign. J. Saf. Res. 2014, 51, 33–40. [Google Scholar] [CrossRef]
- McCoy, P.T.; Bonneson, J.A.; Kollbaum, J.A. Speed reduction effects of speed monitoring displays with radar in work zones on interstate highways. Transp. Res. Rec. 1995, 1509, 65–72. [Google Scholar]
- Cruzado, I.; Donnell, E.T. Evaluating Effectiveness of Dynamic Speed Display Signs in Transition Zones of Two-Lane, Rural Highways in Pennsylvania. Transp. Res. Rec. J. Transp. Res. Board 2009, 2122, 1–8. [Google Scholar] [CrossRef]
- Walter, L.; Broughton, J. Effectiveness of speed indicator devices: An observational study in South London. Accid. Anal. Prev. 2011, 43, 1355–1358. [Google Scholar] [CrossRef]
- Mattox, J.H.; Sarasua, W.A.; Ogle, J.H.; Eckenrode, R.T.; Dunning, A.; Mattox, I.J.H. Development and Evaluation of Speed-Activated Sign to Reduce Speeds in Work Zones. Transp. Res. Rec. J. Transp. Res. Board 2007, 2015, 3–11. [Google Scholar] [CrossRef]
- Garber, N.J.; Srinivasan, S. Influence of Exposure Duration on the Effectiveness of Changeable-Message Signs in Controlling Vehicle Speeds at Work Zones. Transp. Res. Rec. J. Transp. Res. Board 1998, 1650, 62–70. [Google Scholar] [CrossRef]
- Fontaine, M.; Carlson, P.; Hawkins, H.; Murphy, K.; Brown, D. Evaluation of Speed Trailers at High-Speed Temporary Work Zones. In Proceedings of the 79th Annual Meeting of the Transportation Research Board, Washington, DC, USA, 9–13 January 2000. [Google Scholar]
- McCoy, P.T.; Pesti, G. Effectiveness of Condition-Responsive Advisory Speed Messages in Rural Freeway Work Zones. Transp. Res. Rec. J. Transp. Res. Board 2002, 1794, 11–18. [Google Scholar] [CrossRef]
- Lee, C.; Lee, S.; Choi, B.; Oh, Y. Effectiveness of Speed-Monitoring Displays in Speed Reduction in School Zones. Transp. Res. Rec. J. Transp. Res. Board 2006, 1973, 27–35. [Google Scholar] [CrossRef]
- Ullman, G.; Rose, E. Evaluation of Dynamic Speed Display Signs. Transp. Res. Rec. J. Transp. Res. Board 2005, 1918, 92–97. [Google Scholar] [CrossRef]
- Vlakveld, W.; Goldenbeld, C.; De Groot, J. Road signs depicting childrens’s book illustrations temporarily reduce speed on urban roads. Transp. Res. Part F Traffic Psychol. Behav. 2022, 87, 236–248. [Google Scholar] [CrossRef]
- Karimpour, A.; Kluger, R.; Wu, Y.-J. Traffic sensor data-based assessment of speed feedback signs. J. Transp. Saf. Secur. 2020, 13, 1302–1325. [Google Scholar] [CrossRef]
- Zineddin, A.; Hallmark, S.; Smadi, O.; Hawkins, N. Spotlighting Speed Feedback Signs. Public Roads 2016, 79, 01597982. [Google Scholar]
- Madireddy, M.; De Coensel, B.; Can, A.; Degraeuwe, B.; Beusen, B.; De Vlieger, I.; Botteldooren, D. Assessment of the impact of speed limit reduction and traffic signal coordination on vehicle emissions using an integrated approach. Transp. Res. Part D Transp. Environ. 2011, 16, 504–508. [Google Scholar] [CrossRef]
- Gressai, M.; Varga, B.; Tettamanti, T.; Varga, I. Investigating the impacts of urban speed limit reduction through microscopic traffic simulation. Commun. Transp. Res. 2021, 1, 18. [Google Scholar] [CrossRef]
- Ott, L.; Longnecker, M. An Introduction to Statistical Methods & Data Analysis, 5th ed.; Cengage Learning: Boston, MA, USA, 2001. [Google Scholar]
- Wramborg, P. A New Approach to a Safe and Sustainable Road Structure and Street Design for Urban Areas. In Proceedings of the Road Safety on Four Continents Conference, Warsaw, Poland, 5–7 October 2005. [Google Scholar]
- Klomp, M.; Jonasson, M.; Laine, L.; Henderson, L.; Regolin, E.; Schumi, S. Trends in vehicle motion control for automated driving on public roads. Veh. Syst. Dyn. 2019, 57, 1028–1061. [Google Scholar] [CrossRef]
Figure 1.
Speed display radar—example.

Figure 2.
Locations at which the field research was conducted.

Figure 3.
Cumulative representation of average speeds in an hour on road D28 in Severin.

Figure 4.
Cumulative representation of average speeds in an hour on road D1 in Mirkovec.

Figure 5.
Cumulative representation of average speeds in an hour on road D1 in Donji Macelj.

Figure 6.
Cumulative representation of average speeds in an hour on road Ž2195 in Veliko Trgovišće.

Figure 7.
Cumulative representation of average speeds in an hour on road Ž2160 in Sveti Križ Začretje.
Figure 7.
Cumulative representation of average speeds in an hour on road Ž2160 in Sveti Križ Začretje.

Figure 8.
Cumulative representation of average speeds in an hour on road Ž2195 in Pavlovec Zabočki.


Table 1.
Traffic-technical characteristics of the selected locations.
| Location | Road Mark | Road Type | Speed Limit [km/h] | Location in Relation to the Settlement | AADT [veh/day] | Road Lane Width [m] | Installation Period |
|---|---|---|---|---|---|---|---|
| Severin | Road D28 | District road | 50 | At the entrance to the settlement | 1989 | ~3.25 | Temporarily installed |
| Mirkovec | Road D1 | District road | 40 | At the entrance to the settlement | 2135 | ~3.00 | More than 12 months |
| Donji Macelj | Road D1 | District road | 50 | At the entrance to the settlement | 1283 | ~3.25 | More than 12 months |
| Veliko Trgovišće | Road Ž2195 | District road | 40 | At the entrance to the settlement | 2247 | ~3.00 | More than 12 months |
| Sveti Križ Začretje | Road Ž2160 | District road | 40 | At the entrance to the settlement | 2807 | ~3.00 | More than 12 months |
| Pavlovec Zabočki | Road Ž2195 | District road | 40 | At the entrance to the settlement | 2809 | ~3.00 | More than 12 months |
Table 2.
Analyzed data of each location where the field research was conducted.
| Location | Road Mark | Measurement Time [h] | Speed Limit [km/h] | Vehicles Recorded—Display Switched Off | Vehicles Recorded—Display Switched On | Average Hourly Speed—Display Switched Off [km/h] | Average Hourly Speed—Display Switched On [km/h] | Average Hourly Speed Difference | Average 85th Percentile Hourly Speed Difference [km/h] |
|---|---|---|---|---|---|---|---|---|---|
| Severin | Road D28 | 167 | 50 | 13,363 | 14,303 | 54.72 | 49.72 | 5 [km/h] | No data available |
| Mirkovec | Road D1 | 168 | 40 | 15,424 | 14,951 | 53.52 | 53.66 | Negligible | Approximately 1 |
| Donji Macelj | Road D1 | 168 | 50 | 8107 | 8984 | 64.34 | 64.35 | Negligible | Approximately 2 |
| Veliko Trgovišće | Road Ž2195 | 168 | 40 | 14,670 | 15,731 | 49.97 | 48.63 | Negligible | Approximately 2 |
| Sveti Križ Začretje | Road Ž2160 | 168 | 40 | 17,143 | 19,648 | 53.31 | 51.95 | Negligible | Approximately 2 |
| Pavlovec Zabočki | Road Ž2195 | 168 | 40 | 20,365 | 19,663 | 52.44 | 51.77 | Negligible | Approximately 1 |
Disclaimer/Publisher’s Note: The statements, opinions and data contained in all publications are solely those of the individual author(s) and contributor(s) and not of MDPI and/or the editor(s). MDPI and/or the editor(s) disclaim responsibility for any injury to people or property resulting from any ideas, methods, instructions or products referred to in the content. |
© 2023 by the authors. Licensee MDPI, Basel, Switzerland. This article is an open access article distributed under the terms and conditions of the Creative Commons Attribution (CC BY) license (https://creativecommons.org/licenses/by/4.0/).
Share and Cite
MDPI and ACS Style
Vertlberg, J.; Jakovljević, M.; Ševrović, M.; Shabanaj, K. Speed Display Radars’ Impact on Speed Reduction on District Roads at Settlement Entrances. Sustainability 2023, 15, 3099. https://0-doi-org.brum.beds.ac.uk/10.3390/su15043099
AMA Style
Vertlberg J, Jakovljević M, Ševrović M, Shabanaj K. Speed Display Radars’ Impact on Speed Reduction on District Roads at Settlement Entrances. Sustainability. 2023; 15(4):3099. https://0-doi-org.brum.beds.ac.uk/10.3390/su15043099
Chicago/Turabian StyleVertlberg, Juraj, Marijan Jakovljević, Marko Ševrović, and Kamer Shabanaj. 2023. "Speed Display Radars’ Impact on Speed Reduction on District Roads at Settlement Entrances" Sustainability 15, no. 4: 3099. https://0-doi-org.brum.beds.ac.uk/10.3390/su15043099
Note that from the first issue of 2016, this journal uses article numbers instead of page numbers. See further details here.