Article

How Fear, Exogeneous Shocks and Leadership Impact Change: The Case of Economic Models of the French Men’s Professional Basketball Clubs

1
Swiss Graduate School of Public Administration, University of Lausanne, 1015 Lausanne, Switzerland
2
URePSSS, UFR3S, University of Lille, 59000 Lille, France
*
Author to whom correspondence should be addressed.
Sustainability 2023, 15(6), 4910; https://0-doi-org.brum.beds.ac.uk/10.3390/su15064910
Submission received: 31 January 2023 / Revised: 4 March 2023 / Accepted: 7 March 2023 / Published: 9 March 2023
(This article belongs to the Special Issue Sport Policy and Finance Ⅱ)

Abstract

:
The financial situation of clubs is a major issue in professional sports. Their vulnerability can be explained by the structure of income (not diversified enough) or by the breakdown of expenditure (too much investment in sports talent). This state of affairs has prompted an interest in their economic models, specifically in the context of French clubs from 2008/2009 to 2019/2020. How did these clubs evolve over time, and how were they able (or not) to transform their economic model? Principal components and k-means analyses of financial data reveal four main types of economic models. Even if some clubs kept the same model over this period, many clubs also substantially changed their economic models. Interviews with professional clubs were performed to understand the factors underlying change and stasis as appropriate. Although visionary leadership partly explains the changes at certain clubs, exogeneous shock played at least as great a role. However, such external factors are not sufficient to overcome some clubs’ organizational inertia, often due to a fear of change that clubs rationalize in terms of their limited local potential. This paper could be helpful in assisting clubs to fight against attribution biases and to understand how to transform their economic models to become less vulnerable.

1. Introduction

In recent years, professional sport has experienced significant growth in revenue. French football, handball, and rugby clubs have all benefited during this period, significantly increasing their turnover. However, basketball clubs seem not to be susceptible to this trend. The period from 2006 to 2020 saw no overall increase in the revenues of French men’s professional basketball clubs in either of the National Basketball League’s (LNB) two divisions [1,2].
Nevertheless, those studies are based on aggregate data and do not shed light on the economic models of the clubs studied. Understanding this state of affairs is, however, an important issue given the financial difficulties of these organizations. (The last example is given by one of the most mythical French clubs, Pau-Orthez suffering from a deficit of EUR 3 million for a budget of EUR 7.8 million. https://www.lefigaro.fr/sports/basket/basket-pau-orthez-relegue-en-national-1-la-chute-d-un-monument-du-sport-francais-20220712, accessed on 3 December 2022). The club economic model here refers to the distribution of its revenues (or sources of finance) and costs (or expenditures) as well as to its profits or losses [3].
The literature identifies two sources of clubs’ financial troubles and bankruptcies [4]. Exogenous factors provide a first explanation [5,6,7]: clubs are submitted to productivity (a significant gap between actual and expected sporting performance) and demand shocks (an important revenue gap). It is, therefore, important to assess the distribution of revenues because a low revenue diversification may increase a club’s financial vulnerability [8,9]. Furthermore, the problem may be endogenous to the sports industry. Clubs are ruled under a soft budget constraint [10,11]. They enter a rat race and spend more money than they should to hire the best players [12]. Knowledge of the expenditure structure is, therefore, a good indicator of the financial situation of clubs. This paper intends to analyze the economic model of French basketball clubs longitudinally and to understand why these organizations are (un)able to change.
Having access to unique data enables us to conduct a preliminary analysis, enabling us to understand that some clubs increased their turnover and even completely transformed their economic model during the eleven seasons between 2008/2009 and 2019/2020, whereas others continued to follow the same economic model. To do this, we subjected the financial data of the clubs to a two-stage analysis process comprising a principal components analysis (PCA) followed by a k-means analysis. This taxonomy finding leads to our main research question: which factors determine whether a French basketball club changes its economic model?
Our aim was to investigate the role played by exogeneous shock [6] and visionary leadership in driving change and the ability of proactive strategic choices and fear of change [13], rationalized as respect for the club’s traditions [14], to create inertia. We conducted a series of semi-structured interviews with executives from four clubs that had changed their economic model during our analysis period and with executives from four clubs that had kept the same economic model. These interviews allowed us to compare the interviewees’ subjective representations of their decisions with the results of our taxonomy and thereby ensure that our analyses of the factors that had led a club to retain or transform its economic model took into account these post hoc rationalizations [15].
Although visionary leadership partly explains the changes at certain clubs, exogeneous shock (e.g., the local council’s decision to build a new arena, opening of a closed competition to new teams, the innate uncertainty of sport) played at least as great a role. For example, unexpectedly qualifying for a European competition (positive productivity shock) can trigger a systemic professionalization process. However, such external factors are not sufficient to overcome some clubs’ organizational inertia, often due to a fear of change that clubs rationalize in terms of their limited local potential (small arena, small catchment area, intra-sport and inter-sport competition) or the weight of tradition.

2. The Economic Models and the French Men’s Professional Basketball Clubs

2.1. Sport Organization Economic Models

Scholars generally use two archetypes to describe professional sport clubs’ economic models [16]. The most highly developed sports leagues follow the MCMMG model, which first emerged in the 1990s. Clubs in this category obtain their revenues from the Media (broadcasting rights), Corporations (tycoons, oligarchs, etc.), Merchandising, and Markets (trading players, financial markets, in the case of publicly listed clubs) and operate within a Globalized system of finance. Less well-developed leagues, including both divisions of the LNB [1,2], follow the SSSL model. Clubs in these leagues obtain most of their revenues from Spectators (ticketing), Subsidies (from local authorities), and Sponsors (local companies) and operate within a Local system of finance.
Andreff and Staudohar’s [16] MCMMG/SSSL categorization of sports finance has two weaknesses with respect to the present study. First, it overlooks two important aspects of an organization’s economic model, that is, expenditure and financial performance [3]. Second, aggregating data for an entire league can hide large disparities between clubs in terms of their strategy [17] or their profitability [18].
Terrien et al. [19] developed another method for categorizing sports clubs’ economic models based on their revenues, expenditures, and sporting and financial performance, which will be replicated in this research. Applied to French amateur football clubs, they revealed the existence of four categories of models and showed that these clubs rarely changed their economic models. In fact, only 2 of the 77 clubs analyzed changed categories between 2008/2009 and 2019/2020.

2.2. The Economic Models Followed by French Men’s Professional Basketball Clubs

Terrien et al. [1] and Carin et al. [2] observed recent changes in the overall nature (fewer subsidies, more sponsorship) and volume of French professional basketball clubs’ revenues, but these changes are quite modest compared with those seen in French handball [1]. Similarly, the structure of French basketball clubs’ expenditure and profitability have also remained relatively stable [2].
This stability/inertia may come as a surprise, considering that the French national team achieved its best results in international competitions in recent years, and the revenues of NBA clubs have exploded. However, none of these studies about French basketball reported a measure of dispersion around the overall mean, so it is impossible to know whether this apparent stability masks differences between clubs. In other words, extrapolating the overall stability across the league to its constituent clubs may be an ecological fallacy (This is a formal fallacy in the interpretation of statistical data that occurs when inferences about the nature of individuals are deduced from inferences about the group to which those individuals belong.). A club-level analysis is needed to determine whether this is the case, and the preliminary analysis of this paper will answer this question.

3. Exogeneous Shocks, Leadership and Fear: Generators of Change and Inertia

Numerous considerations influence organizations’ decisions about whether to adapt their strategy to (changes in) their environment. However, the tendency for people to rationalize decisions post hoc makes it difficult to determine the most important factors involved [14].

3.1. Exogeneous Shock as a Trigger for Change

It is well-established that external stimuli are major drivers of professionalization within sports organizations [20]. Events within the environment can modify an organization’s characteristics [21]. For example, the professionalism of rugby players in the southern hemisphere had a decisive impact on the professionalization of both French clubs [22] and the English rugby federation [23,24]. Change can also be imposed by a governing body, as when the European Basketball Federation authorized professionalism in European basketball [22].
Another exogeneous shock may come from the very uncertainty at the heart of the sport. For example, productivity shocks due to unexpected variations in sporting results can affect a club’s solvency [5,6,7,25] and profitability [26] and thereby lead it to transform its economic model.
Resource dependency is another potential driver of change in sports organizations [27]. For example, when an organization is reliant on a single source of revenue, such as public subsidies [28] or an event [29], the stakeholder that controls this source has the power to force the organization to change to satisfy its demands. The departure or arrival of a stakeholder (e.g., a shareholder or a sponsor) can also lead to a significant demand shock, resulting in a transformation of the club’s economic model.
A sport organization may also be subject to resource dependency with respect to its arena, which can be a key source of revenue. All of France’s professional basketball clubs play in city council-owned arenas, so they are dependent on the public authorities for the use, renovation, or construction of their operating tool [11]. Having a good quality stadium is an important factor in a professional club’s local potential [30]. The exogenous decision of the local council to build a new arena may therefore trigger a demand shock.

3.2. Visionary Leadership

It is often difficult to determine the extent to which change is the result of visionary leadership and the extent to which it is due to exogeneous shock: leaders tend to rationalize events in hindsight, while, at the same time, success is often a question of having the right person in the right place at the right moment [14]. Indeed, individuals can play a major role in the professionalization of sports organizations [31], as research into organizational professionalization has clearly established [20].
Board members’ strategic abilities play an important role in the transformation of sports organizations [32]. A board that is open to change is an asset for an organization [33], notably when it comes to reducing the organization’s vulnerability [34,35] and avoiding financial difficulties [9]. Diversity within the board can have a similar effect [36]. Furthermore, having board members with large and diverse networks can facilitate access to a wide range of external resources [37]. Thus, human resources are key in diminishing the problems faced by sports organizations [9,33]. Many observers have highlighted the lethargy of sports organizations that results from their poor recruitment processes, often based on social closure [38].

3.3. Fear of Change

Fear of change is both a central issue for understanding an organization’s problems [9,33] and performance [39] and one of the main barriers to the professionalization of sports organizations [40]. Indeed, fear of change and/or the desire to maintain traditions can lead organizations to choose inertia rather than adaptation in response to an environmental stimulus [14]. Graddy and Morgan [13] found that fear of change, alienating stakeholders, and uncertainty can prevent nonprofit organizations from evolving. However, decision-makers within such organizations rationalize their aversion to risk in terms of a desire to preserve the organization’s traditions [13].
An organization’s leaders may also rationalize their opposition to change and thereby justify immobility by overstating external obstacles to change [13]. For example, one of France’s first-division handball clubs, which competes in a rapidly growing professional championship (revenues of French first-division handball clubs grew by 222% between 2006 and 2018), claimed that its poor economic growth was due to a lack of support from the local authorities, even though direct public subsidies account for 60% of its income [1]. Reduced local potential due to competition from other sports within a club’s catchment area [30] can also be used to justify inertia.

4. Methodology

A preliminary analysis was performed to characterize the clubs’ economic models. Following this, a qualitative survey allows us to identify those factors that led clubs to change their economic models or to continue with the same model.

4.1. Preliminary Analysis

We would not have been able to conduct the present longitudinal study of France’s professional basketball clubs’ economic models between 2008/2009 and 2019/2020 without the support of the National Directorate of Management Control (DNCGCP), which monitors the finances of Pro A and Pro B basketball clubs and provides us with financial data for all the clubs concerned. Limiting our analysis to clubs that spent at least five seasons in these two divisions during this period gave us a sample of 395 observations for 38 clubs.
We compiled data for a range of variables that can be used to define an organization’s economic model [3]. These variables covered sources of revenue, areas of expenditure, and sporting and financial performance. They are the same as those considered by Terrien et al. [19], but with three exceptions. Because our focus was France’s elite basketball clubs, we included a measure of sporting success to better describe them. (We calculated a composite index for this variable by allocating 1 point for a Pro B title, 5 points for a Pro A title, 10 points for a EuropCup or FIBA Europe Cup title, and 20 points a Euroleague or Basketball Champions League title. Using a different scale (increasing or decreasing the number of points between competitions) to calculate this index has marginal impact on the statistical results and does not impact the taxonomy reported in this paper.) In addition, the data provided by the DNCGCP enabled us to differentiate between local authority sponsorship and private sponsorship and between a club’s sporting payroll and its administrative payroll. Table 1 provides descriptive statistics for the variables included in the study.
We used a two-stage data analysis procedure [17]. As a first stage, we performed a principal components analysis (PCA) to summarize the information provided by the 21 variables and to reduce the number of dimensions [41]. We evaluated the strength and quality of the PCA by using Bartlett’s Test of Homogeneity of Variances to ensure that the correlation matrix was not determined on the basis of an identity matrix and a Kaiser–Meyer–Olhin (KMO) measure of sampling adequacy to eliminate variables that did not correlate with any of the other variables. We determined the acceptability of the PCA as follows: KMO value below 0.5 = unacceptable; 0.5 to 0.6 = mediocre; 0.6 to 0.7 = moderate; 0.7 to 0.8 = good; 0.8 to 0.9 = very good; above 0.9 = excellent [42].
We then used the k-means method to group observations into homogenous sub-groups (clusters) and thereby categorize the economic models followed by Pro A and Pro B clubs between 2008/2009 and 2019/2020. This iterative process enabled us to select the most appropriate number of groups to minimize the intra-class variance (and therefore maximize the interclass variance).

4.2. Qualitative Analysis

The results of our preliminary analysis provided the information we needed to select the most appropriate clubs to interview in order to collect qualitative data. We conducted a total of eight semi-structured interviews with key executives from Pro A and Pro B clubs. Four of these interviews were with clubs that had remained within the same category throughout our analysis period (one club for each of the four categories), and three were with clubs that were representative of the three most common changes in category during the study period. The final interview was with a club that had remained within the same category but which appeared, from a statistical point of view, to be in the process of moving to a very different model. This club, which we identified on discussing the results of our taxonomic analysis with a member of the DNCGCP, was the only French club to take part in the Euroleague (the most prestigious European competition) in 2019/2020.
We also used the discussion with the DNCGCP to validate the four clusters we had identified and to determine the most representative clubs in each category. When deciding which clubs to interview, we also chose clubs that were close to their cluster’s barycenter. This approach helped to confirm the existence of the fifth category suggested by the statistical analysis, as the club in question was 4.5 times the mean distance from its cluster’s barycenter during the last two years of the analysis period. Finally, the clubs we chose had to agree to be interviewed about their economic models.
The interview grid included three themes. The first was the interviewee’s personal and club background. The second dealt with the club’s economic model, based on Andreff and Scelles’s definition [3]. The third dealt with the changes experienced by the club in revenues, expenditure, and/or profitability over the years. We then asked for explanations for any changes/lack of change. The grid was the same for all eight interviews. We transcribed and double-coded all the interviews. Table 2 lists the roles of the people we interviewed and the length of each interview.
When determining the causes of inertia or transformation in a club’s economic model, we took several precautions to protect against the phenomenon of post hoc rationalization by the people involved [14]. First, the clubs we interviewed did not know that we had seen their accounts. Similarly, neither the club nor the interviewer was aware of the results of our taxonomic analysis and, therefore, of whether the club’s economic model had changed.
These factors allowed us to compare our interviewees’ responses with their clubs’ financial statements. Although objective and subjective financial evaluations are often correlated [43], this approach helped to reveal respondents’ conscious and subconscious biases [15]. In addition, keeping the interviewer in the dark as to whether a club had changed its economic model ensured that he did not phrase the questions in a way that might orient the interviewee’s responses.

5. Economic Models Adopted by French Professional Basketball Clubs

5.1. Principal Components Analysis

The matrix of Pearson correlations between the 21 variables revealed several interesting points (Appendix A). First, the size of a club’s arena correlated with its past and present results, which shows the importance of infrastructure resources [9]. Non-sporting salary expenditure correlated positively with a club’s revenues and sporting results. Variables associated with profitability correlated poorly with the other variables. Finally, travel costs represented a greater proportion of expenditure for clubs with poorer sporting results. This result may be because these clubs used travel expenses to complement salaries, as is the case in some amateur French football clubs [19].
Results of the tests conducted to assess the quality of the PCA led us to discard one variable because of multicollinearity (Total Expenditure) and five variables for which KMOs were below 0.5 (% Other Products, % Public Sponsorship, % Sports Wages, % Private Sponsorship, % Sports Social Security Costs). Table 3 shows the results of this backward induction process, which allowed us to improve the quality of the PCA [43].
Consequently, we based our taxonomic analysis on the remaining 15 variables, which could be grouped into five dimensions with eigenvalues greater than one [41]. These dimensions were D1: Exposure (most important variables: Ranking t, Ranking t − 1, TV Rights, Total Revenues); D2: Profitability (Operating Income, Net Income); D3: Professionalization (Wages + Social Security Costs); D4: Other Costs (Travel Costs, Other Costs); D5: Club’s History (Arena Size, Past Sporting Success, Subsidies, Equity). We applied a varimax rotation to facilitate the interpretation of these factors (i.e., reducing the number of variables with high loadings in each factor). Appendix B shows the loadings of each variable on each dimension after this rotation. Considering differences between clubs on these five dimensions, rather than the 21 original variables, facilitated our analysis of the clusters identified by the taxonomic analysis.

5.2. Description of Clusters

Appendix C shows the results of the k-means analysis. Creating a fourth cluster greatly reduced the amount of intra-class variance. 
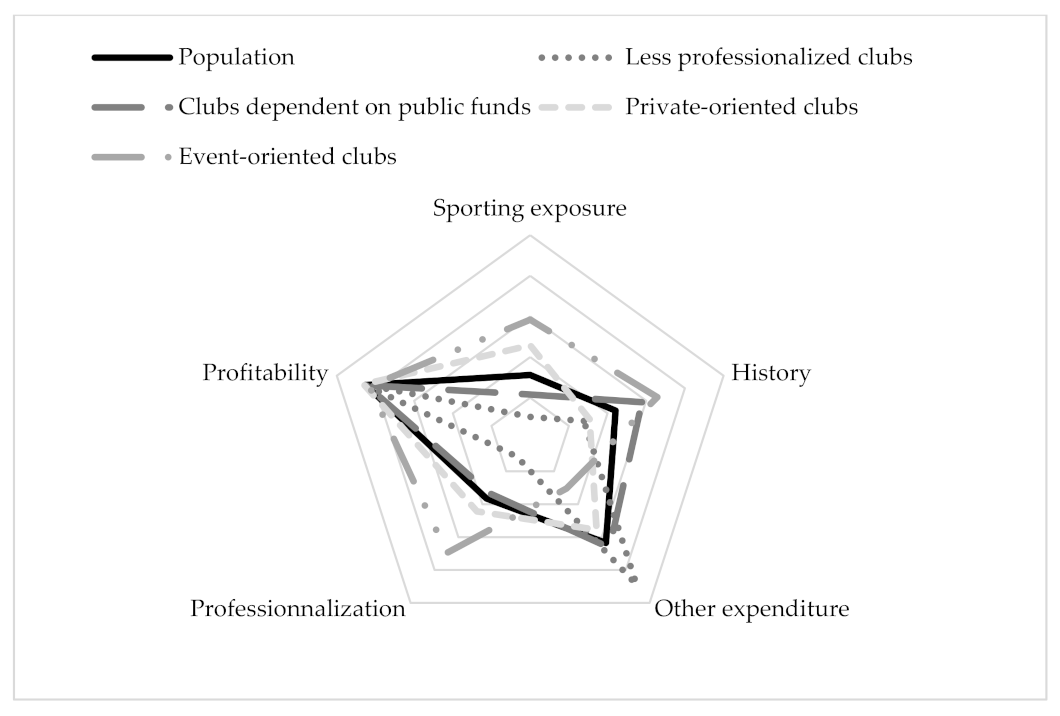
Figure 1 shows the profiles of the four clusters obtained by plotting the loadings of the variables for each of the five dimensions revealed by the PCA.
This diagram shows that the four economic models differ markedly in four of these dimensions. Although Pro A and Pro B clubs had an overall deficit (see Table 1), there was no significant difference between clusters in overall profitability. The clubs in Clusters 2 and 4 had slightly higher mean deficits than the clubs in the other clusters, but intra-cluster heterogeneity was too great to use this dimension to explain the taxonomic analysis.
  • Cluster 1 (C1): Less Professionalized Clubs
This cluster included the largest number of observations (131). Clubs in C1 had the lowest mean budgets (EUR 1.75 million) and the smallest arenas (2140 seats). Public subsidies were their main source of revenue (EUR 0.76 million, 43.68%), even though they received fewer subsidies than clubs in the other clusters. This low level of income was linked to mediocre sporting performance (lowest level of sporting success; mean performance equivalent to eighth place in Pro B; only 11% of observations were in Pro A). Clubs in this cluster also had the lowest level of professionalization (administrative payroll), which may be a cause or a consequence of their poor sporting performance.
However, C1 clubs spent more on travel costs (EUR 0.29 million) than the clubs in all the other clusters, even those in C4 (EUR 0.28 million), which take part in European competitions. Intriguingly, for 11 observations in C1, travel costs accounted for more than 40% of total expenditure.
In the case of Club 7, whose economic model evolved from C2 to C1 during our study period, the executive we interviewed underestimated the club’s expenditure on travel by 16% compared with the figures given in the club’s accounts (as provided by the DNCGCP). At the same time, the interviewee overestimated the amount the club spent on talent. The interviewee from Club 6, which was in C1 at the beginning of our analysis period, criticized some clubs’ accounting practices:
We are the only French basketball club that doesn’t use cash, so we don’t have a slush fund, something that’s very common, at least in basketball. I can’t talk about other sports, but I know that under-the-table payments are very common. And we don’t want to have any lost turnover.
  • Cluster 2 (C2): Clubs Dependent on Public Subsidies
C2 (94 observations) contains clubs that received substantial public subsidies, whether directly (mean subsidy = EUR 0.84 million) or indirectly in the form of arenas (mean size 4542 seats) and/or sponsorship. Indeed, public sponsorship accounted for 8.3% of these clubs’ revenues, compared with 2.8% in C1. This support may be explained by these clubs’ past sporting glory (only C4 clubs have a better track record). C2 clubs had a mean budget of EUR 2.4 million, which they appeared to invest in their sporting performance, as they achieved much better sporting results than C1 clubs (mean position of third place in Pro B, 36% of these clubs played in Pro A).
The quid pro quos of public sponsorship may be why clubs in C2 are more professionalized than those in C1 (administrative payroll of EUR 0.2 million in C2 vs. EUR 0.12 million in C1). Club 2 (representative of C2) does not differentiate between public and private partnerships, although its financial statements indicated that public sponsorship provided approximately 15% of its annual income. However, Club 7, which was in C2 for many years, highlighted the increasing demands being placed on clubs in exchange for public funding (without differentiating between subsidies and sponsorship):
We’re trying to find alternatives to the local authorities because we are aware that their contribution is going to decrease as time goes on. Even if it doesn’t, there’ll be strings attached; they won’t just sponsor elite sport. We’ll also have to have a societal mission.
  • Cluster 3 (C3): Private-Oriented Clubs
Even though they lack an illustrious sporting past, clubs in this cluster managed to attract substantial sums from the private sector. Consequently, during our analysis period, C3 clubs (80 observations) obtained, on average, 43.7% of their revenues from private sponsorship. In contrast, only 12.4% of their revenues came from match-day receipts, an equivalent sum to C2 clubs, even though C3 clubs had much larger budgets (mean = EUR 4.69 million) and much smaller arenas (mean = 3417 seats) than C2 clubs. The income C3 clubs obtained from private sources compensated for the relatively modest amount of public support they received (C3 clubs obtained only 26.3% of their income from direct subsidies).
C3 clubs’ ability to attract private funding may be explained by their relatively high level of sporting success (equivalent to ninth place in Pro A; 86% of C3 clubs play in Pro A). This success may be linked to their high degree of professionalization, as reflected by their administrative payroll (EUR 0.47 million, wages plus social security contributions), which was twice as high as in C2. Having salaried staff may also have a direct effect on their ability to obtain private funding [44].
  • Cluster 4 (C4): Event-Oriented Clubs
This cluster contained 90 observations. C4 clubs had a mean budget of EUR 5.45 million and more diverse sources of revenue than clubs in the other clusters. In addition to the usual pillars of public subsidies (24% of income) and private and public sponsorship (48% of income: 41% from the private sector; 7% from the public sector), these clubs obtained a non-negligible proportion of their revenues from TV rights and match-day receipts (21% of total revenues, compared with 15% for C3 clubs).
These high match-related receipts are probably due to the fact that most C4 clubs took part in European competitions and had large enough arenas (mean capacity of 5999 seats) to obtain substantial ticketing revenues, especially for European Cup matches. Although competing in Europe incurs both high travel costs (EUR 0.28 million in C4 vs. EUR 0.16 million in C3) and the cost of organizing home games, the C4 clubs we interviewed did not remark on this, as they were used to taking part in European competitions. In contrast, our interviewees from C3 clubs (Clubs 5 and 6), which only occasionally qualify for these competitions, did comment on the cost of competing in Europe: “So, I know that in this model I have to achieve EUR 6.2 million in turnover in order to cover the cost of playing in Europe and to have a competitive team” (Club 5, member of C3 since 2015).
The race to recruit talented players seemed to be slightly less pronounced in C4 because sporting payroll (salaries and social security contributions) accounted for only 43% of C4 clubs’ expenditure, compared with 47% or 48% in the other three clusters. This limited ambition may explain why their domestic sporting performances were not much better than those of C3 clubs (mean position of eighth place in Pro A, 9% of C4 clubs play in Pro B) even though C4 clubs had far more resources.

6. Causes of Inertia and Drivers of Change in Economic Models

6.1. Instability of Clusters

Table 4 shows the number of clubs in each cluster for each season during our study period. Overall, there was no major change in the proportion of clubs in each cluster during this period.
However, examining each club individually showed that 31% of them changed their model between 2008/2009 and 2019/2020. The four most frequent changes were from C1 to C2, from C1 to C3, from C2 to C1, and from C2 to C3 (shown in italics in Table 5). We used this analysis to guide our choice of clubs to interview (Club 5: C1 to C2, then C3; Club 6: C1 to C3; and Club 7: C2 to C1).
We added a fourth club (Club 8) to our list of interviewees because it was moving toward a fifth type of economic model, a fact that was noted by the DNCGCP and remarked upon by all the other clubs we interviewed, except for Clubs 1 and 5. Club 8’s takeover by a new investor enabled it to double its budget between 2015 and 2020, even though it lost its public subsidy, which had accounted for 20% of its budget a few years earlier. Thanks to its new patron, the club can live on credit. The investor expects to obtain a return on its current investment by gaining a long-term license to play in the Euroleague and taking delivery of a new arena.

6.2. Rationalizing Inertia: Limited Local Potential and Tradition

Clubs that did not change their economic model during our study period attributed this inertia to three aspects of their local potential [30]. First, they blamed their inability to grow on the low attractiveness of French basketball competitions. For example, Clubs 1 and 2, which play in Pro B, remarked on the competition from North American basketball. Although the NBA is undeniably the world’s preeminent basketball league, it is surely greater competition for clubs that belong to France’s (Clubs 5 and 6) or even Europe’s (Club 8) basketball elite, some of which nevertheless managed to develop their economic models.
Second, they felt that their arenas were too small to allow them to increase their revenues and that obtaining a new arena was essential to the success of any new project (Clubs 2, 3, 4, and 8). However, the sporting success of C3 clubs shows that the size of a club’s arena is not necessarily the most important factor. Expertise in exploiting the arena is just as important, as Club 5 noted, although this may be a case of attributing success to internal decisions while overlooking the impact of external factors. Nevertheless, Club 5 managed to change its economic model, even though its new arena is smaller than average for clubs in its cluster (C3). In contrast, Club 2, which moved into a new arena at the same time as Club 5, did not change its economic model, despite having a larger arena than Club 5. Consequently, obtaining a new arena (Clubs 1, 3, and 8) should not be seen as a miracle cure.
Third, our interviewees frequently referred to competition from other professional clubs in their club’s catchment area. Clubs 1, 4, and 7, for example, saw this competition as ruling out any possibility of growing the club. However, local competition did not prevent other clubs from growing, as shown by Club 5, which moved from C1 to C3, despite facing competition from professional rugby and football clubs located in the same (small) city. Indeed, the DNCGCP would like to see Club 5 become a model for French basketball. This example shows that “geographical Darwinism” has not yet occurred in French basketball [1].
Some clubs rationalized their inertia by evoking a desire to maintain traditions, an argument that often masks a fear of change [14]. The weight of tradition can lead clubs to continue relying on volunteers, even for important tasks (Clubs 1, 2, 3, and 7), or to constitute their managerial teams from former players (Club 7). It can also be seen in some clubs’ legal status. For example, Clubs 3 and 4 are semi-public companies with the local council as majority shareholders. The main aims of these shareholders are to ensure the clubs’ “stability” and to ensure that they do not “make the headlines because of non-sporting problems” (Club 4).

6.3. Harnessing Exogeneous Shock to Implement Change

Productivity shocks [6] appear to be one of the main drivers of change in French basketball clubs. The description of C4 clubs shows that taking part in European competitions can spur clubs to evolve (Clubs 5 and 6) and lead to their systemic professionalization [20]. This was most notably the case for Club 6, whose economic model evolved directly from C1 to C3.
It wasn’t the economic model or new money that meant the club managed to win; it was the opposite. When we started winning, we had to recruit salaried staff and move, because the old headquarters weren’t big enough.
Other clubs remarked on positive (Club 2) or negative (Clubs 3 and 5) productivity shocks that did not change their current position, and there were also occasions when clubs saw a positive productivity shock as a curse: “Unfortunately, and I do mean unfortunately, we had a very determined team that, with one of the smallest budgets in Pro B, got us promoted to Pro A. That didn’t help me; it didn’t help me” (Club 2).
Nevertheless, sporting success can help rouse a club from its inertia by clarifying its objectives [38]. This was the case for Club 7, which moved from C2 to C1 after an excellent season took the team to the brink of Pro A:
Three years ago, we had a great season. We were almost in the running for promotion. Everyone got a bit carried away, but… I’m not saying it would be madness, but even if it’s good to go up, the next season isn’t structured.
Exogeneous shock led to a change of course for Club 7 that translated into a change of economic model (14% reduction in budget, less expenditure on talent, fewer administrative staff, and improvement of the club’s equity).

6.4. Visionary Leadership

Exogeneous shock will only result in a club changing its economic model if its executives take the actions needed to do this. Consequently, leaders can trigger change, as was the case for Club 5, which moved from C1 to C2 and then to C3 in just a few seasons. It was not the players who sparked the changes to the club, as was the case for Club 6, but the opposite:
There was a phase after we had launched the project when we spent a bit more on infrastructure, on indirect costs rather than on players’ salaries. Now that we have exceeded our most optimistic forecasts, we have gone back to spending the increase on players.
This expenditure has allowed the club to professionalize by giving volunteers the more humdrum tasks and recruiting skilled paid staff to take over the more technical functions:
Managing volunteers is quite complex because there’s no hierarchy. So, if you try to chivvy on someone who does their job badly, they can very easily say, “if it’s like that, I’m leaving.” There’s a sort of threat, not unhealthy, but if you like, you cannot organize things very professionally.
This approach differs greatly from that of Club 7, which makes widespread use of volunteers and outside service providers. Moreover, it chooses its human resources based on their local connections, with the idea that they will have “that little extra attachment that can make the difference.” Basing its recruitment on social closure [38] may explain why the club is unable to obtain external resources [37] and therefore forced to rely on direct or indirect subsidies.
Club 8 is another example of visionary leadership. It was not the club’s professionalization that enabled its transformation but its new shareholder’s personal fortune. Current spending has created a deficit but has given the club the impetus it needs to attract new shareholders (e.g., the city’s professional football club) and partners. According to the people we interviewed (the club itself made a similar point, as did the DNCCG (when asked about the issue) and even some of the clubs that highlighted their limited local potential), this situation will enable the club to develop a new virtuous model when it takes delivery of its new arena and earns a guaranteed place in the Euroleague.
Consequently, the project’s success depends greatly on outside factors. This example highlights the fact that it is often difficult to differentiate between the impacts of managerial decisions (in this case, to professionalize the club) and of exogeneous shock on triggering (systemic) change [20]. In addition, the case of Club 3 shows that even though moving to a new arena may be a necessary condition for a club’s economic development, it is not sufficient on its own.

7. Discussion

This paper is helpful in exploring an underrepresented sporting environment in the sports management literature: French basketball clubs. (To the best of our knowledge, before the two papers using aggregate data [1,2], only one study [45] had focused on French professional basketball and had only researched the design of Pro A basketball.) Our analysis of French professional basketball clubs’ finances between 2008/2009 and 2019/2020 has revealed the existence of four types of economic models. They are summed up in Table 6.
This paper enables us to understand why and how some clubs manage to change their economic model, whereas some organizations seem to stagnate. Those findings can help clubs and the LNB identify levers for change. They also provide insights into why the LNB’s wildcards strategy failed. After evaluating the economic potential of Rouen Métropole Basket, the LNB promoted the club to Pro A at the end of the 2013/2014 season, even though it had finished fourteenth in the Pro B division. Several criteria were used to assess the economic potential of the club. Among them, two were overestimated: the size of the arena (6000 seats) and the catchment area. Indeed, Rouen did not achieve the standard of play required by Pro A and was relegated back to Pro B two years later. If the size of the city matters in football [46,47], this is not true in French basketball [1,48]. Rouen was unable to develop and continued following the same type of economic model for the entire period from 2010/2011 to 2019/2020 (C2). If the LNB decides to repeat the wild card strategy, it should use a wider range of criteria than just a club’s economic potential when selecting clubs to promote. Club 5’s success shows that a club’s level of professionalization is at least as important as having good local potential.
More generally, our taxonomic analysis could be useful to the LNB and to the DNCGCP in their work supporting and regulating French basketball clubs. For example, both bodies should warn some C1 clubs that their illicit accounting practices (misuse of travel costs) could expose them to crippling financial penalties from France’s social security contribution collection organization (URSSAF).
Our analysis also has theoretical interests. This paper provides a club-level analysis to avoid the ecological fallacy of the previous study [1,2] and to explain changes in the French professional basketball industry. It describes different economic models with specific features. This research also confirms that fear, leadership, and exogeneous shock impact decision-making behaviors [14,26] in these organizations.
Combining quantitative and qualitative analyses of objective and subjective data allowed us to assess the factors underlying these changes and to guard against possible attribution biases. Despite the methodological precautions taken in this research, the line between exogeneous shock and visionary leadership may remain blurred due to the conscious and subconscious biases of the people involved, especially in post hoc rationalization [15]. This is the main limitation of this study.
Nevertheless, the triangulation between accounting data, statistical analyses, and interviews enables us to increase the internal validity of this research. This approach could be replicated to test the external validity of this research. Replication of this method could also explain why many French Men’s professional basketball clubs change their economic model, whereas amateur football clubs do not [19].
Profitability was not a differentiating factor between any of the clusters we identified, none of which appeared more virtuous or more remiss than the others in terms of balancing their budgets. In fact, clubs in every cluster regularly incurred deficits. Therefore, further research is also needed to better understand the causes and consequences of these deficits and to analyze the financial situation of French basketball clubs [8]. Taking an interest in the economic models of clubs is a promising area of research, as it is difficult to predict the failure of clubs [25]. Indeed, Dufau et al. [4] have shown how exogenous shocks can have differentiated consequences (i.e., generate demand shocks) depending on the endogenous characteristics (linked to the business model) of the clubs.

8. Conclusions

In contrast to the inertia suggested by aggregate figures for the French basketball leagues, this paper showed major evolutions in many clubs’ economic models during the period 2008–2020. Combining qualitative and quantitative analyses and objective and subjective data threw light onto these changes while allowing us to guard against possible attribution biases.
The changes at certain clubs can be attributed to decisions taken by their leaders. For example, a shareholder’s capacity to invest or an executive’s ability to professionalize a club, whether to achieve or to respond to greater sporting success, can lead a club to change. Exogeneous shocks, such as the political decision to build a new arena, the opening of a closed competition to new teams, or the innate uncertainty of the sport, leading to a productivity shock, can also trigger changes in a club’s economic model.
However, many clubs have experienced potentially transformative events without managing to change. Such clubs rationalize their organizational inertia by evoking external factors that do not determine sporting or economic performance. Contrary to the beliefs expressed by these clubs, having a small arena, being based in a small city, or facing intra- and inter-sport competition are not unsurmountable obstacles in the French basketball leagues. Clubs can find ways to grow if they give themselves the necessary resources and if they professionalize.
However, while diversifying revenue sources can transform the economic model by reducing financial vulnerability [8,9], it does not necessarily affect the profitability of clubs. In fact, clubs in every cluster regularly incurred deficits, even those which managed to change. This result is a reminder that the causes of club insolvencies are complex [25] and that structural deficits are not necessarily a problem as long as they are not the consequence of a governance problem [10,11,12].
This research focuses on the period 2008–2020, a time span barely impacted by COVID-19. The global pandemic has triggered a deep economic crash that has jeopardized the revenue sources of all professional clubs, including basketball clubs. This leads us to wonder how this exogeneous shock will impact the economic model of each cluster. Will the resilience of clubs going forward be linked to their ability to change?

Author Contributions

Conceptualization, M.T., L.T. and Y.C.; methodology, M.T.; investigation, M.T., L.T. and Y.C.; resources, M.T., L.T. and Y.C.; writing—original draft preparation, M.T.; writing—review and editing, M.T. All authors have read and agreed to the published version of the manuscript.

Funding

This research received no external funding.

Informed Consent Statement

Informed consent was obtained from all subjects involved in the study.

Data Availability Statement

Data is unavailable due to privacy.

Conflicts of Interest

The authors declare no conflict of interest.

Appendix A

Pearson Correlation Matrix
Variable123456789101112131415161718192021
1 0.740.12−0.17−0.410.160.16−0.10−0.08−0.050.010.14−0.15−0.150.090.09−0.10−0.110.07−0.08−0.32
2 0.24−0.09−0.170.070.09−0.060.00−0.01−0.010.06−0.05−0.040.080.03−0.01−0.020.07−0.10−0.16
3 0.270.30−0.38−0.350.300.190.210.05−0.35−0.070.510.00−0.150.290.25−0.280.150.46
4 0.54−0.44−0.470.380.180.160.27−0.40−0.020.58−0.27−0.300.400.42−0.270.200.59
5 −0.31−0.310.300.080.090.11−0.300.180.47−0.14−0.210.300.28−0.150.080.53
6 0.82−0.36−0.38−0.24−0.200.460.04−0.810.090.25−0.33−0.330.43−0.31−0.81
7 −0.34−0.41−0.18−0.260.430.02−0.800.130.26−0.34−0.330.46−0.35−0.79
8 0.18−0.030.09−0.49−0060.33−0.14−0.210.160.15−0.210.190.34
9 0.050.04−0.250.020.41−0.03−0.050.050.03−0.100.090.41
10 −0.13−0.68−0.150.360.13−0.180.080.10−0.090.050.35
11 −0.330.040.20−0.17−0.080.170.16−0.220.180.19
12 −0.16−0.560.090.36−0.22−0.190.27−0.25−0.56
13 −0.01−0.25−0.210.02−0.03−0.010.160.02
14 −0.17−0.370.510.50−0.450.320.98
15 0.66−0.32−0.330.21−0.51−0.18
16 −0.38−0.300.25−0.49−0.37
17 0.94−0.220.030.50
18 −0.220.030.49
19 −0.88−0.45
20 0.32
21
Values in bold are significant at α = 0.05.

Appendix B

Eigenvalues and Loadings After Rotation on the Five Principal Factors
Synthetic FactorsD1D2D3D4D5F6F15
Eigenvalue5.371.901.771.371.070.760.06
Variability (%)18.0512.9016.6014.3514.655.060.40
Sum (%)18.0530.9547.5661.9076.5581.61100
Loadings
Operating income−0.080.91−0.070.01−0.14
Net income−0.020.910.020.070.02
Equity0.290.380.24−0.150.48
Arena size0.25−0.140.41−0.130.56
Past sporting successes0.09−0.330.310.010.65
Ranking t−0.760.06−0.260.29−0.24
Ranking t − 1−0.760.08−0.260.32−0.20
Match-day income0.18−0.02−0.02−0.130.74
TV rights0.82−0.01−0.120.09−0.02
% private sponsorship−0.370.02−0.050.18−0.64
Total revenues0.70−0.020.44−0.270.36
% administrative wages0.130.000.95−0.040.09
% administrative social security costs0.11−0.020.95−0.050.07
% travel costs−0.180.01−0.150.94−0.08
% other costs0.10−0.05−0.05−0.950.07

Appendix C

Intra-class variance
Variance\Class123456
% of intra-class variance100%47.65%33.25%23.35%20.99%18.12%

References

  1. Terrien, M.; Valin, G.; Jugé, R. Chalandise ou expertise(s): Le développement économique des clubs professionnels de sport indoor. Étude de cas de trois clubs du Nord. [Local potential or expertise(s): The economic development of the professional clubs of indoor sports. Case study of three northern clubs]. Mov. Sport Sci. 2021, 1, 93–103. [Google Scholar] [CrossRef]
  2. Carin, Y.; Desquennes, C.; Jaworski, L.; Andreff, W. French men’s professional basketball under the economic shock of the Covid-19. Sport Bus. Manag. Int. J. 2021, 12, 479–495. [Google Scholar] [CrossRef]
  3. Andreff, W.; Scelles, N. Le modèle économique d’un club de football professionnel en France. In Marketing du Football [Football Marketing]; Chanavat, N., Desbordes, M., Eds.; Economica: Paris, France, 2016; pp. 84–100. [Google Scholar]
  4. Dufau, B.; Terrien, M.; Carin, Y.; Andreff, W. French amateur football clubs’ finance and revenue volatility: The determinants of demand shocks. Appl. Econ. Lett. 2022, 1–5. [Google Scholar] [CrossRef]
  5. Scelles, N.; Szymanski, S.; Dermit-Richard, N. Insolvency in French soccer: The case of payment failure. J. Sport. Econ. 2018, 19, 603–624. [Google Scholar] [CrossRef]
  6. Szymanski, S. Entry into exit: Insolvency in English professional football. Scott. J. Political Econ. 2017, 64, 419–444. [Google Scholar] [CrossRef]
  7. Szymanski, S.; Weimar, D. Insolvencies in professional football: A German Sonderweg. Int. J. Sport Financ. 2019, 14, 54–68. [Google Scholar] [CrossRef]
  8. Cordery, C.J.; Sim, D.; Baskerville, R.F. Three models, one goal: Assessing financial vulnerability in New Zealand amateur sports clubs. Sport Manag. Rev. 2013, 16, 186–199. [Google Scholar] [CrossRef]
  9. Wicker, P.; Breuer, C. Understanding the importance of organizational resources to explain organizational problems: Evidence from nonprofit sport clubs in Germany. VOLUNTAS Int. J. Volunt. Nonprofit Organ. 2013, 24, 461–484. [Google Scholar] [CrossRef]
  10. Jacobsen, Å.; Kringstad, M.; Olsen, T.E. Extraordinary funding and a financially viable football industry—Friends or foes? A Norwegian Football League perspective. Sustainability 2021, 13, 2788. [Google Scholar] [CrossRef]
  11. Moulard, J.; Lang, M.; Dermit-Richard, N. Soft Budget Constraints in French Football through Public Financing of Stadiums. Sustainability 2022, 15, 135. [Google Scholar] [CrossRef]
  12. Storm, R.K.; Nielsen, K. Soft budget constraints in professional football. Eur. Sport Manag. Q. 2012, 12, 183–201. [Google Scholar] [CrossRef]
  13. Graddy, E.A.; Morgan, D.L. Community foundations, organizational strategy, and public policy. Nonprofit Volunt. Sect. Q. 2006, 35, 605–630. [Google Scholar] [CrossRef]
  14. Millesen, J.L.; Martin, E.C. Community foundation strategy: Doing good and the moderating effects of fear, tradition, and serendipity. Nonprofit Volunt. Sect. Q. 2014, 43, 832–849. [Google Scholar] [CrossRef]
  15. Bolino, M.; Long, D.; Turnley, W. W. Impression management in organizations: Critical questions, answers, and areas for future research. Annu. Rev. Organ. Psychol. Organ. Behav. 2016, 3, 377–406. [Google Scholar] [CrossRef]
  16. Andreff, W.; Staudohar, P. The evolving European model of professional sports finance. J. Sport. Econ. 2000, 1, 257–276. [Google Scholar] [CrossRef]
  17. Feuillet, A.; Terrien, M.; Scelles, N.; Durand, C. Determinants of coopetition and contingency of strategic choices: The case of professional football clubs in France. Eur. Sport Manag. Q. 2021, 21, 748–763. [Google Scholar] [CrossRef]
  18. Dermit-Richard, N.; Scelles, N.; Evrard, B. Gouvernance des clubs de football professionnels [Governance of professional football clubs]. Rev. Française Gest. 2019, 279, 53–72. [Google Scholar] [CrossRef]
  19. Terrien, M.; Dufau, B.; Carin, Y.; Andreff, W. Economic Models of French Amateur Soccer Clubs. From One Crisis to the Other: Which Transformation? J. Glob. Sport Manag. 2021, 1–21. [Google Scholar] [CrossRef]
  20. Dowling, M.; Edwards, J.; Washington, M. Understanding the concept of professionalisation in sport management research. Sport Manag. Rev. 2014, 17, 520–529. [Google Scholar] [CrossRef]
  21. Child, J. Organizational structure, environment and performance: The role of strategic choice. Sociology 1972, 6, 1–22. [Google Scholar] [CrossRef]
  22. Bayle, E. La dynamique du processus de professionnalisation des sports collectifs: Les cas du football, du basket-ball et du rugby [Dynamics of sport professionnalisation process of collective sports: The cases of football, basketball and rugby]. STAPS Sci. Tech. Act. Phys. Sport. 2000, 52, 33–60. [Google Scholar]
  23. O’Brien, D.; Slack, T. An analysis of change in an organizational field: The professionalization of English rugby union. J. Sport Manag. 2003, 17, 417–448. [Google Scholar] [CrossRef]
  24. O’Brien, D.; Slack, T. The emergence of a professional logic in English rugby union: The role of isomorphic and diffusion processes. J. Sport Manag. 2004, 18, 13–39. [Google Scholar] [CrossRef]
  25. Carin, Y.; Terrien, M. Mort subite? Trajectoires d’entrée dans la défaillance des clubs de football français [Sudden death? Trajectories of entry into the failure of French football clubs]. Rev. Sci. Gest. 2021, 307, 15–24. [Google Scholar]
  26. Terrien, M.; Scelles, N.; Morrow, S.; Maltese, L.; Durand, C. The win/profit maximization debate: Strategic adaptation as the answer? Sport Bus. Manag. Int. J. 2017, 7, 121–140. [Google Scholar] [CrossRef]
  27. Pfeffer, J.; Salancik, G.R. The External Control of Organizations: A Resource Dependence Perspective, 1st ed.; Stanford University Press: Stanford, CA, USA, 2003. [Google Scholar]
  28. Houlihan, B.; Green, M. Modernization and sport: The reform of Sport England and UK Sport. Public Adm. 2009, 87, 678–698. [Google Scholar] [CrossRef] [Green Version]
  29. Terrien, M.; Feuillet, A.; Bayle, E. A taxonomy of national sport federations based on their financial profiles: The case of France’s state-subsidized model. Manag. Sport Leis. 2021, 1–18. [Google Scholar] [CrossRef]
  30. Bayle, E.; Lang, M.; Moret, O. How professional sports clubs exploit a heterogeneous local potential: The case of Swiss professional ice hockey. Sport Soc. 2020, 23, 433–451. [Google Scholar] [CrossRef] [Green Version]
  31. Kikulis, L.M.; Slack, T.; Hinings, B. Institutionally specific design archetypes: A framework for understanding change in national sport organizations. Int. Rev. Sociol. Sport 1992, 27, 343–368. [Google Scholar] [CrossRef]
  32. Shilbury, D.; Ferkins, L. Professionalisation, sport governance and strategic capability. Manag. Leis. 2011, 16, 108–127. [Google Scholar] [CrossRef] [Green Version]
  33. Hall, M.H.; Andrukow, A.; Barr, C.; Brock, K.; de Wit, M.; Embuldeniya, D. The Capacity to Serve: A Qualitative Study of the Challenges Facing Canada’s Nonprofit and Voluntary Organizations; Canadian Centre for Philanthropy: Toronto, Canada, 2003. [Google Scholar]
  34. Cordery, C.; Sim, D.; Baskerville, R. Financial vulnerability in football clubs: Learning from resource dependency and club theories. Third Sect. Rev. 2018, 24, 49–70. [Google Scholar]
  35. Hodge, M.M.; Piccolo, R.F. Funding source, board involvement techniques, and financial vulnerability in nonprofit organizations: A test of resource dependence. Nonprofit Manag. Leadersh. 2005, 16, 171–190. [Google Scholar] [CrossRef]
  36. Lee, W.; Cunningham, G.B. Group diversity’s influence on sport teams and organizations: A meta-analytic examination and identification of key moderators. Eur. Sport Manag. Q. 2019, 19, 139–159. [Google Scholar] [CrossRef]
  37. Oliver, C. Determinants of interorganizational relationships: Integration and future directions. Acad. Manag. Rev. 1990, 15, 241–265. [Google Scholar] [CrossRef]
  38. Thiel, A.; Mayer, J. Characteristics of voluntary sports clubs management: A sociological perspective. Eur. Sport Manag. Q. 2009, 9, 81–98. [Google Scholar] [CrossRef]
  39. Denison, D.R.; Mishra, A.K. Organizational culture and organizational effectiveness: A theory and some preliminary empirical evidence. Acad. Manag. Proc. 1989, 1, 168–172. [Google Scholar] [CrossRef] [Green Version]
  40. Nagel, S.; Schlesinger, T.; Bayle, E.; Giauque, D. Professionalisation of sport federations–a multi-level framework for analysing forms, causes and consequences. Eur. Sport Manag. Q. 2015, 15, 407–433. [Google Scholar] [CrossRef]
  41. Kaiser, H.F. Coefficient alpha for a principal component and the Kaiser-Guttman rule. Psychol. Rep. 1991, 68, 855–858. [Google Scholar] [CrossRef]
  42. Kaiser, H.F. An index of factorial simplicity. Psychometrika 1974, 39, 31–36. [Google Scholar] [CrossRef]
  43. Coates, D.; Wicker, P.; Feiler, S.; Breuer, C. A bivariate probit examination of financial and volunteer problems of non-profit sport clubs. Int. J. Sport Financ. 2014, 9, 230. [Google Scholar]
  44. Horch, H.D.; Schütte, N. Pressure and obstacles to the employment of paid managers in voluntary sports clubs and federations in Germany. Eur. J. Sport Soc. 2009, 6, 101–120. [Google Scholar] [CrossRef]
  45. Scelles, N.; Desbordes, M.; Durand, C. Marketing in sport leagues: Optimising the product design. Intra-championship competitive intensity in French football Ligue 1 and basketball Pro A. Int. J. Sport Manag. Mark. 2011, 9, 13–28. [Google Scholar] [CrossRef]
  46. Scelles, N.; Helleu, B.; Durand, C.; Bonnal, L. Determinants of professional sports firm values in the United States and Europe: A comparison between sports over the period 2004–2011. Int. J. Sport Financ. 2013, 8, 280–293. [Google Scholar]
  47. Scelles, N.; Helleu, B.; Durand, C.; Bonnal, L. Professional sports firm values: Bringing new determinants to the foreground? A study of European soccer, 2005–2013. J. Sport. Econ. 2016, 17, 688–715. [Google Scholar] [CrossRef]
  48. Terrien, M.; Durand, C.; Proot, C. Marque territoriale et clubs sportifs professionnels: Menaces et opportunités des ligues ouvertes pour les collectivités [Territorial branding and professional sports clubs: Threats and opportunities of open leagues for local authorities]. Polit. Manag. Public 2022, 39, 207–229. [Google Scholar] [CrossRef]
Figure 1. Description of the clusters.
Sustainability 15 04910 g001
Table 1. Dataset and variables analyzed.
DimensionsVariableMinimumMaximumMeanStandard Deviation
Sporting and financial performanceOperating income1−3836607−32.33327.36
Net income2−3399632−16.63239.28
Equity3−16261252143.46292.52
Arena size4116078133849.601613.10
Past sporting success50959.4520.38
Ranking t613617.249.95
Ranking t − 1 1713817.4510.23
RevenueMatch-day income80.7349.3612.557.16
TV rights9014.702.491.93
% private sponsorship106.8796.1937.7312.31
% public sponsorship11027.825.976.10
% subsidies12081.1433.5115.89
% other products13024.954.194.75
Total revenues148049226.813349.011783.40
Expenditure% sport wages 1519.4162.0833.104.47
% sport social security costs 165.6320.9913.662.47
% administrative wages 17014.936.372.93
% administrative social security costs1805.332.501.17
% travel costs19092.029.7811.39
% other costs20−5560.1630.2713.48
Total costs2156710,626.693381.341859.37
1 Sports rankings range from 1 (Pro A champion) to 38 (second or third division at t − 1).
Table 2. Qualitative table.
ClubInterviewee Job FunctionTenure
(Years)
Interview Time (min)Clusters
1Chairman11511
2Chairman and majority shareholder8502
3CFO16523
4Chairman27654
5Chairman20561 → 2 → 3
6Chairman6521 → 3
7Chief executive5432 → 1
8CFO4494 → 5?
Deputy CEO7
9 (DNCGCP)Head of management control department485
Table 3. Backward induction of the PCA.
ModelsVariablesBartlett’s Test of SphericityKMO Adequacy MeasureDecision
M1AllMulticollinearity issue0.557Rejected
M2M1 except total expenditurep-value < 0.00010.518Rejected
M3M2 except % other products0.602Rejected
M4M3 except % public sponsorship0.656Rejected
M5M4 except % sport wages0.666Rejected
M6M5 except % private sponsorship0.702Rejected
M7M6 except % sport social security costs0.758Accepted
Table 4. Number of clubs in each cluster during each season.
SeasonsC1C2C3C4
2008/20098877
2009/201010687
2010/201110887
2011/201210779
2012/201312858
2013/201411858
2014/201512768
2015/201611878
2016/201713878
2017/201813967
2018/201910886
2019/202011967
Percentage33.165%23.80%20.25%22.785%
Table 5. Number of changes in terms of economic models.
ChangesC1C2C3C4
C1NA340
C23NA31
C311NA 2
C4011NA
Table 6. Number of changes in terms of economic models.
Clusters
C1C2C3C4
DimensionsExposureTurnover**********
Sporting performance*********
ProfitabilityToo much interclass heterogeneity
Professionalization**********
Other costsHigh travel cost Cost of participation in the European cups
History**********
Asterisks are used to define the level of the different dimensions in each cluster. To give an example, * for C1 on the professionalization dimension means that this cluster is not very professionalized, whereas C4 is very professionalized (****).
Disclaimer/Publisher’s Note: The statements, opinions and data contained in all publications are solely those of the individual author(s) and contributor(s) and not of MDPI and/or the editor(s). MDPI and/or the editor(s) disclaim responsibility for any injury to people or property resulting from any ideas, methods, instructions or products referred to in the content.

