
Whole Life Carbon Assessment of a Typical UK Residential Building Using Different Embodied Carbon Data Sources


 , and
, and
Abstract
:1. Introduction
2. Research Methods
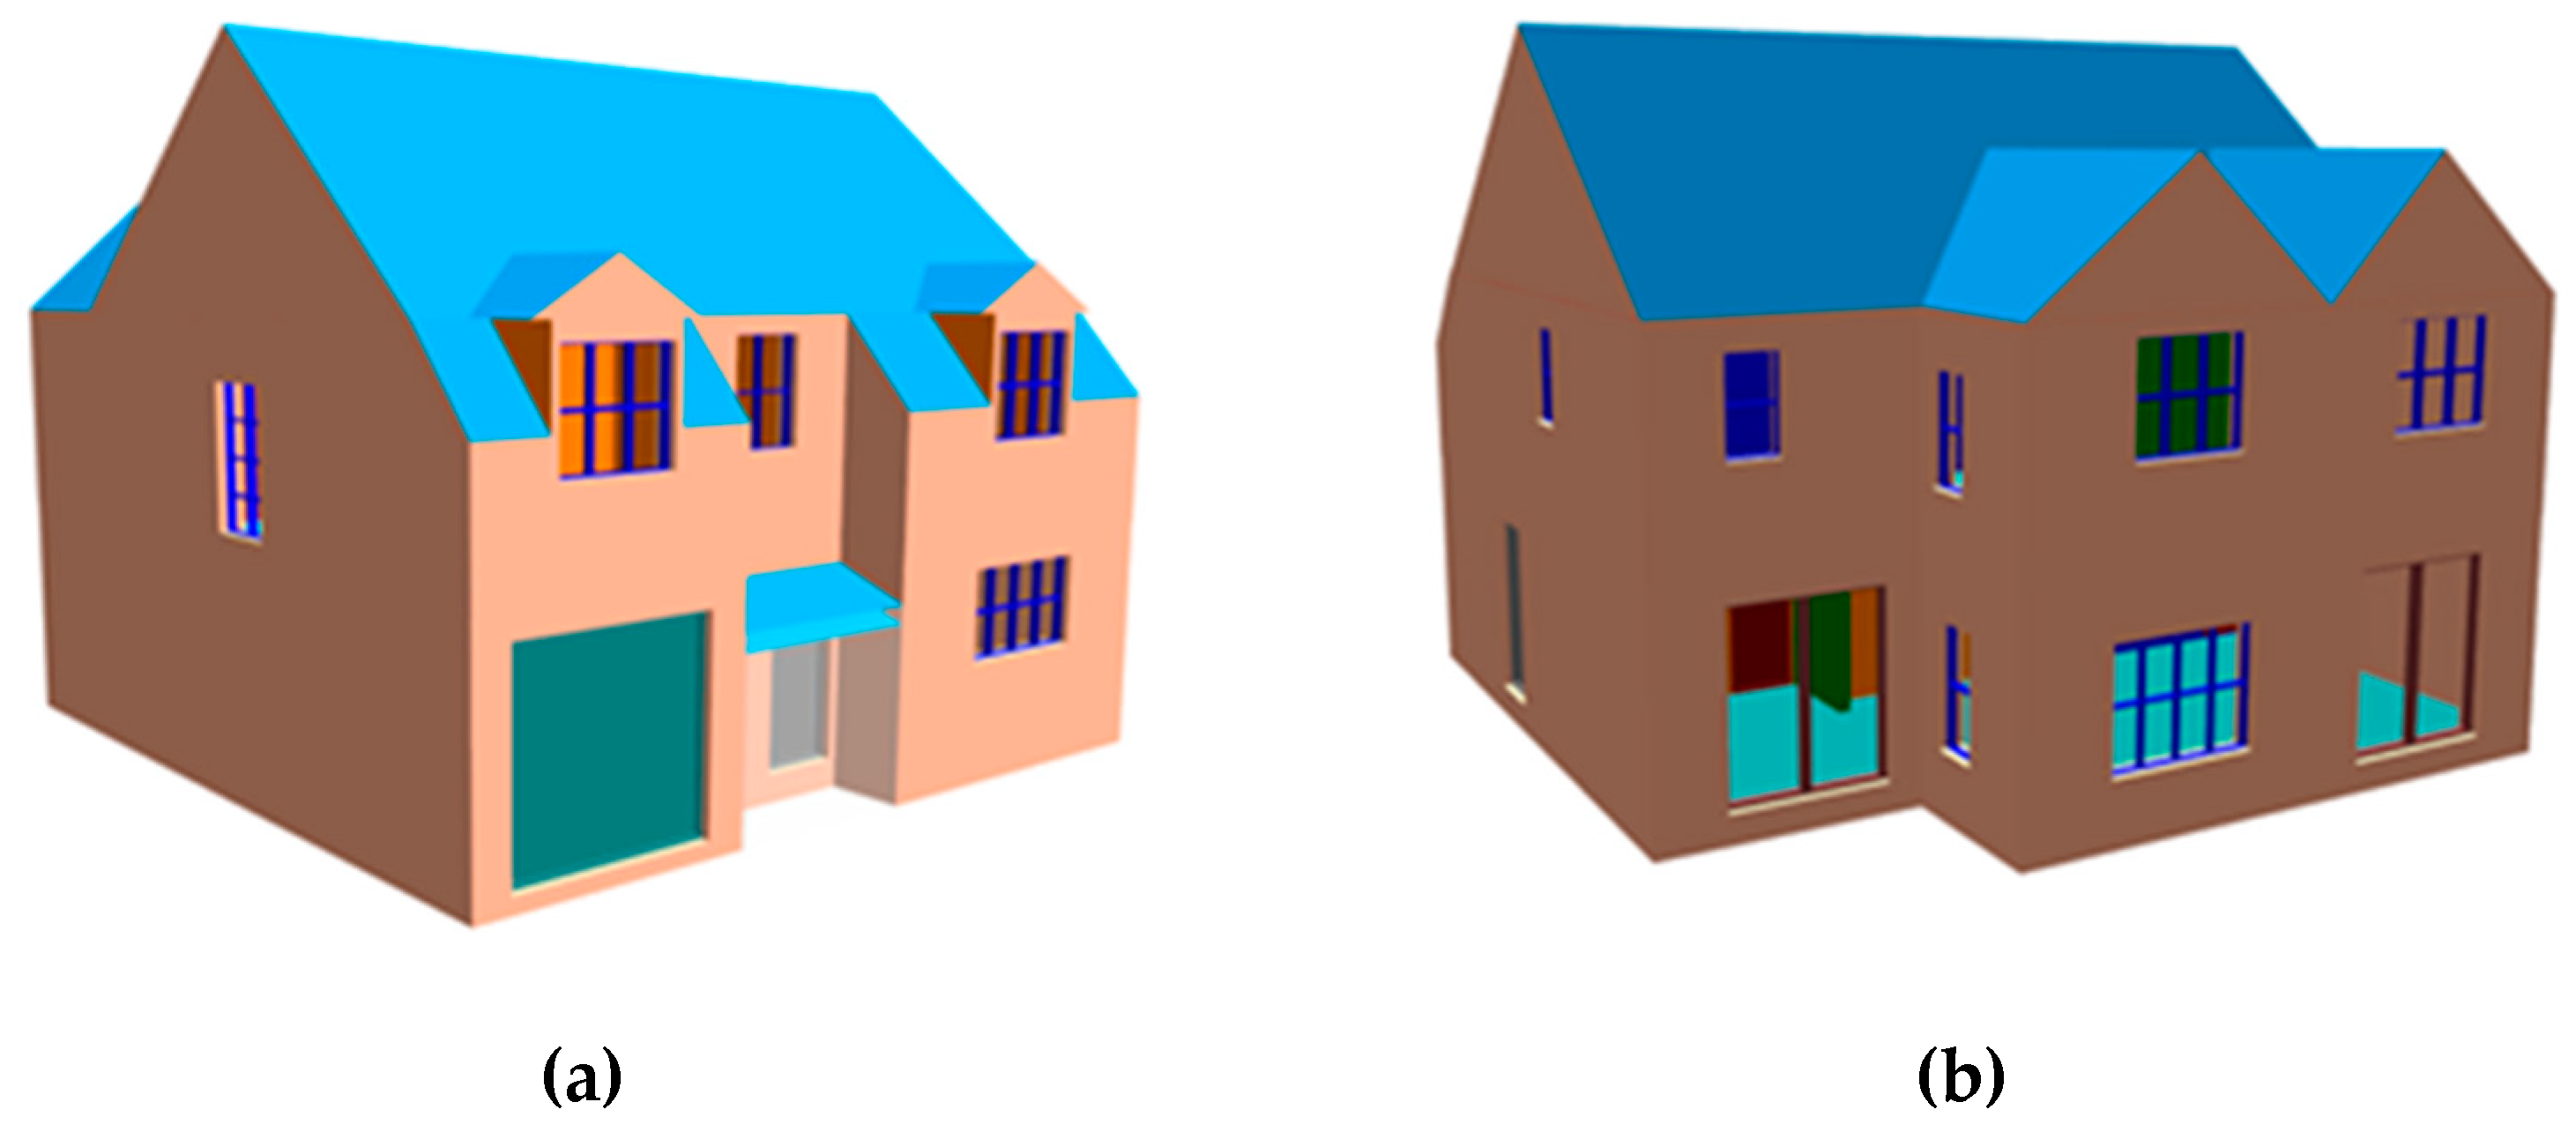
2.1. Case Introduction
2.2. System Boundary
2.3. Calculation Model
2.3.1. Life Cycle Assessment Methodology
2.3.2. Embodied Carbon Definition
- Manual calculations;
- BIM models;
- Structural analysis models;
- Scheming manuals (e.g., Structural Engineer’s Pocket Book: Eurocodes18);
- Preliminary calculations on representative/repeated structural elements;
- Previous project experience;
- A quantity surveyor’s cost plan [26].
Product Stage Embodied Carbon (A1–A3)
Demolition Stage Embodied Carbon (C1)
Waste Transport Stage Embodied Carbon (C2)
Waste Processing Stage Embodied Carbon (C3)
Waste Disposal Stage Embodied Carbon (C4)
2.3.3. Operational Carbon Definition
2.3.4. Assumptions
- In the UK, industry standards state that recycled steel and concrete should be used in the construction phase. In this research, however, it was assumed that all parts are made from virgin materials, so different methods could be well compared.
- It was assumed the entire building would be demolished at the end of its useful life, and a recycling method for all demolished materials was also considered.
- All the factors in the Inventory of Carbon and Energy database (ICE) account for cradle-to-grave emissions [26].
- In embodied carbon calculations, transport distances should be estimated based on project-specific scenarios. A default road transport distance of 50 km on average laden was assumed in this research [6].
- According to the Royal Institution of Chartered Surveyors (RICS) guideline, carbon factors for waste processing for reuse, recovery, or recycling (C3) and disposal (C4) are often grouped together in embodied carbon assessments as the two scenarios are mutually exclusive. As materials and/or components are intended to be recycled after the end of the life of the built asset, in the line with RICS guidance, C3 and C4 together was assumed 0.013 kgCO2e/kg for all materials [26].
- Due to the lack of information from the contractor, the following could be assumed about the average rate:
- A natural gas-fired boiler was defined as delivering the demanded heat to the zones using hot water radiators. Therefore, natural gas and grid-supplied electricity CO2 factors were assumed 0.21 kg/kWh and 0.1388 kg/kWh, respectively, from EDSL TAS default assumptions [30].
- No cooling was defined considering the typical weather of the building’s location.
- Lighting was provided using halogen lights.
- A 200 L hot water tank was defined by the author in DHW circuit having a 90 percent distribution efficiency.
2.4. Modelling and Simulation
2.4.1. Embodied Carbon Simulation
2.4.2. Operational Carbon Simulation
2.5. Data Collection
2.5.1. Embodied Carbon Database for Product Stage
2.5.2. Embodied Carbon Database for End-of-Life Stage
3. Results and Discussion
4. Conclusions
Author Contributions
Funding
Data Availability Statement
Conflicts of Interest
References
- Pachauri, R.K.; Meyer, L. Climate Change 2014; The Intergovernmental Panel on Climate Change: Geneva, Switzerland, 2015.
- Asensio, O.I.; Delmas, M.A. The effectiveness of US energy efficiency building labels. Nat. Energy 2017, 2, 17033. [Google Scholar] [CrossRef]
- Brian, D.; John, D.; Ksenia, P.; Peter, G. Global Status Report 2016: Towards Zero-Emission Efficient and Resilient Buildings; Global Alliance for Buildings and Construction: Paris, France, 2017. [Google Scholar]
- Li, H.X.; Zhang, L.; Mah, D.; Yu, H. An integrated simulation and optimization approach for reducing CO2 emissions from on-site construction process in cold regions. Energy Build. 2017, 138, 666–675. [Google Scholar] [CrossRef]
- Zhang, L.; Li, R. Impacts of green certification programs on energy consumption and GHG emissions in buildings: A spatial regression approach. Energy Build. 2022, 256, 111677. [Google Scholar] [CrossRef]
- Papakosta, A.; Sturgis, S. Whole life carbon assessment for the built environment. In RICS Professional Standards and Guidance; Royal Institution of Chartered Surveyors: London, UK, 2017. [Google Scholar]
- Nadoushani, Z.S.M.; Akbarnezhad, A. Effects of structural system on the life cycle carbon footprint of buildings. Energy Build. 2015, 102, 337–346. [Google Scholar] [CrossRef]
- Webster, M.; Arehart, J.; Ruthwik, C.; Aloisio, J.; Karineh, G.; Gryniuk, M.; Hogroian, J.; Jezeritz, C.; Johnson, L.; Kestner, D.; et al. Achieving Net Zero Embodied Carbon in Structural Materials by 2050; American Society of Civil Engineers: Reston, VA, USA, 2020. [Google Scholar]
- Akbarnezhad, A.; Xiao, J. Estimation and Minimization of Embodied Carbon of Buildings: A Review. Buildings 2017, 7, 5. [Google Scholar] [CrossRef]
- Adams, M.; Burrows, V.; Richardson, S. Bringing Embodied Carbon Upfront; World Green Building Council: London, UK, 2019. [Google Scholar]
- Godefroy, J. Buildings Mission 2030; Construction Leadership Council: London, UK, 2019.
- Salem, R.; Bahadori-Jahromi, A.; Mylona, A.; Godfrey, P.; Cook, D. Energy performance and cost analysis for the nZEB retrofit of a typical UK hotel. J. Build. Eng. 2020, 31, 101403. [Google Scholar] [CrossRef]
- Salem, R.; Bahadori-Jahromi, A.; Mylona, A.; Godfrey, P.; Cook, D. Nearly-zero energy buildings: Retrofitting to meet the standard. Constr. Eng. 2020. [Google Scholar] [CrossRef]
- LETI Embodied Carbon Primer. London Energy Transformation Initiative; LETI: London, UK, 2020. [Google Scholar]
- RIBA. RIBA 2030 Climate Challenge; Royal Institute of British Architects: London, UK, 2021. [Google Scholar]
- Hart, J.; Amico, B.; Pomponi, F. Whole-life embodied carbon in multistory buildings: Steel, concrete and timber structures. J. Ind. Ecol. 2021, 25, 403–418. [Google Scholar] [CrossRef]
- Zhu, W.; Feng, W.; Li, X.; Zhang, Z. Analysis of the embodied carbon dioxide in the building sector: A case of China. J. Clean. Prod. 2020, 269, 122438. [Google Scholar] [CrossRef]
- Marsh, E.; Orr, J.; Ibell, T. Quantification of uncertainty in product stage embodied carbon calculations for buildings. Energy Build. 2021, 251, 111340. [Google Scholar] [CrossRef]
- Cang, Y.; Luo, Z.; Yang, L.; Han, B. A new method for calculating the embodied carbon emissions from buildings in schematic design: Taking “building element” as basic unit. Build. Environ. 2020, 185, 107306. [Google Scholar] [CrossRef]
- Moncaster, A.M.; Symons, K.E. A method and tool for ‘cradle to grave’ embodied carbon and energy impacts of UK buildings in compliance with the new TC350 standards. Energy Build. 2013, 66, 514. [Google Scholar] [CrossRef] [Green Version]
- Hellweg, S.; Milà i Canals, L. Emerging approaches, challenges and opportunities in life cycle assessment. Science 2014, 344, 1109–1113. [Google Scholar] [CrossRef] [PubMed]
- Basbagill, J.; Flager, F.; Lepech, M.; Fischer, M. Application of life-cycle assessment to early stage building design for reduced embodied environmental impacts. Build. Environ. 2013, 60, 81–92. [Google Scholar] [CrossRef]
- Lasvaux, S.; Achim, F.; Garat, P.; Peuportier, B.; Chevalier, J.; Habert, G. Correlations in Life Cycle Impact Assessment methods (LCIA) and indicators for construction materials: What matters? Ecol. Indic. 2016, 67, 174. [Google Scholar] [CrossRef]
- Buyle, M.; Braet, J.; Audenaert, A. Life cycle assessment in the construction sector: A review. Renew. Sustain. Energy Rev. 2013, 26, 379–388. [Google Scholar] [CrossRef]
- Kumanayake, R.; Luo, H.; Paulusz, N. Assessment of material related embodied carbon of an office building in Sri Lanka. Energy Build. 2018, 166, 250–257. [Google Scholar] [CrossRef]
- Gibbons, O.P.; Orr, J.J.; Archer-Jones, C.; Arnold, W.; Green, D. How to Calculate Embodied Carbon, 2nd ed.; The Institution of Structural Engineers: London, UK, 2022. [Google Scholar]
- Mohebbi, G.; Bahadori-Jahromi, A.; Ferri, M.; Mylona, A. The Role of Embodied Carbon Databases in the Accuracy of Life Cycle Assessment (LCA) Calculations for the Embodied Carbon of Buildings. Sustainability 2021, 13, 7988. [Google Scholar] [CrossRef]
- Ortiz, O.; Castells, F.; Sonnemann, G. Sustainability in the construction industry: A review of recent developments based on LCA. Constr. Build. Mater. 2009, 23, 28–39. [Google Scholar] [CrossRef]
- ISO 14044; Environmental Management—Life Cycle Assessment—Requirements and Guidelines. International Organization for Standardization: Geneva, Switzerland, 2006.
- EDSL TAS. 2023. Available online: http://www.edsl.net/ (accessed on 19 January 2023).
- CIBSE. CIBSE Weather Data Sets. Available online: http://www.cibse.org/knowledge/cibse-weather-data-sets (accessed on 19 January 2023).
- Thistlethwaite, G.; Karagianni, E.; Collins, A.; MacCarthy, J.; Thomas, H.; Mullen, P.; Kelsall, A.; Bramwell, R.; Wong, J.; Quinn, P.; et al. 2022 Government Greenhouse Gas Conversion Factors for Company Reporting. Department for Business; Enenrgy & Industrial Strategy: London, UK, 2022.
- Committee on Climate Change (CCC, 2016). The Fifth Carbon Budget. Available online: https://www.theccc.org.uk/wpcontent/uploads/2016/07/5CB-Infographic-FINAL-.pdf (accessed on 19 January 2023).


| Building Element | Structural Element and Component |
|---|---|
| Substructure | Strip Foundation |
| Superstructure | Structural framing: T-Beam Concrete, Universal Beam, I joist Floor: Floor block, Concrete Screed, Rock Wool, Polyurethane, Chipboard, Plasterboard, Timber stairs Roof: Metal Roof Panel, Softwood, Polyurethane |
| External Envelope | External Walls: Brick, Rock Wool, Aerated Concrete Block, Plasterboard |
| Interiors | Internal Walls: Aerated Concrete Block, Plasterboard, Koolthermal Kingspan |
| Site Waste Disposal Scenarios | ||
|---|---|---|
| Disposal to landfill/incineration | Reuse or recycling on-site | Reuse or recycling off-site |
| (A1–A3) +(A4) + (C2) + (C4) | (A1–A3) +(A4) + (C3) | (A1–A3) +(A4) + (C2) + (C3) |
| Building Element | Structural Element | Component | Volume (m3) | Weight (kg) |
|---|---|---|---|---|
| Substructure | Strip Foundation | Concrete | 28.28 | 70,417 |
| Superstructure | Structural Framing | T-Beam Concrete | 1.91 | 5075 |
| Universal Beam | 0.05 | 393 | ||
| I joist | 0.61 | 367 | ||
| Floor | Floor block | 10.73 | 24,677 | |
| Concrete Screed | 4.9 | 11,704 | ||
| Rock Wool | 14.34 | 645 | ||
| Polyurethane | 7.81 | 250 | ||
| Chipboard | 4.35 | 3482 | ||
| Plasterboard | 4.116 | 1525 | ||
| Timber Stairs | 0.12 | 70 | ||
| Roof | Metal Roof Panel | 5.4 | 14,588 | |
| Softwood | 8.71 | 5097 | ||
| Polyurethane | 18.96 | 607 | ||
| Window | Glass | 0.31 | 769 | |
| PVC | 0.54 | 810 | ||
| External Envelope | External Walls | Brick Rock Wool Aerated concrete Plasterboard | 15.43 15.11 17.49 2.161 | 30,094 680 10,491 2423 |
| Interiors | Internal Walls | Aerated concrete Plasterboard Koolthermal Kingspan | 12.19 2.853 0.43 | 7312 3190 15 |
| Material | ECF ICE Database (kgCO2e/kg) | Source | ECF BEIS Database (kgCO2e/kg) | Source |
|---|---|---|---|---|
| Chipboard | 0.4 | ICE-Timber, Chipboard | 0.312 | Wood |
| Concrete Block | 0.0931 | ICE-concrete block | 0.131 | Concrete |
| Concrete Screed | 0.163 | ICE-Mortar 1:4 | 0.131 | Concrete |
| Rock Wool | 1.12 | ICE-Rockwool | 1.861 | Insulation |
| Plasterboard | 0.39 | ICE-Plasterboard | 0.120 | Plasterboard |
| Polyurethane | 4.26 | ICE-Polyurethane | 1.861 | Insulation |
| Metal Roof Panel | 3.06 | ICE-Steel, organic coated sheet | 4.018 | Metals |
| Precast Concrete | 0.1591 | ICE-concreteRC40/50 | 0.131 | Concrete |
| T-Beam Concrete | 0.1939 | ICE-Precast concrete beam and column | 0.131 | Concrete |
| Universal Beam | 1.55 | ICE-steel, section | 4.018 | Metals |
| I Joist | 0.4833 | ICE-timber, wood I-Beam | 0.312 | Wood |
| Softwood | 0.26 | ICE-timber, softwood | 0.312 | Wood |
| Brick | 0.21 | ICE-General common brick | 0.241 | Brick |
| Aerated concrete block | 1.59 | ICE-AAC concrete block | 0.131 | Concrete |
| Koolthermal Kingspan | 1.86 | ICE-General Insulation | 1.861 | Insulation |
| Glass | 1.6256 | ICE-Double glazed unit | 1.402 | Glass |
| PVC | 3.1 | ICE-General PVC | 3.413 | Plastics:PVC |
| Material | Weight (kg) | ICE Database (kgCO2e) | Enhanced Value (kgCO2e) |
|---|---|---|---|
| Chipboard | 3481.60 | 1392.639 | 1392.639 |
| Concrete Block | 24,676.84 | 2297.413 | 2297.413 |
| Concrete Screed | 11,704.12 | 2713.478 | 2713.478 |
| Rock Wool | 1325.34 | 1484.381 | 990 |
| Plasterboard | 7137.54 | 2783.639 | 1722.8 |
| Polyurethane | 856.67 | 3649.407 | 3649.407 |
| Metal Roof Panel | 14,588.18 | 44,639.826 | 39,645.16 |
| Precast Concrete | 70,417.20 | 15,863.383 | 12,641.16 |
| T-Beam Concrete | 5074.50 | 1160.72 | 1014.96 |
| Universal Beam | 392.64 | 608.594 | 608.594 |
| I Joist | 366.80 | 177.275 | 146.72 |
| Softwood | 5167.31 | 1343.499 | 671.31 |
| Brick | 30,093.78 | 6319.694 | 4346.176 |
| Aerated concrete block | 17,803.2 | 4987.83 | 4984.9 |
| Koolthermal Kingspan | 14.95 | 27.798 | 27.72 |
| Glass | 768.80 | 1249.761 | 1249.761 |
| PVC | 810.00 | 2511 | 2511 |
| Material | CO2 Emissions Enhanced Database (kgCO2e) | CO2 Emissions BEIS Database (kgCO2e) |
|---|---|---|
| Chipboard | 1392.639 | 1088.382 |
| Concrete Block | 2297.413 | 3251.173 |
| Concrete Screed | 2713.478 | 3255.85 |
| Rock Wool | 990 | 2467.452 |
| Plasterboard | 1723 | 856.861 |
| Polyurethane | 3649.407 | 1594.902 |
| Metal Roof Panel | 39,645.16 | 58,615.3 |
| Precast Concrete | 12,641.16 | 19,168.75 |
| T-Beam Concrete | 1012.961 | 1154.73 |
| Universal Beam | 608.594 | 1577.634 |
| I Joist | 146.72 | 114.666 |
| Softwood | 671.31 | 1615.351 |
| Brick | 4346.175 | 7275.172 |
| Aerated concrete block | 4984.9 | 2345.571 |
| Koolthermal Kingspan-Insulation | 27.72 | 27.824 |
| Glass | 1249.761 | 1078.45 |
| PVC | 2511 | 2764.595 |
| Material | RICS (C1–C4) (kgCO2e) | LETI (kgCO2e) |
|---|---|---|
| Chipboard | 72.797 | 66.316 |
| Concrete Block | 515.972 | 109.401 |
| Concrete Screed | 235.502 | 129.213 |
| Rock Wool | 27.712 | 47.143 |
| Plasterboard | 149.240 | 82.048 |
| Polyurethane | 17.912 | 173.781 |
| Metal Roof Panel | 305.027 | 1887.865 |
| Precast Concrete | 1419.147 | 601.960 |
| T-Beam Concrete | 95.701 | 48.236 |
| Universal Beam | 8.210 | 22.381 |
| I Joist | 7.670 | 6.987 |
| Softwood | 108.044 | 31.967 |
| Brick | 629.236 | 206.961 |
| Aerated concrete block | 372.250 | 237.376 |
| Koolthermal Kingspan | 1.422 | 1.320 |
| Glass | 16.075 | 59.512 |
| PVC | 16.936 | 119.571 |
| Material | A1–A5 (kgCO2e) | C1–C4 (kgCO2e) | Total (kgCO2e) |
|---|---|---|---|
| Timber | 2607.85 | 188.51 | 2796.36 |
| Concrete | 28,767.09 | 2266.32 | 31,033.41 |
| Insulation | 5213.66 | 47.04 | 5260.70 |
| Plasterboard | 2863.38 | 149.24 | 3012.62 |
| Metal | 40,253.36 | 313.233 | 40,566.59 |
| Brick | 8191 | 1001.49 | 9192.49 |
| Glass | 1320.59 | 16.07 | 1336.66 |
| PVC | 2648.48 | 16.94 | 2665.42 |
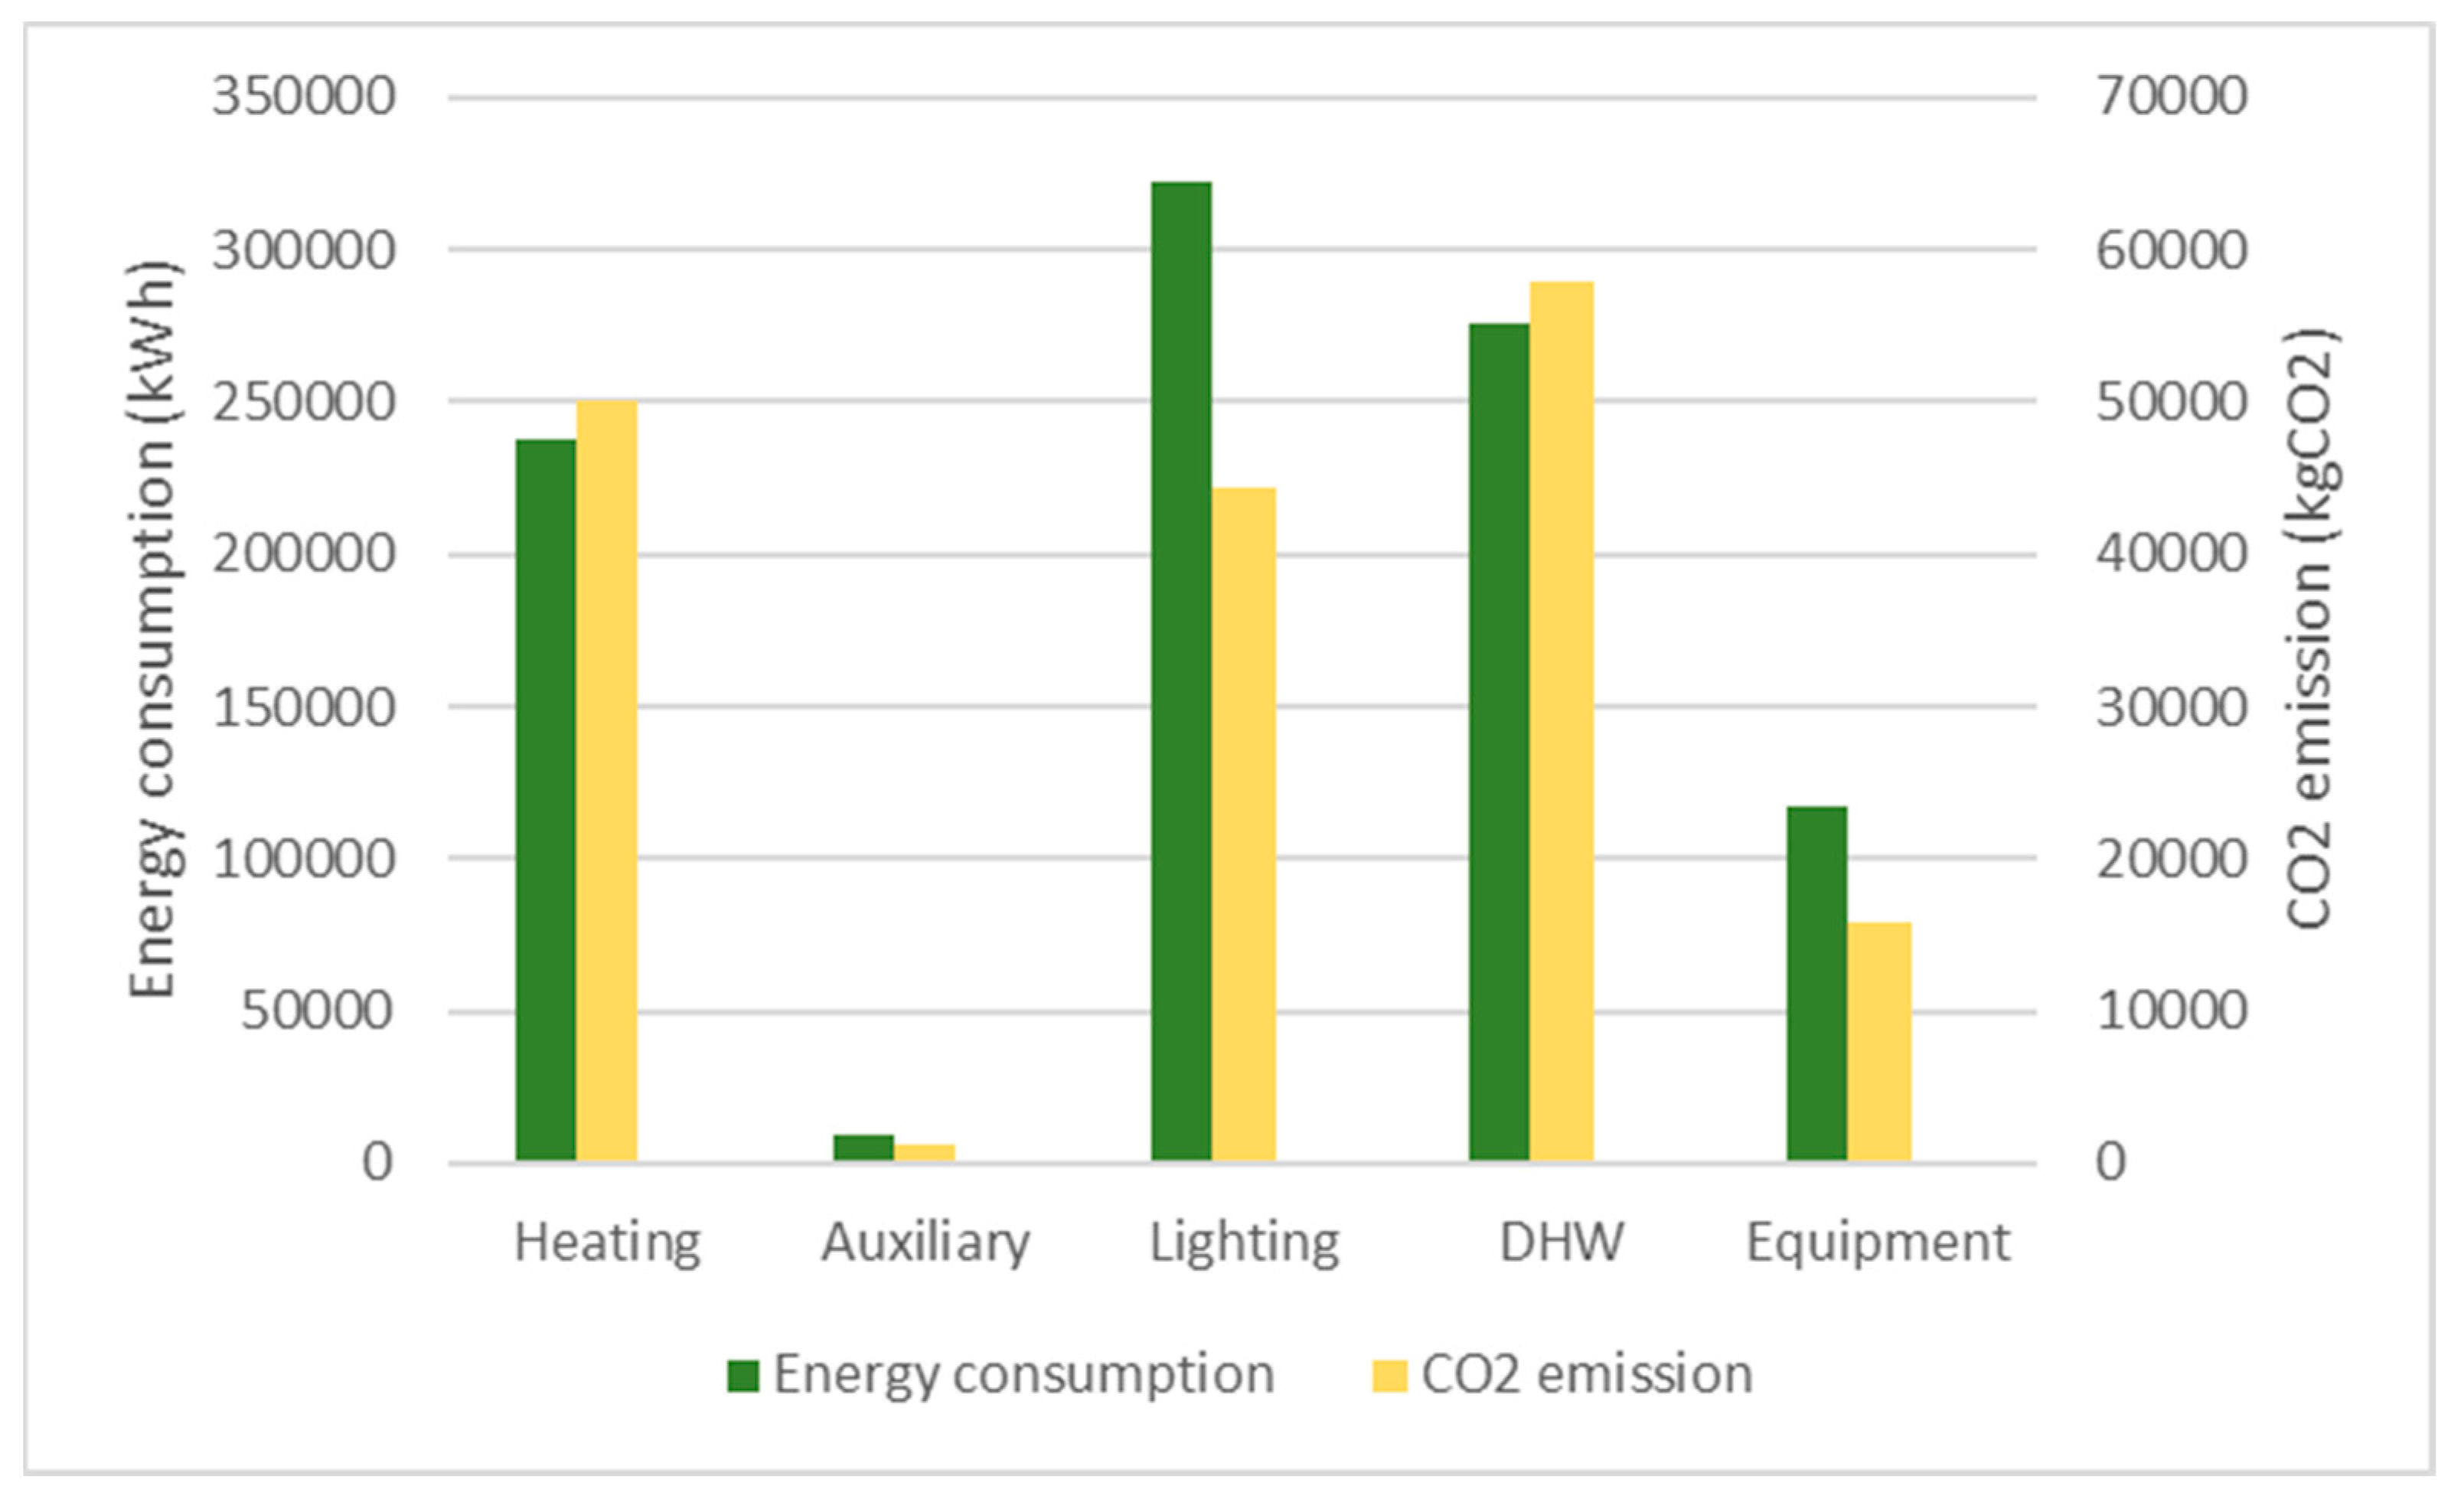
| Heating | Auxiliary | Lighting | DHW | Equipment | Displaced Electricity | Total | ||||
|---|---|---|---|---|---|---|---|---|---|---|
| Baseline | Energy consumption (kWh/m2) | 32.66 | 1.23 | 44.18 | 37.8 | 16.1 | 0 | 131.88 | ||
| model | CO2 emission (kgCO2/m2) | 6.86 | 0.17 | 6.09 | 7.93 | 2.17 | 0 | 23.22 | ||
| Group A | Group B | Group A | Group B | |||||||
| Retrofitted model | Energy consumption (kWh/m2) | 48.63 | 1.23 | 6.63 | 37.8 | 16.1 | −14.8 | −17.69 | 95.48 | 92.61 |
| with LED lights and PV panels | CO2 emission (kgCO2/m2) | 10.21 | 0.17 | 0.91 | 7.93 | 2.17 | −1.88 | −2.29 | 19.51 | 19.22 |
| Material | A1–A5 (kgCO2e) | C1–C4 (kgCO2e) | Total (kgCO2e) | Source of Data |
|---|---|---|---|---|
| LED Lighting | 972.18 | 45.06 | 1017.24 | EPD |
| photovoltaic (PV) panels | 3355.7 | 7.9 | 3363.6 | One Click LCA |
Disclaimer/Publisher’s Note: The statements, opinions and data contained in all publications are solely those of the individual author(s) and contributor(s) and not of MDPI and/or the editor(s). MDPI and/or the editor(s) disclaim responsibility for any injury to people or property resulting from any ideas, methods, instructions or products referred to in the content. |
© 2023 by the authors. Licensee MDPI, Basel, Switzerland. This article is an open access article distributed under the terms and conditions of the Creative Commons Attribution (CC BY) license (https://creativecommons.org/licenses/by/4.0/).
Share and Cite
Keyhani, M.; Abbaspour, A.; Bahadori-Jahromi, A.; Mylona, A.; Janbey, A.; Godfrey, P.; Zhang, H. Whole Life Carbon Assessment of a Typical UK Residential Building Using Different Embodied Carbon Data Sources. Sustainability 2023, 15, 5115. https://0-doi-org.brum.beds.ac.uk/10.3390/su15065115
Keyhani M, Abbaspour A, Bahadori-Jahromi A, Mylona A, Janbey A, Godfrey P, Zhang H. Whole Life Carbon Assessment of a Typical UK Residential Building Using Different Embodied Carbon Data Sources. Sustainability. 2023; 15(6):5115. https://0-doi-org.brum.beds.ac.uk/10.3390/su15065115
Chicago/Turabian StyleKeyhani, Maryam, Atefeh Abbaspour, Ali Bahadori-Jahromi, Anastasia Mylona, Alan Janbey, Paulina Godfrey, and Hexin Zhang. 2023. "Whole Life Carbon Assessment of a Typical UK Residential Building Using Different Embodied Carbon Data Sources" Sustainability 15, no. 6: 5115. https://0-doi-org.brum.beds.ac.uk/10.3390/su15065115