Article

CFD Investigation and Optimization on the Aerodynamic Performance of a Savonius Vertical Axis Wind Turbine and Its Installation in a Hybrid Power Supply System: A Case Study in Iran

by
Shayan Farajyar
1,
Farzad Ghafoorian
2,
Mehdi Mehrpooya
3,* and
Mohammadreza Asadbeigi
2
1
Science and Research Branch, Department of Civil Engineering, Architecture and Art, Islamic Azad University, Tehran 17776-13651, Iran
2
Turbomachinery Research Laboratory, Department of Energy Conversion, School of Mechanical Engineering, Iran University of Science and Technology, Tehran 13114-16846, Iran
3
Department of Renewable Energies and Environment, Faculty of New Sciences and Technologies, University of Tehran, Tehran 14399-56191, Iran
*
Author to whom correspondence should be addressed.
Sustainability 2023, 15(6), 5318; https://0-doi-org.brum.beds.ac.uk/10.3390/su15065318
Submission received: 6 February 2023 / Revised: 9 March 2023 / Accepted: 15 March 2023 / Published: 16 March 2023
(This article belongs to the Special Issue Sustainable Integration of Renewable Power Generation Systems)

Abstract

:
In this study, a 3D-CFD simulation on the effect of various design and operating parameters, namely the number of blades, overlap ratio, spacing size, arc angle, shape factor, presence of curtain, wind velocity, and multi-bucket rotor, on the aerodynamic performance of a Savonius vertical axis wind turbine (VAWT) is conducted. In order to evaluate the effect of each parameter, the rotor’s power coefficient (Cp) for different tip speed ratio (TSR) values and overall torque as a function of the azimuth angle are investigated. The results show that the generated power of a solid rotor with more buckets is less than that of the two-bladed rotor, and by decreasing the overlap ratio and spacing size, Cp values are enhanced. Moreover, a rotor with a larger bucket arc angle has less Cp value and total torque, in addition to shape factor, which changes the configuration of the rotor by adding arms, thus enhancing the aerodynamic performance of the prototype. Furthermore, it is shown that installing a curtain in the upstream section of the rotor improves Cp value by directing airflow. Moreover, it is observed that by increasing inlet wind velocity and, subsequently, the Reynolds number, generated power is boosted. In addition, it is noted that a suitable multi-bucket rotor configuration can boost generated power. Finally, the optimum design is achieved by using the Kriging method. Based on the optimization results, a 2-bladed Savonius VAWT with an overlap ratio of 0, spacing size of 0 (m), arc angle of 170°, shape factor of 0.5, and inlet wind velocity of 12 (m/s) at TSR = 0.37 introduces the highest efficiency.

1. Introduction

More than half of electric power resources are extracted from heavy carbon fuels, and only close to 5 percent is provided by carbon-free approaches [1]. Disturbing of ecological balances and irreparable damage of the earth from fossil fuels have triggered scientists from the world over to use a wide range of renewable energy sources to offset carbon emissions [2]. Due to this universal impulse, wind, solar, hydropower, geothermal, and biomass energy have been the most productive and eco-friendly methods. According to the statistical data, since 2011, wind turbine usage has doubled every three years [3]. Generally, wind turbines’ operating manner is divided into VAWT and HAWT, which determines the axis that blades rotate around [4]. When blade surfaces face wind flow, the aerodynamic lift is the driving force for HAWT; therefore, it causes rotation around the horizontal axis [5]. Conversely, VAWT applies drag or lift, or a mixture of both, to function, and wind flow rotates blades around a vertical axis. Although VAWT is less remarked upon in research, it has various advantages compared with HAWTs. In contrast to HAWTs, which must constantly be in contact with a certain direction of the wind stream to rotate, VAWTs are omnidirectional and thus can produce energy even if it receives wind from a different direction. It is worth mentioning that VAWT can show higher efficiency in slower and more turbulent conditions such as urban areas and is much quieter than HAWTs [6]. Taking into account the difficulties of installing HAWTs, it should be noted the configuration of VAWTs provide easier access to locate the gearbox and generator on land and, relatively, it can ease the hardship of assembling and fixing of turbines [7]. The most famous type of VAWTs being mass-produced in the industry are tro-poskein Darrieus, H- Darrieus, Savonius, and helical Gorlov turbines [8]. George Darrieus invented the Darrieus turbine as the first lift-based turbine in France in 1925. However, the US took Darrieus’ patent in 1931 [9]. At first, because of its geometry, the Darrieus turbine collection included egg-beater-style blades known as tro-poskein and φ-configuration Darrieus. Darrieus’ patent also includes straight-style blades known as H-rotor turbines [9]. Furthermore, an egg-beater shape of Darrieus named 17-m Sandia is one of the enormous turbines in Canada. Due to Sandia’s geometry, a wide variety of research has been conducted to reach the best efficiency [10]. Among all types of VAWTs, the helical rotors, which are classified as a lift-based turbine alongside Darrieus, held the attention of investigators based on its improved features, such as less vibration and higher generated power compared to straight-shaped blades [11]. In the same vein, Alexander Gorlov converted a tidal low-head helical turbine used in shallow channels to a VAWT and carved a niche by result [12]. However, because all lift-based turbines need initial torque to begin functioning, they are disadvantaged compared to Savonius VAWTs, rotating with drag force [13]. This type of rotor, made by S.J. Savonius in 1920, is made of two or more half-cylinders attached to a vertical shaft. Although this turbine does not need initial torque to start working, it has lower output power than other VAWT configurations [14]. Thus, one of the ways to use this turbine is to combine it with Darrieus or Gorlov rotors. The outcomes of past studies have illustrated that with this approach, not only was the initial torque of the turbine improved, however, in some cases, it also increased the efficiency [15]. Moreover, Savonius turbines are installed in appropriate spaces between highways and produce electrical energy from the free wind flow stream and the drag force caused by passing vehicles [16]. It is noteworthy that the efficiency of the initial model was between 31% and 37%; however, applying geometric changes, aerodynamic optimization, and providing a more favorable arrangement of blades and more suitable operating conditions increases the efficiency of this type of turbine remarkably [17]. One of the most substantial factors directly impacting Savonius turbine is aspect ratio, which is a relation between rotor height and rotor diameter [18]. An experimental evaluation of different aspect ratio values in a range of 0.6–1 was investigated by Kamoji et al. [19] and eventually, this found that the best power revenue was obtained by an aspect ratio of 0.7. However, other investigations posit that as the aspect ratio increases, power coefficient also increases [
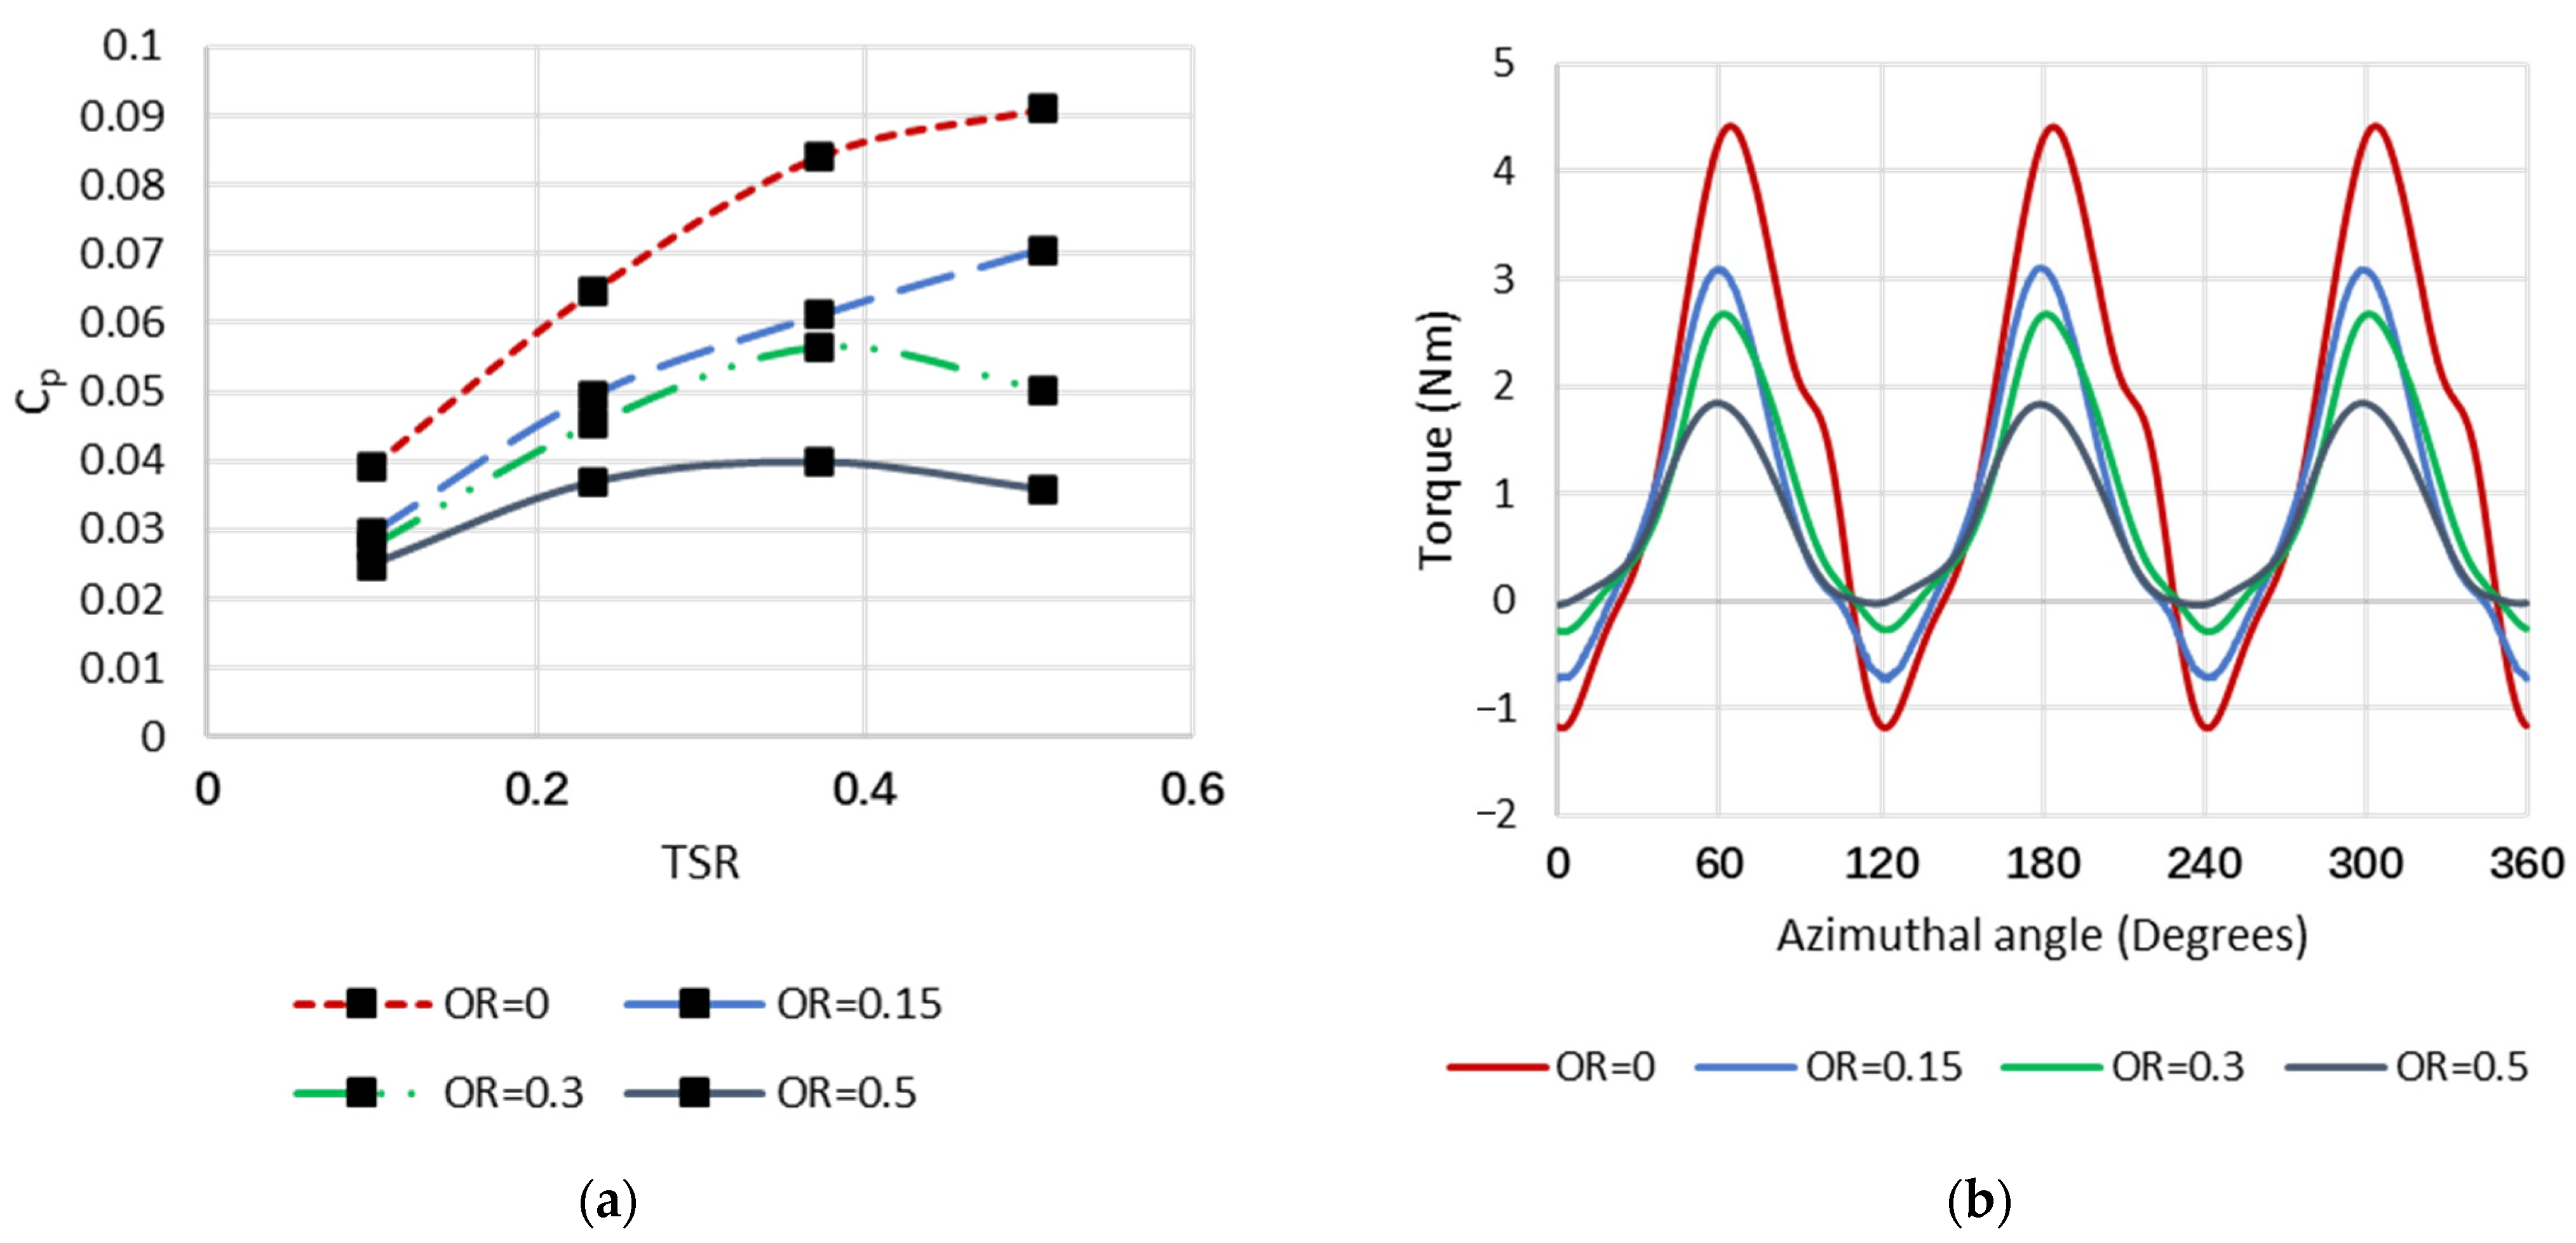
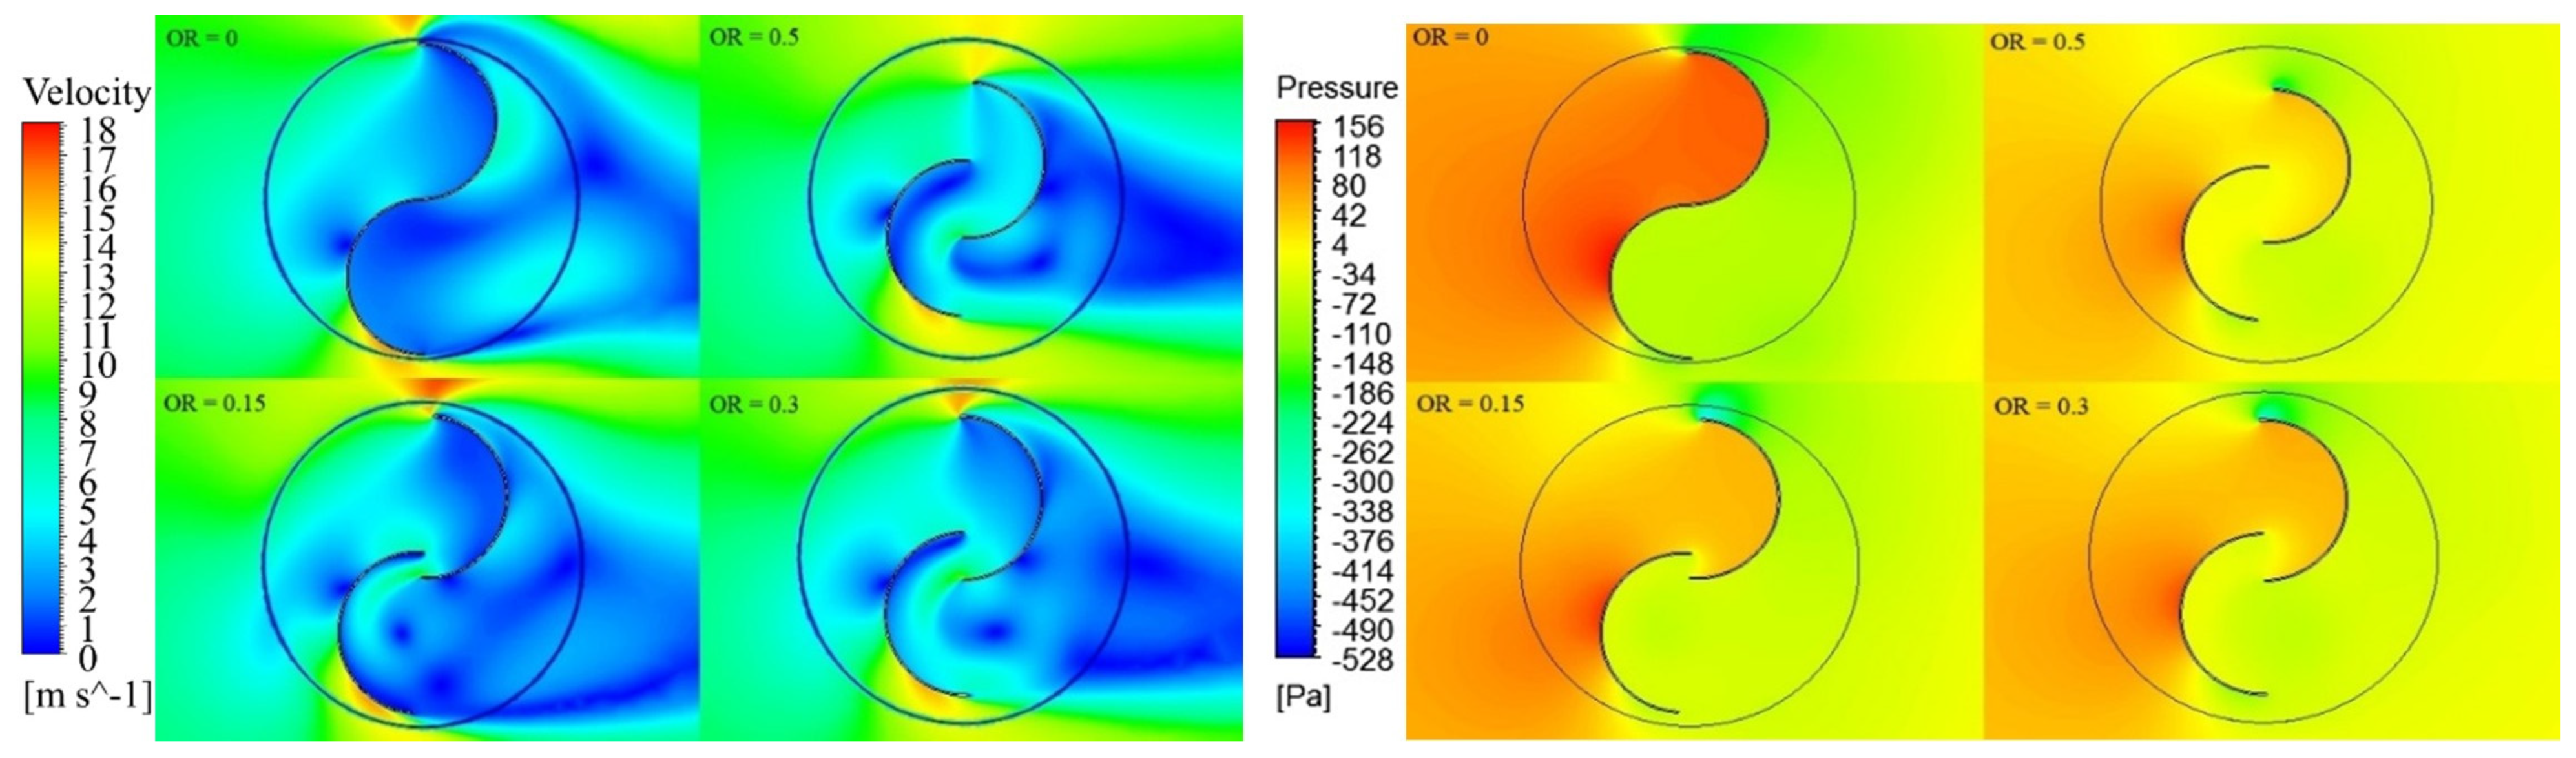
20]. The other effective parameter for the efficiency of Savonius turbines is overlap ratio, which is defined as a relevance between the overlap of buckets and diameter of each bucket [21]. Menet et al.’s [22] inspection of the overlap ratio influence on power coefficient illustrated that at the overlap ratio between 0.2 and 0.25, the maximum efficiency is obtained. Additionally, in another study on a 2-bladed Savonius, a comparison between inward and outward overlap ratios was conducted, and the outcome proved that the inward overlap ratio of 0.2 was much more efficient [23]. The other influential factor on the power coefficient of Savonius VAWTs is the number of blades. It is worth mentioning that a change in this factor will affect turbine solidity. In an experimental study on a Savonius VAWT, a range of two, three, and four blades were evaluated. The results proved that adding each blade raises the power coefficient of the turbine [24]. Another geometrical element able to impact theextracted power of Savonius VAWTs is arc or camber angle, which is the angle made by the left and right bottom of the bucket relevant to the center of the blade. Generally, a camber angle of 180° is used for Savonius VAWTs [25]. An investigation on arc angle revealed that the most and least positive influences of arc angles are 170° and 200°, respectively [26]. A more complicated geometry which contains a twisted blade and conical shaft rather than a typical Savonius VAWT was examined by Tahani et al. [27] and numerical results proved that a twisted blade with a conical shaft enhanced the power coefficient of the Savonius VAWT compared to normal prototypes. Moreover, twisted blades alone had higher Cp values. Furthermore, Jeon et al. [
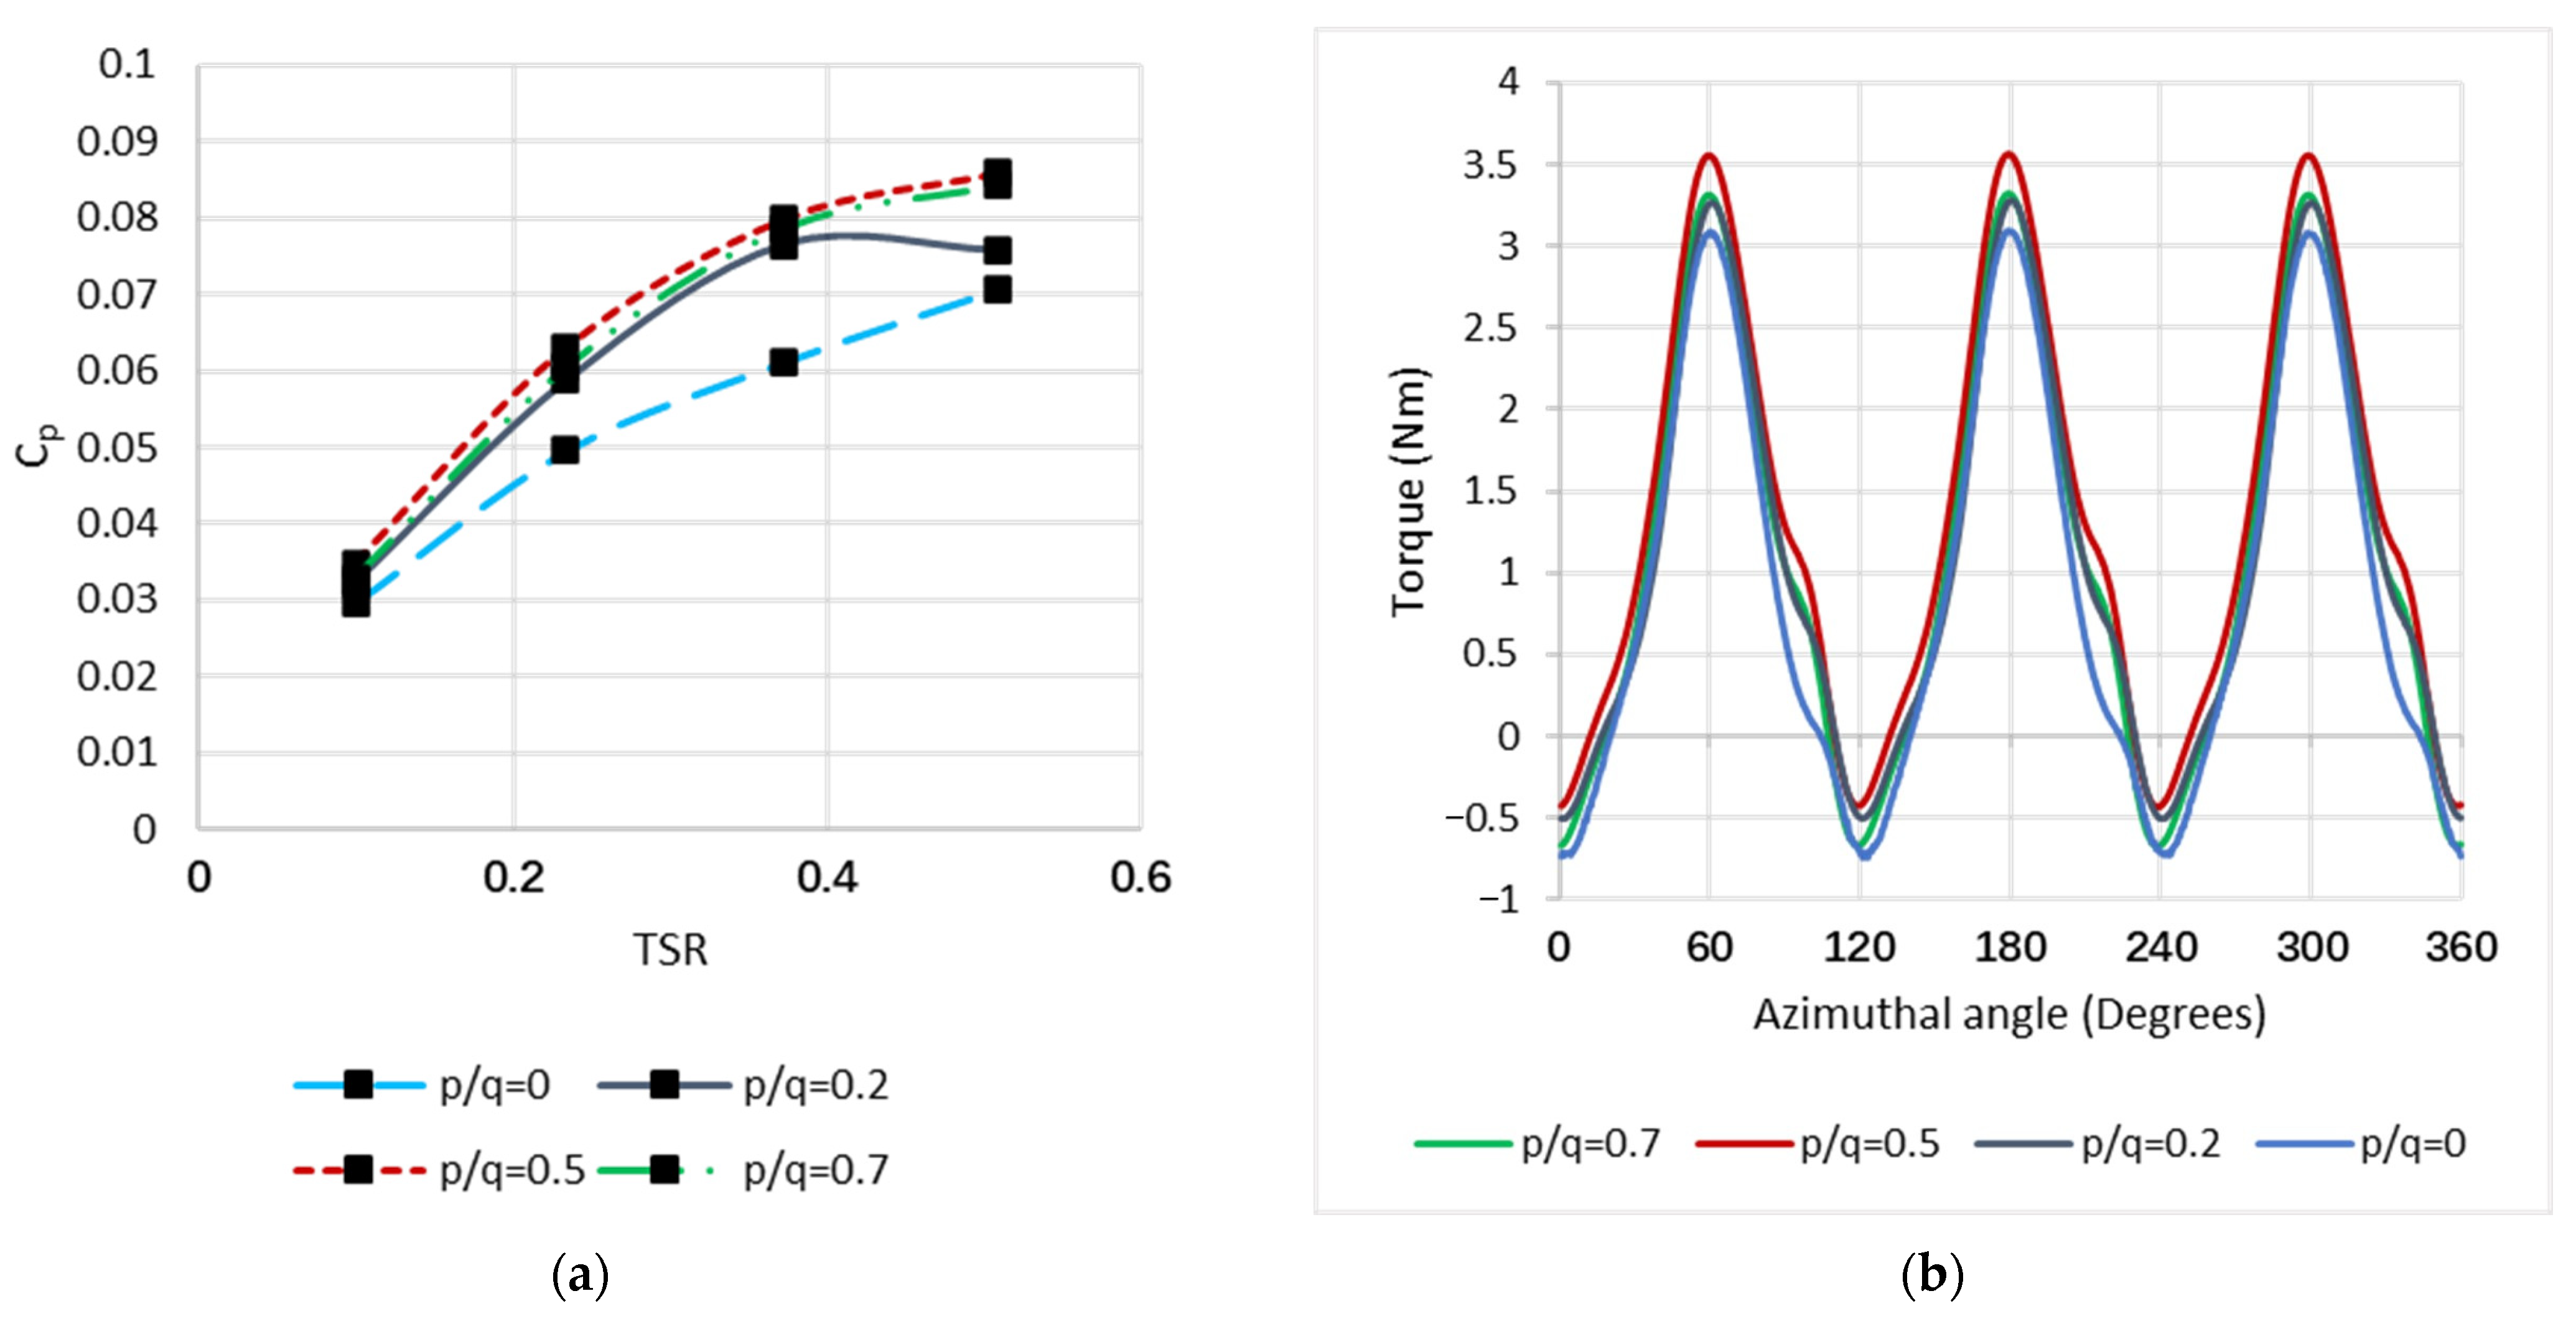
28] examined the impact of end plates with four different areas on 3D-Savonius VAWT, and this demonstrated that more extensive covered surface results in a higher power coefficient. Another geometric element which significantly affects the performance of Savonius VAWT is the shape factor [29]. The results of numerical and experimental studies have shown that the efficiency of the turbine changes with different shape factor values and the optimum case was related to a shape factor of 0.5 [30]. Furthermore, by placing the curtain in the suitable dimensions and angle in the upstream section of the rotor and directing the air flow toward the buckets, the efficiency of the turbine is increased [31]. Beside the geometrical parameters, operating conditions such as free wind velocity affect wind turbine performance significantly. Thus, by growing free wind velocity and subsequently the Reynolds number, Cp values increase [32]. The working fluid of wind turbines should be assumed to be Newtonian fluid, in which, unlike non-Newtonian fluids, changes in fluid speed do not change viscosity [33,34]. Another point to be considered for the analysis of wind turbines is the selection of a suitable approach for simulation. Experimental methods have acceptable accuracy; however, due to the high cost, different numerical methods have been developed [35]. The MST method is considered to be an accurate numerical method which is based on potential solutions, and this approach was conducted on a 17-m Sandia VAWT in order to evaluate Cp and performance prediction [36]. However, the DMST solution, which is as same as the MST method in mathematical methodology and benefits from experimental data, shows more accurate results than other potential solutions and was conducted on a Gorlov VAWT [
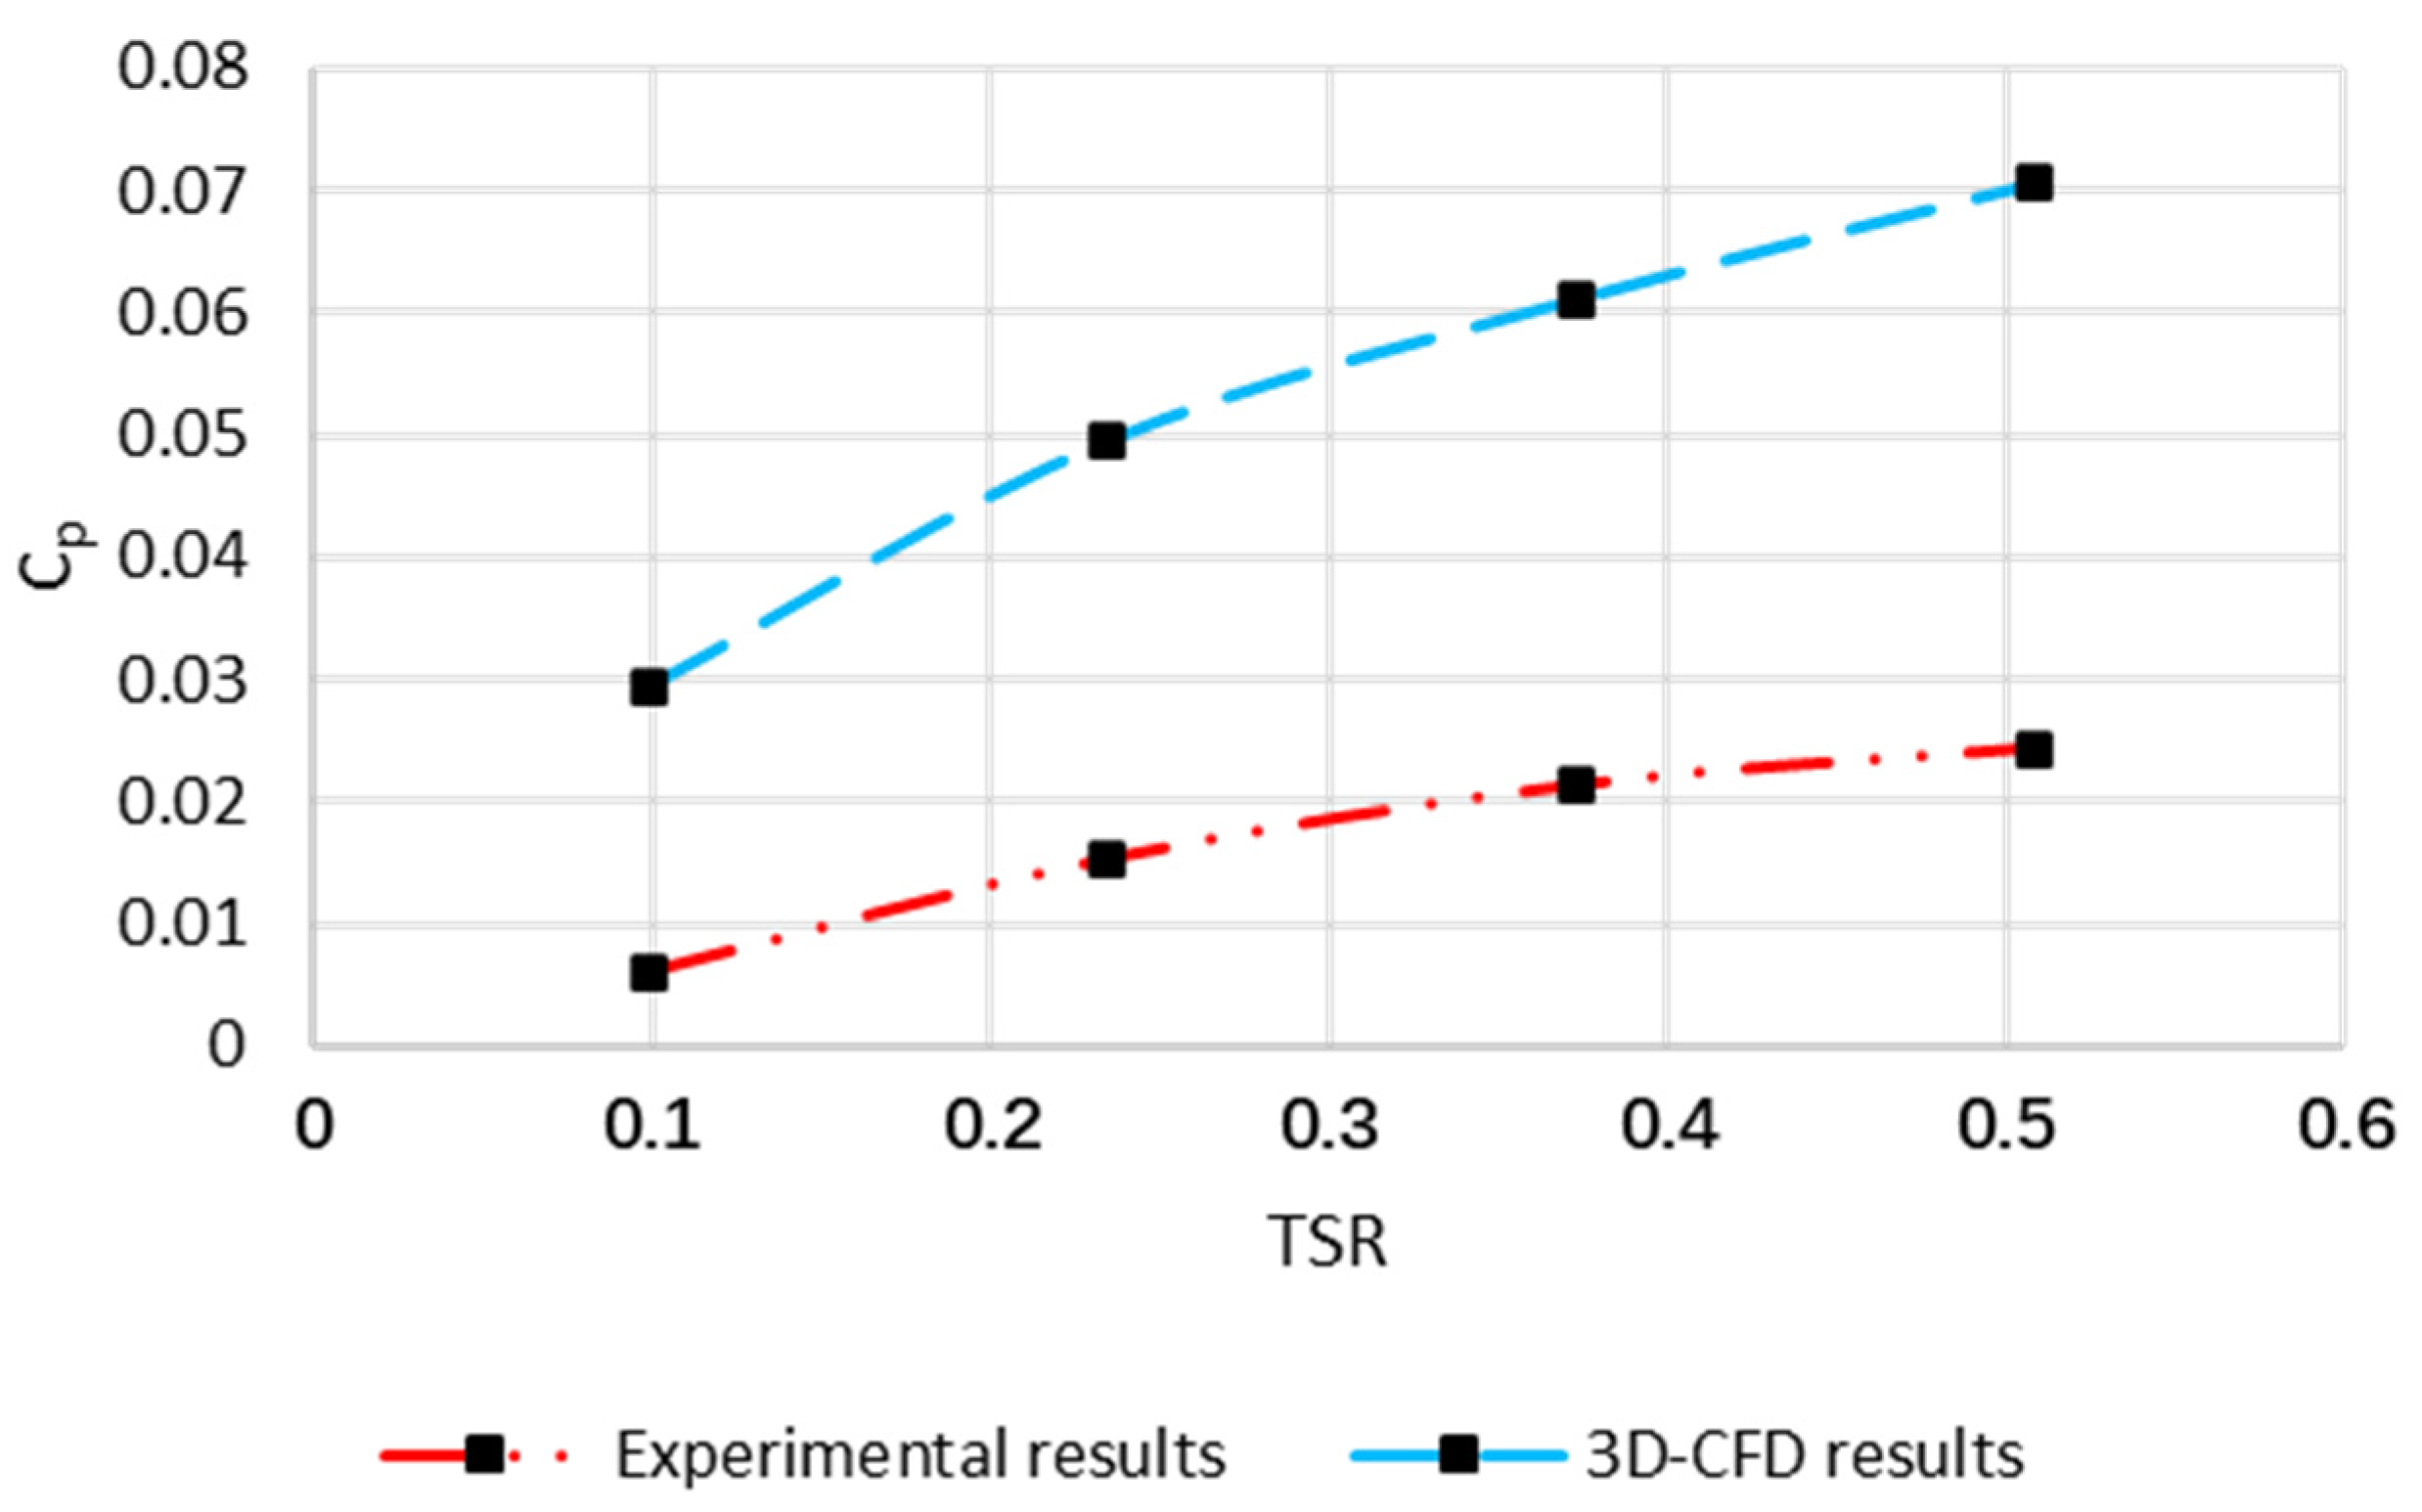
37]. Another common numerical method is CFD simulation, which is based on the U-RANS equation and can simulate the wake-flow regime in the downstream of VAWTs; therefore, that is more precise than other potential approaches [38]. Moreover, various optimization approaches have been nominated to find the optimal geometry configuration. One of these common methods is the Kriging method [39,40]. Another optimization method is the design of experiment (DOE). The main goal of DOE is to choose each design parameter to illustrate the shape design space. Considering the relatively insignificant number of control points, a factorial method is suitable for this approach [41]. For optimization with DOE, there are three optimization techniques, namely, Mixture design, Taguchi, and Response Surface Methodology. The first one is for formulation, the second one is for process conditions, and the third one has simultaneous applications for both process and formulation changes [42]. The RSM approach has two techniques. The first one is Central Composite Design (CCD), which can simultaneously optimize two to nine factors (independent variables) with a large number of responses. The second one is Box-Behnken Design (BBD), which can optimize three to seven factors with a large number of responses [43]. To show the practicality of the numerical studies, a techno-economic study is applied to the simulated system to determine its installation, repair, and maintenance costs, and this cost is compared to other power generation systems such as photovoltaic systems, biomass, and hydropower turbines [44]. HOMER Pro 3.14.2 commercial software, which has a rich library of geographical information of different regions in the world, including the velocity and amount of wind and solar radiation throughout the year, has provided a suitable platform for this type of study [45].
In this study, a 3D-CFD investigation on the geometrical and operational parameters, namely the number of blades, overlap ratio, spacing size, arc angle, shape factor, presence of curtain, wind velocity, and multi-bucket rotor, on the aerodynamic performance and the efficiency of a Savonius VAWT is conducted with Ansys CFX 21.2 software. As the Ansys workbench provides a platform for systems optimization, a suitable optimization method is nominated; therefore, by using the Kriging optimization method, the optimum values for geometrical and operational parameters are introduced. Finally, the technical and economic performance of the evaluated Savonius VAWT in a hybrid power supply system is investigated by HOMER 14.2 pro-commercial software. The main novelty of this numerical study is that all three CFD modeling, DOE optimization and techno-economic analyses, which were investigated separately in previous research, are simultaneously conducted here.

2. Problem Description and Solution Strategy

This paper uses a three-dimensional numerical simulation based on the CFD method. Therefore, a Savonius VAWT is regarded as the prototype with which to proceed for the simulation process. In the present investigation, turbine blades located in a circular zone are coupled with a rectangular domain to allow rotation in this region; thus, the mesh motion method is adopted to make this procedure possible. The geometric features of the rotor and stator originate from the experimental investigation of Wenehenubun et al. [24]. The schematic configuration of the case study is illustrated in Figure 1 and geometrical dimensions of the rotor and stator are given in Table 1.
In this numerical analysis, an unstructured grid is selected, and the all-triangles method is chosen for the rotor and stator zones. To enrich the CFD outputs, the interfaces of the rotor and stator are appropriately sized. Moreover, to obtain more accurate CFD outcomes and the effects of fluid-flow separation around rotor blades, an appropriate grid size and boundary layer mesh, including ten layers with a growth factor of 1.1, are applied. The generated mesh is illustrated in Figure 2.

3. Governing Equations

In this paper, the Navier-Stokes equation models the flow around the Savonius rotor, and Reynolds average method is also applied. RANS equations are time-averaged equations of flow motion. The Reynolds decomposition is used to decompose the quantities into fluctuation and time-averaged quantities. The velocity is separated into two terms, u ¯ and u , which are averaged and fluctuating velocity terms. The below equations represent the Unsteady Reynolds Average Navier Stokes (URANS) [46].
u ¯ = 1 T T u ( t ) d t
u = u u ¯
u i ¯ x i = 0
u i ¯ t + u j ¯ u i x j = 1 ρ p ¯ x i + v 2 u i ¯ 2 x j 2 u j u i ¯ x j
where u is the velocity of fluid flow (m/s) in the x-direction, p is pressure (Pa), and ρ (kg/m3) is the fluid density.
Selecting the turbulence model is crucial due to fluid flow separation simulation, which significantly affects CFD results. Several conventional turbulence models can be used for numerical modeling, namely k-ε, k-ω, and SST transition. All mentioned models benefit from the Boussinesq assumption which ignores changes in fluid properties other than density, shown in Equation (5) for Reynolds stresses [47].
τ i j = 2 μ t ( S i j 1 3 u k x k δ i j ) 2 3 ρ k δ i j
S i j = 1 2 ( u i x j + u j x i )
The k-ω SST model is widely used for modeling the flow around turbomachines; moreover, the k-ω SST equations for applications near wall regions are suitable [48]. The k-ω SST model is effective for capturing near-wall behavior and the viscous sub-layer, which are crucial effects for rotating blades. Therefore, this model is adopted for these simulations. These models are based on transport equations for the turbulence kinetic energy, k, and its dissipation rate ω. The model uses the following transport equations:
D k D t = P β * ρ ω k + x j [ ( μ + σ k ρ k ω ) k x j ]
D ω D t = γ ω k P β ρ ω 2 + x j [ ( μ + σ ω ρ k ω ) ω x j ]
where τ i j derived from Equations (5) and (6).
P = τ i j u i x j
The turbulent viscosity is assumed from the below equation:
μ t = ρ k ω
The other parameters of the above equation are obtained from Table 2.
The γ coefficient is selected to obtain the appropriate value for the von Karman constant (κ ≈ 0.41), via expression 11:
γ = β β * σ ω k 2 β *
The tip speed ratio is the mathematical relation between the blade tip speed and the wind speed (Vw) [46].
T S R =   R × ω V i n
where R is the radius and ω is the angular velocity of the rotor.
Power coefficient (Cp), which represents the turbine efficiency, can be written as follows:
C m = T 1 2 ρ A R V i n 2
where ρ (kg/m3) is wind densities, Vin (m/s) is wind speeds entering the turbine, p (W) is the extractable power, and A (m2) is the swept area.

4. Numerical Modeling and Simulation

4.1. Boundary Condition

In this 3D-CFD simulation, Ansys CFX commercial software is used. Due to the unsteady physics of the problem and the interaction between the blade’s movement and wake flow around the rotor, the transient method is adopted. The velocity inlet boundary condition is chosen for the stator inlet section, and the outlet zone of the stator domain is defined as the pressure outlet condition. Other faces of the cube are considered as symmetry boundary conditions, which do not have a significant effect on the results due to the large distance from the rotor. Furthermore, to model the rotation of the rotor inside the stator, a cylinder around the rotor is considered to be the interface boundary condition, which is properly coupled with the stator. In the 3D-CFD simulation, SIMPLE scheme is selected, and second-order upwind spatial discretization is obtained for pressure, momentum, and turbulence equations.

4.2. Validation and Grid Independence

The experimental investigation of a two-bladed small-scale Savonius VAWT performed by Wenehenubun et al. [45], is used for this numerical study. Based on the experimental information, the inlet velocity of the wind tunnel was 10 (m/s) [45]; thus, this amount is used for inlet boundary condition. The numerical outputs are compared to experimental data at four TSRs to verify the present numerical simulation. The validation results for Cp are shown in Figure 3.
Regarding the information in Figure 3, the 3D-CFD outputs are compatible with experimental investigation data; thus, the CFD methodology is acceptable. In that, the arms and shaft are omitted, and the 3D approach based on the URANS equation cannot foresee the tip vortices around buckets; therefore, there is a difference between the CFD and experiment results. However, this numerical method is adopted in order to reduce the calculation expenditure.
In the next chapter, the mesh around the buckets and rotor domain, which remarkably affected the results, is gradually minified to achieve grid independence. Additionally, the Cp at TSR = 0.23 is considered in three cases. The whole numbers of grids in the first, second, and third cases are approximately 1.4, 3.4, and 5.4 million respectively. To evaluate the mesh quality, the y+ non-dimensional parameter was obtained. The y+ values for the cases are 1.8, 1.1, and 0.8 respectively. Cp values at TSR = 0.23 are illustrated in Table 3.
Based on Table 3, the Cp values are not sensibly different in the three cases: this means that the CFD simulation is not dependent on the number of grids and the CFD results are reliable. Therefore, to compromise between results accuracy and simulation time, Case 2 was selected for the following simulations.

5. Results and Discussion

In this chapter, according to the impact of the factors which have a significant effect on Savonius VAWT is numerically analyzed. Impressive parameters, including the number of blades, overlap ratio, spacing size, arc angle, shape factor, inlet wind speed, utilizing curtains, and multi-bucket rotor, are inspected.

5.1. Effect of Number of Blades

The number of rotor blades is a crucial parameter that can affect the turbine’s performance. Usually, Savonius VAWTs are designed with two, three, and four blades. In this numerical study, three different rotor configurations with various blade numbers are investigated. The outputs of Cp values for the rotor with a different number of blades are given in Figure 4a. To illustrate the turbine total torque in a complete rotation, the turbine torque is given as a function of the azimuth angle at TSR = 0.23. The results are shown in Figure 4b.
Based on Figure 4a, the turbine’s efficiency diminished by adding each blade. At the first TSR, the Cp value of three-bladed and four-bladed turbines is 12% and 52% lower than the two-bladed rotor. Moreover, in further rotational speeds at TSR = 0.5, the Cp value of the two-bladed rotor is 38% and 58% more than rotors with three and four blades, respectively. Furthermore, as can be seen from Figure 4b, by adding blades to the rotor, overall torque in a complete cycle declined, which resulted in less power generated. However, at the azimuth angle of 0, which is the point at which the turbine starts rotating, the 2-bladed rotor torque is negative, which means that this configuration needs initial torque to start operating. In contrast, other formations with more blades start rotating without initial torque. Velocity and pressure contour plots for rotor configuration with different blade numbers at TSR = 0.23 are shown in Figure 5.
Based on Figure 5, the wake flow region around the downstream rotor area and between the 4-bladed turbine buckets is more intense. Furthermore, in a turbine with more blades, deflected airflow from the upstream bucket focuses on the downstream bucket, affecting turbine performance. As a result, less torque and generated power from the airflow are achieved in a turbine with more blades. Moreover, based on the pressure contour plot, unfavorable pressure on the convex section of upstream buckets increases when blades are added. However, as the space between the buckets decreased in three- and four-bladed rotors, the positive pressure significantly decreased in the concave section of the buckets.

5.2. Effect of Overlap Ratio

The degree of overlap ratio plays a significant role in developing the productivity of Savonius VAWTs. This value is obtained from the relationship between the horizontal gap of buckets and bucket diameter. To examine the effect of various overlap ratios on turbine performance, overlap ratios of 0, 0.3, and 0.5, alongside 0.15, the initial and standard overlap ratio value, are checked. The results of Cp values for different overlap ratio values are illustrated in Figure 6a, as is the effect of overlap ratio on overall torque as a function of azimuth angle at TSR = 0.23. The results are shown in Figure 6b.
Regarding the details of Figure 6a, Cp values increase as the amount of overlap ratio declines. In the lower rotational speed at TSR = 0.1, the Cp value of overlap ratio of 0 is 36%, 28%, and 24% more than overlap ratios of 0.5, 0.3, and 0.15, respectively. In other words, the Savonius VAWT with the overlap ratio of 0.5 needs more initial torque to start operating. Moreover, at TSR = 0.5, the maximum Cp values related to the overlap ratio of 0 increase by 60%, 45%, and 22% compared to overlap ratios of 0.5, 0.3, and 0.15, respectively. It should be noted that as the overlap ratio increases, the fulfilling concentration of wind flow on the bucket’s concave section decreases, leading to a reduction in generated power. Furthermore, based on Figure 6b, the rotor configuration with OR = 0 has the highest total torque value in a complete rotation. Moreover, in the OR = 0.5, the value of the required initial torque is less than in other circumstances. In order to illustrate the reduction of fulfilling wind flow concentration on the concave side, velocity and pressure contour plots for various overlap ratios at TSR = 0.23 are given in Figure 7.
As is evident in Figure 7, when OR = 0, the intensity of the wake flow zone between and around buckets is more than other conditions, which causes a fulfilling concentration of wind flow on the concave section. Moreover, when OR = 0.5, the wake flow regime in the rotor’s downstream section is more stretched than other overlap ratio values. Likewise, regarding the pressure contour plot with rising overlap ratio values, the satisfactory pressure in the upstream bucket’s convex area reduces, which triggers a drop in overall torque and output power. In Figure 7, positive pressure on the concave section of the bucket with OR = 0 is more than other configurations; subsequently, satisfactory pressure on the convex side of this case, which leads to a remarkable increase in overall torque, is more than other conditions.

5.3. Effect of Spacing Size

Based on the results, a new geometrical novelty that impacted Savonius VAWT aerodynamic performance is spacing size, an indicator of the vertical gap between buckets. To inspect the effect of spacing size on the prototype Savonius VAWT, three different spacing sizes, including 0.03 (m), 0.06 (m), and 0.1 (m) alongside the initial spacing size, which is 0 (m), are used. The results of Cp values for different spacing size values are given in Figure 8a. Moreover, overall torque is plotted as a function of azimuth angle at TSR = 0.23 in Figure 8b.
According to the information in Figure 8a, there is an inverse relationship between increasing spacing size and Savonius aerodynamic performance. In addition, the Cp value related to S = 0.1 (m) at TSR = 0.1 is equal to 0.024, which is 18% lower than S = 0 (m) at the same point. However, at TSR = 0.5, the most negligible Cp value for S = 0.1 (m) is equal to 0.007, which is 89% less than S = 0 (m) at the same point. This drop in efficiency is due to the appearance of empty vertical space between the buckets, which causes the air flow to escape. As is clear from the results, the turbine efficiency drops more with the further increase of this unfavorable space. At higher rotational speeds where the flow escape has reached its maximum, the decline in CP is very evident. It can be seen from Figure 8b that overall torque with S = 0 (m) is slightly more than the rotor configuration with S = 0.03 (m), and the overall torque and subsequently generated power of the rotor with spacing size value of 0.1 (m) is significantly less than other models. To illustrate air flow between buckets, velocity and pressure contour plots for various spacing sizes at TSR = 0.23 are shown in Figure 9.
Regarding Figure 9, although in the configuration with S = 0 (m), the wake flow region centralized around buckets is much more than the other configurations, the favorable wind flow escaping is less than other models; therefore, it prompts a remarkable rise in overall torque and generated power. This means that the destructive effects of favorable wind flow escaping between gaps are more than the positive impact of wake flow regime concentration. Moreover, by looking at the pressure contour plot, positive pressure on the convex side of the downstream bucket and between the blade gap in the rotor with S = 0 (m) is less than other models, which enhances overall torque in a complete rotation.

5.4. Effect of Arc Angle

Arc angle, which indicates the buckets’ circular sector, significantly affects air flow maintenance in the concave section of the bucket and creates favorable pressure. In order to study the effect of arc angle on Savonius VAWT, different arc angle values, including 160°, 170°, 190°, and 200°, are evaluated along with the standard case of 180°. The outputs of Cp values for different arc angle values are illustrated in Figure 10a. In order to show the total turbine torque in a complete rotation, the turbine torque is plotted as a function of azimuth angle at TSR = 0.23. The results are shown in Figure 10b.
Regarding the details of Figure 10a, if φ = 180° is considered as the reference case, Cp values of the turbine decrease as the arc angle increases. However, Savonius VAWT efficiency grows as the arc angle declines until φ = 170°, which is the optimum case. After this amount, Cp values decrease as the arc angle falls (φ = 160°). At TSR = 0.1, the Cp value related to φ = 200° is 19% and 37% less than reference and optimum cases, respectively, which indicates more initial torque for the turbine to start operating. Furthermore, the Cp value related to φ = 200° at TSR = 0.5 is 33% less than the reference case and 40% lower than the optimum case. Additionally, as arc angle decreases, satisfactory pressure on the concave section of buckets increases. In addition, as Figure 10b conveys, the total torque of the prototype in a complete rotation has the maximum value when φ = 170°; subsequently, the most significant generated power is obtained in this condition. Moreover, among the five evaluated arc angles, the graph proves that the least required initial torque to begin turbine rotation is related to φ = 160°; therefore, as the arc angle is enlarged, the initial torque for turbine rotation increases. To illustrate the satisfactory pressure increase in the bucket concave section, velocity and pressure contour plots for various arc angles at TSR = 0.23 are shown in Figure 11.
Based on Figure 11, velocity contour plots illustrate that when the arc angle increases, the flow stream in the rotor’s convex side diminishes, and the dissatisfactory pressure on this section increases. Moreover, wake flow region of the upstream bucket becomes extended. This results in lessening the satisfactory pressure in the concave area of the downstream bucket, which reduces overall torque and subsequently generated power. Furthermore, as can be seen from the pressure contour plot, when the buckets’ arc angle decreases, satisfactory pressure in the concave section of the rotor increases slightly. Obviously, when the arc angle value rises, this satisfactory pressure in the concave section declines steadily.

5.5. Effect of Shape Factor

Another design parameter is the shape factor, defined as the ratio between the bucket arm length and the bucket radius. To study the effect of the shape factor, the bucket is removed from the full semicircular shape, and a straight arm is added to its end. The configuration of a Savonius VAWT with an arm is shown in Figure 12.
Based on Figure 12, the arms’ length is changed by stabilizing the bucket radius, resulting in various shape factors. To investigate that, shape factor values of 0.2, 0.5, and 0.7 are inspected beside the reference configuration, which had a complete semicircular shape with a shape factor of 0. The outputs of Cp for different shape factor values are illustrated in Figure 13a. In order to show the total turbine torque in a complete rotation, the turbine torque is plotted as a function of azimuth angle at TSR = 0.23. The results are shown in Figure 13b.
Regarding the details of Figure 13a, although the highest Cp value obtained for p/q = 0.5 and p/q = 0.7 are close to each other, the highest Cp is related to p/q = 0.5. Moreover, at TSR = 0.1, the Cp value of p/q = 0.5 is 5%, 7%, and 15% more than shape factor values of 0.7, 0.2, and 0, respectively. In higher rotational speeds at TSR = 0.5, Cp values calculated for p/q = 0.5 are 2%, 12%, and 18% more than Cp values related to shape factor of 0.7, 0.2, and 0. At higher shape factor values, the air flow leading between buckets space takes place more efficiently. Moreover, by raising the shape factor on the concave side of buckets, the concentration of satisfactory air flow pressure grows, which increases the Cp. Additionally, by looking at the details of Figure 13b, it seems the most optimal torque value is achieved when shape factor is equal to 0.5, and overall torque at this point is slightly more than other shape factors. Furthermore, all of these configurations’ torque at the beginning point is less than zero, meaning they need initial torque to start rotating. To illustrate the effect of air flow, satisfactory pressure concentration, velocity, and pressure contour plots for various shape factor values at TSR = 0.23 are shown in Figure 14.
Regarding Figure 14, with increasing arm length and subsequently shape factor value, directing the air flow in the space between the buckets happens in a more suitable way and with higher tangential velocity, which causes a more favorable air flow stream concentration on the concave section of the bucket. Moreover, according to the pressure contour plot, in the rotor with a more prominent shape factor, the positive pressure in the concave section and the space between the buckets is higher than in other cases. As a result, the overall torque is higher for a turbine with more significant shape factors.

5.6. Effect of Curtain

This chapter defines and analyzes the effect of another method, which is designing a curtain at the upstream section of the rotor which can hinder the misleading of the inlet air flow and cause higher efficiency, additionally lowering the negative torque. The schematic view of the curtain is shown in Figure 15.
The dimensions of the curtain are presented in Table 4. The results of the effects of various curtain configurations on the Savonius VAWT’s Cp is presented in Figure 16a. In order to show the total turbine torque in a complete rotation, the turbine torque is plotted as a function of azimuth angle at TSR = 0.23. The results are shown in Figure 16b.
Concerning Figure 16a, the Cp values related to curtain 1 are placed at first and in the initial rotational speed at TSR = 0.1. Cp values related to curtain 1 are 29%, 48%, and 76% higher than curtain 2, curtain 3, and curtainless cases. At TSR = 0.5, Cp values for curtain 1 are 35%, 55% and 82% more than curtain 2, curtain 3, and curtainless configurations, respectively. Therefore, installing the curtain increases generated power significantly by directing the inlet air flow stream to the rotor section. Looking at Figure 16b, the overall torque related to a Savonius VAWT with curtain 1 is remarkably more than other cases. In addition, by equipping the rotor with a curtain, the initial torque becomes positive, which means that in contrast with the curtainless case, which needs initial starting torque, they have the ability to self-start. To show the direction of the incoming air flow toward the rotor section more concentratedly and effectively than the curtainless case, velocity and pressure contour plots for various curtain models at TSR = 0.23 are shown in Figure 17.
Regarding Figure 17, curtains guide the flow into the rotor section and not only has the concentration of the air flow in the upstream part of the rotor been significantly improved, but also the direction of flow towards the convex section of the buckets has occurred more effectively in the presence of the curtain. It is clear that in the configuration of curtain 1, the airflow passes over the buckets at a higher speed, which increases the rotor torque. In addition, according to the pressure contour, the presence of the curtain creates positive pressure in the concave part of the bucket, which increases the effective drag force. Furthermore, in the rotor with curtain 1, the region with favorable negative pressure in the convex part is more tangible than in other situations, which leads to the better performance of this configuration.

5.7. Effect of Inlet Wind Velocity

In this chapter, the effect of inlet wind velocity, which directly relates to the Reynolds number and flow regime, is studied. Inlet wind velocity values of 8 (m/s) and 12 (m/s) are examined beside Vin = 10 (m/s). Moreover, the Reynolds numbers of 20,145, 25,180, and 30,216 are calculated for an inlet wind velocity of 8 (m/s), 10 (m/s), and 12 (m/s), respectively. The output of Cp values for different inlet wind velocities is illustrated in Figure 18a. In order to show the total turbine torque in a complete rotation, the turbine torque is plotted as a function of azimuth angle at TSR = 0.23. The results are shown in Figure 18b.
Regarding the details of Figure 18a, mounting inlet wind velocity causes a slight increase in Cp values; therefore, increasing Reynolds numbers cannot improve turbine performance significantly. The Cp value at TSR = 0.1 with Vin = 12 (m/s) is 10% and 20% more than Cp values related to Vin = 10 (m/s) and Vin = 8 (m/s), respectively. In high rotational speed values at TSR = 0.5, obtained Cp values for Vin = 12 (m/s) are 3% and 10% higher than Cp values related to Vin = 10 (m/s) and Vin = 8 (m/s), respectively, and favorable pressure is increased by growing wind velocity. Furthermore, based on the details of Figure 18b, the overall torque of the turbine when Vin = 12(m/s) is more than other operating conditions. Moreover, it can be seen that an increase in inlet wind velocity can enhance the negative torque problem; therefore, as the initial torque of Vin = 12(m/s) is positive, Savonius VAWT does not need self-starting torque in this condition. To illustrate favorable pressure growth, velocity and pressure contour plots for various Vin values at TSR = 0.23 are shown in Figure 19.
Furthermore, based on Figure 19, when Vin = 12 (m/s), positive pressure on the concave section and upstream blade tip increases. In addition, the negative pressure area, which is satisfactory pressure on the bucket’s convex side, grows, which leads to a remarkable increase in rotor torque.

5.8. Effect of Multi-Bucket Rotor

In this chapter, the effect of a multi-bucket rotor is investigated. Modified configurations with two-variable spacing between the main bucket and smaller ones, and different inner blades arc angle values, are adopted. Spacing values and inner blades arc angle, which are defined as Δ and ψ, are 0.005 (m) and 0.01 (m), and 100°, 140°, and 180°, respectively. Figure 20 illustrates the multi-bucket rotor configurations.
In order to study the effect of the multi-bucket rotor on the performance, the impact of different inner blade arc angle values, namely 110°, 140°, and 180°, are evaluated in constant bucket space values of 0.01 (m) and 0.005 (m). The results of Cp values for these configurations are illustrated in Figure 21a,b. In addition, in order to show the turbine torque in a complete rotation, the turbine torque is plotted for different inner arc angles and bucket space values of 0.01 (m) and 0.005 (m) as a function of azimuth angle at TSR = 0.23. The results are shown in Figure 21c,d, respectively.
According to Figure 21a, the multi-bucket rotor with ψ = 110° has the best performance compared to other cases, and its performance is slightly more than the single-bucket rotor; however, the single-bucket model shows higher efficiency compared to modified cases. Cp values at TSR = 0.1 for a rotor with an inner arc angle of 110° with Δ = 0.01 are 16%, 30%, and 11% higher than a rotor with ψ = 140°, ψ = 180° and single blade rotor. In higher rotational speeds, Cp values at TSR = 0.5 related to the rotor with ψ = 110° are 15%, 51%, and 5% higher than the Savonius VAWT with ψ = 140°, ψ = 180°, and single blade rotor. It can be seen from Figure 21c that the overall torque for the rotor with ψ = 110° is more than other models. Moreover, multi-buckets with this arc angle enhance negative torque; therefore, the Savonius VAWT needs less initial torque to start rotating. According to the data of Figure 21b, rotor configuration with ψ = 110° gives the highest Cp, and additionally, in initial rotational speed values, turbines with ψ = 140° have better performance. However, after TSR = 0.4 single-bucket rotor, Cp increased. With more details, it can be claimed that the Cp value at TSR = 0.1 and ψ = 110° is 10%, 33%, and 16% more than ψ = 140°, ψ = 180°, and the single bucket model. Furthermore, at TSR = 0.5, the Cp value related to ψ = 110° is 14%, 30%, and 9% more than ψ = 140°, ψ = 180°, and the single-bucket model, respectively. It can be seen from Figure 21d that the overall torque for the rotor with ψ = 110° is more than other models and that multi-buckets with this arc angle enhance negative torque; therefore, the turbine needs less initial torque to start rotating. The velocity and pressure contour plots for rotor configurations with bucket space values of 0.01 (m) and 0.005 (m) at TSR = 0.23 are shown in Figure 22a,b, respectively.
Based on Figure 22, the case with ψ = 110° tangential velocity in the convex surface and blade tip is better than others. Likewise, the air-flow stream leading between inner buckets and the gap between main buckets occurred better in this condition. Nevertheless, in the rotor with ψ = 180° in the inner buckets’ interaction, the air flow velocity is approximately zero and the stagnation zone is visible in this area, leading to a considerable drop in drag force arm and a subsequent decrease in the initial torque. Moreover, regarding the pressure contour plot, in the rotor configuration with ψ = 110°, positive pressure, which is the main reason for turbine rotation, increases in the concave section. Furthermore, negative pressure, which is satisfactory pressure for turbine operation, grows on the convex side and upstream blade tip.

6. Optimization

For the optimization process, the design of experiments method (DOE) is used as a methodology to study the effects of the different geometrical and operating parameters investigated in this paper. Since the experiment steps were pre-designed and the impacts of various geometrical and operational parameters were evaluated, the DOE setup is defined as the custom mode. In the response surface section, different methods are examined. According to the observation of the existing errors, the Kriging method with variable Kernel variation type is the most optimal and accurate mode. It is established to calculate the functional relation between the examined parameters and the power coefficient. Figure 23 shows the response surface’s results in different conditions based on the Kriging method.
Regarding Figure 23, optimum points for each parameter are evaluated; therefore, optimum values for number of blades, overlap ratio, spacing size, arc angle, shape factor, and inlet velocity are determined at 2 blades, 0, 0 (m), 170°, 0.5, and 12 (m/s), respectively, when TSR value is equal to 0.37. Furthermore, the sensitivity of the prototype to each of the examined parameters is shown in Figure 24.
As for the pie chart data, the effect of the number of blades and shape factor is ranked in the highest and lowest place between parameters at 18.6% and 8.1%, respectively, which means that this Savonius VAWT’s performance sensitivity to the number of blades is more than other design parameters.

7. Economic Analysis

In this section, the economic analysis is performed using the HOMER 14.2 Pro application introduced by National Renewable Energy Laboratory in the United States. This software can use the Net Present Cost (NPC) approach to select the optimum combination of initial investment, replacement, and maintenance costs [50]. In addition, another ability of this software is performing sensitivity analysis for variables with uncertain values. In fact, HOMER Pro software allows users to investigate the effect of changing a parameter on the entire system [51].

7.1. Model Description and Components

For economic analysis, a simple small hybrid power supply system, which is located in the southeast of Iran in the Zabul region with the task of supplying the electricity power for the instrumentation of the water transmission line of a potato farm, is considered as the prototype. The lifetime of the project is considered to be 10 years, and the nominal discount rate and the expected inflation rate are assumed to be approximately 25% and 30%, respectively. This power supply system consists of an electric load, a solar panel (PV), a wind turbine, a converter and a battery. The schematic of the power supply system is shown in Figure 25.

7.2. Load Demand

The average electrical energy consumption of the instrumentation in the site is 0.25 kWh/d. and the peak load is calculated to be 0.02 kwh/d. Figure 26 shows the daily load profile during a year.

7.3. Solar Radiation Information and Solar Panel

The solar energy information for the selected area is obtained from Solar Energy and Surface Meteorology NASA [52]. Average daily radiation (kWh/m2/day) data for Zabul province is illustrated in Figure 27.
Regarding the solar energy information, the annual average radiation in the selected area is 5.27 kWh/m2/day.
The chosen solar panel for the power supply system is a simple flat panel type (Sharp ND-250QCS), which operates without a tracking system, with the general specification of HOMER library. This model of PV has a capital cost of 25,000,000 IRR per kilowatt. The replacement and operation and maintenance (O&M) costs are considered to be 10,000,000 IRR and 1,000,000 IRR per year, respectively. According to the manufacturer’s information, the lifetime of solar panel is 25 years. A derating factor of 80% is applied on the electric generation from each solar panel. In this simulation, temperature effect is considered; therefore, about 0.485%/°C reduction happens in the system output.

7.4. Wind Speed Information and Turbine

Wind resource data for this area is adopted from the NASA prediction of worldwide energy resource [53]. Figure 28 shows the monthly average wind speed in Zabul province.
The Savonius VAWT, which is numerically simulated in the previous section, is selected for this power supply system. The capital cost, replacement, and O&M costs of the Savonius VAWT are 8,000,000 IRR, 4,000,000 IRR, and 500,000 IRR, respectively, and the lifetime of the turbine is equal to 20 years. The Savonius VAWT output power for various wind speeds is shown in Figure 29.

7.5. Battery

For the energy storage component, a lead-acid battery (SUNLIGHT 2V 2 RES OPzS) with a nominal capacity of 0.263 kWh is chosen for this study. It is a low-maintenance energy storage solution that offers significant benefits in terms of cost per cycle, combined with highest level of reliability and performance, even for remote installations where long discharges occur and excellent recharging properties are essential. This model of lead-acid battery has capital and replacement costs of 10,000,000 IRR and 5,000,000IRR per kilowatt and the lifetime of this energy storage systems is estimated to be approximately 10 years.

7.6. Converter

In order to harmonize among AC and DC outputs of different components, the converter system is employed. A 1 kW converter’s capital, replacement, and O&M costs are obtained at 8,000,000 IRR, 4,000,000 IRR, and 1,000,000 IRR, respectively. Regarding the manufacturer’s data the lifetime of this type of converter is approximately 15 years and the efficiency of inverter is estimated to be approximately 95%.

7.7. Results

To accommodate the load demand, the NPC approach is adopted by HOMER pro software to explore and find an optimum combination of components. In this simulation, two different combinations of components are suggested as a power reservoir to provide the required electrical power.

7.7.1. VAWT, Battery and Converter

In this arrangement, the power supply system consists of two Savonius VAWTs, a battery and a converter. The total net present cost, cost of energy, initial capital cost, and operating cost of system are 45,209,200 IRR, 57,201 IRR, 26,068,050 IRR, and 1,532,966 IRR. The NPC and an inclusive perspective of the system’s performance during the project lifetime (over 10 years) are presented in Table 5 and Table 6, respectively.
The share of different costs of the system in the total NPC is illustrated in Figure 30.

7.7.2. VAWT, Solar Panel, Battery and Converter

In the second scenario, a solar panel is added to the arrangement of the power generation system. The total net present cost, cost of energy, initial capital cost, and operating cost of the system are 56,267,980 IRR, 69,531 IRR, 43,059,301 IRR, and 1,057,849 IRR. The NPC and an inclusive perspective of the system’s performance during the project lifetime (over 10 years) are presented in Table 7 and Table 8, respectively.
Regarding the information in Table 8, most of the electricity is produced by solar panels (75%). While the Savonius VAWT works more hours during the year, it provides a smaller share of electrical energy (25%). The share of different costs of the system in the total NPC is illustrated in Figure 31.
According to Figure 31, the capital cost of installing a solar panel is more than Savonius VAWT cost, and the operating cost of a Savonius VAWT is slightly more than the solar panel operating cost, and finally, at the end of the project, the solar panel, turbine, and converter salvage will generate income.
To summarize, in the first scenario with two Savonius VAWTs, the NPC and COE is lower than the second arrangement with the solar panel. In other words, an arrangement including a Savonius VAWT, battery, and converter is suitable for the power supply system of the instrumentation equipment of this water pipeline, and adding a solar panel only adds to the project cost.

8. Conclusions

In this study, a three-dimensional CFD simulation with the help of ANSYS CFX software is performed on a Savonius VAWT, and the effect of different geometrical and operating parameters, namely number of blades, overlap ratio, spacing size, arc angle, shape factor, presence of curtain, wind velocity, and multi bucket rotor are studied, and the Cp values on different TSRs, total torque as a function of azimuth angle, and velocity and pressure contour plots are discussed. The results show that these parameters have a remarkable impact on the aerodynamic performance of the rotor. And finally, the optimum value for each parameter is calculated based on the DOE optimization method. The summary of the essential results is presented below as bullet points.
(1)
The number of blades plays a vital role in the Savonius VAWT solidity. The numerical simulation was conducted on a two, three, and four-blade rotor. The results show that the generated power of a two-bladed rotor is more than other configurations. Additionally, the torque value of the two-bladed rotor at an azimuth angle of 0° is less than the three and four-bladed rotor; therefore, the rotor with two buckets needs more initial torque to start operating.
(2)
The results of different overlap ratio values on the aerodynamic performance of the rotor show that by decreasing the amount of overlap ratio, the concentration of flow in the concave section increases, leading to a remarkable rise in the total torque of the rotor and generated power.
(3)
The obtained outputs for different spacing size values indicate that the larger spacing size helps flow escape between the vertical gap, resulting in a decline in favorable pressure in the concave section and causing less total torque and generated power.
(4)
Buckets’ arc angle value affects the aerodynamic performance of the Savonius rotor. Raising the arc angle value diminishes the air flow stream and satisfactory pressure around the convex section, and the wake flow regime around buckets increases, reducing generated power. The best value for arc angle is calculated at 170°.
(5)
The shape factor slightly increases the efficiency of the rotor as the arms direct the flow between the buckets’ space. The favorable flow concentration in the concave section rises, enhancing the rotor’s aerodynamic performance and generated power. The optimum value for the shape factor is equal to 0.5.
(6)
A curtain with different configurations in the upstream section of the rotor guides the air flow into the rotor suction side; as a result, the negative torque problem at azimuth angle of 0° is solved by installing the curtain. Additionally, the results indicate that the size of curtain length plays an essential role in the rotor aerodynamic performance enhancement and generated power.
(7)
Increasing wind velocity, which increases the Reynolds number, raises the turbine generated power; however, the effect of the Reynolds number on the aerodynamic performance is not as significant as other elements.
(8)
The multi-bucket rotor configuration with different inner bucket arc angles and spacing affects the performance of the rotor. The results show that the internal bucket arc angle of 110° enhances the performance of the rotor; however, the multi-bucket configuration with inner arc angle of 180° reduces the generated power.

Author Contributions

Conceptualization, F.G.; methodology, S.F. and F.G.; software, F.G.; validation, F.G.; formal analysis, F.G. and M.A.; investigation, F.G., M.M. and M.A.; resources, M.M.; data curation, M.A. and S.F.; writing—original draft preparation, F.G.; writing—review and editing, M.A.; visualization, F.G. and M.A.; supervision, M.M.; project administration, M.M.; funding acquisition, M.M. All authors have read and agreed to the published version of the manuscript.

Funding

This research received no external funding.

Institutional Review Board Statement

Not applicable.

Informed Consent Statement

Not applicable.

Data Availability Statement

The data that support the findings of this study are available in this paper.

Conflicts of Interest

The authors declare no conflict of interest.

Nomenclature

Symbols Subscript
VFlow velocity (m/s)tTurbulence
POutput power (W)inInlet
TTorque (N.m)Abbreviations
DRotor diameterVAWTVertical axis wind turbine
HRotor height (m)HAWTHorizontal axis wind turbine
ASwept Area (m2)CFDComputational fluid dynamic
DoPlate diameter (m)DMSTDouble multi-stream tube
qBucket radius (m)URANSUnsteady Reynolds averaged Naive Stokes
pArm length (m)TSRTip speed ratio
CmTorque coefficientOROverlap ratio
CpPower coefficient
eOverlap size (m)
SSpacing size (m)
Greek
µViscosity (Pa.s)
ψInner bucket arc angle (deg)
ΔInner bucket space (m)
ρDensity (kg/m3)
φBucket arc angle (deg)

References

  1. Winslow, A.R. Urban Wind Generation: Comparing Horizontal and Vertical Axis Wind Turbines at Clark University in Worcester, Massachusetts; International Development, Community and Environment (IDCE): Worcester, MA, USA, 2017; p. 35. [Google Scholar]
  2. Mostafaeipour, A. Productivity and development issues of global wind turbine industry. Renew. Sustain. Energy Rev. 2010, 14, 1048–1058. [Google Scholar] [CrossRef] [Green Version]
  3. Dixon, S.L.; Hall, C.A. Fluid Mechanics and Thermodynamics of Turbomachinery, 7th ed.; Butterworth-Heinemann Is an Imprint of Elsevier: Amsterdam, The Netherlands; Boston, MA, USA, 2014; ISBN 978-0-12-415954-9. [Google Scholar]
  4. Johari, M.K.; Jalil, M.; Shariff, M.F.M. Comparison of horizontal axis wind turbine (HAWT) and vertical axis wind turbine (VAWT). Int. J. Eng. Technol. 2018, 7, 74–80. [Google Scholar] [CrossRef] [Green Version]
  5. Saad, M.; Moh, M. Comparison of Horizontal Axis Wind Turbines and Vertical Axis Wind Turbines. IOSR J. Eng. 2014, 4, 27–30. [Google Scholar] [CrossRef]
  6. Toja-Silva, F.; Colmenar-Santos, A.; Castro-Gil, M. Urban wind energy exploitation systems: Behaviour under multidirectional flow conditions—Opportunities and challenges. Renew. Sustain. Energy Rev. 2013, 24, 364–378. [Google Scholar] [CrossRef]
  7. Zhang, T.; Elsakka, M.; Huang, W.; Wang, Z.; Ingham, D.B.; Ma, L.; Pourkashanian, M. Winglet design for vertical axis wind turbines based on a design of experiment and CFD approach. Energy Convers. Manag. 2019, 195, 712–726. [Google Scholar] [CrossRef]
  8. Basumatary, M.; Biswas, A.; Misra, R.D. CFD analysis of an innovative combined lift and drag (CLD) based modified Savonius water turbine. Energy Convers. Manag. 2018, 174, 72–87. [Google Scholar] [CrossRef]
  9. Möllerström, E.; Gipe, P.; Beurskens, J.; Ottermo, F. A historical review of vertical axis wind turbines rated 100 kW and above. Renew. Sustain. Energy Rev. 2019, 105, 1–13. [Google Scholar] [CrossRef]
  10. Worstell, M.H. Aerodynamic Performance of the DOE/Sandia 17-m-Diameter Vertical-Axis Wind Turbine. J. Energy 1981, 5, 39–42. [Google Scholar] [CrossRef]
  11. Karimian, S.M.H.; Abdolahifar, A. Performance investigation of a new Darrieus Vertical Axis Wind Turbine. Energy 2020, 191, 116551. [Google Scholar] [CrossRef]
  12. Jayaram, V.; Bavanish, B. A brief review on the Gorlov helical turbine and its possible impact on power generation in India. Mater. Today Proc. 2021, 37, 3343–3351. [Google Scholar] [CrossRef]
  13. Kragten, A. The Darrieus Rotor, a Vertical Axis Wind Turbine (VAWT) with Only a Few Advantages and Many Disadvantages; Report KD215; Engineering Office Kragten Design: Sint-Oedenrode, The Netherlands, 2004; 5p. [Google Scholar]
  14. Akwa, J.V.; Vielmo, H.A.; Petry, A.P. A review on the performance of Savonius wind turbines. Renew. Sustain. Energy Rev. 2012, 16, 3054–3064. [Google Scholar] [CrossRef]
  15. Pallotta, A.; Pietrogiacomi, D.; Romano, G.P. HYBRI—A combined Savonius-Darrieus wind turbine: Performances and flow fields. Energy 2020, 191, 116433. [Google Scholar] [CrossRef]
  16. Santhakumar, S.; Palanivel, I.; Venkatasubramanian, K. A study on the rotational behaviour of a Savonius Wind turbine in low rise highways during different monsoons. Energy Sustain. Dev. 2017, 40, 1–10. [Google Scholar] [CrossRef]
  17. Zemamou, M.; Aggour, M.; Toumi, A. Review of savonius wind turbine design and performance. Energy Procedia 2017, 141, 383–388. [Google Scholar] [CrossRef]
  18. Mahmoud, N.H.; El-Haroun, A.A.; Wahba, E.; Nasef, M.H. An experimental study on improvement of Savonius rotor performance. Alex. Eng. J. 2012, 51, 19–25. [Google Scholar] [CrossRef] [Green Version]
  19. Kamoji, M.A.; Kedare, S.B.; Prabhu, S.V. Experimental investigations on single stage modified Savonius rotor. Appl. Energy 2009, 86, 1064–1073. [Google Scholar] [CrossRef]
  20. Sobczak, K. Numerical investigations of an influence of the aspect ratio on the Savonius rotor performance. J. Phys. Conf. Ser. 2018, 1101, 012034. [Google Scholar] [CrossRef]
  21. Tawi, K.; Yaakob, O.; Sunanto, D.T. Computer simulation studies on the effect overlap ratio for savonius type vertical axis marine current turbine. Int. J. Eng. 2010, 23, 79–88. [Google Scholar]
  22. Menet, J.-L. A double-step Savonius rotor for local production of electricity: A design study. Renew. Energy 2004, 29, 1843–1862. [Google Scholar] [CrossRef]
  23. Hassanzadeh, R.; Mohammadnejad, M. Effects of inward and outward overlap ratios on the two-blade Savonius type of vertical axis wind turbine performance. Int. J. Green Energy 2019, 16, 1485–1496. [Google Scholar] [CrossRef]
  24. Wenehenubun, F.; Saputra, A.; Sutanto, H. An Experimental Study on the Performance of Savonius Wind Turbines Related With The Number Of Blades. Energy Procedia 2015, 68, 297–304. [Google Scholar] [CrossRef] [Green Version]
  25. Akhlaghi, M.; Ghafoorian, F. The investigation of arc angle rotor blade variations effect of the Savonius vertical axis wind turbine on the Power and Torque coefficients, using 3D modeling. Renew. Energy Res. Appl. 2023, 4, 13–19. [Google Scholar]
  26. Mao, Z.; Tian, W. Effect of the blade arc angle on the performance of a Savonius wind turbine. Adv. Mech. Eng. 2015, 7, 168781401558424. [Google Scholar] [CrossRef]
  27. Tahani, M.; Rabbani, A.; Kasaeian, A.; Mehrpooya, M.; Mirhosseini, M. Design and numerical investigation of Savonius wind turbine with discharge flow directing capability. Energy 2017, 130, 327–338. [Google Scholar] [CrossRef]
  28. Jeon, K.S.; Jeong, J.I.; Pan, J.-K.; Ryu, K.-W. Effects of end plates with various shapes and sizes on helical Savonius wind turbines. Renew. Energy 2015, 79, 167–176. [Google Scholar] [CrossRef]
  29. Moazam Sheikh, H.; Shabbir, Z.; Ahmed, H.; Waseem, M.H.; Sheikh, M.Z. Computational fluid dynamics analysis of a modified Savonius rotor and optimization using response surface methodology. Wind Eng. 2017, 41, 285–296. [Google Scholar] [CrossRef]
  30. Alit, I.B.; Andyani, I.A.S. Effect of Overlapping Ratio, Blade Shape Factor, and Blade Arc Angle to modified Rotor Savonius performances. Int. J. Appl. Eng. Res. 2018, 13, 411–416. [Google Scholar]
  31. Altan, B.D.; Atılgan, M. The use of a curtain design to increase the performance level of a Savonius wind rotors. Renew. Energy 2010, 35, 821–829. [Google Scholar] [CrossRef]
  32. Roy, S.; Saha, U.K. Wind tunnel experiments of a newly developed two-bladed Savonius-style wind turbine. Appl. Energy 2015, 137, 117–125. [Google Scholar] [CrossRef]
  33. Khan, N.S.; Usman, A.H.; Sohail, A.; Hussanan, A.; Shah, Q.; Ullah, N.; Kumam, P.; Thounthong, P.; Humphries, U.W. A Framework for the Magnetic Dipole Effect on the Thixotropic Nanofluid Flow Past a Continuous Curved Stretched Surface. Crystals 2021, 11, 645. [Google Scholar] [CrossRef]
  34. Khan, N.S.; Shah, Q.; Sohail, A.; Kumam, P.; Thounthong, P.; Muhammad, T. Mechanical aspects of Maxwell nanofluid in dynamic system with irreversible analysis. Z. Angew. Math. Mech. 2021, 101, e202000212. [Google Scholar] [CrossRef]
  35. Mandal, A.K.; Rana, K.B.; Tripathi, B. Experimental and Numerical Analysis on Small Scale Wind Turbines: A Review. Int. J. Appl. Eng. Res. 2018, 13, 97–111. [Google Scholar]
  36. Hosseinkhani, A.; Sanaye, S. Performance Prediction of a SANDIA 17-m Vertical Axis Wind Turbine Using Improved Double Multiple Streamtube. Int. J. Mech. Mechatron. Eng. 2020, 14, 655–659. [Google Scholar]
  37. Moghimi, M.; Motawej, H. Developed DMST model for performance analysis and parametric evaluation of Gorlov vertical axis wind turbines. Sustain. Energy Technol. Assess. 2020, 37, 100616. [Google Scholar] [CrossRef]
  38. Jin, X.; Zhao, G.; Gao, K.; Ju, W. Darrieus vertical axis wind turbine: Basic research methods. Renew. Sustain. Energy Rev. 2015, 42, 212–225. [Google Scholar] [CrossRef]
  39. Ranjbar, M.H.; Rafiei, B.; Nasrazadani, S.A.; Gharali, K.; Soltani, M.; Al-Haq, A.; Nathwani, J. Power Enhancement of a Vertical Axis Wind Turbine Equipped with an Improved Duct. Energies 2021, 14, 5780. [Google Scholar] [CrossRef]
  40. Mehrpooya, M.; Asadbeigi, M.; Ghafoorian, F.; Farajyar, S. Investigation and Optimization on Effective Parameters of a H-rotor Darrieus Wind Turbine, Using CFD Method. Iran. J. Chem. Chem. Eng. 2023; in press. [Google Scholar]
  41. Akhlagi, M.; Ghafoorian, F.; Mehrpooya, M.; Sharifi Rizi, M. Effective Parameters Optimization of a Small Scale Gorlov Wind Turbine, Using CFD Method. Iran. J. Chem. Chem. Eng. 2022, 36. [Google Scholar] [CrossRef]
  42. Chen, W.-H.; Carrera Uribe, M.; Kwon, E.E.; Lin, K.-Y.A.; Park, Y.-K.; Ding, L.; Saw, L.H. A comprehensive review of thermoelectric generation optimization by statistical approach: Taguchi method, analysis of variance (ANOVA), and response surface methodology (RSM). Renew. Sustain. Energy Rev. 2022, 169, 112917. [Google Scholar] [CrossRef]
  43. Sun, H.; Zhu, J.; Zhang, B.; Liu, C.; Miao, C.; Wang, K.; Zhao, X. Optimization of Laser-MAG Hybrid Welding Parameters of Ship Steel Based on Response Surface Methodology. Materials 2022, 15, 4328. [Google Scholar] [CrossRef]
  44. Icaza-Alvarez, D.; Jurado, F.; Tostado-Véliz, M.; Arevalo, P. Design to include a wind turbine and socio-techno-economic analysis of an isolated airplane-type organic building based on a photovoltaic/hydrokinetic/battery. Energy Convers. Manag. X 2022, 14, 100202. [Google Scholar] [CrossRef]
  45. Asadbeigi, M.; Ghafoorian, F.; Mehrpooya, M.; Chegini, S.; Jarrahian, A. A 3D Study of the Darrieus Wind Turbine with Auxiliary Blades and Economic Analysis Based on an Optimal Design from a Parametric Investigation. Sustainability 2023, 15, 4684. [Google Scholar] [CrossRef]
  46. Siddiqui, M.S.; Rasheed, A.; Kvamsdal, T.; Tabib, M. Effect of Turbulence Intensity on the Performance of an Offshore Vertical Axis Wind Turbine. Energy Procedia 2015, 80, 312–320. [Google Scholar] [CrossRef] [Green Version]
  47. Stergiannis, N.; Lacor, C.; Beeck, J.V.; Donnelly, R. CFD modelling approaches against single wind turbine wake measurements using RANS. J. Phys. Conf. Ser. 2016, 753, 032062. [Google Scholar] [CrossRef]
  48. Liamis, N.; Lebert, Y. Implementation of a low Reynolds k-epsilon turbulence model in a 3D Navier-Stokes solver for turbomachinery flows. In Proceedings of the 31st Joint Propulsion Conference and Exhibit, San Diego, CA, USA, 10–12 July 1995. [Google Scholar]
  49. Nichols, R.H. Turbulence Models and Their Application to Complex Flows; University of Alabama at Birmingham: Birmingham, UK, 2010; p. 214. [Google Scholar]
  50. Mehrpooya, M.; Mohammadi, M.; Ahmadi, E. Techno-economic-environmental study of hybrid power supply system: A case study in Iran. Sustain. Energy Technol. Assess. 2018, 25, 1–10. [Google Scholar] [CrossRef]
  51. Mousavi, S.A.; Mehrpooya, M.; Rad, M.A.V.; Jahangir, M.H. A new decision-making process by integration of exergy analysis and techno-economic optimization tool for the evaluation of hybrid renewable systems. Sustain. Energy Technol. Assess. 2021, 45, 101196. [Google Scholar] [CrossRef]
  52. Oulis Rousis, A.; Tzelepis, D.; Konstantelos, I.; Booth, C.; Strbac, G. Design of a Hybrid AC/DC Microgrid Using HOMER Pro: Case Study on an Islanded Residential Application. Inventions 2018, 3, 55. [Google Scholar] [CrossRef] [Green Version]
  53. Tizpar, A.; Satkin, M.; Roshan, M.B.; Armoudli, Y. Wind resource assessment and wind power potential of Mil-E Nader region in Sistan and Baluchestan Province, Iran—Part 1: Annual energy estimation. Energy Convers. Manag. 2014, 79, 273–280. [Google Scholar] [CrossRef]
Figure 1. Schematic of a Savonius VAWT.
Sustainability 15 05318 g001
Figure 2. (a) Rotor mesh, (b) Blade boundary layer mesh.
Sustainability 15 05318 g002
Figure 3. Cp values of CFD simulation compared to the experimental study results.
Sustainability 15 05318 g003
Figure 4. (a) Cp values for different blade numbers; (b) Torque plot for different blade numbers at TSR = 0.23.
Sustainability 15 05318 g004
Figure 5. Velocity and pressure contour plots for rotors with different blade numbers at TSR = 0.23.
Sustainability 15 05318 g005
Figure 6. (a) Cp values for different overlap ratios; (b) Torque plot for different overlap ratios at TSR 0.23.
Sustainability 15 05318 g006
Figure 7. Velocity and pressure contour plots for rotors with different overlap ratio values at TSR = 0.23.
Sustainability 15 05318 g007
Figure 8. (a) Cp values for different spacing sizes; (b) Torque plot for different spacing sizes at TSR 0.23.
Sustainability 15 05318 g008
Figure 9. Velocity and pressure contour plots for rotors with varying spacing size at TSR = 0.23.
Sustainability 15 05318 g009
Figure 10. (a) Cp values for different arc angles; (b) Torque plot for different arc angles at TSR = 0.23.
Sustainability 15 05318 g010
Figure 11. Velocity and pressure contour plots for rotors with varying arc angle values at TSR = 0.23.
Sustainability 15 05318 g011
Figure 12. Schematic of the rotor with arms.
Sustainability 15 05318 g012
Figure 13. (a) Cp values for different shape factors; (b) Torque plot for different shape factors at TSR = 0.23.
Sustainability 15 05318 g013
Figure 14. Velocity and pressure contour plots for rotors with the different shape factor values at TSR = 0.23.
Sustainability 15 05318 g014
Figure 15. Schematic of curtain.
Sustainability 15 05318 g015
Figure 16. (a) Cp values for different curtain configurations; (b) Torque plot for different curtain configurations at TSR = 0.23.
Sustainability 15 05318 g016aSustainability 15 05318 g016b
Figure 17. Velocity and pressure contour plots for rotors with the different curtain configurations at TSR = 0.23.
Sustainability 15 05318 g017
Figure 18. (a) Cp for different inlet wind velocity values; (b) Torque plot different inlet wind velocity values at TSR = 0.23.
Sustainability 15 05318 g018
Figure 19. Velocity and pressure contour plots for rotors with the different inlet wind velocity values at TSR = 0.23.
Sustainability 15 05318 g019
Figure 20. Multi-bucket rotor with different configurations.
Sustainability 15 05318 g020
Figure 21. (a) Cp values for different multi-bucket rotor with varying inner are angles and Δ = 0.01. (b) Cp values for different multi-bucket rotor with varying inner are angles and Δ = 0.005 (m). (c) Torque plot for different multi-bucket rotor with varying inner are angles and Δ = 0.01 (m). (d) Torque plot for different multi-bucket rotor with varying inner arc angles and Δ = 0.005 (m).
Sustainability 15 05318 g021aSustainability 15 05318 g021b
Figure 22. (a) Velocity and pressure contour plots for rotors with varying inner arc angles and Δ = 0.01 (m) at TSR = 0.23; (b) Velocity and pressure contour plots for rotors with varying inner arc angles and Δ = 0.005 (m) at TSR = 0.23.
Sustainability 15 05318 g022
Figure 23. Cp based on TSR and different (a) overlap ratio values, (b) spacing size values, (c) arc angle values, (d) shape factor values, (e) inlet velocity values, and (f) number of blades.
Sustainability 15 05318 g023
Figure 24. Local sensitivity.
Sustainability 15 05318 g024
Figure 25. The schematic of power supply system.
Sustainability 15 05318 g025
Figure 26. Monthly load profiles.
Sustainability 15 05318 g026
Figure 27. Average daily radiation kWh/m2/day.
Sustainability 15 05318 g027
Figure 28. Average wind speed.
Sustainability 15 05318 g028
Figure 29. Output power of wind turbine.
Sustainability 15 05318 g029
Figure 30. Cost summary of power supply system.
Sustainability 15 05318 g030
Figure 31. Cost summary of the power supply system.
Sustainability 15 05318 g031
Table 1. Dimensions and main geometric characteristics of the simulated turbine rotor and stator.
QuantityValue
1Number of blades2
2Bucket diameter0.2 (m)
3Spacing size0 (m)
4Overlap size 0.03 (m)
5Blade thickness0.002 (m)
6Rotor diameter0.37 (m)
7Height of blade0.37 (m)
8Length of stator6 (m)
9Width of stator2 (m)
10Height of stator2 (m)
Table 2. Constants of model k-ω [49].
C μ σ k σ ω β * β γ
0.90.50.50.090.0720.52
Table 3. Grid independence analysis.
CaseCp Value
1Case 10.049
2Case 20.046
3Case 30.043
Table 4. Dimensions of the curtain.
Curtain ConfigurationLength of l1 (cm)Length of l2 (cm)Height (cm)Thickness (mm)A (Degrees)B (Degrees)
Curtain 145523224515
Curtain 234393224515
Curtain 322263224515
Table 5. Net present costs.
ComponentCapital (IRR)O&M (IRR)Replacement (IRR)Salvage (IRR)Total (IRR)
Savonius VAWT16,000,000 24,972,7030.00−5,920,97735,051,726
Battery10,000,0000.000.000.0010,000,000
Converter68,050 106,2110.00−16,788157,473
System26,068,050 25,078,9140.00−5,937,76545,209,198
Table 6. Optimization results for Savonius VAWT system.
QuantityValueUnits
Total production181kWh/yr
Hours of Operation8055hr/yr
Capacity shortage35.8kWh/yr
Renewable fraction100%
CO2 Emission0kg/yr
Table 7. Net present costs.
ComponentCapital (IRR)O&M (IRR)Replacement (IRR)Salvage (IRR)Total (IRR)
Solar panel25,000,00012,486,3510.00−8,881,46628,604,856
Savonius VAWT8,000,000 12,486,3510.00−2,960,48917,525,683
Battery10,000,0000.000.000.0010,000,000
Converter59,301 92,5570.00−14,630137,229
System43,059,301 25,065,2600.00−11,856,58456,267,977
Table 8. Optimization results for Savonius VAWT system.
QuantityValueUnits
Total production of VAWT90.4kWh/yr
Hours of Operation of VAWT8055hr/yr
Total production of PV270kWh/yr
Hours of Operation of PV4374hr/yr
Capacity shortage35.5kWh/yr
Renewable fraction100%
CO2 Emission0kg/yr
Disclaimer/Publisher’s Note: The statements, opinions and data contained in all publications are solely those of the individual author(s) and contributor(s) and not of MDPI and/or the editor(s). MDPI and/or the editor(s) disclaim responsibility for any injury to people or property resulting from any ideas, methods, instructions or products referred to in the content.

