
Forecasting of Groundwater Quality by Using Deep Learning Time Series Techniques in an Arid Region
 ,
,  ,
,
Abstract
:1. Introduction
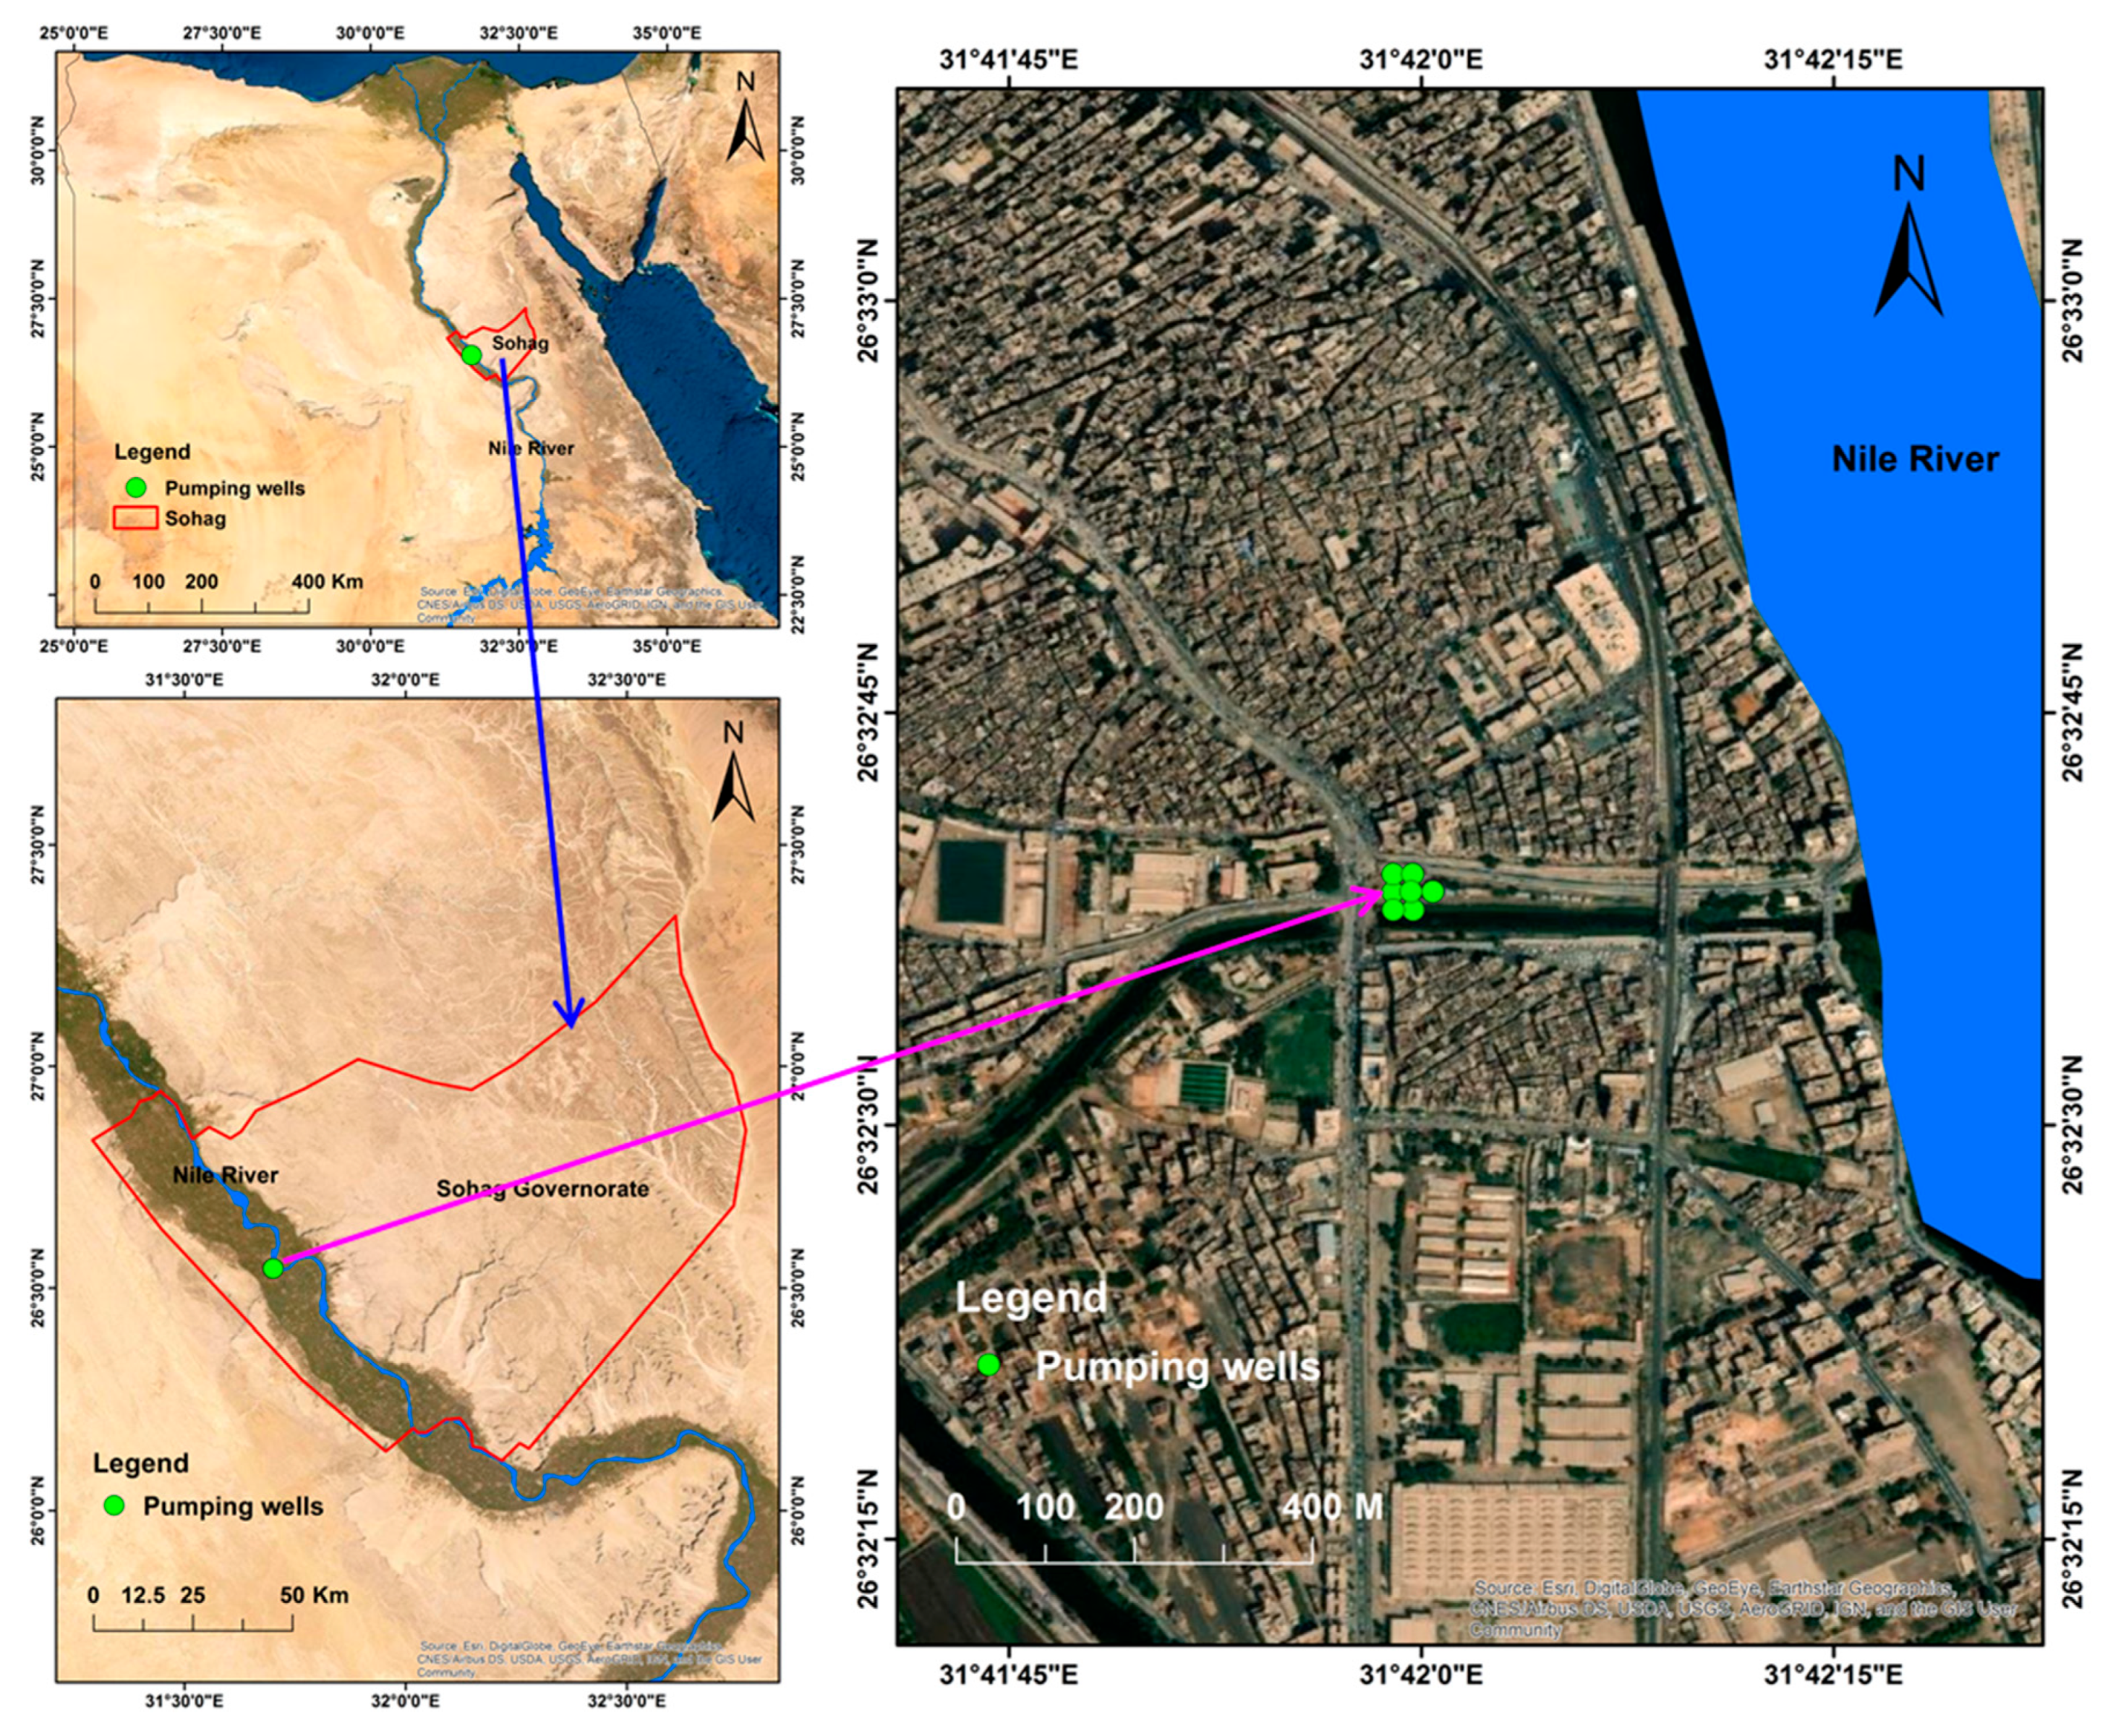
2. Study Area Description
3. Materials and Methods
3.1. Analysis of Collected Samples
3.2. Water Quality Index (WQI) Calculation
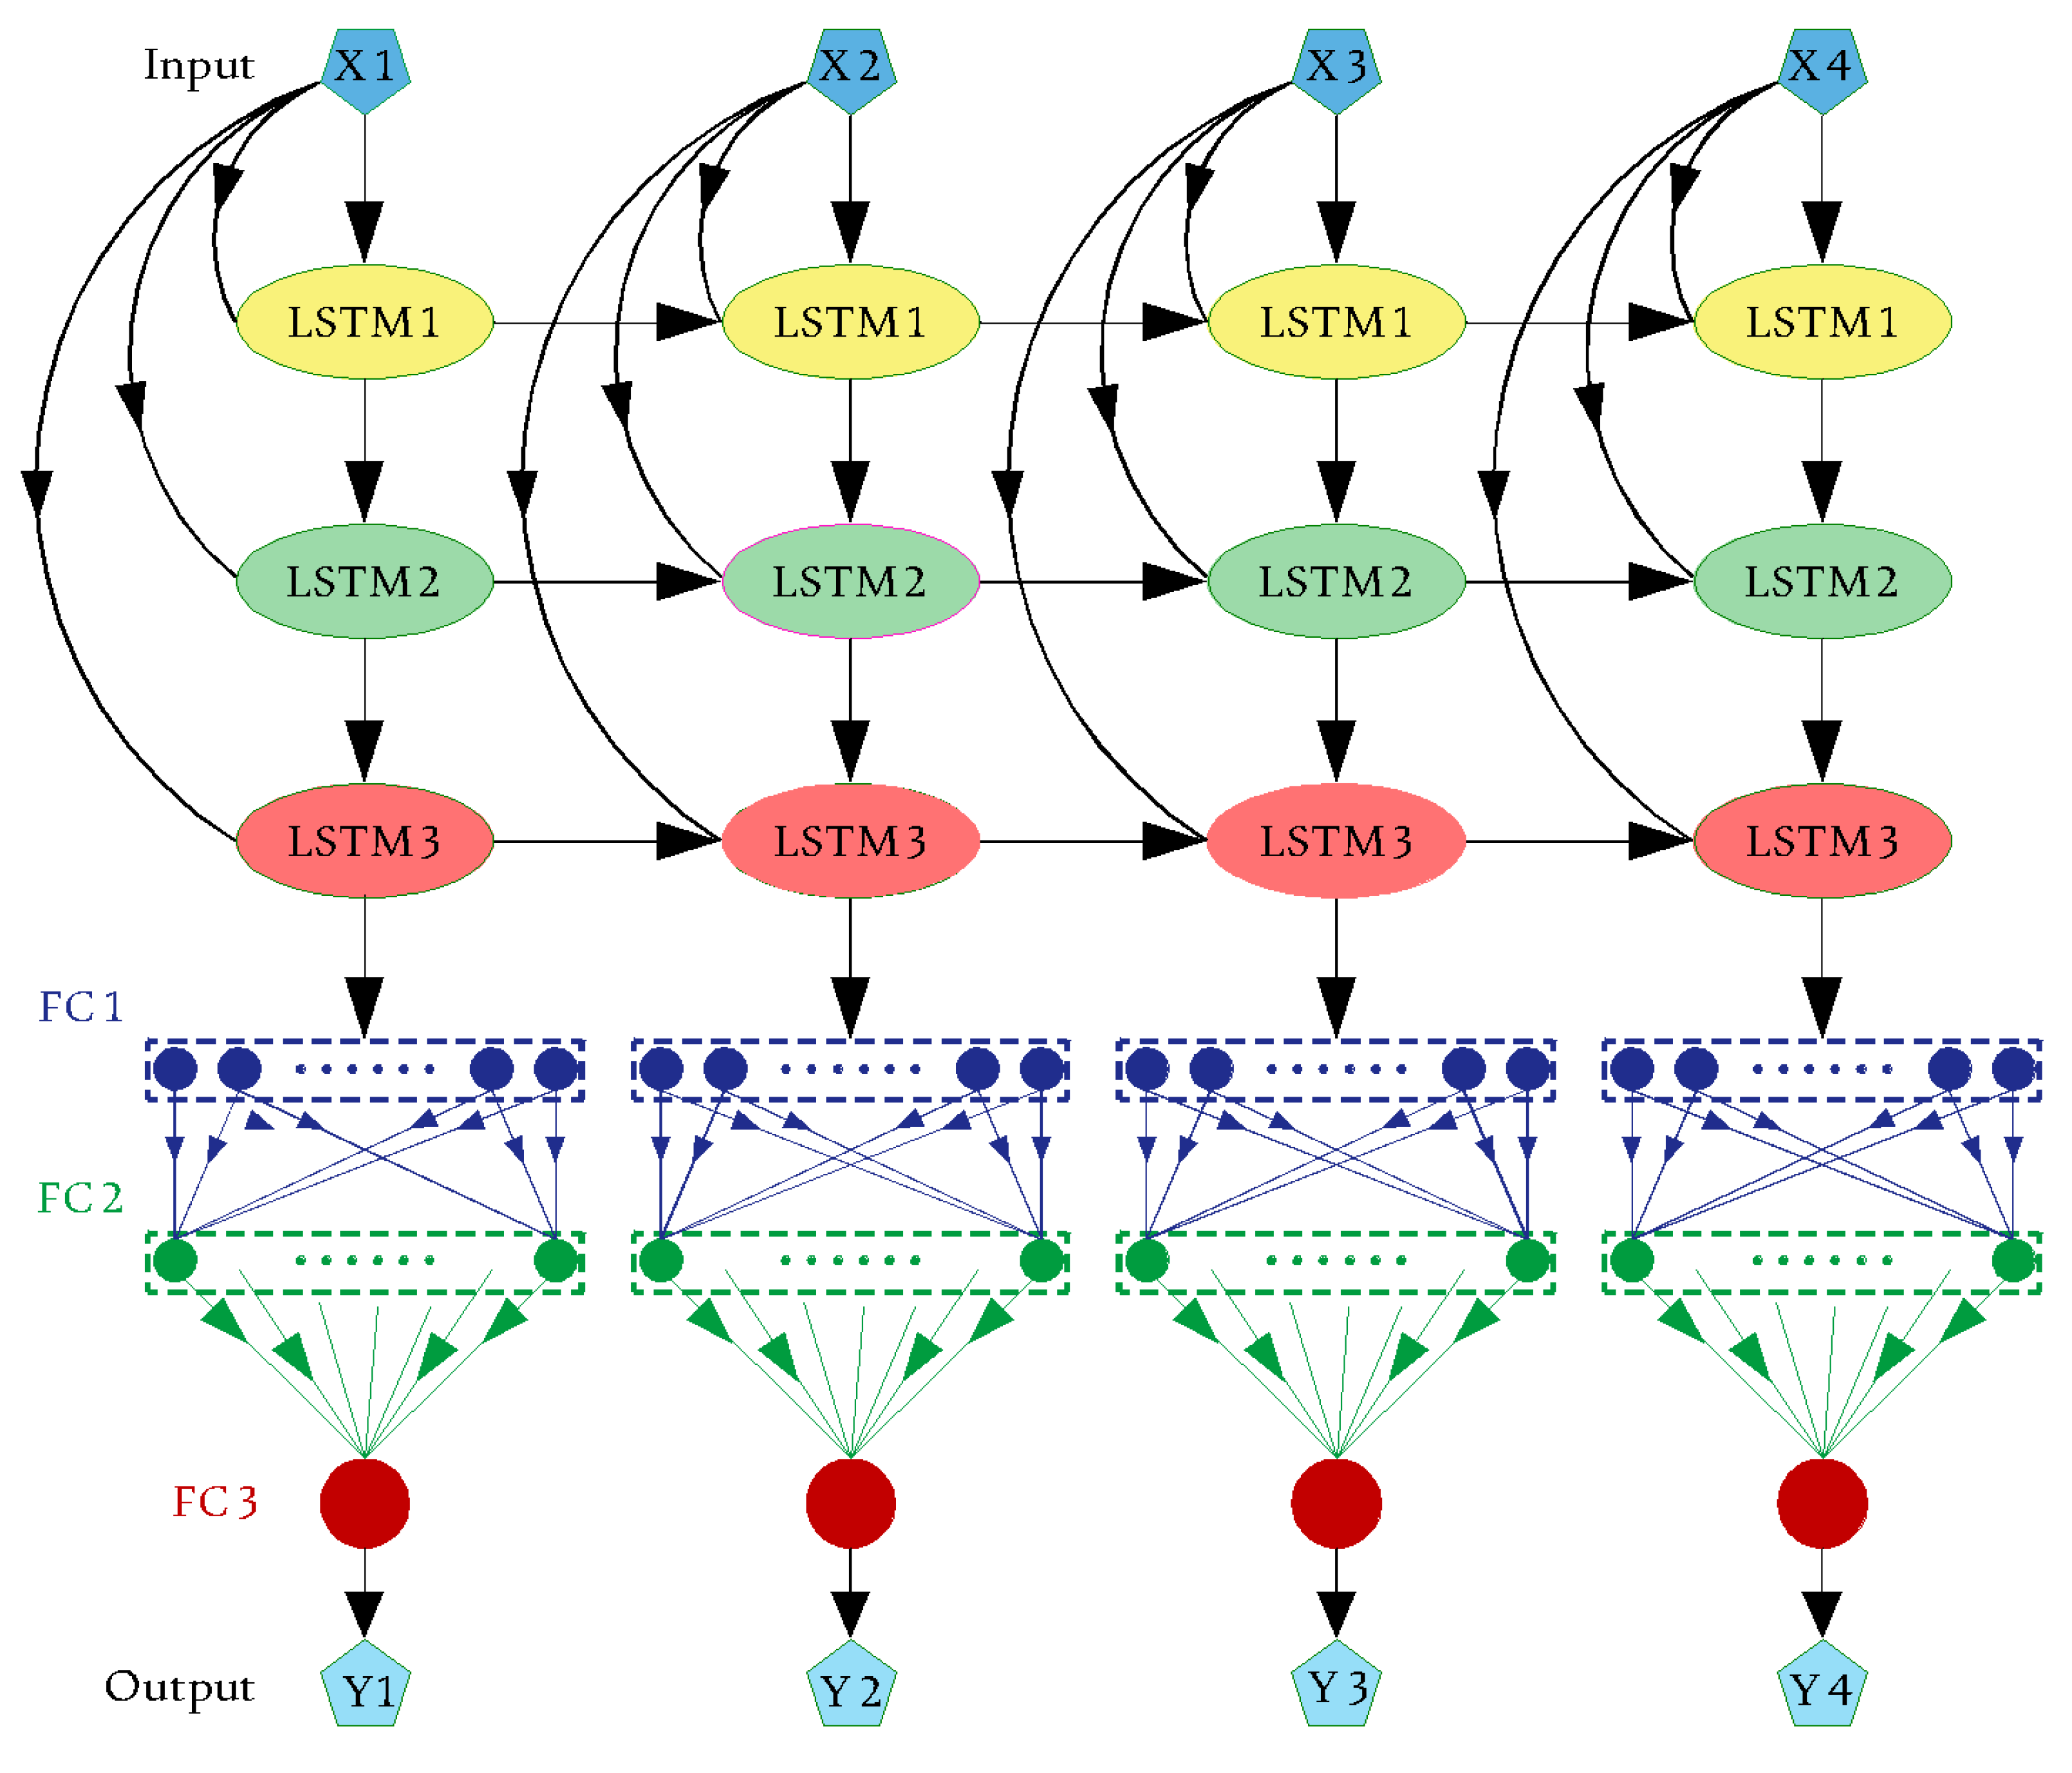
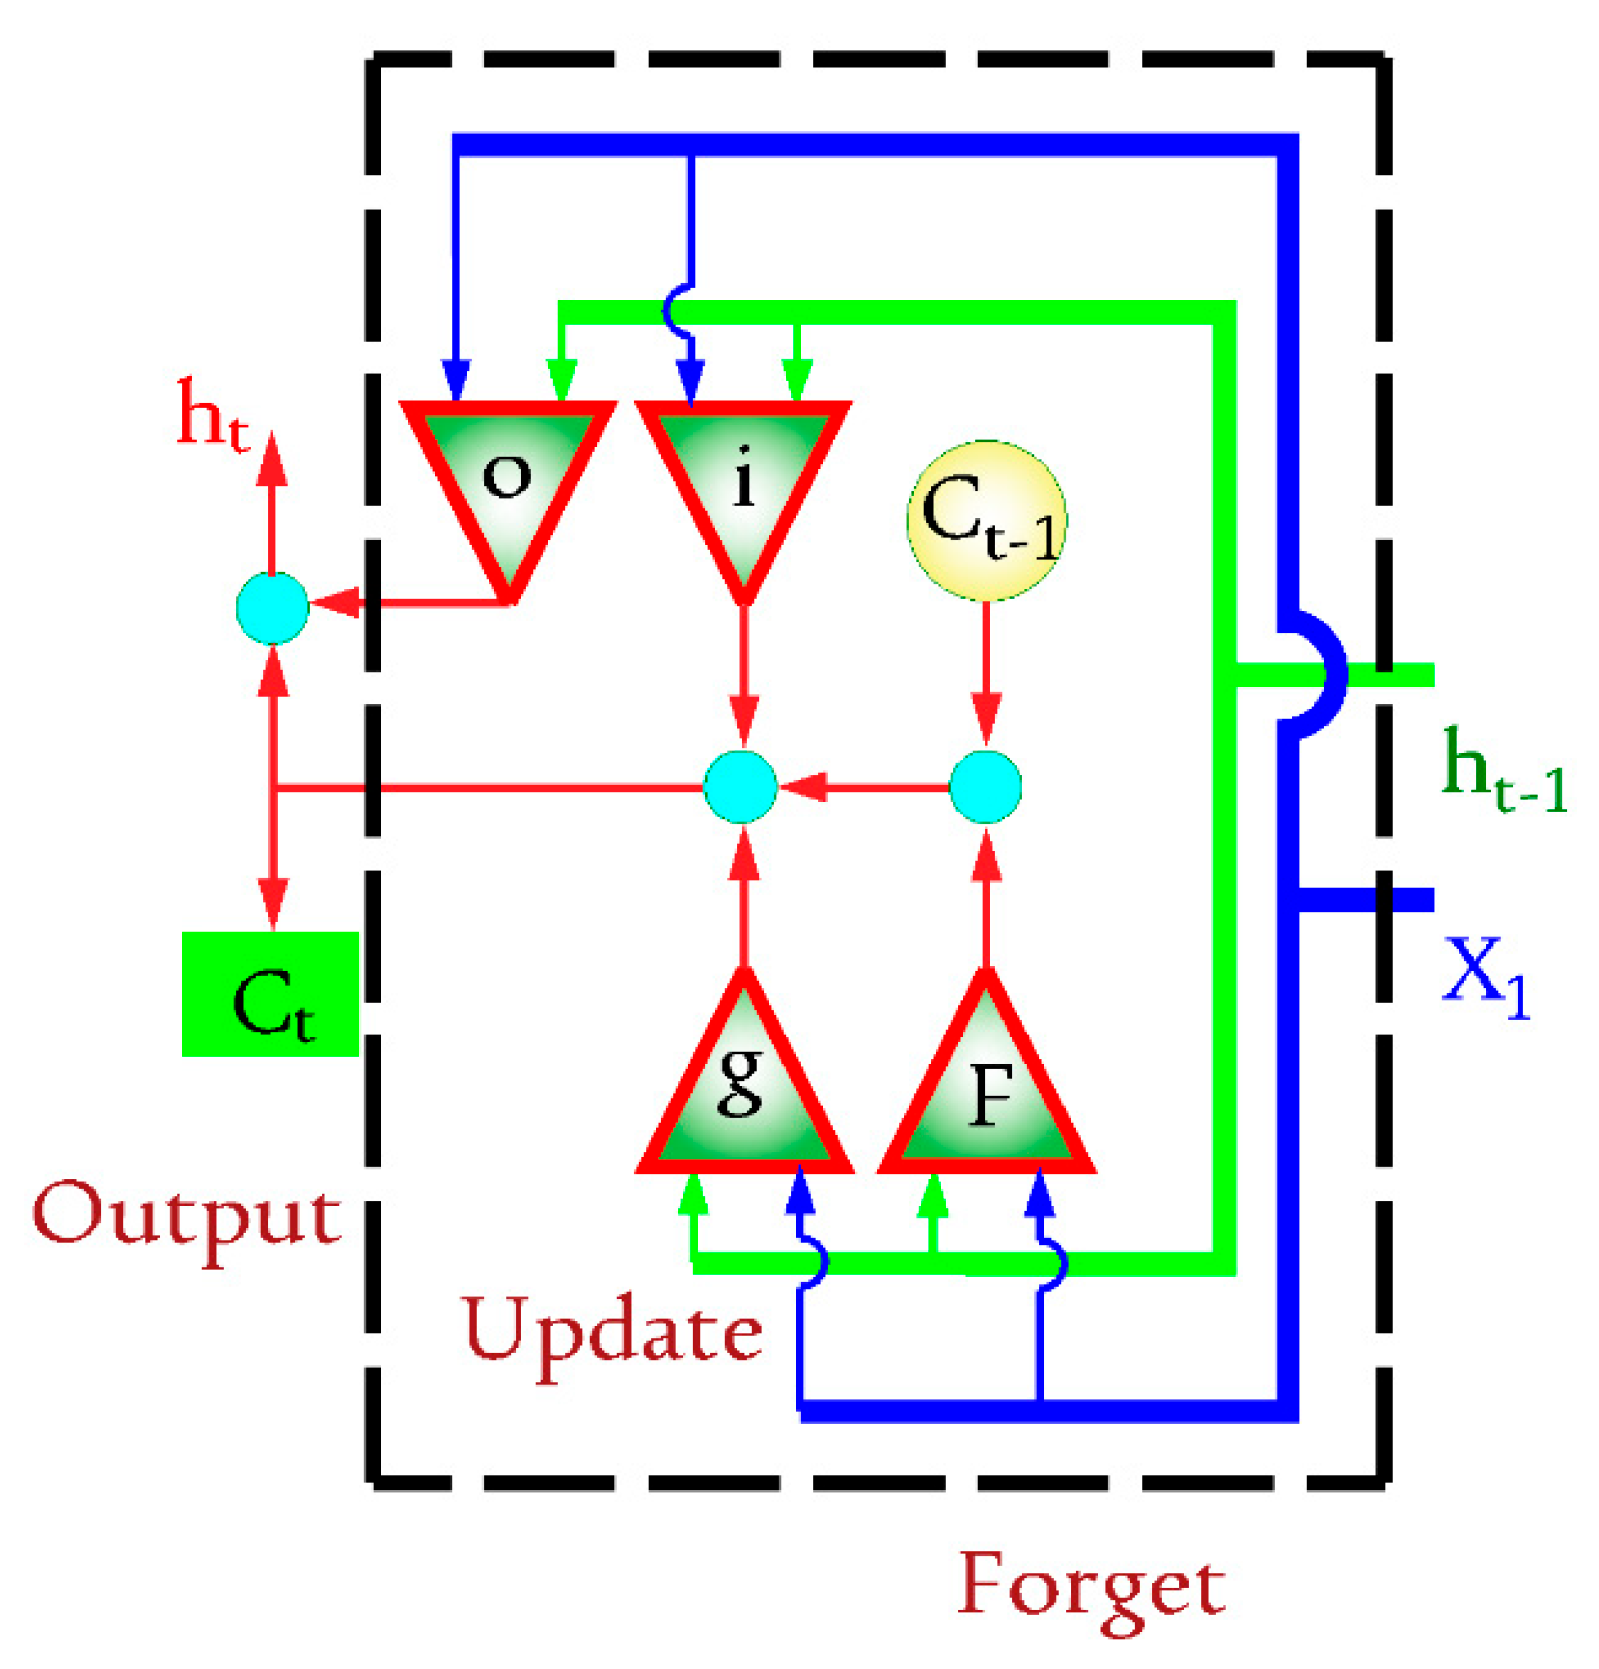
3.3. Deep Learning Time Series Techniques
4. Results and Discussion
4.1. Statistical Analysis and Water Quality Index
4.2. Forecasting Model Results
5. Conclusions
Author Contributions
Funding
Institutional Review Board Statement
Informed Consent Statement
Data Availability Statement
Acknowledgments
Conflicts of Interest
References
- Luo, P.; Sun, Y.; Wang, S.; Wang, S.; Lyu, J.; Zhou, M.; Nakagami, K.; Takara, K.; Nover, D. Historical assessment and future sustainability challenges of Egyptian water resources management. J. Clean. Prod. 2020, 263, 121154. [Google Scholar] [CrossRef]
- El-Rawy, M.; Abdalla, F.; El Alfy, M. Water Resources in Egypt. In The Geology of Egypt. Regional Geology Reviews; Hamimi, Z., El-Barkooky, A., Martínez Frías, J., Fritz, H., Abd El-Rahman, Y., Eds.; Springer: Cham, Switzerland, 2020; pp. 687–711. [Google Scholar] [CrossRef]
- Salman, S.A.; Arauzo, M.; Elnazer, A.A. Groundwater quality and vulnerability assessment in west Luxor Governorate, Egypt. Groundw. Sustain. Dev. 2019, 8, 271–280. [Google Scholar] [CrossRef]
- El-Rawy, M.; Makhloof, A.A.; Hashem, M.D.; Eltarabily, M.G. Groundwater management of quaternary aquifer of the Nile Valley under different recharge and discharge scenarios: A case study Assiut Governorate, Egypt. Ain Shams Eng. J. 2021, 12, 2563–2574. [Google Scholar] [CrossRef]
- Abdella Ahmed, A.K.; Ibraheem, A.M.; Abd-Ellah, M.K. Forecasting of municipal solid waste multi-classification by using time-series deep learning depending on the living standard. Results Eng. 2022, 16, 100655. [Google Scholar] [CrossRef]
- Gautam, A.; Rai, S.C.; Rai, S.P.; Ram, K. Impact of anthropogenic and geological factors on groundwater hydrochemistry in the unconfined aquifers of Indo-Gangetic plain. Phys. Chem. Earth Parts A/B/C 2022, 127, 103109. [Google Scholar] [CrossRef]
- Rakib, M.A.; Quraishi, S.B.; Newaz, M.A.; Sultana, J.; Bodrud-Doza, M.; Rahman, M.A.; Patwary, M.A.; Bhuiyan, M.A.H. Groundwater quality and human health risk assessment in selected coastal and floodplain areas of Bangladesh. J. Contam. Hydrol. 2022, 249, 104041. [Google Scholar] [CrossRef]
- Foster, S.; Gogu, R. Groundwater Assessment and Management for Sustainable Water-Supply and Coordinated Subsurface Drainage: A Guidebook for Water Utilities & Municipal Authorities; IWA Publishing: London, UK, 2022; p. 50. Available online: https://library.oapen.org/handle/20.500.12657/57565 (accessed on 15 January 2023).
- Ha, K.; Lee, E.; An, H.; Kim, S.; Park, C.; Kim, G.-B.; Ko, K.-S. Evaluation of Seasonal Groundwater Quality Changes Associated with Groundwater Pumping and Level Fluctuations in an Agricultural Area, Korea. Water 2021, 13, 51. [Google Scholar] [CrossRef]
- World Health Organization. Guidelines for Drinking Water Quality: Incorporating the First and Second Addenda. 2022. Available online: https://creativecommons.org/licenses/by-nc-sa/3.0/igo (accessed on 15 January 2023).
- Balamurugan, P.; Kumar, P.S.; Shankar, K. Dataset on the suitability of groundwater for drinking and irrigation purposes in the Sarabanga River region, Tamil Nadu, India. Data Brief 2020, 29, 105255. [Google Scholar] [CrossRef]
- Balamurugan, P.; Kumar, P.S.; Shankar, K.; Nagavinothini, R.; Vijayasurya, K. Non-carcinogenic risk assessment of groundwater in southern part of Salem district in Tamilnadu, India. J. Chil. Chem. Soc. 2020, 65, 4697–4707. [Google Scholar] [CrossRef]
- El-Rawy, M.; Ismail, E.; Abdalla, O. Assessment of groundwater quality using GIS, hydrogeochemistry, and factor statistical analysis in Qena Governorate, Egypt. Desalin. Water Treat. 2019, 162, 14–29. [Google Scholar] [CrossRef]
- Kadri, A.; Baouia, K.; Kateb, S.; Al-Ansari, N.; Kouadri, S.; Najm, H.M.; Mashaan, N.S.; Eldirderi, M.M.A.; Khedher, K.M. Assessment of Groundwater Suitability for Agricultural Purposes: A Case Study of South Oued Righ Region, Algeria. Sustainability 2022, 14, 8858. [Google Scholar] [CrossRef]
- Ismail, E.; El-Rawy, M.; Mauritsch, H. Evaluation of Groundwater Potential Zones Using Electrical Resistivity and Hydrogeochemistry in West Tahta Region, Upper Egypt. In Sustainability of Groundwater in the Nile Valley, Egypt; Earth and Environmental Sciences Library; Negm, A.M., El-Rawy, M., Eds.; Springer: Cham, Switzerland, 2022. [Google Scholar] [CrossRef]
- Ramadan, E.M.; Badr, A.M.; Abdelradi, F.; Negm, A.; Nosair, A.M. Detection of Groundwater Quality Changes in Minia Governorate, West Nile River. Sustainability 2023, 15, 4076. [Google Scholar] [CrossRef]
- Negm, A.M.; Armanuos, A.M. GIS-based spatial distribution of groundwater quality in the Western Nile Delta, Egypt. In The Nile Delta; Springer: Cham, Switzerland, 2017; pp. 89–119. [Google Scholar] [CrossRef]
- El Bilali, A.; Taleb, A.; Brouziyne, Y. Groundwater quality forecasting using machine learning algorithms for irrigation purposes. Agric. Water Manag. 2021, 245, 106625. [Google Scholar] [CrossRef]
- Hanoon, M.S.; Ammar, A.M.; Ahmed, A.N.; Razzaq, A.; Birima, A.H.; Kumar, P.; Sherif, M.; Sefelnasr, A.; El-Shafie, A. Application of soft computing in predicting groundwater quality parameters. Front. Environ. Sci. 2022, 10, 828251. [Google Scholar] [CrossRef]
- Kouadri, S.; Pande, C.B.; Panneerselvam, B.; Moharir, K.N.; Elbeltagi, A. Prediction of irrigation groundwater quality parameters using ANN, LSTM, and MLR models. Environ. Sci. Pollut. Res. 2021, 29, 21067–21091. [Google Scholar] [CrossRef]
- El Yousfi, Y.; Himi, M.; El Ouarghi, H.; Aqnouy, M.; Benyoussef, S.; Gueddari, H.; Ait Hmeid, H.; Alitane, A.; Chaibi, M.; Zahid, M.; et al. Assessment and Prediction of the Water Quality Index for the Groundwater of the Ghiss-Nekkor (Al Hoceima, Northeastern Morocco). Sustainability 2023, 15, 402. [Google Scholar] [CrossRef]
- Molla, M.H.; Chowdhury, M.A.T.; Bhuiyan, M.H.R.; Das, S.; Morshed, A.J.M.; Das, J.; Islam, S. Seasonal variation of drinking water quality in urban water bodies (UWBs) of Chittagong Metropolitan City, Bangladesh: Implications of higher water quality index (WQI) for the urban environment. Water Supply 2022, 22, 4934–4950. [Google Scholar] [CrossRef]
- Paul, V.; Ramesh, R.; Sreeja, P.; Jarin, T.; Kumar, P.S.; Ansar, S.; Ashraf, G.A.; Pandey, S.; Said, Z. Hybridization of long short-term memory with Sparrow Search Optimization model for water quality index prediction. Chemosphere 2022, 307, 135762. [Google Scholar] [CrossRef]
- Villada-Canela, M.; Muñoz-Pizza, D.M.; García-Searcy, V.; Camacho-López, R.; Daesslé, L.W.; Mendoza-Espinosa, L. Public Participation for Integrated Groundwater Management: The Case of Maneadero Valley, Baja California, Mexico. Water 2021, 13, 2326. [Google Scholar] [CrossRef]
- Guerrero, J.; Mahmoud, A.; Alam, T.; Sanchez, A.; Jones, K.D.; Ernest, A. Collaborative Environmental Approach for Development of the Lower Laguna Madre Estuary Program Strategic Plan in South Texas. J. Environ. Inform. Lett. 2022, 7, 1–11. [Google Scholar] [CrossRef]
- Liu, C.W.; Lin, K.H.; Kuo, Y.M. Application of factor analysis in the assessment of groundwater quality in a blackfoot disease area in Taiwan. Sci. Total Environ. 2003, 313, 77–89. [Google Scholar] [CrossRef] [PubMed]
- Said, R. The Nile in Egypt. The Geological Evolution of the River Nile; Springer: New York, NY, USA, 1981; pp. 12–92. [Google Scholar] [CrossRef]
- Seif, E.S.S.A. Geological evolution of Nile Valley, west Sohag, Upper Egypt: A geotechnical perception. Arab. J. Geosci. 2015, 8, 11049–11072. [Google Scholar] [CrossRef]
- Ali, M.H.; Mustafa, A.R.A.; El-Sheikh, A.A. Geochemistry and spatial distribution of selected heavy metals in surface soil of Sohag, Egypt: A multivariate statistical and GIS approach. Environ. Earth Sci. 2016, 75, 1257. [Google Scholar] [CrossRef]
- Omran, A. Integration of remote sensing, geophysics and GIS to evaluate groundwater potentiality—A case study in Sohag Region, Egypt. In Proceedings of the 3rd International Conference on Water Resources and Arid Environments and the 1st Arab Water Forum, Riyadh, Saudi Arabia, 16–19 November 2008; Available online: https://icwrae-psipw.org/papers/2008/Tech/10.pdf (accessed on 20 January 2023).
- Lenore, S.C.; Arnold, E.G.; Andrew, D.E.; Mary, A.H. Standard Methods for the Examination of Water and Wastewater, 20th ed.; American Public Health Association: Washington, DC, USA; American Water Works Association: Washington, DC, USA; World Environment Federation: Washington, DC, USA, 1998. [Google Scholar]
- Gautam, S.P.; Reeta, K.; Suniti, P.; Basu, D.D.; Kamyotra, J.S. Guide Manual: Water and Wastewater Analysis; Central Pollution Control Board, Ministry of Environment & Forests, Government of India: New Delhi, India, 2011.
- Maiti, S.K. Handbook of Methods in Environmental Studies; ABD Publishers: Jaipur, India, 2003; Volume 2, pp. 110–121. [Google Scholar]
- Horton, R.K. An index number system for rating water quality. J. Water Pollut. Control Fed. 1965, 37, 300–306. [Google Scholar]
- Ramakrishnaiah, C.R.; Sadashivaiah, C.; Ranganna, G. Assessment of water quality index for the groundwater in Tumkur Taluk, Karnataka State, India. E-J. Chem. 2009, 6, 523–530. [Google Scholar] [CrossRef] [Green Version]
- Maiti, S.K. Handbook of Methods in Environmental Studies, Volume 1 (Water and Wastewater Analysis); Oxford Book Company: Oxford, UK, 2016. [Google Scholar]
- Abdel-Gawad, S. Actualizing the right to water: An Egyptian perspective for an action plan. Int. J. Water Resour. Develop. 2007, 23, 341–354. [Google Scholar] [CrossRef]
- Ram, A.; Tiwari, S.K.; Pandey, H.K.; Chaurasia, A.K.; Singh, S.; Singh, Y.V. Groundwater quality assessment using water quality index (WQI) under GIS framework. Appl. Water Sci. 2021, 11, 46. [Google Scholar] [CrossRef]
- Dandge, K.P.; Patil, S.S. Spatial distribution of ground water quality index using remote sensing and GIS techniques. Appl. Water Sci. 2022, 12, 7. [Google Scholar] [CrossRef]
- Panneerselvam, B.; Muniraj, K.; Duraisamy, K.; Pande, C.; Karuppannan, S.; Thomas, M. An integrated approach to explore the suitability of nitrate-contaminated groundwater for drinking purposes in a semiarid region of India. Environ. Geochem. Health 2022, 45, 647–663. [Google Scholar] [CrossRef]
- Wurts, W.A.; Durborow, R.M. Interactions of pH, Carbon Dioxide, Alkalinity and Hardness in Fish Ponds. SRAC Publication No. 464. 1992, pp. 1–4. Available online: https://lee-phillips.org/Backyard/cache/464fs.pdf (accessed on 20 January 2023).
- Sadat-Noori, S.M.; Ebrahimi, K.; Liaghat, A.M. Groundwater quality assessment using the Water Quality Index and GIS in Saveh-Nobaran aquifer, Iran. Environ. Earth Sci. 2014, 71, 3827–3843. [Google Scholar] [CrossRef]
- Safar, Z.; Chassagne, C.; Rijnsburger, S.; Sanz, M.I.; Manning, A.J.; Souza, A.J.; van Kessel, T.; Horner-Devine, A.; Flores, R.; McKeon, M.; et al. Characterization and classification of estuarine suspended particles based on their inorganic/organic matter composition. Front. Mar. Sci. 2022, 9, 896163. [Google Scholar] [CrossRef]
- World Health Organization. Guidelines for Drinking-Water Quality. Incorporating the First Addendum; World Health Organization: Geneva, Switzerland, 2017. Available online: https://apps.who.int/iris/bitstream/handle/10665/254636/9789241550017-eng.pdf (accessed on 20 January 2023).
- Rodriguez-Alvarez, M.S.; Gutiérrez-López, A.; Iribarnegaray, M.A.; Weir, M.H.; Seghezzo, L. Long-Term Assessment of a Water Safety Plan (WSP) in Salta, Argentina. Water 2022, 14, 2948. [Google Scholar] [CrossRef]
- Liyanage, D.N.D.; Diyabalanage, S.; Dunuweera, S.P.; Rajapakse, S.; Rajapakse, R.M.G.; Chandrajith, R. Significance of Mg-hardness and fluoride in drinking water on chronic kidney disease of unknown etiology in Monaragala, Sri Lanka. Environ. Res. 2022, 203, 111779. [Google Scholar] [CrossRef]
- Chakraborty, T.K.; Ghosh, G.C.; Ghosh, P.; Jahan, I.; Zaman, S.; Islam, M.S.; Hossain, M.R.; Habib, A.; Biswas, B.; Sultana, N.; et al. Arsenic, iron, and manganese in groundwater and its associated human health risk assessment in the rural area of Jashore, Bangladesh. J. Water Health 2022, 20, 888–902. [Google Scholar] [CrossRef]
- Desye, B.; Belete, B.; Asfaw Gebrezgi, Z.; Terefe Reda, T. Efficiency of treatment plant and drinking water quality assessment from source to household, gondar city, Northwest Ethiopia. J. Environ. Public Health 2021, 2021, 9974064. [Google Scholar] [CrossRef]
- Inglezakis, V.J.; Doula, M.K.; Aggelatou, V.; Zorpas, A.A. Removal of iron and manganese from underground water by use of natural minerals in batch mode treatment. Desalin. Water Treat. 2010, 18, 341–346. [Google Scholar] [CrossRef]
- Abdella, A.K.; Abdel-Aa, M.H. Iron Removal from Ground Water through Expanded Polystyrene Filter. J. Environ. Treat. Tech. 2021, 9, 657–666. [Google Scholar]
- Li, X.; Zhang, Y.; Wu, T.; Sun, X.; Yang, T.; Wang, L.; Li, X.; Wang, J.; Wang, Y.; Yu, H. Major ions in drinking and surface waters from five cities in arid and semi-arid areas, NW China: Spatial occurrence, water chemistry, and potential anthropogenic inputs. Environ. Sci. Poll. Res. 2020, 27, 5456–5468. [Google Scholar] [CrossRef]
- National Research Council. Nitrate and Nitrite in Drinking Water; National Academies Press: Hoboken, NJ, USA, 1995. [Google Scholar]
- Wang, S.; Wei, S.; Liang, H.; Zheng, W.; Li, X.; Hu, C.; Currell, M.J.; Zhou, F.; Min, L. Nitrogen stock and leaching rates in a thick vadose zone below areas of long-term nitrogen fertilizer application in the North China Plain: A future groundwater quality threat. J. Hydro. 2019, 576, 28–40. [Google Scholar] [CrossRef]
- Sobhanardakani, S.; Taghavi, L.; Shahmoradi, B.; Jahangard, A. Groundwater quality assessment using the water quality pollution indices in Toyserkan Plain. Environ. Health Eng. Manag. 2017, 4, 21–27. [Google Scholar] [CrossRef] [Green Version]
- EPA. Drinking water, national primary drinking water regulations, total coliforms (including fecal coliforms and E. coli); Final rule. Fed. Regist. 1989, 54, 27544–27568. [Google Scholar]
- Acrylamide, O.C. National Primary Drinking Water Regulations. Kidney 2009, 2, 7. [Google Scholar]
- Kumar, S.K.; Bharani, R.; Magesh, N.S.; Godson, P.S.; Chandrasekar, N. Hydrogeochemistry and groundwater quality appraisal of part of south Chennai coastal aquifers, Tamil Nadu, India using WQI and fuzzy logic method. Appl. Water Sci. 2014, 4, 341–350. [Google Scholar] [CrossRef] [Green Version]


| Parameters | EHML 2007 | WHO 2017 | wi | RWi |
|---|---|---|---|---|
| pH | 6.5–8.5 | 7–8 | 3 | 0.078947 |
| Total Hardness mg/L as CaCO3 | 500 | 200 | 2 | 0.052632 |
| TDS mg/L | 1000 | 600–1000 | 4 | 0.105263 |
| Turbidity (NTU) | 1 | - | 5 | 0.131579 |
| Sulfate mg/L | 250 | 250 | 4 | 0.105263 |
| Nitrates mg/L | 45 | 50 | 5 | 0.131579 |
| Magnesium mg/L | 0.4 | 0.4 | 4 | 0.105263 |
| Chlorides mg/L | 250 | 250 | 3 | 0.078947 |
| Iron mg/L | 0.3 | 0.3 | 4 | 0.105263 |
| Total Coliform MPN/100 ml | 0 | 0 | 4 | 0.105263 |
| Parameter | Min. | Max. | Mean | Median | Std. Err. | Mode | Std. Dev. | (EHML) | WHO |
|---|---|---|---|---|---|---|---|---|---|
| pH | 7.2 | 7.8 | 7.97 | 7.3 | 0.6 | 7.3 | 0.187 | 6.5–8.5 | 7–8 |
| Turbidity (NTU) | 0.16 | 1.3 | 0.66 | 0.69 | 0.02 | 0.8 | 0.18 | 1 | - |
| Total Hardness | 210 | 420.1 | 357.5 | 357 | 3.94 | 330 | 42.02 | 500 | 200 |
| TDS | 400 | 774 | 653.95 | 661 | 8.91 | 705 | 95.93 | 1000 | 1000 |
| Iron | 0.06 | 0.46 | 0.32 | 0.33 | 0.01 | 0.33 | 0.07 | 0.3 | 0.3 |
| Magnesium | 0.05 | 0.86 | 0.6 | 0.6 | 0.01 | 0.75 | 0.14 | 0.4 | 0.4 |
| Nitrates | 0 | 1.82 | 0.52 | 0.48 | 0.04 | 0 | 0.44 | 45 | 50 |
| Sulfate | 7.49 | 105.26 | 74.79 | 75.9 | 1.21 | 75.2 | 12.75 | 250 | 250 |
| Chlorides | 33.9 | 156 | 63.6 | 62.5 | 1.62 | 56.4 | 17.44 | 250 | 250 |
| Total Coliform (MPN/100 mL) | 0 | 3 | 0.07 | 0 | 0.04 | 0 | 0.4 | 0 | 0 |
| WQI Partitions | Quality of Groundwater | Percentage of Sohag Groundwater Samples (%) |
|---|---|---|
| <50 | Excellent | 27.4 |
| 50–100 | Good | 72.6 |
| 100–200 | Poor | 0 |
| 200–300 | Very poor | 0 |
| >300 | Unsuitable for drinking water | 0 |
| pH | Turbidity | TH | TDS | Iron | Magnesium | Nitrates | Sulfate | Chlorides | Total Coliform | |
|---|---|---|---|---|---|---|---|---|---|---|
| pH | 1.000 | |||||||||
| Turbidity | 0.031 | 1.000 | ||||||||
| TH | −0.035 | 0.155 | 1.000 | |||||||
| TDS | 0.104 | 0.270 | 0.668 | 1.000 | ||||||
| Iron | 0.123 | 0.351 | 0.206 | 0.376 | 1.000 | |||||
| Magnesium | 0.050 | −0.085 | 0.018 | 0.026 | 0.129 | 1.000 | ||||
| Nitrates | 0.027 | 0.264 | 0.260 | 0.420 | 0.196 | −0.383 | 1.000 | |||
| Sulfate | 0.120 | 0.189 | 0.599 | 0.899 | 0.358 | −0.028 | 0.370 | 1.000 | ||
| Chlorides | 0.125 | 0.171 | 0.261 | 0.445 | 0.264 | −0.442 | 0.404 | 0.480 | 1.000 | |
| Total Coliform | −0.095 | −0.098 | −0.111 | −0.168 | −0.073 | 0.066 | −0.169 | −0.115 | −0.156 | 1.000 |
| Parameter | F1 | F2 | F3 | F4 |
|---|---|---|---|---|
| pH | 0.008 | 0.581 | −0.811 | 0.071 |
| Turbidity | 0.372 | −0.224 | −0.017 | −0.398 |
| Total Hardness | 0.570 | 0.178 | 0.484 | 0.144 |
| TDS | 0.935 | 0.247 | 0.072 | 0.139 |
| Iron | 0.486 | 0.090 | −0.110 | −0.620 |
| Magnesium | −0.116 | 0.653 | 0.327 | −0.218 |
| Nitrates as (NO3)2 | 0.520 | −0.403 | −0.258 | 0.108 |
| Sulfate | 0.881 | 0.235 | 0.016 | 0.184 |
| Chlorides | 0.589 | −0.368 | −0.156 | −0.020 |
| Total Coliform | −0.183 | 0.017 | 0.148 | −0.025 |
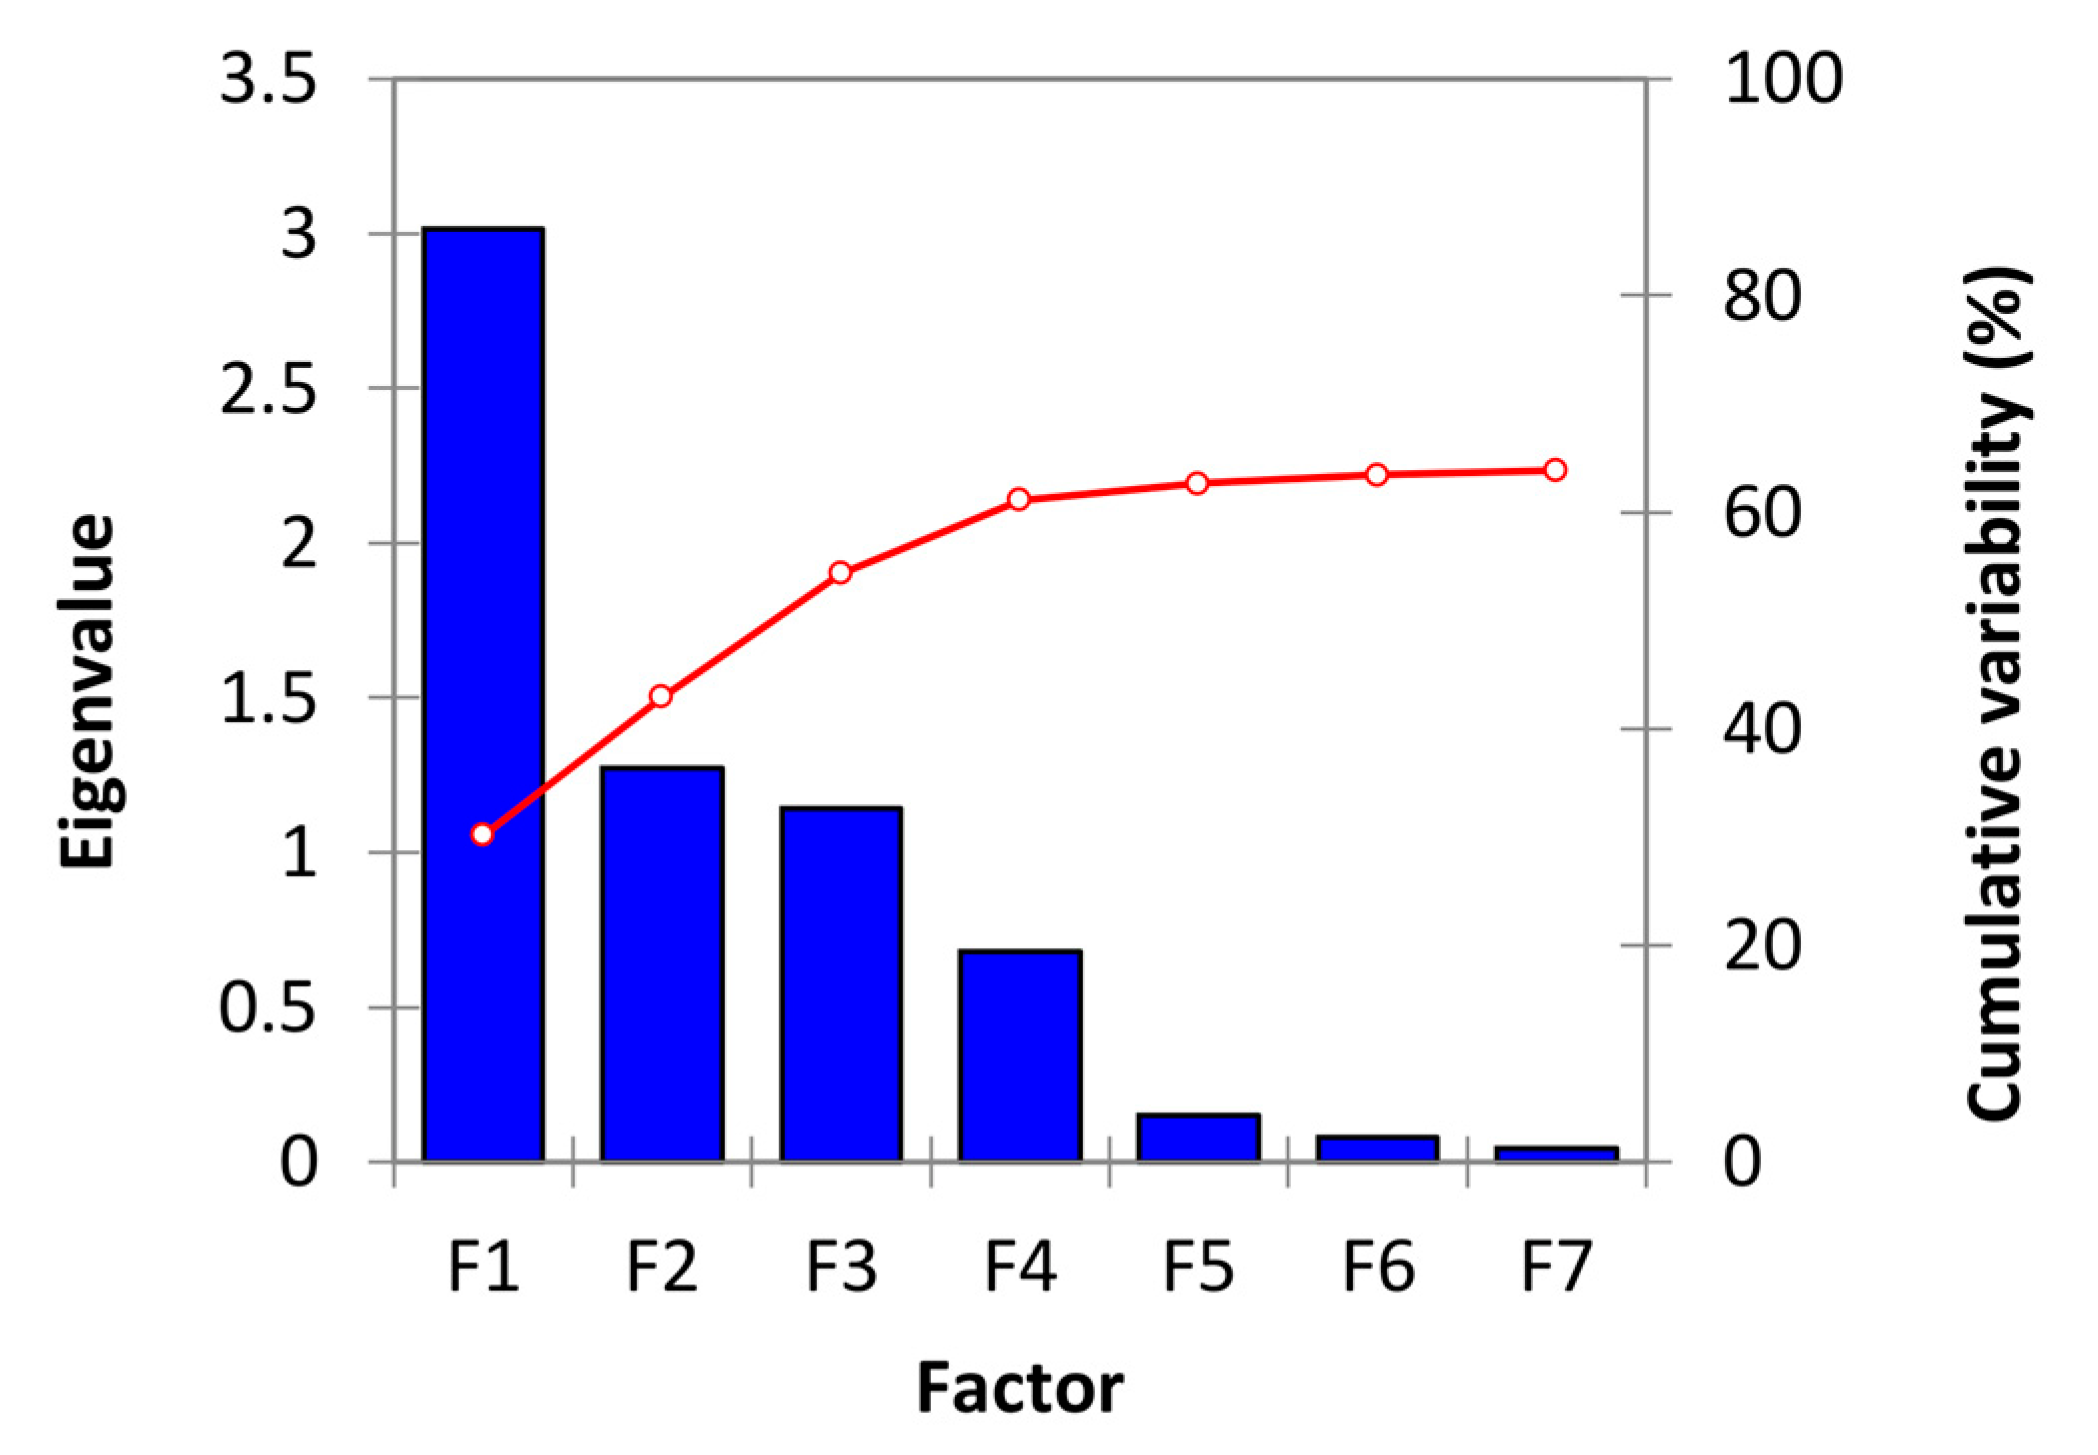
| Eigenvalue | 3.016 | 1.272 | 1.141 | 0.682 |
| Variability (%) | 30.158 | 12.723 | 11.409 | 6.817 |
| Cumulative % | 30.158 | 42.881 | 54.291 | 61.108 |
| Ref. | Parameters | Models | Performance Indices | |
|---|---|---|---|---|
| MSE | RMSE | |||
| [18] | TDS, PS, SAR, ESP, MAR, RSC, and pH | Adaboost | 8.41 | 2.9 |
| RF | 79.7449 | 8.93 | ||
| ANN | 204.2041 | 14.29 | ||
| SVR | 217.2676 | 14.74 | ||
| [19] | Fe, Cl, SO4, pH, and TDSs | LR | 0.30987 | 0.55666 |
| TR | 0.092821 | 0.30466 | ||
| GPR | 0.18049 | 0.42484 | ||
| SVM | 0.18201 | 0.42663 | ||
| ER | 0.053896 | 0.23215 | ||
| [20] | SAR, %Na, RSC, MH, PI, and KR | LSTM | 191.0601 | 13.82245 |
| MLR | 1.370898 | 1.170854 | ||
| ANN | 0.1323 | 0.363731 | ||
| [21] | TDS, pH, EC, Na, K, Ca, Mg, HCO3, NO3, Br, SO4, and Cl | ANN | 22.2887 | 4.7211 |
| This study | pH, Sulfate, Nitrates, Magnesium, Chlorides, Iron, Total Coliform, TDS, Total Hardness, and Turbidity, WQI | DLTS and LSTM | 1.6091 × 10⁻⁷ | 4.0114 × 10⁻⁴ |
Disclaimer/Publisher’s Note: The statements, opinions and data contained in all publications are solely those of the individual author(s) and contributor(s) and not of MDPI and/or the editor(s). MDPI and/or the editor(s) disclaim responsibility for any injury to people or property resulting from any ideas, methods, instructions or products referred to in the content. |
© 2023 by the authors. Licensee MDPI, Basel, Switzerland. This article is an open access article distributed under the terms and conditions of the Creative Commons Attribution (CC BY) license (https://creativecommons.org/licenses/by/4.0/).
Share and Cite
Ahmed, A.K.A.; El-Rawy, M.; Ibraheem, A.M.; Al-Arifi, N.; Abd-Ellah, M.K. Forecasting of Groundwater Quality by Using Deep Learning Time Series Techniques in an Arid Region. Sustainability 2023, 15, 6529. https://0-doi-org.brum.beds.ac.uk/10.3390/su15086529
Ahmed AKA, El-Rawy M, Ibraheem AM, Al-Arifi N, Abd-Ellah MK. Forecasting of Groundwater Quality by Using Deep Learning Time Series Techniques in an Arid Region. Sustainability. 2023; 15(8):6529. https://0-doi-org.brum.beds.ac.uk/10.3390/su15086529
Chicago/Turabian StyleAhmed, Ahmed Khaled Abdella, Mustafa El-Rawy, Amira Mofreh Ibraheem, Nassir Al-Arifi, and Mahmoud Khaled Abd-Ellah. 2023. "Forecasting of Groundwater Quality by Using Deep Learning Time Series Techniques in an Arid Region" Sustainability 15, no. 8: 6529. https://0-doi-org.brum.beds.ac.uk/10.3390/su15086529