Article

Experimental Study on Runoff and Sediment Production of the Fully Weathered Granite Backfill Slope under Heavy Rain in Longling, Yunnan Province

1
Faculty of Land Resources Engineering, Kunming University of Science and Technology, Kunming 650093, China
2
Key Laboratory of Geohazard Forecast and Geoecological Restoration in Plateau Mountainous Area, Ministry of Natural Resources of China (MNR), Kunming 650093, China
3
Key Laboratory of Geohazard Forecast and Geoecological Restoration in Plateau Mountainous Area in Yunnan Province, Kunming 650093, China
4
Yunnan Provincial Traffic Safety Coordination Center, Department of Transport of Yunnan Province, Kunming 650031, China
5
Dehong Oil and Gas Transportation Branch of Southwest Oil and Gas Pipeline Co., Ltd. National Pipe Network Group, Mangshi 678400, China
6
Yunnan Institute of Geo-Environment Monitoring, Kunming 650216, China
*
Authors to whom correspondence should be addressed.
Sustainability 2024, 16(4), 1454; https://0-doi-org.brum.beds.ac.uk/10.3390/su16041454
Submission received: 11 December 2023 / Revised: 4 February 2024 / Accepted: 6 February 2024 / Published: 8 February 2024
(This article belongs to the Special Issue Soil Erosion and Water and Soil Conservation)

Abstract

:
Heavy or intermittent rainfall can cause slopes to become unstable and erode, resulting in significant damage, loss of life, and destruction of property. Targeted management solutions are based on an analysis of slopes’ flow generation and sediment production patterns during periods of rainfall. This study used a fully granite backfill slope as its research subject and examined the features of slope erosion during intermittent rainfall. We examined the processes of slope flow generation and soil erosion during intermittent rain through indoor artificially simulated rainfall experiments. Three intermittent rainfall events with a 220 mm/h intensity were designed during the experiment. Each rainfall event lasted for 60 min, with an interval of 60 min between the events. By analyzing multiple rainfall events, this study reveals the patterns of runoff and sediment yield on different slopes in response to variations in rainfall intensity and slope gradient. The runoff volume on other slope surfaces exhibits a similar pattern in reaction to changes in rainfall events. As the frequency of rainfall events increases, the surface runoff tends to be higher. Additionally, with variations in slope steepness, the runoff volume generally follows an increasing trend. Notably, the slope with a 20° incline shows the smallest runoff volume. The sediment yield on different slope surfaces gradually increases as the slope increases. In particular, on a 20° slope, the sediment yield experiences a substantial increase, indicating that the impact of the slope on the sediment yield becomes more pronounced. In different rainfall events, the morphology of the slope changes due to the influence of gravity and hydraulics, resulting in oscillations in both the average runoff rate and sediment yield. Furthermore, as the slope steepens, the amplitude of these oscillations increases. The process of slope erosion involves three stages: raindrop splash erosion, runoff erosion, and collapse damage. The sequence of slope damage locations is as follows: footslope, mid-slope, and hilltop. For the backfilled slope of completely weathered granite, the artificial slope can be controlled to around 20°. Erosion on the slope mainly occurs after the formation of gullies, and slope management should focus on preventing gully formation before it happens.

1. Introduction

Soil erosion is a significant global natural disaster that leads to land degradation [1,2], ecological environment deterioration, and various environmental issues such as collapses, landslides, and debris flows [3]. A bare slope is affected by many factors in the process of soil erosion [4,5]. Rainfall is the main driving factor in slope erosion and the essential force behind soil erosion [6,7]. The slope gradient is another crucial factor that influences soil erosion on slopes, as it affects the erosive force and transport ability of surface runoff [8,9,10,11,12,13,14]. Additionally, the physical properties of soil moisture play a crucial role in determining the soil’s resistance to erosion and its ability to withstand impact forces [15]. In the actual process of erosion, the simultaneous influence of various factors makes the soil erosion process complex. Previous research has demonstrated that artificially simulated rainfall experiments are an effective method for investigating soil erosion processes and their influencing factors [16,17,18].
Erosion characteristics serve as essential criteria in scientifically preventing soil erosion and establishing erosion models [19], while runoff and sediment yield are two crucial indicators in assessing the degree of slope erosion [20,21,22,23,24,25]. Wei Xiaoyan et al. discovered that, under a constant rainfall intensity, the runoff rates of clay and sandy soils exhibited a power function relationship with the duration of runoff, while the sediment yield rates showed a quadratic function relationship with the runoff duration. The slope gradient had a greater impact on sediment yield than on runoff in slope erosion [26]. Zhao Qinghe studied red soil slopes and observed that, under the same rainfall intensity, the initial trend of runoff on the slope showed an unstable upward trend, which later stabilized. The stability point appeared later under higher rainfall intensity, and the runoff rate did not increase with an increase in slope gradient [27]. Zhang Huiru et al. investigated the influence of slope gradient on runoff and erosion processes on red soil slopes under different rainfall conditions. The conclusion drawn was that both surface runoff and soil erosion on the slope increased with increasing rainfall intensity. However, the impact of the slope gradient was more complex, exhibiting different trends under varying rainfall intensities [28]. Wu Lei et al. studied exposed loess under high rainfall intensity and found that, with an increase in rainfall duration, the sediment yield initially decreased rapidly before gradually stabilizing. The linear correlation between runoff and rainfall intensity was more pronounced at different slopes, but the correlation between sediment yield and rainfall intensity was relatively weak [29]. As mentioned above, different soils and conditions exhibit significant variations in the patterns of slope erosion.
Weathered granite plays a vital role in soil erosion in the southern regions. In the northeastern part of Longling County, Western Yunnan, granite is widely distributed. However, due to human engineering activities, the surface vegetation has suffered significant damage [30]. The completely weathered granite and its backfill soil have low clay content, a loose structure, poor physical and mechanical properties, and weak erosion resistance. Under the scouring action of flowing water, the slope is prone to the formation of gully erosion. During heavy rainfall, rainwater carries sediment and rapidly pours down along deep-cut gullies, leading to the formation of miniature debris flows. This poses a threat to the lives, property, and safety of residents in downstream villages [31]. In the granite distribution area, extensive studies have been conducted on slope erosion, particularly focusing on rockfall. Research indicates that as the slope gradient increases, the development trend of soil erosion gradually transitions from water erosion to gravity erosion [32]. Previous studies have conducted meaningful research on the slope erosion characteristics of slopes composed of completely weathered granite and its backfill soil. Xu Jiapan et al. [33], through indoor simulated rainfall experiments utilizing three-dimensional laser scanning technology, investigated the erosion characteristics of weathered granite soil. The results indicated that, throughout the entire rainfall process, the area of soil surface erosion above the slope base is limited, while gully formation is more likely at the slope bottom. Deng Longzhou et al. [34,35], through the study of rainfall runoff and hydrological processes on erodible weathered granite slopes, found that, in most cases, the proportion of subsurface flow to total runoff is greater than that of surface runoff. The proportion of surface runoff increases with the rainfall intensity, while the variation in proportion is relatively small with changes in slope gradient. These findings have certain guiding significance for the study and management of soil erosion in granite areas [36,37]. However, the slope erosion characteristics, erosion patterns, and controlling factors of slopes composed of completely weathered granite and its backfill soil are still not well understood.
Soil erosion modeling is a crucial tool for predicting soil loss and evaluating soil and water conservation measures. The most widely used soil erosion models worldwide are the Universal Soil Loss Equation (USLE) and the Revised Universal Soil Loss Equation (RUSLE) [38]. These models conduct quantitative analysis of soil and water loss based on factors such as rainfall erosivity (R), soil erodibility (K), slope length (L), slope steepness (S), vegetation coverage (C), and soil and water conservation practices (P). However, these evaluation models primarily rely on data from gentle slopes and flat terrains. In recent years, domestic scholars have modified the USLE by incorporating observation data from runoff plots in water erosion areas. For instance, Liubaoyuan [39] developed the Chinese Soil Loss Equation (CSLE), which considers the topographic characteristics of China and further categorizes soil and water conservation measures into biological, engineering, and farming practices. This model is both simple and practical. Similarly, Wufaqi et al. [40] established a model for bare land based on rainfall factors, slope, and slope length, using runoff field data from the Southern Loess Plateau and bare farmland runoff plots as benchmarks. These evaluation models directly account for rainfall events dominated by rill erosion and splash erosion. Furthermore, previous studies have indicated that extreme rainfall plays a significant role in generating runoff and sediment, with erosion caused by extreme rainfall surpassing that caused by ordinary rainfall [41]. Under extreme rainfall conditions, rill erosion is more likely to occur, leading to substantial sediment yield [42]. From the previous analysis, it can be seen that the predecessors have carried out some meaningful research on the evaluation of the soil erosion theorem, but most of them have carried out research on gentle slopes or small watersheds, more research on loess areas, and less research on slope erosion characteristics in mountainous areas, especially in completely weathered granite distribution areas [43]. Therefore, it is necessary to design an artificial rainfall simulation experiment, carry out soil erosion characteristics research, and construct a quantitative soil erosion evaluation model under the steep mountain slope conditions of completely weathered granite and its backfill so as to provide theoretical reference for soil and water conservation research in this type of soil distribution area.
Taking into account the comprehensive analysis of previous research, it is noted that the majority of simulated erosion experiments related to soil erosion primarily focus on natural soils, with red and yellow soils being predominant [44,45,46,47,48]. In contrast, there is a relatively limited body of research on slope erosion characteristics specifically related to slopes composed of completely weathered granite and its backfill soil. The erosion patterns and key influencing factors controlling the intensity of slope erosion in these contexts remain unclear. Furthermore, previous studies on slope erosion have predominantly focused on the soil runoff and sediment yield patterns under single-event rainfall conditions, with a notable absence of research on slope erosion under intermittent rainfall conditions [49,50,51,52]. In reality, natural rainfall is often characterized by intermittent patterns. At present, research on intermittent rainfall has predominantly focused on the patterns of soil nutrient loss [53,54]. However, there is relatively limited research on the characteristics and patterns of soil erosion under intermittent rainfall conditions. Targeted studies in this regard are urgently needed to provide a basis for soil and water conservation in granite distribution areas. Therefore, this study aims to utilize artificial simulated rainfall methods, with slopes composed of completely weathered granite backfill soil as the research subject, to analyze the characteristics of runoff and sediment yield on the slope surface under intermittent heavy rainfall conditions. The objective is to elucidate the erosion patterns on backfilled soil slopes and identify the key factors controlling slope erosion. The findings are intended to provide a theoretical reference for soil and water conservation in engineering operations on slopes in granite distribution areas.

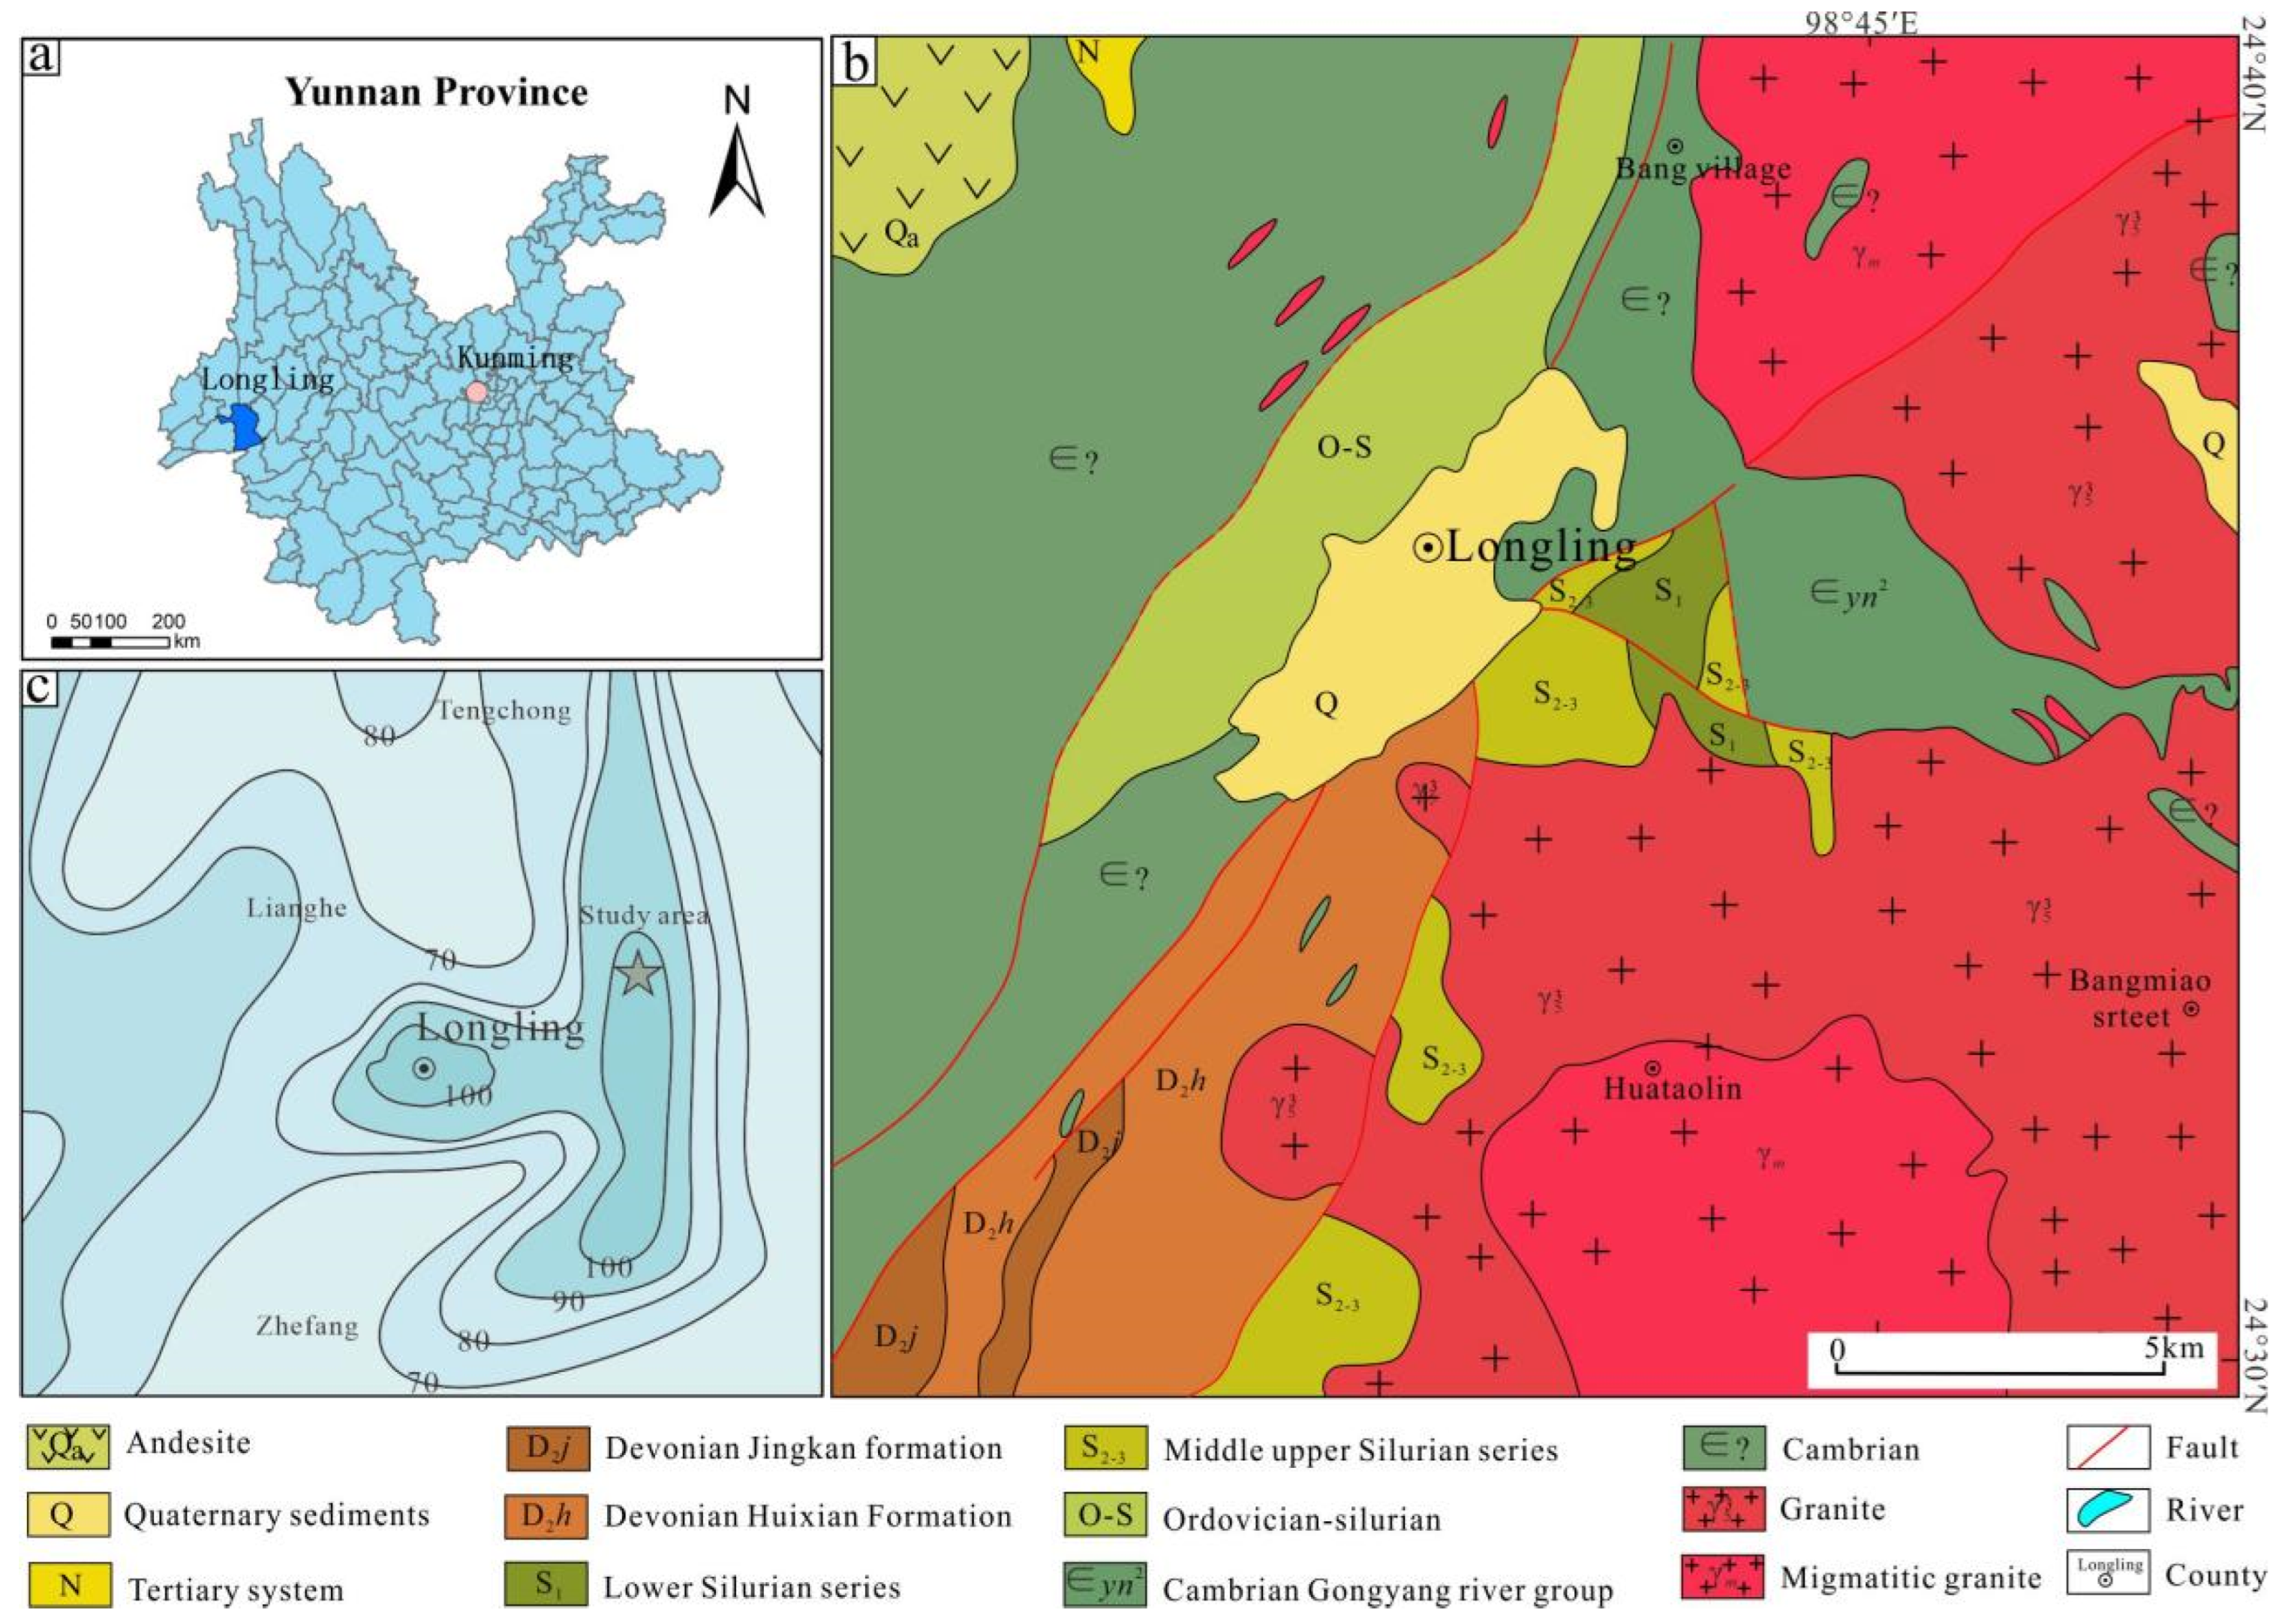
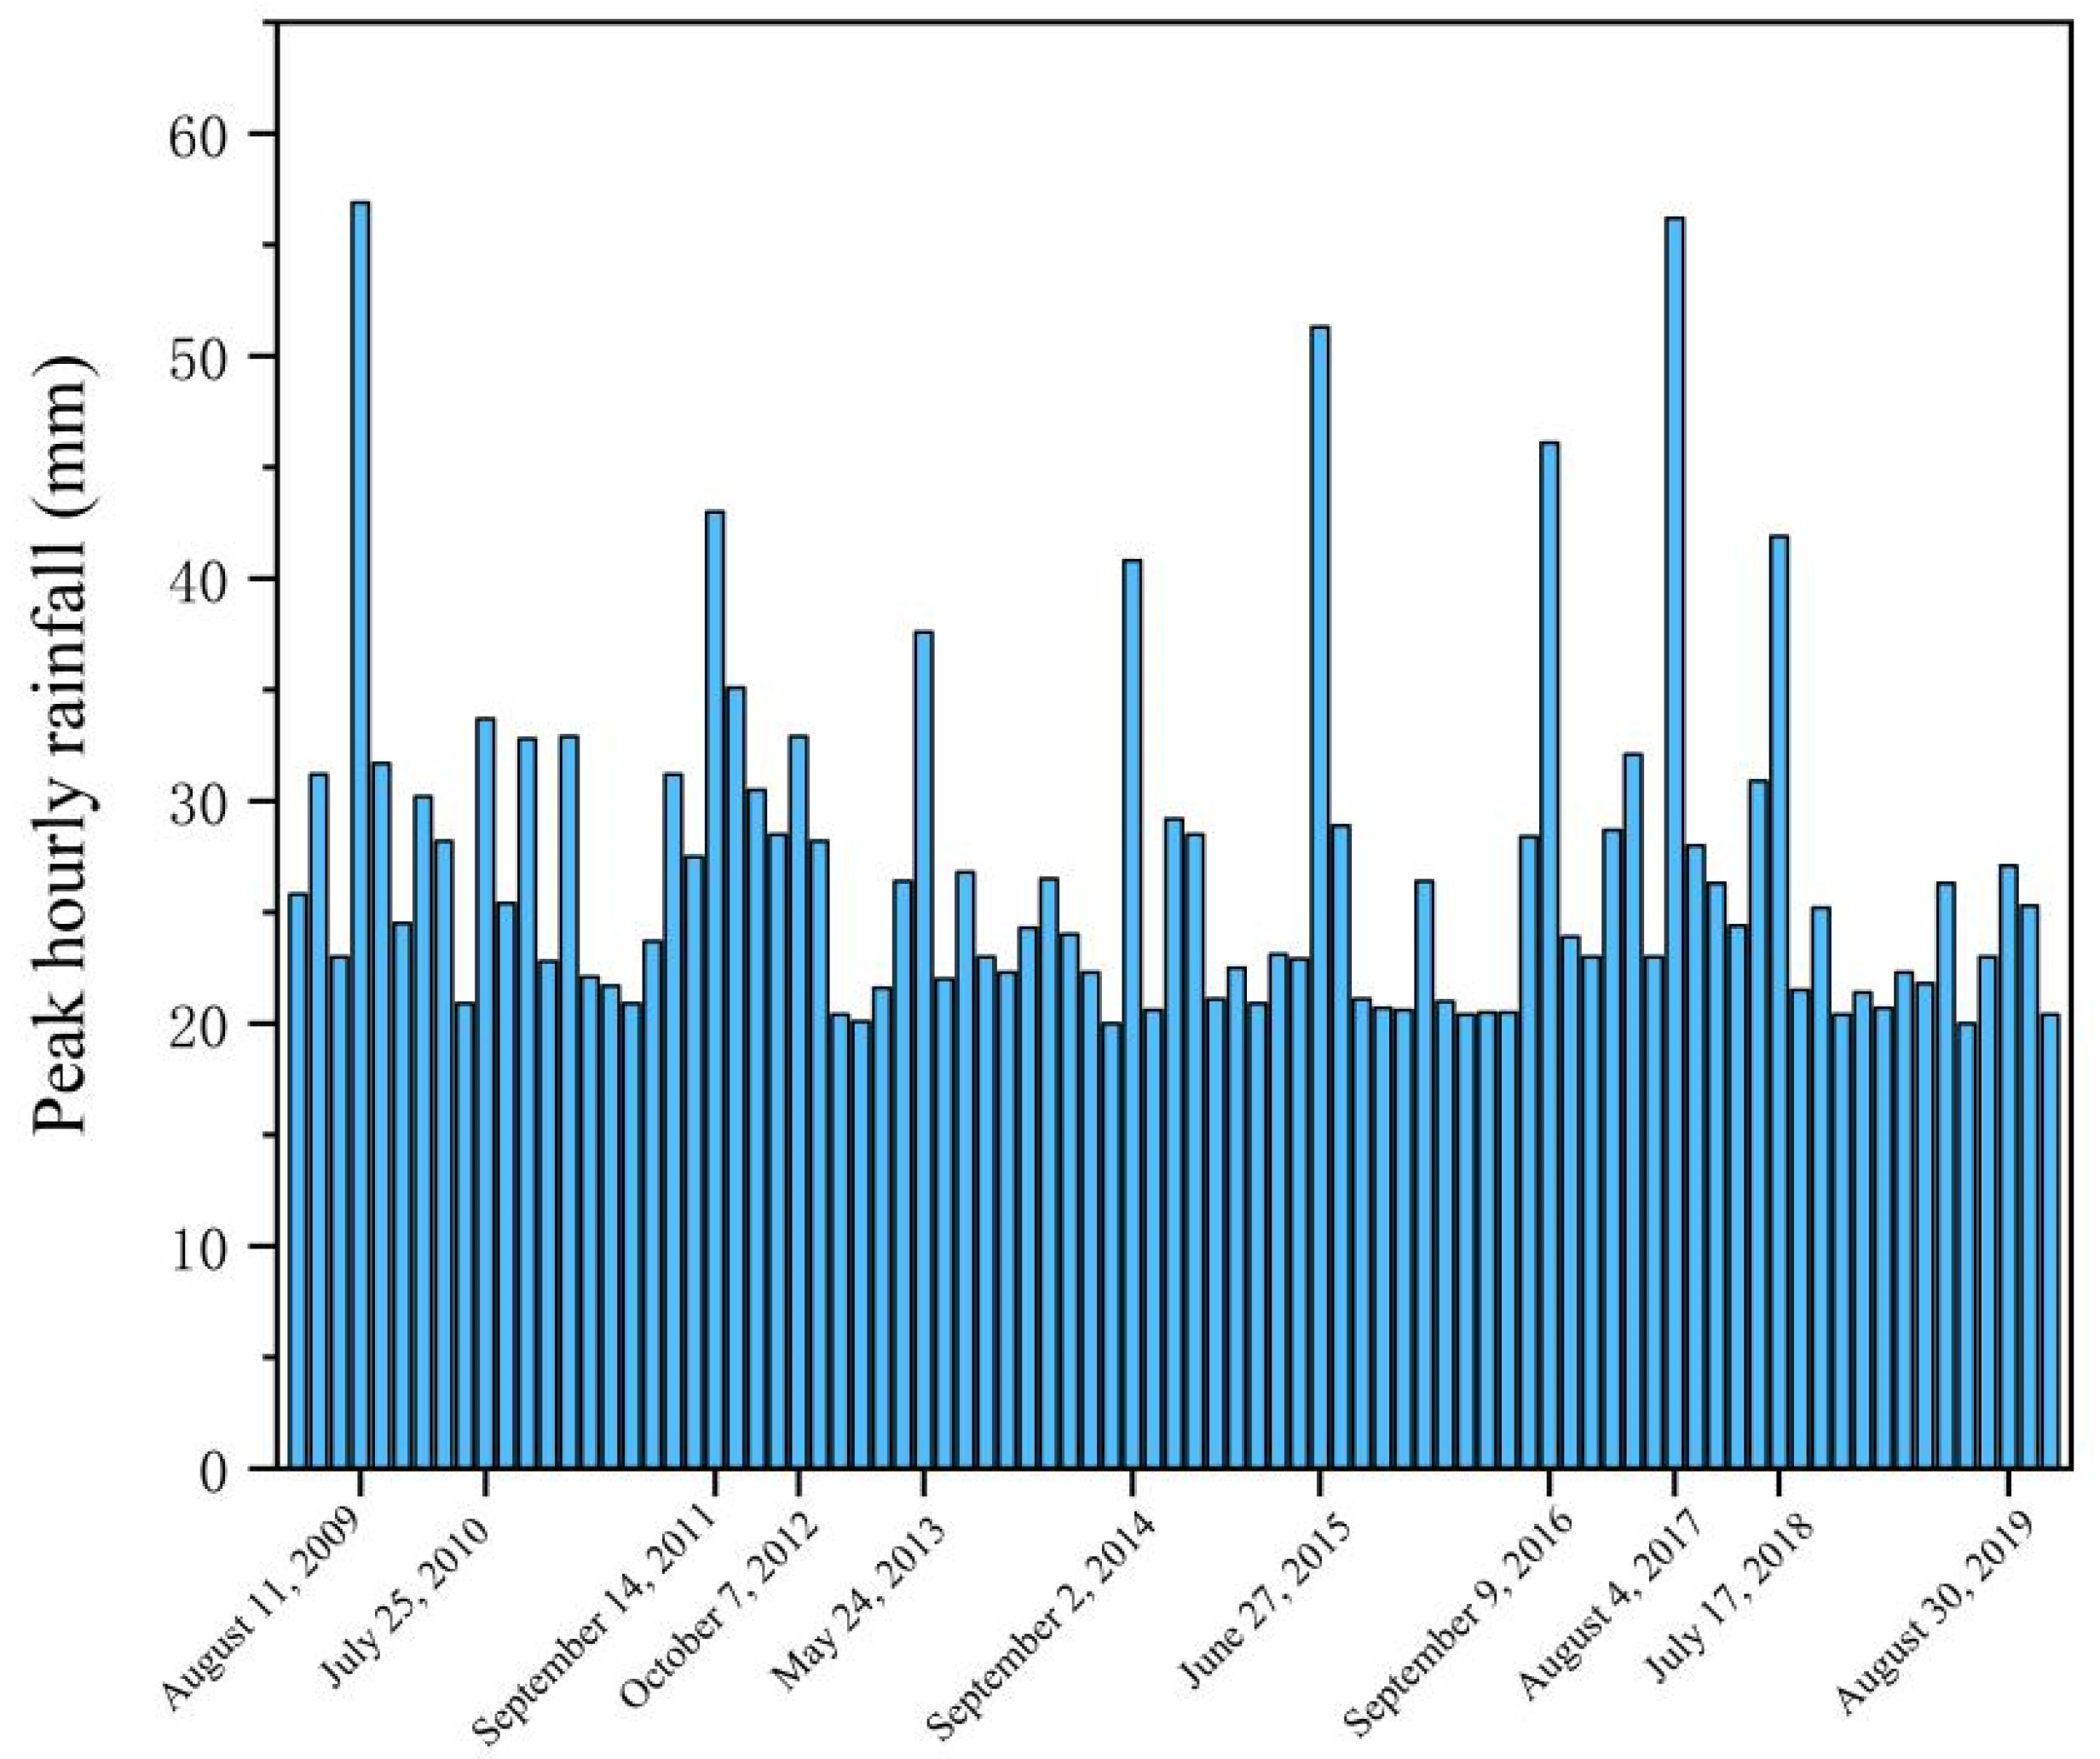
2. Geological and Meteorological Characteristics of the Study Area

The study area is situated in the Longling County region of Western Yunnan Province (Figure 1a), characterized by the western edge of the Yunnan–Guizhou Plateau and the southern terminus of the renowned Hengduan Mountain Range, which exhibits intricate terrain. The pinnacle of the pipeline project crossing area is situated at Laoguangshan, boasting an elevation of 2518.55 m, while the nadir is represented by the water surface of the Nujiang River at the Nujiang Dam, with an elevation of 640 m. The overall area exhibits a maximum elevation difference of 1878.55 m. The geomorphology in the region is influenced by the underlying tectonic structure, characterized by primary mountain ranges and rivers extending in a north-to-south direction, creating an intricate interplay between them. The valley morphology predominantly exhibits “V”-shaped configurations. The geological structure within the study area is notably intricate, featuring the presence of folds and fracture structures. The region falls within the category of a hilly slope situated in the middle of a mountainous region with seasonal gullies. The area is characterized by abundant and thriving vegetation. The slope gradient typically ranges between 20° and 30°, with certain local slopes reaching a steep inclination of up to 40°. The study area experiences average annual precipitation ranging from 1400 to 2100 mm (Figure 1b), classifying it within the southern subtropical and northern tropical climate zones. Abundant rainfall characterizes the climate in the region, which is marked by distinct dry and wet seasons. The primary rainfall is concentrated during the rainy season, highlighting the pronounced three-dimensional climatic patterns (Figure 2).
The predominant bedrock in the study area consists mainly of Yanshanian granite, with mixed granite of unknown age following as a secondary geological feature (Figure 1c). The Quaternary loose accumulations primarily comprise fully weathered granitic sands and residual clays. Granite predominantly consists of quartz, potassium feldspar, plagioclase feldspar, and black mica. The quartz content ranges from 35 to 40%, the potassium feldspar content is between 30 and 35%, plagioclase feldspar constitutes 25–30%, and black mica comprises 5–10%. Following weathering, there are substantial alterations in the material composition and structural configuration of rock and soil bodies, leading to a rapid decline in mechanical properties. After weathering, the predominant minerals include quartz, mica, potassium feldspar, kaolinite, plagioclase, and greenite, with quartz constituting the largest proportion, followed by mica, feldspar, and kaolinite (Figure 3). The granite rock mass on the northeast side of Longling has undergone extensive weathering, attributed to high temperatures and frequent rainfall, resulting in the substantial thickness of the weathering zone. The thickness of the fully weathered layer typically exceeds 3 m, and, in certain local areas, it can extend to more than 10 m. The weathering is characterized by uniform progression, resulting in a loose and granular structure. The core comprises sand, breccia, and gravel, while the overburden is relatively thin.
With the intensification of human engineering activities in the study area, backfill slope erosion has become increasingly severe, leading to the formation of deep erosion gullies on the slopes (Figure 4). The trailing edge of the slope frequently exhibits the development of tensile cracks, leading to the rapid evolution of slope erosion into a gully in the direction of the negative terrain. This results in substantial and severe slope erosion. On the lower side of the slope, a profound gully is sculpted at the confluence point of the watercourses. The gully typically ranges from 0.3 to 2.0 m in width and 0.4 to 2.0 m in depth. The maximum dimensions of a gully reach 2.5 m in width and 2.5 m in depth, with a tendency for further profound incision. The gully on the upper edge of the slope typically exhibits a ‘V’ shape, with the gully profile evolving into a ‘U’ shape or irregular shape along the direction of runoff. Once the gully is formed, it often cuts quickly. Simultaneously, the gully banks experience collapse under the erosive action of running water. The occurrence of bank collapse is highly pronounced, with the strong headward erosion of the gully leading to potential risks such as the loss of human life and property, damage to farmland, and other associated hazards.

3. Materials and Methods
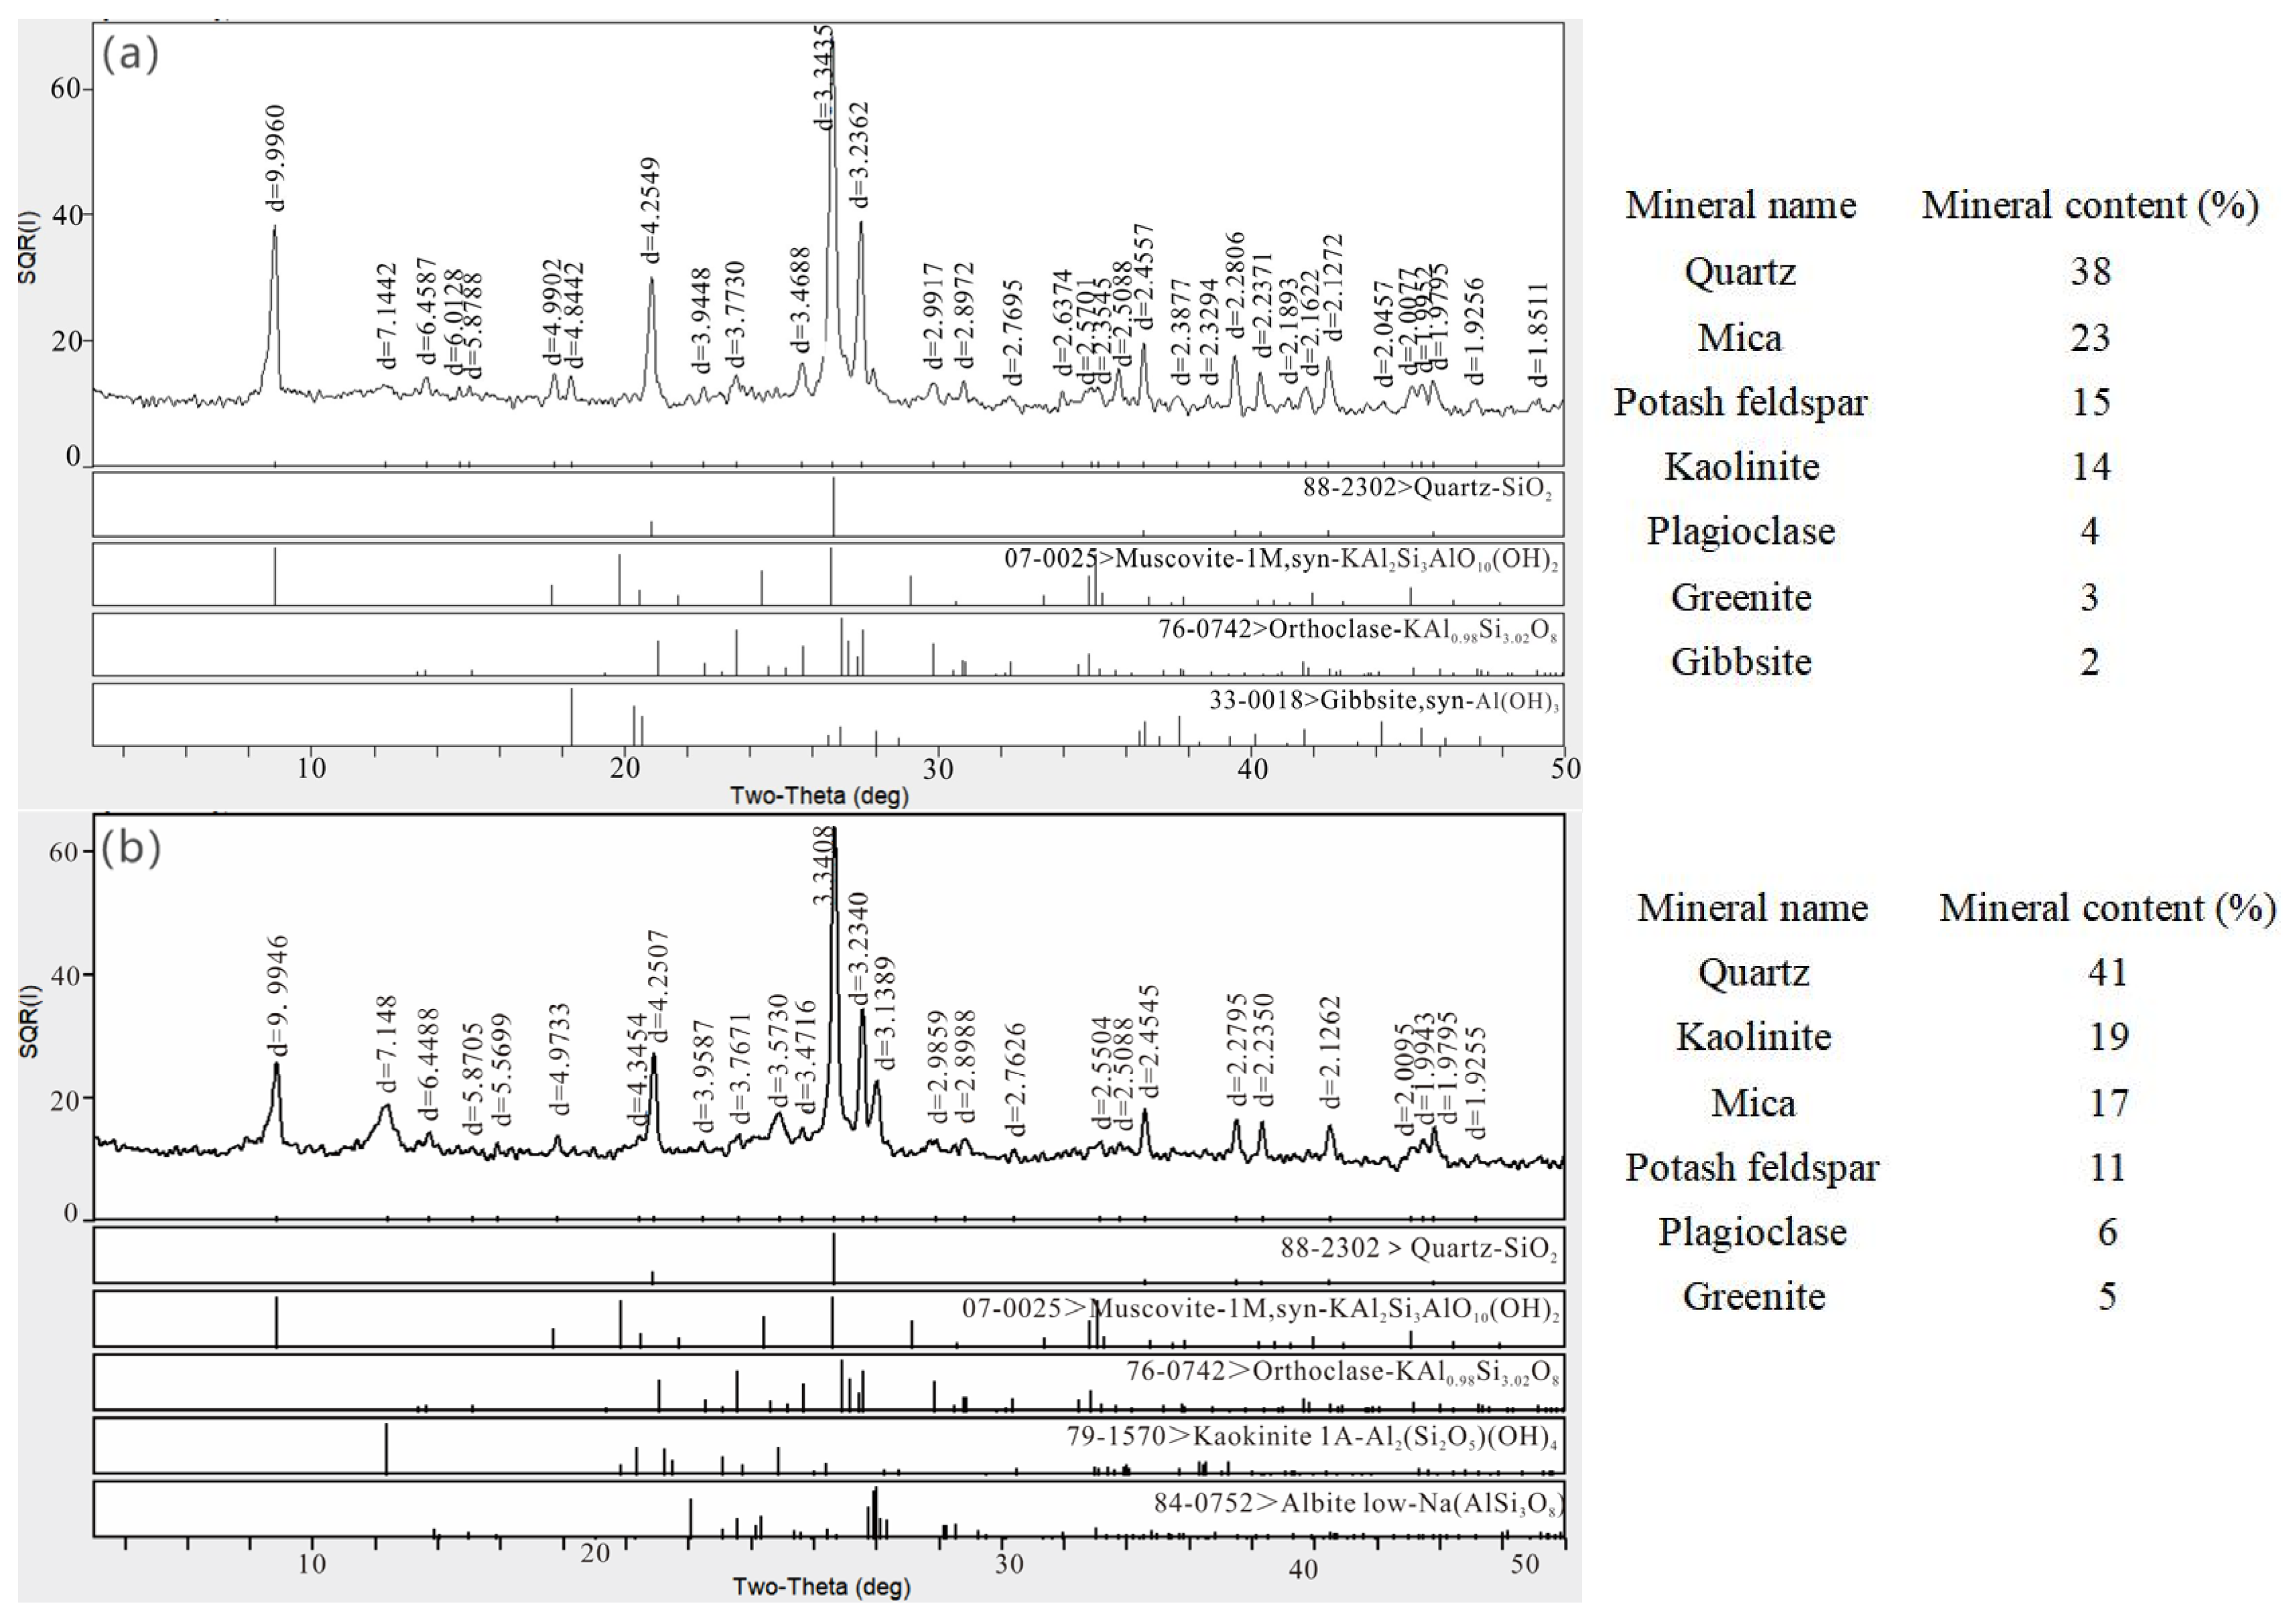
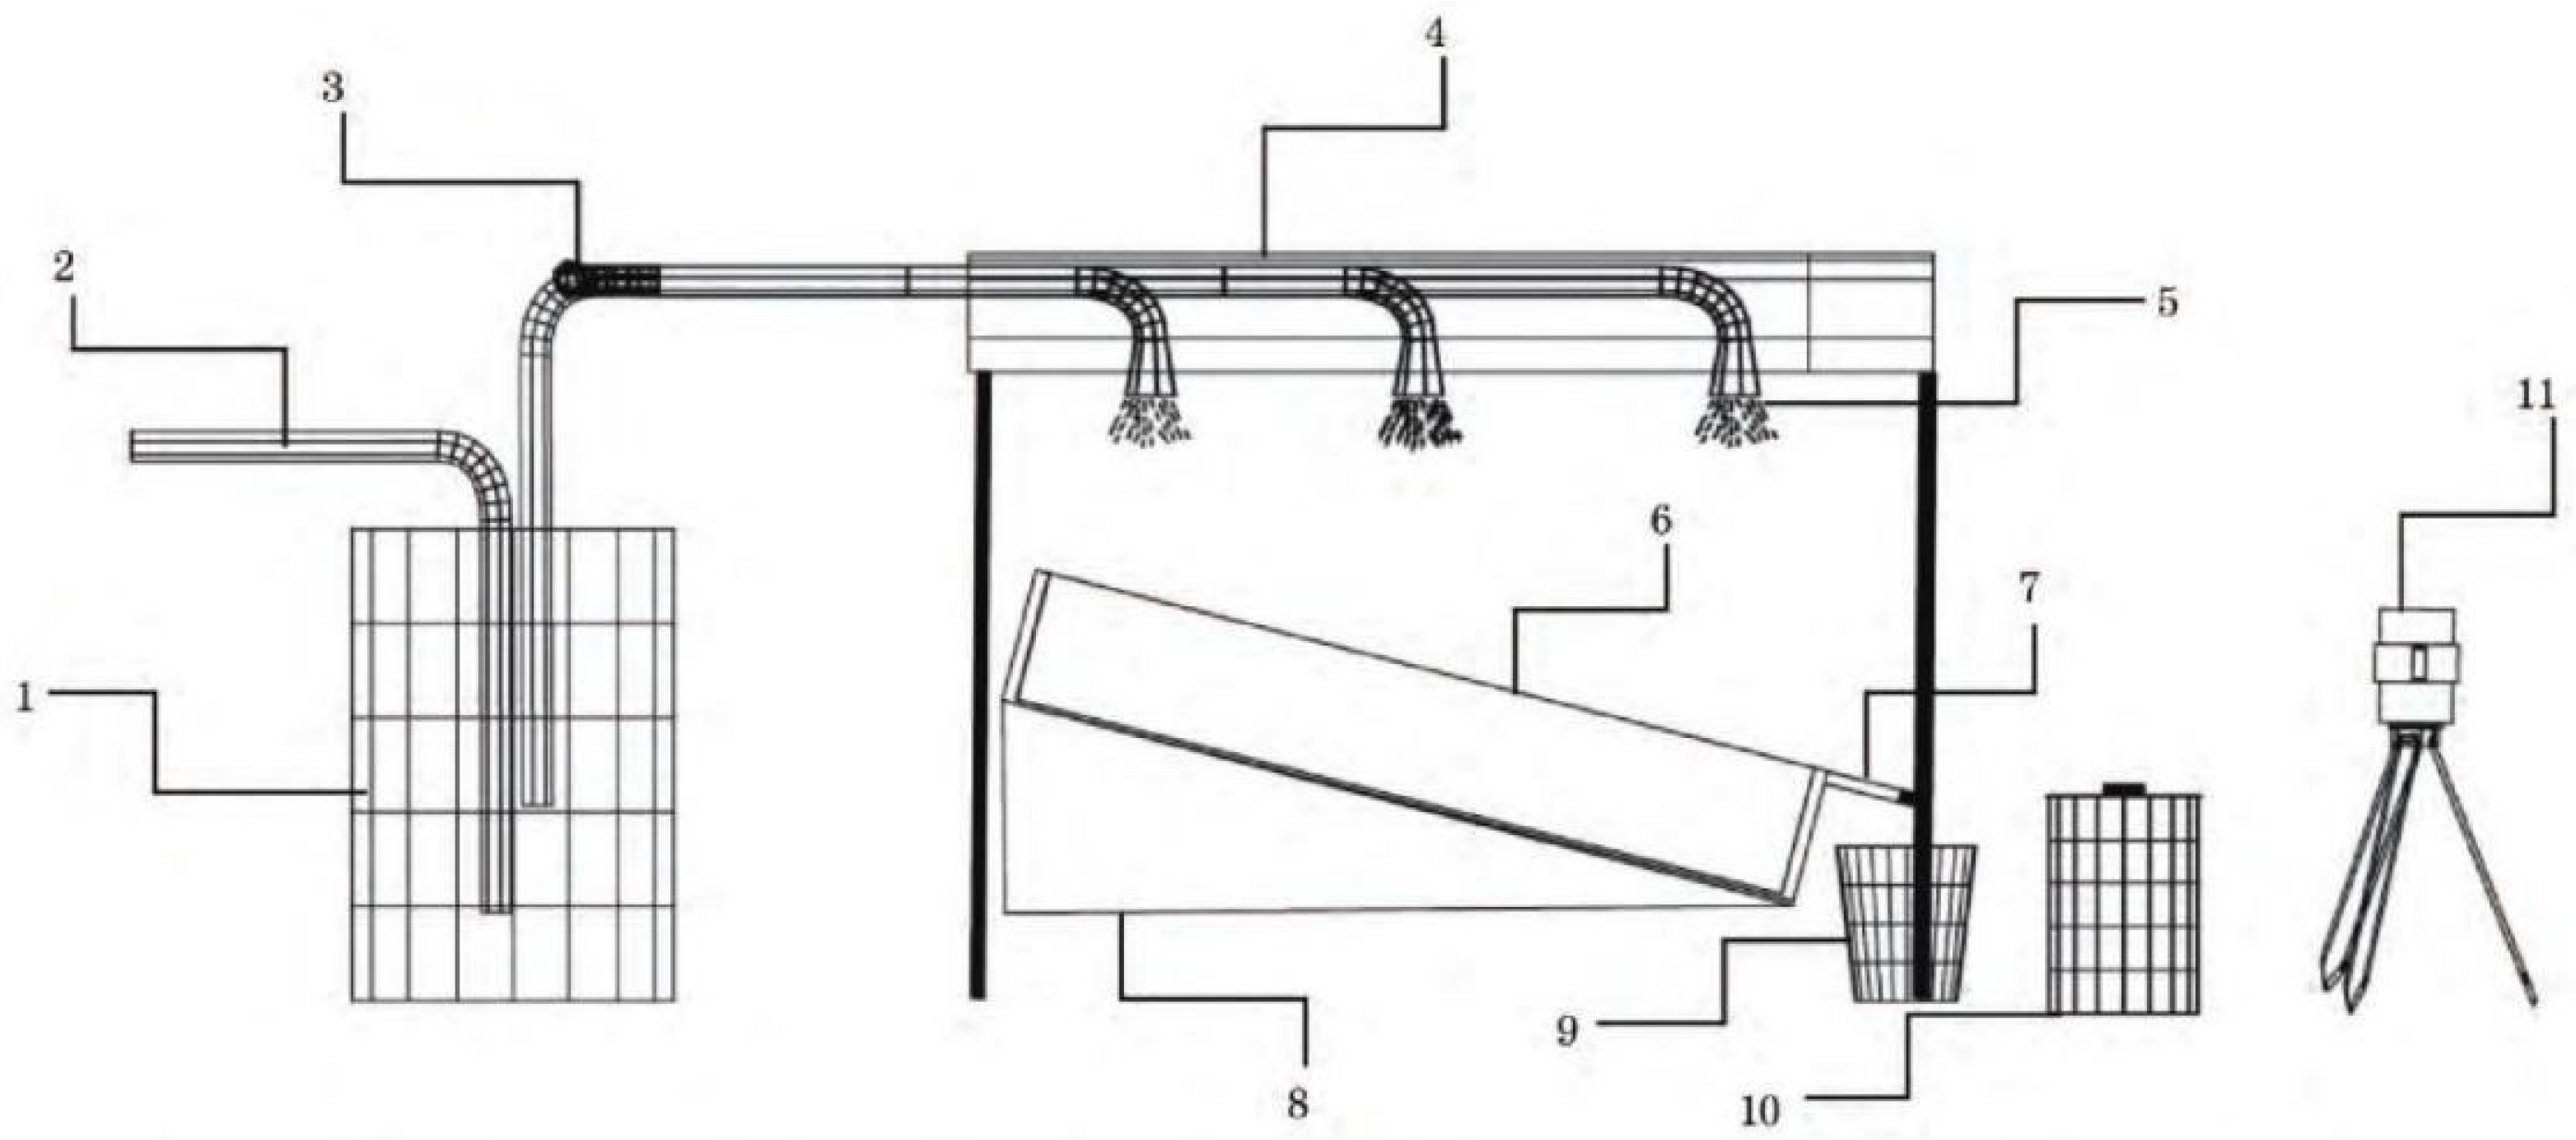
3.1. Test Materials

The study area belonged to a typical distribution area of granite. The soil type used for the experiment was sandy soil excavated and backfilled by human engineering activities in the Longling weathered granite distribution area. The soil sampling time was July 2020, and the experimental period was from March to May 2021. The average soil density was 1.78 g/cm3, with natural moisture content of 14.7% to 25.3%. The natural void ratio ranged from 0.633 to 0.863, indicating a relatively loose structure with well-developed pores.
The sand in the experiment was based on the test results of the backfill soil, the designed dry density of the soil was 1.3–1.5 g/cm3, and the initial water content was 15%. The particle composition of the air-dried test soil was determined using the sieve method. The particle size of <0.075 mm accounted for 1.13%, the particle size of 0.075–0.25 mm accounted for 24.76%, the particle size of 0.25–2 mm accounted for 41.16%, and the particle size greater than 2 mm accounted for 32.95% (Table 1). According to the classification standard, the soil belonged to sandy soil.

3.2. Test Design

The indoor simulated rainfall erosion test device consisted of four main components: an artificial rainfall unit, a water supply and drainage system, an experimental tank, and a monitoring system. The device is illustrated in Figure 5.
The objective of the simulation test was to delineate the pattern of slope erosion evolution, the sediment characteristics related to erosion, and the dynamic mechanisms governing erosion in fully weathered granite backfill slopes subjected to intermittent rainfall conditions. This test was conducted within a model box (designated as Box B) with dimensions of 3 m (length) × 1 m (width) × 0.5 m (height), chosen based on the precipitation data from the Longling area over the past decade. The design took into account the maximum single-hour rainfall recorded during this period, which amounted to 56.9 mm. Drawing upon formulae commonly used in the fields of hydroelectricity and hydraulics,
H tp = K p × H t
where Htp is the design single-point rainfall (mm), Kp is the design frequency mode ratio coefficient, and Ht is the annual maximum single-point rainfall (mm).
Kp is related to the value of the coefficient of variation Cv. Consulting the data, we obtained Cv = 0.3 in Longling area, and when the Kp value of the 100-year storm (p = 1%) was 1.916, the rainfall value of the 100-year storm was calculated to be 110 mm/h.
According to meteorological monitoring data, the distribution of rainfall within a single hour is typically non-constant, exhibiting characteristics resembling a normal curve. The primary period of intense rainfall is concentrated between 20 and 40 min, with the majority occurring around 30 min. Additionally, consideration has been given to the occurrence of exceptionally heavy rainfall exceeding 200 mm/h in various regions across the country in recent years. Hence, in designing the rainfall intensity for this study, the characteristics of the single-hour rainfall distribution were taken into account. Under extreme conditions, the calculation was based on a single-point rainfall value of 110 mm/h for a 1-in-100-year period *2, resulting in the design of an extreme single-point rainfall intensity of 220 mm/h.
Based on the field survey, the slope gradient in the Longling area ranges from 5° to 40°, and slope erosion disasters are more concentrated in the 15° to 40° range. With an increase in slope, the erosion intensity also increases. Therefore, the selected slope gradients for the test were 10°, 20°, 30°, and 40°. The total test duration was 5 h, with 2–3 designed rainfall events for each test. Each rainfall event lasted for 1 h, followed by a 1 h static period after the cessation of the rain. This design allowed for the observation of the evolutionary pattern of gully erosion and changes in the slope runoff and sand content under intermittent rainfall conditions.

3.3. Index Observation and Calculation

Surface runoff water generated on slopes after rainfall was collected in runoff buckets. Simultaneously, the time of initial flow production on the slopes was meticulously recorded. Sediment-laden water flushed from the runoff at the outlets of various troughs was systematically collected in containers with a 1 L volume at 2 min intervals from the onset of rainfall. If the sediment water collected within the initial 30 s was insufficient to reach 1 L, the collection was halted. The volume of sediment water amassed within this 30 s interval was recorded. However, if the sediment water collected surpassed 1 L within 30 s, the collection was continued until it reached the 1 L mark, and the duration of time utilized for this collection was duly recorded. Upon concluding the test, the sediment water volume accumulated in the runoff bucket of the bare slope tank was meticulously recorded. Subsequently, the sediment water in both the runoff bucket and the 1 L container was allowed to stand for a period exceeding 24 h. Following this, the upper layer of clear water was pumped away, and the sediment at the bottom was subjected to drying and weighing, with the sediment quantity duly documented.
(1)
When runoff was initially generated (T0), this unit refers to the time from the start of rainfall until the slope stabilizes the runoff generation. The unit of measurement is s.
(2)
Runoff rate (N) and sediment yield rate (M) are the runoff (mL/s) and sediment yield amount (g/s), respectively. They can be calculated as follows:
N = q t
M = M t
In the formula, q is the catch flow (mL); M′ is the amount of sediment after the drying of the spliced sample (g); t is the time used for the spliced sample(s).
The data were calculated and summarized using Excel 2019, while SPSS 25.0 was utilized for statistical analysis. The drawing was created using Origin 2018.

4. Results

4.1. Initial Flow-Producing Time

Under a rainfall intensity of 220 mm/h, the onset of the initial flow production time on the slope during the first rainfall exhibited a variation corresponding to the slope gradient. Initially, it increased with the slope, followed by a decline and then a subsequent increase, reaching its zenith at a 20° slope. The initial flow production times varied across slopes: 71 s on the 10° slope and 80 s on the 20° slope (9 s longer than the 10° slope), followed by a reduction to 58 s on the 30° slope and 60 s on the 40° slope. As the number of rainfall events increased, the rainfall intensity played a significant role, overshadowing the influence of the slope gradient. Consequently, the time of flow production on each slope was considerably advanced in the last two rainfall events. This led to the initiation of flow production on the slopes early in the rainfall events, and the initial flow production characteristics of the third rainfall event were consistent with those of the second rainfall event.

4.2. Characterization of Slope Runoff Changes under Intermittent Rainfall Conditions

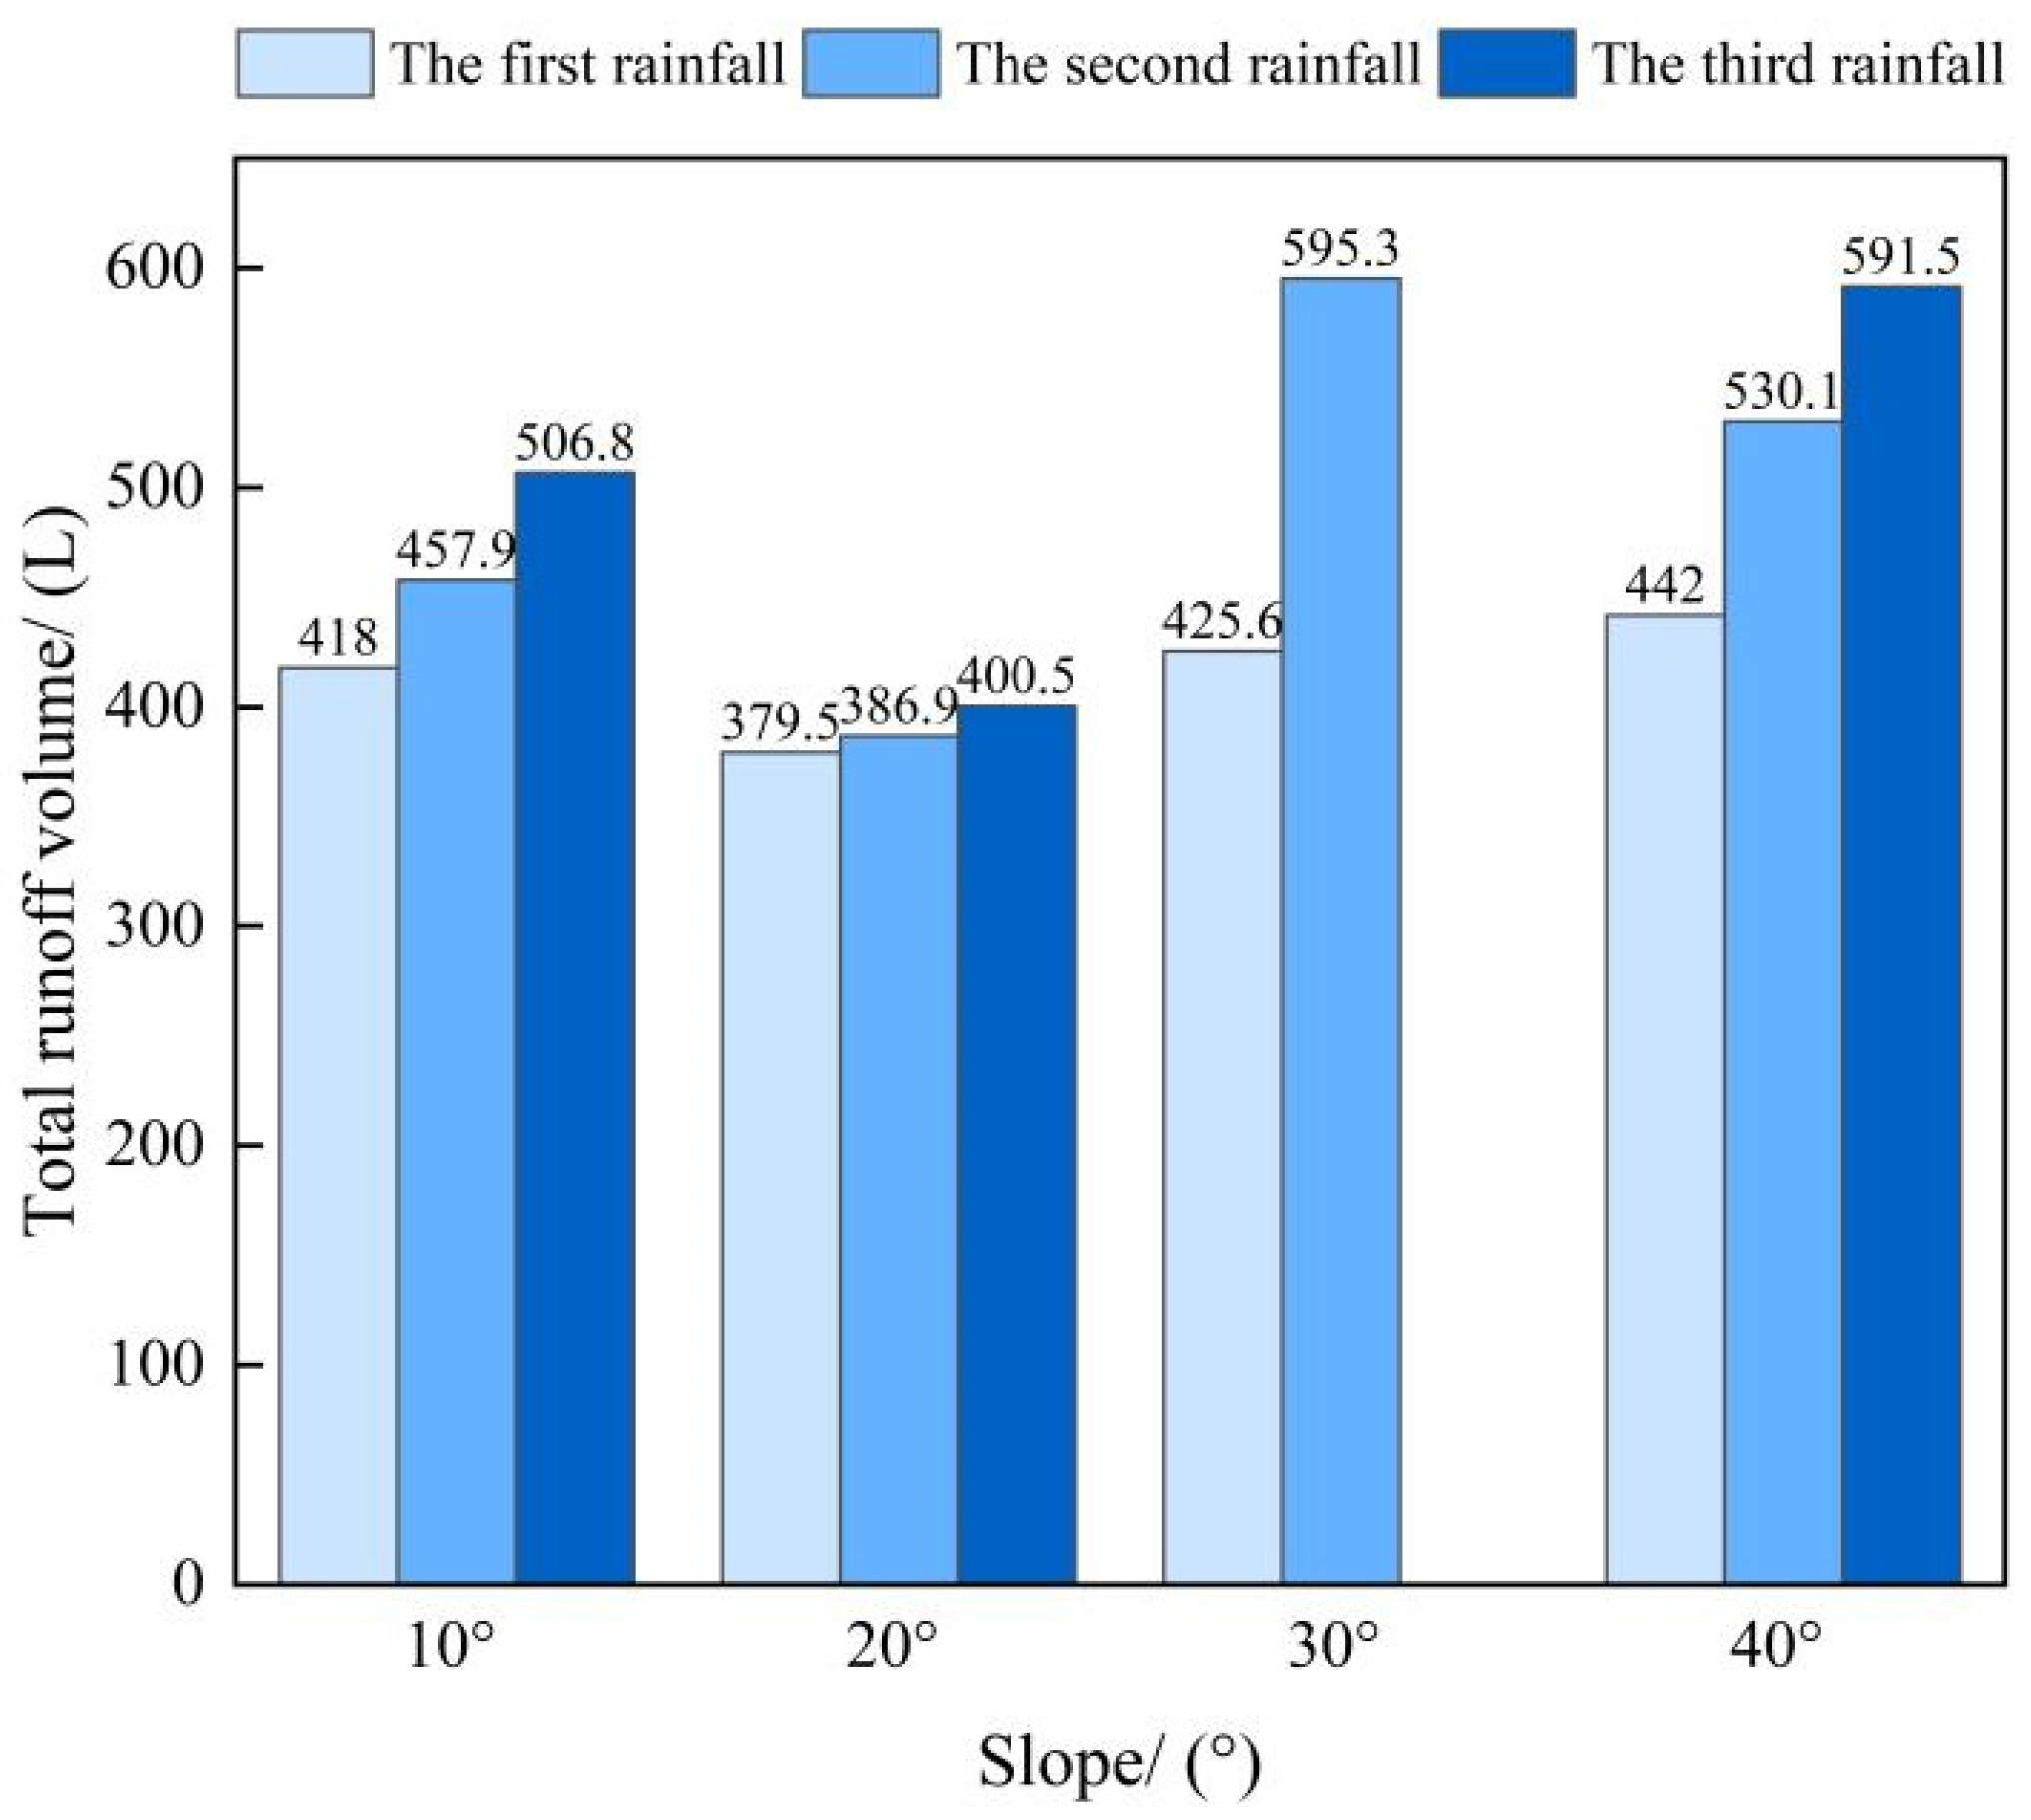
4.2.1. Characterization of Total Runoff under Intermittent Rainfall Conditions

The data from the third rainfall experiment on the 30° slope were excluded due to the severe erosion and local bottoming out of the slope after the second rainfall event. Based on the test data, it was evident that the variation in the total runoff amount at different slopes followed a pattern of third field > second field > first field (Figure 6). The total runoff volume for each slope in the second field increased by 9.5%, 1.95%, 39.87%, and 19.94%, respectively, compared to the first field. The third rainfall event at 10°, 20°, and 40° increased the total runoff volume by 21.24%, 5.54%, and 33.82%, respectively, compared to the first rainfall event. This represents a notable increase compared to the second rainfall event. As the slope increased, the total runoff generated by different rainfall events exhibited a general pattern of decreasing and then increasing. Notably, all three rainfall events resulted in the least amount of runoff at a 20° slope.

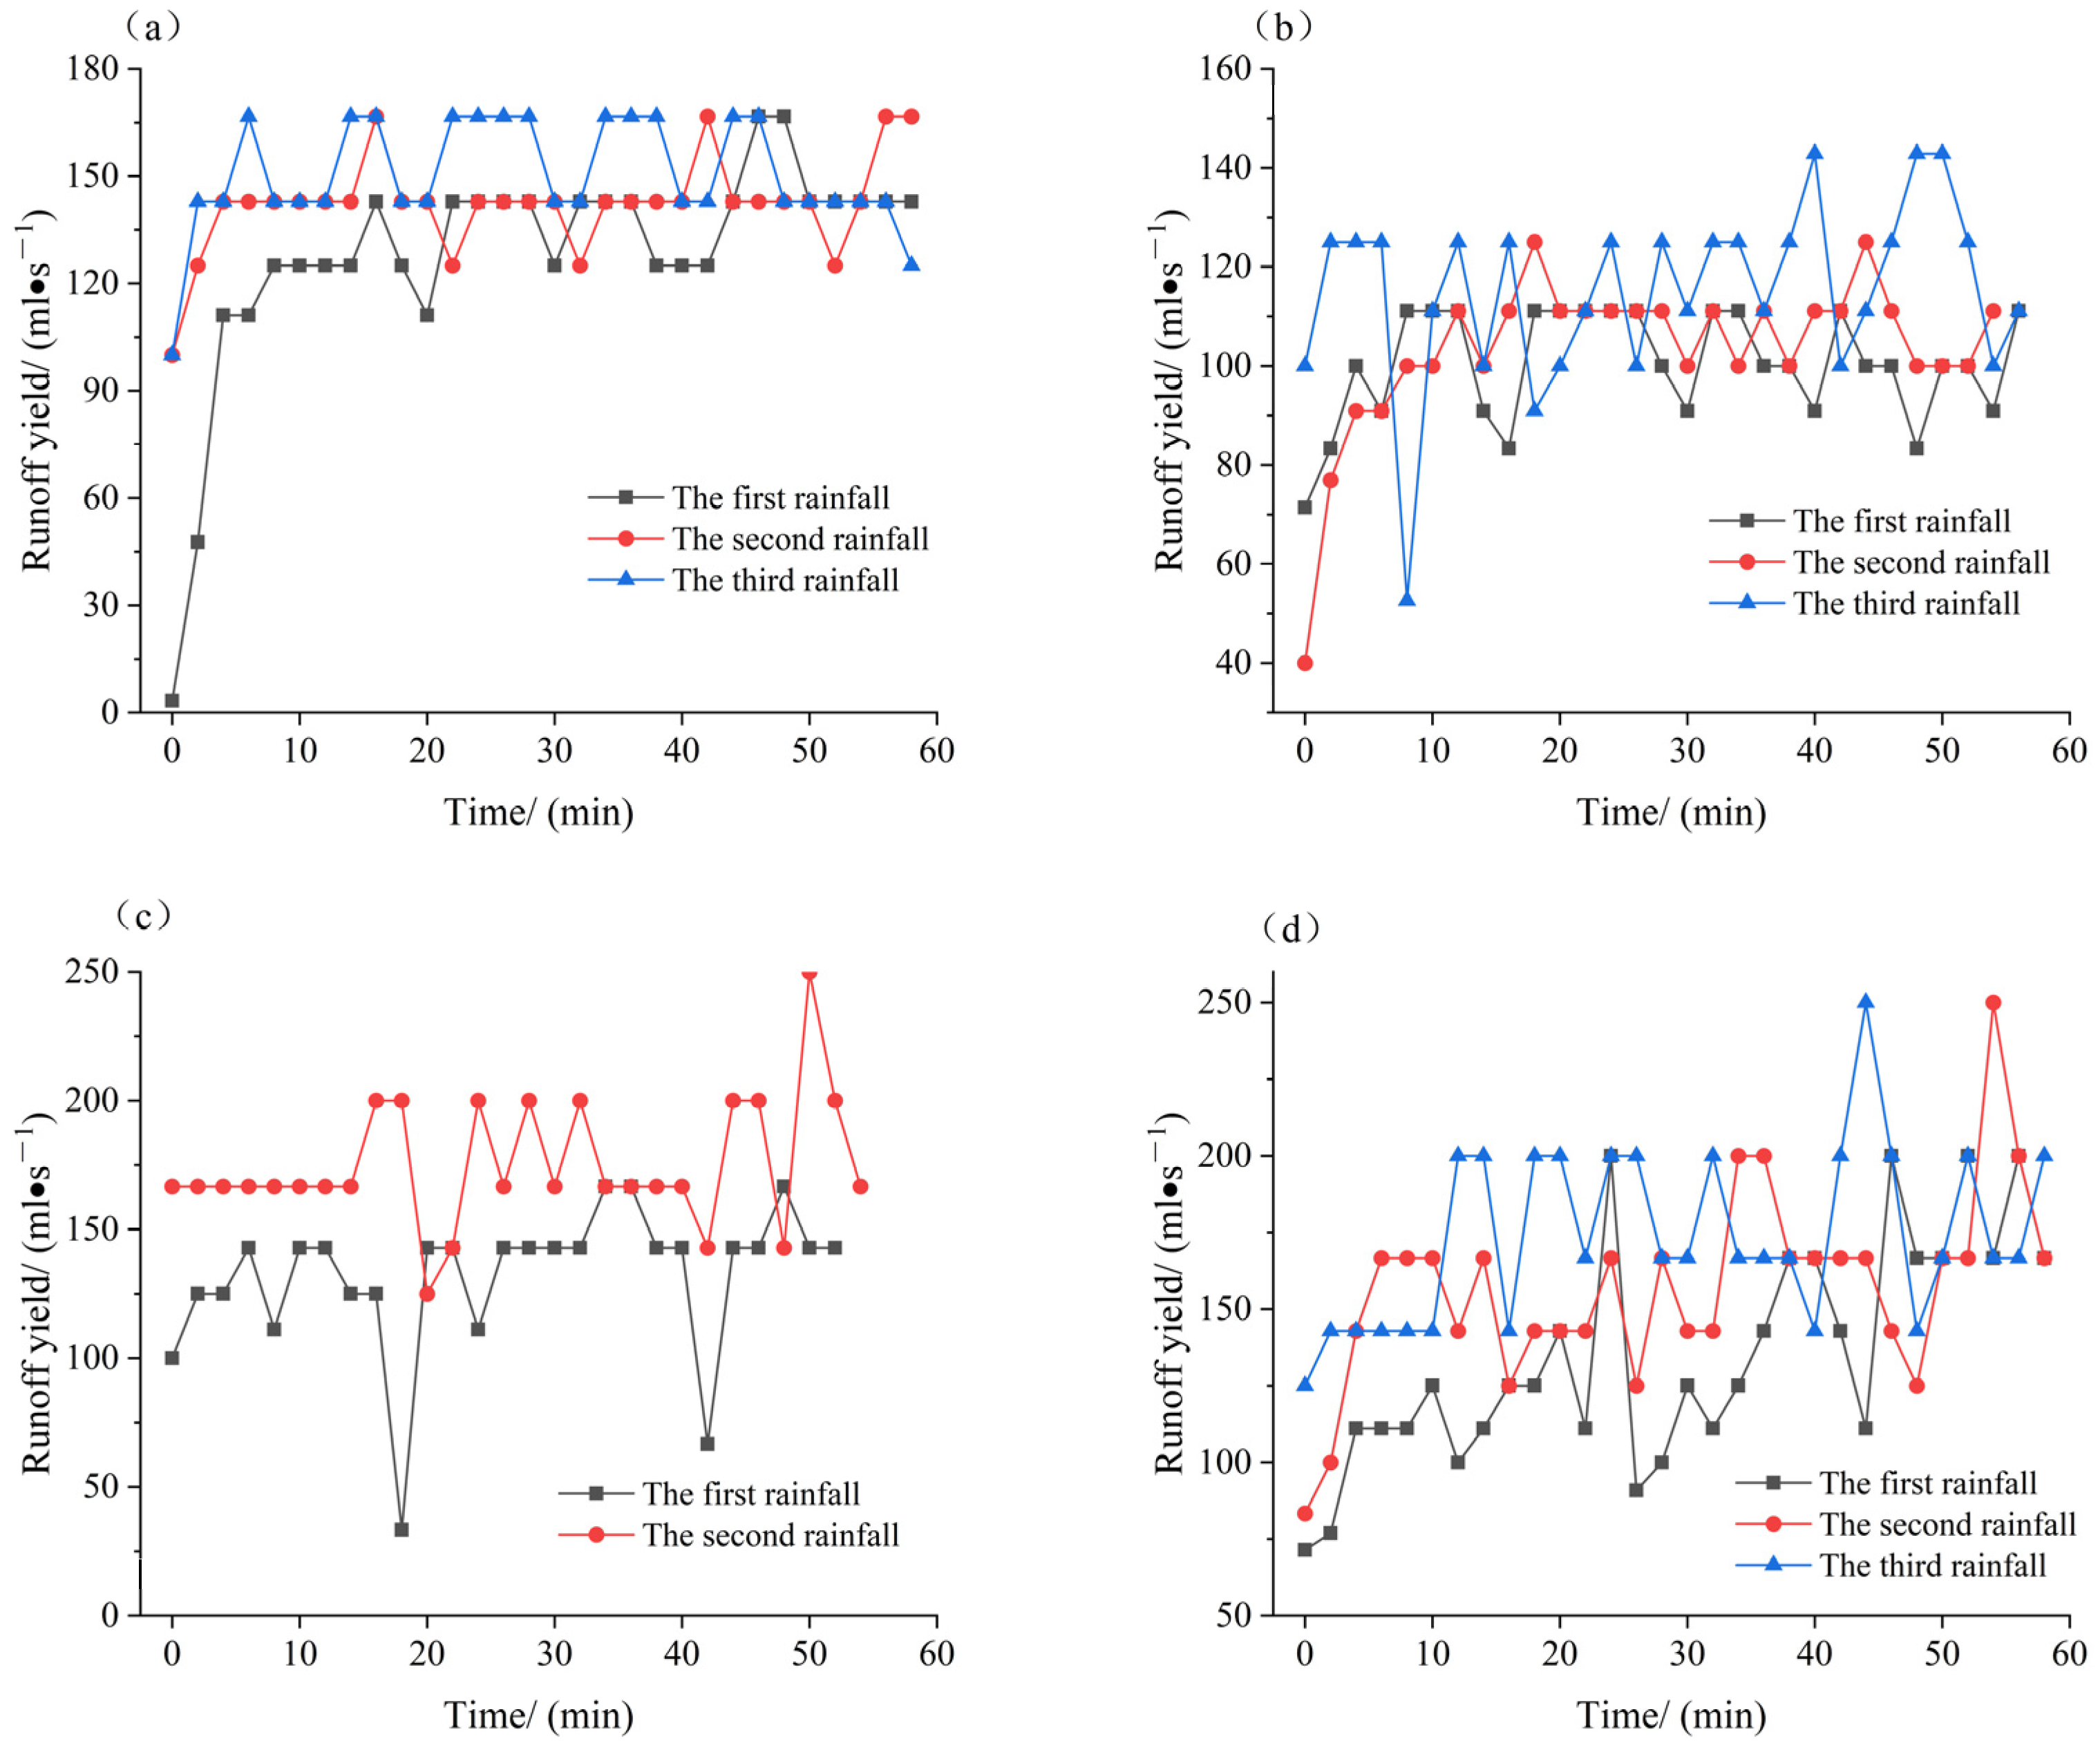
4.2.2. Characteristics of Changes in Yield Rate for Different Rainfall Events on the Same Slope

The flow production rate is a key indicator used to assess the erosion intensity of slopes. For the fully weathered granite backfill, the average flow production rates on slopes with angles of 10°, 20°, 30°, and 40° were consistently higher post-field than pre-field under the three artificially simulated rainfall conditions (Figure 7). Under the same slope conditions, the flow production rate exhibited a rapid increase in the initial phase, followed by stable oscillations within a certain range for different rainfall events. The subsequent rainfall event reached stabilization in a shorter period compared to the previous one (Figure 7). On 10° and 20° slopes, the flow production rate from the first rainfall event exhibited a rapid increasing trend in the initial 10 min, followed by stabilization. There was a rapid increase in the flow production rate for the second and third rainfall events within the first 5 min, followed by a relatively stable change. All three rainfall events peaked over a period of more than 40 min. On 30° slopes, the flow production rate from the first rainfall event showed a small increase and decrease in the early part of the period, followed by stabilization. The production and flow rates for the second rainfall event reached a plateau in the first 15 min, maintaining a steady state in the middle and late stages, with the peak occurring in the later stages. Under the 40° slope conditions, the rate of flow production during the first, second, and third rainfall events exhibited an increasing trend throughout the phase, with peaks occurring in the middle and late stages. In the middle and late stages of rainfall, the rate of flow production exhibited multiple peaks and valleys. These patterns of change may be influenced by soil infiltration, runoff, erodibility, and soil resistance to erosion. The interactions between these factors may vary at different slope gradients and rainfall events, resulting in fluctuations in flow production rates.

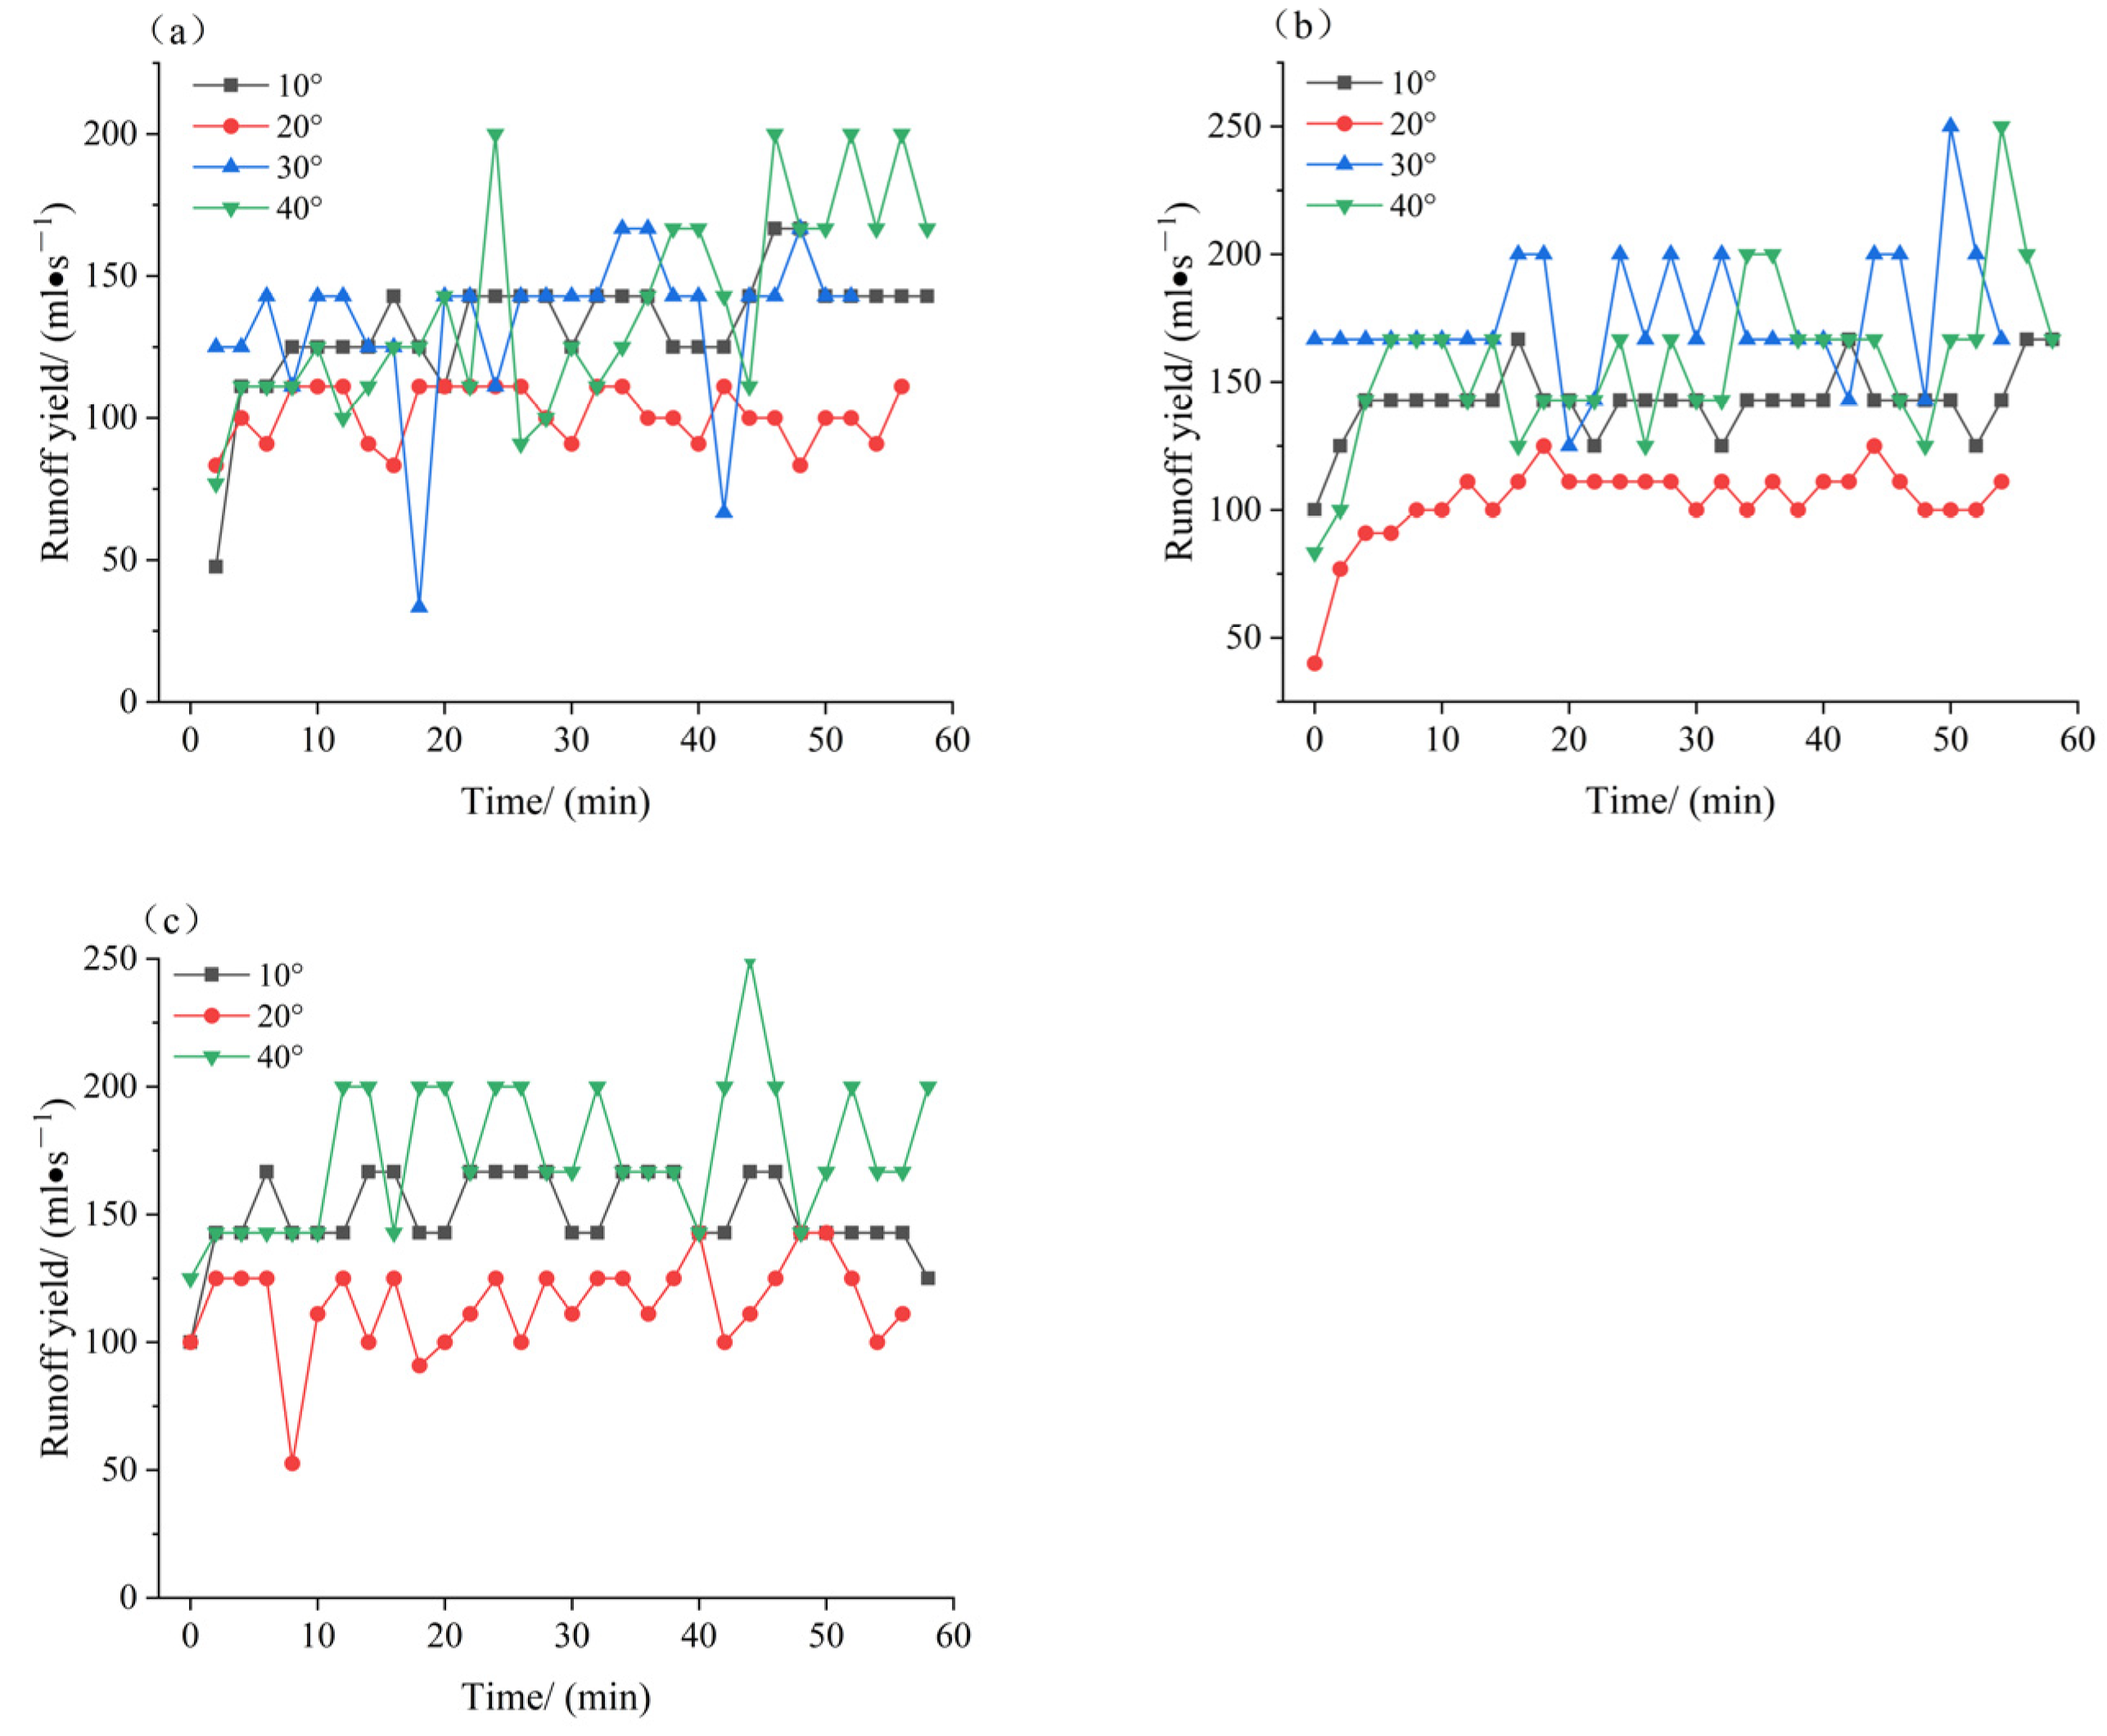
4.2.3. Characteristics of Changes in Flow Production Rates for the Same Rainfall Event at Different Slopes

Under the same rainfall event with varying slopes, the average flow production rate followed the sequence of 40° > 30° > 10° > 20°, with the 30° slope slightly surpassing the 40° slope during the second rainfall event (Figure 8). This pattern aligned with the trend observed in the total runoff amount, indicating a consistent decrease and subsequent increase in the flow production rate with an increasing slope. On a 20° slope, the slope yield rate was the lowest for all three rainfall events, suggesting that the runoff from the slope was minimal at a 20° incline, allowing for greater water infiltration into the slope. The cause analysis for this phenomenon is consistent with the cause analysis of the total runoff change. Additionally, as depicted in Figure 8, the flow production rate for each slope experienced a rapid increase in the early stages. As the rainfall progressed, the flow production rate stabilized for the 10° and 20° slopes, displaying a relatively modest change. On the other hand, the slopes of 30° and 40° exhibited a more pronounced and fluctuating pattern in flow production rates after the initial twenty minutes. This was primarily attributed to the relatively small size of the gullies generated by the 10° and 20° slopes, where the occurrence of bank collapse during rainfall was not prominent. However, as the slope gradient rose, enhancing the erosive potential of the slope surface, deeper gullies were formed, leading to the noticeable occurrence of bank collapse. Consequently, this dynamic contributed to significant fluctuations in the rate of flow production.

4.3. Characteristics of Changes in Sediment Production under Intermittent Rainfall Conditions

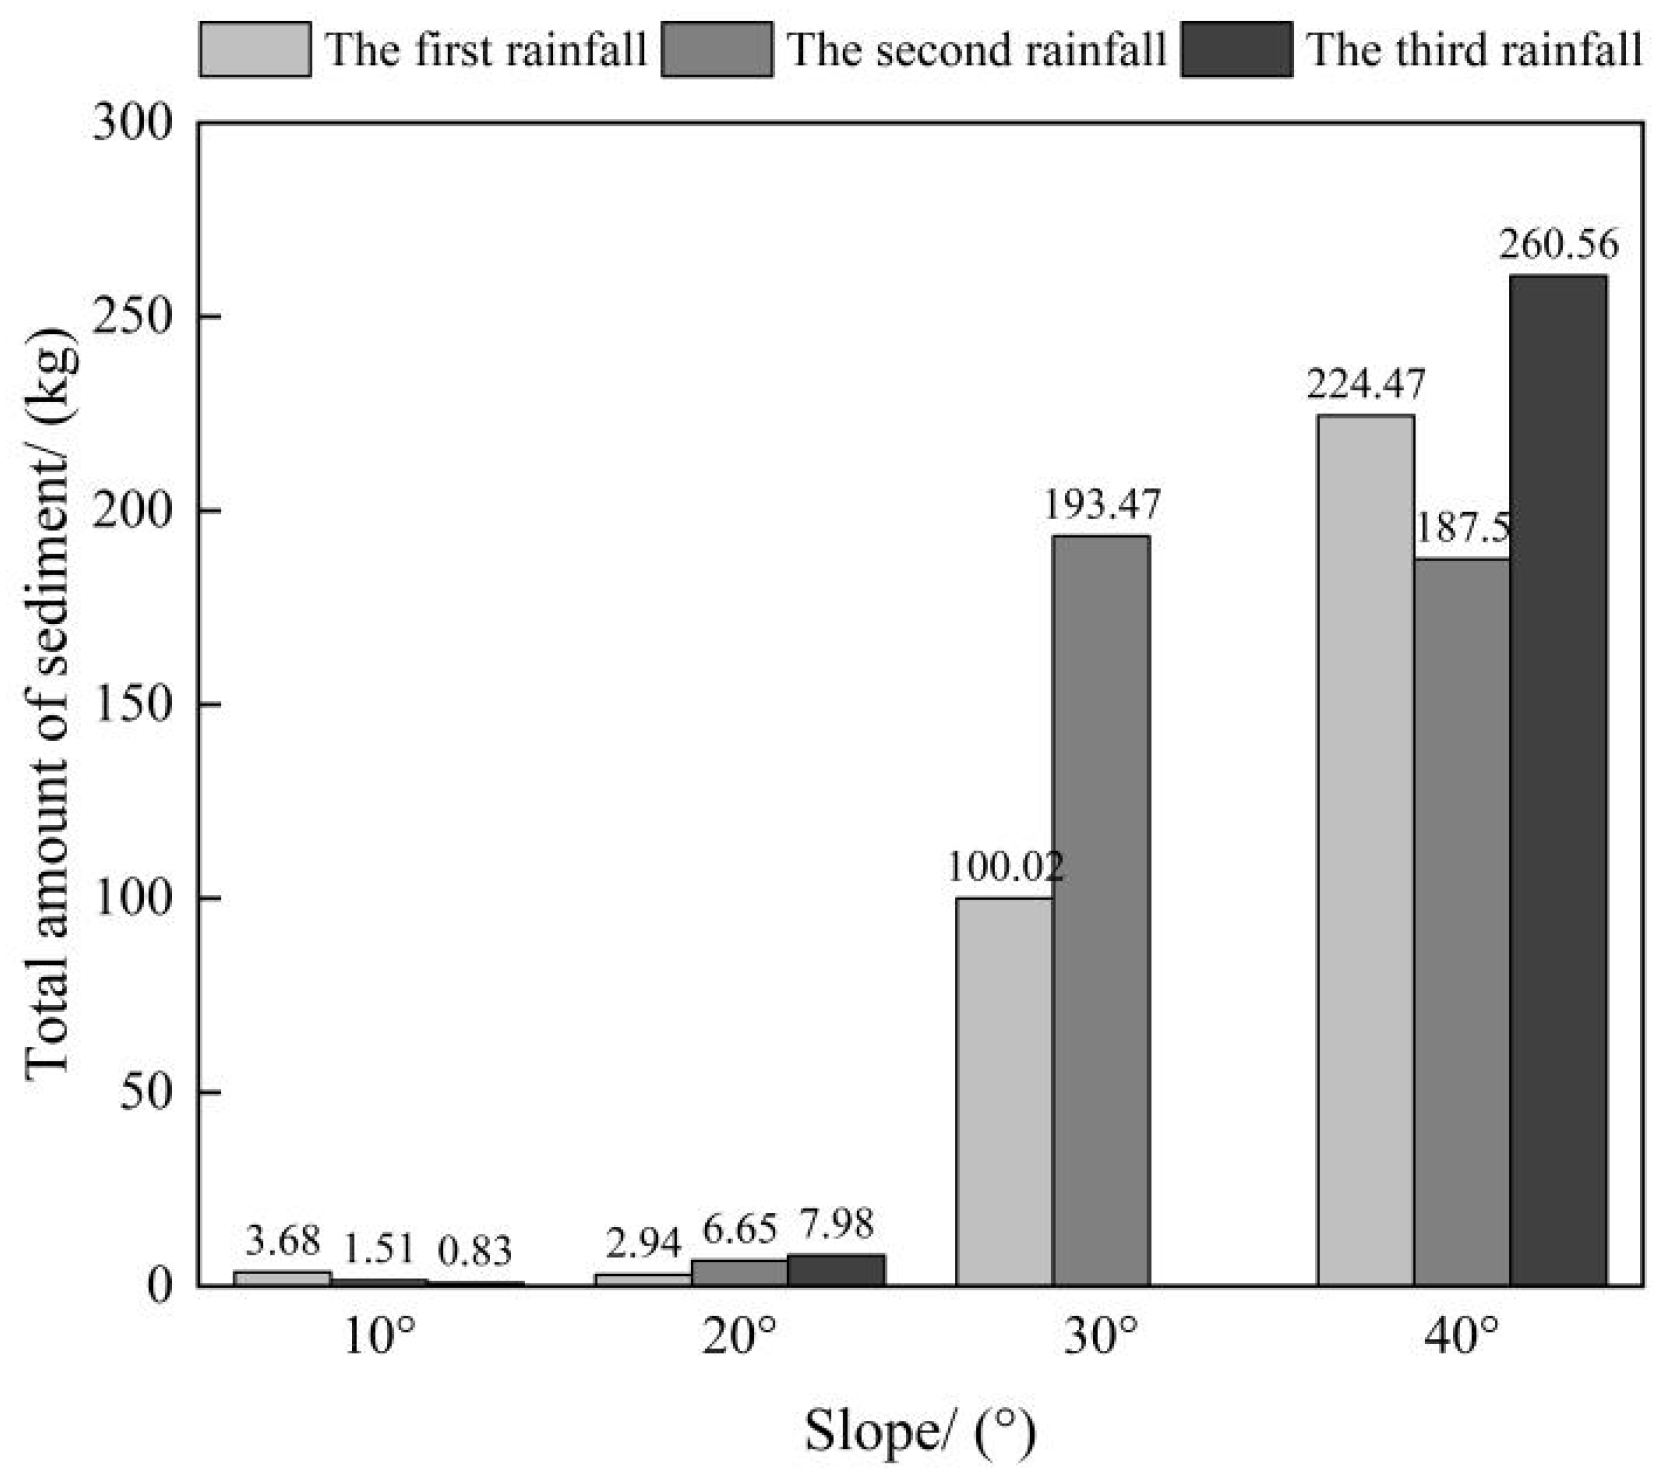
4.3.1. Characteristics of Total Sand Production under Intermittent Rainfall Conditions

The data from the artificial rainfall simulation experiments revealed that the total sand production at the conclusion of the three rainfall events increased with the slope gradient on all slopes, with a notable abrupt change observed on the 30° and 40° slopes (Figure 9). Following the initial rainfall, sand production on the 40° slope was 60.93 times higher than on the 10° slope, 76.35 times higher than on the 20° slope, and 2.24 times higher than on the 30° slope. Following the second rainfall event, sand production on the 40° slope was 123.86 times higher than on the 10° slope, 28.22 times higher than on the 20° slope, and 0.97 times higher than on the 30° slope. Following the third rainfall event, sand production on the 40° slope was 276.5 times higher than on the 10° slope and 32.64 times higher than on the 20° slope. As depicted in Figure 8, the total sand production during the second field on each slope at 10°, 20°, 30°, and 40° increased by −58.98%, 126%, 93.4%, and −16.47%, respectively, in comparison to the first field. The increment in the total sand production on each slope during the third rainfall event, compared to the first rainfall event, was −77.36%, 171.5%, and 16.05%, respectively.

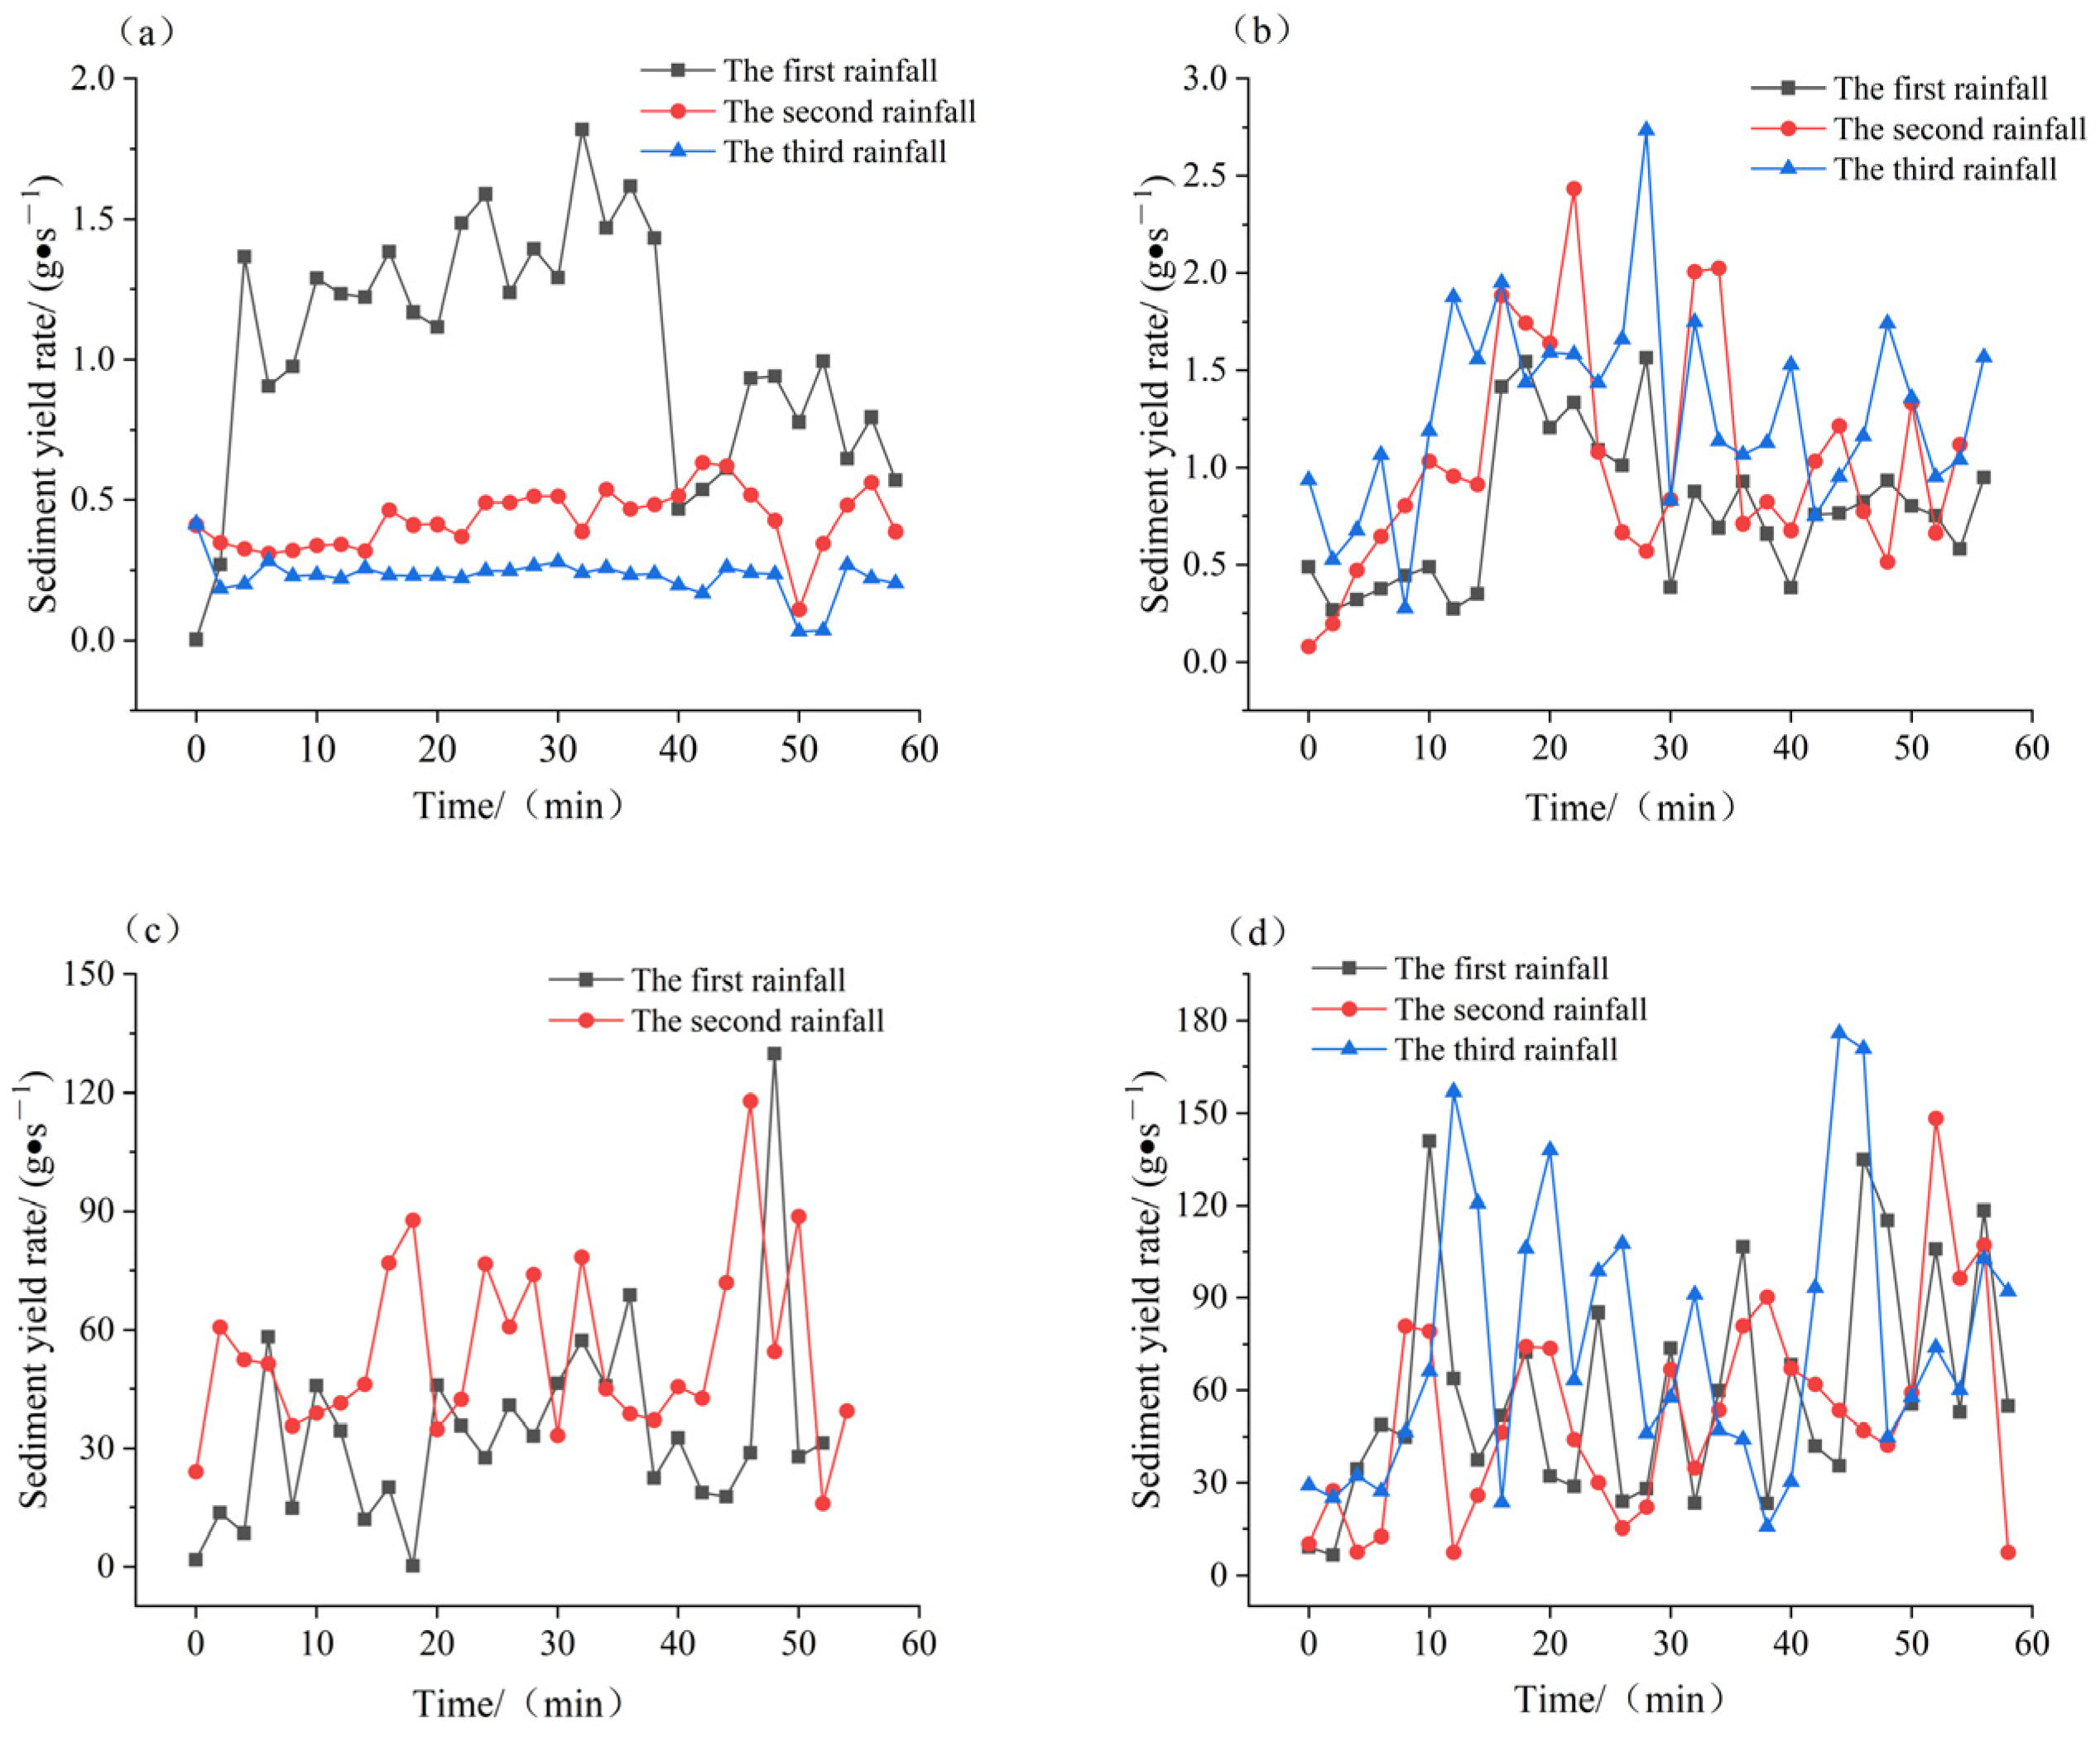
4.3.2. Characteristics of Changes in Sand Production Rates for Different Rainfall Events on the Same Slope

Under the 10° slope condition, the sand production rate during the first rainfall event exhibited a rapid increase, followed by a decline with the prolongation of the rainfall duration. Subsequently, it gradually stabilized, reaching its peak at 32 min (Figure 10a). This phenomenon was attributed to the initial rainfall, where the bare slope surface harbored a significant amount of loose debris material. Raindrop splash erosion also generates some debris particles, and surface runoff predominantly transports these materials, leading to a rapid increase in the sand production rate that peaks. However, as the formation of a crust on the slope surface occurs, the sand production rate subsequently decreases. Throughout the second and third rainfall events, the sand production rates exhibited overall stability, fluctuating within a narrower range.
On the 20° slope, the sand production rates during the three rainfall events exhibited a rapid increase followed by a decrease, oscillating within a certain range as the rainfall duration extended. Notably, the oscillation amplitude of the sand production rates during the second and third rainfall events was significantly larger than that of the first event. Moreover, the sand production rate during the third event exceeded that of the second event. This observation indicates that intermittent rainfall exacerbated the erosion of the slope surface (Figure 10b). From the observation of the experimental process, it is evident that the initial slope erosion was primarily characterized by surface erosion. This is attributed to the loose structure of the fully weathered granite backfill, which, during early rainfall, experienced splash erosion from raindrops. This process generates a substantial quantity of fine particles. These fine particles are transported to the bottom of the slope with the runoff from the slope surface, resulting in a gradual increase in the sand production rate during the early stages of sand production. Around 15 min later, gullies started to form on the slope surface, marking the transition from slope erosion to gully erosion. As the gullies developed, the sand production rate increased rapidly. With the ongoing rainfall, gully erosion progressed gradually and steadily. The oscillating changes in the sand production rate were primarily induced by the collapse of the gully banks. Following the initial rainfall, a period of natural settlement took place, causing an increase in the density of the fully weathered granite backfill. In the initial phase of the second rainfall event, rainwater collected and then followed the path of the gully formed during the first rainfall. The sand production rate gradually rose, and when the soil on the gully bank reached saturation, both sides of the bank slumped, leading to an exceedingly rapid increase in the sand production rate. Subsequently, as the rainfall persisted, gully erosion gradually stabilized and developed.
The characteristics of the third rainfall event mirrored those of the second rainfall event. The pattern of change in the sand production rate on the 30° and 40° slopes was akin to that on the 20° slopes, albeit with an increasing order of magnitude. Moreover, on larger slopes, the oscillation amplitude of the sand production rate was more significant (Figure 10c,d). This is primarily attributed to the heightened intensity of gully cutting with an increasing slope, leading to more frequent collapses of gully bank slopes. As a consequence, the sand production rate undergoes more pronounced oscillations.

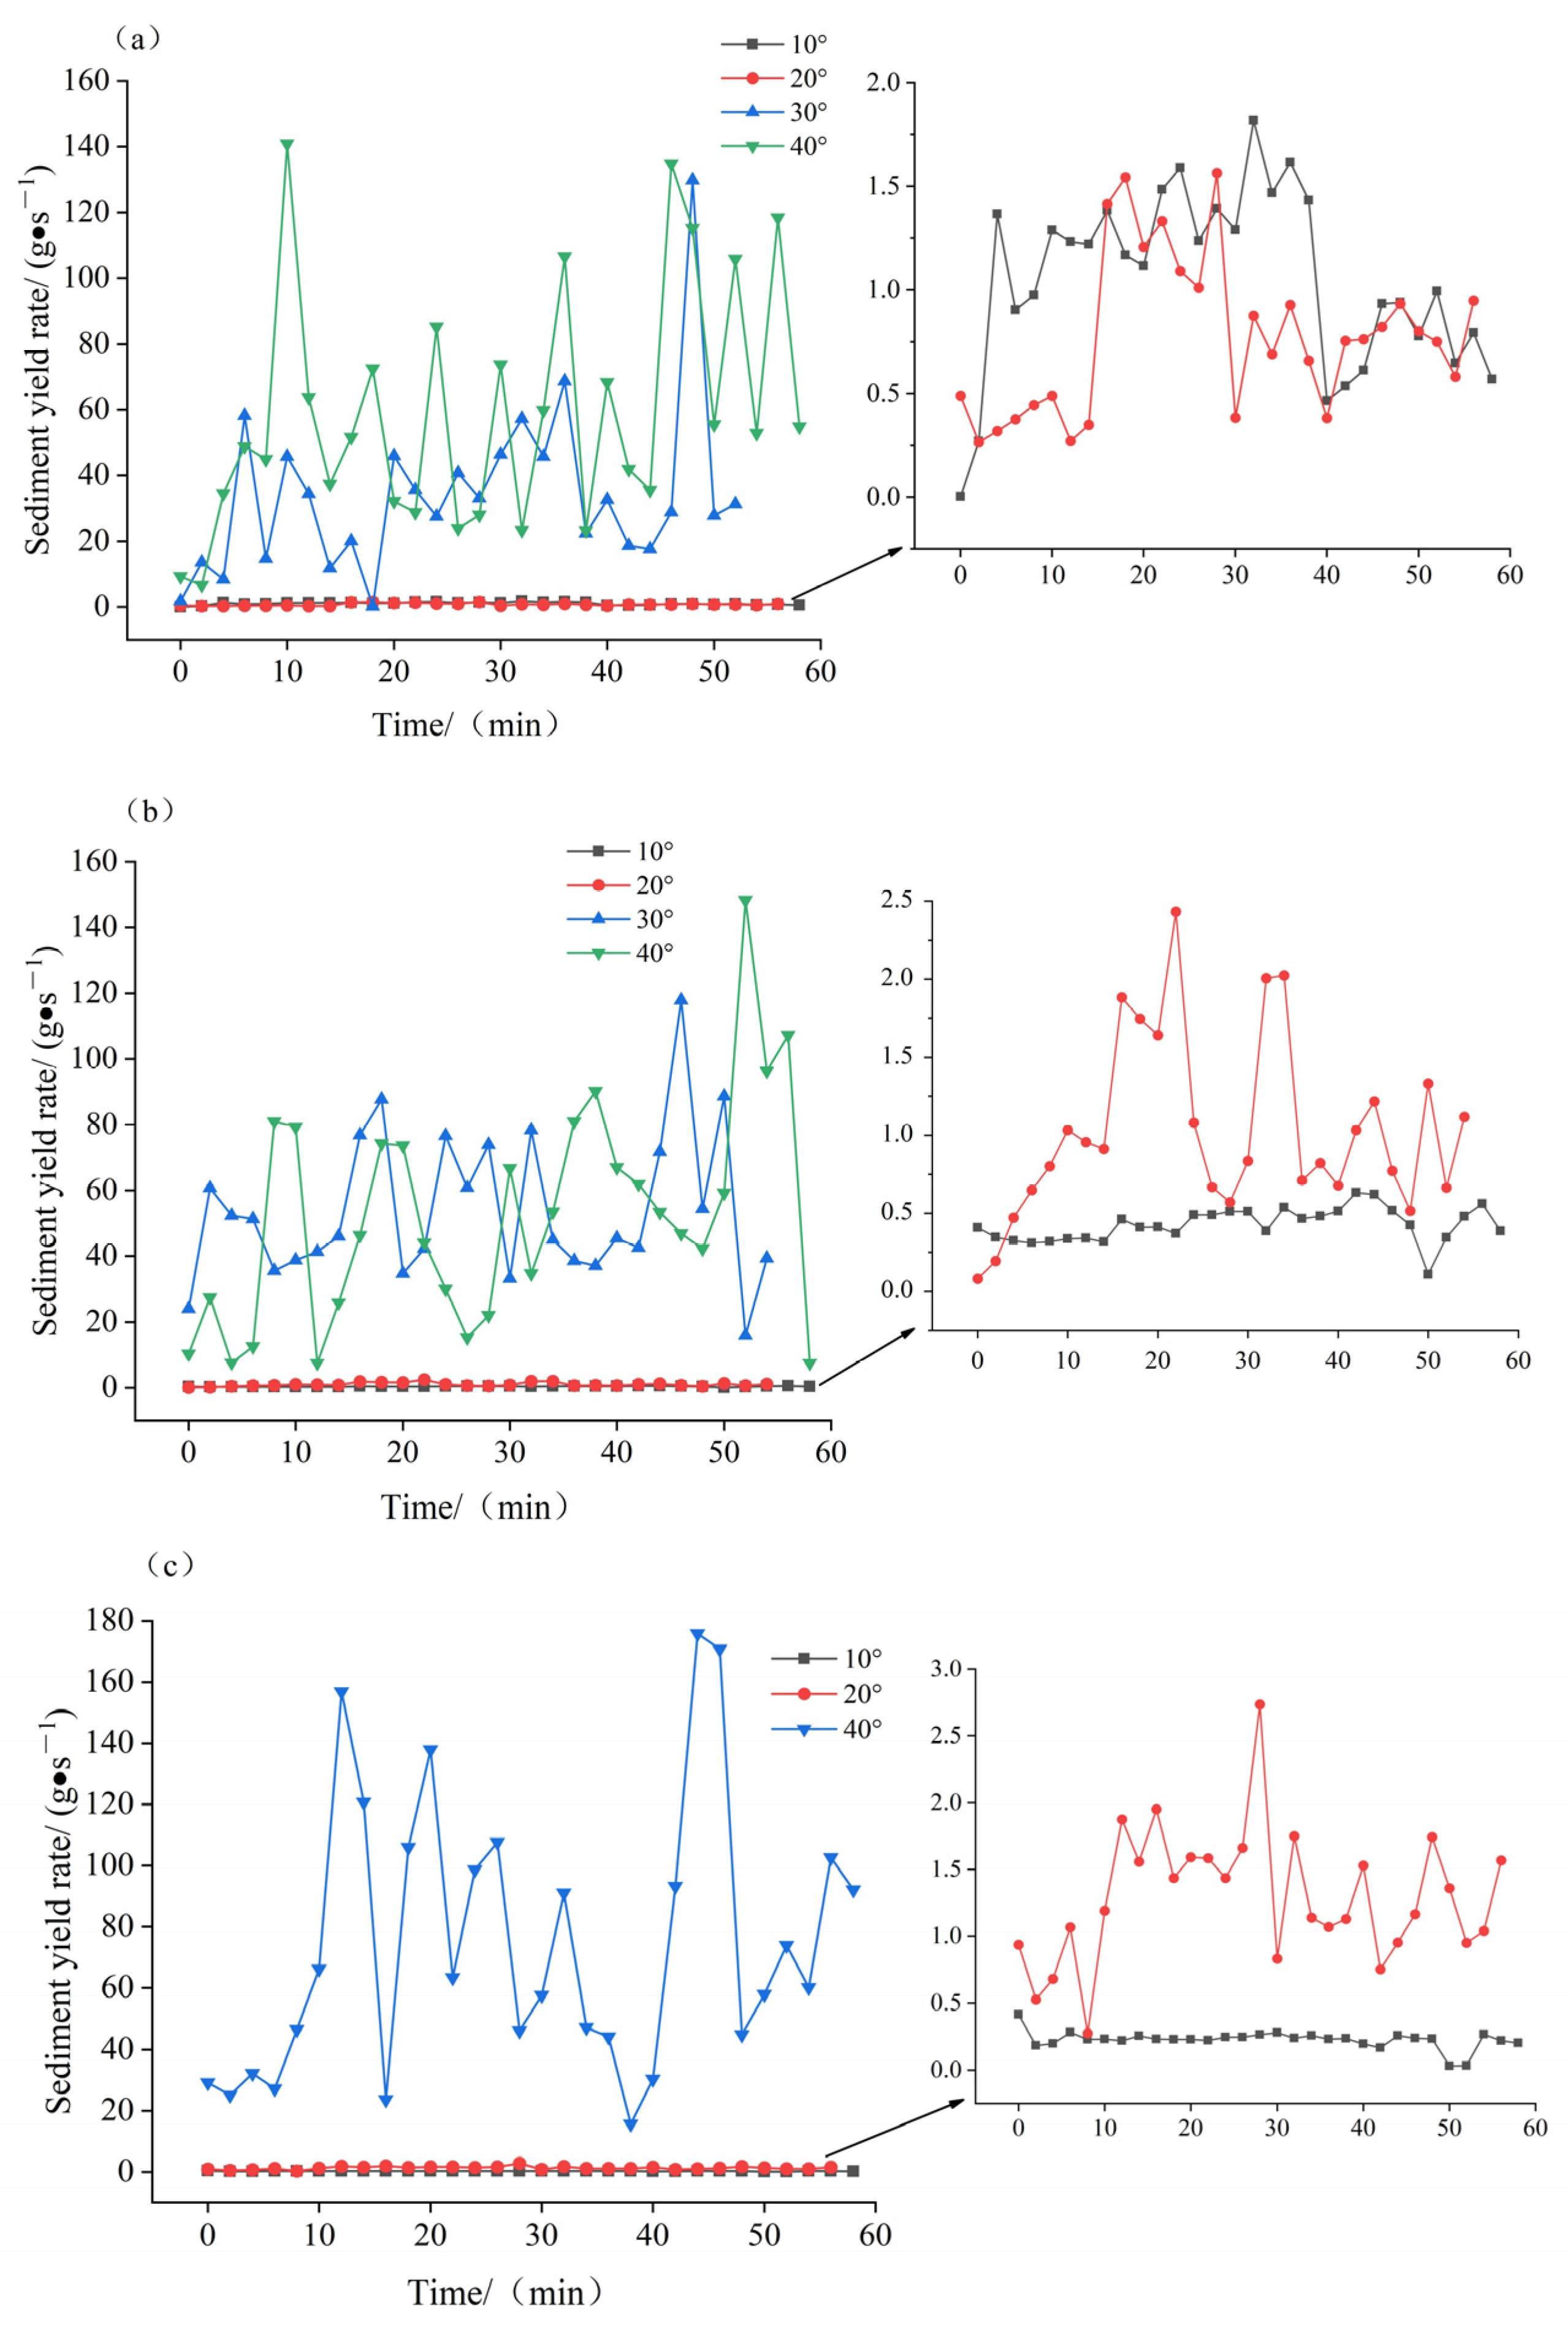
4.3.3. Characteristics of Changes in Sand Production Rates for the Same Rainfall Event at Different Slopes

Based on the results of the artificial rainfall simulation tests conducted on various slopes, it is evident that, during the first rainfall event, the fluctuations in the sand production rate at the 10° and 20° slopes were relatively minor, maintaining an overall state of stability throughout the entire rainfall process. The sand production rates at 30° and 40° experienced a rapid increase within the first ten minutes, followed by relatively large fluctuations in the middle and late periods. The sand production rates exhibited multiple peaks and valleys, with the peaks occurring around the forty-minute mark. During the second rainfall event, the sand production rates under the 10° and 20° slopes resembled those of the first rainfall event and remained relatively consistent throughout. The time required to attain a stabilized sand production rate during the second rainfall event on the 30° and 40° slopes was further reduced. Additionally, the magnitude of change in the sand production rate was smaller than that observed during the first rainfall event, with peaks occurring in the latter part of the rainfall process. During the third rainfall event, the sand production rates on the 10° and 20° slopes exhibited patterns similar to the previous two rainfall events, maintaining a generally smooth variation throughout the rainfall period. However, the sand production rates at 40° experienced dramatic overall fluctuations. Comparing the sand production rates of different slopes across the three rainfall events, the average sand production rate was in the order of 40° > 30° > 10° > 20° for the first rainfall event, 30° > 40° > 20° > 10° for the second rainfall event, and 40° > 20° > 10° for the third rainfall event (Figure 11). From the observed patterns of sand production, it is evident that, in the same rainfall scenario, the sand production rate did not exhibit a linear change with the slope. During the first rainfall event, the sand production rate initially decreased and then increased with the slope. In contrast, during the second rainfall event, the sand production rate showed a fluctuating pattern, initially increasing and then decreasing with the slope. The sand production rate during the third rainfall event exhibited a gradual increase with an ascending slope.

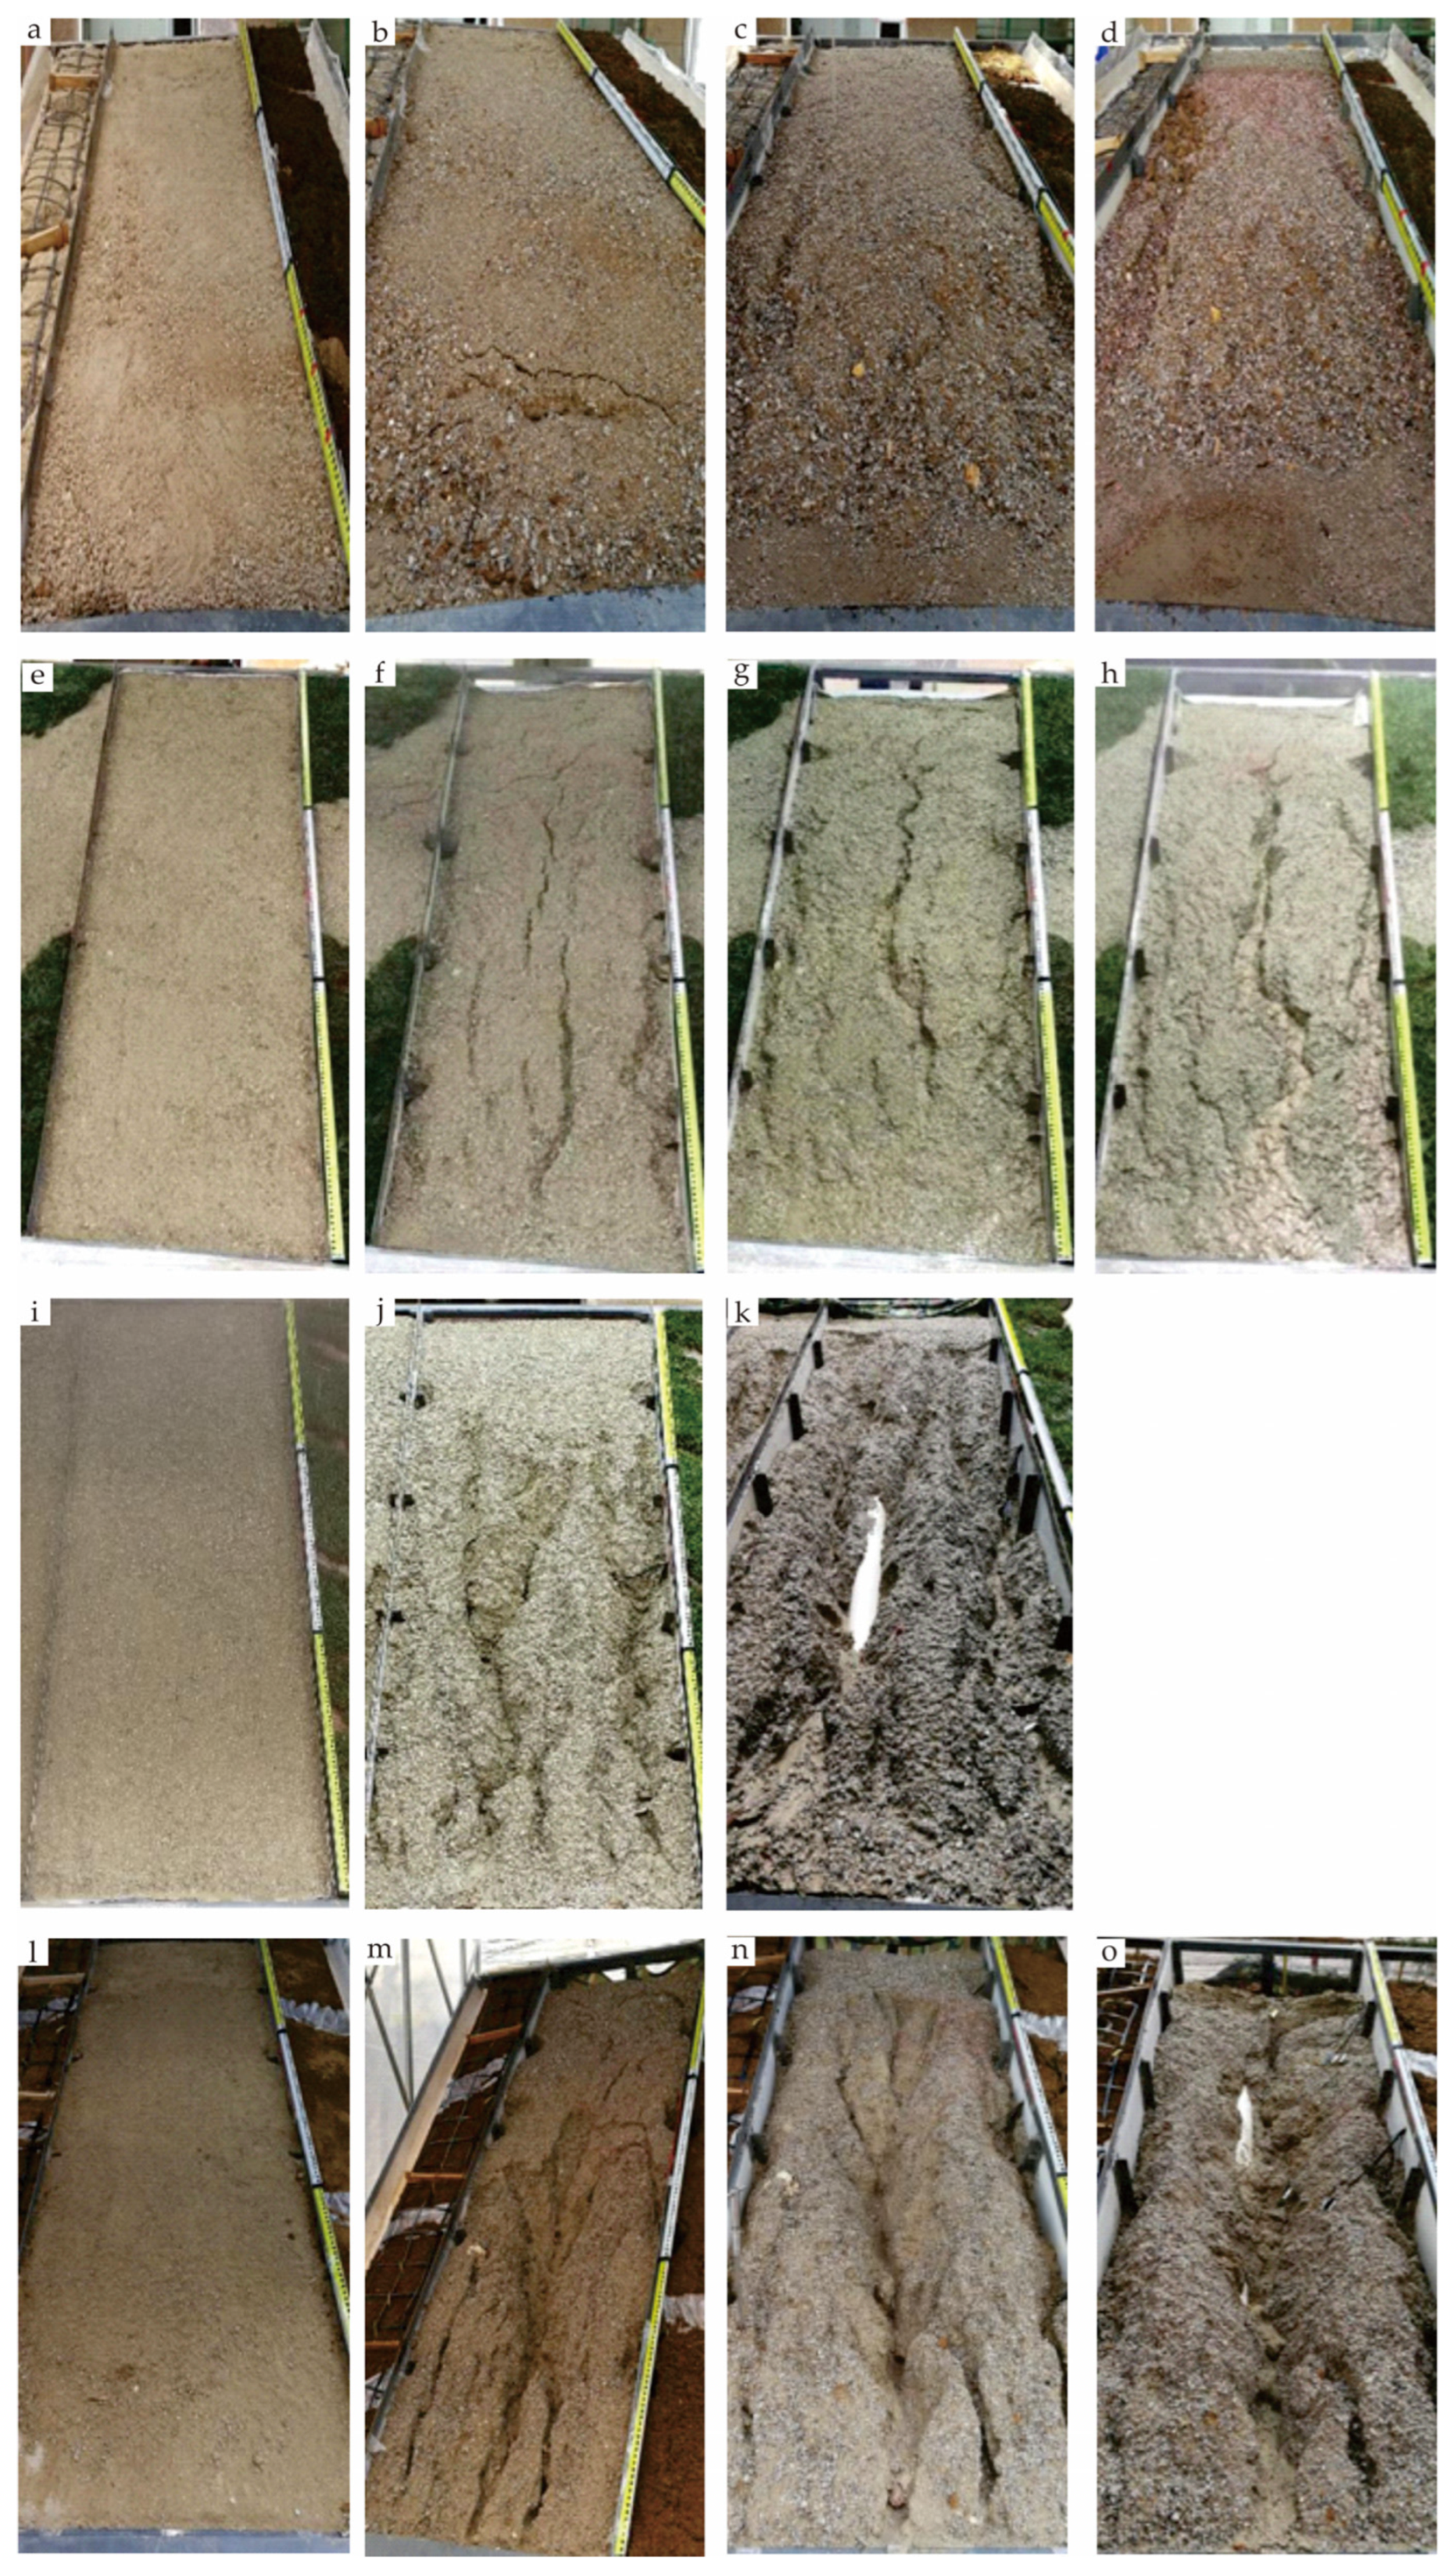
4.4. Characteristics of Changes in Slope Erosion under Intermittent Rainfall Conditions

Through an analysis of rainfall field photos (Figure 12), it is evident that the erosion intensity on the same slope at different times follows the sequence of third > second > first. In order, the slope damage location is at the bottom, middle, and top of the slope. In terms of soil erosion severity, the order is 40° > 30° > 20° > 10°. The more pronounced the slope, the greater the gravitational potential generated by the runoff from the slope. With an equal number of rainfall events, 40° slopes exhibit a faster drainage rate, preventing rain accumulation on the slope surface. In contrast, there is a slight accumulation of rain at the base of 20° medium–gentle side slopes, and a relatively significant amount of rain accumulates on 10° low–gentle slopes.

5. Discussion

This study delved into the impact of intermittent rainfall and the slope gradient on the processes that generate flow during erosion and contribute to soil denudation. This investigation specifically focused on the erosion process occurring in slopes filled with fully weathered granite backfill. Regarding the mechanisms of slope flow and sand production, under specific rainfall intensity and catchment area conditions, the production of slope flow primarily hinges on the soil’s infiltration characteristics [55,56]. In contrast, the sand production on slopes predominantly results from gully wall collapse and runoff scouring [57,58,59].

5.1. Influence of Rainfall Events and Slope on Runoff Formation Mechanisms

With an increase in slope gradient, the effective rain-bearing area of the slope gradually diminishes, while the volume of soil within the test trench remains constant. Consequently, the quantity of water necessary for the soil to reach its holding capacity remains essentially unchanged, leading to the prolongation of the initial flow production time. Conversely, with an increase in slope gradient, the force of gravity intensifies in the downslope direction. This augmentation results in an accelerated flow velocity on the slope, consequently reducing the time required for runoff to reach the outlet to some extent. Hence, the interaction between these two factors renders the relationship between the initial flow production time and slope more intricate, displaying a non-linear pattern.
Research indicates that, during intermittent rainfall, the fully weathered granite backfill slopes at a slope of 20° exhibit the least total runoff (Figure 6). On more gentle slopes, the scouring force of rainfall-induced slope runoff is inadequate, leading to the formation of a crust as the topsoil interacts with water [55]. This crust hinders surface water infiltration, potentially resulting in a greater total amount of surface runoff under gently sloping conditions. With an elevation in the slope gradient, the downward force exerted by soil particles on the slope surface intensifies. Consequently, the surface crust of the slope becomes more susceptible to disruption. The structure of the fully weathered granite backfill tends to be loose, characterized by a high permeability coefficient. This allows a portion of the surface water to infiltrate into the slope, forming groundwater and subsequently reducing the overall volume of surface runoff. Simultaneously, with an increase in slope gradient, the effective area for the receipt of rainfall in the experimental steel channel diminishes. The reduced effective rainfall-receiving capacity of the slope further contributes to the overall decrease in the total runoff from the slope. Nevertheless, when the slope exceeds 20°, an elevation in the slope gradient results in an increased downward force due to runoff gravity, hastening the runoff rate. Raindrops propelled along the slope travel a greater distance, reducing the potential for water to infiltrate the soil and leading to a diminished rate of infiltration. This circumstance favors an increase in the overall runoff volume. The second rainfall event exhibited extreme values on a 30° slope, likely attributed to the fact that, as the slope steepens, the reduction in the effective rainfall-receiving area exerts a more pronounced impact on the total net flow compared to the influence of runoff gravity.
The average yield rate of the slope under each gradient indicates that the post-field intermittent rainfall surpasses the pre-field conditions. This is primarily attributed to the loose structure of the fully weathered granite backfill, which is characterized by substantial porosity and a high permeability coefficient. During the initial rainfall, when the soil water content is low, a portion of the rainfall infiltrates into the soil, forming groundwater and consequently resulting in reduced surface runoff. Following the initial rainfall and the commencement of the second rainfall period, the soil reaches saturation, leading to a reduction in water infiltration. Subsequently, the rainfall is predominantly discharged from the slope in the form of surface runoff. Simultaneously, the splattering effect of rainfall on the soil surface particles results in tiny soil particles and other fine particulate matter filling the pores of surface pits. This process diminishes the soil’s infiltration capacity.
The transformation characteristics of the flow production rates at different sites under the same slope are consistent (Figure 7). This uniformity primarily arises from the initial stage, where the surface soil is not saturated, allowing part of the rainwater to infiltrate into the slope. Consequently, the net flow on the slope surface is limited. As the shallow surface soil on the slope gradually attains saturation, reaching a stabilized subsurface seepage, the runoff on the slope surface gradually stabilizes. Slight fluctuations primarily result from the collapse of alluvial gully banks, obstructing the gully, and the erosive action of water washing away the gully. The shorter time required for the stabilization of the flow production rate in the subsequent rainfall event compared to the preceding one can be attributed to the higher soil moisture content following the initial rainfall test. Additionally, the gullies have already formed, accelerating the saturation of shallow surface soils on all slopes at the onset of the subsequent rainfall event. This rapid saturation leads to the swift formation of runoff, thereby shortening the time needed for runoff stabilization on the slopes.

5.2. Influence of Rainfall Events and Slope Gradient on Sand Production Mechanisms on Slopes

The experimental results reveal that, during the initial rainfall, sand production on the slope initially experiences a slight decrease followed by a sharp increase (refer to Figure 9). This pattern bears a resemblance to the rate of flow production. Notably, at a slope of 20°, there is an inflection point. An analysis of the conditions on gentle slopes indicates a larger rainfall-receiving area, potentially influencing the overall amount of sand production. Concurrently, at a 20° slope, the weakening of hydrodynamic forces due to a reduction in the rate of flow production appears to result in a reduction in the total amount of sand production. Beyond the 20° threshold, as the slope increases, there is a corresponding elevation in the downward force of soil particles along the slope and an enhancement in the scouring ability of water down the slope. Consequently, the total amount of sand production experiences a rapid increase. At a 40° slope, the weak stability of the slope fosters an exponential increase in the total amount of sand production as the interaction between slope instability and erosion becomes prominent. Beyond a 20° slope, the total sand production during the latter rainfall surpasses that of the former. The experimental process revealed that, with an increase in the number of experimental sites, the slope erosion gully deepened and widened, accompanied by an escalation in the occurrence of bank collapse (Figure 12e,f,g,h). Consequently, this phenomenon contributed to an increased level of slope erosion. The sand yield during the second rainfall event reached its peak at 30° and exhibited a slight decrease at 40°. This pattern could be attributed to the increased erosion on the slope face of the 40° slope during the initial rainfall. The surface instability at the back edge of the slope eroded first, causing a relative slowdown in the slope gradient, which was subsequently mitigated by the second rainfall event.
Moreover, upon observing the evolution of gullies on the 30° and 40° slopes following the second rainfall event (Figure 12i,j,k and Figure 12l,m,n,o), it was noted that the 30° slopes primarily developed a single large erosion gully. In contrast, the 40° slopes exhibited the development of multiple erosion gullies. Further examination during the rainfall test indicated that the collapse of the gully banks constituted the primary source of erosion debris on the slopes during the later stages. Consequently, the total sand production from the 30° slopes during the second rainfall event was slightly greater than that from the 40° slopes, possibly due to the differences in gully sizes. The total sand production on the 10° slopes was lower during the subsequent rainfall period compared to the preceding one. This phenomenon is attributed to the gentle slope conditions, where, over time, the continuation of rainfall led to the washing away of fine particles formed by the splash erosion of raindrops in the initial stages. As a result of the formation of a soil surface crust and the constraint on the water scouring capacity, the debris content on the slopes diminished, thereby causing a gradual reduction in the total amount of sand production.
Based on the observation and analysis of the test process, it is inferred that the sand production rate follows a pattern similar to the variation observed in the flow production rate during the initial rainfall on the fully weathered granite backfill slope (Figure 8 and Figure 11). Specifically, there is a minimal value at 20°. After intermittent rainfall, both the flow production rate and sand production rate exhibit very small values at 20°, with the sand production rate being slightly greater than that observed at 10°. This analysis indicates that for fully weathered granite backfill slopes, an optimal slope design value is approximately 20°. Intermittent rainfall contributes to heightened slope erosion intensity, and the natural settlement of the soil during rainfall intervals enhances the compactness of the soil body over time. Hence, for fully weathered granite backfill slopes, it is advisable to implement artificial sprinkling during the initial stages of slope backfilling. This approach facilitates the natural settlement of the slope soil body, effectively addressing concerns related to the scouring of slopes exacerbated by uneven settlement. For slopes with a gradient of ≤ 20°, the erosion intensity is minimal, and the primary focus should be on slope drainage. On slopes exceeding 20°, erosion predominantly occurs following the formation of gullies. Therefore, slope management strategies should address both drainage issues and measures to minimize gully formation.

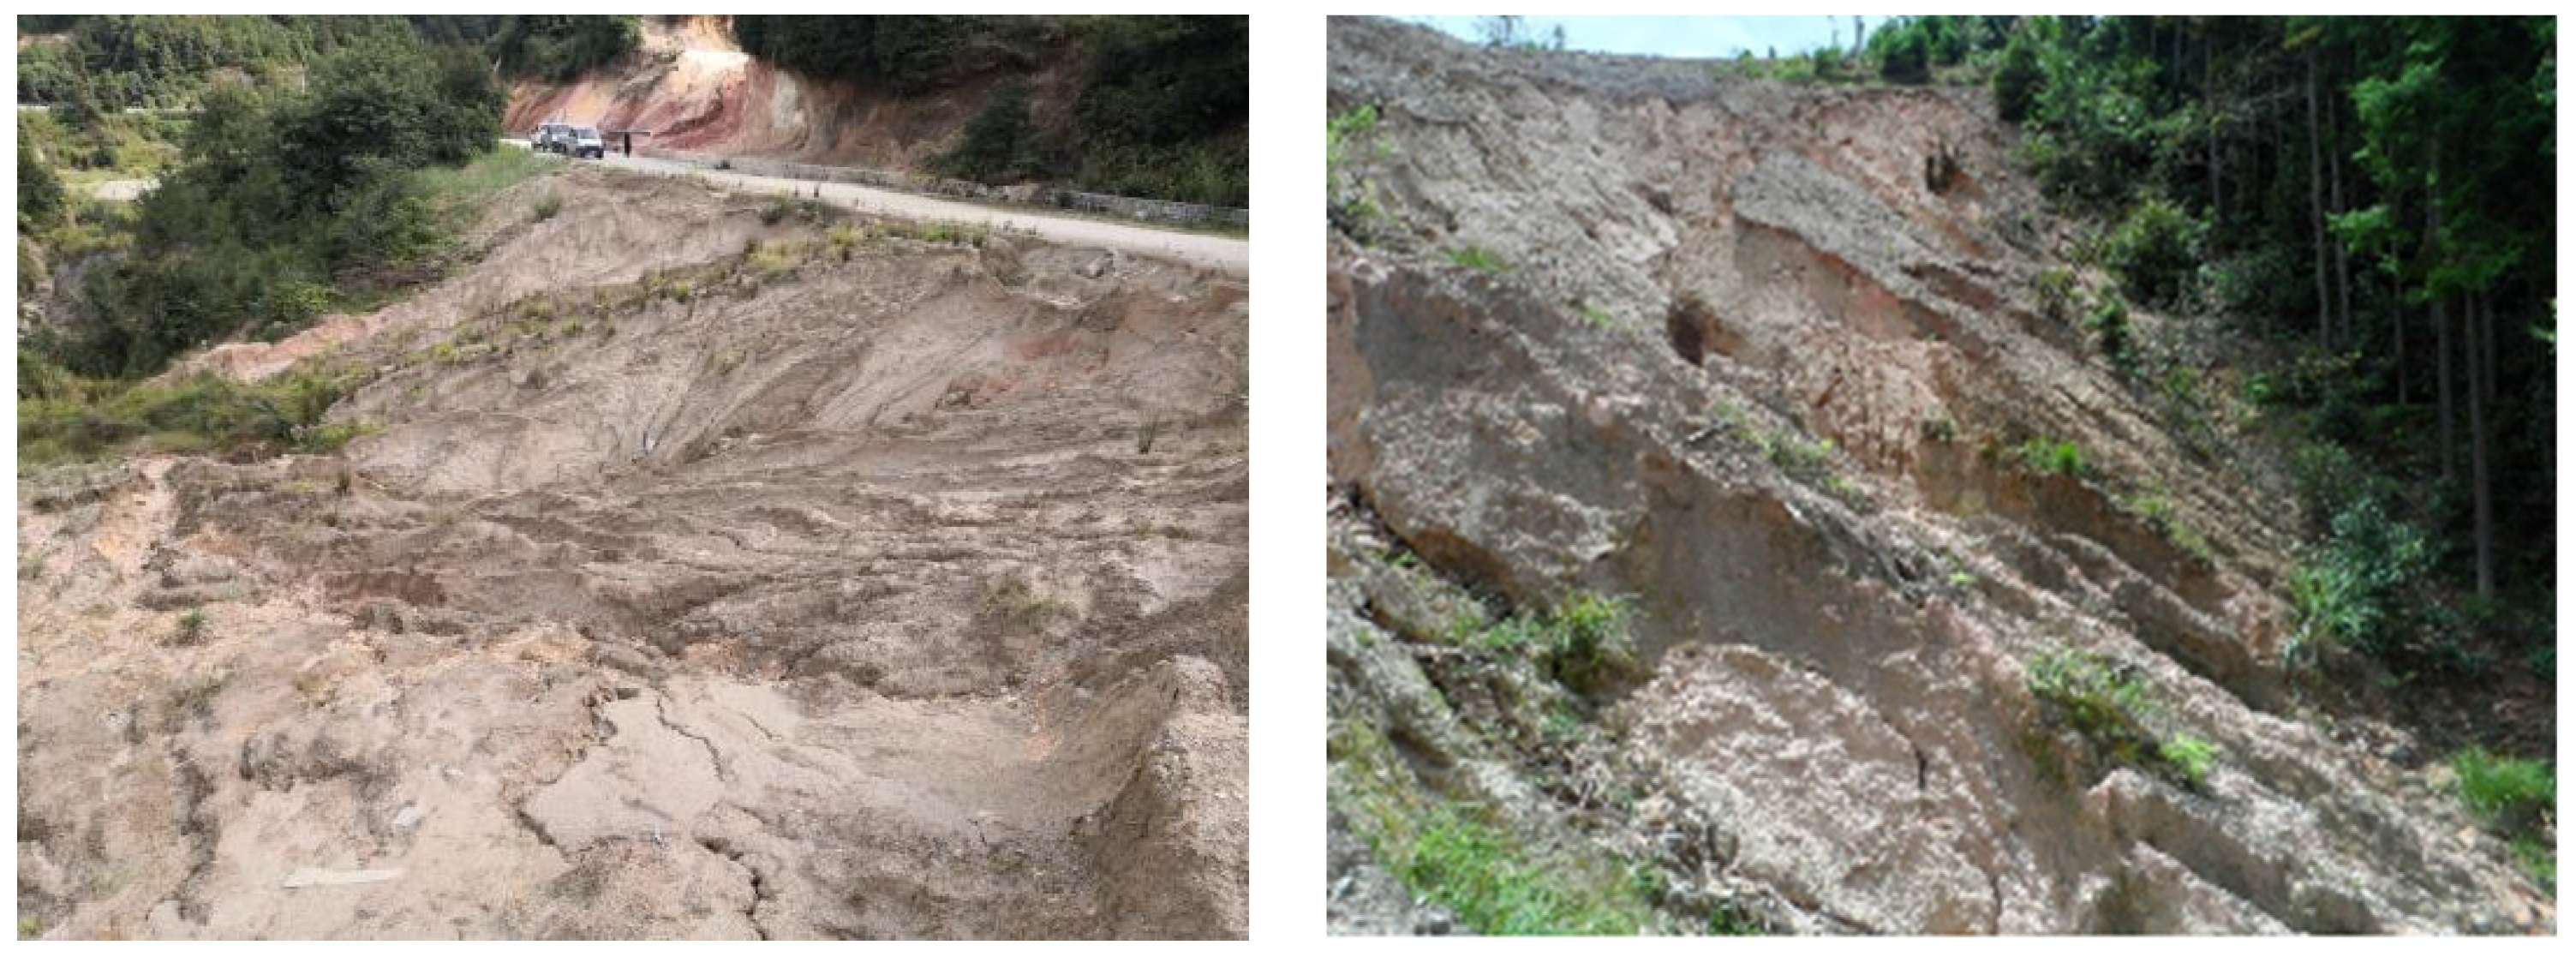
5.3. Analysis of Slope Scour Damage Process

Through the examination of the damage process evolution on slopes with varying gradient angles, under the influence of four sets of test rainfall intensities, consistent initial water content, and specific dry density conditions, the damage mode of fully weathered granite slopes can be outlined in the following aspects:
(1)
Raindrop spallation stage: Raindrops generated by the rainfall generator land on the slope surface, imparting kinetic energy. The impact on the surface soil results in the spattering damage of soil particles. This process unfolds in stages: dry soil spattering, wet soil spattering, and mud spattering. The dispersed soil contributes to the formation of surface pores, leading to the blockage of junctions on the slope panel. This impedes rainfall infiltration, creating conditions conducive to runoff from the slope surface. In varied slope conditions, the distance from the raindrop generator increases with height at each point on the slope. This results in an elevation in the kinetic energy of falling raindrops, intensifying splash erosion, particularly at the foot of the slope.
(2)
Runoff erosion stage: Following the onset of slope runoff, it uniformly transports fine granular material with limited scouring resistance from the slope surface, creating several erosion pits. As the rainfall persists, rainwater diversion will give rise to the formation of several fine gullies on the slope, with the foot of the slope being the initial site to develop and take shape. The subsequent concentration of surface runoff into the fine gullies, coupled with the potent downcutting effect, gradually transforms these fine gullies into incised gully erosion. The greater the slope, the quicker the formation of runoff, leading to heightened gravitational potential energy. This increased energy accelerates the erosion of the slope, facilitating the rapid formation of gullies and exacerbating soil erosion damage.
(3)
Collapse damage stage: This stage is primarily manifested in the collapse of cut ditches. Firstly, the ditch head soil body is affected by numerous tensile fissures, leading to the step-by-step occurrence of soil damage with a gradual recession. Secondly, the cessation of rainfall results in water loss in the ditch, causing a collapse due to the lack of water flow to support the ditch wall. The severity of collapse damage increases with a steeper slope.
The test results indicate that slope erosion predominantly comprises a raindrop splash erosion stage, runoff erosion stage, and collapse failure stage (Figure 12). The severity of slope damage increases with a steeper slope, leading to the more extensive development of slope erosion and damage.
This experiment aims to investigate the impact of runoff and sediment yield under different slopes and rainfall conditions in the study area during rainstorms. These findings are crucial for establishing an accurate quantitative model or relationship for slope soil erosion. By utilizing the model, it is possible to quantitatively assess the key areas of soil loss and generate an erosion risk map. Furthermore, based on the analysis of the test results, water erosion is found to be the main type of erosion on slopes below 20°. Therefore, measures should be taken to increase slope protection and reduce surface runoff energy during treatment. On the other hand, gravity erosion caused by water erosion is the primary erosion type on slopes above 20°. In the later stages, soil shear strength enhancement should be prioritized to reduce rill erosion and mitigate the scale effect of soil erosion. In areas with low erosion risk, vegetation can be preferentially planted, while areas with high erosion risk require a combination of slope protection and reinforcement measures.

6. Conclusions

(1)
In this paper, a comprehensive analysis of multiple rainfall datasets reveals a consistent pattern in the relationship between slope characteristics and runoff dynamics, and the runoff on the slope increases with an increase in rainfall events, according to the study of multiple rainfall datasets in this work. On the other hand, for identical rainfall events on different slopes, the flow production rates remain relatively stable, with minor variations at 10° and 20° slopes, while showing significant fluctuations at 30° and 40° slopes.
(2)
The cumulative sand production across various slopes indicates a positive correlation between the slope magnitude and sand yield. Specifically, there is a quantitative increase in sand production after 20° slopes, highlighting the more pronounced impact of the slope on the runoff volume in sand production. The mean sand production rates during diverse rainfall events on the same slope remain generally stable at 10° inclination but exhibit oscillations on 20°, 30°, and 40° slopes, with more significant fluctuations observed at steeper inclinations. Notably, the sand production rate does not demonstrate a linear correlation with the slope gradient during the same rainfall event. Instead, the oscillatory changes in the sand production rate are attributed to variations in slope morphology influenced by gravitational and hydraulic forces.
(3)
The test findings delineate the stages of slope erosion, encompassing raindrop splash erosion, runoff erosion, and slump damage. The sequence of slope degradation unfolds chronologically at the toe, middle, and crest of the slope. Larger slopes exhibit more severe degrees of slope damage, leading to more extensive progression through the erosion stages.
In conjunction with the findings derived from tests conducted on fully weathered granite backfill slopes, it is recommended to maintain artificial slopes at an inclination of approximately 20°. Periods of intermittent rainfall heighten the slope erosion intensity. During rain-free intervals, natural settlement occurs in the soil, enhancing its compactness. Consequently, early-stage artificial sprinkling during slope backfill facilitates natural settlement, thereby mitigating the issue of slope scouring exacerbated by uneven settlement. It is important to note that slope erosion mainly occurs after gully formation, emphasizing the importance of proactive slope management to prevent gully development.

Author Contributions

Conceptualization, K.G. and Z.K.; methodology, K.G., Z.K. and Y.L.; software, B.C. and F.Z.; validation, B.C., D.S. and R.W.; formal analysis, K.G., Z.K. and Y.L.; investigation, Z.K., F.Z., B.C., D.S. and R.W.; resources, Y.L., F.Z., D.S. and R.W.; data curation, K.G., Z.K. and Y.L.; writing—original draft preparation, K.G.; writing—review and editing, K.G. and Z.K.; supervision, Y.L., F.Z. and D.S.; project administration, Z.K. and B.C. All authors have read and agreed to the published version of the manuscript.

Funding

This research was funded by the science and technology development project of Power China, Sinohydro Foundation Engineering Co., Ltd. (Tianjin, China) (Grant No. KKK0202321010); the scientific and technological development project of Southwest Pipeline Co., Ltd. (Chengdu, China) (Grant No. KKK0201921153); and the Key Research and Development Plan of Yunnan Province (No. 202203AC100003).

Institutional Review Board Statement

Not applicable.

Informed Consent Statement

Not applicable.

Data Availability Statement

The data presented in this paper are available on request.

Acknowledgments

We are very grateful to our colleagues in the team who supported the implementation of this project. We are also sincerely thankful to the editors and reviewers.

Conflicts of Interest

Authors Fei Zhao, Dehua Shi and Ren Wang were employed by Dehong Oil and Gas Transportation Branch of Southwest Oil and Gas Pipeline Co., Ltd. The authors declare no conflicts of interest.

References

  1. Shi, Z.; Liu, Q.; Zhang, H.; Wang, L.; Huang, X.; Fang, N.; Yue, Z. Study on Soil Erosion and Conservation in the Past 10 Years: Progress and Prospects. Acta Pedol. Sin. 2020, 57, 1117–1127. [Google Scholar]
  2. Liu, D.; She, D.; Yu, S.; Shao, G.; Chen, D. Rainfall Intensity and Slope Gradient Effects on Sediment Losses and Splash from a Saline–Sodic Soil under Coastal Reclamation. Catena 2015, 128, 54–62. [Google Scholar] [CrossRef]
  3. Chen, J.; Xiao, H.B.; Li, Z.; Liu, C.; Ning, K.; Tang, C. How Effective are Soil and Water Conservation Measures (SWCMs) in Reducing Soil and Water Losses in the Red Soil Hilly Region of China? A Meta-Analysis of Field Plot Data. Sci. Total Environ. 2020, 735, 139517. [Google Scholar] [CrossRef]
  4. Yan, X. Experimental Study on Soil Erosion by Different Slope under Simulated Rainfall Condition. Shanxi Hydrotech. 2020, 1, 41–44. [Google Scholar]
  5. Su, Y.; Zhang, Y.; Wang, H.; Lei, N.; Li, P.; Wang, J. Interactive Effects of Rainfall Intensity and Initial Thaw Depth on Slope Erosion. Sustainability 2022, 14, 3172. [Google Scholar] [CrossRef]
  6. Li, G.; Zheng, F.; Lu, J.; An, J. Effects of Rainfall and Topographyon Soil Erosion Processes of Black Soil Hillslope. Trans. Chin. Soc. Agric. Mach. 2015, 46, 147–154. [Google Scholar]
  7. Liang, Y.; Jiao, J.; Dang, W.; Cao, W. The Thresholds of Sediment-Generating Rainfall from Hillslope to Watershed Scales in the Loess Plateau, China. Water 2019, 11, 2392. [Google Scholar] [CrossRef]
  8. He, J.; Cai, Q.; Liu, S. Effects of Slope Gradient on Slope Runoff and Sediment Yield under Different Single Rainfall Conditions. Chin. J. Appl. Ecol. 2012, 23, 1263–1268. [Google Scholar]
  9. Shen, H.; Zheng, F.; Wen, L.; Han, Y.; Hu, W. Impacts of Rainfall Intensity and Slope Gradient on Rill Erosion Processes at Loessial Hillslope. Soil Tillage Res. 2016, 155, 429–436. [Google Scholar] [CrossRef]
  10. Fu, S.; Liu, B.; Liu, H.; Xu, L. The Effect of Slope on Interrill Erosion at Short Slopes. Catena 2011, 84, 29–34. [Google Scholar] [CrossRef]
  11. Komatsu, Y.; Kato, H.; Zhu, B.; Wang, T.; Yang, F.; Rakwal, R.; Onda, Y. Effects of Slope Gradient on Runoff from Bare-Fallow Purple Soil in China under Natural Rainfall Conditions. J. Mt. Sci. 2018, 15, 738–751. [Google Scholar] [CrossRef]
  12. Qian, F.; Dong, L.; Liu, J.; Sun, B.; Liu, H.; Huang, J.; Li, H. Equations for Predicting Interrill Erosion on Steep Slopes in the Three Gorges Reservoir, China. J. Hydrol. Hydromech. 2020, 68, 51–59. [Google Scholar]
  13. Chen, Z.; Zhu, B.; Tang, J.; Liu, X. Influence of Slope Gradient on Soil Erosion in the Hilly Area of Purple Soil under Natural Rainfall. Pearl River 2016, 37, 29–33. [Google Scholar]
  14. Sun, W.; Shao, Q.; Liu, J. Assessing the Effects of Land Use and Topography on Soil Erosion on the Loess Plateau in China. Catena 2014, 121, 151–163. [Google Scholar] [CrossRef]
  15. Peng, Y.; Zhou, B.; Chen, X.; Tang, X.; Tao, W.; Wang, Q. Study on the Mechanism of Soil, Water and Nutrient Loess Slope under Interval Rain Events. J. Soil Water Conserv. 2018, 32, 54–60. [Google Scholar]
  16. Luo, B.; Zhang, Y.; Zhang, Z.; Ni, S.; Zhang, X.; Wang, G. Application of laser scanning and photogrammetry in the evolution process of slope erosion. Trans. Chin. Soc. Agric. Eng. 2022, 38, 101–109. [Google Scholar]
  17. Tian, H.; Kong, Z. Influence of Rainfall Intensity and Slope on the Slope Erosion of Longling Completely Weathered Granite. Appl. Sci. 2023, 13, 5295. [Google Scholar] [CrossRef]
  18. Zhao, Z.; Tang, Y.; Feng, F.; Li, Z.; Xu, Y.; Hong, B.; Feng, W. Characteristics and Mechanisms of Large-Scale Old Landslides and Landslide Dams in the Loess Plateau—A Case Study from Daning County, Shanxi Province, China. Heliyon 2023, 9, e19910. [Google Scholar] [CrossRef] [PubMed]
  19. Li, X.; Wang, C.; Che, Y. Charcteristics of Rill Erosion on Sail Excavation Slope under Different Rainfall Conditions. J. Subtrop. Resour. Environ. 2023, 18, 78–85. [Google Scholar]
  20. Xu, X.; Liu, Q.; Zhang, H. Effects of Rainfall Type and Slope on Runoff and Sediment Yield in Brown Soil Furrow System. J. Soil Water Conserv. 2020, 34, 56–62. [Google Scholar]
  21. Su, Y.; Li, P.; Ren, Z.; Xiao, L.; Wang, T.; Zhang, J.; Liu, Z. Effect of Slope Gradient on the Process of Runoff and Sediment Yield and Water-Sediment Relation on the Loess slope. Res. Soil Water Conserv. 2020, 27, 118–122. [Google Scholar]
  22. Zhang, H.; Zheng, F. Effect of slope Gradients on Erosion from a Red Soil Hillslope under Different Rainfall Intensity. J. Soil Water Conserv. 2011, 25, 40–43. [Google Scholar]
  23. Defersha, M.B.; Melesse, A.M. Effect of Rainfall Intensity, Slope and Antecedent Moisture Content on Sediment Concentration and Sediment Enrichment Ratio. Catena 2011, 90, 47–52. [Google Scholar] [CrossRef]
  24. El Kateb, H.; Zhang, H.; Zhang, P.; Mosandl, R. Soil Erosion and Surface Runoff on Different Vegetation Covers and Slope Gradients: A Field Experiment in Southern Shaanxi Province, China. Catena 2013, 105, 1–10. [Google Scholar] [CrossRef]
  25. Mandal, D.; Chandrakala, M.; Alam, N.M.; Roy, T.; Mandal, U. Assessment of Soil Quality and Productivity in Different Phases of Soil Erosion with the Focus on Land Degradation Neutrality in Tropical Humid Region of India. Catena 2021, 204, 105440. [Google Scholar] [CrossRef]
  26. Wei, X.; Bi, H.; Huo, Y. Comparative Analysis of the Features of Runoff and Sediment Yield on the Different Soil Slopes. J. Soil Water Conserv. 2016, 30, 44–48. [Google Scholar]
  27. Zhao, Q.; Li, D.; Zhuo, M.; Guo, T.; Liao, Y.; Xie, Z. Effects of Rainfall Intensity and Slope Gradient on Erosion Characteristics of the Red Soil Slope. Stoch. Environ. Res. Risk Assess. 2015, 29, 609–621. [Google Scholar] [CrossRef]
  28. Yang, H.; Wei, C.; Sun, G.; Tao, X.; Wang, Y.; Xing, W. Responses of Soil and Ammonia Nitrogen Loss Rates to Hydraulic Parameters under Different Slope Gradients and Rainfall Intensities. Water 2024, 16, 230. [Google Scholar] [CrossRef]
  29. Wu, L.; Peng, M.; Qiao, S.; Ma, X.Y. Effects of Rainfall Intensity and Slope Gradient on Runoff and Sediment Yield Characteristics of Bare Loess Soil. Environ. Sci. Pollut. Res. 2018, 25, 3480–3487. [Google Scholar] [CrossRef] [PubMed]
  30. Zhang, H.; Li, Y.; Yan, Y.; Kong, Z.; Ge, H.; Liu, Z.; Yuan, Q. Ecological Protection Measures of Completely Weathered Granite Backfill Slope under Different Slope Conditions. J. Soil Water Conserv. 2022, 36, 156–162. [Google Scholar]
  31. Ge, H.; Fang, Y.; Zhao, F.; Kong, Z.; Dai, G.; Zhang, Y. Numerical Modeling of Erosion Process of Backfill Soil in Pipe Trench of Longling Section of Sino-Burmese Oil and Gas Pipeline. Yangtze River 2021, 52, 122–127. [Google Scholar]
  32. Deng, L.; Zhang, L.; Fan, X.; Wu, Y.; Sun, T.; Fei, K. Characteristics of Runoff and Sediment Yield under Different Rainfall Intensities and Slope Gradients in Erosive Weathered Granite Area. Trans. Chin. Soc. Agric. Eng. 2018, 34, 143–150. [Google Scholar]
  33. Xu, J.; Wang, Q.; Deng, Y.; Wan, Y.; Liu, D.; Ding, S. Study on Characteristics of Erosion Surface on Weathered Granite Soil Based on Three-dimensional Laser Scanning Technology. J. Soil Water Conserv. 2016, 30, 14–19. [Google Scholar]
  34. Deng, L.; Zhang, L.; Sun, T.; Fei, K.; Fan, X.; Wu, Y.; Ni, L.; Sun, R. Simulation Study on Runoff Processes and Erosion Rate on the Weathered Granite Slope in Southern China. J. Soil Water Conserv. 2020, 34, 35–41. [Google Scholar]
  35. Deng, L.; Zhang, L.; Wu, Y.; Fan, X.; Sun, T.; Fei, K. Characteristics of Rainfall Runoff and Hydrological Dynamics on the Erosive Weathered Granite Slope. J. Soil Water Conserv. 2018, 32, 67–73. [Google Scholar]
  36. Liu, H.; Yu, P.; Lu, H.; Xie, Y.; Wang, Z.; Hao, S.; Liu, H.; Fu, Y. Experimental Study on Disaster Mechanism of Completely Weathered Granite Landslide Induced by Extreme Rainfall. Geoenviron. Disasters 2023, 10, 5. [Google Scholar] [CrossRef]
  37. Yu, P.; Liu, H.; Yu, H.; Xie, Y.; Yu, Y.; Zhu, C.; Dong, J.; Guan, Y. Study on Fluid–Solid Coupling Numerical Simulation and Early Warning of Weathered Granite Landslides Induced by Extreme Rainfall. Sustainability 2023, 15, 11738. [Google Scholar] [CrossRef]
  38. Renard, K.; Foster, G.; Weesies, G.; Porter, J. RUSLE: Revised universal soil loss equation. Soil Water Conserv. 1991, 46, 30–33. [Google Scholar]
  39. Liu, B.; Xie, Y.; Zhang, K. Soil Erosion Prediction Model; China Science and Technology Press: Beijing, China, 2001. [Google Scholar]
  40. Wu, Q.; Zhao, X.; Liu, B. Soil Erosion Prediciton on Slope Cultivated Landsin South Part of Loess Plateau. J. Soil Eros. Soil Water Conserv. 1998, 4, 36–40. [Google Scholar]
  41. Sun, L.; Zhou, J.L.; Cai, Q.; Liu, S.; Xiao, J. Comparing Surface Erosion Processes in Four Soils from the Loess Plateau under Extreme Rainfall Events. Int. Soil Water Conserv. Res. 2021, 9, 520–531. [Google Scholar] [CrossRef]
  42. Han, J.; Ge, W.; Hei, Z.; Cong, C.; Ma, C.; Xie, M.; Liu, B.; Feng, W.; Wang, F.; Jiao, J. Agricultural land Use and Management Weaken the Soil Erosion Induced by Extreme Rainstorms. Agric. Ecosyst. Environ. 2020, 301, 107047. [Google Scholar] [CrossRef]
  43. Ke, Q.; Zhang, K. Patterns of Runoff and Erosion on Bare Slopes in Different Climate Zones. Catena 2021, 198, 105069. [Google Scholar] [CrossRef]
  44. Xie, S.; Mo, M.; Tu, A.; Liu, Y. Characteristics of vertical runoff output on red-soil slope under natural rainfall conditions. Trans. Chin. Soc. Agric. Eng. 2014, 30, 132–138. [Google Scholar]
  45. Chen, X.; Yang, J.; Tang, C.; Zheng, T.; Li, L. Effects of Rainfall Intensity and Slope on Surface and Subsurface Runoff in Red Soil Slope Farmland. Trans. Chin. Soc. Agric. Eng. 2017, 33, 141–146. [Google Scholar]
  46. Chen, Z.; Liu, X.; Zhu, B. Runoff Estimation in Hillslope Cropland of Purple Soil Based on SCS-CN Model. Trans. Chin. Soc. Agric. Eng. 2014, 30, 72–81. [Google Scholar]
  47. Hernandez, M.; Nearing, M.A.; Al-Hamdan, O.Z.; Pierson, F.B.; Armendariz, G.; Weltz, M.A.; Spaeth, K.E.; Holifield Collins, C.D. The Rangeland Hydrology and Erosion Model: A Dynamic Approach for Predicting Soil Loss on Rangelands. Water Resour. Res. 2017, 53, 9368–9391. [Google Scholar] [CrossRef]
  48. Choi, K.; Arnhold, S.; Huwe, B.; Reineking, B. Daily Based Morgan-Morgan-Finney (DMMF) Model: A Spatially Distributed Conceptual Soil Erosion Model to Simulate Complex Soil Surface Configurations. Water 2017, 9, 278. [Google Scholar] [CrossRef]
  49. Wang, B.; Xiao, S.; Zhang, G.; Yang, J.; Zhang, L. Study on Runoff and Sediment Yield Characteristics under Different Land Uses in Red Soil Area of South China. Trans. Chin. Soc. Agric. Eng. 2012, 28, 239–243. [Google Scholar]
  50. Zhang, Q.; Lv, X.; Ni, Y.; Ma, L. Slope Runoff Process and Regulation Threshold under the Dual Effects of Rainfall and Vegetation in Loess Hilly and Gully Region. Sustainability 2023, 15, 7582. [Google Scholar] [CrossRef]
  51. Zheng, F.; Bian, F.; Lu, J.; Qin, C.; Xu, X. Effects of Rainfall Patterns on Hillslope Erosion with Longitudinal Ridge in Typical Black Soil Region of Northeast China. Trans. Chin. Soc. Agric. Mach. 2016, 47, 90–97. [Google Scholar]
  52. Chen, S.; Zha, X. Evaluation of Soil Erosion Vulnerability in the Zhuxiwatershed, Fujian Province, China. Nat. Hazards 2016, 82, 1589–1607. [Google Scholar] [CrossRef]
  53. Xie, M.; Hong, D.; Fu, J.; Zhang, Z.; Zheng, C.; Zhang, P. Characteristics of Nitrate Nitrogen Transport of Purple Sloped soils in Resopnse to Single and Intermittent Rainfalls. J. Soil Water Conserv. 2022, 36, 24–29. [Google Scholar]
  54. Shi, P.; Chiahue, D.Y.; Zhang, P. Effect of lntermittent Rainfall on Size Distribution and Phosphorus, Copper and Zinc Enrichment of Soil Aggregates. Acta Pedol. Sin. 2021, 58, 948–956. [Google Scholar]
  55. Wen, Y.; Gao, P.; Mu, X.; Li, M.; Su, Y.; Wang, H. Experimental Study on Landslides in Terraced Fields in the Chinese Loessial Region under Extreme Rainfall. Water 2021, 13, 270. [Google Scholar] [CrossRef]
  56. Patriche, C.V.; Roșca, B.; Pîrnău, R.G.; Vasiliniuc, I.; Irimia, L.M. Simulation of Rainfall Erosivity Dynamics in Romania under Climate Change Scenarios. Sustainability 2023, 15, 1469. [Google Scholar] [CrossRef]
  57. Jeong, S.; Lee, K.; Kim, J.; Kim, Y. Analysis of Rainfall-Induced Landslide on Unsaturated Soil Slopes. Sustainability 2017, 9, 1280. [Google Scholar] [CrossRef]
  58. Martin, K.; Santhi, K.; Marco, Z.; Albert, N. Experimental Study of Site-Specific Soil Water Content and Rainfall Inducing Shallow Landslides: Case of Gakenke District, Rwanda. Geofluids 2021, 18, 7194988. [Google Scholar]
  59. Dan, C.; Liu, G.; Zhao, Y.; Shu, C.; Shen, E.; Liu, C.; Tan, Q.; Zhang, Q.; Guo, Z.; Zhang, Y. The Effects of Typical Grass Cover Combined with Biocrusts on Slope Hydrology and Soil Erosion during Rainstorms on the Loess Plateau of China: An Experimental Study. Hydrol. Process. 2023, 37, e14794. [Google Scholar] [CrossRef]
Figure 1. Study area. (a) Map of Yunnan Province and location of Longling County; (b) stratigraphic lithology map of the study area; (c) contour map of rainstorm in the study area.
Sustainability 16 01454 g001
Figure 2. Daily one-hour rainstorm data in Longling area in past 10 years.
Sustainability 16 01454 g002
Figure 3. (a) X-ray diffraction pattern of undisturbed soil of completely weathered granite; (b) X-ray diffraction pattern of backfill soil.
Sustainability 16 01454 g003
Figure 4. Photographs of erosion in areas of fully weathered granite.
Sustainability 16 01454 g004
Figure 5. Schematic diagram of indoor simulation test device. (1. Storage bucket; 2. water supply pipe; 3. stabilizing water pump, flow meter, and top; 4. rainfall simulator; 5. rainfall nozzle; 6. experimental plot; 7. triangular diversion weir; 8. slope; 9. runoff bucket; 10. samples; 11. 3D laser scanner).
Sustainability 16 01454 g005
Figure 6. Total runoff under intermittent rainfall conditions.
Sustainability 16 01454 g006
Figure 7. The variation curve of runoff rate with rainfall duration under different slopes. (a) is 10° slope change curve; (b) is 20° slope change curve; (c) is 30° slope change curve; (d) is 40° slope change curve.
Sustainability 16 01454 g007
Figure 8. Change curve of runoff rate with rainfall duration under different rainfall events. (a) is the change curve of each slope in the first rainfall event; (b) is the change curve of each slope in the second rainfall event; (c) is the change curve of each slope in the third rainfall event.
Sustainability 16 01454 g008
Figure 9. Total sediment yield under intermittent rainfall conditions.
Sustainability 16 01454 g009
Figure 10. Variation curves of sediment yield with rainfall duration under different slopes. (a) is 10° slope change curve; (b) is 20° slope change curve; (c) is 30° slope change curve; (d) is 40° slope change curve.
Sustainability 16 01454 g010
Figure 11. The sediment yield variation curve with rainfall duration during different rainfall events. (a) is the change curve of each slope in the first rainfall event; (b) is the change curve of each slope in the second rainfall event; (c) is the change curve of each slope in the third rainfall event.
Sustainability 16 01454 g011
Figure 12. Transformation of slope morphology pre- and post-rainfall at 10°, 20°, 30°, and 40°. (a,e,i,l) Slope morphology before rainfall; (b,f,j,m) slope morphology after the conclusion of the first rainfall event; (c,g,k,n) slope morphology after the conclusion of the second rainfall event; (d,h,o) slope morphology after the conclusion of the third rainfall event.
Sustainability 16 01454 g012
Table 1. Grain size gradation of backfill soil.
Size range<0.075 mm0.075–0.25 mm0.25–2 mm>2 mm
Mass percentage %1.1324.7641.1632.95
Disclaimer/Publisher’s Note: The statements, opinions and data contained in all publications are solely those of the individual author(s) and contributor(s) and not of MDPI and/or the editor(s). MDPI and/or the editor(s) disclaim responsibility for any injury to people or property resulting from any ideas, methods, instructions or products referred to in the content.

