1. Introduction
Extensive theoretical and empirical research suggests that improvements in environmental quality with the rise of per capita income could reflect how successfully environmental policies are implemented. In this paper, we analyse the relationship between income and taxation, one of the most important market-based instruments for environmental protection. To the best of our knowledge, the economic literature does not provide a clear picture concerning the relationship between environmental taxation and economic activity, as represented by per capita income. The idea that environmental taxation may first increase with rising income before it starts to decline with even higher income is a hypothesis that we call the environmental taxation Kuznets curve (ETKC). This relationship is shown to be strongly influenced by the institutional context.
The relationship between economic development and the environment has been widely discussed. It is usually measured by the environmental Kuznets curve (EKC), which defines the links between economic growth and environmental degradation. Models that investigate the existence of the EKC propose an inverse U-shaped curve, whereby, starting from lower levels of per capita income, pollution increases gradually to reach a peak before decreasing at a turning point at higher levels of income. The evidence of the EKC is usually based on theories relating socioeconomic progress to environmental protection [
1]. One of these considers environmental quality as a socially preferred good. This theory suggests that, as economic growth and social well-being increase, stronger institutions call for environmental awareness, thus opting for environmental protection as the active policy of sustainable development and not simply as the consequence of economic development. This theory, therefore, implies compatibility between economic growth and a clean environment that can be only achieved through application of effective environmental policies. The introduction and application of these policies, in turn, depend to a great extent on the stringency of the institutional context and the quality of institutions that has been proven to strongly affect the functioning of environmental policies [
2,
3,
4].
Numerous studies confirm the importance of market-based policy instruments, such as environmental taxes, for pollution reduction (for example [
5,
6,
7]). The use of environmental taxation is found to produce not only environmental, but also economic benefits; this is called the double dividend hypothesis. It is argued that tax extraction from polluting factors instead of production factors leads to the rise in economic growth [
7,
8,
9]. These findings confirm the importance of environmental taxation as a policy for environmental protection and provide incentives for further investigation.
It should be stressed that, while the results of environmental protection are well documented in empirical studies, the factors that contribute to its implementation are left in the shade. Some studies try to analyse environmental protection and identify factors crucial for its efficacy [
5,
8]. One of these factors is institutional enforcement. Institutions, such as the protection of property rights, legal origins, democracy and governance, have been shown to have a strong impact on the quality of the environment [
10,
11,
12,
13,
14]. However, among the institutions studied from an environmental perspective, that of the rule of law has not yet received the attention it deserves. In fact, the implementation of environmental protection measures rarely occurs without state intervention, and this depends on the quality of governance [
15]. For this reason, the strength of the rule of law is expected to have a decisive role.
The intuition behind our model is the following. With the growth of income, environmental taxation is expected to rise together with emissions until high income and strong institutions contribute to achieving the goals of environmental protection policy to decrease pollution. After this, emissions and, therefore, environmental taxation decline with the further increase of income. We expect that during this process, the rule of law plays a dual role in environmental taxation policy. The direct effect is through the impact that the rule of law has on taxation, since a strong rule of law has a positive impact on tax collection. In turn, there is an indirect impact that works through the positive contribution that the rule of law gives to economic growth. Since taxation is commonly related to per capita income, which is assumed as ability to pay, the rule of law, through its contribution to economic growth, indirectly affects environmental taxation.
In this paper, we advance two hypotheses. The first evaluates the existence of the environmental taxation Kuznets curve. In particular, we show that the relationship between environmental taxation and per capita income results in an inverse U-shaped curve. The second hypothesis tests whether the turning point of ETKC is influenced by the stringency of the rule of law. We demonstrate that enforcement of the rule of law shifts the turning point to lower levels of per capita income, thereby accelerating environmental improvement.
2. Background
An increasing body of empirical research (for an overview, see [
2,
16,
17]) has confirmed the existence of the EKC for various polluters in different countries, including European economies [
18,
19,
20,
21]. The presence of this curve indicates the progress achieved in environmental protection policies. Various studies put forward a wide range of factors that contribute to this progress, such as an increase in welfare and economic openness, a shift to green technologies, the switch in consumer preferences to green products, among others. Not surprisingly, environmental policy plays a decisive role in determining how these factors influence environmental protection and sustainable development.
In turn, some studies have demonstrated that the successful implementation of environmental policies is determined by the institutional context. For example, corruption has been shown to have a negative effect on the environment, undermining the effectiveness of such policies [
10,
11,
12]. In contrast, strong institutions in the form of political liberties, civil rights and democracy have been shown to positively contribute to environmental issues [
22], as have secure property rights and legal protection [
23], as well as economic openness [
24].
The rule of law is one of the most important institutions that guarantee successful policy implementation [
25]. Kaufmann
et al. [
26] define the rule of law as the “perceptions of the extent to which agents have confidence in and abide by the rules of society and, in particular, the quality of contract enforcement, property rights, the police and the courts, as well as the likelihood of crime and violence”. Environmental policies are therefore dependent on the quality of this institution, as it determines their effective application. Although the link between the quality of the rule of law and effective environmental policies is hardly surprising, very few empirical studies have shown that the rule of law improves environmental quality [
13,
22,
27].
Inter alia, environmental taxation is one of the instruments used to compel private users of environmental resources to take account of the social costs of their actions. As argued in the early literature [
28,
29], environmental taxation improves social welfare, since this tax is imposed to neutralize a negative externality. Following [
28], the use of environmental taxes is an optimal way to bring equal private and social costs. The traditional arguments in favour of environmental taxes are that firms will consequently reduce the amount of pollution to equate their marginal cost of pollution abatement to the pollution tax. This allows firms to choose the cheapest method available for reducing emissions (new machinery, production relocation, R&D investment,
etc.). Recently, environmental taxation has received renewed attention, since it has been suggested that the revenues from taxation can be used for lowering other distortive taxes, such as those on labour and/or on capital, that negatively affect economic performance. In this way, to the old argument (taxation that corrects environmental externality) is added a new one (taxation that enhances growth). Both arguments are at the base of the Environmental Tax Reform (ETR) in the European Union as proposed by the European Environmental Agency [
6]. According to ETR, environmental taxation can provide a double dividend, since the shift from conventional to environmental taxation not only corrects negative externality, but also reduces the distorting effects of taxation in other markets, and consequently improves welfare.
A number of authors provide theoretical and empirical evidence on the importance of taxation on environmental improvements [
7,
8,
30]. However, there is still a need to understand which factors are responsible for the effectiveness of this policy instrument. The perplexities around this policy instrument as the first-best solution to harmful emissions, require further investigation. For example, [
31] in a detailed analysis of environmental taxation in the OECD countries found that green taxes are highly differentiated from country to country and are far from the first-best optimal design. This is mainly due to the different contractual power of the agents that have to pay taxes. One notable example concerns energy-intensive big firms that are able to lobby harder against CO
2 taxation than labour-intensive small firms, while CO
2 taxation can be easily applied to households that tend to be less organized in contrasting taxation. At the theoretical level, the work of [
32] based on a game theory growth model demonstrates that resource taxes and quantity rationing reach their environment goal better than environmental taxes.
In this paper, we consider the environmental taxation policy in European countries. In particular, we evaluate the extent to which environmental taxation is determined by the strength of the rule of law and how its enforcement contributes to reversing the gradual increase in pollution. Most policies aimed at environmental improvement and protection were introduced in Europe at the end of the nineteen eighties and the beginning of the nineteen nineties. The emergence of these policies was initially instigated by increasing public awareness of environmental damage and the need for long-term sustainable development [
33].
Since then, the taxation system in European countries has passed through complex evolution processes with the introduction of different forms of taxation designed to perform different functions. A large part of these environmental taxes has been proven to be effective [
6]. One of the first examples is Finland, which, in January, 1990, as an
ad hoc reaction to the international discussion on sustainable development, was the first European country to implement a tax on carbon dioxide emissions in the form of an additional excise duty on energy products, shortly followed by the Netherlands, Sweden, Norway and Denmark. Other examples are: Germany’s introduction of a tax on leaded petrol, which led to the rapid substitution of this polluting fuel with a less damaging one; the decrease in the amount of waste delivered to landfill sites in Denmark and the U.K., after the introduction of taxes on waste disposal; the shift away from high-emission petrol engine vehicles towards diesel as a result of the application of a vehicle excise duty in U.K.; the reduction in demand of products containing PVCs after the Danish government’s tax on this plastic; traffic reduction in urban centres after a congestion charge was introduced in various European cities [
30,
34,
35,
36].
These are a few of the many examples that demonstrate that, when environmental taxes successfully reduce pollution, less taxation is subsequently required. Therefore, in conditions where the rule of law is strong and policies are properly enforced, the volume of environmental taxation may first increase and then actually decrease as a consequence of the effectiveness of environmental policies. Some European countries, the so-called “eco-leaders”, such as Denmark, the Netherlands, Norway and Sweden, have achieved considerable progress in applying such polies [
7]. These countries have successively reduced emission levels, and this has led to the decrease of environmental taxation overall. Even though the revenue generated was not the primary aim of environmental policy, most of these countries recycle the revenue obtained from taxation back into the economy by reducing income tax and increasing investments, which significantly contributes to economic performance, confirming the double dividend hypothesis. The success of taxation has induced the European Environmental Agency to propose a reform of the tax system, called Environmental Tax Reform (ETR). According to [
6], the ETR is a change in the national tax system that shifts the burden “from economic function, sometimes called ‘goods’, such as labour (personal income tax), capital (corporate income tax) and consumption (VAT and other indirect taxes), to activities that lead to environmental pressures and natural resources use, sometimes called ‘bads’ ([
6] p. 83)”. The main aim of this shift is to reconcile economic growth and the environment [
30]. However, we cannot ignore the criticisms regarding the social acceptability of the costs and benefits of such taxation reform. Kallbekken and Sælen [
37], for example, have raised a number of objections on the lack of awareness surrounding the ETR, since in some northern European countries, the attitudes of households and producers towards environmental taxation appear negative.
Having said that, in light of the progress achieved in environmental policies, we advance the hypothesis that the relationship between environmental taxation and per capita income should exhibit an inverse U-shaped curve, strongly influenced by the stringency of the rule of law. The increasing slope of the curve is found in conditions where income and institutions are growing and environmental taxes are introduced. When these taxes achieve major efficacy, the curve reaches a turning point where pollution levels start to decline. This turning point reflects a moment when a relatively high level of per capita income is achieved and institutional quality is improved (the relationship between income and rule of law has been recognised in the economic literature as a positive one [
38,
39]). Thus, no further increase in taxation is needed, since the existing one is able to reduce pollution. The decrease of emission levels implies a diminishing tax burden. The relationship between environmental taxation and income would, therefore, result in an inverse U-shaped curve.
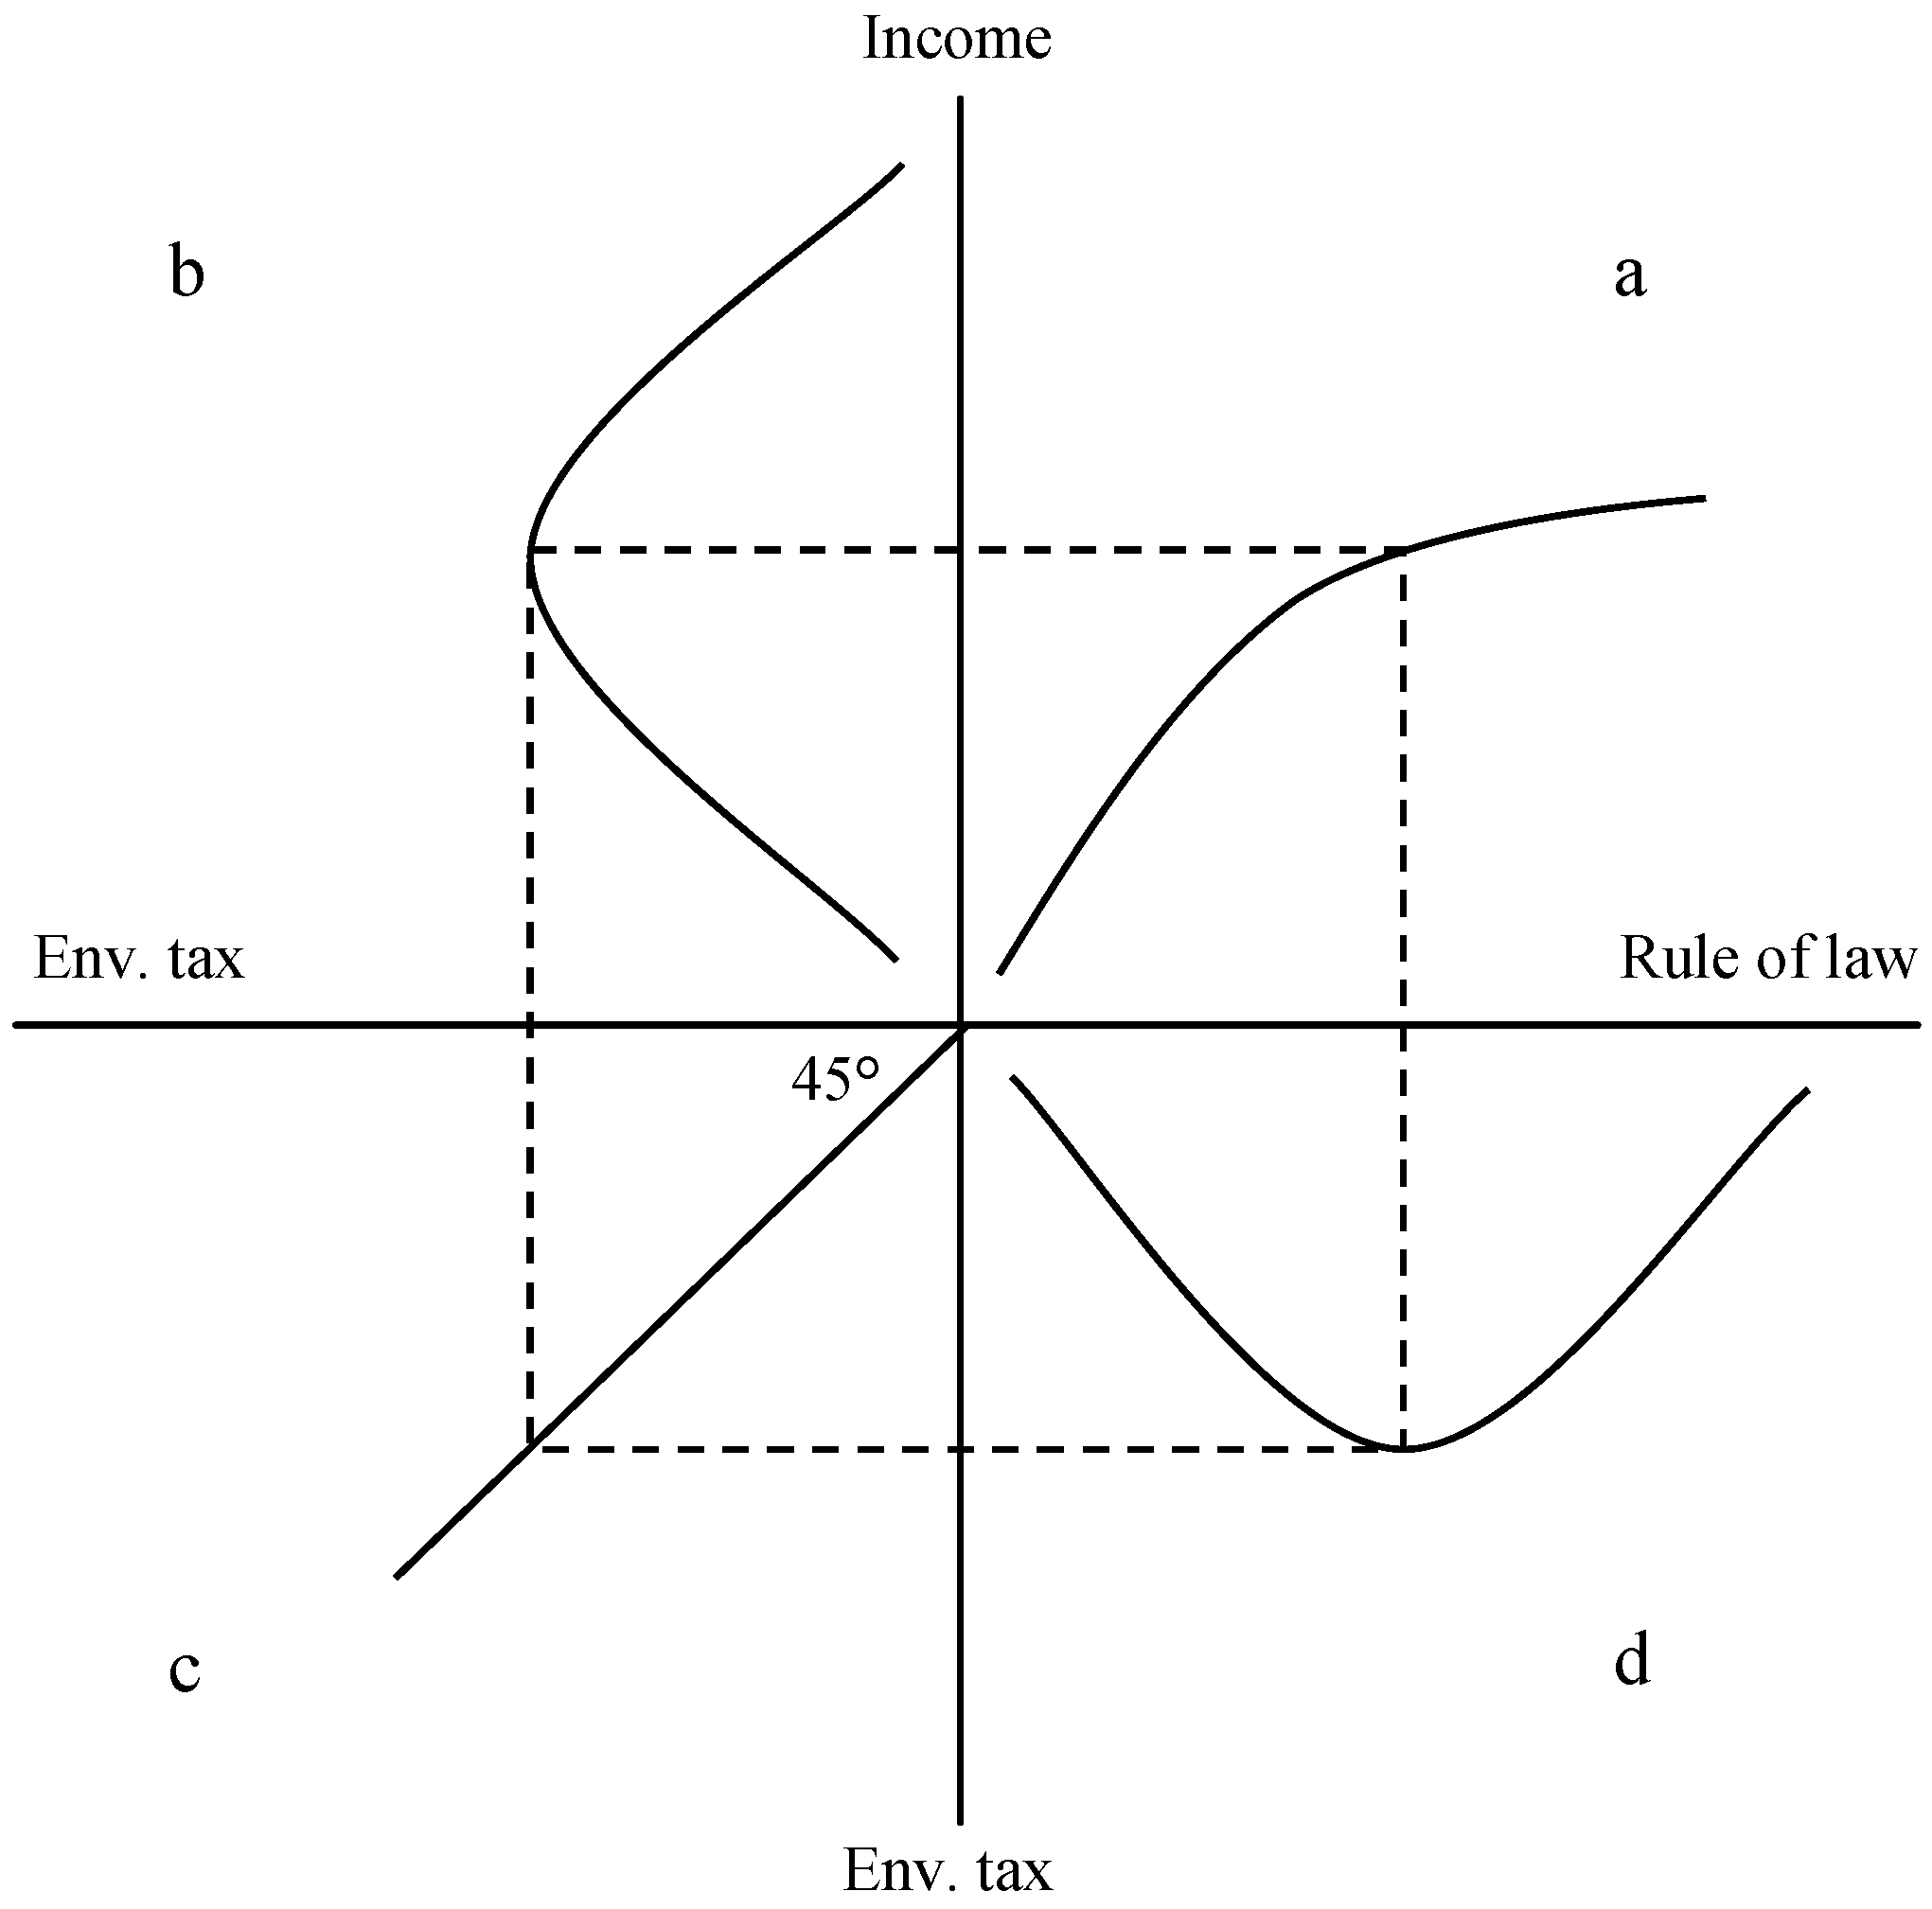
On the basis of the existing literature and following [
24], we can illustrate the links between the rule of law, income and environmental taxation, as shown in
Figure 1. The quadrant (a) presents the direct influence that the rule of law (
Rule of Law) has on income (
Income), a relationship that has been widely recognized in the economic literature as a positive one, since income per capita increases in countries where the rule of law is more stringent. The quadrant (b) represents the relationship between income and environmental taxation (
Env. Tax). The level of environmental taxation increases (
dEnv. Tax/
dIncome > 0), since greater attention is given to environmental issues as income increases, up to a turning point. After this point, high income and enforcement of the rule of law lead to a decrease in pollution levels and, consequently, to a decrease in taxation (
dEnv. Tax/
dIncome < 0). The combination of these effects determines the inverse U-shaped relationship between environmental taxation and income, which we attempt to investigate. The quadrant (c) is a dummy that allows us to translate environmental taxation on the vertical axis. The relationship between environmental taxation and the rule of law is illustrated in quadrant (d). As the enforcement of the rule of law increases, environmental taxes may be gradually introduced (
dEnv. Tax/
dRule of Law > 0); when the rule of law becomes more stringent, environmental quality improves; this, in turn, leads to a decrease of environmental tax levels (
dEnv. Tax/
dRule of Law < 0).
Figure 1.
The relationship between environmental taxation, income and the rule of law.
Figure 1.
The relationship between environmental taxation, income and the rule of law.
A country tends to raise environmental taxation levels as institutional development proceeds, followed by declining taxation and better institutional quality at more advanced stages of economic development.
We emphasize that our primary interest lies in understanding the importance of the rule of law in the environmental taxation-growth relationship. However, the links between regulatory policy, growth and institutions can take different forms, where each of the factors influences other factors and reinforces each other. For example, the level of trust existing in the economy may influence not only environmental taxation and growth relationship, but also the degree of the rule of law enforcement. Our aim is to uncover one possible mechanism existing between environmental protection, economic growth and the rule of law, but a further analysis could be undertaken to take into account the complexity of the relationship between environment, economic growth and institutions.
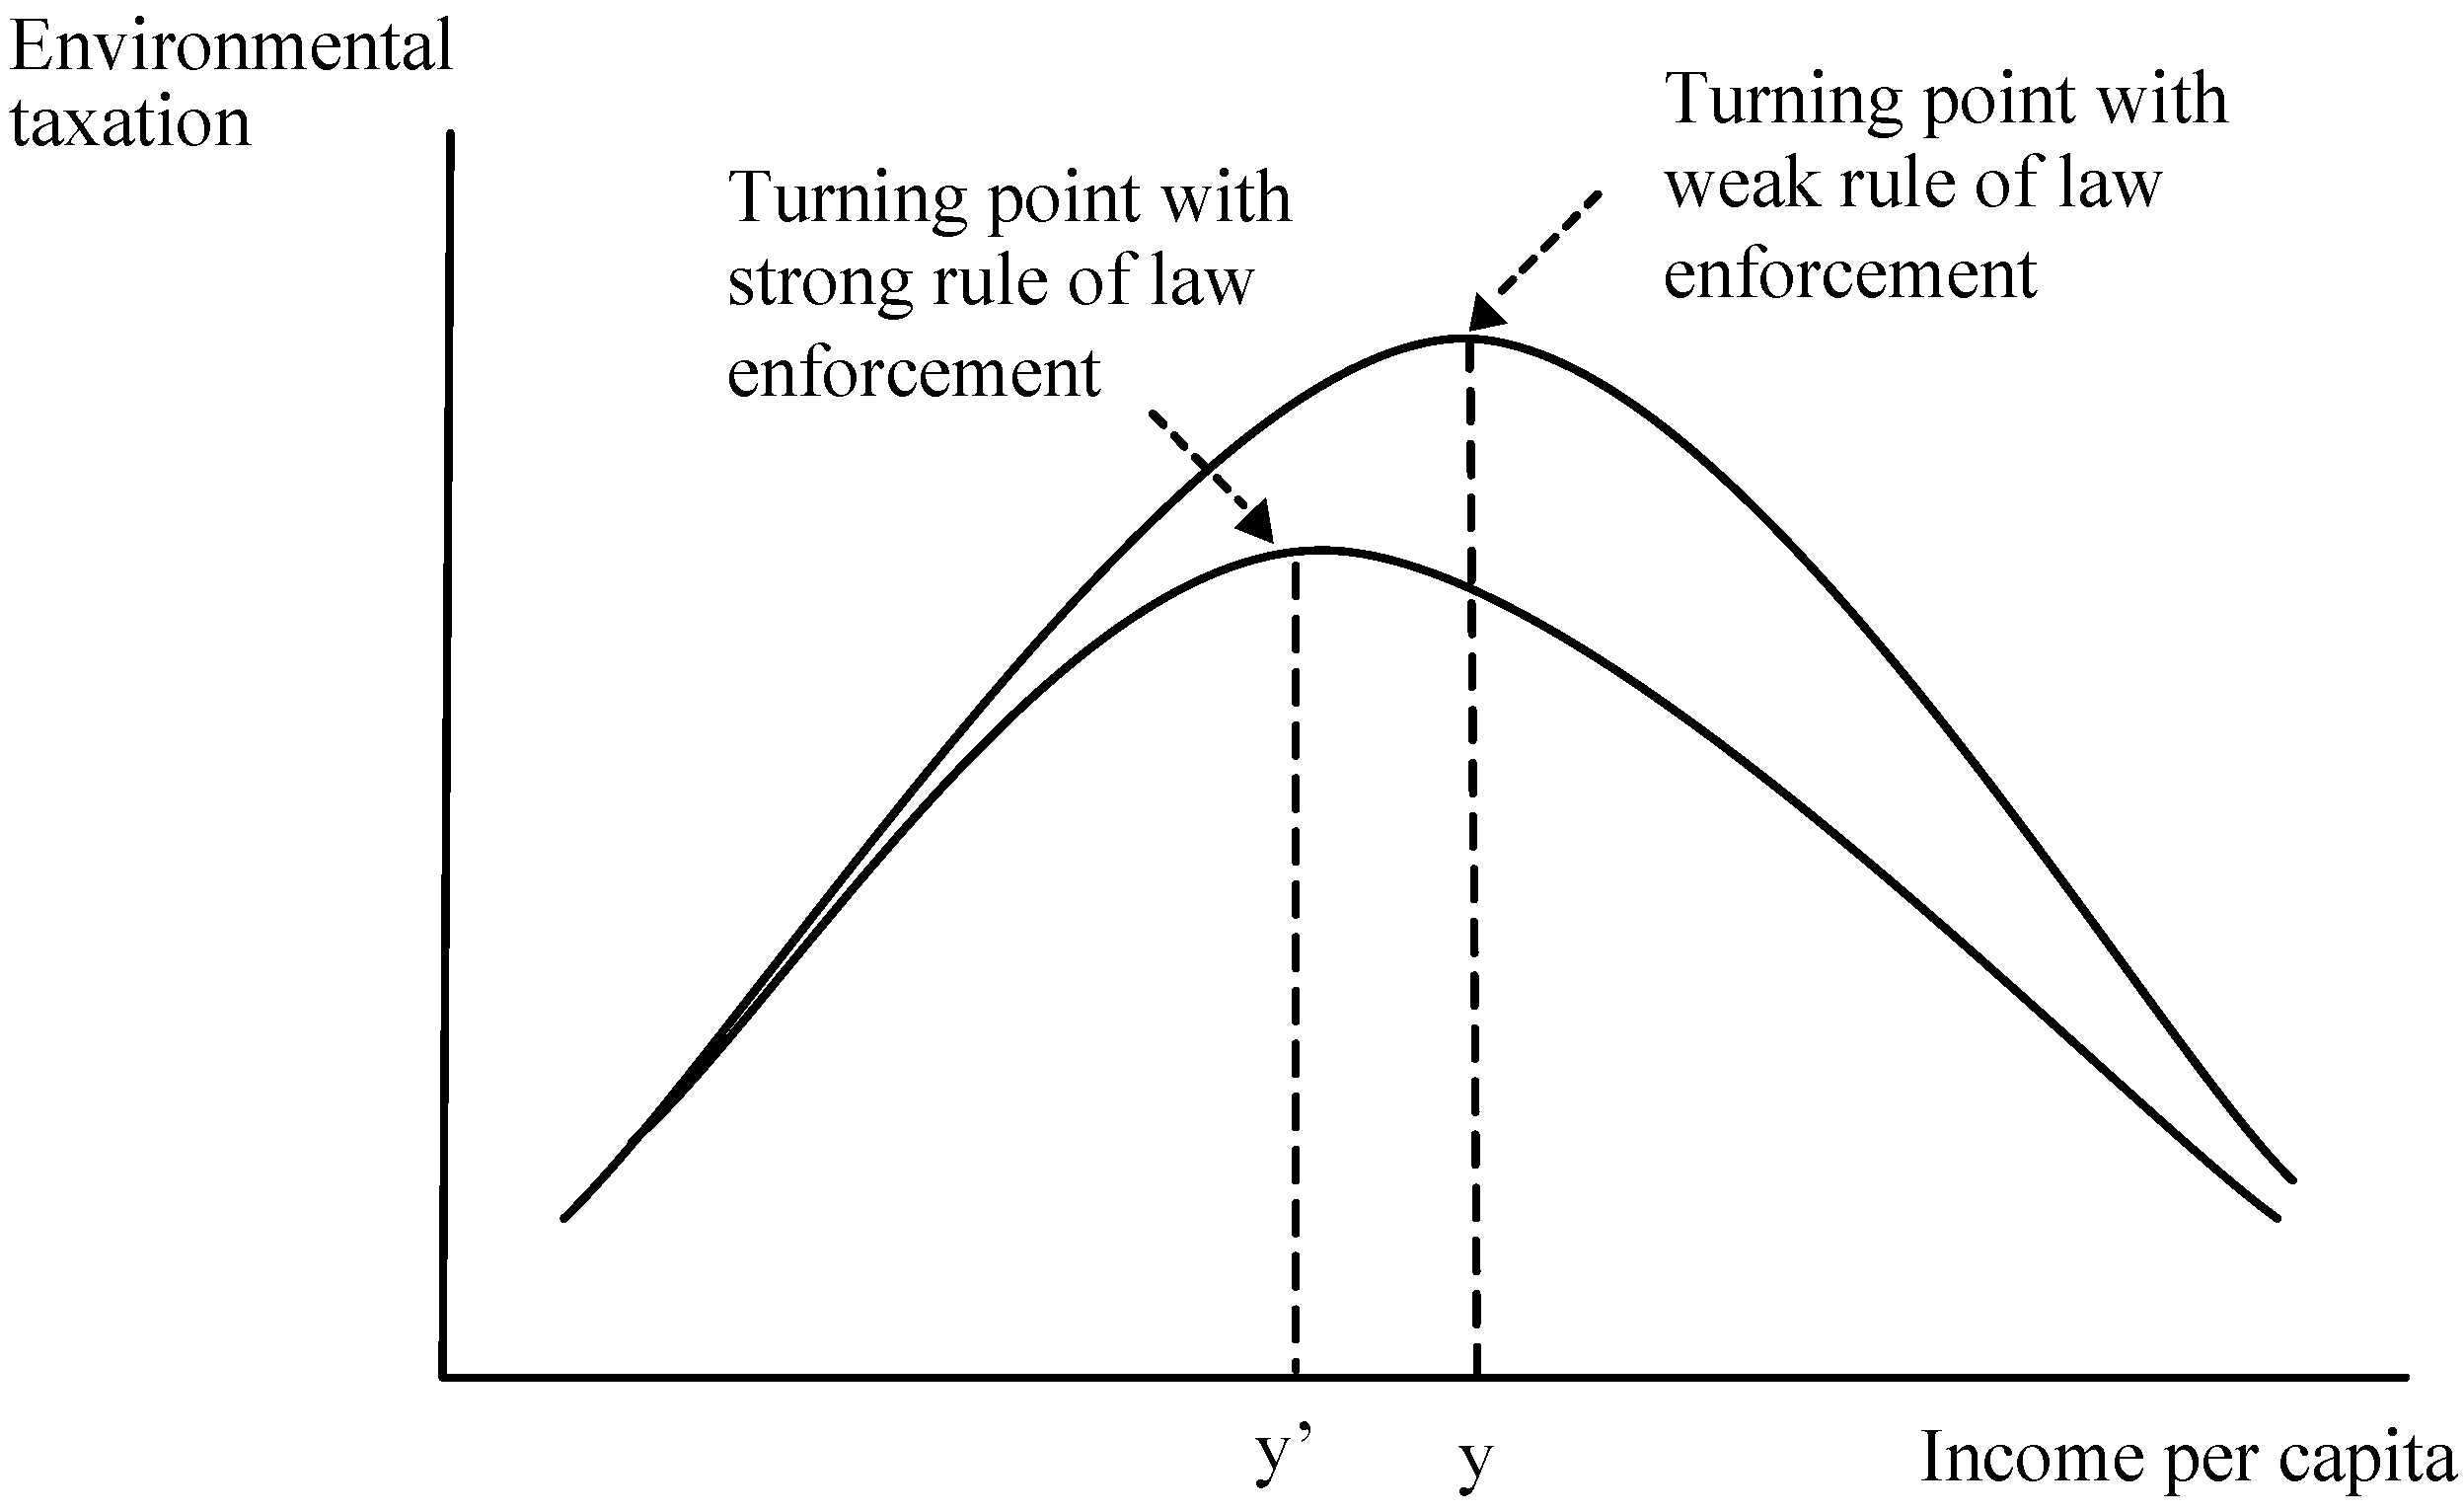
Finally, it should be noted that heterogeneity could be expected in the environmental taxation-income path in different countries. In fact, the theory of opportunity costs states that, in pollution abatement, wealthy countries have lower opportunity costs with respect to less developed ones [
40]; moreover, higher per capita income and strong institutions are both associated with lower pollution. In fact, despite the fact that less developed countries with weak institutions work towards pollution abatement, in many cases, their environmental progress is undermined by a lack of enforcement of regulations [
25]. This explains how the environmental protection, income and institutions are related (
Figure 2). Under the strong rule of law, the turning point of the ETKC shifts to the left, towards a lower income point. This is because strong institutions facilitate environmental policies and provide more effective environmental protection, even at lower income levels. We argue, therefore, that countries with different levels of institutional enforcement would have heterogeneous environmental taxation-income paths.
Figure 2.
Environmental taxation Kuznets curve: different scenarios.
Figure 2.
Environmental taxation Kuznets curve: different scenarios.
The enforcement of the rule of law shifts the turning point of the curve to lower levels of per capita income and pollution.
3. Model
To verify the existence of an inverse U-shaped curve of the environmental taxation-income relationship and the influence of the rule of law on the behaviour of this curve, we start by considering the direct and indirect effect the rule of law has on environmental taxation. In addition to the direct effect on environmental taxation, there is an indirect effect on taxation through the influence of the rule of law on per capita income.
Our analysis is based on the alternative methodology to test the inverse U-shaped curve proposed by [
41]. This approach has the advantage of a more robust estimation, as it avoids the use of nonlinear transformations of non-stationary regressors, a problem that occurs in quadratic and cubic regression functions (the estimation of the pollution-income relationship based on these functions was found to suffer from severe econometric misspecifications; for a review, see [
42]).
We assume that the change of environmental taxation (
ET) is a function of the growth rate of GDP (
g) and of the distance of income (
y) from the turning point (
y*):
Therefore, (ET) increases until the turning point y* is reached and decreases thereafter when the coefficient γ is negative and g is positive. A negative sign of γ reflects the inverse U-shaped relationship between environmental taxation and per capita GDP.
To incorporate the direct effect of the rule of law on the environmental taxation, we follow the approach proposed by [
12] and establish the turning point
y* as a function of the rule of law (
RoL):
We assume that ϕ
2 < 0, so that the stronger rule of law implies lower levels of GDP per capita at the turning point
y*. By bringing together and integrating with respect to time Equations (1) and (2), while keeping income, average growth rate and the average degree of the rule of law constant, we obtain:
where λ is a constant of integration.
To estimate Equation (3) the following reduced form is used, transforming environmental taxation into logarithms:
where the countries are indexed by
i and time by
t.
ET is the environmental tax per capita,
yi is the average real per capita GDP,
gi is the average real per capita GDP growth and
RoLi is the average of the degree of the rule of law, all measured over the sampled period. Additional explicative variables are defined by matrix
Zit. These variables are expected to influence the level of environmental taxation: the level of corruption, the quality of regulation, index of economic freedom, tax revenue in GDP, the share of exports and imports in GDP, greenhouse gas emissions, rents from crude oil, a dummy that reflects the shock in oil prices and a dummy that reflects a change in European environmental policy.
In accordance with our model, the negative sign of α0 confirms the hypothesis of the existence of the U-shaped curve of the environmental taxation-income relationship (ETKC), while the hypothesis of the inverse relationship between per capita income and the rule of law at the turning point of the ETKC is checked by ϕ2 = α2/α0 < 0, so that α2 > 0.
In order to introduce the indirect effect of the rule of law on environmental taxation through income, we estimate the following growth equation:
where real per capita GDP (
Yit) is a function of the rule of law (
Rit) and other regressors (
Xit). The matrix (
Xit) consists of classical variables of the growth model, such as capital stock, level of education and share of trade in GDP, while µ
i and χ
t correspond to unobserved specific effects of country and year, respectively. From Equation (5), the fitted values of
Yit are extracted to obtain interpolated values
yi and
gi for Equation (4). This is done by computing the average value of per capita GDP of the first (
Y1
i) and the last (
Y2
i) four-year period of the total of GDP series for each country and calculating the average of per capita GDP and its growth rate in the following way:
where
yi and
gi are interpolated values at a sample mid-point.
On the basis of the estimation of Equation (4), we evaluate the existence of the ETKC and the influence of the rule of law on the position of the turning point.
4. Data, Variables and Descriptive Statistics
Due to scarce data availability, we use as a proxy of environmental taxation the indicator of environmental taxation revenue provided by Eurostat [
43]. Among the explicative variables, we introduce the rule of law index [
26]. Data on this, from 1996 to 2002, is available every two years, while data from 2003 to 2008 is given yearly. The missing data for the years 1997, 1999 and 2001 are imputed as the average value between two years.
Other independent variables used are: the quality of regulation, the index of economic freedom, level of corruption, tax revenue in GDP, shares of exports and imports in GDP, and greenhouse gas emissions. The first three variables reflect the quality of the institutional environment, which influences the process of tax collection. Strong regulator quality, transparent economic systems and low corruption limit tax evasion, thus increasing tax revenues. The measures of the quality of regulation and the level of corruption are also provided by [
26]. The index of economic freedom is taken from [
44]. The variable on tax revenue in GDP reflects the volume of various taxes collected and indicates the intensity of tax collection. Finally, economic openness expressed in imports and exports reflects the level of economic activity, influencing pollution and, therefore, the amount of environmental tax revenues. The greenhouse gas emissions variable is a measure of environmental quality and is expected to influence environmental taxation, as in the polluter pays principle.
Finally, being aware that environmental taxation revenue may be influenced by a wide range of factors, for example, as a result of policy change or oil price shocks, we introduce into the model other plausible determinants of environmental taxation revenue in order to take into account these possible effects. We consider the rents from oil extraction, expressed as the difference between the value of crude oil production at world prices and total costs of production, as a determinant of environmental taxation, given that the substantial part of environmental taxes are energy taxes, which depend on the trends in oil prices. Data on these variables were taken from the World Bank [
45]. We expect the above explicative variables to have a positive relationship with environmental taxation. In addition, we add two dummy variables; the first dummy is equal to one after year 1999 when a sharp increase of oil prices was registered and zero otherwise [
46]. The second dummy captures the influence of European environmental policy legislation aimed at emission reduction that was particularly intensive after 2004 [
47]. Hence, the variable is equal to one after 2003 and zero before this period.
Data used in this analysis was obtained from a panel of 28 European countries and spans the timeframe from 1996 to 2008 for a total of 392 observations.
Table 1 reports the description of variables and source of data, while
Table 2 presents a summary of the sample statistics.
To obtain interpolated values of average income per capita (
yi) and its growth rate (
gi) and to estimate the indirect effect of the rule of law on the environmental taxation-income relation, we utilize classical variables of economic growth models (Equation (5)). These variables are real per capita GDP, capital per worker, education and share of exports and imports in GDP, all obtained from [
45]. For the purpose of capturing the indirect effect, we divided countries according to their stage of economic development. This was necessary in light of criticisms made by [
25,
48] on probable overlapping of country data series. This must be considered in our model, since we have high-income observations from market economy countries and low-income observations from former transition countries. Moreover, this division helps to capture how different economic and institutional conditions affect income and, therefore, environmental taxation. The first group (
G1) includes European countries characterized by mature industrial and/or service sectors, such as Austria, Belgium, Denmark, Finland, France, Germany, Luxemburg, the Netherlands, Norway, Sweden and the United Kingdom. Countries that, according to the European Union regional policies, present delayed development in industrial and/or growing service sectors at either the national or regional level constitute the second group (
G2): Cyprus, Greece, Ireland, Italy, Malta, Portugal and Spain. Former transition countries with a shrinking agricultural sector and developing industrial and service sectors were assigned to the third group (
G3): Bulgaria, the Czech Republic, Estonia, Hungary, Latvia, Lithuania, Poland, Romania, Slovakia and Slovenia.
Table 1.
Data information.
Table 1.
Data information.
| Variable | Definition | Source |
|---|
| Y | Real per capita GDP: Purchasing Power Parity constant prices 2005, international $. | [45] |
| Kpw | Capital stock per worker: measured as gross capital formation percentage of GDP. | [45] |
| R (Rol) | Rule of law: an indicator measured in units ranging from about −2.5 to 2.5, with higher values corresponding to better governance outcomes. | [26] |
| CCorr | Control of corruption: an indicator measured in units ranging from about −2.5 to 2.5, with higher values corresponding to better governance outcomes. | [26] |
| EcFree | Index of economic freedom: the overall index includes different kinds of freedom—business, trade, fiscal policy, monetary, investment, financial, property rights, labour and freedom of corruption. | [44] |
| EDU | School enrolment: gross enrolment ratio, which is the ratio of total enrolment, regardless of age, to the population of the age group that officially corresponds to the level of tertiary education. | [45] |
| Engfrac | Fraction of a country’s population that speaks English as a mother tongue. | [49] |
| ET | Environmental tax revenue per capita, €. | [43] |
| Eurfrac | Fraction of a country population that speaks one of the five primary Western European languages, including English as a mother tongue. | [49] |
| RegQual | Regulatory quality: an indicator measured in units ranging from about −2.5 to 2.5, with higher values corresponding to better governance outcomes. | [26] |
| TaxRevenueGDP | Tax revenue: compulsory transfers to the central government for public purposes measured as a percentage of GDP. | [45] |
| XIMint | Share of exports and imports in GDP: export and imports of goods and services represent the value of all goods and other market services provided and received from the rest of the world. | [45] |
| GGE | Greenhouse gas emissions (CO2 equivalent) | [43] |
| RentOil | Oil rents (% of GDP) expressed as the difference between the value of crude oil production at world prices and total costs of production | [45] |
| D_oil_price | The dummy variable is equal to 1 if year ≥2000 | [47] |
| D_policy | The dummy variable is equal to 1 if year ≥2004 | [46] |
Table 2.
Sample summary statistics.
Table 2.
Sample summary statistics.
| Variable | Observations | Mean | Standard deviation | Min | Max |
|---|
| Y | 363 | 24,723.22 | 11,987.3 | 5921.674 | 74,421.63 |
| Kpw | 352 | 8459.583 | 5676.116 | 374.5925 | 32,710.88 |
| R (Rol) | 364 | 1.148901 | 0.580172 | −0.193140 | 1.964045 |
| CCorr | 364 | 1.156859 | 0.794892 | −1.021719 | 2.47 |
| EcFree | 364 | 66.15247 | 7.229807 | 45.7 | 82.6 |
| EDU | 321 | 53.12494 | 18.25695 | 9.626324 | 94.88895 |
| Engfrac | 364 | 0.061286 | 0.223440 | 0 | 0.974 |
| ET | 363 | 6.391923 | 0.637011 | 4.68375 | 7.654727 |
| Eurfrac | 364 | 0.244464 | 0.394537 | 0 | 1.004 |
| RegQual | 364 | 1.162789 | 0.423399 | −0.234753 | 2.012003 |
| TaxRevenueGDP | 256 | 20,816.41 | 4955.785 | 10,700 | 32,700 |
| XIMint | 362 | 105.6177 | 50.04793 | 44.15393 | 318.2252 |
| GGE | 364 | 11.2873 | 1.4179 | 7.8099 | 13.9437 |
| RentOil | 364 | 0.214531 | 0.52289 | 0 | 2.8114 |
| D_oil_price | 364 | 0.69231 | 0.46217 | 0 | 1 |
| D_policy | 364 | 0.3846 | 0.4872 | 0 | 1 |
5. Estimations and Discussion
One of the problems when estimating a growth model (Equation (5)) is the possible endogeneity between the rule of law and income. In fact, countries tend to enter virtuous circles of institutional and economic development. To address the problem of endogeneity, the rule of law was instrumented by considering: (I) the fraction of the population that speaks English as a mother tongue; (II) the fraction of the population that speaks one of the five primary Western European languages, including English as a mother tongue; and (III) the index of economic freedom. First-stage regression indicates the validity of the instrumental variables used here. Moreover, the validity of the first two instruments has been confirmed by [
11,
12,
49]. Other variables, such as country’s distance from the equator and a dummy for legal origin were added as instruments in the regression, but they did not prove to be valid. The endogeneity of the rule of law was also tested with the Durbin–Wu–Hausman test, the results of which (not reported) led to rejection of the null hypothesis that the rule of law is exogenous.
The growth model (Equation (5)) is estimated for the three groups of countries:
G1,
G2,
G3. Given the presence of fitted values of
yi and
gi, we do not express variables in natural logarithms and instrument the rule of law by using Two Stage Least Squares (
Table 3). As suspected, rule of law (
Rit) does not have the same influence on income across the three groups of countries. In the
G1 group, the rule of law has a positive and significant impact on income, while in the
G2 group, the rule of law has a negative, but a significant impact. This unexpected sign can be due to the fact that institutional performance in these countries declined in the presence of increasing per capita income. It seems that the worsening effects of the rule of law on growth were strongly counterbalanced by other economic factors. As expected, in former transition countries (
G3), which present the lower average value of the rule of law index, there is no statistically significant relationship between income and the rule of law. Other variables, such as capital stock, level of education and economic 1openness, expressed through exports and imports, all have a significant positive effect on income, with the exception of
Edu in the
G2 group.
Table 3.
Estimation results for growth Equation (5).
Table 3.
Estimation results for growth Equation (5).
| Variable | G1 | G2 | G3 |
|---|
| R | 9252.85 * | −6659.37 *** | 993.273 |
| (4661.173) | (2121.705) | (1762.512) |
| Kpw | 1.404 *** | 1.557 *** | 2.013 *** |
| (0.137) | (0.167) | (0.234) |
| Edu | 34.469 * | 34.651 | 52.179 *** |
| (20.879) | (25.81) | (8.016) |
| XIMsh | 52.481 *** | 43.318 *** | 36.532 *** |
| (11.664) | (11.905) | (7.301) |
| Constant | −6787.4 *** | 13,409.26 *** | −106.849 *** |
| (7379.95) | (2288.912) | (1346.251) |
| Observations | 119 | 70 | 122 |
| Number of id † | 11 | 7 | 10 |
| R-squared | 0.776 | 0.828 | 0.844 |
| Wald χ2 | 577.25 | 222.7 | 2242.27 |
| Probability | (0.000) | (0.000) | (0.000) |
Dealing with panel data, we considered the difference between fixed and random effect models [
50]. To estimate Equation (5), we preferred the random effects model, since introducing time invariant instruments prevented the potential correlation between country-specific effects and the explanatory variables. In estimating the direct effect of the rule of law on environmental taxation (Equation (4)), it is very likely that a country’s unobservable characteristics can be correlated with income, thus making it more appropriate to consider estimates derived from fixed effects. Moreover, given the significance of Hausman test statistics, the random effects model was rejected in favour of the fixed effects model.
The ETKC model (Equation (4),
Table 4) was first estimated considering only
ygt,
gt and
RoLgt (Specification 1). These variables were all significant with expected signs. As discussed in
Section 3, the negative sign of the coefficient on
ygt indicates the presence of the inverse U-shaped environmental taxation-income relationship in European countries. These results confirm our first hypothesis: with the growth of income, environmental taxation first increases to counteract the damaging effects of pollution and then decreases, once pollution starts to decline as a consequence of the successful application of environmental taxation policy. It is worth noting that the coefficient on
RoLgt is positive, demonstrating the expected positive relationship between the strength of the rule of law and environmental taxation.
Our findings also confirm the second hypothesis on the importance of the rule of law for the position of the environmental taxation-income path. As the estimated value of ϕ
2, which is negative and statistically significant (
Table 4), demonstrates, the strong rule of law determines the turning point of the ETKC at a lower level of income per capita. Under the strong rule of law, the turning point of the environmental taxation-income path shifts to the left, indicating greater efficiency of environmental taxation policy, where pollution abatement is enhanced, even at lower income levels.
Successively, other explanatory variables were added (Specification 2): control of corruption (CCorr), regulatory quality (RegQual), index of economic freedom (Ecfree), tax revenue in GDP (TaxRev), share of exports and imports in GDP (XIMint), greenhouse gas emissions (GGE) and oil rents as a percentage of GDP (RentOil). As expected, all variables carry positive signs and are statistically significant. Control of corruption, regulatory quality, gas emissions and oil rents have a greater effect on environmental taxation than the index of economic freedom and economic openness, while the effect of taxation revenue is very small.
The dummy variable that controls for the shock in oil prices after 1999 (D_oil_price) is not statistically significant. This could suggest that environmental taxation is not sensitive to the change of oil market prices, probably because European countries are in a large part oil consumers and not producers. In fact, as the positive sign of the variable (RentOil) and its significance demonstrates, oil rents are an important source for environmental taxation. The other dummy that accounts for the effects of regulation (D_policy) is significant and confirms the positive effect of the legislation of European countries aimed at environmental improvement.
The final hypothesis we test is that of the presence of heterogeneity in the environmental taxation-income path between different economies. We believe that market economy countries (
mark) where the rule of law is strong have already reached the turning point in the ETKC, while former transition countries (
ptrans) with lower levels of income and where the rule of law is weaker have just started the declining trend or have not yet reached the turning point. Heterogeneity in the environmental taxation-income relationship is introduced by relaxing the assumption that these two groups of countries have the same turning point, which is influenced by the state of the rule of law. Following [
12], we investigate this heterogeneity allowing for different income slopes across countries.
Table 4.
Estimation results based on interpolated values (Equation (4)).
Table 4.
Estimation results based on interpolated values (Equation (4)).
| Variable | 1 | 2 | 1a | 2a |
|---|
| ygt | −0.91 *** | −1.500 *** | −0.53 ** | −1.160 *** |
| (0.201) | (0.248) | (0.246) | (0.299) |
| ygt * ptrans | | | 0.218 *** | 0.156 *** |
| | | (0.053) | (0.060) |
| gt | 9.118 *** | 13.763 *** | 3.912 * | 9.664 *** |
| (1.744) | (2.142) | (2.332) | (2.849) |
| RoLgt | 0.632 *** | 1.095 *** | 1.424 *** | 1.607 *** |
| (0.215) | (0.243) | (0.343) | (0.344) |
| RoLgt * ptrans | | | −1.185 *** | −1.055 *** |
| | | (0.372) | (0.444) |
| CCorr | | 0.152 *** | | 0.145 *** |
| | (0.042) | | (0.042) |
| RegQual | | 0.174 *** | | 0.178 *** |
| | (0.048) | | (0.047) |
| EcFree | | 0.007 *** | | 0.005 ** |
| | (0.002) | | (0.002) |
| TaxRevenueGDP | 0.00003 *** | | 0.00003 *** |
| XIMint | | (0.000) | | (0.000) |
| | 0.002 *** | | 0.001 |
| GGE | | (0.001) | | (0.001) |
| | 0.269 *** | | 0.333 *** |
| | (0.110) | | (0.112) |
| RentOil | | 0.154 * | | 0.160 * |
| | (0.085) | | (0.084) |
| D_oil_price | | −0.026 | | −0.023 |
| | (0.019) | | (0.019) |
| D_policy | | 0.056 *** | | 0.051 *** |
| | (0.017) | | (0.018) |
| Constant | −44.618 *** | −15.970 *** | −44.749 *** | −22.072 *** |
| (3.256) | (7.031) | (3.240) | (7.625) |
| ϕ2 | −0.649 | −0.730 | | |
| p-value | (0.000) | (0.000) | | |
| Observations | 338 | 241 | 338 | 241 |
| Number of id | 26 | 26 | 26 | 26 |
| R-squared | 0.59 | 0.75 | 0.61 | 0.75 |
| F-test | 145.99 | 51.30 | 95.49 | 51.30 |
| p-value | (0.000) | (0.000) | (0.000) | (0.000) |
| Hausman | 444.29 | 101.73 | 483.00 | 115.48 |
| p-value | (0.000) | (0.000) | (0.000) | (0.000) |
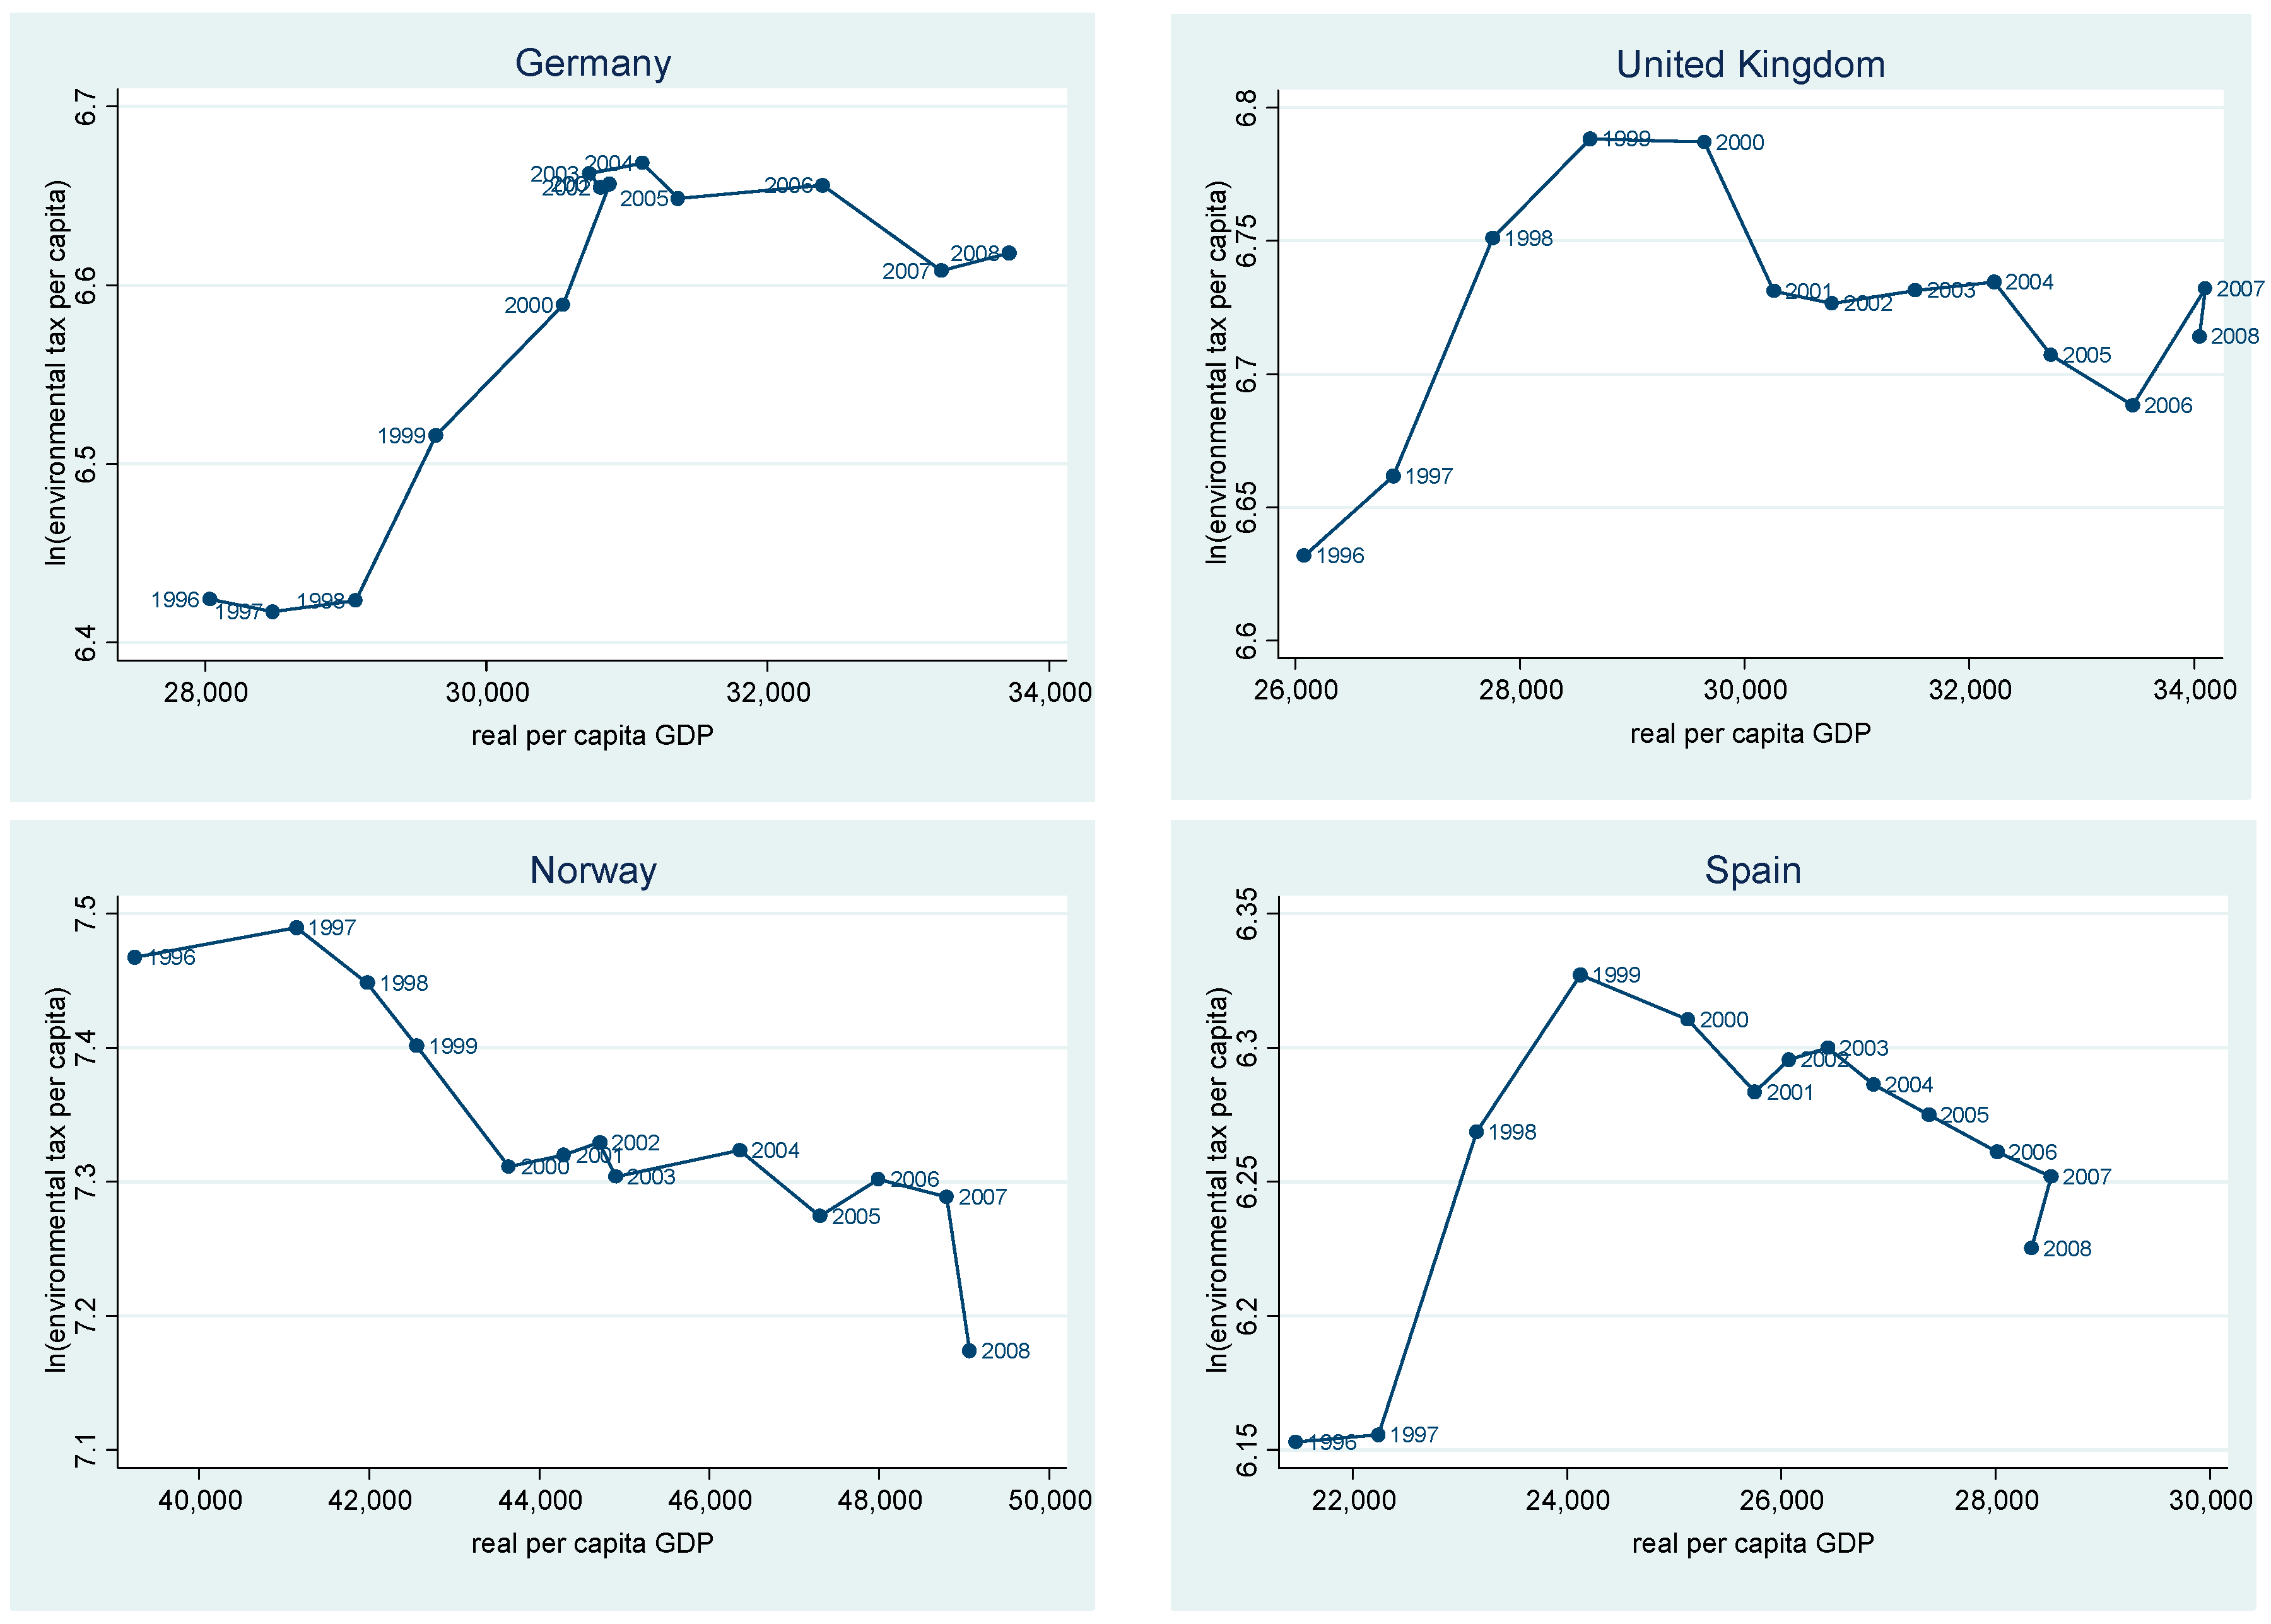
The descriptive analysis of the data confirms this hypothesis. To illustrate this, the environmental taxation-income path for four market economies (
Figure 3) and four former transition countries (
Figure 4) is shown. As is evident, market economy countries have already achieved their turning point and have reduced environmental taxation, while former transition countries have only recently reached the turning point, probably due to weak enforcement of the rule of law.
Figure 3.
Environmental tax and income: market economy countries.
Figure 3.
Environmental tax and income: market economy countries.
The relationship between per capita income and environmental taxation presents an inverse U-shaped curve in market economy countries.
To test for heterogeneity, we add two additional variables,
yigit *
ptrans and
RoLigit *
ptrans, which incorporate the effect of the rule of law in former transition economies in Equation (4) to obtain:
Estimation results obtained from Equation (8) are presented in
Table 4. Specification 1a contains basic variables, while Specification 2a includes the control variables. Given that all the variables are statistically significant in all of the estimations, the heterogeneity assumption cannot be rejected.
To determine if the inverse U-shape curve characterizes the environmental taxation-income relation, we test the hypothesis of α
01 < 0 and α
01 + α
02 < 0 for the market economy and former transition countries, respectively. In addition, by testing the hypothesis α
21/α
01 < 0 and (α
21 + α
22)/(α
01 + α
02) < 0 for the market economy and former transition countries, we evaluate whether a relationship exists between the rule of law and per capita income at the turning point. The results show (
Table 5) that market economy countries are characterized by the inverse U-shape environmental taxation-income path, where the enforced rule of law leads to a turning point at a lower level of per capita income. As for former transition economies, in the basic specification of the model (Y1a), there is no evidence for the ETKC path and no impact from the rule of law. The evidence of the curve and the influence of the rule of law appears only when other control variables are considered (Y2a). This is probably due to the fact that former transition economies have not yet achieved much progress in applying environmental policies and should pay more attention to the enforcement of the rule of law.
Figure 4.
Environmental tax and income: former transition countries.
Figure 4.
Environmental tax and income: former transition countries.
The per capita income and environmental taxation path has recently reached the turning point of the inverse U-shaped curve in former transition economies.
Table 5.
Estimation results for the heterogeneity model (Equation (8)).
Table 5.
Estimation results for the heterogeneity model (Equation (8)).
| Parameter | (Y1a) | (Y2a) |
|---|
| Market economy European countries |
| α01 | −0.53 ** | −1.160 *** |
| | (0.032) | (0.000) |
| α21/α01 | −2.687 ** | −1.385 *** |
| | (0.015) | (0.000) |
| Former transition European countries |
| α01 + α02 | −0.312 | −1.004 *** |
| | (0.107) | (0.001) |
| (α21 + α22)/(α01 + α02) | −0.766 | −0.550 *** |
| | (0.168) | (0.001) |
6. Robustness Check
Given that the main hypothesis of our paper is that initially increasing environmental taxes is needed to make regulation effective and, later on, when pollution taxes “have done their job”, they can be lowered, we can hypothesize that there is a link between EKC and ETKC, as discussed in
Section 2. Consequently, our aim is to check if the reduced tax revenues go together with the improving environment. This means that our hypothesis calls for a joint estimation of EKC and ETKC. We proceed in two steps. Firstly, by applying our model, we estimate the EKC to test whether the proposed relationship holds using a polluter as dependent variable. Secondly, we apply the seemingly unrelated regression (SUR) methodology to jointly estimate EKC and ETKC, given that the two models appear independent while they can be correlated through the error terms. In order to avoid the problem of identical regressors in the SUR estimation [
51], in the EKC equation, we replace the rule of law variable with the regulatory quality (
RegQual) variable. This indicator reflects law enforcement, so that it can be considered as a valid proxy for the rule of law. The obtained results for the robustness check are presented in
Table 6.
Table 6.
Estimation results for the robustness check. SUR, seemingly unrelated regression; EKC, environmental Kuznets curve; ETKC, environmental taxation Kuznets curve.
Table 6.
Estimation results for the robustness check. SUR, seemingly unrelated regression; EKC, environmental Kuznets curve; ETKC, environmental taxation Kuznets curve.
| Variable | Fixed Effects | SUR |
|---|
| | EKC | EKC | ETKC |
|---|
| Ygt | −0.000051 *** | −1.592 *** | −1.375 *** | −1.006 *** |
| (0.000) | (0.185) | (0.172) | (0.228) |
| Gt | 0.571 *** | 14.59 *** | 12.49 *** | 9.867 *** |
| (0.140) | (1.586) | (1.472) | (1.982) |
| RoLgt | −0.919 *** | | | 0.898 *** |
| (0.277) | | | (0.244) |
| RegQual | | −0.530 ** | −0.406 * | |
| | (0.260) | (0.240) | |
| Observations | 286 | 286 | 286 | 286 |
| Number of id | 26 | 26 | 26 | 26 |
| R-squared | 0.41 | 0.47 | | |
| F-test | 60.21 | 75.49 | | |
| Probability | (0.000) | (0.000) | | |
The second column of
Table 6 displays the estimated results of the same model as in column two of
Table 4, but with carbon monoxide emission as the dependent variable (EKC model) and
ygt,
gt and
RoLgt as regressors. Furthermore, in this case, the explanatory variables are significant with the expected signs. According to our model, the negative coefficient of
ygt indicates the presence of the EKC for carbon monoxide emissions in the panel of European countries. The negative sign of
RoLgt demonstrates the inverse relationship between the strength of the rule of law and the level of pollution. Very similar results are also obtained when we consider regulatory quality (
RegQual) as the institutional variable influencing the turning point (third column of
Table 6).
Finally, the fourth and fifth columns of
Table 6 display the obtained results when EKC and ETKC are estimated by applying SUR methodology. The emerging results are consistent with our previous conclusions. The estimated coefficients of the EKC and ETKC equations hold both in terms of signs and significance. Therefore, we can assert that our previous conclusions are also valid when the interrelationships between the ETKC, with environmental taxation as the dependent variable, and the EKC, with pollution as the dependent variable, are taken into account.
7. Conclusions and Policy Implications
This paper gives new insights into the links between environmental protection policy and economic growth, by assessing how this relationship is influenced by the quality of institutions in European countries. As a proxy for the environmental protection policy, we have used the environmental taxation, which since the early nineteen nineties, has been an essential policy instrument of European countries to combat environmental degradation and to enhance sustainable development. In particular, we advance the hypothesis that the relationship between environmental taxation and per capita income is an inverse U-shaped curve, which is based on the presumed success achieved by European economies in pollution abatement. This relationship, i.e., the environmental taxation Kuznets curve, is found to be strongly influenced by the rule of law, which plays a key role in enforcing environmental taxation policies and enhancing economic growth. Our analysis explains the differences in the environmental taxation-income relationship in market economy and former transition countries, given by differences in the progress achieved in the application of environmental protection policies, due to different levels of rule of law enforcement.
The analysis covers 28 European countries and utilizes data between 1996 and 2008. To prove the existence of the inverse U-shaped relationship between environmental taxation and per capita income, we apply the [
41] approach that avoiding the estimation of nonlinear regression increases its robustness. While the existing literature, such as [
12], extends the Bradford
et al. [
41] model to explore the links between environmental degradation and income, our contribution is to investigate the relationship between environmental protection and income, from an institutional perspective.
To analyse this relationship, we firstly address the indirect effect of the rule of law on environmental taxation through its impact on per capita income. Our results confirm the importance of the rule of law for economic growth. At the same time, the direct effect of the rule of law on environmental taxation demonstrates that enforcement of the rule of law has a positive impact on the application of environmental policy. In fact, we find evidence for the presence of the ETKC for the entire panel, with the turning point that occurs at a lower level of income when the rule of law is more stringent. Countries with enforced rule of law, therefore, achieve greater progress in environmental policies, even at a lower per capita income, reducing emissions and, thus, environmental taxation levels.
Heterogeneity is detected in the environmental taxation-income path between market economy and former transition countries. The results demonstrate that market economy countries are described by the ETKC, which is strongly influenced by enforcement of the rule of law. Former transition countries have not yet reached the turning point of the curve, and this probably reflects less stringent institutional context [
52], hindering full implementation of policies aimed to achieve sustainable development.
In addition, to take into account other factors that may influence environmental taxation, we provide the analysis of its possible determinants. Among the variables, we consider those related to production and consumption processes, governance quality, environmental degradation, shocks in oil prices and shifts in European environmental policy. All of the indicators have been demonstrated to be important in influencing environmental taxation revenue.
We perform two tests to check the robustness of our results. Firstly, we apply our methodology to test the EKC model and confirm that the model holds also when pollution is taken into consideration as the main variable to be explained. Secondly, we test the hypothesis that EKC and ETKC are interrelated through a joint estimation of the two models. The results, in both cases, support our main findings.
Our analysis suggests that the effective implementation of environmental protection policies is, first of all, the result of institutional enforcement. The findings support those who argue in favour of government intervention in defence of the environment, since, as we have demonstrated, environmental taxes provide advantages, both for environmental and economic development, improving social welfare. Our findings have strong policy implications for the Environmental Taxation Reform promoted by [
6] (p. 83) to shift “the burden of taxes from conventional taxes, such as labour (or capital), to environmentally damaging activities, such as resource use or pollution”. The existence of an ETKC for European countries supports the idea that increasing taxation on “bads” does not necessarily undermine economic activity. However, to be successful, this change should be accompanied by the enforcement of the rule of law to ensure that environmental policy leads to more effective reduction of emissions, subsequently requiring fewer resources to protect the environment. Our main finding, regarding the first increasing and then decreasing function of the relationship between environmental taxation and income, is important, since it holds not just for the tax on a single pollutant that involves short-term costs, but for the taxes of pollutants overall which, in the long-term, are an increasing function of income.
It should be noted that, given the objections on the increasing lack of support for ETR in many countries, our evidence on the existence of an ETKC may contribute to a more widespread acceptance of the need for environmental taxation, since taxation is demonstrated to decrease in time as income rises and the rule of law is enforced. However, to achieve this goal, greater coordination of ETR at the European level is required. Some European countries adopt and reinforce it, while others are still backsliding. Consequently, the interaction between European countries is not regulated by the same environmental and institutional policies, contributing to a decrease in support for ETR in those countries that do apply it. The heterogeneity in ETKC that we have found among market-based and former transition European countries highlights the existence of coordination problems at the EU level in environmental policies and the rule of law enforcement.
Finally, some words of caution should be given in interpreting the inverted environmental taxation U-shaped curve. First, the reduction of taxation in some countries may be the result of the transfer of production, with consequent pollution, to other countries. However, this is the case if we consider the side of production, but that of consumption (a car produced in an emerging country very often is sold in high income markets, where it releases its CO2 emissions). Second, in European countries where environmental taxation has started to decrease, this is mainly due to institutional reforms, such as ETR aimed at reducing pollution. Yet, when other countries fail to implement such reforms, the desired solution is unlikely to materialise in the long run. For example, the Pigouvian solution to environmental degradation is adopted in European countries, but not in other countries, such as the U.S., where the permits market of Coasian derivation to solve negative externalities is preferred. At the same time, many emerging economies, where the achievement of economic growth is the priority, do not introduce any institutional reforms to compel private users of environmental resources to take account of the social costs of their production or consumption. Moreover, even when these countries adhere to international protocols or agreements to control pollution, they are not able to enforce them, due to the weakness of the institutions. Nonetheless, we believe that an attempt to study the relationship between environmental taxation and per capita income in different contexts should be carried out, and the present results could be a useful starting point for future investigation.


