The Spatio-Temporal Evolution of Geo-Economic Relationships between China and ASEAN Countries: Competition or Cooperation?


Abstract
:1. Introduction
2. Materials and Methods
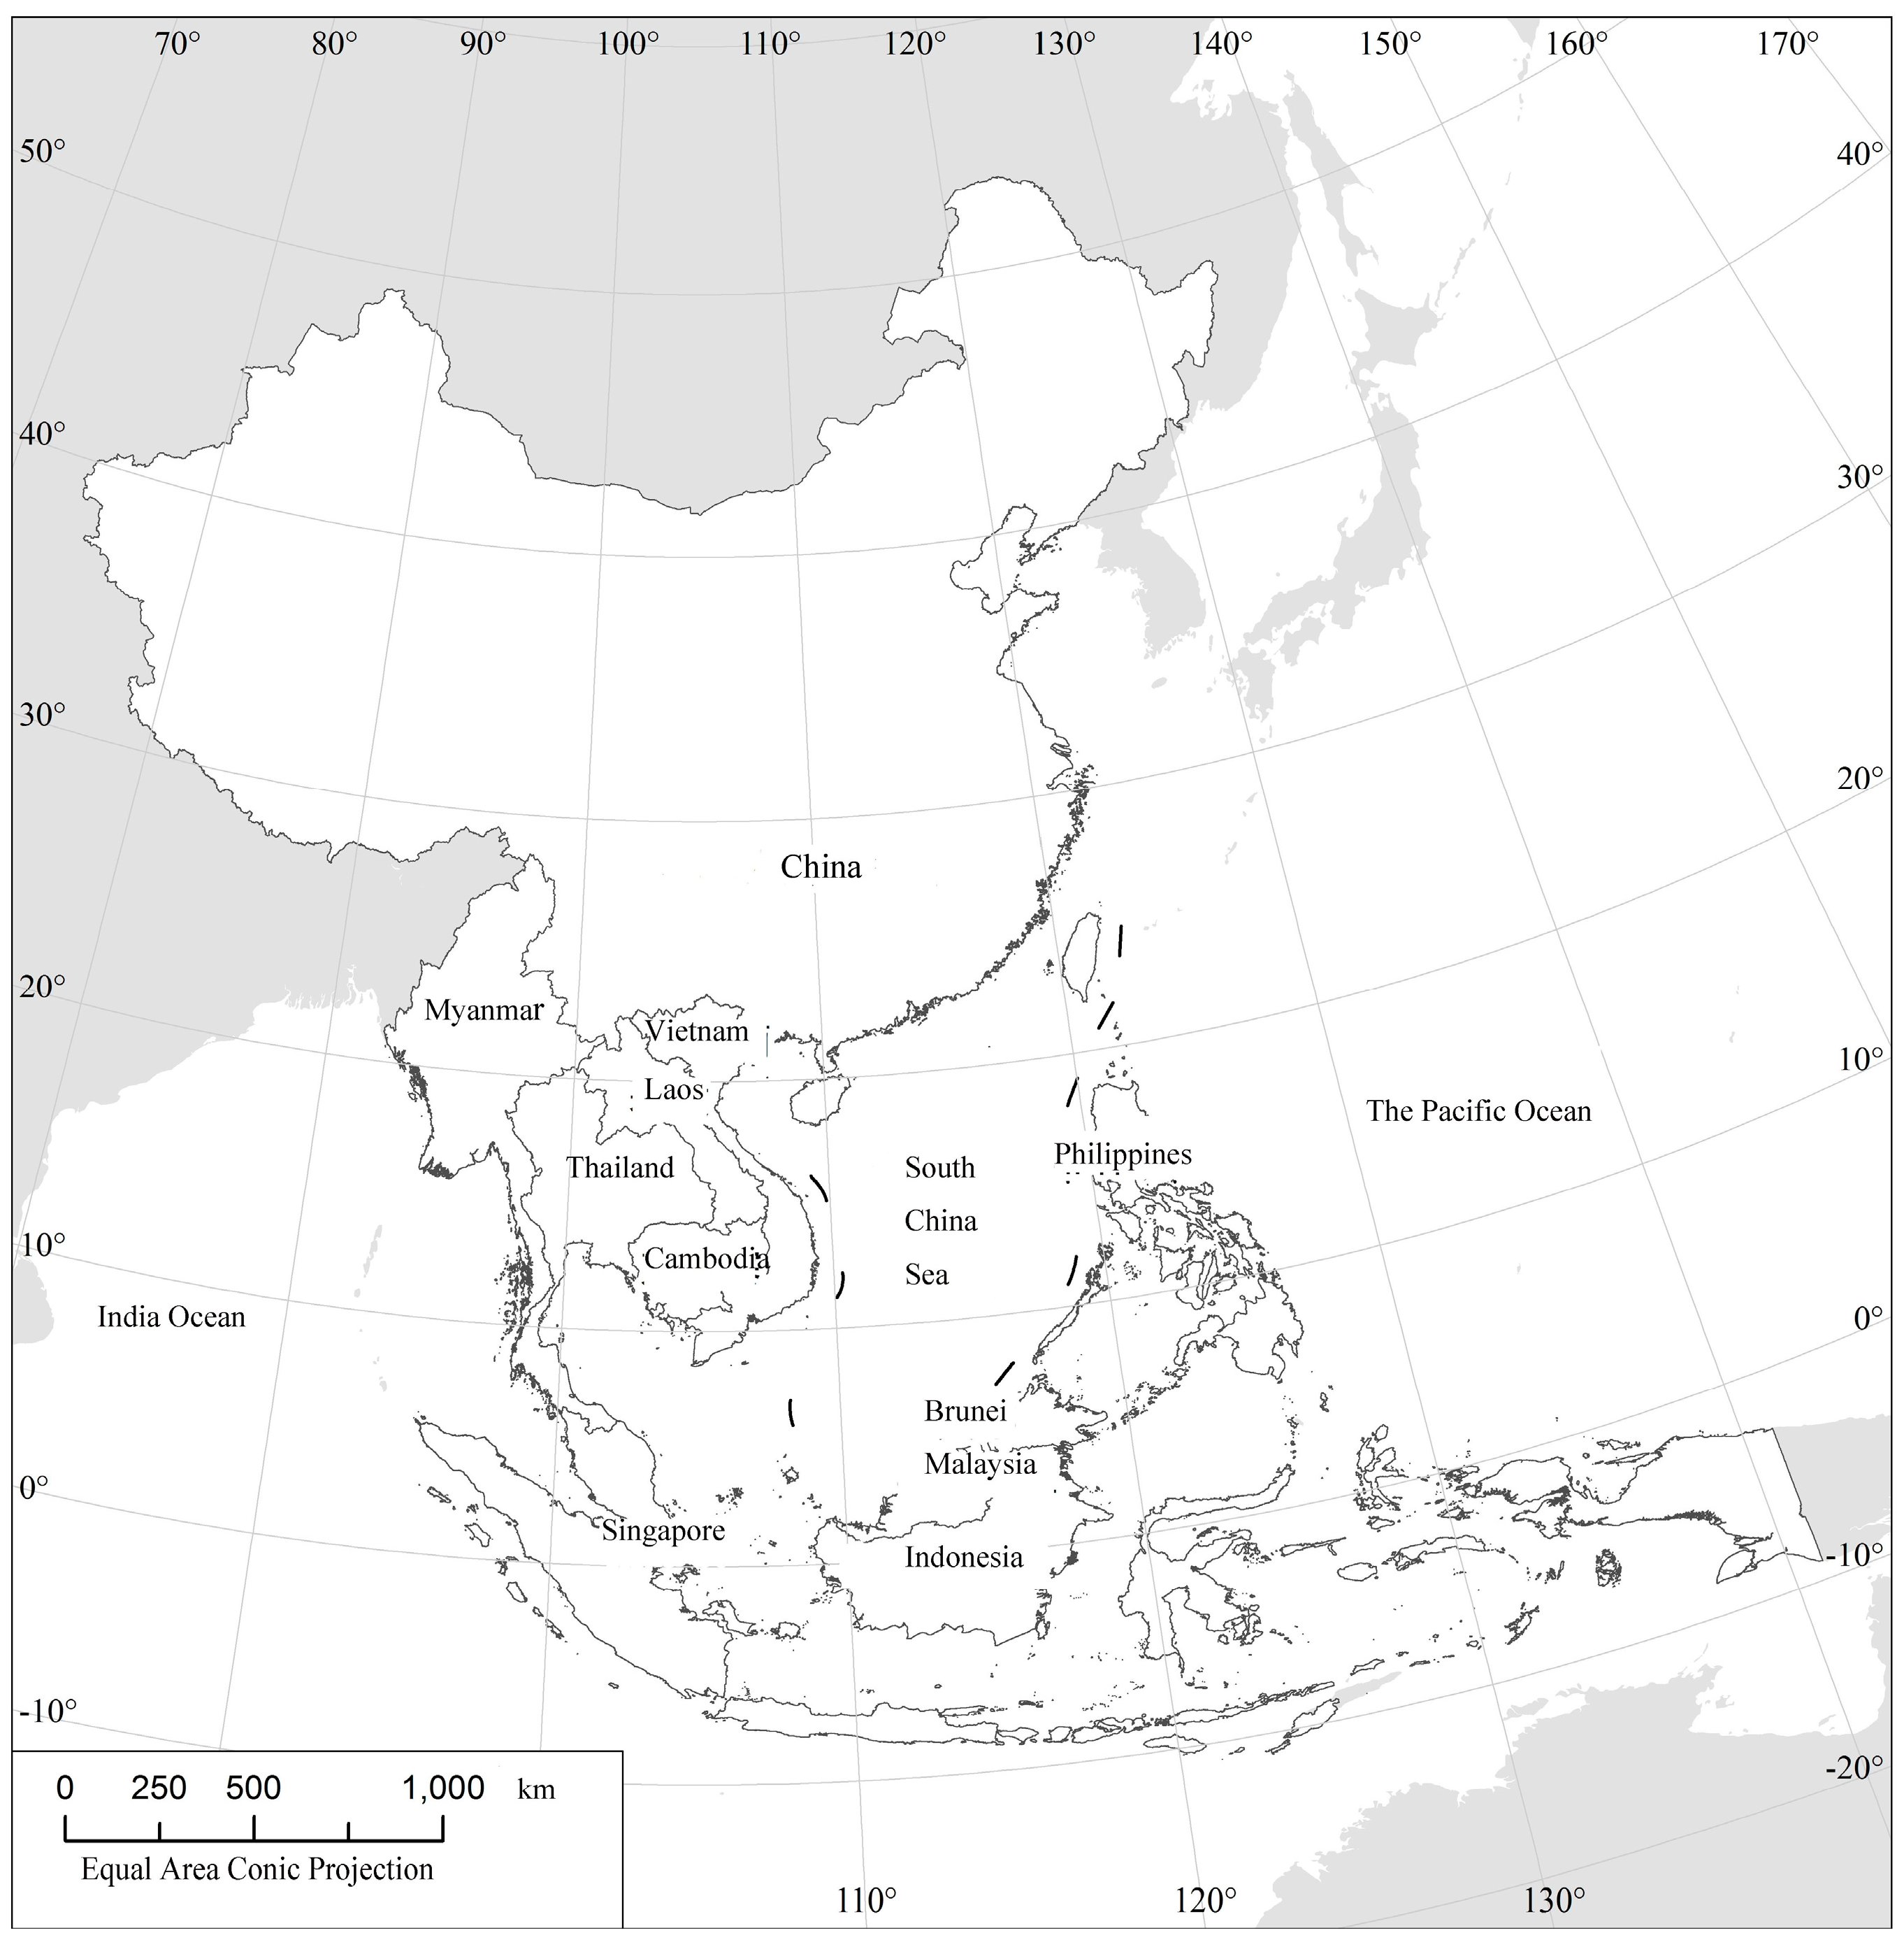
2.1. Research Area
2.2. Concept
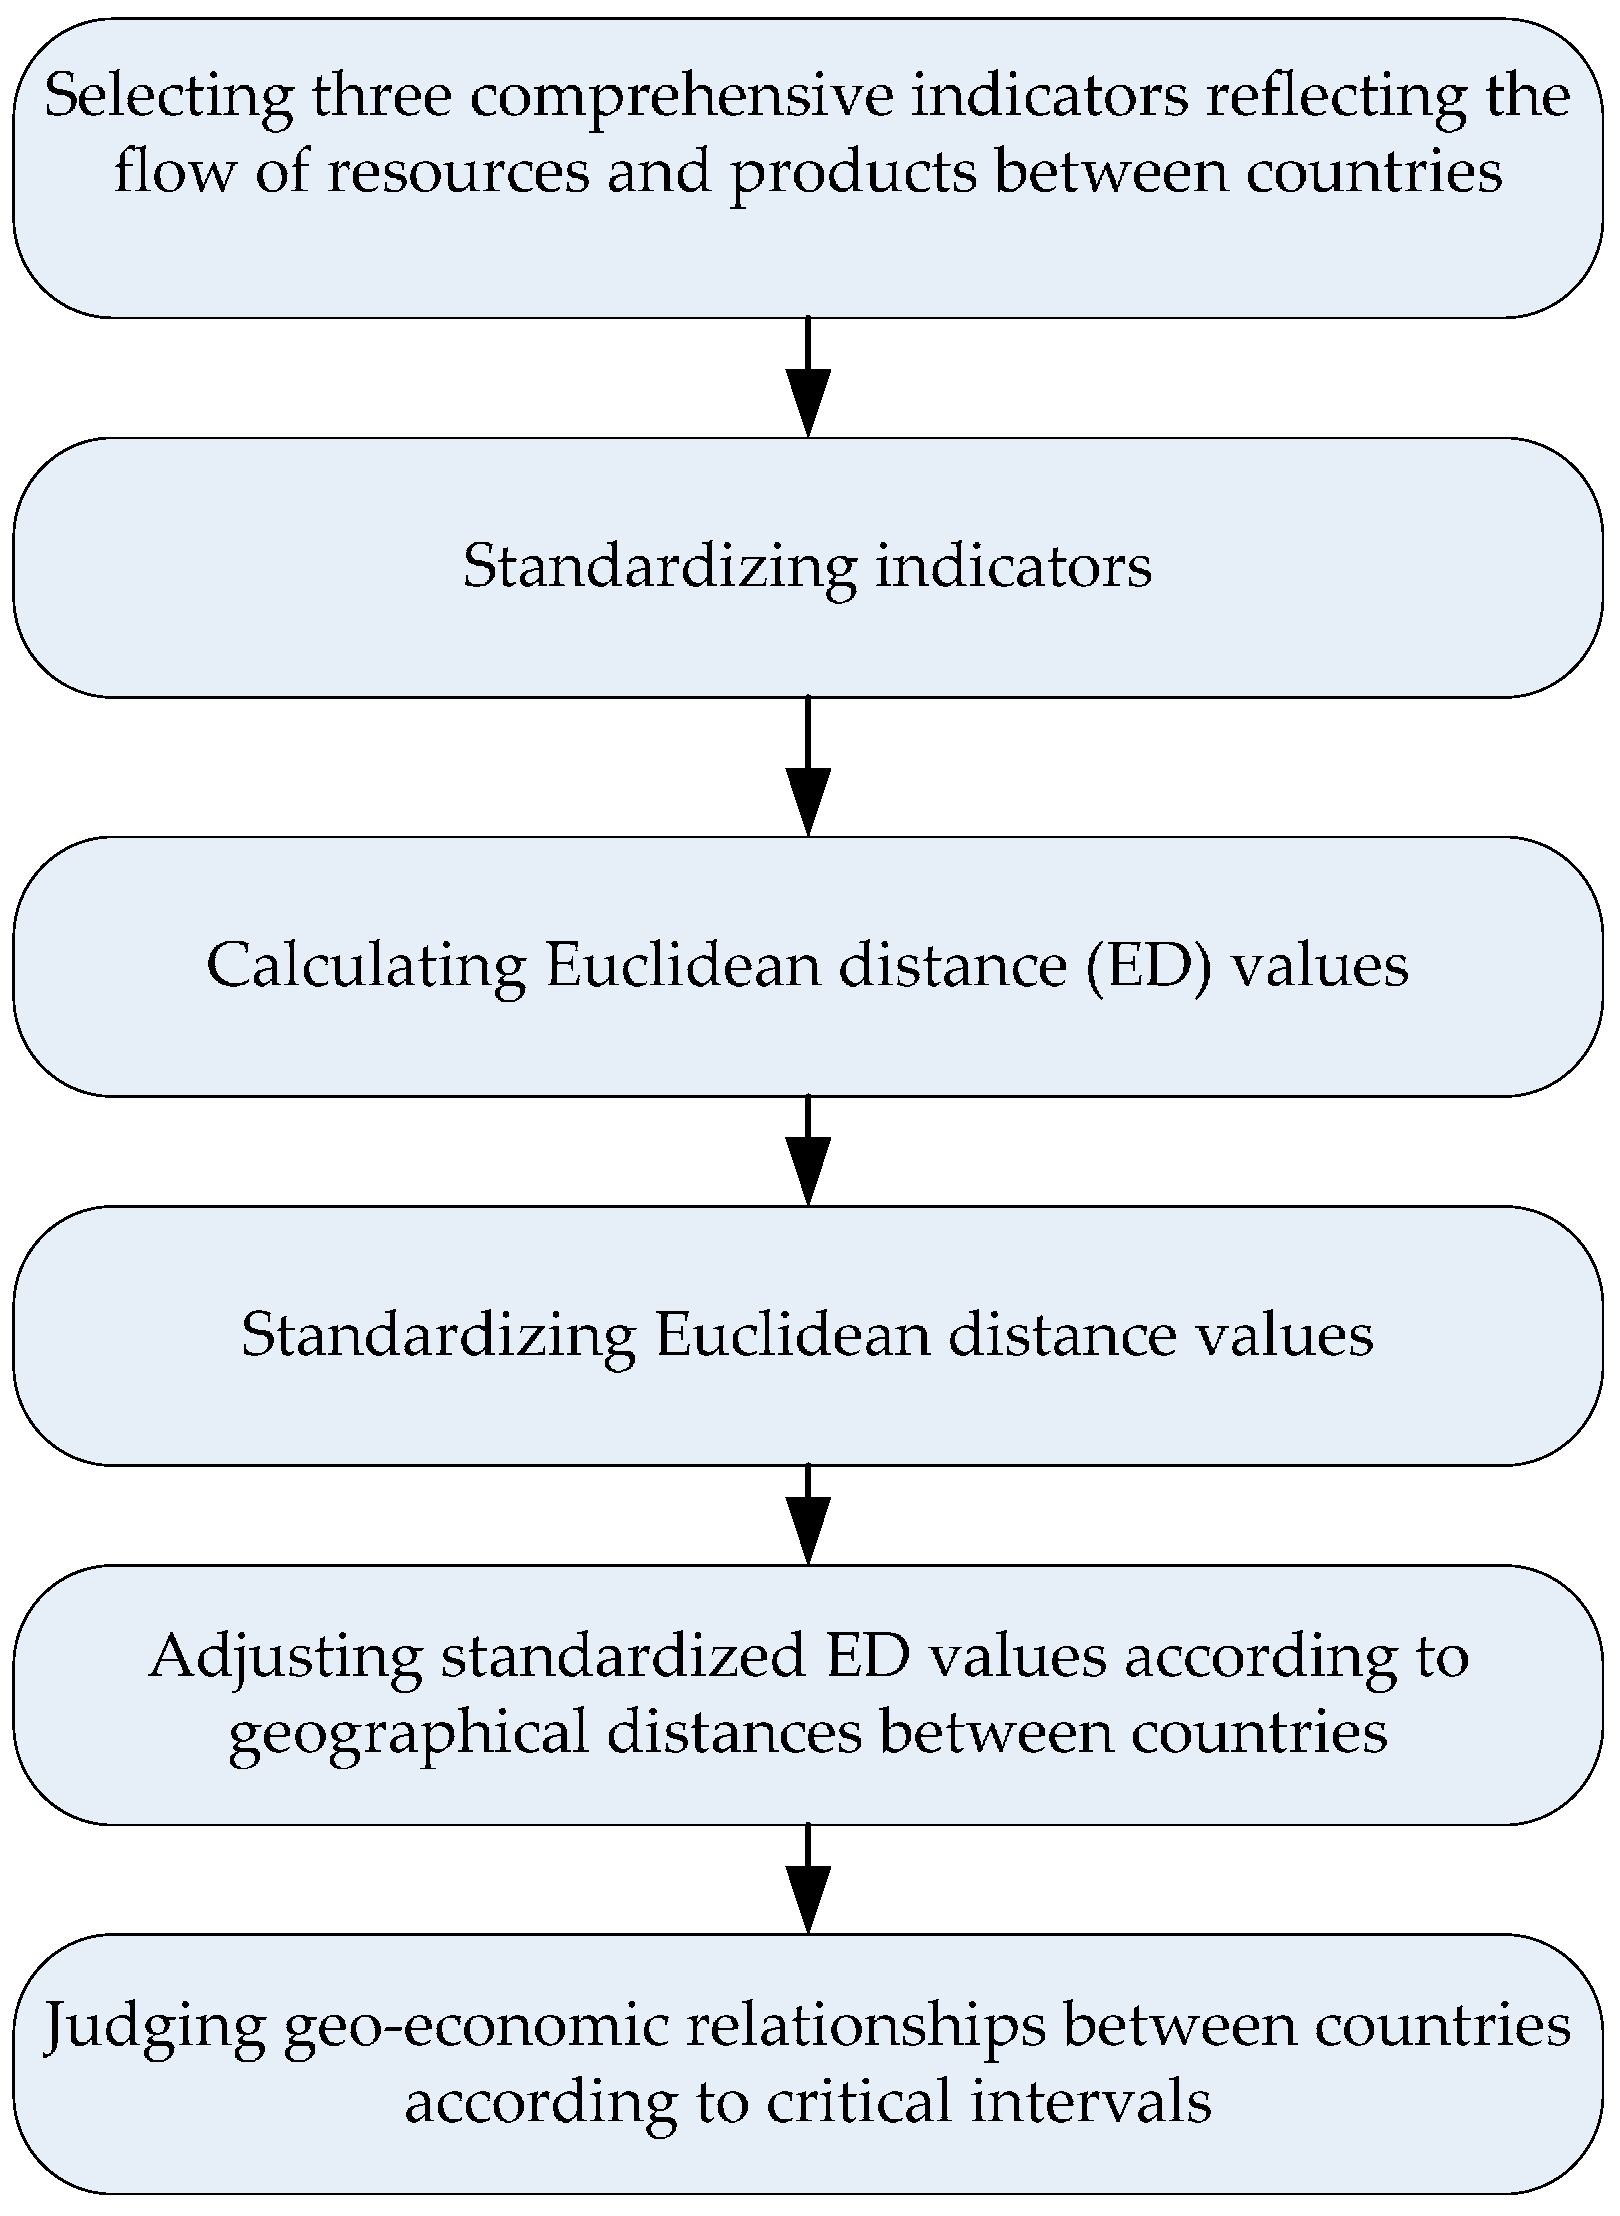
2.3.Research Method
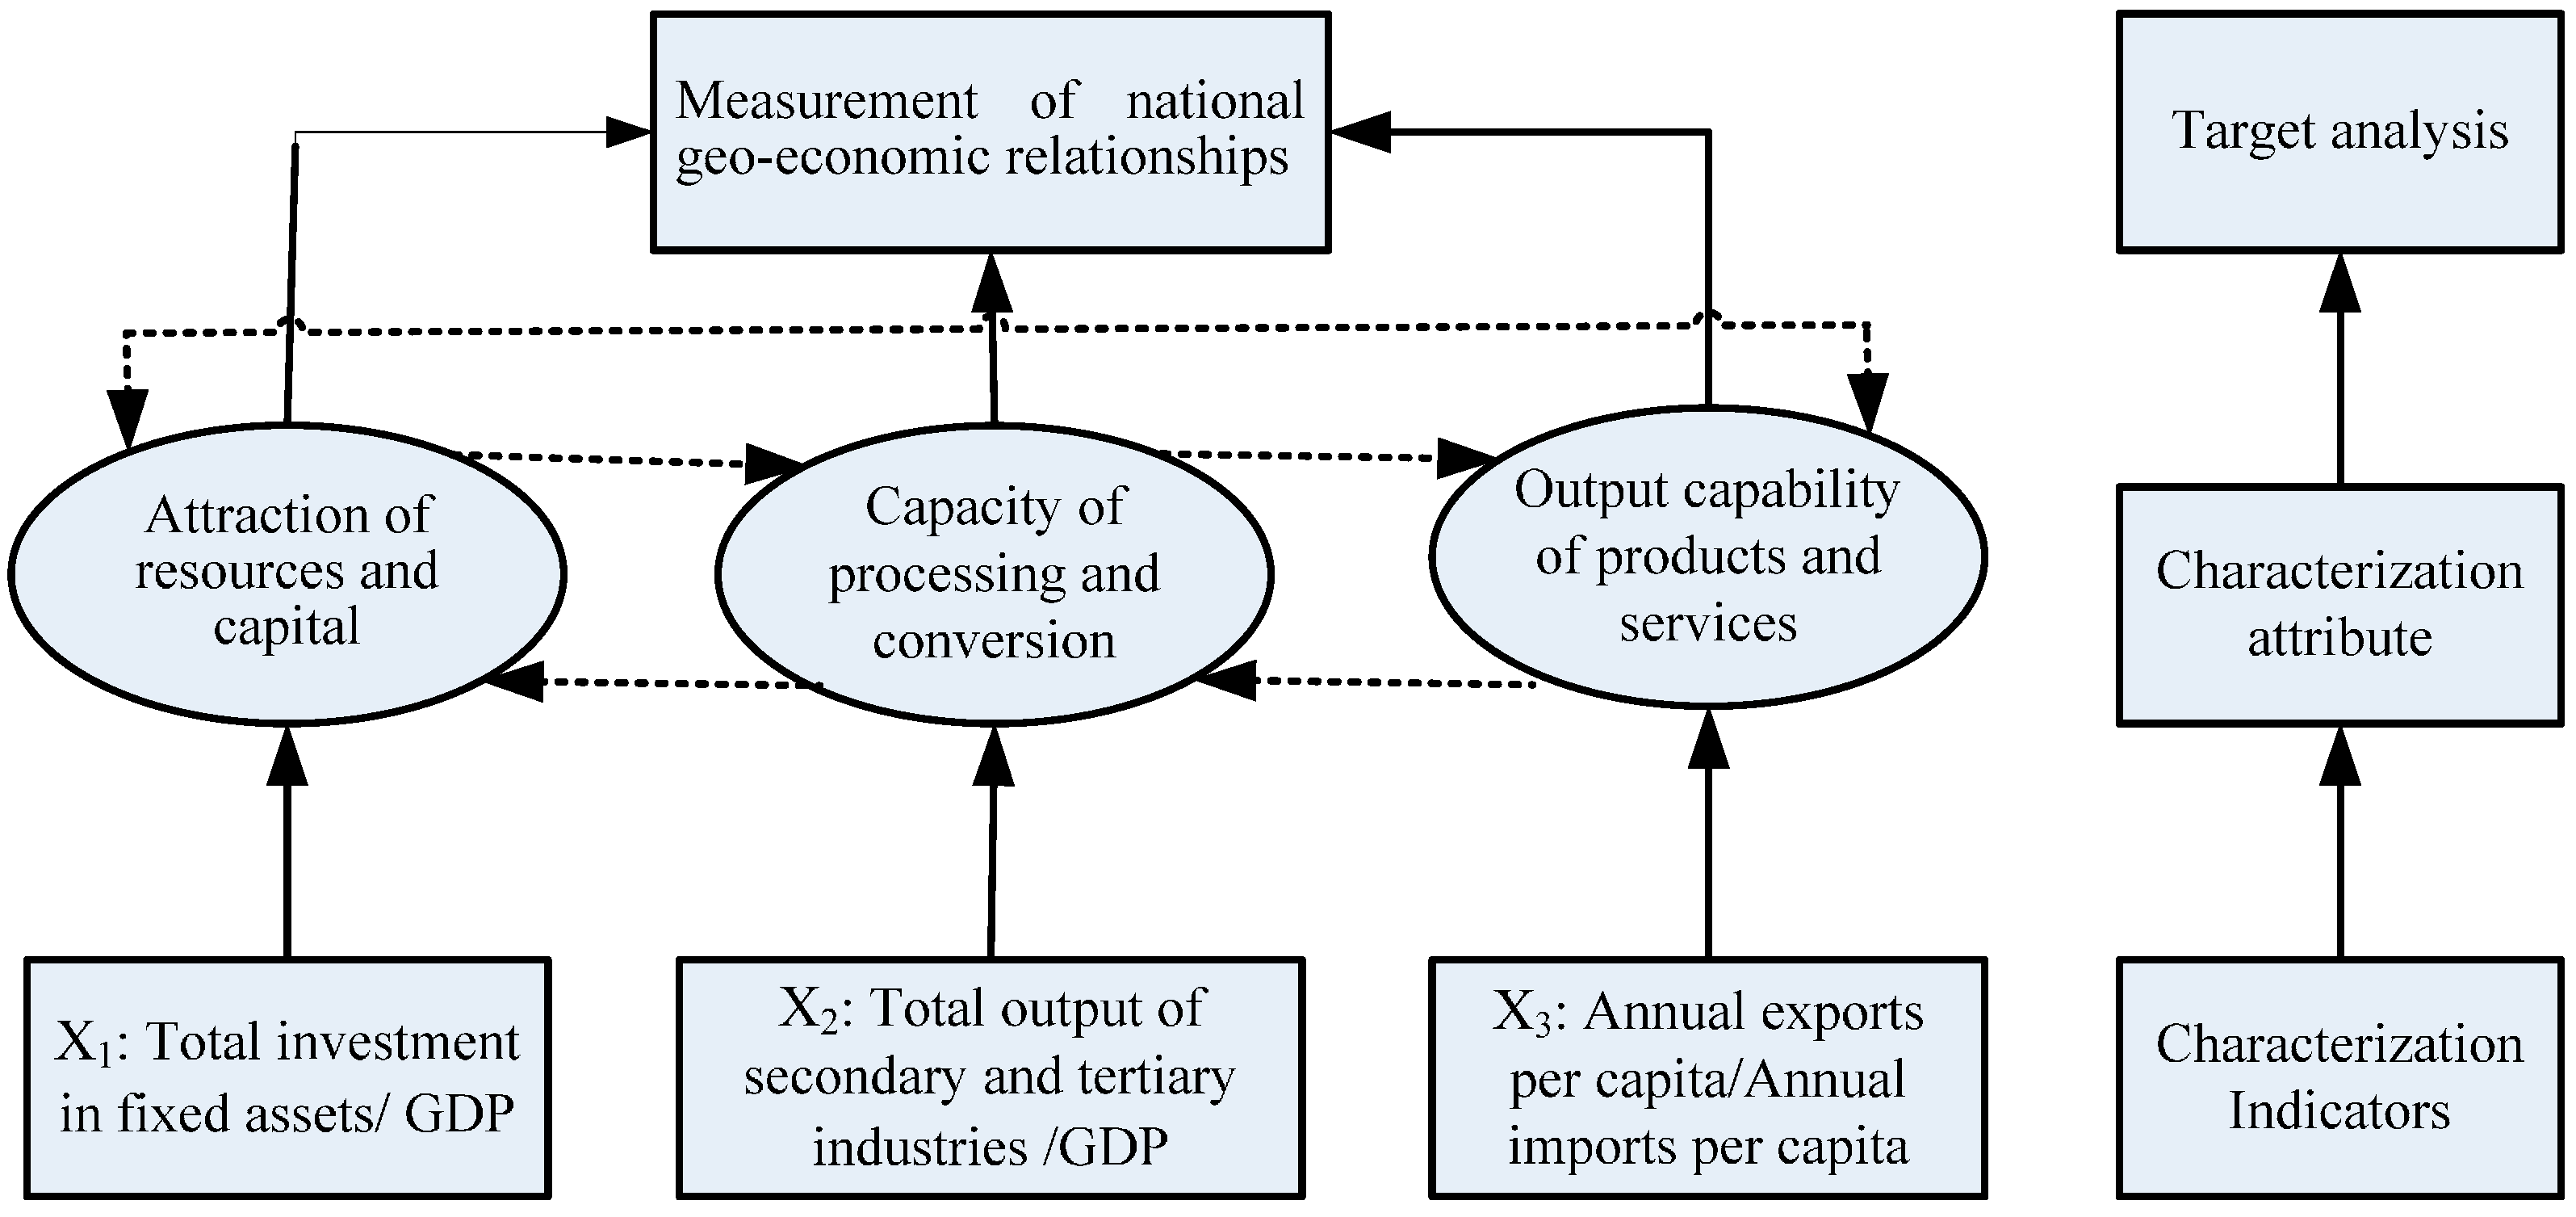
2.3.1. Selection of Evaluating Indicators
- X1 = Total investment in fixed assets/gross domestic product (GDP)
- X2 = Total output of secondary and tertiary industries/GDP
- X3 = Total annual exports per capita/total annual imports per capita
2.3.2. Standardization of Indicators
2.3.3. Calculation of ED Values
2.3.4. Standardization of ED Values
2.3.5. The Assignment of Geographical Location Weight
2.3.6. Determination of Geo-Economic Relationships
2.4. Data Selection and Resources
3. Results
3.1. Geo-Economic Relationships between China and ASEAN Countries in the 1980s
3.2. Geo-Economic Relationships between China and ASEAN Countries in the 1990s
3.3. Geo-Economic Relationships between China and ASEAN Countries in the 2000s
3.4. Geo-Economic Relationships between China and ASEAN Countries in the 2010s
4. Discussion
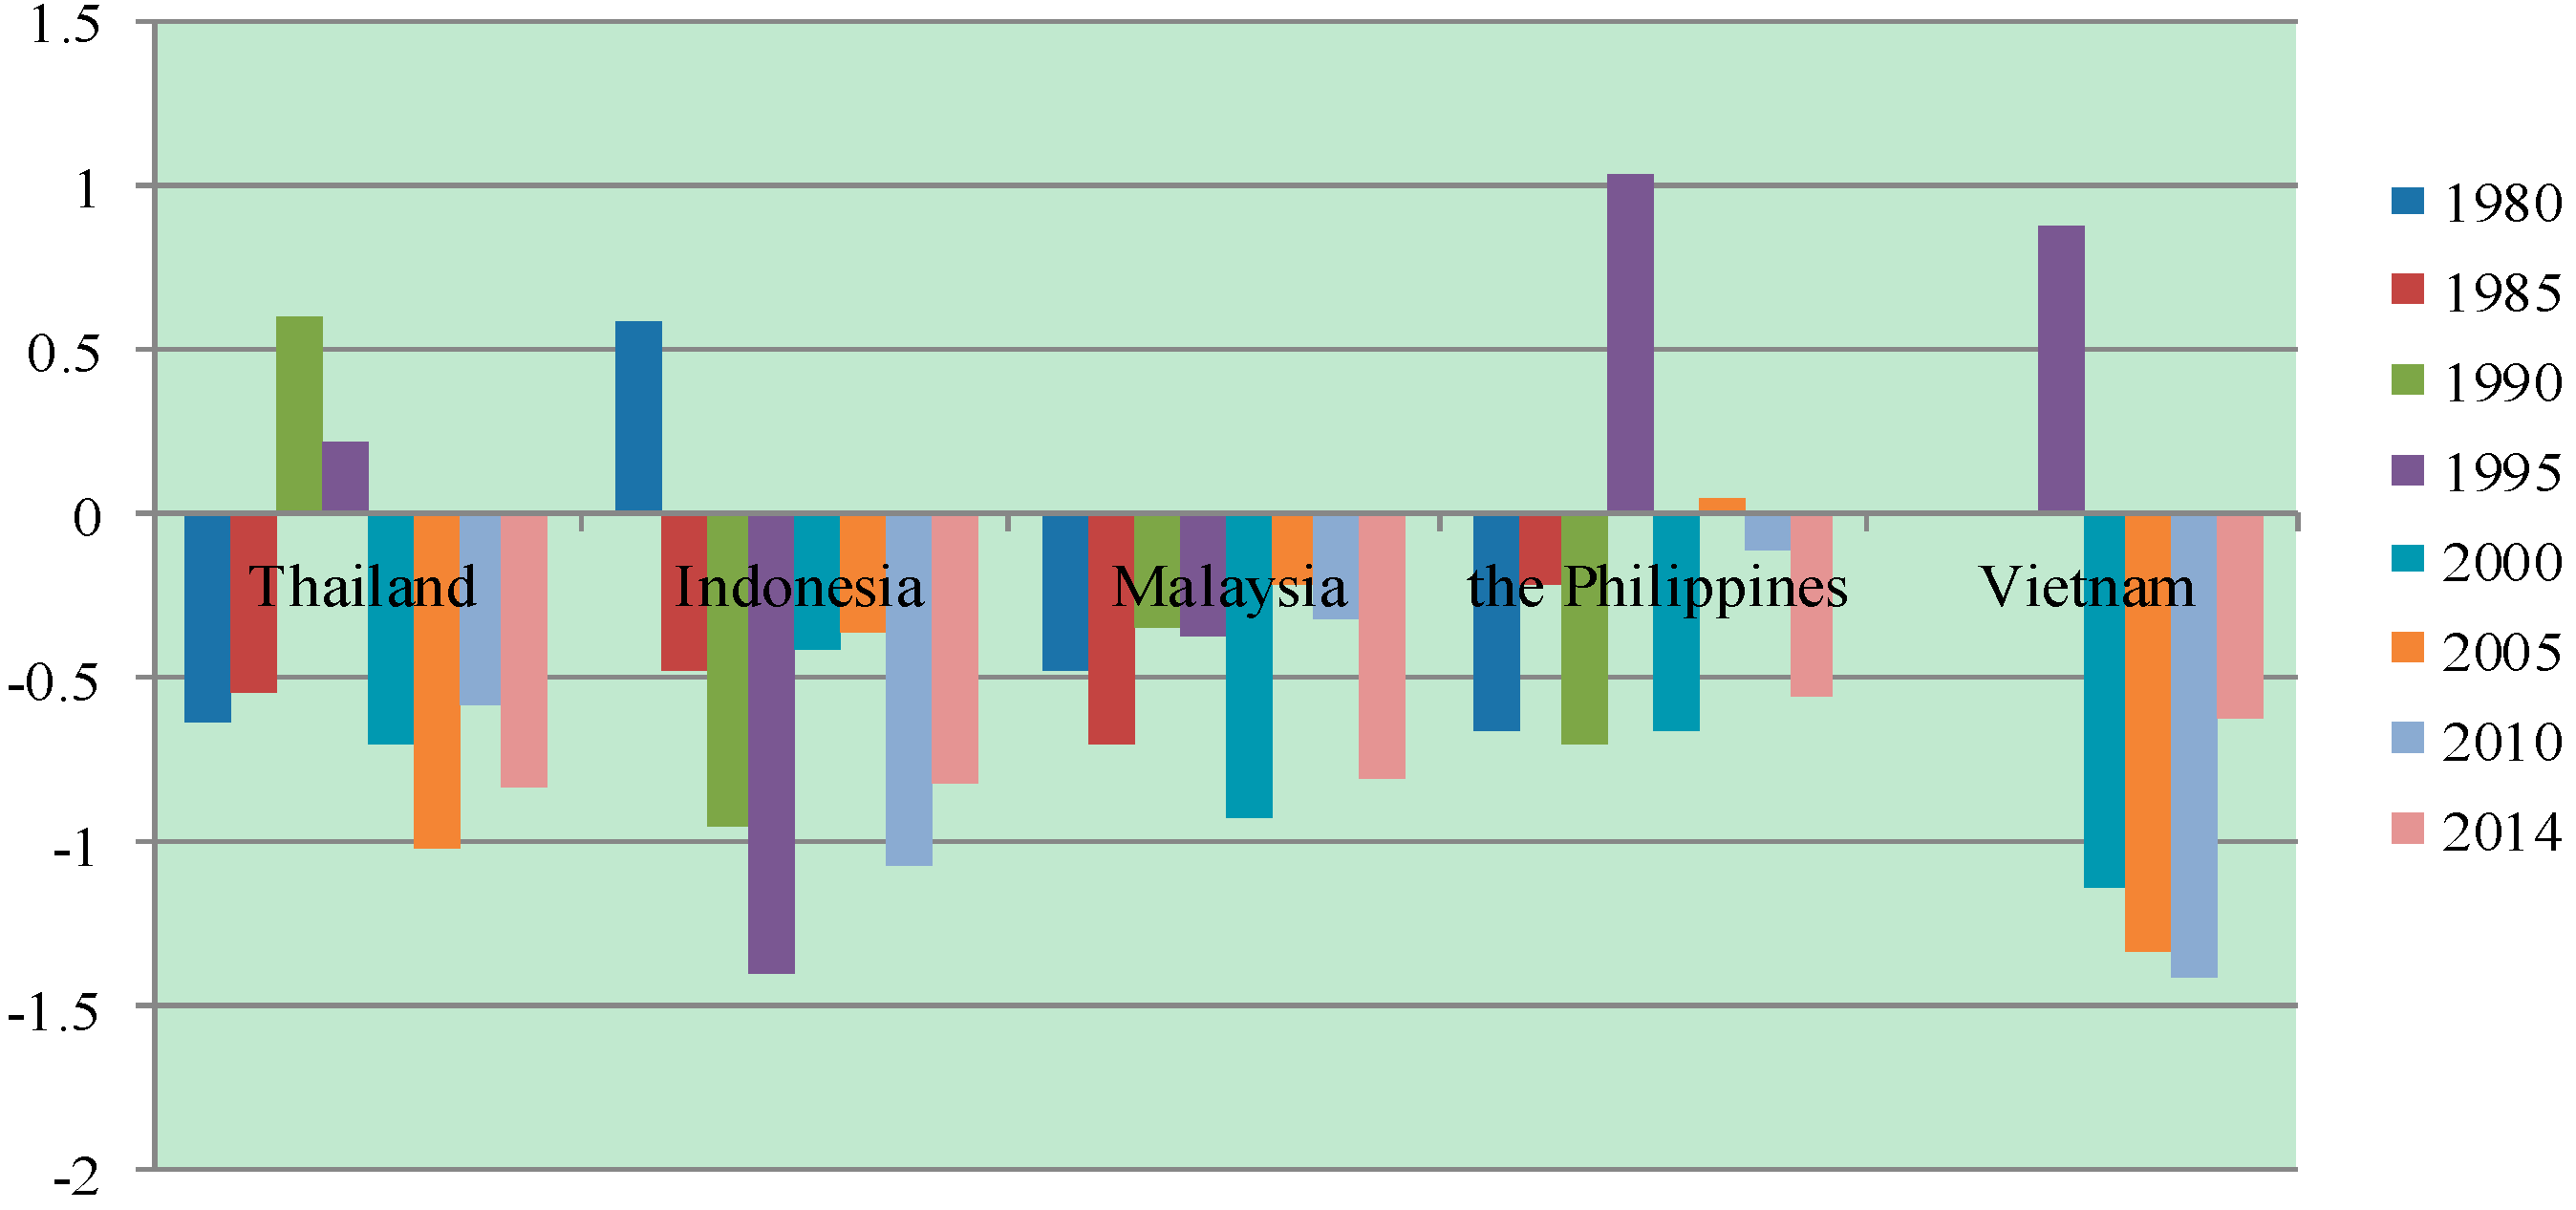
4.1. The Temporal Pattern of Evolution of Geo-Economic Relationships
4.2. The Spatial Pattern of Evolution of Geo-Economic Relationships
4.2.1. China-ASEAN Geo-Economic Relationships from the Perspective of Geographical Location
4.2.2. China-ASEAN Geo-Economic Relationships from the Perspective of Spatial Proximity
4.3. The Attribute Patterns of Evolution of Geo-Economic Relationships
4.3.1. China-ASEAN Political Relationships
4.3.2. Intervention of Great Powers and ASEAN’s Balanced Diplomacy
4.3.3. Close Genetic Relationship
4.4. Path Dependency of Evolution of Geo-Economic Relationships
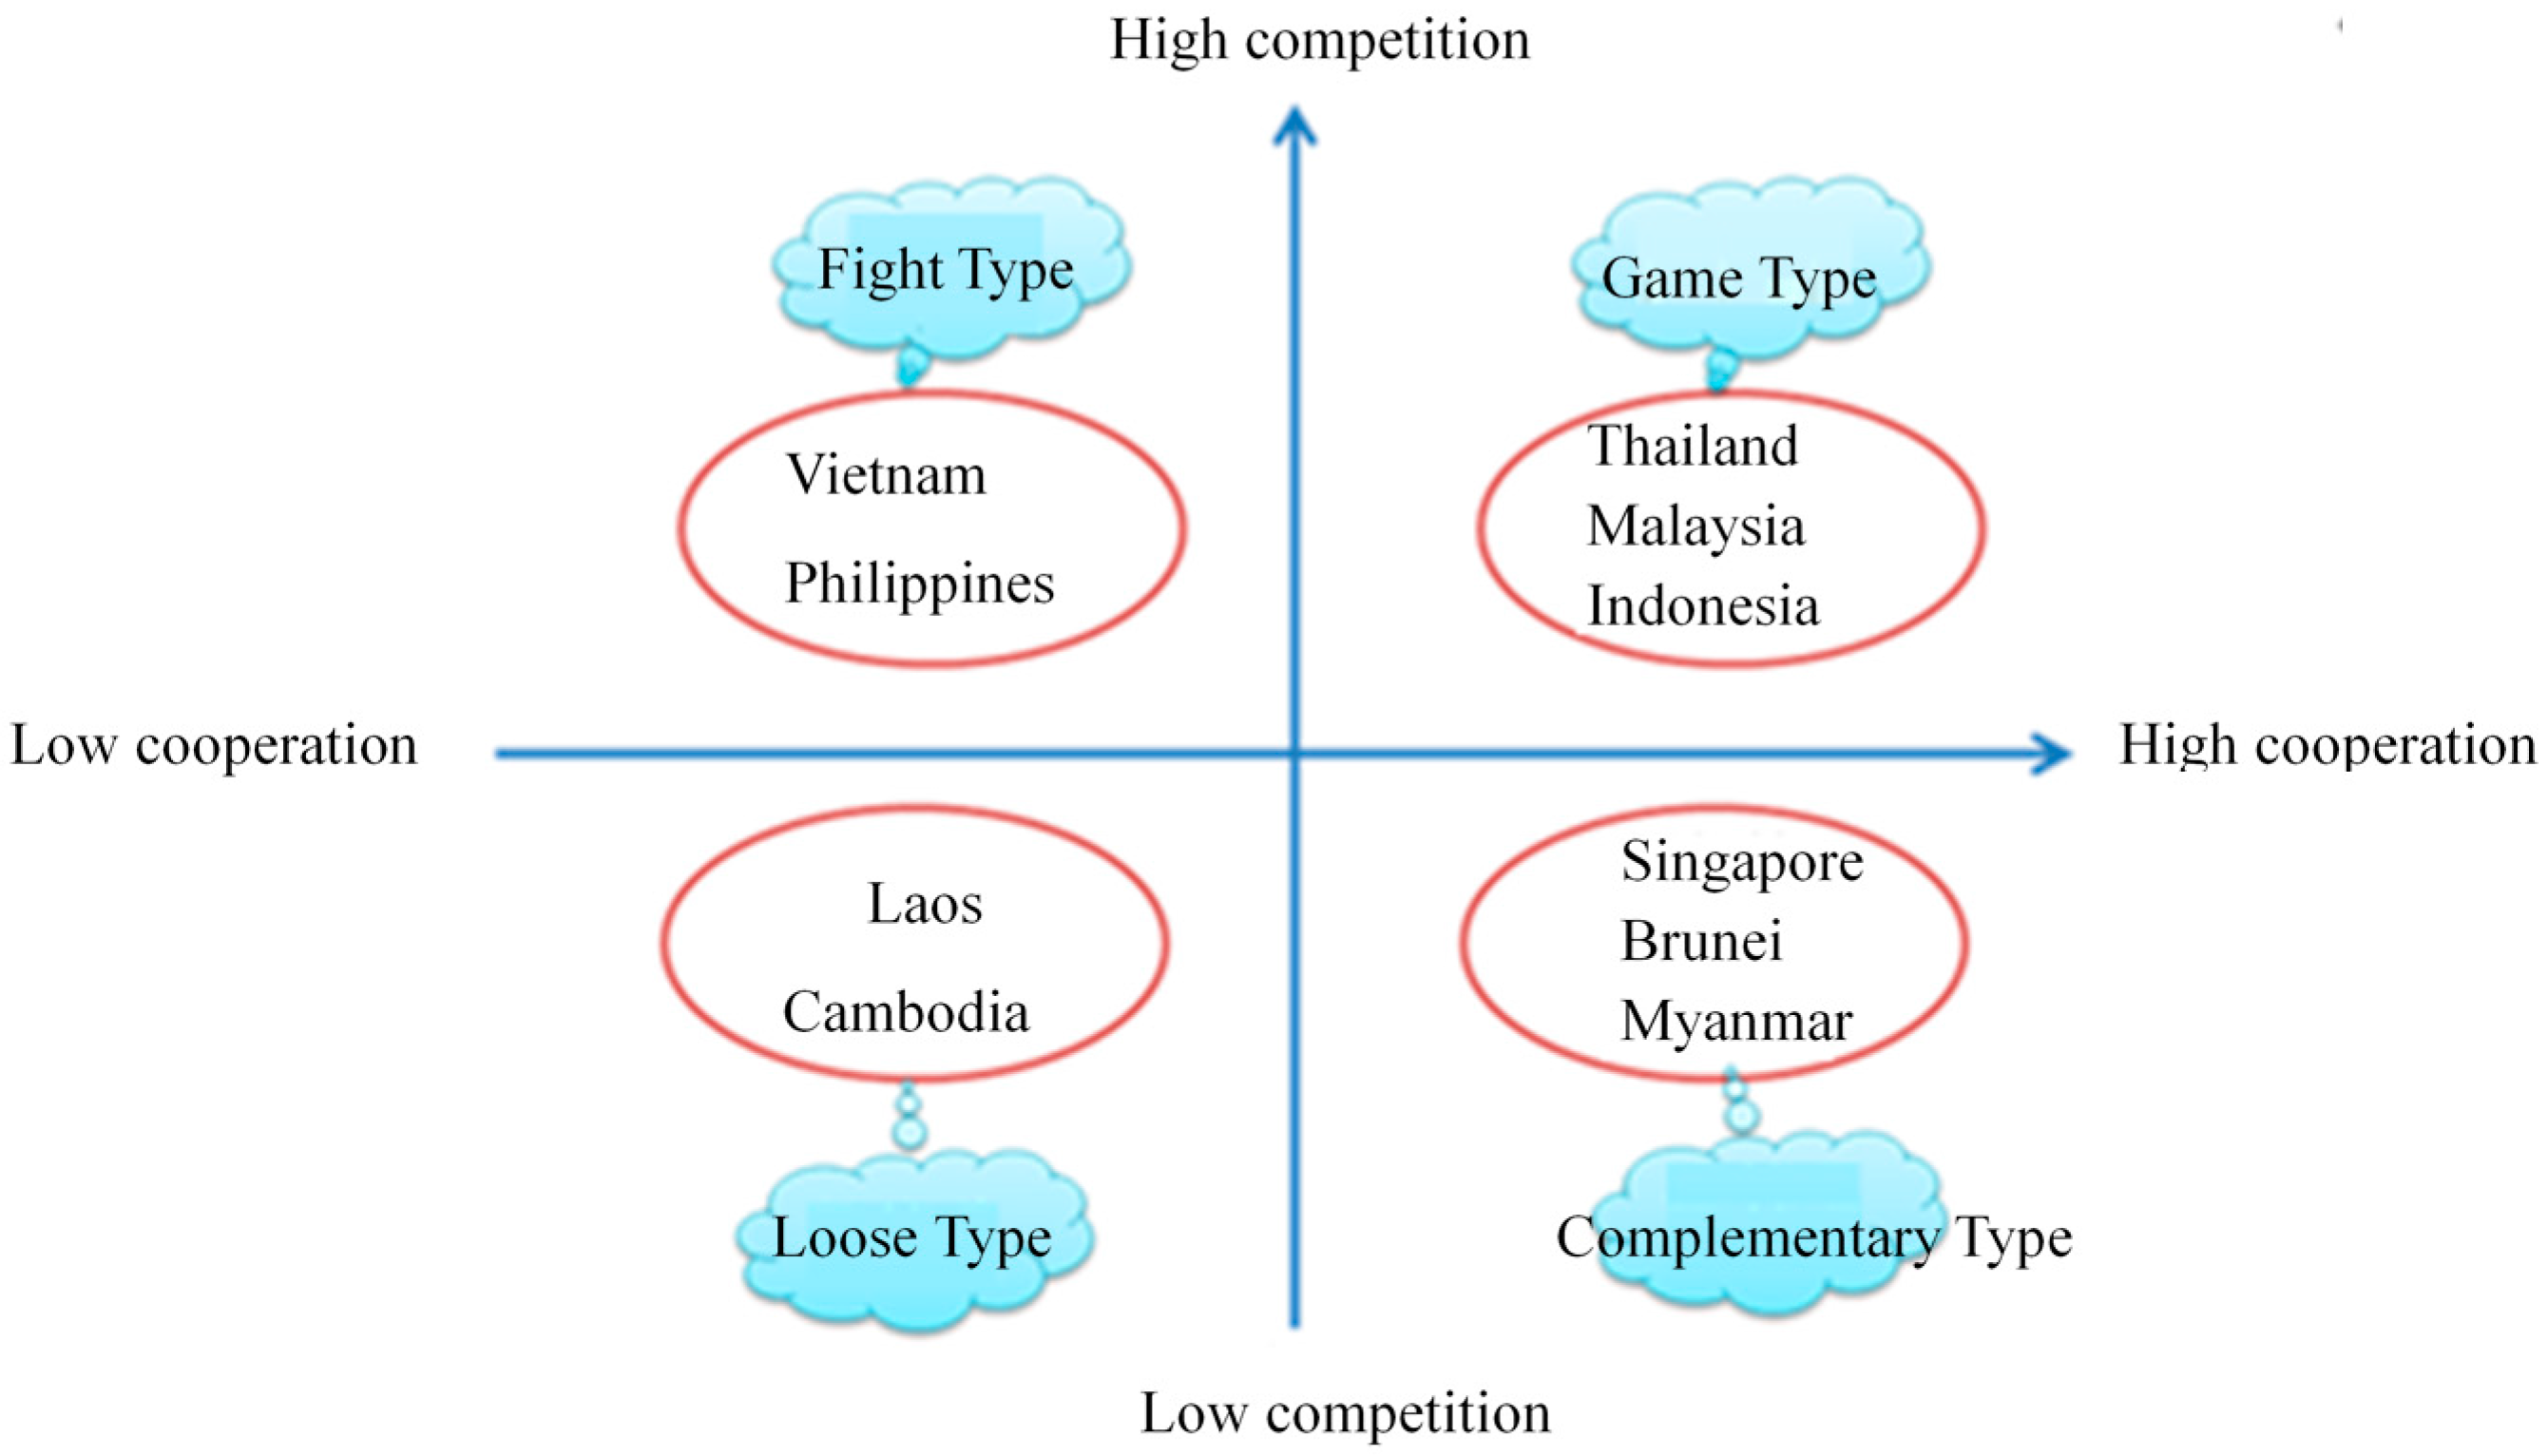
4.5. Classification and Suggestions about Geo-Economic Relationships
5. Conclusions
Acknowledgments
Author Contributions
Conflicts of Interest
References
- Lu, D.D.; Du, D.B. Some thoughts on the strengthening of geopolitical and geo-economic studies. Sci. Geogr. Sin. 2013, 68, 723–727. [Google Scholar]
- Mattlin, M.; Wigell, M. Geoeconomics in the context of restive regional powers. Asia Eur. J. 2016, 14, 125–134. [Google Scholar] [CrossRef]
- Wigell, M. Conceptualizing regional powers’ geoeconomic strategies: Neo-imperialism, neo-mercantilism, hegemony, and liberal institutionalism. Asia Eur. J. 2016, 14, 135–151. [Google Scholar] [CrossRef]
- Blackwill, R.; Harris, J. War by Other Means: Geoeconomics and Statecraft; Harvard University Press: Cambridge, MA, USA, 2016. [Google Scholar]
- Youngs, R. Geo-Economic Futures. In Challenges for European Foreign Policy in 2012: What Kind of Geo-Economic Europe? Martiningui, A., Youngs, R., Eds.; Fride: Madrid, Spain, 2011. [Google Scholar]
- Scholvin, S.; Malamud, A. Is there a Geoeconomic Node in South America? Geography, Politics and Brazil’s Role in Regional Economic Integration; Working Papers ICS: Lisbon, Portugal, 2014. [Google Scholar]
- Hurrell, A. Hegemony, liberalism and global order: What space for would-be great powers? Intern. Aff. 2006, 82, 1–19. [Google Scholar] [CrossRef]
- Fergusson, I.F. United States-Canada Trade and Economic Relationship: Prospects and Challenges; Congressional Research Service: Washington, DC, USA, 2009; pp. 75–98.
- Li, D.R. Theoretical schools and development trend of geo-economics. J. Zhongnan Univ. Econ. Law. 2009, 1, 26–29. [Google Scholar]
- Hanson, G.H. US-Mexico integration and regional economies: Evidence from border-city pairs. J. Urban Econ. 2001, 50, 259–287. [Google Scholar] [CrossRef]
- Grosse, T.G. Geo-economic relations between the EU and China: The lessons from the EU weapon embargo and from Galileo. Geopolitics 2014, 19, 40–65. [Google Scholar] [CrossRef]
- Smith, A. Europe and an inter-dependent world: Uneven geo-economic and geo-political developments. Eur. Urban Reg. Stud. 2013, 20, 3–13. [Google Scholar] [CrossRef]
- Huotari, M.; Heep, S. Learning geoeconomics: China’s experimental financial and monetary initiatives. Asia Eur. J. 2016, 14, 153–171. [Google Scholar] [CrossRef]
- Holslag, J. Geoeconomics in a globalized world: The case of China’s export policy. Asia Eur. J. 2016, 14, 173–184. [Google Scholar] [CrossRef]
- Kärkkäinen, A. Does China have a geoeconomic strategy towards Zimbabwe? The case of the Zimbabwean natural resource sector. Asia Eur. J. 2016, 14, 185–202. [Google Scholar] [CrossRef]
- Yeh, E.T. Introduction: The geoeconomics and geopolitics of Chinese development and investment in Asia. Eurasian Geogr. Econ. 2016, 57, 275–285. [Google Scholar] [CrossRef]
- Yang, W.L.; Du, D.B.; Liu, C.L.; Ma, Y.H. Study on the spatial-temporal evolution and internal mechanism of geo-economic connections of China. Sci. Geogr. Sin. 2016, 71, 956–969. [Google Scholar]
- Zhou, L.; Leung, D. China’s Overseas Investment, Explained in 10 Graphics; World Resources Institute: Washington, DC, USA, 2015; Available online: http://www.wri.org/blog/2015/01/china’s-overseas-investments-explained-10-graphics (accessed on 18 March 2016).
- Li, H.; Wei, Y.G.; Xu, Q.L. Progress in Geo-Economic Cooperation Research from China’s Perspective: A Case Study of the Cooperation between China and ASEAN. Trop. Geogr. 2015, 35, 719–729. [Google Scholar]
- Shao, J.; Yang, M.H. Spatial Analysis: A Method of Evaluating the Relationship of Geo-economic Relationships-Taking Nanjing as an Example. Economist 2005, 10, 267–289. [Google Scholar]
- Wen, Z.H. Distance Analysis: A Method for Evaluating Geo-economic Relationships. Stat. Decis. 1998, 1, 8–10. [Google Scholar]
- Jin, Y.G. An Analysis of the Geo-economic Relationships in Shanxi Province. Econ. Probl. 2000, 10, 53–56. [Google Scholar]
- Li, G.Z.; Duan, M.S.; Yu, H.Y. The Measurement of Geo-economic Relationship in Hebei Province. Geol. Technoecon. Manag. 2003, 6, 79–82. [Google Scholar]
- Gao, Y.H. The Measurement of Geo-economic Relationship in Xinjiang Autonomous Region. Plan. Mark. 2004, 1, 108–110. [Google Scholar]
- Zhang, X.B.; Wu, Y.D.; Luo, H.S. Research on the Theory and Method for the Measurement and Analysis of Inter-regional Economic Relationship—Take Yunnan Province as Sample. Areal Res. Dev. 2006, 25, 34–39. [Google Scholar]
- Deng, C.Y. Strategic Analysis of Guangzhou and National Center City Based on Match of External Economic Links and Geo-economic Relations. Sci. Geogr. Sin. 2009, 29, 329–335. [Google Scholar]
- Xu, Q. Analysis of the Match between the Inter-Provincial Economic Contact and Geo-economics Relationship. Econ. Geogr. 2010, 30, 542–546. [Google Scholar]
- Zhang, Y.M.; Li, X.H.; Tang, C.S. Regional Economic Relationship Analysis of Beijing, Tianjin and Hebei from the perspective of Competition and Cooperation. Urban Stud. 2012, 19, 22–27. [Google Scholar]
- Su, D.H.; Luo, H.S.; Cai, D.K. Analysis of geo-economic relationships between the region of Southeast Asia and major outside countries. World Reg. Stud. 2013, 22, 1–11. [Google Scholar]
- Zhang, H.Z.; Wu, Y.D.; Wang, Y.C.; Chen, C.Y.; Nie, Y.M. A Matching Research on the Relationship between Spatial Economic Connection and Geo-economic Relationship in the Central Cities of Yunnan Province. Areal Res. Dev. 2014, 2, 16–19. [Google Scholar]
- Cheng, S.J.; Sun, B.; Fan, H.; Yu, G.Z. Research on China and the surrounding geo-actors and their geo-economics. J. Jilin Prov. Econ. Manag. Cadre Coll. 2015, 2, 12–15. [Google Scholar]
- Xiong, L.R.; Li, L.J.; Lu, Y.M.; Jiang, M.Y. The Evolution of Geo-economic Relationship between Vietnam and Its Major Neighboring Countries (1986–2013). J. Yulin Norm. Univ. Philos. Soc. Sci. 2016, 37, 37–42. [Google Scholar]
- Xie, B.; Yan, Y.R. Research of the Match Between the Inter-city Economic Contact and Geo-economic Relationship: A Case Study of Kunming. Hum. Geogr. 2016, 31, 106–112. [Google Scholar]
- Wang, B.A. The Strategic Principle of Regional Economic Competitiveness and Its Application. J. Fujian Sch. Adm. Fujian Inst. Econ. Manag. 2002, 1, 30–33. [Google Scholar]
- World Bank Open Data. Available online: http://data.worldbank.org/ (accessed on 15 February 2016).
- Wang, S.F. Research on the Evolution of China-ASEAN Geo-economic Coopetition. Ph.D. Thesis, Beijing Normal University, Beijing, China, 2016. [Google Scholar]
- Zhuang, G.T. The Distribution and Development Trend of Overseas Chinese. Overseas Chin. Stud. 2010, 155, 71. [Google Scholar]
- Wang, M. Spatial and Temporal Evolving Patterns of China’s Geo-economics and Its Strategies. Master’s Thesis, Shandong Normal University, Jinan, China, 2014. [Google Scholar]
- Vahalík, B. Regional bilateral trade analysis of the European Union, China and ASEAN. Procedia Econ. Financ. 2014, 12, 12–709. [Google Scholar] [CrossRef]
- Hastiadi, F.F. East Asian regionalism: The need for ASEAN+3FTA. J. Glob. Bus. Econ. 2011, 3, 1–15. [Google Scholar]
- Hu, J.B.; Tang, W.; An, D. Analysis on the mutual benefit and win-win conditions of China-ASEAN regional economy in cooperative game. Econ. Probl. 2014, 10, 91–96. [Google Scholar]
- Wang, S.F.; Ge, Y.J.; Cao, Y.; Hu, H. Modeling and calculation of China’s surrounding geopolitical influence: A case study of South Asia. Prog. Geogr. 2014, 33, 738–747. [Google Scholar]


| Indicators | X1 | X2 | X3 |
|---|---|---|---|
| X1 | 1.000 | 0.213 | −0.025 |
| (0.072) | (0.837) | ||
| X2 | 0.213 | 1.000 | 0.385 |
| (0.072) | (0.097) | ||
| X3 | −0.025 | 0.385 | 1.000 |
| (0.837) | (0.097) |
| Relationship Types | Range |
|---|---|
| Strongly Competitive | WD < −0.5 |
| Generally Competitive | −0.5 ≤ WD < 0 |
| Generally Complementary | 0 < WD < 0.5 |
| Strongly Complementary | WD ≥ 0.5 |
| Country | X1 | X2 | X3 | X1’ | X2’ | X3’ | ED | ED’ | W | WD | Ranks of Competition |
|---|---|---|---|---|---|---|---|---|---|---|---|
| China | 0.291 | 0.701 | 0.908 | 0.832 | 0.438 | −0.258 | |||||
| Thailand | 0.278 | 0.768 | 0.706 | 0.751 | 0.596 | −0.349 | 0.905 | −0.708 | 1.0 | −0.708 | 1 |
| Indonesia | 0.216 | 0.760 | 2.022 | 0.358 | 0.579 | 0.241 | 2.632 | 0.732 | 0.8 | 0.586 | 4 |
| Malaysia | 0.299 | 0.774 | 1.198 | 0.888 | 0.611 | −0.129 | 1.041 | −0.595 | 0.8 | −0.476 | 3 |
| Philippines | 0.272 | 0.749 | 0.692 | 0.716 | 0.552 | −0.355 | 0.770 | −0.821 | 0.8 | −0.656 | 2 |
| Singapore | 0.395 | 0.948 | 0.807 | 1.495 | 1.026 | −0.303 | 3.423 | 1.391 | 0.8 | 1.113 | 5 |
| Country | X1 | X2 | X3 | X1’ | X2’ | X3’ | ED | ED’ | W | WD | Ranks of Competition |
|---|---|---|---|---|---|---|---|---|---|---|---|
| China | 0.296 | 0.719 | 0.647 | 0.408 | −1.104 | −0.623 | |||||
| Thailand | 0.272 | 0.842 | 0.771 | 0.114 | 0.096 | −0.540 | 1.24 | −0.60 | 1.0 | −0.603 | 2 |
| Indonesia | 0.227 | 0.768 | 1.812 | −0.438 | −0.626 | 0.159 | 1.25 | −0.60 | 0.8 | −0.477 | 3 |
| Malaysia | 0.287 | 0.801 | 1.255 | 0.298 | −0.304 | −0.215 | 0.91 | −0.88 | 0.8 | −0.704 | 1 |
| Philippines | 0.165 | 0.754 | 0.844 | −1.198 | −0.763 | −0.491 | 1.65 | −0.26 | 0.8 | −0.211 | 4 |
| Singapore | 0.408 | 0.953 | 0.868 | 1.781 | 1.180 | −0.475 | 2.67 | 0.58 | 0.8 | 0.468 | 5 |
| Brunei | 0.184 | 0.988 | 4.833 | −0.965 | 1.521 | 2.187 | 4.08 | 1.76 | 0.8 | 1.407 | 6 |
| Type | Range | Country | |
|---|---|---|---|
| 1980 | 1985 | ||
| Strongly Competitive | WD < −0.5 | The Philippines, Thailand | Malaysia, Thailand |
| Generally Competitive | −0.5 ≤ WD < 0 | Malaysia | Indonesia, the Philippines |
| Generally Complementary | 0 < WD < 0.5 | Singapore | |
| Strongly Complementary | WD ≥ 0.5 | Indonesia, Singapore | Brunei |
| Country | X1 | X2 | X3 | X1’ | X2’ | X3’ | ED | ED’ | W | WD | Ranks of Competition |
|---|---|---|---|---|---|---|---|---|---|---|---|
| China | 0.257 | 0.733 | 1.164 | −0.420 | −1.327 | 0.108 | |||||
| Thailand | 0.404 | 0.875 | 0.698 | 1.637 | 0.220 | −0.768 | 2.719 | 0.606 | 1.0 | 0.606 | 5 |
| Indonesia | 0.283 | 0.806 | 1.176 | −0.052 | −0.531 | 0.130 | 0.877 | −1.190 | 0.8 | −0.952 | 1 |
| Malaysia | 0.330 | 0.848 | 1.007 | 0.607 | −0.075 | −0.188 | 1.646 | −0.440 | 0.8 | −0.352 | 3 |
| Philippines | 0.231 | 0.781 | 0.622 | −0.786 | −0.803 | −0.911 | 1.202 | −0.873 | 0.8 | −0.698 | 2 |
| Singapore | 0.317 | 0.950 | 0.868 | 0.421 | 1.041 | −0.449 | 2.574 | 0.465 | 0.8 | 0.372 | 4 |
| Brunei | 0.187 | 0.990 | 2.211 | −1.407 | 1.475 | 2.077 | 3.564 | 1.430 | 0.8 | 1.144 | 6 |
| Country | X1 | X2 | X3 | X1’ | X2’ | X3’ | ED | ED’ | W | WD | Ranks of Competition |
|---|---|---|---|---|---|---|---|---|---|---|---|
| China | 0.342 | 0.803 | 1.126 | 0.145 | −0.604 | 0.977 | |||||
| Thailand | 0.411 | 0.905 | 0.797 | 1.074 | 0.588 | −0.597 | 2.182 | 0.219 | 1.0 | 0.219 | 5 |
| Vietnam | 0.254 | 0.728 | 0.668 | −1.031 | −1.486 | −1.215 | 2.640 | 0.882 | 1.2 | 1.058 | 7 |
| Indonesia | 0.284 | 0.829 | 1.118 | −0.626 | −0.308 | 0.936 | 0.828 | −1.739 | 0.8 | −1.392 | 1 |
| Malaysia | 0.436 | 0.871 | 0.951 | 1.413 | 0.184 | 0.140 | 1.711 | −0.462 | 0.8 | −0.370 | 2 |
| Philippines | 0.222 | 0.784 | 0.618 | −1.464 | −0.835 | −1.457 | 2.927 | 1.297 | 0.8 | 1.038 | 6 |
| Singapore | 0.331 | 0.931 | 0.950 | 0.008 | 0.895 | 0.133 | 1.726 | −0.440 | 0.8 | −0.352 | 3 |
| Brunei | 0.367 | 0.988 | 1.149 | 0.481 | 1.567 | 1.084 | 2.199 | 0.244 | 0.8 | 0.195 | 4 |
| Type | Range | Country | |
|---|---|---|---|
| 1990 | 1995 | ||
| Strongly Competitive | WD < −0.5 | Indonesia, the Philippines | Indonesia |
| Generally Competitive | −0.5 ≤ WD<0 | Malaysia | Malaysia, Singapore |
| Generally Complementary | 0 < WD < 0.5 | Singapore | Brunei, Thailand |
| Strongly Complementary | WD ≥ 0.5 | Thailand, Brunei | Vietnam, the Philippines |
| Country | X1 | X2 | X3 | X1’ | X2’ | X3’ | ED | ED’ | W | WD | Ranks of Competition |
|---|---|---|---|---|---|---|---|---|---|---|---|
| China | 0.339 | 0.853 | 1.107 | 1.649 | 0.352 | −0.148 | |||||
| Myanmar | 0.101 | 0.550 | 0.686 | −1.507 | −1.529 | −0.672 | 3.710 | 1.077 | 1.2 | 1.303 | 9 |
| Thailand | 0.220 | 0.910 | 1.115 | 0.071 | 0.706 | −0.138 | 1.620 | −0.784 | 1.0 | −0.784 | 3 |
| Cambodia | 0.183 | 0.590 | 0.716 | −0.420 | −1.281 | −0.634 | 2.680 | 0.161 | 1.0 | 0.161 | 6 |
| Laos | 0.139 | 0.544 | 0.617 | −1.003 | −1.566 | −0.758 | 3.330 | 0.738 | 1.2 | 0.886 | 8 |
| Vietnam | 0.256 | 0.773 | 0.926 | 0.549 | −0.144 | −0.373 | 1.230 | −1.130 | 1.2 | −1.356 | 1 |
| Indonesia | 0.199 | 0.844 | 1.500 | −0.207 | 0.296 | 0.340 | 1.920 | −0.514 | 0.8 | −0.411 | 5 |
| Malaysia | 0.253 | 0.914 | 1.198 | 0.509 | 0.731 | −0.035 | 1.210 | −1.149 | 0.8 | −0.919 | 2 |
| Philippines | 0.221 | 0.860 | 1.074 | 0.084 | 0.396 | −0.189 | 1.570 | −0.830 | 0.8 | −0.664 | 4 |
| Singapore | 0.320 | 0.931 | 1.024 | 1.397 | 0.836 | −0.251 | 3.560 | 0.939 | 0.8 | 0.751 | 7 |
| Brunei | 0.130 | 0.990 | 3.526 | −1.122 | 1.203 | 2.859 | 4.180 | 1.491 | 0.8 | 1.193 | 10 |
| Country | X1 | X2 | X3 | X1’ | X2’ | X3’ | ED | ED’ | W | WD | Ranks of Competition |
|---|---|---|---|---|---|---|---|---|---|---|---|
| China | 0.399 | 0.883 | 1.155 | 2.094 | 0.439 | −0.201 | |||||
| Myanmar | 0.269 | 0.580 | 1.979 | 0.328 | −1.656 | 0.619 | 2.859 | 0.184 | 1.2 | 0.221 | 6 |
| Thailand | 0.289 | 0.897 | 0.939 | 0.600 | 0.535 | −0.416 | 1.512 | −1.130 | 1.0 | −1.130 | 2 |
| Cambodia | 0.189 | 0.641 | 0.787 | −0.758 | −1.234 | −0.568 | 3.326 | 0.639 | 1.0 | 0.639 | 9 |
| Laos | 0.231 | 0.602 | 0.627 | −0.188 | −1.504 | −0.727 | 3.042 | 0.362 | 1.2 | 0.435 | 7 |
| Vietnam | 0.313 | 0.807 | 0.883 | 0.926 | −0.087 | −0.472 | 1.309 | −1.327 | 1.2 | −1.592 | 1 |
| Indonesia | 0.236 | 0.869 | 1.149 | −0.120 | 0.342 | −0.207 | 2.216 | −0.443 | 0.8 | −0.355 | 3 |
| Malaysia | 0.223 | 0.917 | 1.239 | −0.296 | 0.674 | −0.118 | 2.403 | −0.261 | 0.8 | −0.209 | 4 |
| Philippines | 0.199 | 0.873 | 0.834 | −0.622 | 0.369 | −0.521 | 2.736 | 0.064 | 0.8 | 0.051 | 5 |
| Singapore | 0.231 | 0.955 | 1.148 | −0.188 | 0.936 | −0.208 | 3.235 | 0.607 | 0.8 | 0.486 | 8 |
| Brunei | 0.114 | 0.991 | 4.191 | −1.777 | 1.185 | 2.821 | 4.967 | 2.239 | 0.8 | 1.791 | 10 |
| Type | Range | Country | |
|---|---|---|---|
| 2000 | 2005 | ||
| Strongly Competitive | WD < −0.5 | Vietnam, Malaysia, Thailand, the Philippines | Vietnam, Thailand |
| Generally Competitive | −0.5 ≤ WD < 0 | Indonesia | Indonesia, Malaysia |
| Generally Complementary | 0 < WD < 0.5 | Cambodia | The Philippines, Myanmar, Laos, Singapore |
| Strongly Complementary | WD ≥ 0.5 | Laos, Singapore, Myanmar, Brunei | Cambodia, Brunei |
| Country | X1 | X2 | X3 | X1’ | X2’ | X3’ | ED | ED’ | W | WD | Ranks of Competition |
|---|---|---|---|---|---|---|---|---|---|---|---|
| China | 0.399 | 0.883 | 1.155 | 2.314 | 0.634 | −0.223 | |||||
| Myanmar | 0.179 | 0.651 | 1.820 | −0.849 | −1.280 | 0.655 | 3.800 | 0.808 | 1.2 | 0.970 | 8 |
| Thailand | 0.289 | 0.897 | 0.939 | −0.052 | 0.422 | −0.316 | 2.380 | −0.654 | 1.0 | −0.654 | 3 |
| Cambodia | 0.189 | 0.641 | 0.787 | −1.048 | −1.650 | −0.697 | 4.090 | 1.110 | 1.0 | 1.110 | 9 |
| Laos | 0.231 | 0.602 | 0.627 | −0.099 | −1.401 | −0.582 | 3.180 | 0.168 | 1.2 | 0.201 | 7 |
| Vietnam | 0.313 | 0.807 | 0.883 | 0.873 | −0.069 | −0.578 | 1.640 | −1.410 | 1.2 | −1.692 | 1 |
| Indonesia | 0.236 | 0.869 | 1.149 | 0.686 | 0.105 | −0.181 | 1.710 | −1.337 | 0.8 | −1.070 | 2 |
| Malaysia | 0.223 | 0.917 | 1.239 | −0.310 | 0.574 | −0.126 | 2.630 | −0.398 | 0.8 | −0.318 | 4 |
| Philippines | 0.199 | 0.873 | 0.834 | −0.544 | 0.430 | −0.540 | 2.880 | −0.133 | 0.8 | −0.107 | 5 |
| Singapore | 0.231 | 0.955 | 1.148 | 0.112 | 0.937 | −0.220 | 3.220 | 0.215 | 0.8 | 0.172 | 6 |
| Brunei | 0.114 | 0.991 | 4.191 | −1.083 | 1.300 | 2.806 | 4.600 | 1.631 | 0.8 | 1.305 | 10 |
| Country | X1 | X2 | X3 | X1’ | X2’ | X3’ | ED | ED’ | W | WD | Ranks of Competition |
|---|---|---|---|---|---|---|---|---|---|---|---|
| China | 0.794 | 0.908 | 1.195 | 1.019 | 0.552 | 0.036 | |||||
| Myanmar | 0.117 | 0.651 | 0.845 | −0.756 | −1.518 | −0.503 | 2.779 | 0.927 | 1.2 | 1.112 | 9 |
| Thailand | 0.259 | 0.884 | 0.998 | −0.384 | 0.359 | −0.267 | 1.448 | −0.926 | 1.0 | −0.926 | 1 |
| Cambodia | 0.221 | 0.661 | 0.800 | −0.483 | −1.437 | −0.572 | 2.566 | 0.630 | 1.0 | 0.630 | 8 |
| Laos | 0.353 | 0.684 | 0.803 | −0.137 | −1.252 | −0.568 | 2.226 | 0.157 | 1.2 | 0.189 | 6 |
| Vietnam | 0.238 | 0.819 | 1.008 | −0.439 | −0.165 | −0.252 | 1.649 | −0.616 | 1.2 | −0.792 | 4 |
| Indonesia | 0.326 | 0.841 | 0.989 | −0.208 | 0.012 | −0.281 | 1.377 | −1.025 | 0.8 | −0.820 | 2 |
| Malaysia | 0.264 | 0.909 | 1.121 | −0.371 | 0.560 | −0.078 | 1.394 | −1.001 | 0.8 | −0.801 | 3 |
| Philippines | 0.205 | 0.887 | 0.921 | −0.525 | 0.383 | −0.386 | 1.609 | −0.702 | 0.8 | −0.561 | 5 |
| Singapore | 0.254 | 1.000 | 1.119 | −0.397 | 1.293 | −0.081 | 2.662 | 0.764 | 0.8 | 0.611 | 7 |
| Brunei | 1.428 | 0.990 | 3.088 | 2.681 | 1.212 | 2.953 | 3.421 | 1.821 | 0.8 | 1.457 | 10 |
| Type | Range | Country | |
|---|---|---|---|
| 2010 | 2014 | ||
| Strongly Competitive | WD < −0.5 | Vietnam, Indonesia, Thailand | Thailand, Indonesia, Malaysia, the Philippines, Vietnam |
| Generally Competitive | −0.5 ≤ WD<0 | Malaysia, the Philippines | -- |
| Generally Complementary | 0 < WD < 0.5 | Laos, Singapore | Laos |
| Strongly Complementary | WD ≥ 0.5 | Myanmar, Brunei, Cambodia | Singapore, Cambodia, Myanmar, Brunei |
| Time Range | Type | Country |
|---|---|---|
| 1980s (1980–1989) | Competitive | Thailand, the Philippines, Malaysia |
| Complementary | Singapore, Brunei | |
| Changing from Complementary into Competitive | Indonesia | |
| 1990s (1990–1999) | Competitive | Indonesia, Malaysia |
| Complementary | Brunei, Thailand, Vietnam | |
| Changing from Competitive into Complementary | The Philippines | |
| Changing from Complementary into Competitive | Singapore | |
| 2000s (2000–2009) | Competitive | Vietnam, Thailand, Malaysia, Indonesia |
| Complementary | Laos, Singapore, Cambodia, Brunei, Myanmar | |
| Changing from Competitive into Complementary | The Philippines | |
| 2010s (2010–2019) | Competitive | Vietnam, Thailand, Indonesia, the Philippines, Malaysia |
| Complementary | Laos, Singapore, Cambodia, Brunei, Myanmar |
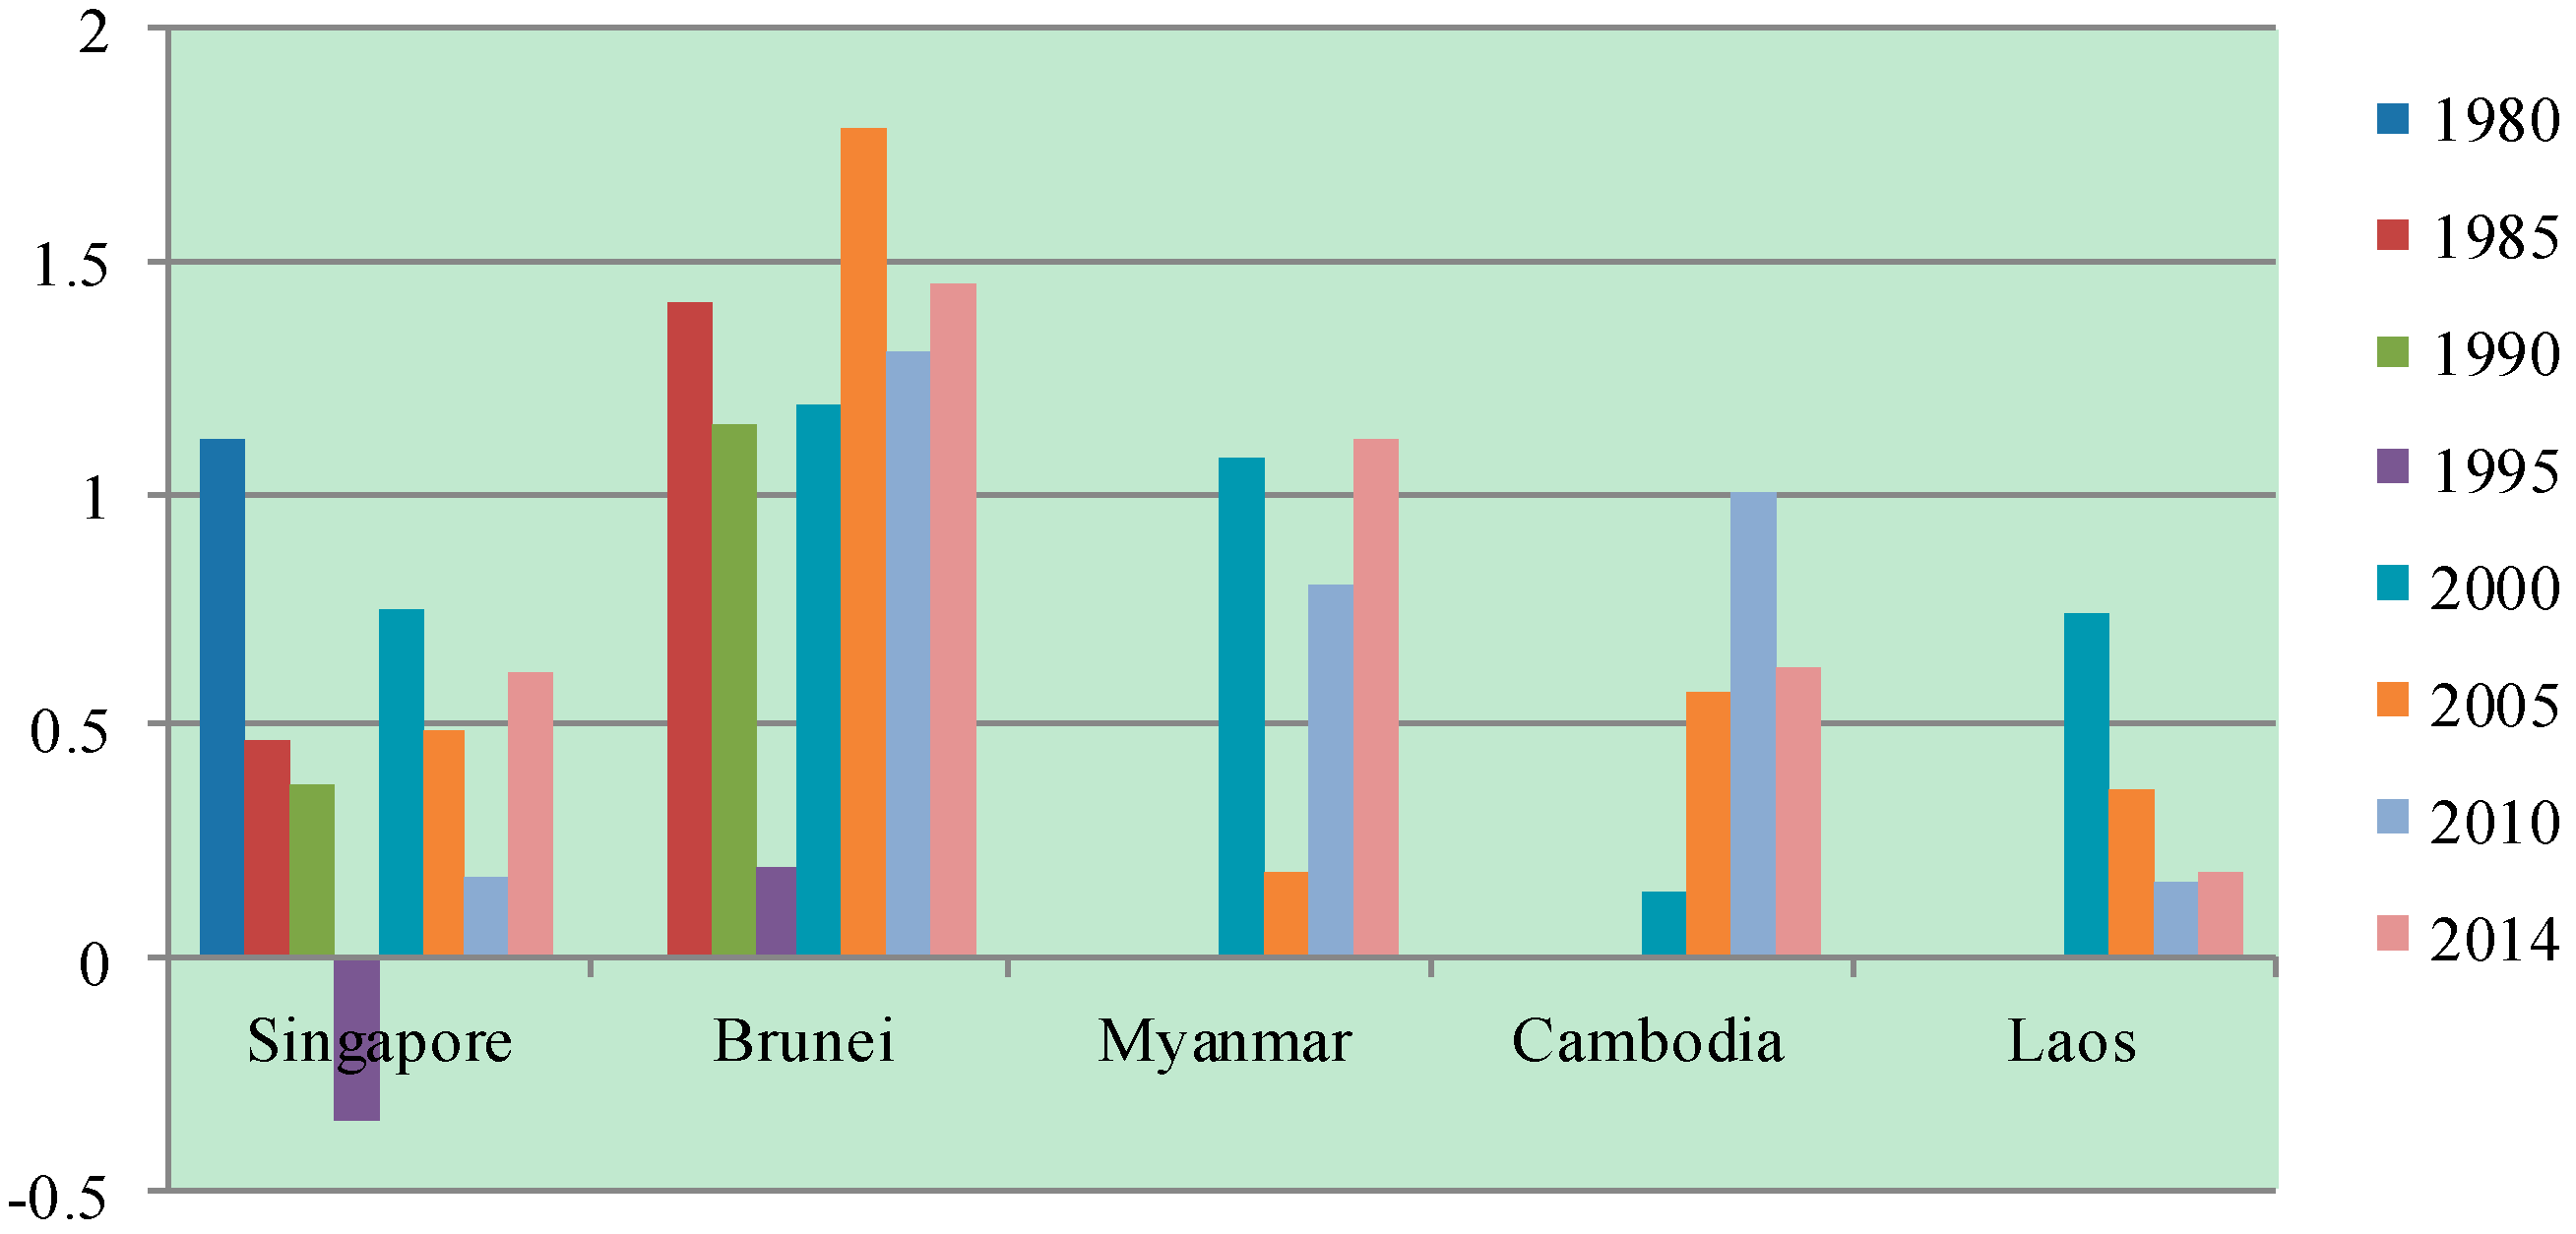
| Country | Year | Type of Geo-Economic Relationship | General Relationship |
|---|---|---|---|
| Myanmar | 2000 | Strongly Complementary | Strongly Complementary Relationship |
| 2005 | Generally Complementary | ||
| 2010 | Strongly Complementary | ||
| 2014 | Strongly Complementary | ||
| Thailand | 1980 | Strongly Competitive | Strongly Competitive Relationship |
| 1985 | Strongly Competitive | ||
| 1990 | Strongly Complementary | ||
| 1995 | Generally Complementary | ||
| 2000 | Strongly Competitive | ||
| 2005 | Strongly Competitive | ||
| 2010 | Strongly Competitive | ||
| 2014 | Strongly Competitive | ||
| Cambodia | 2000 | Generally Complementary | Strongly Complementary Relationship |
| 2005 | Strongly Complementary | ||
| 2010 | Strongly Complementary | ||
| 2014 | Strongly Complementary | ||
| Laos | 2000 | Strongly Complementary | Generally Complementary Relationship |
| 2005 | Generally Complementary | ||
| 2010 | Generally Complementary | ||
| 2014 | Generally Complementary | ||
| Vietnam | 1995 | Strongly Complementary | Strongly Competitive Relationship |
| 2000 | Strongly Competitive | ||
| 2005 | Strongly Competitive | ||
| 2010 | Strongly Competitive | ||
| 2014 | Strongly Competitive |
| Country | Year | Type of Geo-Economic Relationship | General Relationship |
|---|---|---|---|
| Indonesia | 1980 | Strongly Complementary | Competitive Relationship |
| 1985 | Generally Competitive | ||
| 1990 | Strongly Competitive | ||
| 1995 | Strongly Competitive | ||
| 2000 | Generally Competitive | ||
| 2005 | Generally Competitive | ||
| 2010 | Strongly Competitive | ||
| 2014 | Strongly Competitive | ||
| Malaysia | 1980 | Generally Competitive | Competitive Relationship in General |
| 1985 | Strongly Competitive | ||
| 1990 | Generally Competitive | ||
| 1995 | Generally Competitive | ||
| 2000 | Strongly Competitive | ||
| 2005 | Generally Competitive | ||
| 2010 | Generally Competitive | ||
| 2014 | Strongly Competitive | ||
| The Philippines | 1980 | Strongly Competitive | Competitive Relationship |
| 1985 | Generally Competitive | ||
| 1990 | Strongly Competitive | ||
| 1995 | Strongly Complementary | ||
| 2000 | Strongly Competitive | ||
| 2005 | Generally Complementary | ||
| 2010 | Generally Competitive | ||
| 2014 | Strongly Competitive | ||
| Singapore | 1980 | Strongly Complementary | Complementary Relationship in General |
| 1985 | Generally Complementary | ||
| 1990 | Generally Complementary | ||
| 1995 | Generally Competitive | ||
| 2000 | Strongly Complementary | ||
| 2005 | Generally Complementary | ||
| 2010 | Generally Complementary | ||
| 2014 | Strongly Complementary | ||
| Brunei | 1985 | Strongly Complementary | Strongly Complementary Relationship |
| 1990 | Strongly Complementary | ||
| 1995 | Generally Complementary | ||
| 2000 | Strongly Complementary | ||
| 2005 | Strongly Complementary | ||
| 2010 | Strongly Complementary | ||
| 2014 | Strongly Complementary |
© 2017 by the authors. Licensee MDPI, Basel, Switzerland. This article is an open access article distributed under the terms and conditions of the Creative Commons Attribution (CC BY) license (http://creativecommons.org/licenses/by/4.0/).
Share and Cite
Wang, S.; Zhu, A.; Ge, Y.; Liu, Y.; Xue, X. The Spatio-Temporal Evolution of Geo-Economic Relationships between China and ASEAN Countries: Competition or Cooperation? Sustainability 2017, 9, 1064. https://0-doi-org.brum.beds.ac.uk/10.3390/su9061064
Wang S, Zhu A, Ge Y, Liu Y, Xue X. The Spatio-Temporal Evolution of Geo-Economic Relationships between China and ASEAN Countries: Competition or Cooperation? Sustainability. 2017; 9(6):1064. https://0-doi-org.brum.beds.ac.uk/10.3390/su9061064
Chicago/Turabian StyleWang, Shufang, Axing Zhu, Yuejing Ge, Yuli Liu, and Xiao Xue. 2017. "The Spatio-Temporal Evolution of Geo-Economic Relationships between China and ASEAN Countries: Competition or Cooperation?" Sustainability 9, no. 6: 1064. https://0-doi-org.brum.beds.ac.uk/10.3390/su9061064