The Role of Earth Observation, with a Focus on SAR Interferometry, for Sinkhole Hazard Assessment


1
CSIR Meraka Institute, Pretoria 0001, South Africa
2
Department of Geography and Environmental Studies, Stellenbosch University, Stellenbosch 7600, South Africa
*
Author to whom correspondence should be addressed.
Remote Sens. 2018, 10(10), 1506; https://0-doi-org.brum.beds.ac.uk/10.3390/rs10101506
Submission received: 1 August 2018
/
Revised: 12 September 2018
/
Accepted: 15 September 2018
/
Published: 20 September 2018
(This article belongs to the Special Issue Remote Sensing of Land Subsidence)
Abstract
:Sinkholes are global phenomena with significant consequences on the natural- and built environment. Significant efforts have been devoted to the assessment of sinkhole hazards to predict the spatial and temporal occurrence of future sinkholes as well as to detect small-scale deformation prior to collapse. Sinkhole hazard maps are created by considering the distribution of past sinkholes in conjunction with their geomorphic features, controlling conditions and triggering mechanisms. Quantitative risk assessment then involves the statistical analysis of sinkhole events in relation to these conditions with the aim of identifying high risk areas. Remote sensing techniques contribute to the field of sinkhole hazard assessment by providing tools for the population of sinkhole inventories and lend themselves to the monitoring of precursory deformation prior to sinkhole development. In this paper, we outline the background to sinkhole formation and sinkhole hazard assessment. We provide a review of earth observation techniques, both for the compilation of sinkhole inventories as well as the monitoring of precursors to sinkhole development. We discuss the advantages and limitations of these approaches and conclude by highlighting the potential role of radar interferometry in the early detection of sinkhole-induced instability resulting in a potential decrease in the risk to human lives and infrastructure by enabling proactive remediation.

1. Introduction to Sinkhole Hazards
Many regions around the globe are characterised by the presence of highly soluble calcium carbonate (dolomite or limestone) or evaporite (typically halite or gypsum) rocks [1,2,3,4,5,6,7]. These areas are frequently associated with sudden, catastrophic collapse of the surface in a process known as sinkhole development. Sinkholes can be small (less than 1 m in diameter) but can reach up to hundreds of metres in diameter in extreme cases [8,9]. In many sinkhole prone regions, population growth as well as social and political drivers force communities to settle in areas characterised by the presence of sinkhole hazards [10,11]. In such instances, risk avoidance measures, like prohibiting development of any kind, is not feasible [1]. In these areas, sinkholes can cause substantial damage to infrastructure [2,7,9,12,13,14,15,16] and places restrictions on the construction of buildings, roads and other critical infrastructure [13]. Sinkholes have also caused environmental problems, especially in cases where they change the local hydrology, potentially draining streams, rivers and dams [8,9,17].
Due to the risks involved with sinkhole development, significant efforts have been devoted to sinkhole hazard assessment. Sinkhole hazard assessment can be grouped into three distinct stages namely; (1) predicting the spatial and temporal distribution of future sinkholes (or probability of occurrence) [12,15,18], (2) assessing their severity (or capability to do damage) [18], or (3) finding precursory deformation indicative of impending failures that acts as warning signs of impending sinkhole formation [2,16,19,20,21]. The calculation of the probability of sinkhole occurrence relies on the availability of a sinkhole inventory of the area of interest which describes past sinkhole events in addition to the local conditions at the time of their formation [15,22]. In fact, the construction of the sinkhole inventory is considered to be the most important step in sinkhole hazard assessment [11,17,22]. The predictions derived from these models assume that sinkhole phenomena in the future will form in similar conditions as sinkholes in the past [12,23]. Quantitative risk assessment then involves the statistical analysis of sinkhole events in relation to their controlling conditions. In this way, cause-and effect relationships between sinkholes that happened in the past and controlling conditions can be used to perform quantitative risk assessments or probabilistic sinkhole hazard assessment with the aim of identifying high risk areas [12,24] and the production of sinkhole susceptibility maps [15]. To complement these assessments, several approaches have been adopted to identify or confirm the presence of underground cavities in high risk areas which generally relies on geophysical surveys or percussion drilling [25,26,27].
The information derived from the analysis of sinkhole inventories and the mapping of underground cavities can be used to identify high risk areas. The safest strategy is to avoid or prohibit development on high risk areas [12]. However, centuries of urbanisation and urban expansion may imply that communities have already settled in areas that may be deemed unsuitable for development due to the presence of sinkhole hazards. Therefore, to complement sinkhole risk mitigation in high risk areas, recent approaches have focused on the detection and monitoring of small-scale precursory deformation that may, or may not, be present prior to the collapse of a sinkhole [28]. If precursory deformation can be detected, reliably, an early warning can be provided to mitigate the impact of sinkholes on affected communities [16,20].
Although all three stages of sinkhole hazard assessment generally rely extensively on field surveying campaigns and in situ measurements, these approaches are resources intensive and time consuming and frequently impractical for sinkhole hazard assessment over extensive and remote areas. The recent advances in satellite and airborne imaging technologies have made it possible to derive information that can be used for sinkhole hazard assessment while minimising time and cost constraints. This paper aims to review the conventional and earth observation approaches used for sinkhole hazard assessment and highlights the advantages and limitations of the various techniques.
The paper is organised as follows: In Section 2 we review the mechanisms of sinkhole formation, distinguishing between sinkhole types, their sizes and morphological expressions. This is followed in Section 3 by an introduction to the concepts of statistical modelling for sinkhole hazard assessments, focusing on the information requirements, advantages and pitfalls. The role of earth observation in the generation of information to assist with sinkhole hazard assessment is considered in Section 4 with a particular focus on the compilation of sinkhole inventories (Section 4.1) and the detection of precursors to sinkhole development (Section 4.2). We discuss, in Section 5, the advantages and current limitations of remote sensing techniques for sinkhole hazard assessment and highlight the future opportunities.
2. Mechanisms of Sinkhole Formation
Sinkholes are formed due to the presence of cavities in soluble bedrock below the surface. The underground cavities form when water absorbs carbon dioxide (CO2) from the atmosphere or soils to form weak carbonic acid (H2CO3). The weak acidic water can circulate through the subsurface along tension cracks, joints, and faults [3,8,29]. In the presence of calcium carbonate rocks, the acidic water will cause a leaching of the carbonate minerals [8]. In these cases, the process of dissolution progresses slowly [8] and cavity formation under natural conditions can take tens of thousands of years for small caverns to form and millions of years for complete development [3]. However, evaporites dissolve more rapidly [7,22,30], up to 100 times faster than calcium carbonate rocks [11,22]. This is because evaporites have higher solubility and lower mechanical strength compared to calcium carbonates [7,11,12]. The higher solubility of evaporite deposits imply that sinkholes develop more rapidly and have a higher probability of occurrence in these areas [11]. In both scenarios, anthropogenic influences and the presence of urban infrastructure can expedite the process of underground cavity formation significantly [3,8,9,22,29]. This is due to the presence of leaking water-bearing service infrastructure and inefficient storm water management which is associated with an increase in water ingress and consequent acceleration of the development of underground cavities [8].
If subsurface cavities are present, sinkholes can be triggered due to natural or man-made vibrations, surface loading, the ingress of water, or as a result of dewatering [8,14,31]. Where cavities are filled with groundwater, a lowering of the water table (dewatering) can expose roof materials and concurrent removal of the buoyant support of these materials [11,14]. These conditions can activate or accelerate subsurface erosion of the roof strata into the cavity [13]. In the case of water ingress, the concentrated ingress of water will result in the mobilisation of roof materials into the cavity. The triggering mechanism in question generally affects the size of the sinkholes with sinkholes triggered by dewatering resulting in larger sinkholes (up to hundreds of metres in diameter) while sinkholes induced by water ingress tend to be smaller [8].
The resulting instabilities are generally classified either as sinkholes or as subsidence depending on the local conditions leading to their formation. Subsidence, also referred to as solution sinkholes, form when soluble rocks are close to the surface or exposed [12]. This leads progressive dissolution and a gradual sagging of the surface [21]. A graphic representation of subsidence basin formation is provided in Figure 1. The illustration provides an example of water ingress due to leaking water bearing services as example (Figure 1A). The overburden is not competent enough to support arch formation, leading to gradual subsidence (Figure 1B). An example of a subsidence feature developed in a mining region in South Africa is provided in Figure 1D. Although subsidence events can be extremely damaging to buildings and infrastructure, the associated deformation of the surface is slow and gradual, and are therefore less likely to result in catastrophic events since there is time to issue warnings [13].
Sinkholes, on the other hand, are generally associated with sudden collapse [21,22] which poses significant risks to human health and safety as well as infrastructure. The process of sinkhole formation is presented graphically in Figure 2. Certain conditions necessary for the formation of cover-collapse sinkholes have been described [13,29,32]. Firstly, the overburden must have enough inherent strength to form a roof, yet should be permeable and erodible. Near-vertical walls or pillars should also be present near the surface to support bridging material that, if failing, results in the sudden formation of cavities [29,33] (Figure 2B,D). If there is no bridging support or the overburden is too weak to form an arch, subsidence sinkholes will occur instead. Furthermore, a means of transportation of materials, for example from hydrological action, should be present [33]. The water table should consequently be low, since percolating water has a higher erosive potential above the water table [32]. When a void of appropriate size is present, mechanisms that cause the roof to collapse needs to be present. The results will be upwards void migration until the surface is reached [13,29]. An example of a cover collapse sinkhole in South Africa is provided in Figure 2D.
Although sinkholes are generally considered to occur with little prior warning, the appearance of tension cracks, cracks in walls and surface subsidence are often early warning signs of sinkhole formation [8,20]. An example of tension cracks, developed on the edges of a sinkhole in South Africa, is provided in Figure 3. Such evidence manifesting on the surface before the collapse is the result of a phase of continuous underground erosion events (known as arch collapse) leading to upward cavity migration until the surface is reached [34]. Such signs are known to develop either rapidly, in a matter of hours, or over periods of as long as a couple of months or years prior to sinkhole collapse [34,35,36]. The presence of these precursory deformation features suggests that it may be possible to derive early warning indicators of sinkhole formation prior to its ultimate collapse [24]. If a technique for the early detection of small-scale surface deformation prior to collapse of a sinkhole can be developed, the technique can contribute to a sinkhole early warning system. The derived information can inform disaster managers and affected communities of impending sinkhole formation, thereby minimising the potential for injuries and death.
3. Statistical Modelling and Probabilistic Sinkhole Hazard Assessment
It has been noted that valuable indications of an area’s vulnerability to sinkhole and subsidence formation can be obtained from knowledge of past events [12,13,15,31,37]. The process of sinkhole hazard map generation generally involves the mapping of the regional parameters that may impact on collapse occurrences [31] and/or the analysis of the spatial distribution of past sinkholes [15]. A significant component in these processes involves the compilation of a sinkhole inventory for an area under investigation and the subsequent analysis of cause-and-effect relationships between sinkhole occurrences and local conditions [11,12,13,14].
Various approaches to the compilation of sinkhole susceptibility maps have been described [15]. This includes (1) approaches based on the spatial distribution (density) of sinkholes, (2) heuristic models based on the presence of particular controlling factors and (3) probabilistic models that involves the analysis of statistical relationships between existing sinkholes and controlling conditions. Both heuristic models and sinkhole density approaches are geared towards the creation of sinkhole susceptibility maps [15], which aid in defining prevention and remediation measures [14]. In this way, the most hazardous areas can be avoided for further development. On the other hand, probabilistic models aims to analyse cause-and-effect relationships between sinkhole occurrences and local conditions [15], thereby providing valuable information for the compilation of sinkhole risk management plans to reduce dissolution processes.
An understanding of the factors controlling sinkhole development is deemed necessary for the development of sinkhole probability models. In an attempt to develop sinkhole probability models for Minnesota, factors such as distance to nearest sinkhole, sinkhole density, bedrock geology and depth to bedrock were included in a decision tree model [38]. However, the models did not incorporate controlling factors. In contrast, a method for assessing sinkhole probability and hazard was tested for the Ebro Valley in Spain [37] which included an assessment of the contribution of specific variables controlling sinkhole development and their effect on the predictive capability of the models. The results were used to define sinkhole susceptibility models for sinkhole hazard map generation [37]. Further refinements to these models included the incorporation of magnitude and frequency relationships to estimate the probability of a certain area being affected by a sinkhole of a specific size [39]. Further examples of sinkhole risk assessments based on sinkhole inventories are available for several regions world-wide [12,13,14,15,17,37]. In general, statistical investigations reveal that the probability of sinkhole development in undeveloped areas is statistically small when measured as a percentage of the land area [13]. However, the anthropogenic activities in highly developed, urbanised areas have accelerated the development of sinkholes [12,13,37]. In fact, in the dolomitic terrain in the densely populated Gauteng Province of South Africa for example, statistical analysis of sinkhole inventories revealed that between 94 % and 99 % of sinkholes were triggered by anthropogenic activities while only between 1% and 6% could be attributed to natural causes [13]. In particular, the development density of these areas were found to be a significant factor leading to the conclusion that higher densities of water bearing services were associated with higher likelihood of leaking services and, therefore, higher probabilities of sinkhole development [13]. The investigation also revealed a correlation between cumulative rainfall and sinkhole occurrences. It was concluded that an increase in water ingress from ponding rainwater in areas not serviced by storm water drains led to an increase in sinkhole events [13]. The information derived from sinkhole inventories have led to the development of Dolomite Risk Management Strategies (DRMS) for the region. It was determined that, after the development of the DRMS in 2004, the occurrence of sinkhole and subsidence events in the period reduced from 50 events per year in the early 2000’s to 5 events per year, a reduction of 90% [13].
It can be seen that effective sinkhole and subsidence hazard management strategies depend on a comprehensive understanding of the geological mechanisms of sinkhole formation as well as the local sinkhole characteristics, triggering and controlling factors. Section 4 will discuss the contribution from earth observation towards collecting reliable and appropriate data for sinkhole hazard assessment, with a focus on the compilation of sinkhole inventories and monitoring ground deformation associated with sinkhole development.
4. The role of Earth Observation in Sinkhole Hazard Assessment
Although in situ approaches for the collection of information for sinkhole hazard assessment (including surveying, trenching, geophysical and geodetic monitoring approaches) are well established, the limitations of these approaches are well described. This includes the fact that they are time-consuming, labour intensive, costly and invasive [40,41,42,43]. Recent advances in earth observation approaches, including satellite- and airborne imaging techniques, provide information that can assist sinkhole hazard assessments. Earth observation technologies are used for compiling sinkhole inventories but also have the potential to be more widely used for assessing sinkhole damage [44]. This includes the monitoring of active sinkholes [45] and even to identify environmental risk factors that can contribute to sinkhole development. Remote sensing is often used to assess the extent and magnitude of infrastructure damage using techniques involving high-resolution change detection on optical or SAR imagery before and after the event [44]. It has successfully been used after disasters such as earthquakes [44], volcanic eruptions [46] and landslides [47] and could therefore also be applied to sinkhole events. Remote sensing can also be used to monitor the evolution of active sinkholes, this requires very high-resolution data and airborne LiDAR has been shown to be an effective tool [45].
In terms of sinkhole risk assessment and damage mitigation, it has been recognised that sinkholes in urban areas are likely to be caused by anthropogenic factors with leaking water infrastructure and groundwater extraction being particular risk factors [8,12,48,49]. There is therefore an opportunity to investigate the role of remote sensing is assessing the presence of these risk factors and the relationship with sinkhole formation. Remote sensing is in fact already widely used as a tool in monitoring both leaking infrastructure and groundwater extraction. Pipe leaks can be detected by monitoring vegetation growth using vegetation indices on high resolution optical data [50,51,52] while groundwater extraction is often monitored using time-series SAR interferometry [53,54,55]. The potential therefore exists to investigate the connection between these factors and sinkhole events using remote sensing.
Although the monitoring of risk factors can be performed, the value derived from sinkhole inventories through the reduction and management of sinkhole risk means that significant efforts have been devoted to refining techniques for the compilation of sinkhole inventories using earth observation techniques. Additionally, new advances in earth observation techniques have also resulted in several attempts to identify small-scale precursory deformations indicative of sinkhole development. The use of earth observation techniques for the population of sinkhole inventories and for the detection of precursors to sinkhole events have been conducted for various regions across the world (Figure 4). This includes the use of optical, SAR and terrain analysis approaches for sinkhole inventory compilation as well as SAR interferometry for monitoring precursors to sinkhole development. The successes, advantages, and limitations of the various approaches are elaborated on in Section 4.1 for sinkhole inventory compilation and Section 4.2 for precursor detection respectively.
4.1. Compilation of Sinkhole Inventories
The most important step in sinkhole hazard assessment is the construction of a comprehensive sinkhole inventory [11]. In fact, it has been noted that the quality and accuracy of predictive models are dependent on the completeness and representativeness of the sinkhole inventories on which they are based [37]. Theoretically, if a large inventory of past sinkhole events including information on the location, magnitude and chronology is available, the spatial and temporal probability of sinkholes can be derived [39]. Sinkhole inventories should, ideally, include information on the location, morphometric parameters, genetic type, chronology, deformation activity, conditioning and triggering factors of past sinkhole events [11]. The compilation of sinkhole inventories are usually achieved using direct observations such as interviews with local residents and geophysical investigations [15] (Section 3). However, in recent years, various remote sensing approaches have also proven to be effective in the identification of sinkholes at the surface, typically through analysis of historical aerial photographs, satellite imagery and topographic maps [12,15,17,18,22,27]. The compilation of sinkhole inventories generally relies on two aspects: (1) the detection of buried cavities that may cause future collapse of the surface and (2) an inventory of sinkholes that formed in the past.
For the detection and mapping of buried sinkholes and cavities, geophysical methods have been used with reasonable success [25,26]. These methods can be either destructive or non-destructive. Destructive methods include drilling and trenching and are useful for in-depth characterisation of the structures and dating of sediments; information not obtainable through other methods [56]. They are, however, only successful if the excavation site is well chosen, typically by non-destructive methods [22,56]. Non-destructive geophysical methods include the use of seismic reflection [30], micro-gravity surveys [4,27], magnetic surveys [57] electromagnetic (EM) surveys [30,56,58] and ground penetrating radar (GPR) [25,56]. A review of the geophysical methods for the detection of underground cavities has been completed [57]. In general, the most commonly used geophysical technique for the detection of underground cavities is GPR which operate by transmitting microwaves into the ground and analysing the returned signal [25,26]. The technique has been used to identify and localise subsurface cavities [26] and has also successfully identified buried sinkholes [25] to contribute to sinkhole inventories. An example of a radargram generated for a sinkhole-prone area in South Africa is presented in Figure 5. Anomalous features identified were associated with a zone of increased reflections due to the presence of a water-filled zone [59]. The value of GPR depends on the subsurface material characteristics as well as operator expertise and knowledge of the area and is limited by penetration depth of the selected frequency [22].
Gravity surveys have also been performed for the detection of buried cavities. In fact, the approach was demonstrated to be effective in the Dead Sea region when sinkholes occurred a few months to a few years after the survey revealed the presence of anomalies [27]. When using gravity surveys, areas prone to collapse are generally associated with negative gravity anomalies, highlighting shallow mass deficits and the potential for subsidence or collapse [4]. EM surveys, including the Transient Electromagnetic Method (TEM) and the Electrical Resistivity Tomography (ERT) methods, have been also used to provide a better understanding of the composition of underground deposits by profiling different resistivity zones [30]. In this way, different resistivities could be an indications of buried sinkholes and air- or water-filled cavities [58]. In one investigation, ERT was successfully used to characterise buried sinkholes by identifying the low resistivity of the clayey fill material which was contrasted against gravelly alluvium surrounding the cavity [56]. An example of ERT data for the detection of subsurface anomalies are provided in Figure 6. In this example from South Africa, a highly resistive zone was identified and inferred to be associated with an air-filled cavity [58,59]. Additionally, more conductive zones associated with weathered dolomitic material filling two known sinkholes were observed [58,59]. Although these examples illustrate that ERT has been found to be successful in mapping buried cavities, the limitation is that the technique relies on fill materials having contrasting resistivities when compared to surrounding materials. Furthermore, ERT is limited by a loss of resolution at depth [56].
In addition to the loss of resolution and the depth of the investigation, general limitations of geophysical surveys is related to the fact that the absence of a cavity in the geophysics results does not necessarily reject the possibility of future collapse [27]. Furthermore, although effective over small areas, terrestrial geophysical surveys cannot be applied to extensive areas since it is both time-consuming and expensive [27] and are considered to be hazardous in potentially unstable areas [27]. Therefore, earth observation technologies are increasingly being considered for the compilation of sinkhole inventories since the data can cover large areas rapidly, cost effectively and safely [44,60,61].
Various remote sensing platforms are used for sinkhole inventories, each with its own advantages and disadvantages. Ground-based systems such as ground-based radar and portable LiDAR are typically cost-effective and offer good resolution; however, they do not cover large areas, can easily be obstructed and it is challenging to keep the sensor stable over long periods [26,45]. Optical or LiDAR sensors flown on airborne platforms are well suited for sinkhole investigations due to their high resolution [62,63]. However, data acquisition campaigns are relatively expensive and are typically not done frequently over long periods. In these instances, spaceborne platforms are ideal for monitoring large areas consistently over time, and are frequently used to investigate sinkholes [46,61]. However, spatial resolution is a significant challenge for sinkhole research from spaceborne systems due to their relatively small scale [20].
Sinkholes are typically characterised by circular or oval shapes, conical collapse structures, concentric cracks along the outer edges, a sharp drop in elevation or basin-like depressions on the surface [64]. The mapping of sinkholes using remote sensing techniques generally rely on the detection and mapping of these distinct geomorphological features using one of two broad approaches namely; (1) feature extraction on optical imagery and (2) terrain models that are analysed for depression features. The simplest method of feature detection on optical imagery is visual inspection of aerial photography for signs of sinkholes [65]. This technique can be very valuable as sinkholes can often be dated accurately since many countries have aerial photograph archives dating back several decades [22,33]. Sinkhole depressions can often be identified by ponding of water, concentric geomorphological structures such as tension cracks or vegetation clumps [66,67] which are visible on remote sensing scenes. In general, for remote sensing investigations, high resolution, sharpness and the ability to be viewed stereoscopically is important considerations when selecting scenes for identifying sinkholes [22]. In an investigation in Spain, all but one of the sinkholes found in a comprehensive inventory could be detected using aerial imagery. It was concluded that historical imagery can be extremely useful to detect sinkholes in areas where anthropogenic landscape transformation would later erase surface expression of their presence [22].
The construction of sinkhole inventories using remote sensing data is frequently difficult due to complications in identifying sinkhole-related geomorphic features if high resolution data at high temporal frequency is unavailable. Specifically, in several cases, erosion, sedimentation and anthropogenic fills may also mask sinkhole-related geomorphic features soon after they have formed. Such transformation is a big challenge for detecting sinkholes using visual clues only [22,31]. To overcome the limitation of relying only on visible geomorphic expressions, recent experiments have focused on using infrared data to identify temperature differentials between sinkhole-related features and the surrounding landscape. Using drone-based infra-red sensing, this technique relies on sinkhole depressions being colder at night than the surrounding environment and thereby providing a good dataset for machine learning classifiers [68]. Extensive validation and verification of these approaches remains to be performed.
The use of terrain models to extract the characteristic geomorphic expressions associated with sinkholes has also been investigated. Terrain models can be generated from many sources with the simplest being topographic maps generated by surveying techniques. Remote sensing techniques to generate terrain models include terrestrial airborne laser scanning [45,62,69], stereo-photogrammetry using optical imagery [70], drone-based Structure from Motion (SfM) [71] and SAR interferometry [72,73] among others. Global elevation models such as the SRTM and ASTER GDEM, generated through spaceborne SAR interferometry or stereo-photogrammetry respectively, are freely available. However, their use for sinkhole inventories is limited due to their spatial resolution (~30 m) and absolute vertical height accuracy (>16 m) [74] being lower than typical sinkhole feature dimensions. Sinkhole inventories are therefore typically built using airborne platforms. It should be noted that the higher spatial resolution (12 m) and absolute vertical accuracy (6 m) of the recently released WorldDEM [75] may be suitable for the compilation of sinkhole inventories, especially for large sinkhole events, for example in the cases where widths exceeding 100 m and depths exceeding 30 m have been reported [4,76]. Studies have found that high quality topographic maps generated using stereogrammetry on orthophotos can be used to detect and delineate surface depressions likely to be related to sinkholes [22]. However, it was found that the technique relies on sinkhole being large enough to map using these depending on the resolution of the data. The limitation of airborne surveys is that the acquisition of high resolution data over extended areas at high temporal frequency is costly. To overcome this limitation UAV-based image acquisition has evolved to be a simple and cost effective alternative. This data can be used in combination with a three-dimensional image stitching technique called Structure from Motion (SfM), similar in concept to stereogrammetry, to extract terrain models [71]. SfM allows for quick and cost effective generation of 3D point clouds over small areas at a fraction of the cost of airborne surveys [63]. In general, SfM models provide vertical accuracy in the cm to metre scale, with reported RMSE’s ranging between 0.1 m and 1 m [71]. These accuracies have been found to be accurate enough to map surface topography and to detect all but the smallest sinkhole depressions [71]. Rapid advances are being made in commercial UAV technology and processing algorithms and SfM is expected to become a valuable tool for rapid surface model generation at a low cost [63].
Airborne laser scanning is also commonly used for the extraction of accurate terrain models and several investigations used these models for the mapping of sinkhole-related geomorphological features [33,45,62,64]. Airborne laser scanning has been used for the detection of geomorphic features associated with land degradation and sinkhole events in the Dead Sea region [64]. Data analysis focused on identifying areas characterised by a sharp drop in the surface topography in addition to features of circular to oval shapes. Furthermore, sinkholes in the area were associated with conical collapse structures and concentric cracks outside of the edges. The laser scanning data was noted for its ability to detect the cracks at an early stage, pointing to the potential of laser scanning data being used for early warning of impending sinkhole formation [64]. However, challenges in the use of airborne laser scanning for the compilation of sinkhole inventories have also been identified [33]. The problems include: (1) the under-estimation of the area of the depressions depending on the resolution of the data and the size and depth of the depression, (2) the presence of vegetation that can mask the sinkhole boundaries leading to underestimation of sinkhole extents depending on the vegetation density, (3) in urban areas the presence of buildings and structures mask the presence of depressions, and (4) the inability to distinguish between man-made depressions and sinkholes [33].
Irrespective of the choice of data, the visual inspections of imagery or terrain models in an effort to identify sinkholes are time consuming, labour intensive and highly dependent on operator expertise which may lead to incomplete, unreproducible or biased results [63,65,71,77,78]. Automated feature extraction algorithms can therefore play a critical role in sinkhole inventory collection. Various techniques, drawn from a wide range of fields, have been used for automated feature extraction from surface models. In general, pixel-based techniques have been found to be inappropriate for successful feature extraction and most research is focussed on object-, rule- or case-based analysis and artificial neural networks [77]. Terrain analysis-based techniques include sink-filling, whereby a depression-less model is subtracted from the original model to locate depressions, and active contour and image filtering approaches [65]. Spatial models, based on parameters estimated for the feature of interest, can also be used to find matching patterns to expected features in the data [21]. Transformations used in computer vision, such as the Hough transform with its ability to extract ellipses, is also very useful on contour data [79]. Other techniques drawing on graph theory are also useful, particularly for their ability to work on sparse graphs since surface models are often not complete continuous datasets due to noise and artefacts [65,80].
Although the earth observation approaches can identify historical sinkhole events based on the topographic expression or visual clues, their use is limited in areas where natural processes (like erosion and sedimentation) or anthropogenic activities mask the normal topographic expression of these events [22,31]. Furthermore, mapping sinkholes are very dependent on the specific local geology and land cover as all techniques are not equally effective in different areas. The process of sinkhole inventory creation in general have been described as arduous with complications due to (1) complications in identifying sinkhole morphology in flat areas, (2) the obliteration of sinkhole features due to anthropogenic fills, and (3) the non-disclosure of sinkhole events by land owners due to the fear of depreciation of the value of their property [39].
Ultimately, the mitigation of sinkhole risks based on susceptibility mapping and sinkhole management plans derived from probabilistic models depends on the reliability of the predictive models on which they are based [15]. Although significant reductions in the number of occurrences of sinkholes have been observed based on risk management plans derived from sinkhole inventories [13], the reliability of the predictive capability remains unknown in a large number of instances [15]. For this reason, several investigations have been devoted to the search of small scale vertical movements that may be indicative of impending sinkhole collapse. The detection of small scale precursors to sinkhole formation may contribute to the provision of sinkhole early warning, therefore further minimising the probability of catastrophic events. The detection of vertical movement of the surface is measureable, in ideal conditions, by geodetic or remote sensing techniques as outlined in Section 4.2.
4.2. Detecting Precursors to Sinkhole Development
Due to the risks involved with invasive and non-invasive cavity detection approaches, a significant amount of research has focused on the development of techniques to detect and monitor deformation prior to sinkhole development. The ability to detect ground deformation indicative of impending failure allows for proactive remediation, increasing public safety and minimising infrastructural damage [21]. The presence of deformation preceding the collapse of rock masses have been known to exist and are used as early warning for rock mass failures [24]. This is particularly relevant in the mining industry where precursory deformation is observed in both surface and underground mines [35,81]. In the case of sinkholes, deformation in the order of a few mm to cm are speculated to be present days, months or even years before the failure [19,20,26]. In general, measurable deformation have been observed before major displacement occurs, although the main limitation lies in the opportunity to observe such deformation, especially when they occur in the underground environments [24].
The monitoring of ground deformation is conventionally achieved with the use of in situ approaches including, for example, inclinometers, extensometers, geodetic measurements, laser transmitters and receptors [12,71]. Microseismic networks have also been deployed in an effort to identify precursors to collapse events [82]. Although these approaches provide very high precision measurements, their limitations for operational monitoring of surface deformation, irrespective of the cause of the deformation, is well known. The limitations include the fact that measurements are point-based and therefore limited in spatial extent [22,40,41,42,81,83]. Measurements are also labour intensive, time consuming and costly, making its use impractical over large areas [22,43,71,81,83,84]. To address these limitations, recent advances in satellite and airborne imaging techniques introduced new ways of monitoring subtle surface deformation features [85].
Since large areas need to be investigated, the potential of using remote sensing for sinkhole precursor detection have been recognised [31]. In an effort to derive a geohazard map of cover collapse sinkholes in Belgium, high resolution SPOT, ERS and aerial photographs were inspected with the aim of detecting precursors to sinkhole development with little success. The lack of findings were attributed to insufficient spatial and temporal resolution in addition to land use activities that were masking the effects of a growing void at the surface [31]. The use of high resolution data for the construction of digital terrain models and their comparison over time have also been considered. The structure from motion (SfM) algorithm in particular has been recognised for its ability to derive three-dimensional terrain from images taken from different angles at low cost. Image acquisitions with high spatial and temporal resolution are possible, allowing observations in highly dynamic environments [71]. Using multi-temporal SfM datasets, very high resolution digital surface models can be used to quantify changes in surface topography based on surface model differencing [71]. It, therefore, not only has the potential to be used for mapping sinkhole dimensions, but also has the potential to map surface movement. However, differencing of surface models are known to be associated with error propagation and, given the centimetre range vertical accuracies reported in previous investigations [71], the accuracy is typically too low for sinkhole precursor detection through elevation model subtraction [71].
Several advanced in the field of active remote sensing technology has highlighted significant potential for the identification of precursors to sinkhole development. This includes LiDAR surveys as well as differential radar interferometry techniques which is based on the analysis of a time series of SAR data. LiDAR and terrestrial laser scanners are active remote sensing techniques that generate topographical information that can theoretically be used for monitoring deformation over large areas. However, deformation monitoring with LiDAR is challenging as typical rates of subsidence are within the error limits of LiDAR collections [26,60]. Furthermore, reaching the necessary accuracy requires the instrument to be within 10 m to 100 m from the ground, limiting its wide area applicability [26]. On the other hand, the field of Synthetic Aperture Radar (SAR) image analysis in general, and differential SAR interferometry (DInSAR) techniques in particular have demonstrated the ability to measure small scale movements of the surface [19,20,42,43,60,81,83,86,87,88,89]. In fact, in ideal conditions, cm to mm scale deformation measurements are possible [22,81,90,91,92]. Orbiting satellites and satellite constellations enable measurements at high temporal frequency (as often as every couple of days) over large areas [22,81]. Furthermore, in some regions, long-term historical archives of SAR data are available, enabling the retrospective analysis of deformation events and their evolution over time [22,26]. An example of subsidence-induced deformation measurements from DInSAR is shown in Figure 7. In this figure, ongoing ground deformation associated with subsidence basin formation in South Africa as detected by RADARSAT-2 and Sentinel-1 SAR satellites for the period of September to November 2017 is shown.
Due to the sensitivity to small scale movements, DInSAR techniques have been used extensively for the mapping and monitoring of surface deformation associated with a variety of natural and geological hazards [90,93,94,95]. DInSAR has also been used for the identification of precursors to geological hazards such as mining collapse [16,40,42,43,81,83,96,97,98,99,100], landslides [16,91,97,101,102,103] and volcanoes [16,90,95] as well as the mapping of deformation due to aquifer over exploitation [16,56,86,87,89,96,104]. The maturity of DInSAR techniques has reached a stage where they are applied in numerous operational systems [28]. The synoptic view and repeat observations provided by spaceborne SAR sensors mean that the data could prove to be an effective tool for the long-term monitoring of areas susceptible to sinkhole formation [2]. In fact, certain case studies suggest that DInSAR techniques could be used for the detection of precursory deformation [5,6,19,20,21,26,34,60,92,105,106,107,108]. Several successful detections of sinkhole precursors have been reported in the literature. A summary of the investigations for which precursors to sinkholes were successfully detected is provided in Table 1.
The successful detections of sinkhole precursors were achieved using ground-based, airborne as well as spaceborne SAR sensors. In the case of the ground-based InSAR (GB-InSAR) system, approximately 3 mm of deformation could be detected using data acquisitions three months apart, leading to a road closure before the sinkhole formed, mitigating further damages [26]. Importantly, it was found that the deformation basin was approximately three times larger (10 m) than the actual sinkhole event (2.5 m). This is an important consideration since it points to small-scale sinkholes being detectable by precursory basins larger than they are. In this case, the successful detection was also attributed to the presence of a tar road surface that is believed to undergo plastic deformation prior to failure [26]. Although the successful detection of precursory deformation in this instance highlights the potential of GB-InSAR for sinkhole early warning, the investigation also observed some instances of sinkhole development for which no precursory deformation could be detected [26]. The sinkhole in question was 1.5 m in diameter and occurred on the side of a road. Retrospective analysis of interferograms and displacement maps revealed no signs of precursory deformation despite the 1 × 1 m resolution provided by the system. In this case, the cause for the non-detection of precursory deformation was attributed to a combination of factors including the small dimensions of the sinkhole as well as the presence of vegetation reducing the reflectivity and visibility of the feature [26]. The short time-period between the detection of precursors and the collapse has also been identified as potentially problematic [26]. Although the investigation proves the potential for GB-InSAR systems for detecting sinkhole precursors, the systems are limited in extent and not frequently deployed, limiting its large scale ability for operational sinkhole precursor detection.
The use of airborne SAR data has also been used to demonstrate the ability to detect sinkhole-induced surface deformation. Most notably, one case study proved the ability to detect precursory deformation in a challenging environment using NASA’s Uninhabited Aerial Vehicle Synthetic Aperture Radar (UAVSAR) data. In this investigation, primarily horizontal movement of 260 mm was detected in forested marsh conditions months before a sinkhole formed [5]. The success of repeat-pass DInSAR in this terrain was attributed to the high resolution provided by UAVSAR, the long wavelength (L-band) of the sensor as well as the presence of tree stems at the site. The ability of UAVSAR to resolve the subsidence at the edges of the standing water that collected in the subsidence basin, was deemed to be due to the interaction of the signal with the tree trunks. Furthermore, the longer wavelength L-band is less sensitive to temporal decorrelation and is able to detect larger magnitude deformation between acquisitions than shorter wavelengths that are more constrained by the deformation gradient limit [111].
In the case of space-borne SAR data, the increasing availability, coverage and temporal resolution of data have resulted in numerous investigations focussing on DInSAR for detecting sinkhole-related deformation. One area particularly favoured for testing techniques for sinkhole precursor detection is around the Dead Sea region [6,27,85,109]. In this area, the increasing frequency of sinkhole and subsidence events, from less than 50 per year prior to 1999 to 380 per year since 2003 [6] implies that several cases of sinkholes and their potential precursors could be investigated. The mechanisms of sinkhole development in the area was associated with the dissolution of a subsurface salty layer due to flood events [109], decreasing water levels in the Dead Sea [6] potentially leading to the consolidation of an aquifer system or a combination of the two. Furthermore, in one investigation, subsidence features were deemed to be structurally controlled in the presence of faults and boundaries of salt domes that were reactivated due to an earthquake in April 1979 [109]. In these investigations, DInSAR techniques were able to identify several circular to elongated features exhibiting primarily vertical movements (mostly subsidence with one case of heave) [85]. In most instances, sinkhole-related deformation was characterised as wide, shallow subsidence basins with deformation rates ranging between 5 mm/year and ~20 mm/year although rates exceeding 60 mm/year was observed in one instance [85]. In another study, ~12 cm of precursory deformation could be detected up to seven years before a dyke collapsed [27]. In general, the dimension of the subsidence features investigated ranged between a few hundred metres to a few kilometres in size. Furthermore, DInSAR results were used to model precursory deformation behaviour and it was found that, in the region, sinkholes are likely to form at the edges of subsidence basins [114].
In other regions, several successful sinkhole precursors could be detected in areas such as the USA, Europe and South Africa. In the USA, ERS-1 and 2 as well as ALOS PALSAR datasets were acquired for the Holbrook basin in Arizona [110]. Dissolution of salt in the area has resulted in over 500 sinkholes and numerous subsidence-related geomorphic changes. Using SAR scenes captured at varying intervals between 1992 and 2013, over 25 land subsidence features have been identified covering an area of over 3 600 km2. Deformation of between 1.7 cm and 26 cm of deformation could be detected for features ranging between 40 to 130 m and up to 3 km across. The presence of subsidence-induced geomorphic features including drainage reversals, closed-basin formation, compression ridges and expanded joints were identified by field investigations, validating the results obtained by InSAR [110]. In a sinkhole prone region in Texas, ALOS PALSAR data captured over a 6 month period in 2007 revealed the presence of vertical movements in the vicinity of two sinkholes that occurred in 1980 and 2002 [4]. The subsidence basins, formed due to salt dissolution, revealed between 10 cm and 15 cm of total deformation over areas between 300 m and 850 m across. Subsequent gravity surveys confirmed the presence of mass deficits, suggesting a high likelihood of future collapses. Finally, in South Africa, between 17.2 mm and 42.2 mm of surface subsidence was observed 6 months before the development of a sinkhole with dimensions of 0.5 m × 1 m.
Most of the successes in detecting sinkhole-related deformation was reported for areas undergoing solution-type deformation leading to wide shallow subsidence features. Their large scale and the relatively small-scale of deformation events lends itself to the successful monitoring by conventional repeat-pass interferometry. However, in the case of cover-collapse type sinkholes, the small scale of sinkholes, usually occupying a couple of pixels compared to other geohazards, imply that they can easily be misinterpreted as noise of processing errors [76], especially when DInSAR approaches are adopted. In the case of subsidence-type sinkholes, despite the relative success in detecting surface deformation using DInSAR, certain limitations were also identified. For example, despite the successful detection of sinkhole-related deformation in Texas [4], the same approach performed the retrospective analysis of precursory deformation for a 16 month period prior to the collapse of a sinkhole [4]. The analysis failed to detect any precursory deformation prior to sinkhole development. It was suggested that, in this instance, failure may have been sudden, once the void was shallow enough to permit failure of the roof [4] and that small-scale deformation prior to collapse may not have been present. This points to surface-cover and lithological constraints leading to precursory deformation features not be present or visible at the surface [20].
The main limitation associated with the application of conventional DInSAR approaches for the monitoring of surface deformation, irrespective of the cause of the deformation, is the temporal and geometrical decorrelation of the signal, especially in areas of dense vegetation, erosion, changes in moisture conditions and large deformation rates [5,16,19,20,21,27,40,43,81,90,105,115]. In addition to signal decorrelation, the phase distortion introduced by changes in the atmospheric water content between image acquisitions have been known to introduce erroneous valuations of deformation [16,21,105]. To overcome the limitation, advanced processing techniques that focus on the analysis of coherent targets have been used. This includes approaches such as persistent scatterer (PS) interferometry [116], SBAS [117], and SqueeSAR [118] approaches. These approaches can be used to remove atmospheric interferences while focusing on targets that remain coherent over the time series, thereby overcoming limitations due to pixel decorrelation.
The PSI approach was used to retrospectively analyse data captured two decades prior to the collapse of a shopping mall in the Netherlands [34]. A combination of ERS1/2, Envisat and Radarsat-2 scenes were used. A total of 8 cm of subsidence was measured with deformation rates between 3.3 mm/year and up to 15.6 mm/year reported. Importantly, the surface deformation was observed for up to 2 decades prior to the eventual collapse event. Although the interferogram stacking approaches can overcome the limitations associated with atmospheric ambiguities, one particular limitation associated with PSI approaches is that the correct model to describe the expected deformation needs to be adopted [119]. In the case of sinkholes, deformation is expected to be non-linear over time. This makes the removal of atmospheric phase contributions, which are also non-linear, problematic since deformation-related phase contributions may be mistakenly removed [119]. In fact, analysis of the spatial and temporal behaviour of cover-collapse sinkhole related deformation suggests a Gaussian model for sinkhole evolution [21]. Given the unpredictable nature of potential precursors, coupled with their strongly non-linear character and frequently abrupt natures, the selection of appropriate model in the application of interferogram stacking approaches for sinkhole precursor monitoring is potentially problematic. A further limitation is related to the lack of coherent point targets in vegetated or rural areas and pose limitations for the large scale adoptability of the PSI approach for sinkhole precursor detection.
An approach to increasing the density of coherent targets, called the small baseline subset (SBAS) technique, minimises geometric decorrelation by using combinations of scenes with small perpendicular baselines resulting in a higher density of coherent targets [40]. The SBAS technique has been considered in several investigations aiming to measure sinkhole-induced surface deformation [76,97]. In the Ebro Valley, Spain, and area associated with sinkholes <2 m and up to 10 m in diameter as well as subsidence basins up to 100 m in length could be investigated. Up to 1.68 cm/year of deformation was measured between 1995 and 2002 using ERS-1 and 2 data [97]. Although sinkhole precursors could be detected successfully, a large portion of known sinkholes were not detected. The non-detection of precursors were attributed to the decorrelation of the signal in irrigated agricultural areas and the low spatial resolution of the ERS-1 and 2 data. In fact, for cover-collapse sinkholes, exhibiting diameters <2 m, the InSAR techniques were considered to be unsuitable due to their small size and the loss of coherence associated with rapidly deforming surfaces [97]. On the other hand, evidence of ground deformation associated with cover collapse sinkholes exceeding 10 m diameter and subsidence features exceeding 100 m in length were observed [97].
The decorrelation of the signal in rapidly deforming areas [105] as well as generally low coherence in vegetated areas are some of the main limitations associated with approaches based on coherent point targets. The coherent targets frequently correspond to highly reflective, stable structures as often found in densely constructed and urban environments [21,40]. In areas that are scarcely populated, the absence of coherent targets in rural and vegetated regions makes the implementation of coherent target approaches difficult [40]. To increase the quality of measurements in non-urban areas, advance approaches, including the SqueeSAR and Stable Point Network (SPN) approach, incorporates the analysis of larger areas exhibiting coherent behaviour over time, called distributed scatterers, as opposed to focussing on single point targets alone [21,105,112,113]. The SqueeSAR and SPN approaches increase the density and quality of measurements in rural areas by identifying regions with a statistically homogeneous response that also exhibit coherent temporal behaviour [21,113]. The SPN approach was used to monitor railway infrastructure in the Ebro Valley, Spain, and resulted in a high density of measurement points due to the high reflectivity of railways [113]. Subsidence of as high as between 6.6 mm/year and 9.7 mm/year could be measured in this region [113] and was found to be correlated with sinkhole locations. However, in other investigations, it was observed that the coherent distributed targets are normally associated with statistically homogeneous areas such as those found in non-vegetated areas, suggesting limited applicability in vegetated regions [99]. In fact, the SqueeSAR approach was adopted in the investigation of surface deformation associated with sinkhole development and failing infrastructure in Virginia, USA [105,112]. Movement velocities of between 0.03 and 0.22 mm/year could be detected for both known and previously unknown sinkholes. However, heavily vegetated areas proved to be an obstacle and was masked out of the analysis. In these cases, new refinements to interferogram stacking techniques that extract information about scatterers that gain or lose reflectivity over only a subset of the stack has been recommended [112]. These scatterers, known as temporary coherent targets, should be considered for inclusion in future research [107,120,121,122].
5. Discussion and Perspectives—Towards Operational Sinkhole Early Warning
In this section, we discuss the advances and limitations of the techniques employed for the extraction of information informing sinkhole hazard assessments. The main advantages and limitations of the various approaches as well as the recommendations in implementation are summarised in Table 2.
Given the value that can be derived from sinkhole inventories through the reduction and management of sinkhole risk, significant efforts have been devoted to refining techniques for the compilation of sinkhole inventories as well as the mapping of regional conditions impacting sinkhole formation. It has been noted that the quality of predictive models are dependent on the completeness and representativeness of the sinkhole inventories on which they are based [37]. Since sinkholes are characterised by distinct landforms [7], the critical component in identifying the sinkholes generally rely on field surveys and geomorphological investigations together with historical records such as newspapers and interviews with local community members [12,13,14,17,18]. However, an underground cavity can be present without any indications being visible at the surface and the main problem for assessing sinkhole hazard is a lack of knowledge of the existence of a cavity [34]. In such instances, the presence of a cavity can be confirmed by geophysical techniques with the goal of identifying if buried sinkholes overlap with areas of planned development to apply a preventative planning strategy [22]. Through the detection of underground cavities, damage caused by sinkholes can be prevented by refilling of the cavity by material such as sand or gravel [14]. Although the geophysical approaches can identify the presence and geometry of underground cavities, certain limitations associated with these techniques have been described [12,34]. In particular, anomalous features are frequently present on these datasets [22]. Therefore, geophysical surveys are often complemented by cone penetration and percussion borehole investigations, specifically targeting anomalous features identified by geophysical surveys [18]. However, direct observations within cavities are seldom possible due to the lack of knowledge of the location of cavities and their stability. Exploratory drilling campaigns are also expensive and inefficient for overall site characterisation and coverage over large areas [67].
Due to the limitations of in situ and geophysical approaches to collect information for the compilation of sinkhole inventories, remote sensing and earth observation approaches have been considered for the information that can be contributed for sinkhole hazard assessment. Satellite and airborne remote sensing datasets have been found useful for the extraction of information that can contribute to the various stages of sinkhole hazard assessment including the compilation of the sinkhole inventories and the measurements of precursors to sinkhole development. The recent publication frequency of sinkhole investigations (Figure 8) show that there has been increasing interest in the potential of earth observation techniques, and particularly SAR interferometry, for sinkhole hazard studies. These are typically complimented by historical record analysis, available for certain areas, and the various forms of geotechnical investigations.
Remote sensing techniques used to build sinkhole inventories are typically based on either image analysis or topographic model generation. Image analysis is often used successfully but the quality and resolution of the data are important considerations [33]. Aerial imagery is therefore often used, particularly since historical imagery is often available allowing the dating of sinkholes that occurred up to decades ago in some cases [22]. LiDAR is the most accurate remote sensing tool for generating topographic models, and is therefore widely used to detect sinkhole features [45,62]. The main limitation associated with LiDAR for geomorphological analysis is the cost of acquisitions as well as the time required for the acquisition and processing of the data for large areas [123]. The use of SfM algorithms to derive topographic models using UAVs as data acquisition platforms are low cost alternatives. However, their small footprints limits their use to site specific investigations and their use would be limited for regional or large scale investigations. To overcome this limitation, the recently released high-resolution WorldDEM DEM should be considered [75].
A fundamental limitation to remote sensing approaches for compiling sinkhole inventories is that the geomorphic signature of sinkholes may be masked by the transformation of the terrain due to erosion, sedimentation or anthropogenic fills or construction [22,31]. In such cases geophysical investigations, interviews with inhabitants or historical reports is required to complete sinkhole inventories [22]. It is furthermore recognized that classifying sinkhole features (on imagery or elevation models) is typically done manually, and is an intensive process with accuracy and reproducibility limitations [63,65,71,77]. There is therefore a need to investigate automated extraction techniques, with one of the promising growing fields of research being artificial neural networks [78].
The detection of precursors to sinkhole development mainly relies on the use of SAR interferometry approaches. However, the success of these approaches are dependent on both SAR system and processing parameters as well as surface characteristics [20]. From a SAR system and processing perspective, the resolution of the SAR system is particularly important due to the small-scale of sinkhole events compared to other geological hazards [76] making deformation signals indistinguishable from system noise [20,76]. For this reason, most successful studies on precursor detection have focused on sinkholes in evaporite terrain which tend to be larger in scale than sinkholes in dolomitic terrain [5,6]. Although deformation of single point targets can be measured using interferogram stacking approaches, the absence of coherent targets in vegetated regions may be problematic [16,20,40,107,120,121,124]. However, in cases it has been argued that the rural and vegetated areas are generally associated with limited human population and infrastructure and therefore is not deemed to be a priority for analysis [105]. Despite the relative success achieved in the monitoring of sinkhole-related deformation using interferometric techniques, a large portion of known active sinkholes and subsidence features remained unobserved. The non-detections and main limitations of InSAR approaches were attributed to factors including: (1) the resolution of the sensor being too low relative to the size of the feature [20,97], (2) subsidence rates were either too high or too low for the detection by the sensor employed [20,97], (3) water accumulation in shallow depressions inducing soil moisture changes leading to a loss of coherence [97], (4) decorrelation in vegetated areas, including irrigated agriculture [16,97] and 5) the revisit time of some satellites have been identified as potentially problematic depending on the time-interval between the expression of the precursor and the ultimate collapse [16,26].
The considerations of the geophysical characteristics of the sinkhole and the land surface places limitations due to the nature of the precursors themselves. It was noted that, in some instances, precursors may not be present at all [4,20]. This may be due to competent roof strata or landcover that is resistant to gradual deformation and prone to sudden failure. In fact, it has been proposed that the surface above a void can be stable for a considerable amount of time since it can be supported by near-surface competent materials such as ferricrete, or man-made materials (concrete, asphalt etc.) [8]. In these cases, the presence of such materials may affect the potential for precursory deformation to be expressed [20]. However, in another case, it was thought that a tar road acted like a plastic surface that promoted the detection of deformation in the order of a couple of cm prior to failure [26]. These examples highlight the effect of surface cover on the ability to detect sinkhole-induced surface deformation. The land surface conditions also place considerations on the SAR line-of-sight (LOS). Specifically, the side-looking geometry of SAR sensors mean that it is possible that the visibility of subsidence features would be blocked by structures on the ground in the SAR’s LOS [20].
The successful detections of precursory deformation using SAR interferometry approaches highlights the potential for the development of sinkhole early warning systems based on InSAR techniques. Most notably, in several cases, surface deformation features could be observed for days and up to years before the collapse. Furthermore, it was observed that the precursory deformation features were frequently larger than the eventual sinkhole [5,26]. This is an important consideration since it points to small-scale sinkholes being detectable by precursory basins larger than they are. The successful investigations further suggest that a particular strength of InSAR measurements include: (1) providing a quantitative assessment of ground movements in sinkhole prone areas, (2) assisting with the identification of stable areas, (3) analysing the impacts of specific events (i.e., water table changes, cumulative rainfall events, leaking water bearing services etc.) on deformation rates, and (4) the detection of precursory deformation for early warning of potential catastrophic events [22].
6. Concluding Remarks
Due to the consequences of sinkhole development, there is a need for the quantitative determination of sinkhole probability, hazard, risk and vulnerability in sinkhole-prone regions worldwide [7,112]. Sinkhole hazard assessments specifically aim to predict the spatial and temporal distribution of future sinkholes [37]. This probability of occurrence is usually informed by the analysis of past events, recorded in a sinkhole inventory, and the local conditions affecting sinkhole formation and collapse. The accuracy of the inventory on which sinkhole hazard assessments are based governs the accuracy of the derived hazard maps. Previous and ongoing research show that remote sensing is actively being used to improve and accelerate the process of sinkhole inventory compilation. However, there is a need to standardise the recordings of specific event datasets after every sinkhole occurrence. The information should include event occurrence date, morphometric properties (size, depth), land surface conditions and triggering factors. This information is critical for area-specific sinkhole hazard assessments and the quantitative assessment of sinkhole risk.
Furthermore, recent research is providing evidence that detecting precursory deformation prior to sinkhole formation could contribute to sinkhole hazard assessment by providing frequent ground stability reports for sinkhole early warnings. There has been very little focus on the geotechnical evidence of precursors, despite their value as early warning signs [24,35]. The consequent lack of knowledge regarding the physical nature of sinkhole precursors prevents the generation of an accurate model of their spatial and temporal evolution [21,125]. Prior knowledge about precursory deformation that can be expected under local conditions, particularly the rate, magnitude and scale, would be valuable for positively identifying precursors in DInSAR data sets. This information will be especially valuable for time series processing techniques which often require assumptions of deformation behaviour [126]. Despite this knowledge gap, the work on InSAR data for mapping precursory deformation prior to sinkhole development shows that DInSAR is a valuable tool in improving our understanding of sinkhole precursors. The work further suggests that DInSAR data collected operationally could, in cases, identify sinkhole development before surface collapse, thereby decreasing the risk to infrastructure and human lives and reduce the cost of maintenance by enabling proactive remedial work [5,6,20,34,105].
Author Contributions
J.E. conceived the paper. A.T. and J.E. wrote the paper.
Funding
This research was funded by the CSIR Meraka Institute project number KC8ISLI.
Acknowledgments
The authors would like to thank the editors and the 4 anonymous reviewers for their valuable feedback and constructive comments. We also thank Michael van Schoor from the CSIR for providing the GPR and ERT sample datasets. The research was supported by the Council for Scientific and Industrial Research (CSIR), Meraka Institute.
Conflicts of Interest
The authors declare no conflict of interest.
References
- Buttrick, D.B.; Trollip, N.Y.G.; Watermeyer, R.B.; Pieterse, N.D.; Gerber, A.A. A performance based approach to dolomite risk management. Environ. Earth Sci. 2011, 64, 1127–1138. [Google Scholar] [CrossRef]
- Calo, F.; Fornaro, G.; Parise, M.; Zeni, G. The SBAS-DINSAR approach for the spatial and temporal analysis of sinkhole phenomena. Proc. Fringe 2011. [Google Scholar] [CrossRef]
- De Waele, J.; Gutiérrez, F.; Parise, M.; Plan, L. Geomorphology and natural hazards in karst areas: A review. Geomorphology 2011, 134, 1–8. [Google Scholar] [CrossRef]
- Paine, J.G.; Buckley, S.M.; Collins, E.W.; Wilson, C.R. Assessing collapse risk in evaporite sinkhole-prone areas using microgravimetry and Radar Interferometry. J. Environ. Eng. Geophys. 2012, 17, 75–87. [Google Scholar] [CrossRef]
- Jones, C.E.; Blom, R.G. Bayou Corne, Louisiana, sinkhole: Precursory deformation measured by radar interferometry. Geology 2014, 42, 111–114. [Google Scholar] [CrossRef]
- Nof, R.N.; Baer, G.; Ziv, A.; Raz, E.; Atzori, S.; Salvi, S. Sinkhole precursors along the Dead Sea, Israel, revealed by SAR interferometry. Geology 2013, 41, 1019–1022. [Google Scholar] [CrossRef]
- Parise, M.; Closson, D.; Gutiérrez, F.; Stevanović, Z. Anticipating and managing engineering problems in the complex karst environment. Environ. Earth Sci. 2015, 74, 7823–7835. [Google Scholar] [CrossRef]
- Oosthuizen, A.C.; Richardson, S. Sinkholes and subsidence in South Africa. Counc. Geosci. Rep. 2011, 27, 1–31. [Google Scholar]
- Zhou, W.; Beck, B.F. Management and mitigation of sinkholes on karst lands: An overview of practical applications. Environ. Geol. 2008, 55, 837–851. [Google Scholar] [CrossRef]
- Joyce, K.E.; Wright, K.C.; Samsonov, S.V.; Ambriosa, V.G. Remote sensing and the disaster management cycle. In Advances in Geoscience and Remote Sensing; Jedlovec, G., Ed.; InTech: London, UK, 2009; pp. 317–346. ISBN 978-953-307-005-6. [Google Scholar]
- Gutiérrez, F.; Parise, M.; De Waele, J.; Jourde, H. A review on natural and human-induced geohazards and impacts in karst. Earth-Sci. Rev. 2014, 138, 61–88. [Google Scholar] [CrossRef]
- Gutiérrez, F.; Cooper, A.H.; Johnson, K.S. Identification, prediction, and mitigation of sinkhole hazards in evaporite karst areas. Environ. Geol. 2008, 53, 1007–1022. [Google Scholar] [CrossRef] [Green Version]
- Richardson, S. Sinkhole and Subsidence Record in the Chuniespoort Group Dolomite, Gauteng, South Africa. University of Pretoria: Pretoria, South Africa, 2013. [Google Scholar]
- Van Den Eeckhaut, M.; Poesen, J.; Dusar, M.; Martens, V.; Duchateau, P. Sinkhole formation above underground limestone quarries: A case study in South Limburg (Belgium). Geomorphology 2007, 91, 19–37. [Google Scholar] [CrossRef]
- Galve, J.P.; Gutiérrez, F.; Remondo, J.; Bonachea, J.; Lucha, P.; Cendrero, A. Evaluating and comparing methods of sinkhole susceptibility mapping in the Ebro Valley evaporite karst (NE Spain). Geomorphology 2009, 111, 160–172. [Google Scholar] [CrossRef]
- Tomás, R.; Romero, R.; Mulas, J.; Marturià, J.J.; Mallorquí, J.J.; Lopez-Sanchez, J.M.; Herrera, G.; Gutiérrez, F.; González, P.J.; Fernández, J.; et al. Radar interferometry techniques for the study of ground subsidence phenomena: A review of practical issues through cases in Spain. Environ. Earth Sci. 2014, 71, 163–181. [Google Scholar] [CrossRef] [Green Version]
- Youssef, A.M.; Al-Harbi, H.M.; Gutiérrez, F.; Zabramwi, Y.A.; Bulkhi, A.B.; Zahrani, S.A.; Bahamil, A.M.; Zahrani, A.J.; Otaibi, Z.A.; El-Haddad, B.A. Natural and human-induced sinkhole hazards in Saudi Arabia: Distribution, investigation, causes and impacts. Hydrogeol. J. 2015, 24, 625–644. [Google Scholar] [CrossRef]
- Gutiérrez, F.; Guerrero, J.; Lucha, P. Quantitative sinkhole hazard assessment. A case study from the Ebro Valley evaporite alluvial karst (NE Spain). Nat. Hazards 2008, 45, 211–233. [Google Scholar] [CrossRef]
- Theron, A.; Engelbrecht, J.; Kemp, J.; Kleynhans, W.; Turnbull, T. Detection of sinkhole precursors through SAR interferometry: First results from South Africa. In Proceedings of the IEEE International Geoscience and Remote Sensing Symposium, Beijing, China, 10–15 July 2016; pp. 5398–5401. [Google Scholar]
- Theron, A.; Engelbrecht, J.; Kemp, J.; Kleynhans, W.; Turnbull, T. Detection of Sinkhole Precursors through SAR Interferometry: Radar and Geological Considerations. IEEE Geosci. Remote Sens. Lett. 2017, 14, 871–875. [Google Scholar] [CrossRef]
- Vaccari, A.; Stuecheli, M.; Bruckno, B.; Hoppe, E.; Acton, S.T. Detection of geophysical features in InSAR point cloud data sets using spatiotemporal models. Int. J. Remote Sens. 2013, 34, 8215–8234. [Google Scholar] [CrossRef]
- Gutiérrez, F.; Galve, J.P.; Lucha, P.; Castañeda, C.; Bonachea, J.; Guerrero, J. Integrating geomorphological mapping, trenching, InSAR and GPR for the identification and characterization of sinkholes: A review and application in the mantled evaporite karst of the Ebro Valley (NE Spain). Geomorphology 2011, 134, 144–156. [Google Scholar] [CrossRef] [Green Version]
- Yilmaz, I.; Marschalko, M.; Bednarik, M. Gypsum collapse hazards and importance of hazard mapping. Carbonates Evaporites 2011, 26, 193–209. [Google Scholar] [CrossRef]
- Parise, M.; Lollino, P. A preliminary analysis of failure mechanisms in karst and man-made underground caves in Southern Italy. Geomorphology 2011, 134, 132–143. [Google Scholar] [CrossRef]
- Batayneh, A.T.; Abueladas, A.A.; Moumani, K.A. Use of ground-penetrating radar for assessment of potential sinkhole conditions: An example from Ghor al Haditha area, Jordan. Environ. Geol. 2002, 41, 977–983. [Google Scholar] [CrossRef]
- Intrieri, E.; Gigli, G.; Nocentini, M.; Lombardi, L.; Mugnai, F.; Fidolini, F.; Casagli, N. Sinkhole monitoring and early warning: An experimental and successful GB-InSAR application. Geomorphology 2015, 241, 304–314. [Google Scholar] [CrossRef] [Green Version]
- Closson, D.; Karaki, N.A.; Klinger, Y.; Hussein, M.J. Subsidence and sinkhole hazard assessment in the Southern Dead Sea area, Jordan. Pure Appl. Geophys. 2005, 162, 221–248. [Google Scholar] [CrossRef]
- Raspini, F.; Bianchini, S.; Ciampalini, A.; Del Soldato, M.; Solari, L.; Novali, F.; Del Conte, S.; Rucci, A.; Ferretti, A.; Casagli, N. Continuous, semi-automatic monitoring of ground deformation using Sentinel-1 satellites. Sci. Rep. 2018. [Google Scholar] [CrossRef] [PubMed]
- Trollip, N.Y.G. The Geology of an Area South of Pretoria with Specific Reference to Dolomite Stability. Master’s Thesis, University of Pretoria, Pretoria, South Africa, 2006. [Google Scholar]
- Frumkin, A.; Ezersky, M.; Al-Zoubi, A.; Akkawi, E.; Abueladas, A.R. The Dead Sea sinkhole hazard: Geophysical assessment of salt dissolution and collapse. Geomorphology 2011, 134, 102–117. [Google Scholar] [CrossRef]
- Kaufmann, O.; Quinif, Y. Geohazard map of cover-collapse sinkholes in the “Tournaisis” area, southern Belgium. Eng. Geol. 2002, 65, 117–124. [Google Scholar] [CrossRef]
- Momubaghan, G.A. Geotechnical Investigations for the Gautrain Mass Transit Rapid Link over Dolomite Bedrock in the Centurion Area. Master’s Thesis, University of Pretoria, Pretoria, South Africa, 2012. [Google Scholar]
- Larry, D.; Seale, J. Creation, Analysis, and Evaluation of Remote Sensing Sinkhole Databases for Florida. Master’s Thesis, University of South Florida, Tampa, FL, USA, 2005. [Google Scholar]
- Chang, L.; Hanssen, R.F. Detection of cavity migration and sinkhole risk using radar interferometric time series. Remote Sens. Environ. 2014, 147, 56–64. [Google Scholar] [CrossRef]
- Szwedzicki, T. Geotechnical precursors to large-scale ground collapse in mines. Int. J. Rock Mech. Min. Sci. 2001, 38, 957–965. [Google Scholar] [CrossRef]
- Yechieli, Y.; Abelson, M.; Baer, G. Sinkhole formation and subsidence along the Dead Sea coast, Israel. Hydrogeol. J. 2015, 601–612. [Google Scholar] [CrossRef]
- Galve, J.P.; Gutiérrez, F.; Lucha, P.; Guerrero, J.; Bonachea, J.; Remondo, J.; Cendrero, A. Probabilistic sinkhole modelling for hazard assessment. Earth Surf. Process. Landf. 2009, 34, 437–452. [Google Scholar] [CrossRef]
- Gao, Y.; Alexander, E.C. Sinkhole hazard assessment in Minnesota using a decision tree model. Environ. Geol. 2008, 54, 945–956. [Google Scholar] [CrossRef]
- Galve, J.P.; Remondo, J.; Gutiérrez, F. Improving sinkhole hazard models incorporating magnitude-frequency relationships and nearest neighbor analysis. Geomorphology 2011, 134, 157–170. [Google Scholar] [CrossRef]
- Engelbrecht, J. Parameters Affecting Interferometric Coherence and Implications for Long-term Operational Monitoring of Mining-induced Surface Deformation; University of Cape Town: Cape Town, South Africa, 2013; pp. 1–171. [Google Scholar]
- Engelbrecht, J.; Inggs, M.R.; Makusha, G. Detection and monitoring of surface subsidence associated with mining activities in the Witbank Coalfields, South Africa, using differential radar interferometry. S. Afr. J. Geol. 2011, 114, 77–94. [Google Scholar] [CrossRef]
- Engelbrecht, J.; Musekiwa, C.; Kemp, J.; Inggs, M.R. Parameters affecting interferometric coherence-the case of a dynamic agricultural region. IEEE Trans. Geosci. Remote Sens. 2014, 52, 1572–1582. [Google Scholar] [CrossRef]
- Engelbrecht, J.; Inggs, M. Recommendations for long-term operational dinsar monitoring of mining-induced deformation in a dynamic agricultural region. In Proceedings of the IEEE International Geoscience and Remote Sensing Symposium, Melbourne, Australia, 21–26 July 2013; pp. 2912–2915. [Google Scholar]
- Gillespie, T.W.; Chu, J.; Thomas, D. Assessment and prediction of natural hazards from satellite imagery. Prog. Phys. Geogr. 2007, 31, 459–470. [Google Scholar] [CrossRef] [PubMed] [Green Version]
- Calvo, A.B.; Gutiérrez, F. 4D Monitoring of Active Sinkholes with a Terrestrial Laser Scanner (TLS): A Case Study in the Evaporite Karst of the Ebro Valley, NE Spain. Remote Sens. 2018. [Google Scholar] [CrossRef]
- Joyce, K.E.; Belliss, S.E.; Sergey, V.; McNeill, S.J.; Glassey, P.J.; Samsonov, S.V.; McNeill, S.J.; Glassey, P.J. A review of the status of satellite remote sensing and image processing techniques for mapping natural hazards and disasters. Prog. Phys. Geogr. 2009, 33, 183–207. [Google Scholar] [CrossRef]
- SafeLand D4.4. Guidelines for the Selection of Appropriate Remote Sensing Technologies for Monitoring Different Types of Landslides. Available online: https://www.ngi.no/download/file/6014 (accessed on 2 August 2018).
- Salvati, R.; Sasowsky, I.D. Development of collapse sinkholes in areas of groundwater discharge. J. Hydrol. 2002, 264, 1–11. [Google Scholar] [CrossRef]
- Alfarrah, N.; Berhane, G.; Hweesh, A.; Walraevens, K. Sinkholes Due to Groundwater Withdrawal in Tazerbo Wellfield, SE Libya. Groundwater 2017. [Google Scholar] [CrossRef] [PubMed]
- Hadjimitsis, D.G.; Agapiou, A.; Themistocleous, K.; Alexakis, D.D.; Toulios, G.; Perdikou, S.; Sarris, A.; Toulios, L.; Clayton, C. Detection of Water Pipes and Leakages in Rural Water Supply Networks Using Remote Sensing Techniques. In Remote Sensing of Environment: Integrated Approaches; InTech: London, UK, 2011. [Google Scholar]
- Agapiou, A.; Alexakis, D.D.; Themistocleous, K.; Hadjimitsis, G. Water leakage detection using remote sensing, field spectroscopy and GIS in semiarid areas of Cyprus. Urban Water J. 2016, 13, 221–231. [Google Scholar] [CrossRef]
- Zanganeh, R.; Mojaradi, B.; Jabbari, E. Leak Detection from the Buried Water Transmission Pipeline Using Landsat 8 Satellite Images (Case Study of the Kosar Water Transmission Pipeline). In Proceedings of the International Conference on Civil Engineering, Tehran, Iran, 8–10 May 2016. [Google Scholar]
- Castellazzi, P.; Longuevergne, L.; Martel, R.; Rivera, A.; Brouard, C.; Chaussard, E. Remote Sensing of Environment Quantitative mapping of groundwater depletion at the water management scale using a combined GRACE/InSAR approach. Remote Sens. Environ. 2018, 205, 408–418. [Google Scholar] [CrossRef]
- Chaussard, E.; Milillo, P.; Burgmann, R.; Perissin, D.; Fielding, E.J.; Baker, B. Remote sensing of ground deformation for monitoring groundwater management practices: Application to the Santa Clara Valley during the 2012–2015 California drought. J. Geophys. Res. B Solid Earth 2017. [Google Scholar] [CrossRef]
- Amos, C.B.; Audet, P.; Hammond, W.C.; Bürgmann, R.; Johanson, I.A.; Blewitt, G. Uplift and seismicity driven by groundwater depletion in central California. Nature 2014, 509, 483–486. [Google Scholar] [CrossRef] [PubMed]
- Carbonel, D.; Rodríguez, V.; Gutiérrez, F.; Mccalpin, J.P.; Linares, R.; Roqué, C.; Zarroca, M.; Guerrero, J.; Sasowsky, I. Evaluation of trenching, ground penetrating radar (GPR) and electrical resistivity tomography (ERT) for sinkhole characterization. Earth Surf. Process. Landf. 2014, 39, 214–227. [Google Scholar] [CrossRef]
- Billi, A.; De Filippis, L.; Poncia, P.P.; Sella, P.; Faccenna, C. Hidden sinkholes and karst cavities in the travertine plateau of a highly-populated geothermal seismic territory (Tivoli, central Italy). Geomorphology 2016, 255, 63–80. [Google Scholar] [CrossRef]
- Van Schoor, M. Detection of sinkholes using 2D electrical resistivity imaging. J. Appl. Geophys. 2002, 50, 393–399. [Google Scholar] [CrossRef] [Green Version]
- Van Schoor, M. Detecting and monitoring of geological hazards with geophysics. PositionIT 2013, 8, 16–19. [Google Scholar]
- Joyce, K.E.; Samsonov, S.V.; Levick, S.R.; Engelbrecht, J.; Belliss, S. Mapping and monitoring geological hazards using optical, LiDAR, and synthetic aperture RADAR image data. Nat. Hazards 2014, 73, 137–163. [Google Scholar] [CrossRef]
- Tralli, D.M.; Blom, R.G.; Zlotnicki, V.; Donnellan, A.; Evans, D.L. Satellite remote sensing of earthquake, volcano, flood, landslide and coastal inundation hazards. ISPRS J. Photogramm. Remote Sens. 2005, 59, 185–198. [Google Scholar] [CrossRef]
- Filin, S.; Baruch, A.; Morik, S.; Avni, Y.; Marco, S. Use of airborne laser scanning to characterise land degradation processes—The Dead Sea as a case study. Surv. Rev. 2012, 44, 84–90. [Google Scholar] [CrossRef]
- Suh, J.; Choi, Y. Mapping hazardous mining-induced sinkhole subsidence using unmanned aerial vehicle (drone) photogrammetry. Environ. Earth Sci. 2017, 76. [Google Scholar] [CrossRef]
- Filin, S.; Avni, Y.; Baruch, A.; Morik, S.; Arav, R.; Marco, S. Characterization of land degradation along the receding Dead Sea coastal zone using airborne laser scanning. Geomorphology 2014, 206, 403–420. [Google Scholar] [CrossRef]
- Wu, Q.; Deng, C.; Chen, Z. Automated delineation of karst sinkholes from LiDAR-derived digital elevation models. Geomorphology 2016, 266, 1–10. [Google Scholar] [CrossRef]
- Gutiérrez, F.; Galve, J.P.; Guerrero, J.; Lucha, P.; Cendrero, A.; Remondo, J.; Bonachea, J.; Gutiérrez, M.; Sánchez, J.A. The origin, typology, spatial distribution and detrimental effects of the sinkholes developed in the alluvial evaporite karst of the Ebro River valley downstream of Zaragoza city (NE Spain) F. Earth Surf. Process. Landf. 2009, 34, 155–161. [Google Scholar] [CrossRef]
- Rucker, M.L.; Hulburt, S.; Edwards, M.D. Reconnaissance evaluation of a potential future sinkhole using integrated simple surface geophysics and surface monitoring points. In Proceedings of the Sinkhole Conference, Carlsbad, NM, USA, 5–10 May 2013; pp. 221–230. [Google Scholar]
- Lee, E.J.; Shin, S.Y.; Ko, B.C.; Chang, C. Early sinkhole detection using a drone-based thermal camera and image processing. Infrared Phys. Technol. 2016, 78, 223–232. [Google Scholar] [CrossRef]
- Zhu, J.; Taylor, T.P.; Currens, J.C.; Studies, K. Improved Karst Sinkhole Mapping in Kentucky Using Lidar Techniques: A Pilot Study in Floyds Fork Watershed. J. Cave Karst Stud. 2014, 207–216. [Google Scholar] [CrossRef]
- San, B.T.; Suzen, M.L. Digital elevation model (DEM) generation and accuracy assessment from ASTER stereo data. Int. J. Remote Sens. 2011, 1161. [Google Scholar] [CrossRef]
- Clapuyt, F.; Vanacker, V.; Van Oost, K. Reproducibility of UAV-based earth topography reconstructions based on Structure-from-Motion algorithms. Geomorphology 2016, 260, 4–15. [Google Scholar] [CrossRef]
- Crippen, R.; Buckley, S.; Agram, P.; Belz, E.; Gurrola, E.; Hensley, S.; Kobrick, M.; Lavalle, M.; Martin, J.; Neumann, M.; et al. Nasadem global elevation model: Methods and progress. Int. Arch. Photogramm. Remote Sens. Spat. Inf. Sci. 2016, 41, 125–128. [Google Scholar] [CrossRef]
- Krieger, G.; Zink, M.; Bachmann, M.; Bräutigam, B.; Schulze, D.; Martone, M.; Rizzoli, P.; Steinbrecher, U.; Walter Antony, J.; De Zan, F.; et al. TanDEM-X: A radar interferometer with two formation-flying satellites. Acta Astronaut. 2013, 89, 83–98. [Google Scholar] [CrossRef]
- Athmania, D.; Achour, H. External Validation of the ASTER GDEM2, GMTED2010 and CGIAR-CSI- SRTM v4.1 Free Access Digital Elevation Models (DEMs) in Tunisia and Algeria. Remote Sens. 2014, 6, 4600–4620. [Google Scholar] [CrossRef] [Green Version]
- Riegler, G.; Hennig, S.D.; Weber, M. Worlddem—A Novel Global Foundation Layer. In Proceedings of the ISPRS Conference, Munich, Germany, 25–27 March 2015; pp. 25–27. [Google Scholar]
- Kim, J.W.; Lu, Z.; Degrandpre, K. Ongoing deformation of sinkholes in wink, texas, observed by time-series sentinel-1A SAR interferometry (preliminary results). Remote Sens. 2016, 8, 313. [Google Scholar] [CrossRef]
- Dou, J.; Li, X.; Yunus, A.P.; Paudel, U.; Chang, K.T.; Zhu, Z.; Pourghasemi, H.R. Automatic detection of sinkhole collapses at finer resolutions using a multi-component remote sensing approach. Nat. Hazards 2015, 78, 1021–1044. [Google Scholar] [CrossRef]
- Schwegman, C.; Kleynhans, W.; Englebrecht, W.; Mdakane, L.; Meyer, R.G. Subsidence feature discrimination using deep convolutional neural network in synthetic aperture radar imagery. In Proceedings of the 2017 IEEE International Geoscience and Remote Sensing Symposium, Fort Worth, TX, USA, 23–28 July 2017. [Google Scholar]
- Parchkoohi, M.H.; Farajkhah, N.K.; Delshad, M.S. Automatic detection of karstic sinkholes in seismic 3D images using circular Hough transform. J. Geophys. Eng. 2015, 12, 764–769. [Google Scholar] [CrossRef]
- Stuecheli, M.; Vaccari, A.; Acton, S.T. Graph cut segmentation of sparsely sampled images with application to InSAR-measured changes in elevation. In Proceedings of the 2012 IEEE Southwest Symposium on Image Analysis and Interpretation, Santa Fe, NM, USA, 22–24 April 2012; pp. 149–152. [Google Scholar]
- Colesanti, C.; Le Mouelic, S.; Bennani, M.; Raucoules, D.; Carnec, C.; Ferretti, A. Detection of mining related ground instabilities using the permanent scatterers technique—A case study in the east of France. Int. J. Remote Sens. 2005, 26, 201–207. [Google Scholar] [CrossRef]
- Klein, E.; Contrucci, I.; Daupley, X.; Hernandez, O.; Nadim, C.; Cauvin, L.; Pirson, M.; Klein, E.; Contrucci, I.; Daupley, X.; et al. Evolution monitoring of a solution-mining cavern in salt: Identifying and analysing early-warning signals prior to collapse. In Proceedings of the Solution Mining Research Institute’s Technical Conference, Austin, TX, USA, 5–9 October 2008; pp. 2–12. [Google Scholar]
- Engelbrecht, J.; Inggs, M.R. Differential Interferometry techniques on L-Band data employed for the monitoring of surface subsidence due to mining. S. Afr. J. Geomat. 2013, 2, 82–93. [Google Scholar]
- Engelbrecht, J.; Inggs, M.R. Detection and monitoring of surface subsidence associated with miniing activities in the Witbank coalfields, South Africa, using differential radar interferometry. In Proceedings of the IEEE International Geoscience and Remote Sensing Symposium, Vancouver, BC, Canada, 24–29 July 2011; pp. 1596–1599. [Google Scholar]
- Baer, G.; Schattner, U.; Wachs, D.; Sandwell, D.; Wdowinski, S.; Frydman, S. The lowest place on Earth is subsiding—An InSAR (interferometric synthetic aperture radar) perspective. Geol. Soc. Am. Bull. 2002, 114, 12–23. [Google Scholar] [CrossRef]
- Tomás, R.; Márquez, Y.; Lopez-Sanchez, J.M.; Delgado, J.; Blanco, P.; Mallorquí, J.J.; Martínez, M.; Herrera, G.; Mulas, J. Mapping ground subsidence induced by aquifer overexploitation using advanced Differential SAR Interferometry: Vega Media of the Segura River (SE Spain) case study. Remote Sens. Environ. 2005, 98, 269–283. [Google Scholar] [CrossRef]
- Heleno, S.I.N.; Oliveira, L.G.S.; Henriques, M.J.; Falcão, A.P.; Lima, J.N.P.; Cooksley, G.; Ferretti, A.; Fonseca, A.M.; Lobo-Ferreira, J.P.; Fonseca, J.F.B.D. Persistent Scatterers Interferometry detects and measures ground subsidence in Lisbon. Remote Sens. Environ. 2011, 115, 2152–2167. [Google Scholar] [CrossRef]
- Rosi, A.; Agostini, A.; Tofani, V.; Casagli, N. A Procedure to map subsidence at the regional scale using the persistent scatterer interferometry (PSI) technique. Remote Sens. 2014, 6, 10510–10522. [Google Scholar] [CrossRef]
- Rosi, A.; Tofani, V.; Agostini, A.; Tanteri, L.; Tacconi Stefanelli, C.; Catani, F.; Casagli, N. Subsidence mapping at regional scale using persistent scatters interferometry (PSI): The case of Tuscany region (Italy). Int. J. Appl. Earth Obs. Geoinf. 2016, 52, 328–337. [Google Scholar] [CrossRef]
- Peltier, A.; Bianchi, M.; Kaminski, E.; Komorowski, J.C.; Rucci, A.; Staudacher, T. PSInSAR as a new tool to monitor pre-eruptive volcano ground deformation: Validation using GPS measurements on Piton de La Fournaise. Geophys. Res. Lett. 2010, 37, 1–5. [Google Scholar] [CrossRef]
- Colesanti, C.; Wasowski, J. Investigating landslides with space-borne Synthetic Aperture Radar (SAR) interferometry. Eng. Geol. 2006, 88, 173–199. [Google Scholar] [CrossRef]
- Terwel, K.; Hanssen, R.F. Predicting structural disasters with Radar interferometry. In Proceedings of the IABSE Conference, Geneva, Switzerland, 23–25 September 2015; pp. 824–831. [Google Scholar]
- Zhou, X.; Chang, N.; Li, S. Applications of SAR Interferometry in Earth and Environmental Science Research. Sensors 2009, 9, 1876–1912. [Google Scholar] [CrossRef] [PubMed] [Green Version]
- Ferretti, A.; Colombo, D.; Fumagalli, A.; Novali, F.; Rucci, A. InSAR data for monitoring land subsidence: Time to think big. Proc. Int. Assoc. Hydrol. Sci. 2015, 92, 1–4. [Google Scholar] [CrossRef]
- Sansosti, E.; Berardino, P.; Bonano, M.; Calò, F.; Castaldo, R.; Casu, F.; Manunta, M.; Manzo, M.; Pepe, A.; Pepe, S.; et al. How second generation SAR systems are impacting the analysis of ground deformation. Int. J. Appl. Earth Obs. Geoinf. 2014, 28, 1–11. [Google Scholar] [CrossRef]
- Herrera, G.; Tomás, R.; Monells, D.; Centolanza, G.; Mallorquí, J.J.; Vicente, F.; Navarro, V.D.; Lopez-Sanchez, J.M.; Sanabria, M.; Cano, M.; et al. Analysis of subsidence using TerraSAR-X data: Murcia case study. Eng. Geol. 2010, 116, 284–295. [Google Scholar] [CrossRef]
- Castañeda, C.; Gutiérrez, F.; Manunta, M.; Galve, J.P. DInSAR measurements of ground deformation by sinkholes, mining subsidence, and landslides, Ebro River, Spain. Earth Surf. Process. Landf. 2009, 34, 1562–1574. [Google Scholar] [CrossRef] [Green Version]
- Przylucka, M.; Herrera, G.; Graniczny, M.; Colombo, D.; Bejar-Pizarro, M. Combination of conventional and advanced DInSAR to monitor very fast mining subsidence with TerraSAR-X data: Bytom City (Poland). Remote Sens. 2015, 7, 5300–5328. [Google Scholar] [CrossRef]
- Engelbrecht, J.; Inggs, M.R. Coherence Optimization and Its Limitations for Deformation Monitoring in Dynamic Agricultural Environments. IEEE J. Sel. Top. Appl. Earth Obs. Remote Sens. 2016, 9, 5647–5654. [Google Scholar] [CrossRef]
- Herrera, G.; Tomás, R.; Lopez-Sanchez, J.M.; Delgado, J.; Mallorqui, J.J.; Duque, S.; Mulas, J. Advanced DInSAR analysis on mining areas: La Union case study (Murcia, SE Spain). Eng. Geol. 2007, 90, 148–159. [Google Scholar] [CrossRef] [Green Version]
- Xie, M.; Huang, J.; Wang, L.; Huang, J.; Wang, Z. Early landslide detection based on D-InSAR technique at the Wudongde hydropower reservoir. Environ. Earth Sci. 2016, 75. [Google Scholar] [CrossRef]
- Barra, A.; Monserrat, O.; Mazzanti, P.; Esposito, C.; Crosetto, M.; Scarascia Mugnozza, G. First insights on the potential of Sentinel-1 for landslides detection. Geomat. Nat. Hazards Risk 2016, 5705, 1–10. [Google Scholar] [CrossRef]
- Rosi, A.; Tofani, V.; Tanteri, L.; Tacconi Stefanelli, C.; Agostini, A.; Catani, F.; Casagli, N. The new landslide inventory of Tuscany (Italy) updated with PS-InSAR: Geomorphological features and landslide distribution. Landslides 2018, 15, 5–19. [Google Scholar] [CrossRef]
- Tomás, R.; Herrera, G.; Delgado, J.; Lopez-Sanchez, J.M.; Mallorquí, J.J.; Mulas, J. A ground subsidence study based on DInSAR data: Calibration of soil parameters and subsidence prediction in Murcia City (Spain). Eng. Geol. 2010, 111, 19–30. [Google Scholar] [CrossRef]
- Bruckno, B.; Vaccari, A.; Hoppe, E.; Niemann, W.; Campbell, E. Validation of Interferometric Synthetic Aperture Radar as a tool for identification of geohazards and at-risk transportation infrastructure. In Proceedings of the 63nd Highway Geology Symposium, Redding, CA, USA, 7–10 May 2013; pp. 1–19. [Google Scholar]
- Parise, M.; Pisano, L.; Vennari, C. Sinkhole occurrence in consequence of heavy rainstorms. Geophys. Res. Abstr. 2015, 18, 2013–2014. [Google Scholar] [CrossRef]
- Ozden, A.; Faghri, A.; Li, M.; Tabrizi, K. Evaluation of Synthetic Aperture Radar Satellite Remote Sensing for Pavement and Infrastructure Monitoring. Procedia Eng. 2016, 145, 752–759. [Google Scholar] [CrossRef]
- Massonnet, D.; Feigl, K.L. Radar interferometry and its application to changes in the Earth’s surface. Rev. Geophys. 1998, 36. [Google Scholar] [CrossRef]
- Closson, D.; Karaki, N.A.; Milisavljevic, N.; Hallot, F.; Acheroy, M. Salt-dissolution-induced subsidence in the Dead Sea area detected by applying interferometric techniques to ALOS Palsar Synthetic Aperture Radar images. Geodin. Acta 2010, 23, 65–78. [Google Scholar] [CrossRef] [Green Version]
- Conway, B.; Cook, J. Monitoring evaporite karst activity and land subsidence in the Holbrook Basin, Arizona using interferometric synthetic aperture radar (InSAR). In Proceedings of the Sinkhole Conference, Carlsbad, New Mexico, 5–10 May 2013; pp. 187–194. [Google Scholar]
- Jones, C.E.; Blom, R.G. Pre-event and post-formation ground movement associated with the Bayou Corne sinkhole. In Proceedings of the Sinkhole Conference, Rochester, Minnesota, 5–9 October 2015; pp. 415–422. [Google Scholar]
- Bruckno, B.; Vaccari, A.; Hoppe, E.; Acton, S.; Campbell, E.; Bruckno, B.S.; Vaccari, A.; Hoppe, E.; Acton, S.T.; Campbell, E. Integration and delivery of interferometric Synthetic Aperture Radar [InSAR] data into stormwater planning within karst terranes. In Proceedings of the Sinkhole Conference, Rochester, Minnesota, 5–9 October 2015; pp. 371–380. [Google Scholar]
- Galve, J.P.; Castañeda, C.; Gutiérrez, F. Railway deformation detected by DInSAR over active sinkholes in the Ebro Valley evaporite karst, Spain. Nat. Hazards Earth Syst. Sci. 2015, 15, 2439–2448. [Google Scholar] [CrossRef] [Green Version]
- Atzori, S.; Baer, G.; Antonioli, A.; Salvi, S. InSAR-based modeling and analysis of sinkholes along the Dead Sea coastline. Geophys. Res. Lett. 2015, 42, 8383–8390. [Google Scholar] [CrossRef]
- Prati, C.; Ferretti, A.; Perissin, D. Recent advances on surface ground deformation measurement by means of repeated space-borne SAR observations. J. Geodyn. 2010, 49, 161–170. [Google Scholar] [CrossRef] [Green Version]
- Ferretti, A.; Prati, C.; Rocca, F. Permanent scatterers in SAR interferometry. IEEE Trans. Geosci. Remote Sens. 2001, 39, 8–20. [Google Scholar] [CrossRef] [Green Version]
- Hooper, A.; Zebker, H.; Segall, P.; Kampes, B. A new method for measuring deformation on volcanoes and other natural terrains using InSAR persistent scatterers. Geophys. Res. Lett. 2004, 31, 1–5. [Google Scholar] [CrossRef]
- Ferretti, A.; Fumagalli, A.; Novali, F.; Prati, C.; Rocca, F.; Rucci, A. A new algorithm for processing interferometric data-stacks: SqueeSAR. IEEE Trans. Geosci. Remote Sens. 2011, 49, 3460–3470. [Google Scholar] [CrossRef]
- Raucoules, D.; Bourgine, B.; de Michele, M.; Le Cozannet, G.; Closset, L.; Bremmer, C.; Veldkamp, H.; Tragheim, D.; Bateson, L.; Crosetto, M.; et al. Validation and intercomparison of Persistent Scatterers Interferometry: PSIC4 project results. J. Appl. Geophys. 2009, 68, 335–347. [Google Scholar] [CrossRef]
- Hoppe, E.; Bruckno, B.; Campbell, E.; Acton, S.; Vaccari, A.; Stuecheli, M.; Bohane, A.; Falorni, G.; Morgan, J. Transportation Infrastructure Monitoring Using Satellite Remote Sensing. Mater. Infrastruct. 2016, 1, 185–198. [Google Scholar] [CrossRef]
- Zhang, L.; Lu, Z.; Ding, X.; Jung, H.S.; Feng, G.; Lee, C.W. Mapping ground surface deformation using temporarily coherent point SAR interferometry: Application to Los Angeles Basin. Remote Sens. Environ. 2012, 117, 429–439. [Google Scholar] [CrossRef]
- Zhang, L.; Ding, X.; Lu, Z. Ground settlement monitoring based on temporarily coherent points between two SAR acquisitions. ISPRS J. Photogramm. Remote Sens. 2011, 66, 146–152. [Google Scholar] [CrossRef]
- Guzzetti, F.; Mondini, A.C.; Cardinali, M.; Fiorucci, F.; Santangelo, M.; Chang, K.T. Landslide inventory maps: New tools for an old problem. Earth-Sci. Rev. 2012, 112, 42–66. [Google Scholar] [CrossRef]
- Jia, H.L.; Yu, B.; Zhang, R.; Sang, M.Z. Land Subsidence Detection by PSInSARTM Based on TerraSAR-X Images. Adv. Mater. Res. 2011, 301–303, 641–645. [Google Scholar] [CrossRef]
- Boncori, J.P.M.; Devoti, R.; Visini, F.; Carafa, M.M.C.; Pezzo, G.; Fornaro, G.; Berardino, P.; Atzori, S.; D’Amico, V.; Kastelic, V.; et al. Mid-term review results of the ESA stse pathfinder charming project (constraining seismic hazard models with InSAR and GPS). In Proceedings of the Workshop, Frascati, Italy, 23–27 March 2015. [Google Scholar]
- Bekaert, D.P.S.; Walters, R.J.; Wright, T.J.; Hooper, A.J.; Parker, D.J. Statistical comparison of InSAR tropospheric correction techniques. Remote Sens. Environ. 2015, 170, 40–47. [Google Scholar] [CrossRef]
Figure 1.
A graphic representation of subsidence basin formation. (A) The presence of a cavity near the surface and a triggering mechanism initiates the process of subsurface erosion; (B) The roof strata is not competent enough to support arch formation and leads to gradual sagging; (C) Significant damage to infrastructure can be experienced; (D) An example of a subsidence basin in South Africa.

Figure 2.
A graphic representation of the mechanisms of sinkhole formation. (A) The presence of a sub-surface cavity and a triggering mechanism initiates the process of subsurface erosion; (B) Competent roof strata supports the formation of an arch; (C) Sudden collapse can lead to damage to infrastructure and pose a health and safety risk; (D) An example of a cover collapse sinkhole in South Africa.

Figure 3.
A sinkhole, and associated tension cracks, that resulted in road closure in Gauteng, South Africa in 2018. The sinkhole is in the process of being rehabilitated and has been filled with concrete. (photo credit: Dilnaaz Patel).
Figure 3.
A sinkhole, and associated tension cracks, that resulted in road closure in Gauteng, South Africa in 2018. The sinkhole is in the process of being rehabilitated and has been filled with concrete. (photo credit: Dilnaaz Patel).

Figure 4.
Earth observation techniques have been used worldwide for sinkhole precursor detection (stars) and sinkhole inventory compilation using optical remote sensing (blue triangles), remotely generated terrain models (green triangles) and DInSAR techniques (red triangles).
Figure 4.
Earth observation techniques have been used worldwide for sinkhole precursor detection (stars) and sinkhole inventory compilation using optical remote sensing (blue triangles), remotely generated terrain models (green triangles) and DInSAR techniques (red triangles).

Figure 5.
Radargram indicating a potential water-filled feature beneath a car-park in South Africa (with permission from [59]).
Figure 5.
Radargram indicating a potential water-filled feature beneath a car-park in South Africa (with permission from [59]).

Figure 6.
(A) The process of ERT data collection; and (B) Sample ERT profile indicating the presence of anomalies including a potential cavity and know surface cavings (with permission from [59]).
Figure 6.
(A) The process of ERT data collection; and (B) Sample ERT profile indicating the presence of anomalies including a potential cavity and know surface cavings (with permission from [59]).

Figure 7.
An example of differential interferograms generated from Sentinel-1 data showing ongoing ground deformation related to mining activity in South Africa. Each colour cycle represents ground surface deformation of ~2.7 cm between image acquisitions.
Figure 7.
An example of differential interferograms generated from Sentinel-1 data showing ongoing ground deformation related to mining activity in South Africa. Each colour cycle represents ground surface deformation of ~2.7 cm between image acquisitions.

Figure 8.
Frequency of publication of referenced sinkhole investigations that aim to build inventories or detect precursors, categorized by the main investigation method; compiling historical records in yellow, geotechnical and in situ investigations in grey, remotely sensed terrain models in green, multispectral image analysis (including aerial imagery) in red and InSAR in blue.


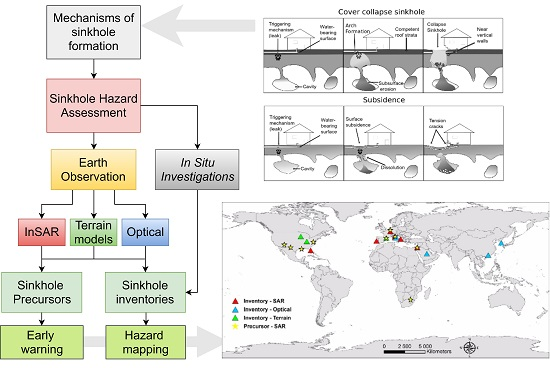
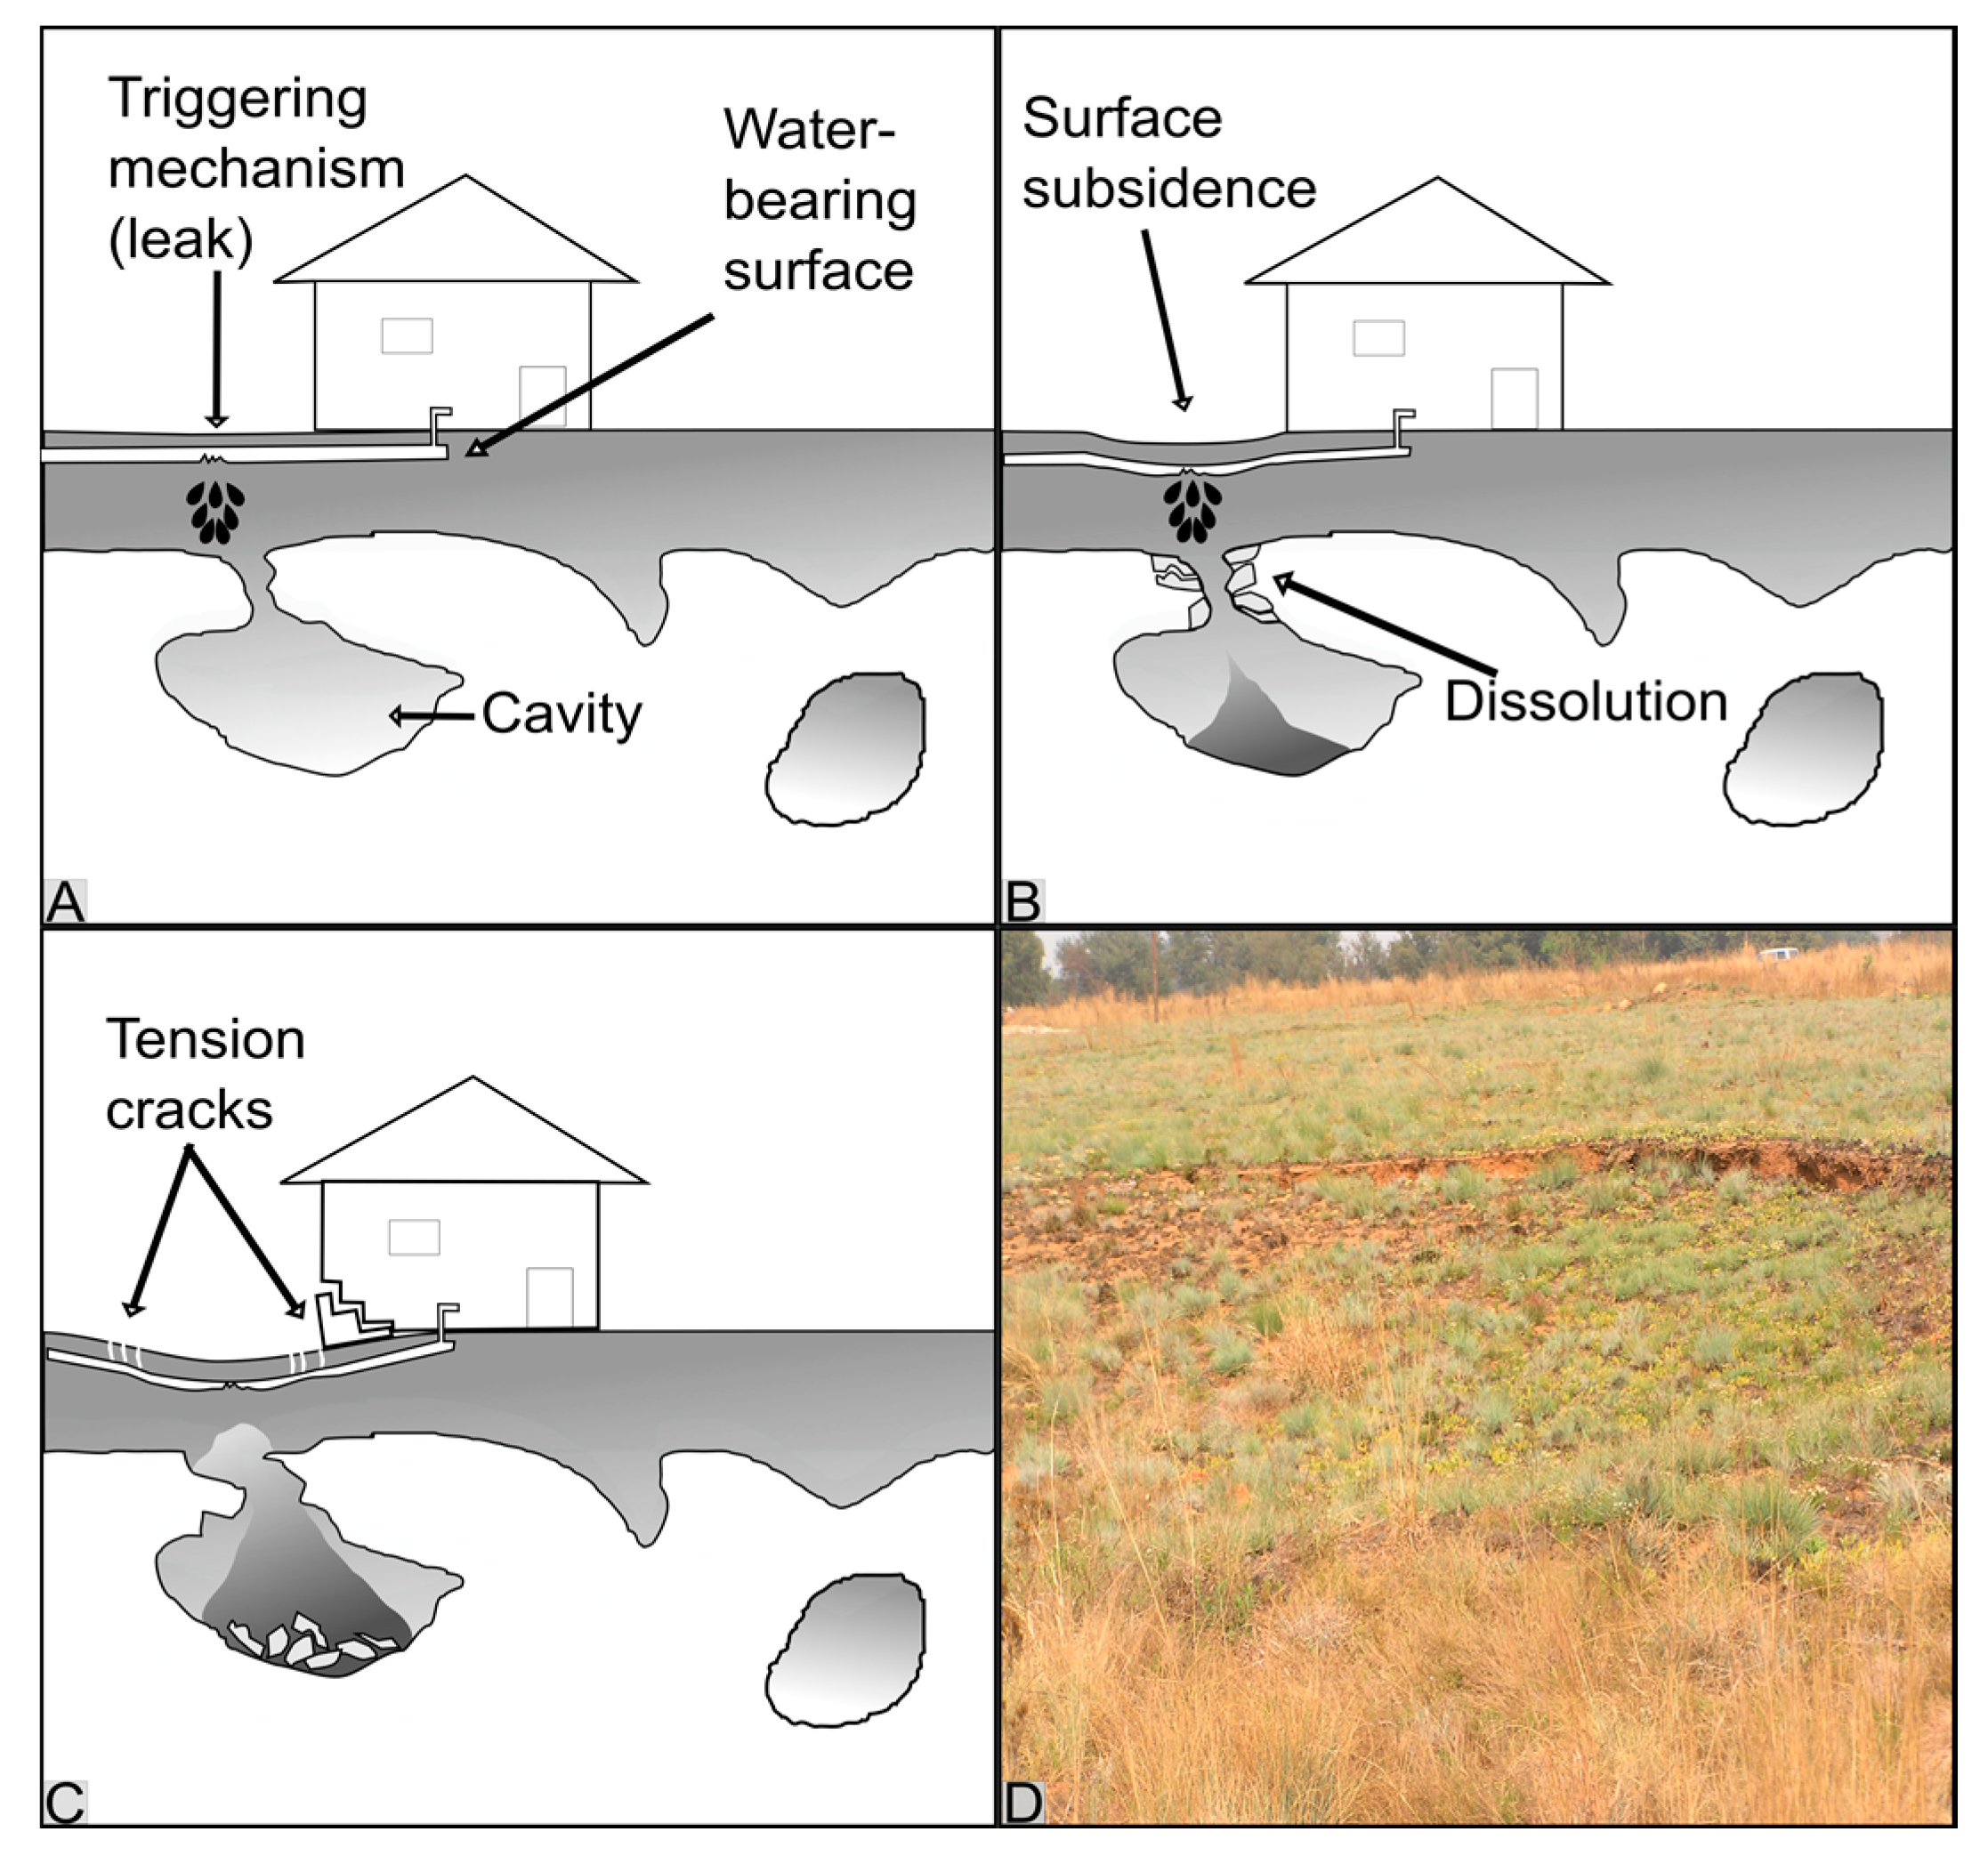
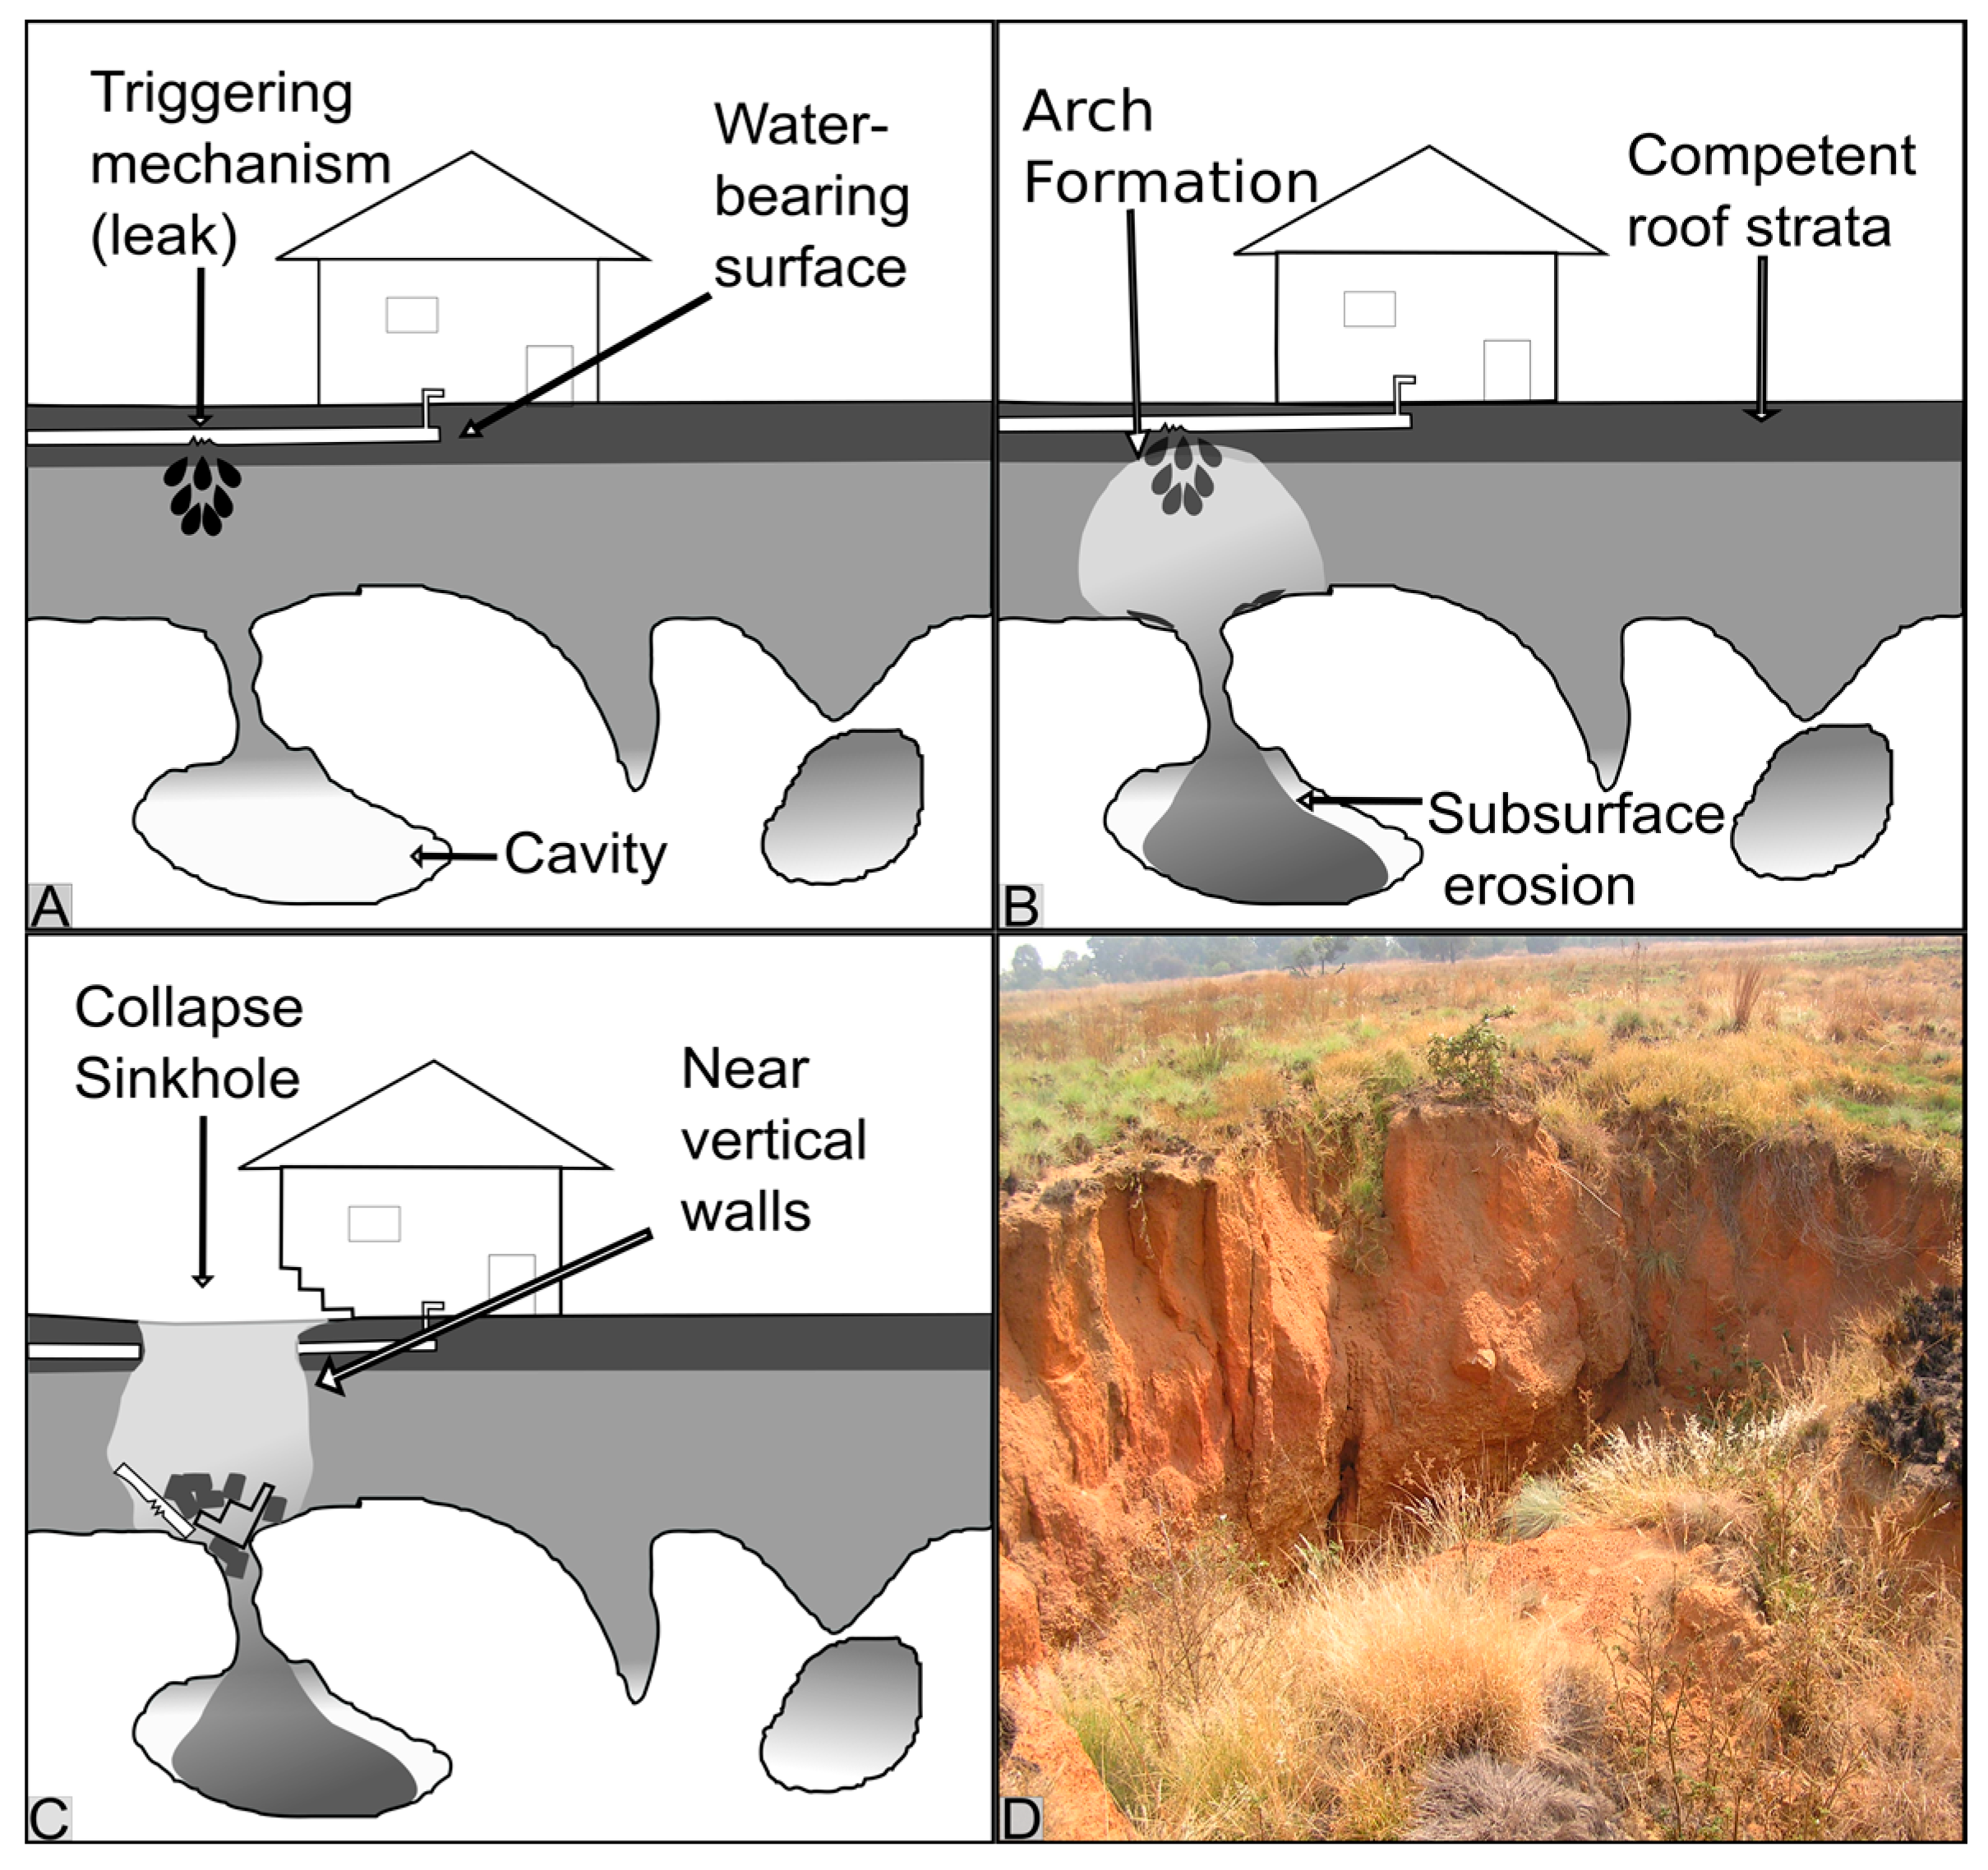
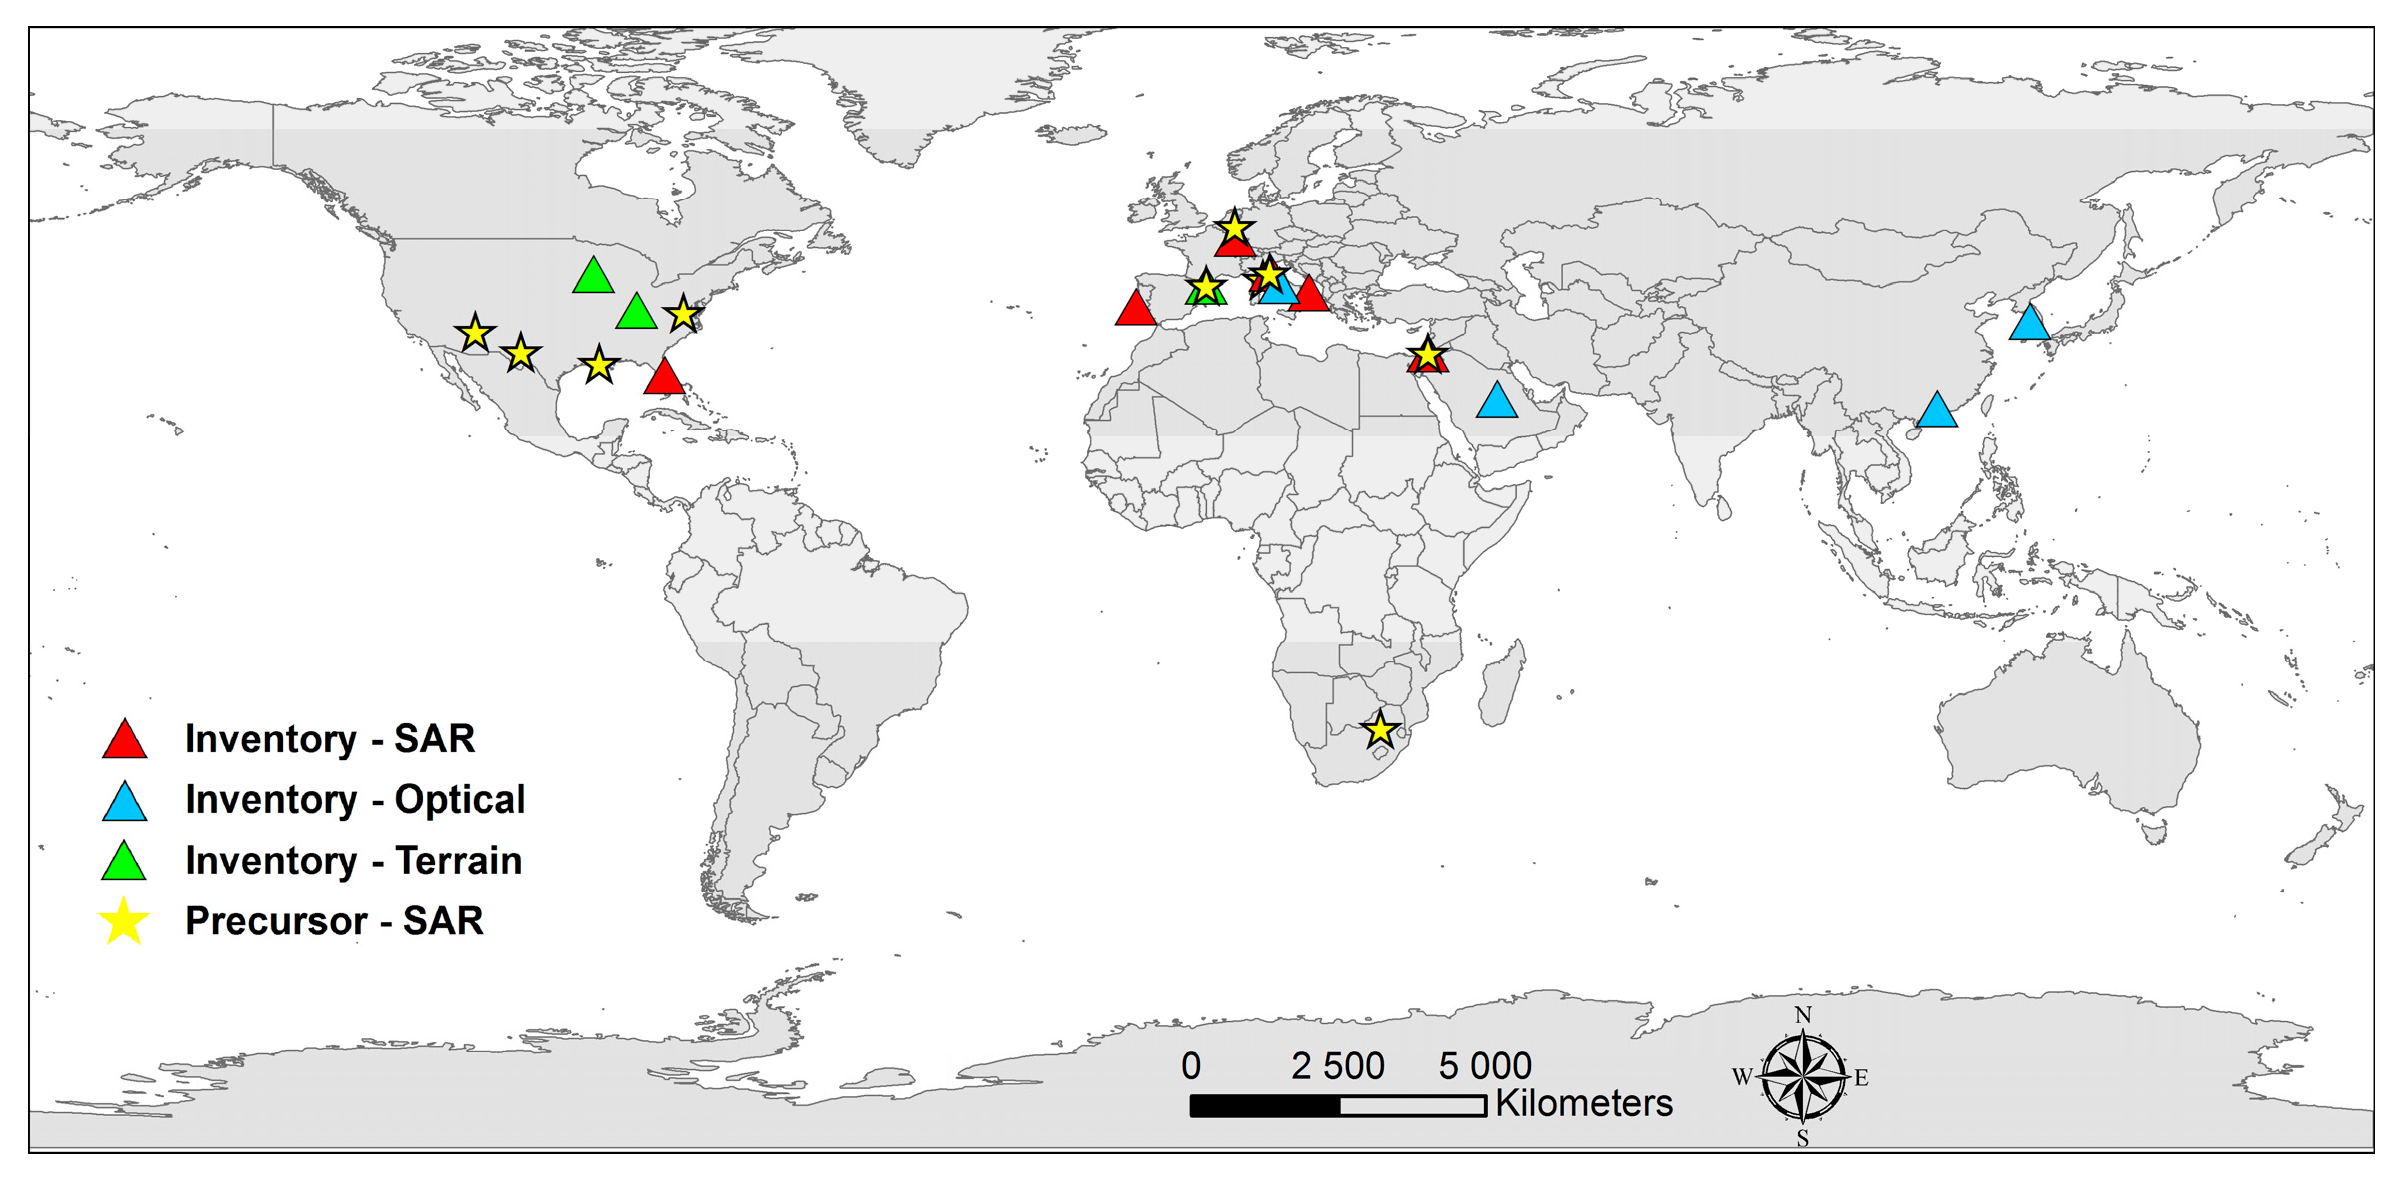
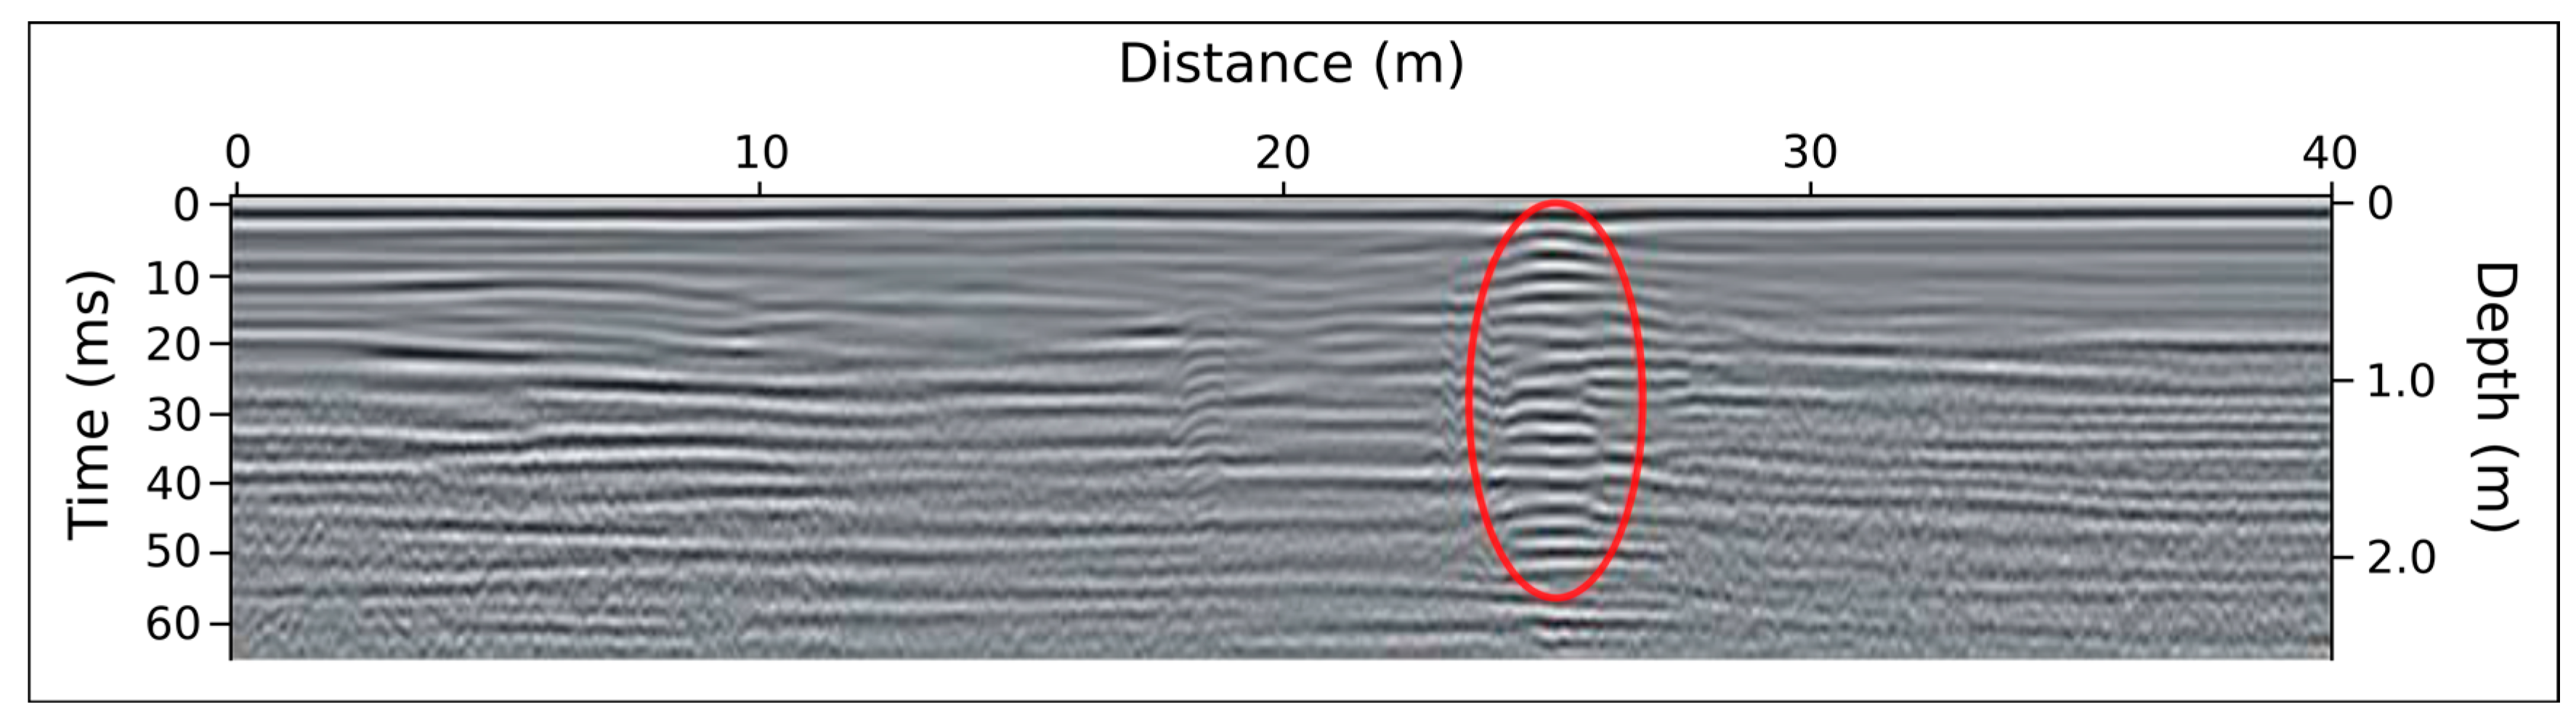
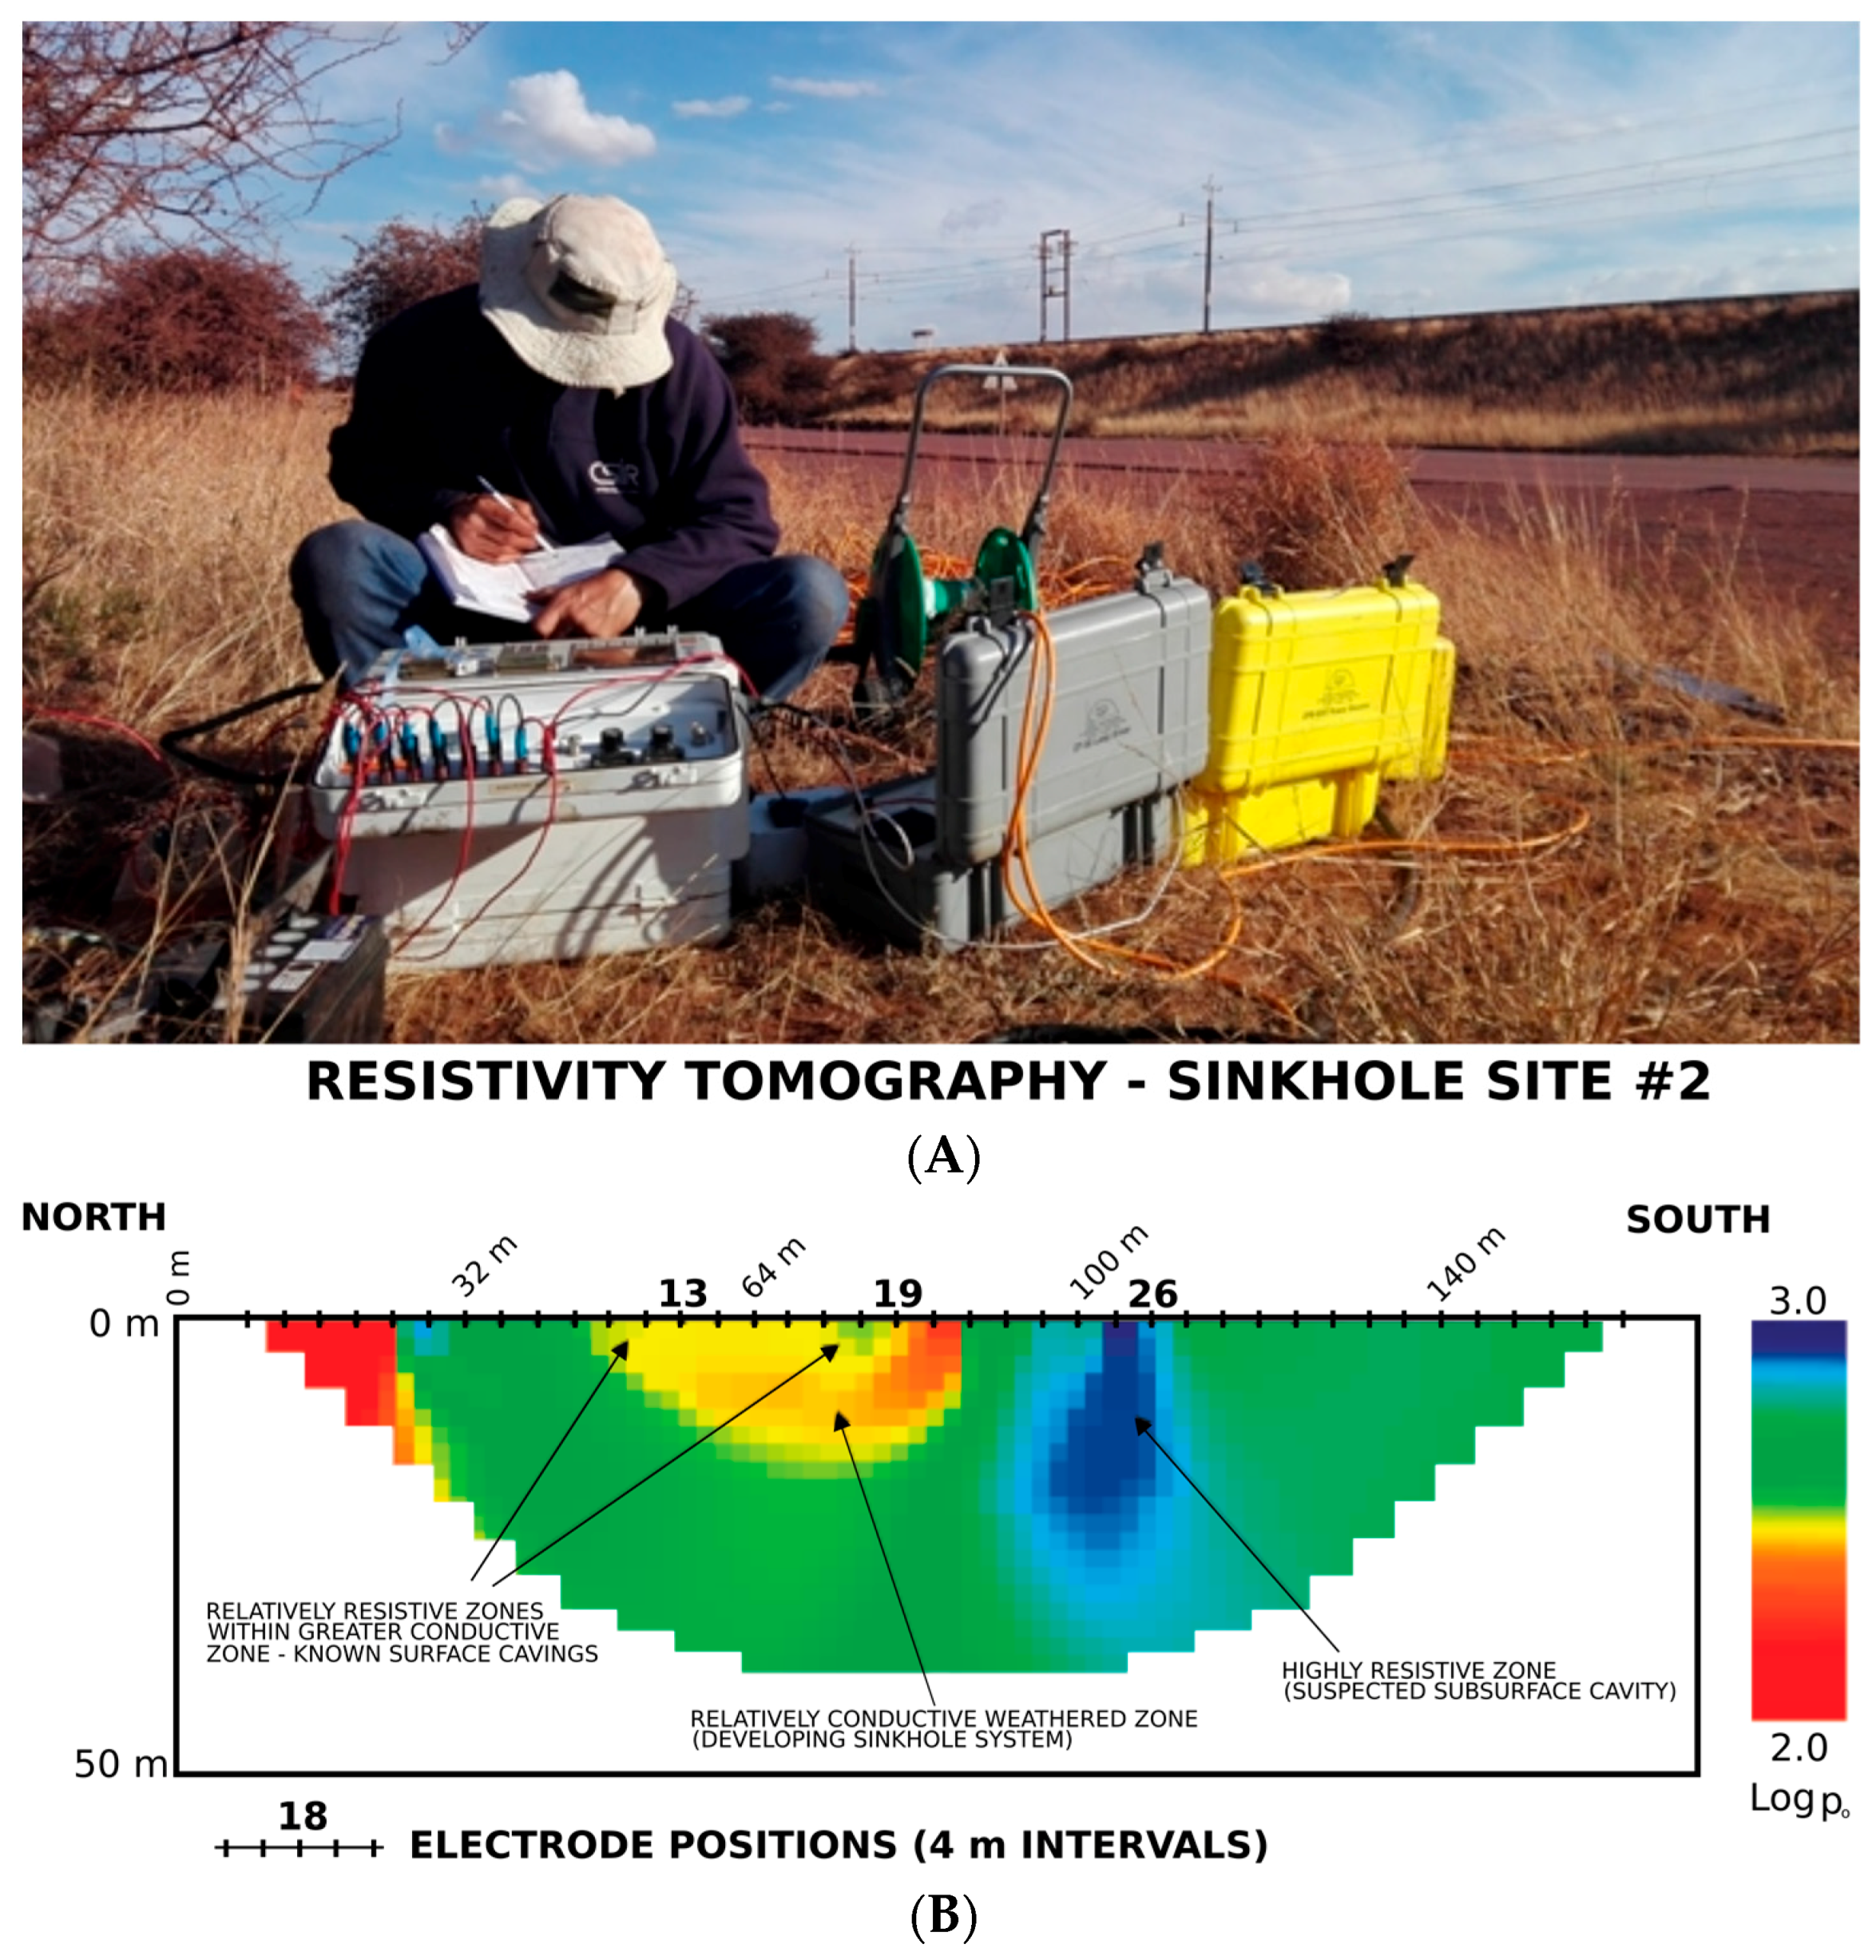
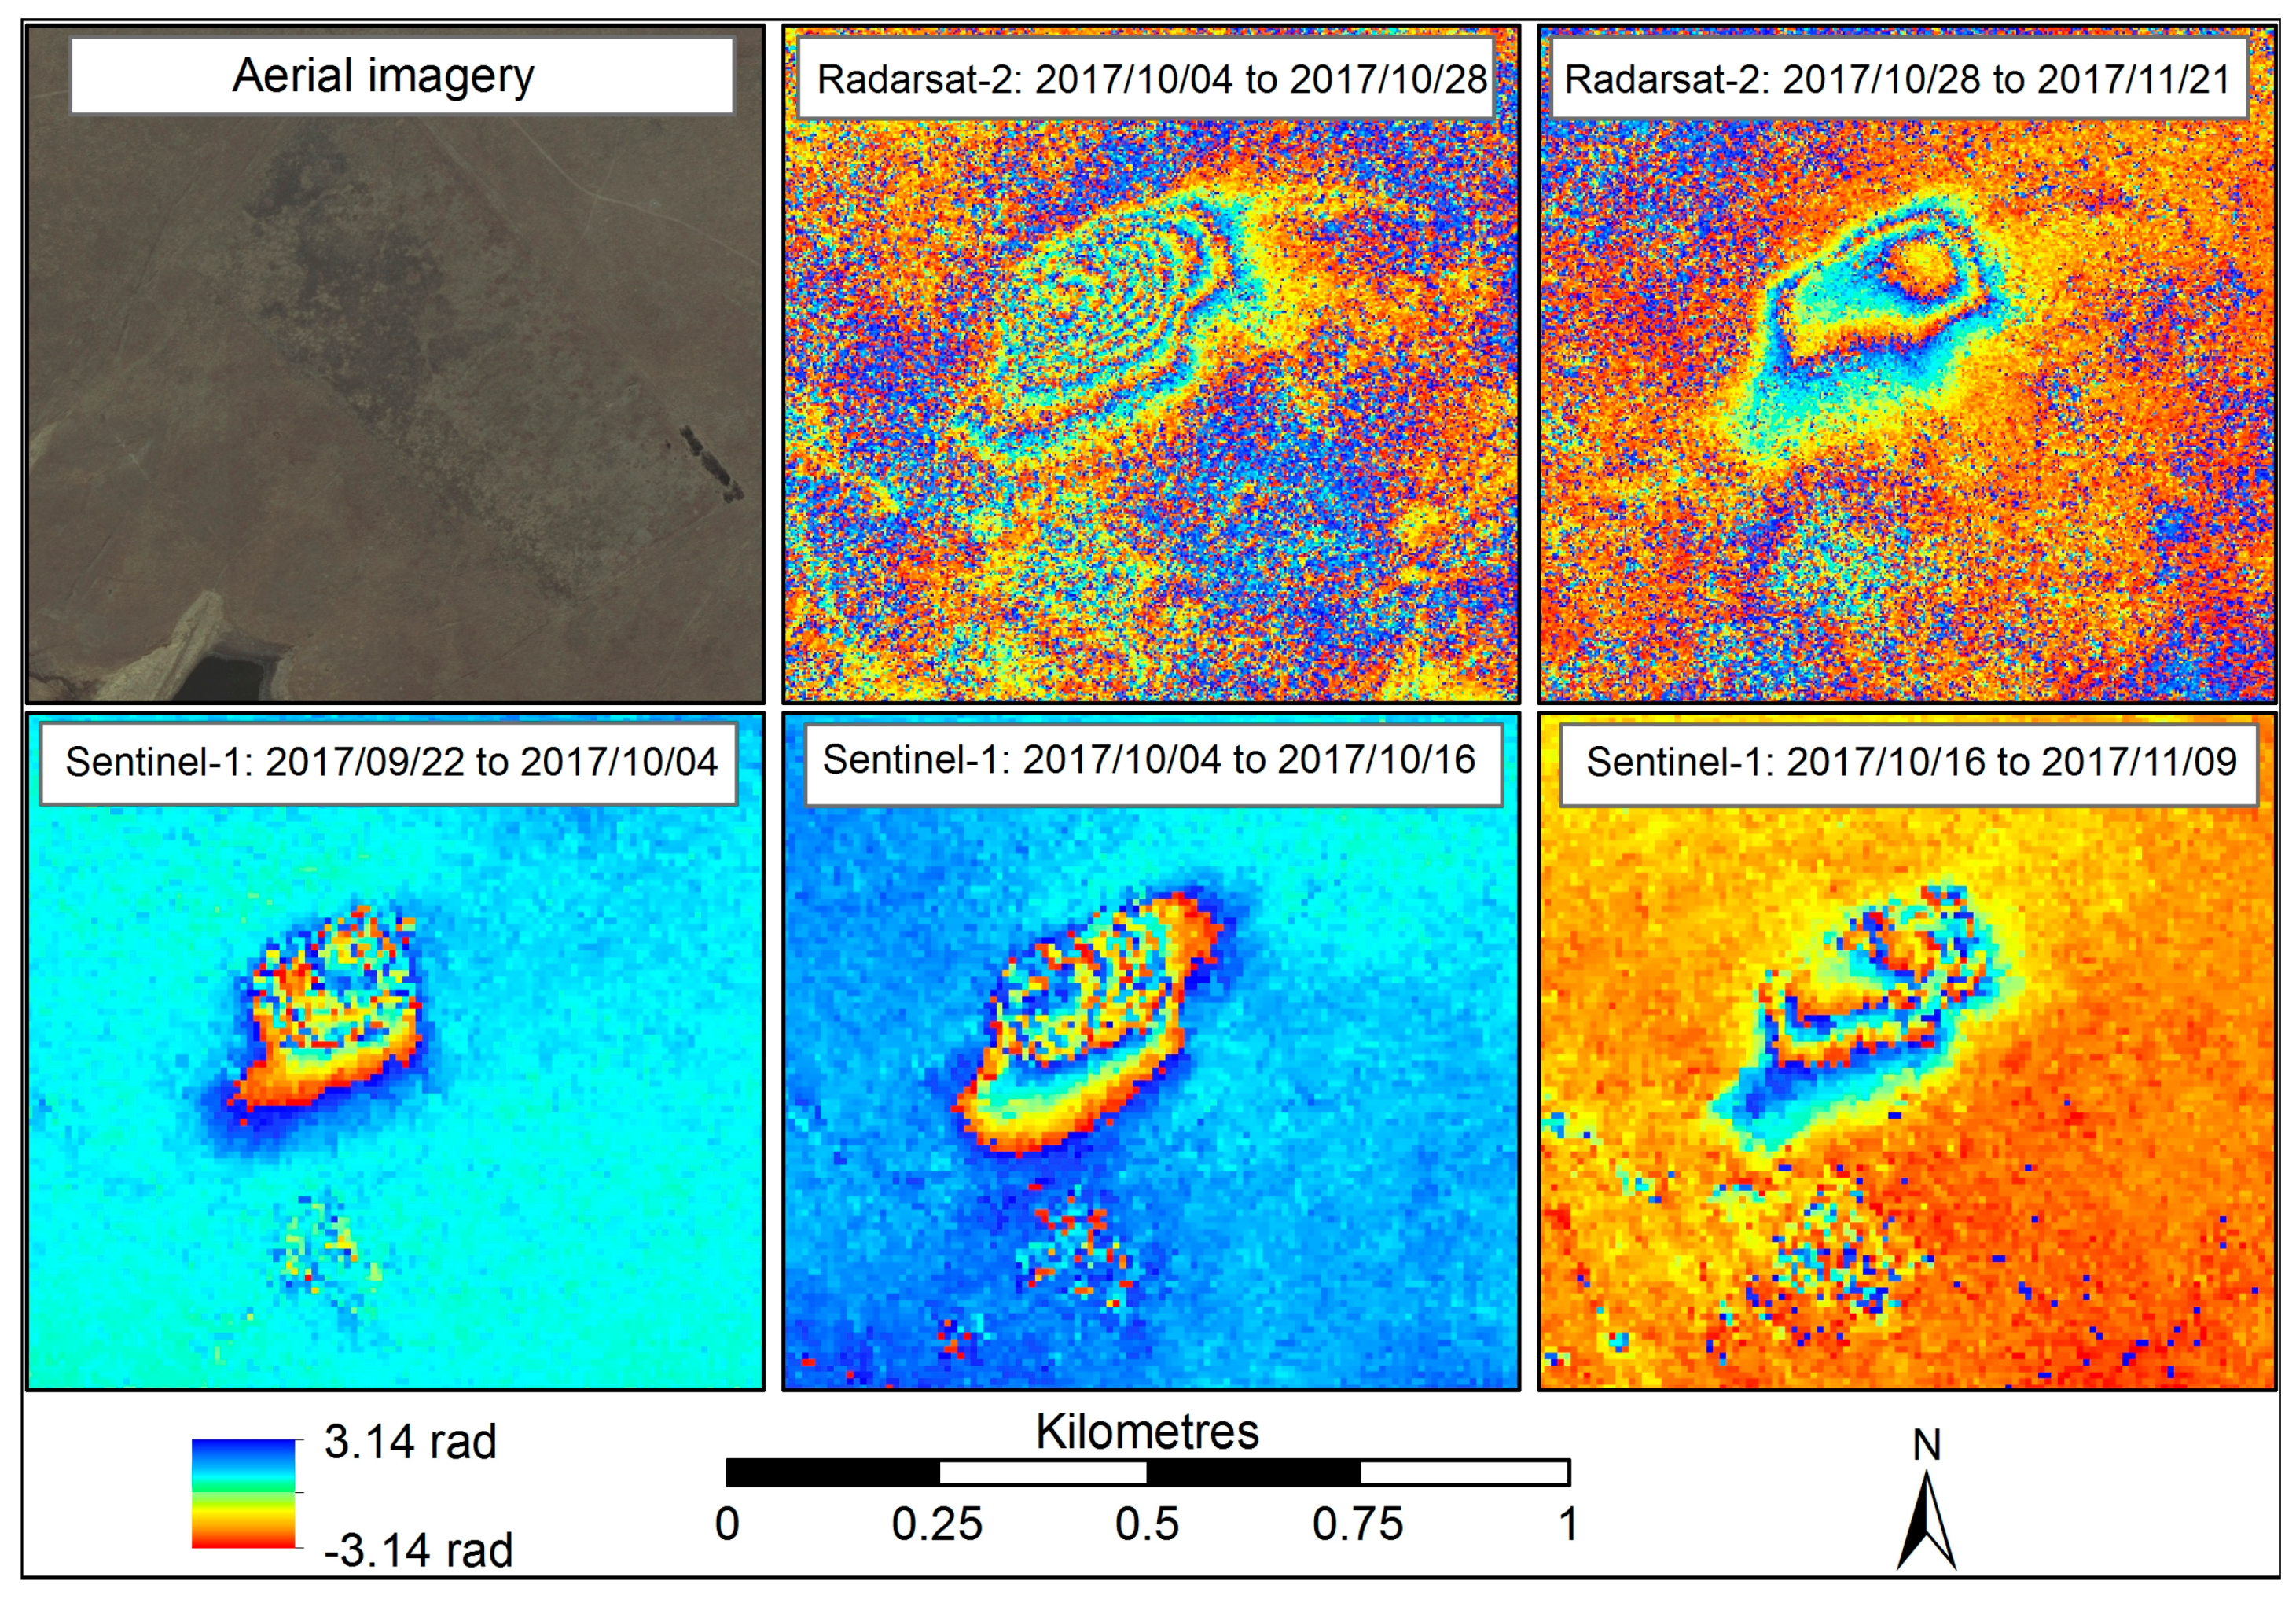
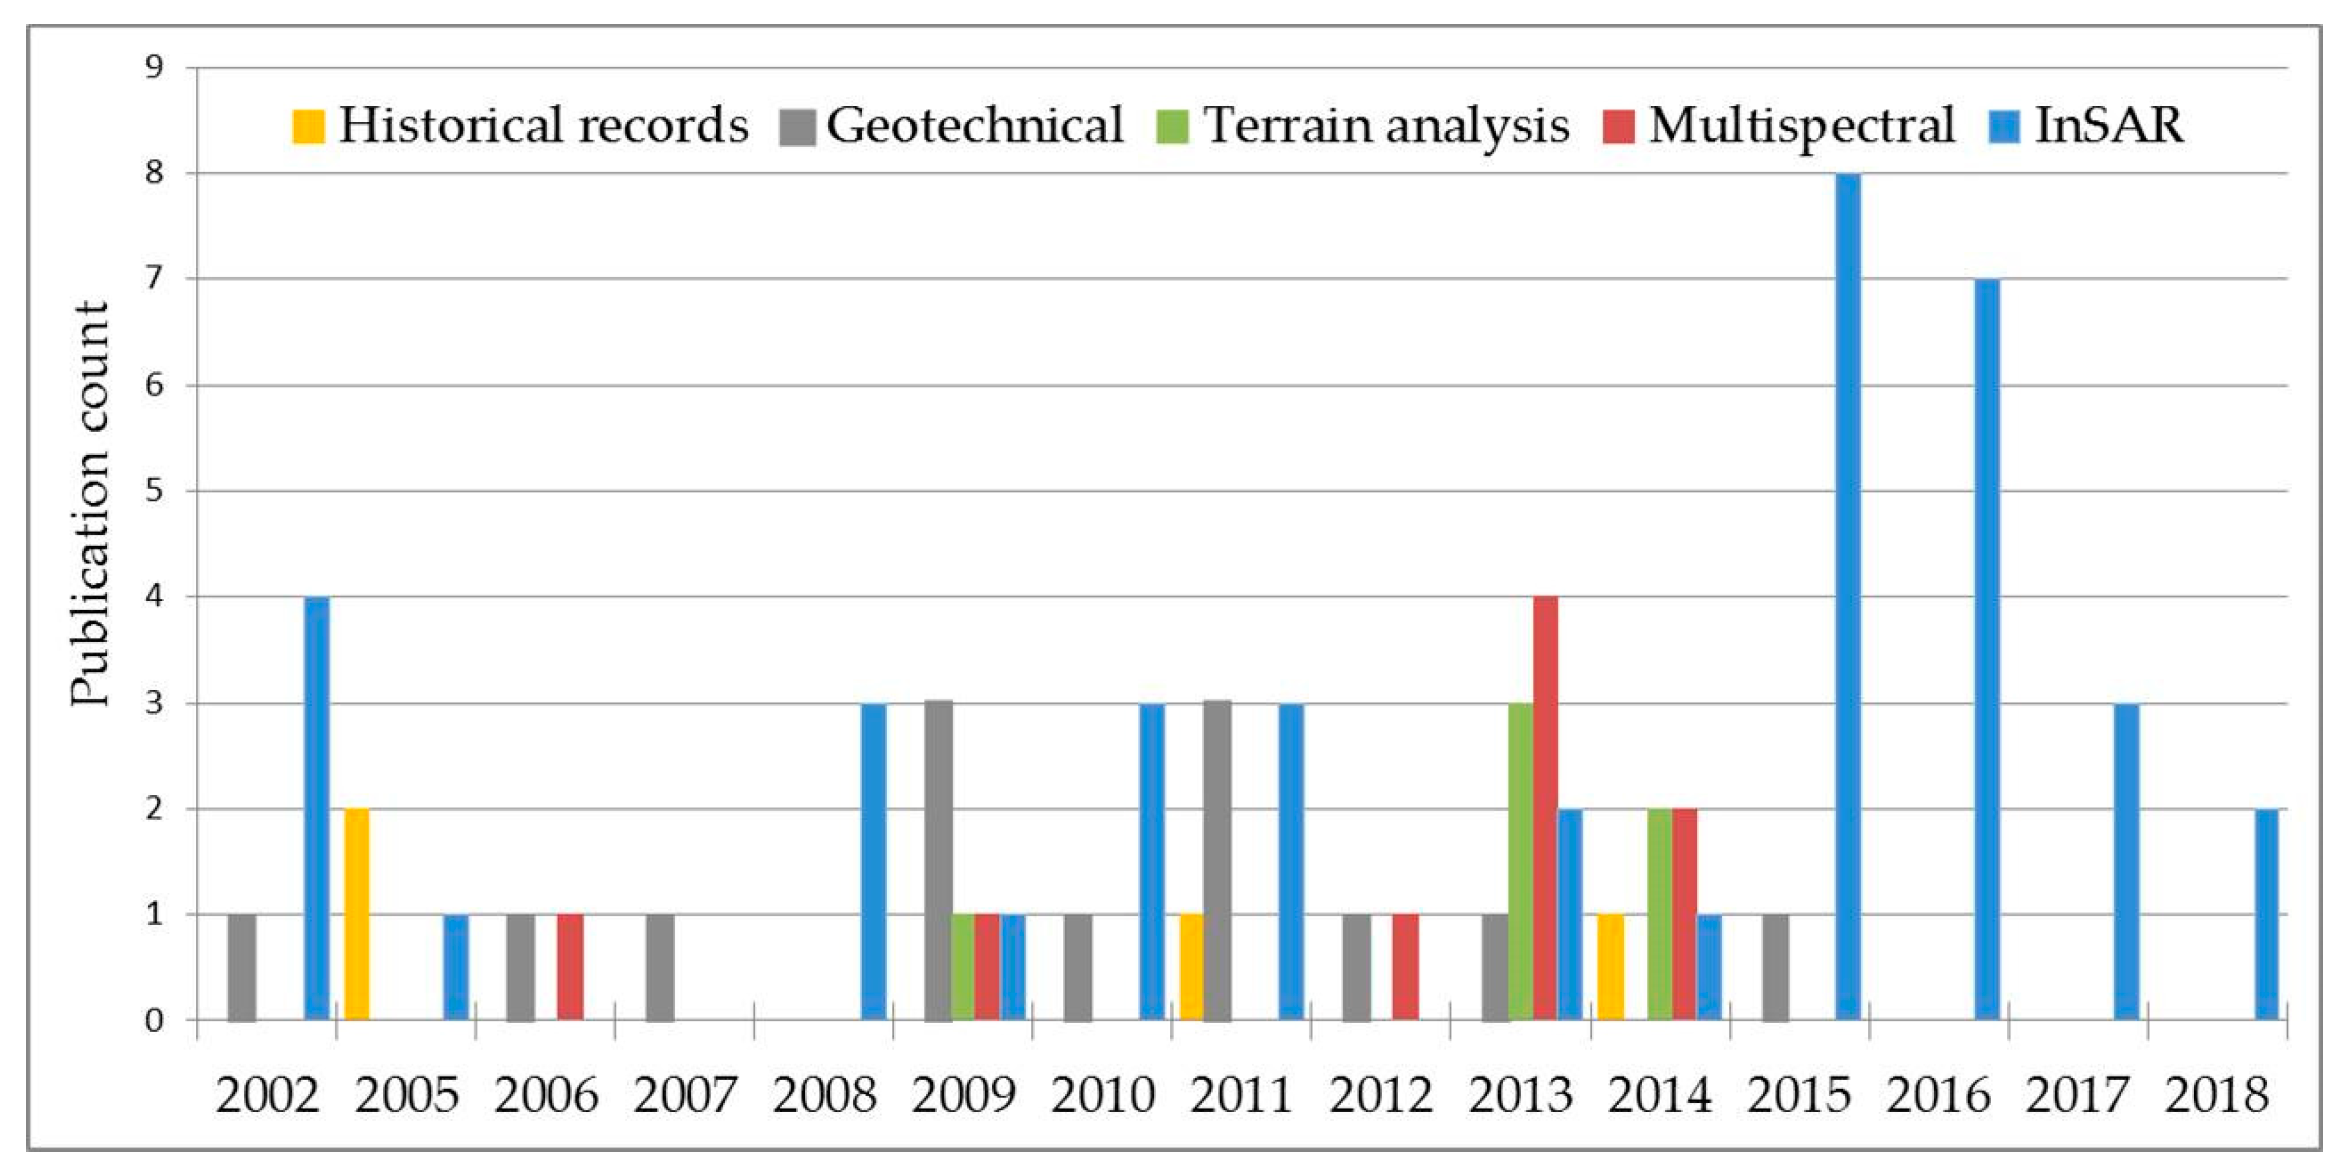
Table 1.
Summary of investigations for which precursors to sinkhole development were successfully detected.
Table 1.
Summary of investigations for which precursors to sinkhole development were successfully detected.
| Project | Geological Details | SAR System Parameters | Processing Parameters | Precursor Parameters | Sinkhole Parameters |
|---|---|---|---|---|---|
| Elba Island, Italy, 2013–2014, [26] | Event: 3 sinkholes/subsidences—1 filled before collapse. Geology: Dolomitic limestone. Trigger: Groundwater abstraction. | SAR: Ground-based Band: Ku Resolution: 1 m Repeat: Daily Incidence: ~10° | Technique: Repeat-pass interferometry Projection: Vertical | Diameter: 10 m Magnitude: 0.028 m Behaviour: non-linear, rapid increase Lead time: days | Diameter: 1.5–2.5 m Depth: 2 m |
| Dead Sea, Israel, [6] | Event: 3 Sinkholes Geology: Evaporite Trigger: Decreasing water levels | SAR: COSMO-SkyMed Band: X Resolution: 3 m Repeat: 16 days Scenes: 20 Incidence angle: 41° | Technique: Repeat-pass interferometry Pair selection: Sequential Surface model: LiDAR 0.5 m Projection: Vertical | Rate: 0.001–0.005 m/day Behaviour: Non-linear increase Lead time: 16–90 days | Diameter: 13 m Depth: 7 m |
| Dead Sea, Israel, 2007–2008, [109] | Event: Subsidence basins associated with hundreds of sinkholes Geology: Evaporite Trigger: Seismic events and/or salt dissolution | SAR: ALOS PALSAR Band: L Polarisation: HH Scenes: 6 | Technique: Repeat-pass interferometry Pair selection: Overlapping Surface model: None Projection: Vertical | Diameter: 100–2000 m Magnitude: 0.03–0.08 m Rate: 0.064–0.476 m/year Behaviour: increasing | Diameter: < 100 m Depth: < 20 m |
| Dead Sea, Israel, 1992–1999 [85] | Event: Sinkholes and subsidence Geology: Evaporite Trigger: Water level decrease or dissolution of salt layers | SAR: ERS-1 and ERS-2 Band: C Incidence angle: 23° Scenes: 16 | Technique: Repeat-pass interferometry Pair selection: Overlapping Surface model: Low resolution Projection: 2D Ascending and descending tracks | Diameter: 100–1000 m Rate: 0.005–0.06 m/year Behaviour: Linear gradual | Diameter: < 100 m Depth: < 20 m |
| Arizona, USA, 1992–1997, 2006–2011, [110] | Event: 3 Subsidence associated with sinkholes Geology: Evaporite Trigger: Salt dissolution | SAR: ERS-1, ERS-2 and ALOS PALSAR Band: C + L Scenes: 6 ERS, 28 ALOS | Technique: Repeat-pass interferometry Surface model: SRTM 30m | Diameter: ~ 1000 m Magnitude: 0.017–0.026 m | Diameter: 40–3000 m Depth: 10–30 m |
| Texas, USA, 2006–2008, [4] | Event: Subsidence surround 2 large existing Sinkholes Geology: Evaporite Trigger: salt dissolution and water abstraction | SAR: ALOS PALSAR Band: L Scenes: 3 | Technique: Repeat-pass interferometry | Diameter: 300–850 m Magnitude: 0.10–0.15 m Rate: 0.30 m/year | Diameter: 100 m Depth: 34 m |
| Texas, USA, 2015 [76] | Event: Subsidence surround 2 large existing Sinkholes Geology: Evaporite Trigger: salt dissolution and water abstraction | SAR: Sentinel-1A Band: C Scenes: 11 Resolution: 5 × 20 m Incidence Angle: 33.8° | Technique: Multi- dimensional SBAS Projection: 2D from ascending and descending tracks | Diameter: 500 m Magnitude: 0.01–0.04 m Rate: 0.03–0.014 m/year | Diameter: 100 m Depth: 34 m |
| Gauteng, South Africa, 2015 [19,20] | Event: Sinkhole Geology: Dolomite Triggers: Leaking servitudes and ineffective stormwater management | SAR: TerraSAR-X Band: X Scenes:4 Resolution: 3 m | Technique: Repeat-pass interferometry Projection: LOS Pair selection: Sequential Surface model: SUDEM 5 m | Diameter: 90 m Magnitude: 0.067 m Behaviour: Non linear | Diameter: 2–15 m Depth ~7 m |
| Louisiana, USA, 2012, [5,111] | Event: Sinkhole Geology: Evaporite Trigger: Collapse of a brine well. | SAR: UAVSAR Band: L Scenes: 2 Resolution: 7 m Incidence Angle: 61° | Technique: Repeat-pass interferometry Projection: 2D Ascending + descending passes | Diameter: 400 m Magnitude: 0.260 m Lead time: 1 mo | Diameter: 110 m |
| Heerlen, Netherlands, 1992–2011, [34] | Event: Structural damage Geology: Old coal mining cavities Dolomite Trigger: Cavity migration | SAR: ERS1/2, Envisat, Radarsat-2 Band: C Scenes: 160 | Technique: PSI Surface model: LiDAR Projection: Vertical | Diameter: 20–40 m Magnitude: 0.08 m Rate: 0.003–0.015 m/year Behaviour: Non-linear, periodically increasing Lead time: 18 years | Diameter: 8 m |
| Texas, USA, 1992–1998, 2011–2012, [21] | Event: Subsidence surround 2 large existing Sinkholes Geology: Evaporite Trigger: salt dissolution and water abstraction | SAR: ERS 1/2, COSMO-SkyMed Band: C + X Scenes: 54 | Technique: PSI + SqueeSAR Automated extraction | Diameter: 9–30 m Magnitude: 0.030–0.040 m Rate: 0.001 m/year | Diameter: 100 m Depth: 34 m |
| Ebro Valley, Spain, 1995–2000, [97] | Events: Sinkholes and subsidence Geology: Evaporite Trigger: water ingress and abstraction | SAR: ERS-1/2 Band: C Resolution:90 m Scenes: 27 | Technique: SBAS Surface model: SRTM 90 m | Diameter: Magnitude: 0.024m Rate: 0.017 m/year | Diameter: 1–100 m Depth: 2 m |
| Virginia, USA, 2011- 2016, [105,112] | Event: deformation related to subsidence and sinkholes Geology: dolomite and limestone | SAR: Cosmo-Skymed Band: X Scenes 57 | Technique: PSI, SqueeSAR | Rate: 0.0003–0.002 m/year | N/R |
| Ebro Valley, Spain, 2003–2007, [113] | Event: subsidence Trigger: Dissolution | SAR: ALOS PALSAR and Envisat Band: C + L Scenes: 42 Resolution: 25 m | Technique: SPN | Rate: 0.006–0.009 m/year | N/R |
Table 2.
The advantages and limitations of various earth observation technologies employed for the compilation of sinkhole inventories and the detection of sinkhole precursors.
Table 2.
The advantages and limitations of various earth observation technologies employed for the compilation of sinkhole inventories and the detection of sinkhole precursors.
| Earth Observation Technology | Sinkhole Hazard Phase | Advantages | Limitations | Recommendations |
|---|---|---|---|---|
| Sinkhole inventories | ||||
| Ground geophysics—i.e., Seismics, ERT, GPR | Underground cavity detection and delineation | Detect underground cavities in addition to describing the shape, size and overall geometry of subsurface cavities; In-depth characterisation of structures and dating of sediments | Limited spatial extent, labour intensive, expensive. Anomalous features are frequently present; Limited by observation depth of selected technique; Relies on contrasting properties of cavities, cavity fill materials and surrounding strata | Complement investigations by drilling, trenching to confirm nature of anomalies |
| Satellite and airborne remote sensing (optical and multispectral) | Sinkhole inventory population–identifying of historical sinkhole events, extracting geomorphological parameters and estimating timeframe of occurrence | Image analysis and elevation model generation can be useful for delineating sinkholes; Historical archives frequently available that allow for the dating of past sinkholes | Sinkhole geomorphological expression frequently masked by dynamic surfaces like erosion, sedimentation and anthropogenic changes; Absolute vertical accuracy is frequently too low in relation to sinkhole dimensions | High resolution is required depending on typical sinkhole dimensions in the area under investigation |
| Infrared | Sinkhole inventory compilation– | Rely on temperature differential between sinkholes and surrounding landscape to identify sinkhole features; suitable for machine learning classifiers | High resolution data availability | Extensive validation and verification remains to be performed |
| LiDAR | Sinkhole inventory compilation through elevation model generation and subsequent geomorphological analysis | High resolution, high accuracy digital surface models are provided; Useful for early detection of tension cracks and collapse features | Cost of data acquisitions; Time required for processing and analysis; Limited in spatial coverage; Archive data frequently unavailable; Sinkhole features masked by presence of vegetation or urban structures | Manual inspection and feature extraction is intensive, error-prone and difficult to reproduce. Automated feature extraction algorithms to be investigated |
| UAV data collections | Sinkhole inventory compilation through elevation model generation and subsequent geomorphological analysis | Low cost alternative to LiDAR collections | Limited spatial coverage, limited to site-specific investigations; Archive data frequently unavailable–historical sinkholes masked by terrain transformation | Manual inspection and feature extraction is intensive, error-prone and difficult to reproduce. Automated feature extraction algorithms to be investigated |
| Sinkhole precursor detection | ||||
| In situ surveying and geodetic observations i.e., inclinometers, extensometers, dGPS, laser transmitters | Mapping small-scale movements of the surface | High precision measurements | Measurements are point-based and limited in spatial extent; Surveying is labour intensive, time consuming and costly | Identify high risk areas by use of remote sensing techniques to direct field measurement campaigns |
| High resolution optical and SfM | Precursor detection through digital elevation model differencing over time | Cost effective monitoring at high revisit frequencies, derivation of surface models to map sinkhole dimensions and detection of larger scale movement | Surface model differencing prone to error propagation, vertical accuracy not sufficient for monitoring small-scale precursors | Monitoring areas of rapid deformation only |
| LiDAR | Precursor detection through digital elevation model differencing over time | High resolution surface models can be generated, derivation of surface models to map sinkhole dimensions and detection of larger scale movement | Surface model differencing prone to error propagation, high accuracy requires instrument close to ground, limiting aerial coverage; vertical accuracy not sufficient for monitoring small-scale precursors | Monitoring areas of rapid deformation only |
| SAR Interferometry | Precursor detection | Sensitive to very small-scale surface movements; early detection of precursors prior to collapse; High revisit frequency, in cases, implying operational monitoring of high risk areas; Ability to analyse impacts of specific events on deformation rates; Early warning potential; low cost per measurement area | Signal decorrelation in rural and vegetated areas; Atmospheric artefacts; Lack of coherent targets in stacking approaches; Very fast or slow movements cause decorrelation; Water accumulation in depressions cause decorrelation; Long revisit time; Potential blind-spots caused by Surface features in the sensor line-of-sight | High spatial and temporal resolution is desirable |
© 2018 by the authors. Licensee MDPI, Basel, Switzerland. This article is an open access article distributed under the terms and conditions of the Creative Commons Attribution (CC BY) license (http://creativecommons.org/licenses/by/4.0/).
Share and Cite
MDPI and ACS Style
Theron, A.; Engelbrecht, J. The Role of Earth Observation, with a Focus on SAR Interferometry, for Sinkhole Hazard Assessment. Remote Sens. 2018, 10, 1506. https://0-doi-org.brum.beds.ac.uk/10.3390/rs10101506
AMA Style
Theron A, Engelbrecht J. The Role of Earth Observation, with a Focus on SAR Interferometry, for Sinkhole Hazard Assessment. Remote Sensing. 2018; 10(10):1506. https://0-doi-org.brum.beds.ac.uk/10.3390/rs10101506
Chicago/Turabian StyleTheron, Andre, and Jeanine Engelbrecht. 2018. "The Role of Earth Observation, with a Focus on SAR Interferometry, for Sinkhole Hazard Assessment" Remote Sensing 10, no. 10: 1506. https://0-doi-org.brum.beds.ac.uk/10.3390/rs10101506
Note that from the first issue of 2016, this journal uses article numbers instead of page numbers. See further details here.