Article

Characterization of S-Band Dual-Polarized Radar Data for the Convective Rain Melting Layer Detection in A Tropical Region

1
Temasek Laboratories, Nanyang Technological University, 50 Nanyang Drive, Research Techno Plaza, BorderX Block, 9th Storey, Singapore 637553, Singapore
2
School of Electrical and Electronic Engineering, Nanyang Technological University, 50 Nanyang Avenue, Singapore 639798, Singapore
3
National Metrology Centre, Agency for Science, Technology and Research (A*STAR), 1 Science Park Drive, Singapore 118221, Singapore
4
C2N Pte. Ltd., 1 North Bridge Road, #07-10 High Street Centre, Singapore 179094, Singapore
*
Author to whom correspondence should be addressed.
Remote Sens. 2018, 10(11), 1740; https://0-doi-org.brum.beds.ac.uk/10.3390/rs10111740
Submission received: 2 October 2018 / Revised: 24 October 2018 / Accepted: 1 November 2018 / Published: 5 November 2018
(This article belongs to the Special Issue Remote Sensing of Tropical Environmental Change)

Abstract

:
In the tropical region, convective rain is a dominant rain event. However, very little information is known about the convective rain melting layer. In this paper, S-band dual-polarized radar data is studied in order to identify both the stratiform and convective rain melting layers in the tropical region, with a focus on the convective events. By studying and analyzing the above-mentioned two types of rain events, amongst three radar measurements of reflectivity ( Z ), differential reflectivity ( Z DR ), and cross correlation coefficient ( ρ HV ), the latter one is the best indicator for convective rain melting layer detection. From two years (2014 and 2015) of radar and radiosonde observations, 13 convective rain melting layers are identified with available 0 °C isothermal heights which are derived from radiosonde vertical profiles. By comparing the melting layer top heights with the corresponding 0 °C isothermal heights, it is found that for convective rain events, the threshold to detect melting layer should be modified to ρ HV = 0.95 for the tropical region. The melting layer top and bottom heights are then estimated using the proposed threshold, and it is observed from this study that the thickness of convective rain melting layer is around 2 times that of stratiform rain melting layer which is detected by using the conventional ρ HV = 0.97 .

Graphical Abstract

1. Introduction

The melting layer is the region where the ice crystals melt and transit into raindrop precipitation. Therefore, it is also defined as the effective rain height. At this melting region, the reflectivity increases and causes a bright band effect in radar measurements. Studying the characteristics of melting layer is very important for accurate estimation of rainfall and microphysical characterization of the cloud [1].
For satellite-to-earth communications and radar remote sensing applications, the melting layer can cause both attenuation [2,3,4,5] and scattering [6,7,8] to the propagating signal at microwave frequencies. It has been reported that the melting layer contributes significantly to the overall path attenuation during the periods of stratiform rain for slant paths with low elevation angles [9].
Previously, reflectivity ( Z ) measurements from conventional radar have been used for calculating the rainfall rate and detecting the melting layer bright band. However, the transition between ice crystals and water droplets in melting layer cannot be well identified with only the reflectivity measurements especially for convective rain events. Dual-polarized radar measurements not only include the reflectivity, Z , measurement, but also the differential reflectivity, Z DR , the linear depolarization ratio, LDR , the specific differential propagation phase, K DP , and the cross correlation coefficient, ρ HV [10]. Some of these parameters from dual-polarized radar measurement can provide a better way to identify the melting layer. In a recent study of melting layer detection using dual-polarized radar measurements, Giangrande et al. [1] proposed the use of three of these parameters ( Z , Z DR , ρ HV ) for the detection of stratiform rain melting layer.
However, most of the existing studies [11,12] on melting layer are for stratiform rain events, and very limited research work was performed for convective rain events. This might be because typically, there is no bright band effect in Z for convective rain events and therefore, it is very difficult to identify the convective rain melting layer by using a single parameter from conventional radar reflectivity measurements [13,14].
Recently, Teshiba et al. [15] reported polarimetric melting signatures in a convective rainfall area in central Oklahoma. They found that in one convective downdraft event, larger Z was observed at lower altitude of below 3 km, and the downdraft resulted in a depression of melting layer height as indicated by the vertical profiles of Z DR and ρ HV . In [16,17], Shusse et al. presented the convective rain melting layer characteristics in East China Sea region by using C-band polarimetric radar data. After applying the classification method to separate the convective rain and stratiform rain on a 3-h event, they found that the melting layer in the convective region showed a marked decrease in ρ HV together with an increase in Z DR around the 0 °C isothermal height. They also concluded that the average height of the melting layer signature maximum (defined by the level of the ρ HV minimum in the melting level) in the convective region is 0.46 km higher than that in the stratiform region.
In the tropical country of Singapore, there are frequent convective precipitations relative to the temperate region. Therefore, it is ideal to study the convective rain melting layer in a tropical country like Singapore. With the recent implementation of S-band dual-polarized radar in Singapore, both the stratiform and convective melting layers will be investigated in details in this paper, with a focus on the convective melting layer. By analyzing the recorded convective rain events, a method to detect the convective rain melting layer will be proposed.
In the following, Section 2 provides a description of two meteorological databases (dual-polarized radar data and radiosonde vertical profiles), which are used to detect the melting layer structure and the corresponding 0 °C isothermal heights. Section 3 presents the different characteristics of stratiform and convective rain melting layer. An improved method to separate these two types of rain cells are also proposed and discussed. In Section 4, by studying and analyzing the characteristics of convective rain melting layer based on recorded events, a method to detect convective rain melting layer structure (top, bottom and thickness) based on a single value of ρ HV will be proposed and the performance of this threshold will be also discussed. Finally, conclusions are presented in Section 5.

2. Data Description

Two types of meteorological data sets are used for detecting the melting layers. S-band dual-polarized radar data are used to detect the structure of melting layers including the top height, bottom height and thickness. Radiosonde data providing the vertical profiles of temperature information is used to find the 0 °C isothermal height as the reference for the melting layer top boundary [1].

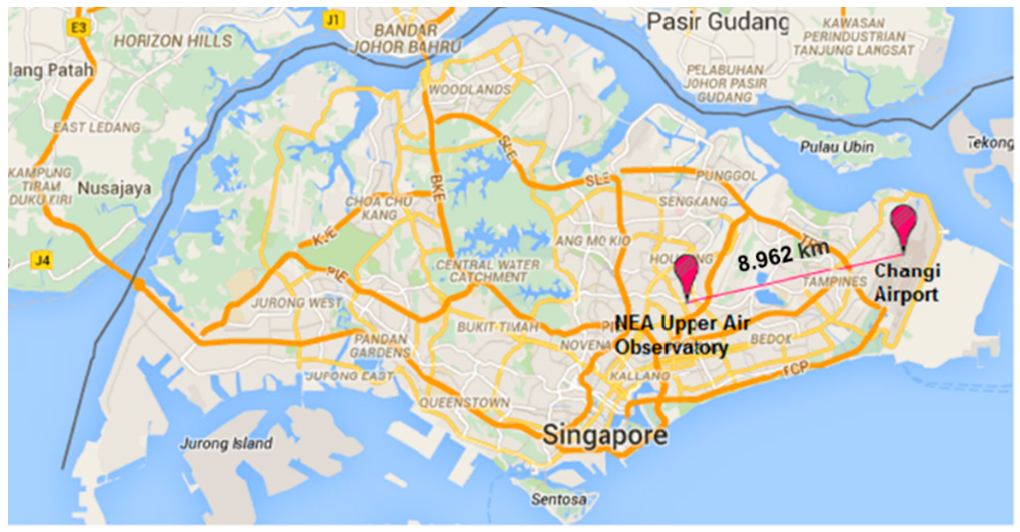
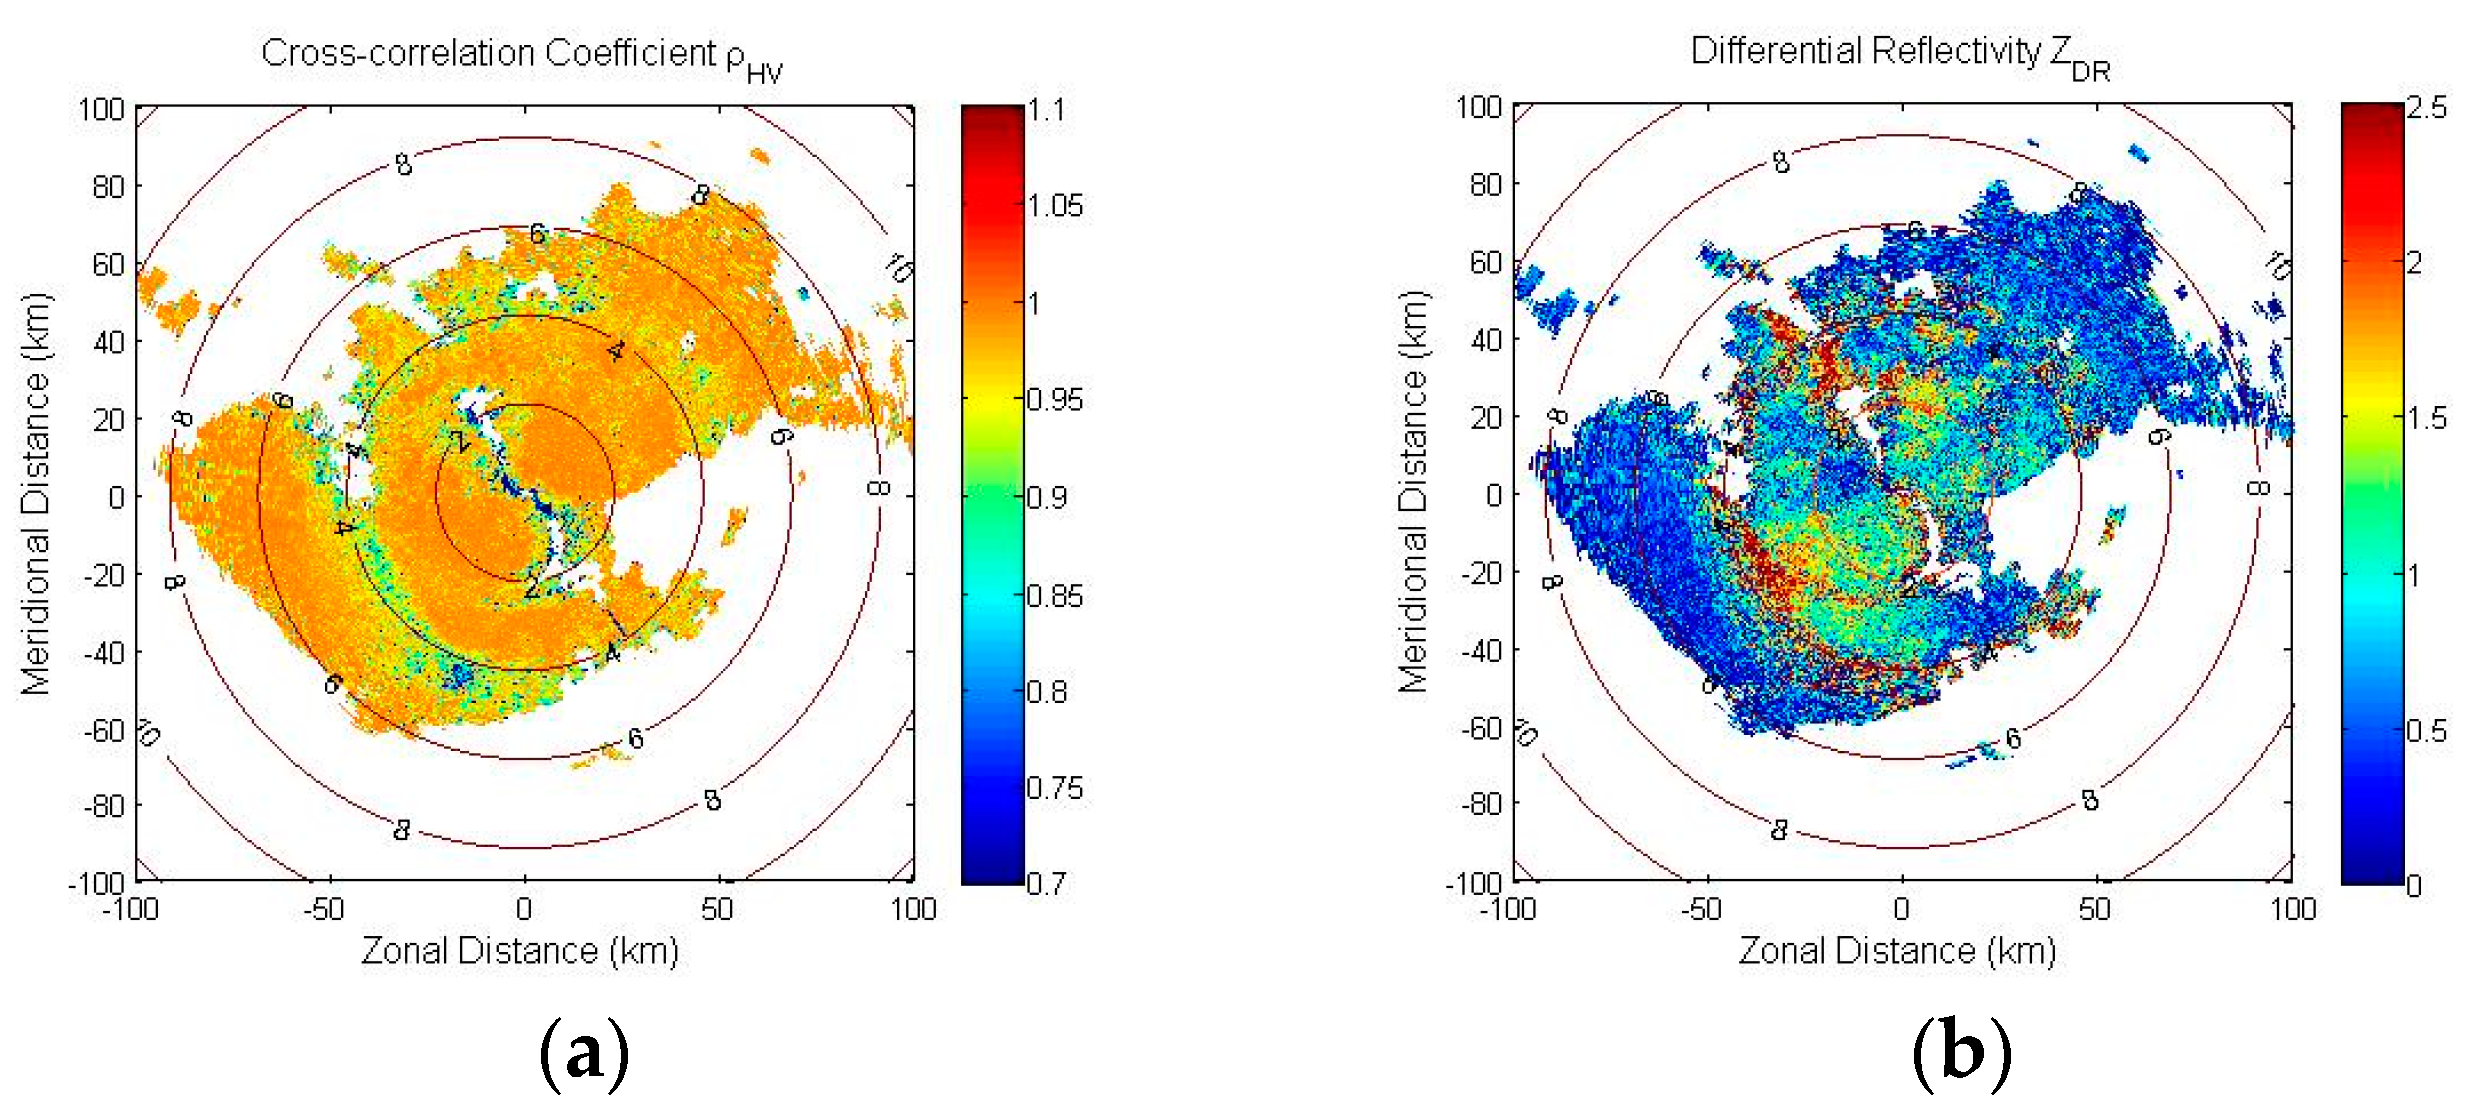
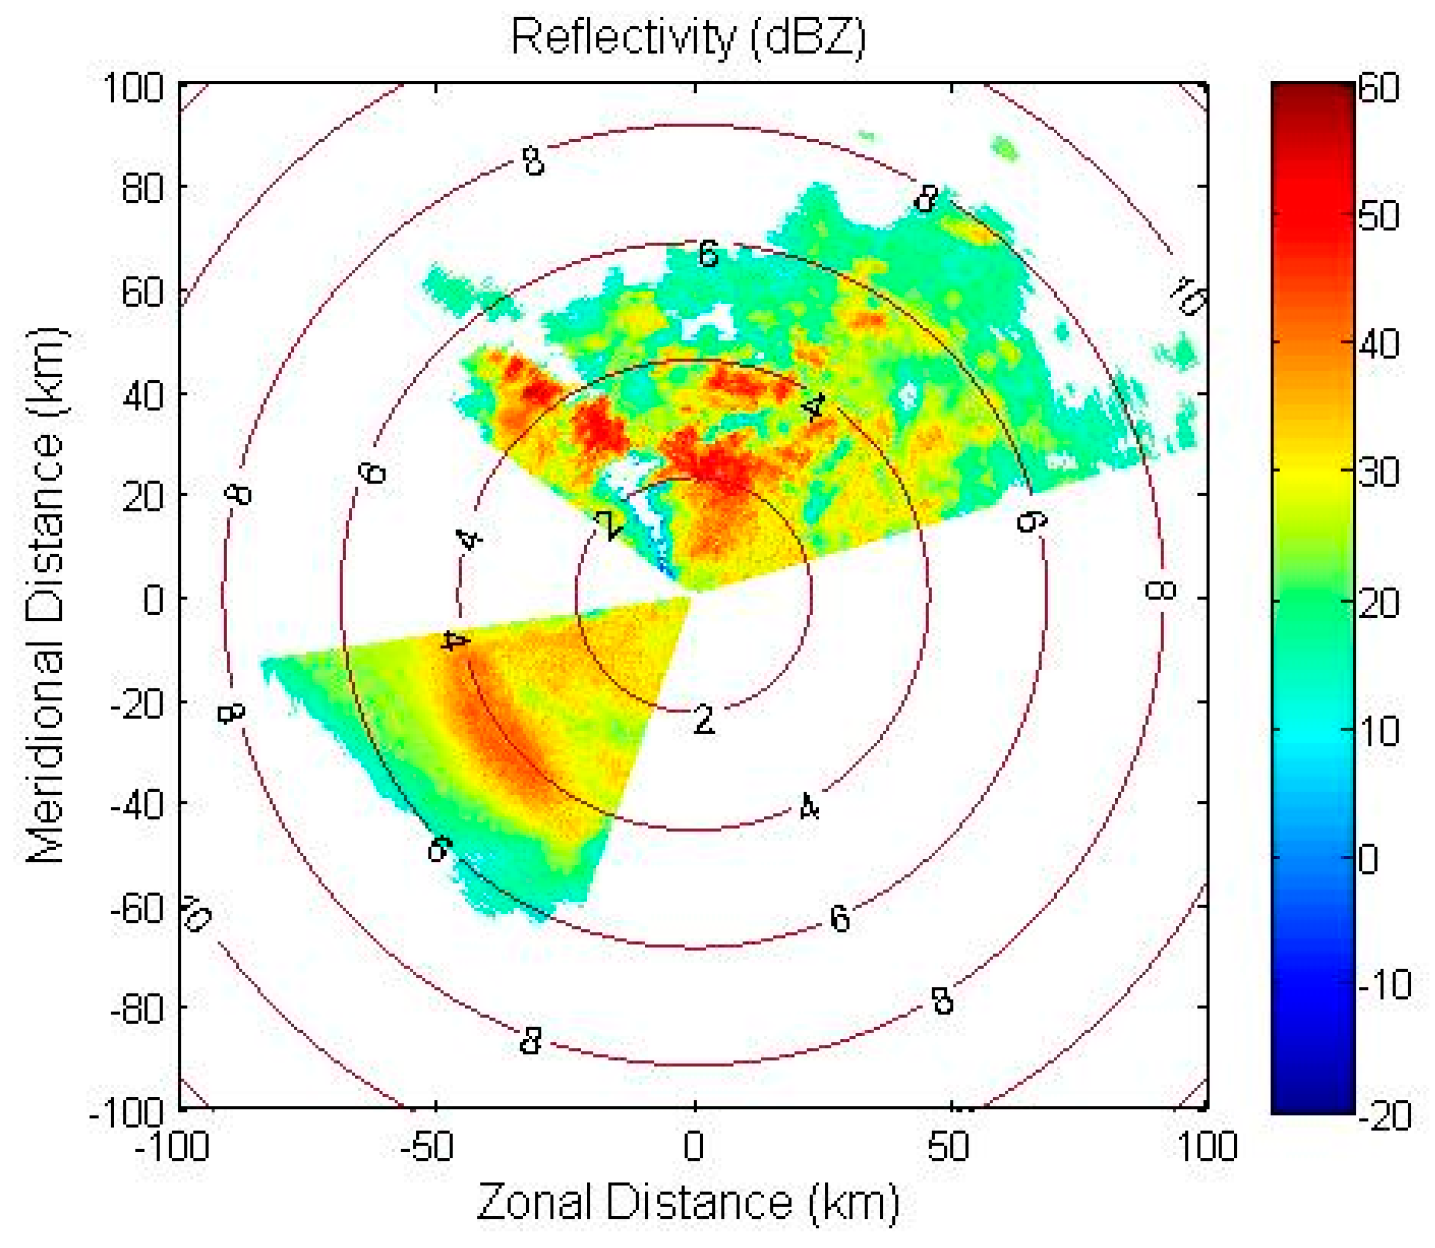
2.1. Dual-Polarized Weather Radar Data

In order to detect the melting layer, 2 years (2014 and 2015) data were collected from a dual-polarized weather radar at Changi airport (1.35° N, 103.97° E) as shown in Figure 1. The total number of radar scans collected from the year 2014 and 2015 is 93,891. The radar is operating in the S band at a frequency of 2.71 GHz. It performs a full volume scan per 5 min with a maximum range of 120 km and a resolution of 250 m. For every interval of 5 min, the radar collects measurements at 8 elevation angles (1°, 1.5°, 3°, 5°, 7.5°, 10°, 20°, and 40°). The 5° elevation angle radar data is chosen for the detection and the analysis of the melting layer in this study. It was reported in [1,17] that this elevation angle can provide relatively good vertical resolution/range and a good coverage range.
Dual-polarization radar can provide several types of measurements (reflectivity, differential reflectivity, cross-correlation coefficient, differential phase shift etc.), from the literature study [1], first three parameters were applied for stratiform rain melting layer detection. Therefore, these three parameters will be also studied and discussed in the following sections.

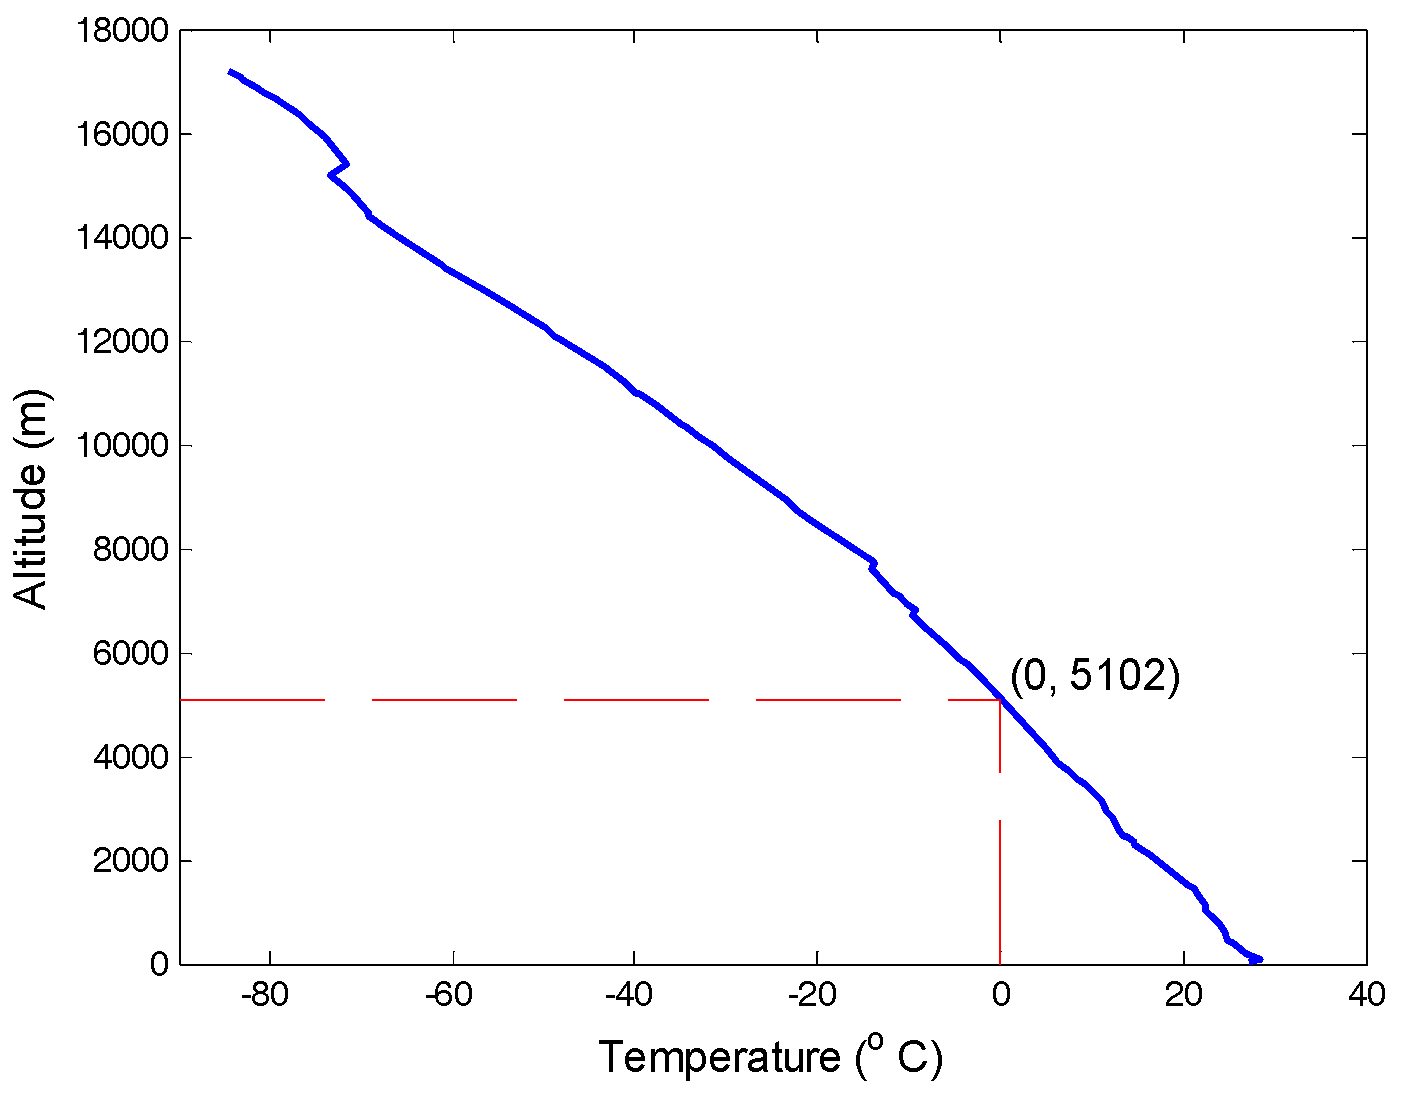
2.2. Radiosonde Data

Radiosonde data are acquired from an online database provided by the Department of Atmospheric Science, University of Wyoming [18].
For the Singapore station, the raw experimental data are collected by the National Environment Agency (NEA) at Singapore upper air observatory (1.34° N, 103.89° E) as shown in Figure 1. The station number is 48698 in the World Meteorological Organization (WMO) network. The radiosonde observation times are twice per day at approximately 00:00 UTC and 10:00 UTC. The total number of radiosonde observations collected from the year 2014 and 2015 is 1.194.
The temperature and altitude information obtained from the radiosonde data can be used to estimate the 0 °C isothermal height as shown in Figure 2. In order to determine the 0 °C isothermal levels for the corresponding rain events, the radiosonde data collected in Year 2014 and 2015, are processed as a reference for the melting layer top heights [1,19].

3. Methodology

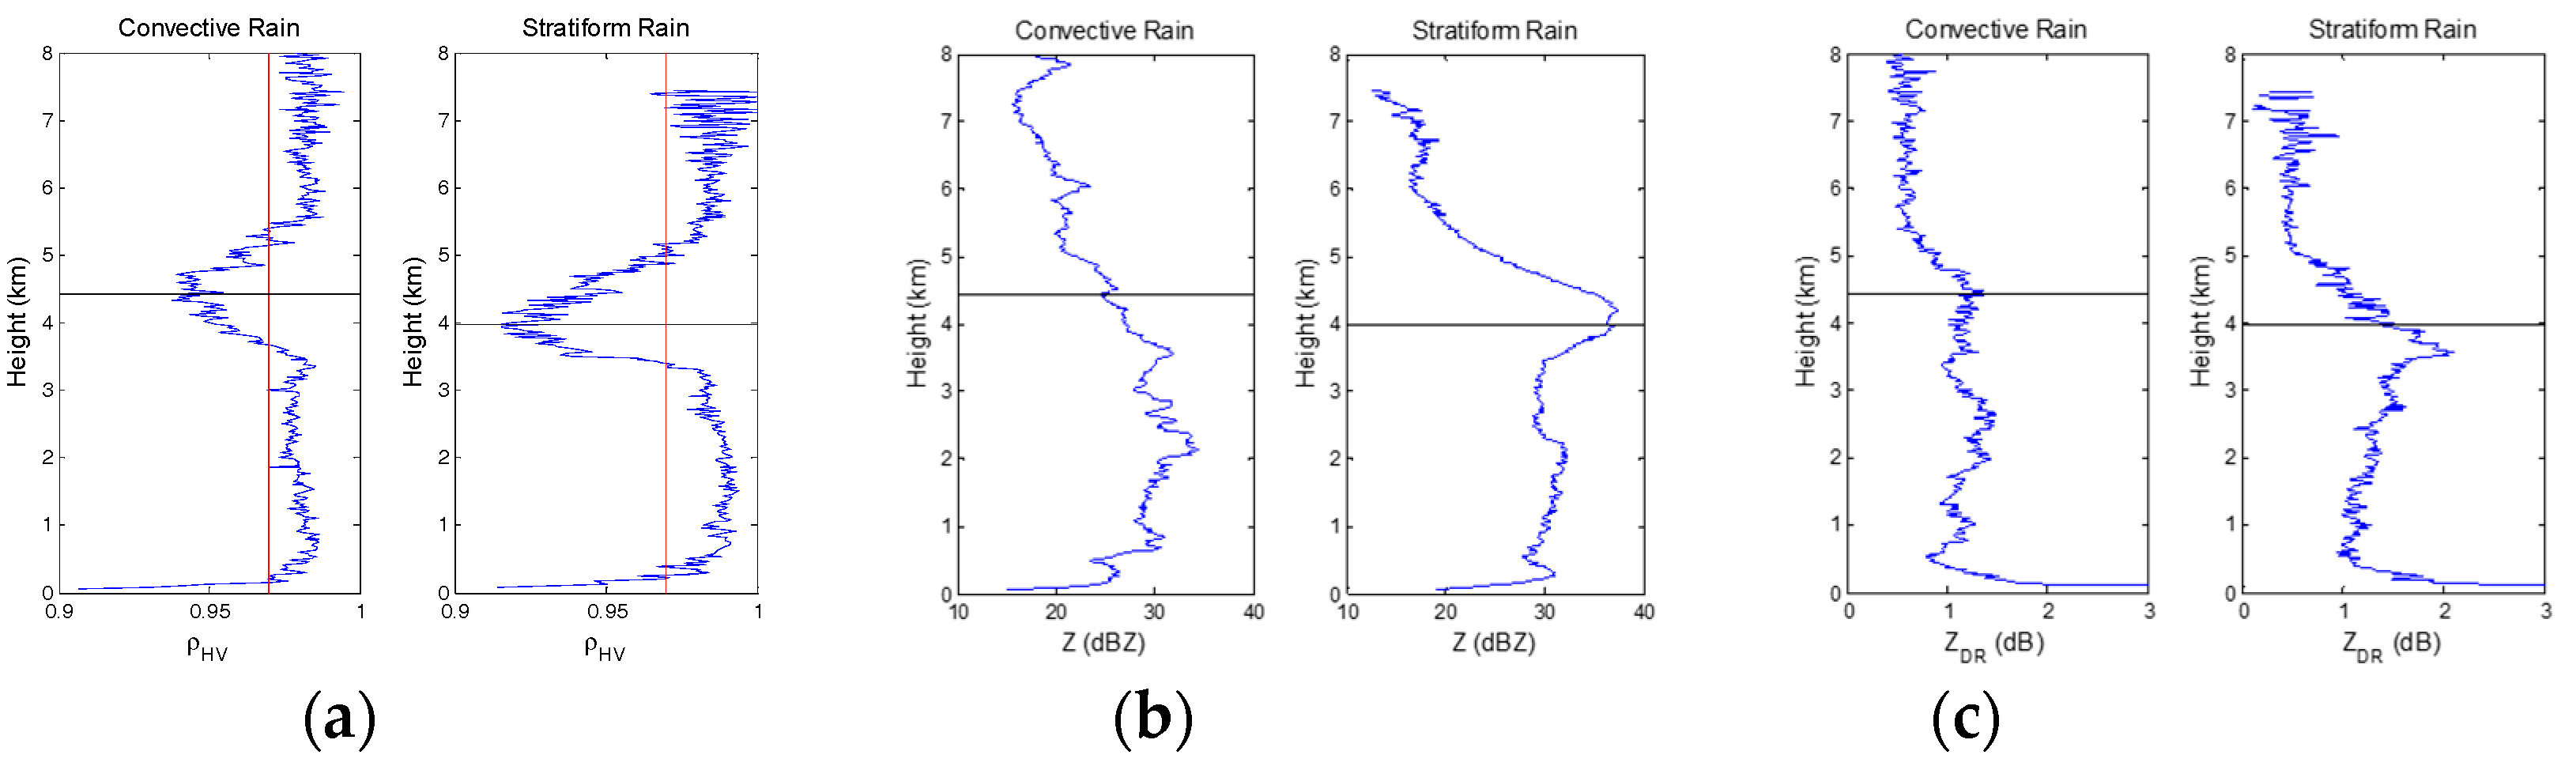
3.1. Identification of Melting Layer for Different Rain Cases

To investigate and identify the characteristics of melting layers in the tropical region, the dual-polarized radar data from three different categories of rains are processed and analyzed. The three different rain categories include stratiform rain only, convective rain only, and stratiform rain together with convective rain. For example, one radar PPI (Plan Position Indicator) image of the reflectivity measurement ( Z ) taken from 05:45 UTC on 21st April 2014 at an elevation angle of 5° is shown in Figure 3 over a 200 km by 200 km square area.
As shown in Figure 3, the center is Changi airport where the dual-polarized radar is located. Since the height information is very important for melting layer detection, the contour lines indicating the heights above ground level (a.g.l.) of the pixels are included in the figures. The contour lines at 2 km intervals are specified as shown in Figure 3. For the 5° elevation angle, the maximum height is 8.72 km a.g.l. at the range of 100 km.
In Figure 3a, maximum reflectivity is observed at a height of around 4 km a.g.l., which are due to the bright band effect of stratiform rain melting layer. Similar effect can be also observed in Figure 3c in the south western part at a similar height of around 4 km a.g.l. For convective rain event shown in Figure 3b, there is no any clear bright band effect since the maximum reflectivity spreads over the height ranging from ground level to around 5 km a.g.l. In this rain region, the maximum reflectivity is recorded to be 56 dBZ, which is equivalent to a rainfall rate of 169 mm/h [20]. This high rainfall rate clearly is categorized as convective rain as reported in [21]. Similar convective rain cell can also be observed in Figure 3c in the northern part. The maximum reflectivity in the northern part of Figure 3c is at 57.5 dBZ (i.e., rainfall rate of 217 mm/h) which clearly indicates a convective rain event. Therefore, it is clear from Figure 3a,c that for the stratiform rain, maximum reflectivity is concentrated in the melting layer area with similar altitude, the bright band, while for the convective rain the maximum reflectivity spreads across a vertical range from ground level to 5 km a.g.l. and therefore, the melting layer cannot be easily identified.
To detect the melting layer accurately, as reported in the Giangrande model [1], three measurements ( Z ,   Z DR ,   ρ HV ) from the dual-polarized radar should be processed and analyzed. Giangrande et al. proposed to use these three parameters for the detection of stratiform rain melting layer. It suggested that the value of ρ HV should fall between 0.90 and 0.97, the maximum value of Z DR should be within the interval of 0.8 to 2.5 dB and the maximum value of Z should fall between 30 and 47 dBZ. All these three criteria should be fulfilled in the same window of 500 m for a melting layer to be identified.
Taking the stratiform rain together with convective rain case in Figure 3c as an example, radar PPI images of ρ HV and Z DR at the same moment are plotted in Figure 4. In Figure 4a, a light circle ring with ρ HV around 0.95 can be observed at the height around 4 km a.g.l. indicating the melting layer. The height of convective rain melting layer in the northern part is found to be slightly higher between 4 km a.g.l. to 5 km a.g.l. as compared to the stratiform rain melting layer in the south western part. In Figure 4b for stratiform rain region, the maximum value of differential reflectivity Z DR can be found around the melting layer area region, however for the convective rain region, it is scattered. Similar patterns are also observed for all other rain events processed. Therefore, among these three measurements ( Z ,   Z DR ,   ρ HV ), it can be concluded that ρ HV is the best indicator for melting layer detection, since it has the ability to detect both the stratiform and convective rain melting layers. In the next section, differentiation of the two types of stratiform and convective rain melting layers will be carried out. By processing three parameters ( Z ,   Z DR ,   ρ HV ) of radar measurements along the slant path from each type of rain events, the characteristics of stratiform and convective rain melting layers will be analyzed and discussed.

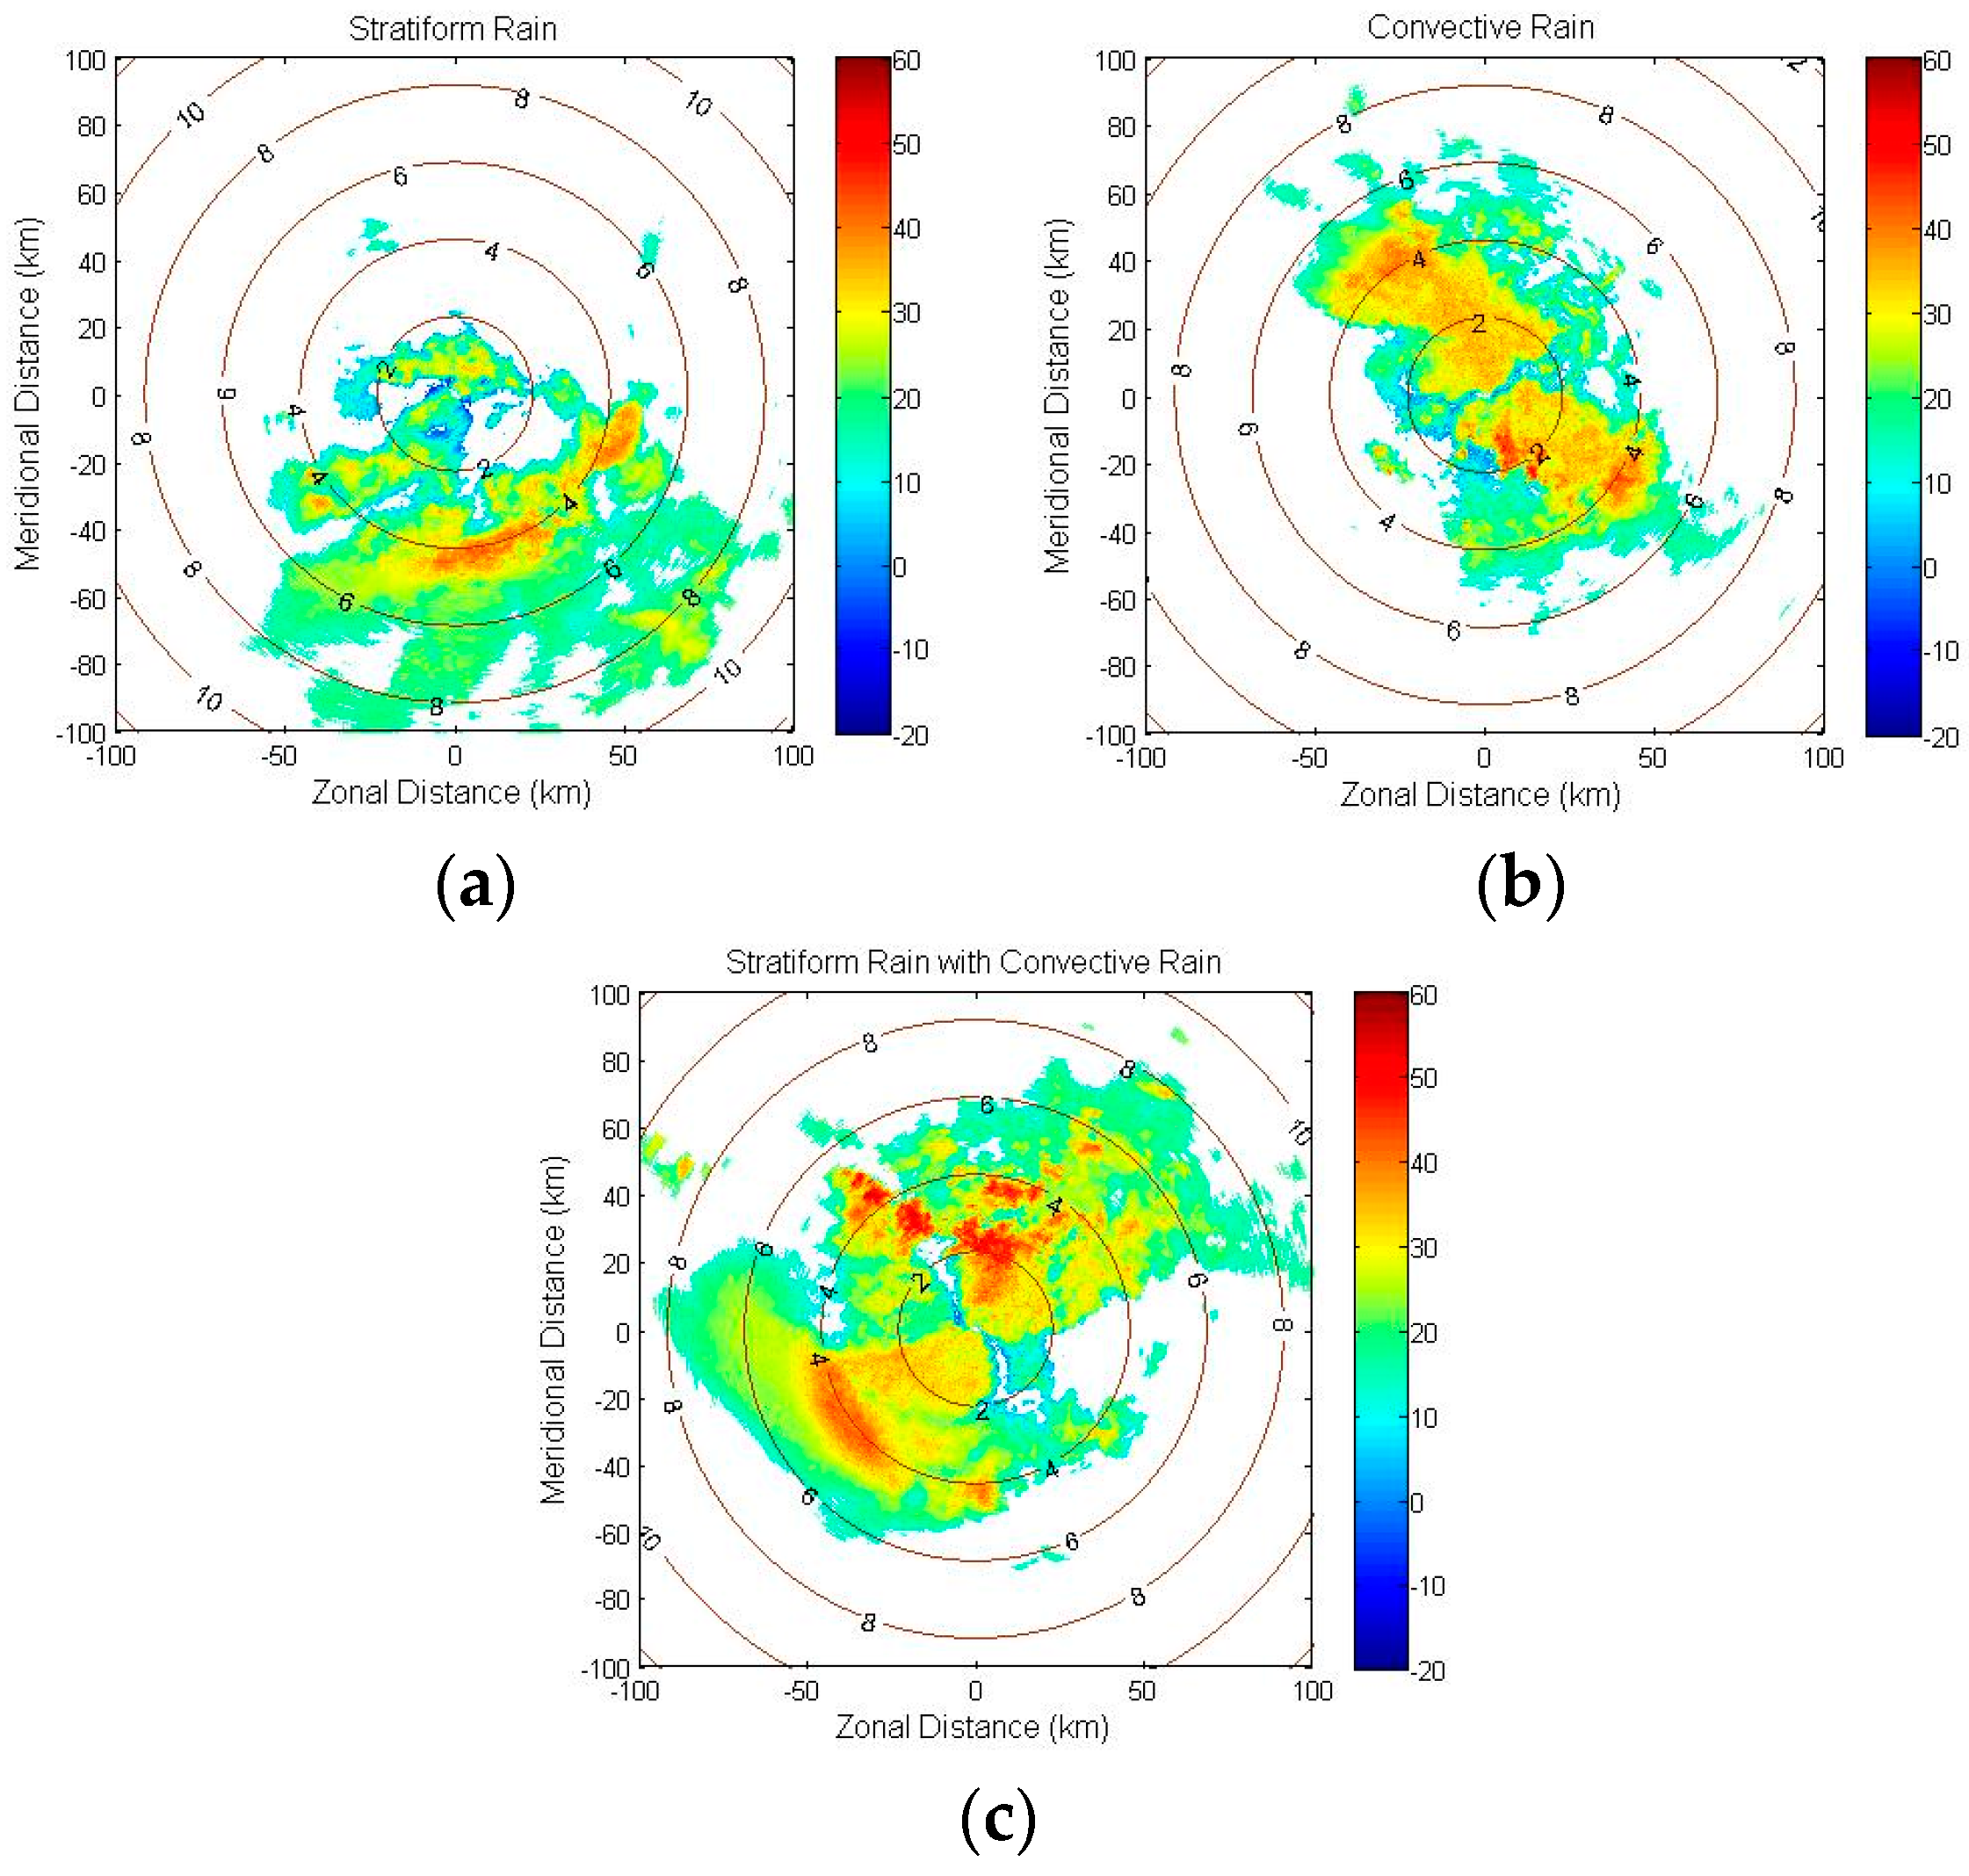
3.2. Differentiation between Stratiform and Convective Rain

In order to better understand the characteristics of stratiform rain and convective rain cells, a method to differentiate these two types of rain is proposed in this section. By considering the top height of the melting layer to be at the 0 °C isothermal height and the thickness is around 500 m [1,22,23], it is noted that in the tropical region, the height of stratiform rain melting layer is typically within 3 km a.g.l. to 5 km a.g.l. [12,24].
The proposed method for the classification of the stratiform rain cell and convective rain cell in this study is given as such:
  • a reflectivity of 30 dBZ [1] is taken as the threshold for melting layer detection, if the maximum reflectivity is above or equal to the threshold within the height range of 3 km a.g.l. to 5 km a.g.l., then this ray is considered to be passing through the stratiform rain cell.
  • with the same threshold of 30 dBZ, if the maximum reflectivity is above or equal to the threshold within the height range of 1 km a.g.l. to 3 km a.g.l., then this ray is considered to be passing through the convective rain cell.
After classifying all the slant rays, a clear separation of the stratiform rain cell in southwest and the convective rain cell in north from Figure 3c is plotted in Figure 5. It can be observed that the bright band area from stratiform rain melting layer is clear in the south western region of the plot. Although the convective rain cell can be identified in the northern region of the plot, there is no clear indication of the melting layer for the convective rain cell.
Therefore, in order to identify the convective melting layer and better understand the stratiform melting layer, vertical profiles of ρ HV , Z and Z DR for the two categories of rain cells are combined and averaged across the same height along each slant ray. The averaged vertical profiles of 3 radar parameters for the convective rain cell and the stratiform rain cell are presented in Figure 6. For the stratiform rain cell, 118 slant path profiles are used for averaging and for the convective rain cell, 61 slant path profiles are averaged. The vertical red line in Figure 6a is a reference line representing ρ HV = 0.97 [1]. The lower and upper boundary of the melting layer can be identified from the interception point between the measured ρ HV and the red line. The horizontal black line in Figure 6a indicates the minimum point of the measured ρ HV within the melting layer. From Figure 6, it can easily be seen that for the stratiform rain event, as indicated by the Giangrande model, the maximum value of Z and Z DR in Figure 6b and c respectively corresponds well to the minimum value of ρ HV in Figure 6a by the black line in all plots. This occurs roughly around the same height of 4 km a.g.l.
However, for the convective rain event, there is no obvious maximum in the Z and Z DR values in Figure 6b,c respectively. Two local maximums can be observed around the height of 2.5 km a.g.l. However, this is not the melting layer height for a convective rain cell in the tropical region. In [24], the 0 °C isothermal heights for tropical region are reported to be typically within the range of (4.2 km, 5.5 km). It is reported in [1,19,25] that the 0 °C isothermal height is generally taken as the top boundary of melting layers. Examining the value of ρ HV along the slant path of the convective rain cell in Figure 6a, by using a threshold of ρ HV < 0.97 , the melting layer height of the convective rain cell can be detected. In addition, it can be observed that the ρ HV minimum level of melting layer in the convective rain region is around 0.5 km higher than that of the stratiform rain region, which is also discussed in [17].
Therefore, the results show that the cross-correlation coefficient ρ HV can indicate the melting layer height not only for stratiform rain cells but also for convective rain cells. The variation and the maximum value of Z and Z DR are not so useful for convective rain cell melting layer detection.

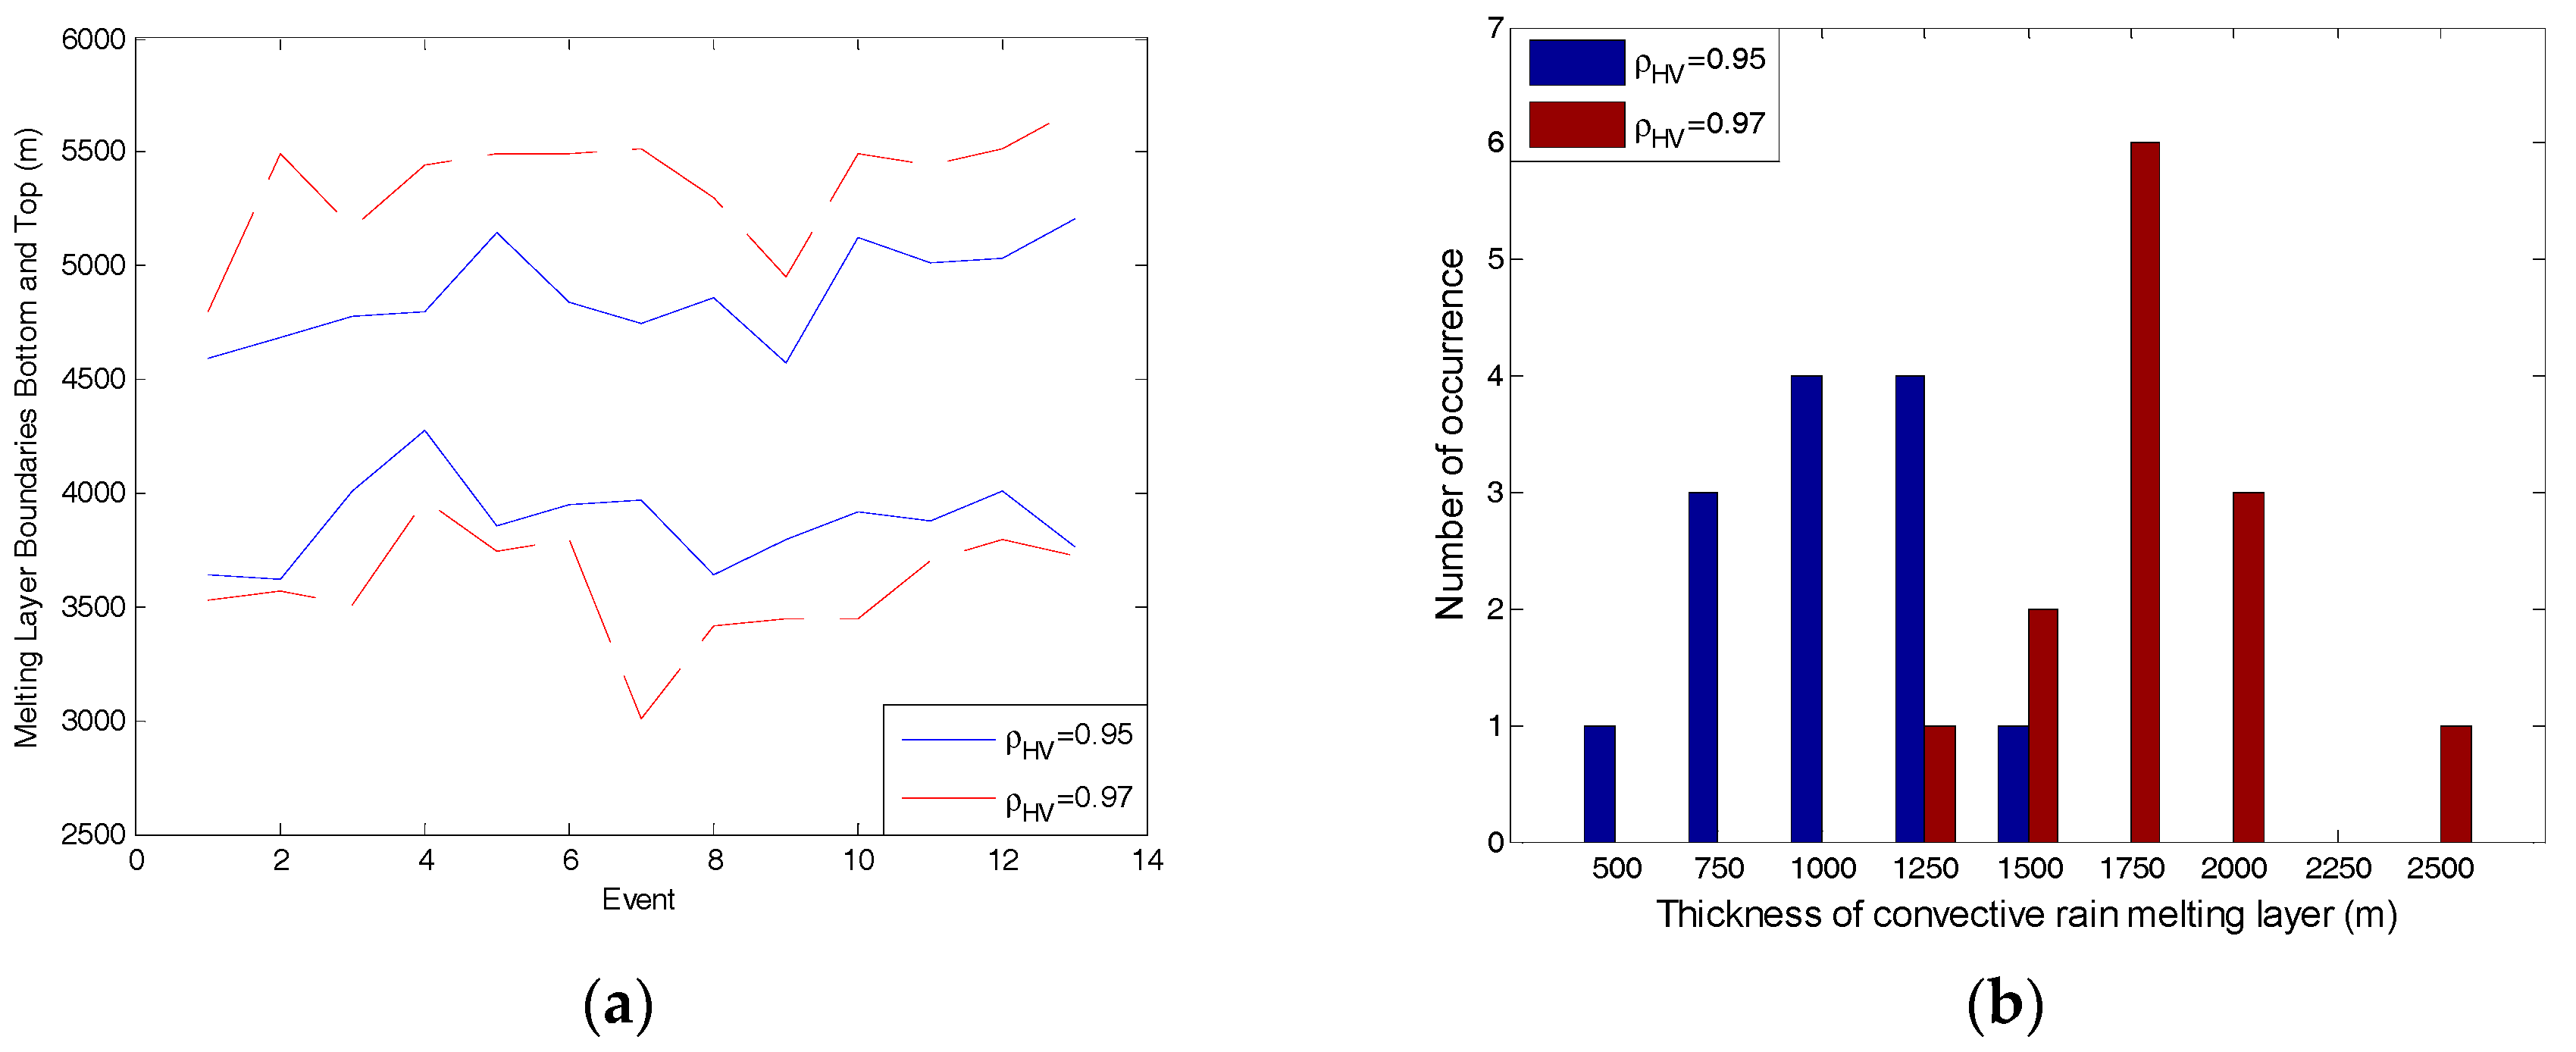
3.3. Proposed Threshold for Convective Rain Melting Layer Detection

After processing two-year dual-polarized radar data by using the differentiation and categorization methods as discussed above, 13 convective rain events with corresponding melting layers found via the radiosonde temperature profiles in the years 2014 and 2015. These events are listed in Table 1 with their corresponding date and time information. Since the top boundary of the melting layer is typically located where the 0 °C isothermal height is [1,19,25], the vertical profiles of temperature data measured by the radiosonde are processed in order to retrieve the 0 °C isothermal height. In Table 1, the convective rain with melting layers detected are found to have the corresponding radiosonde measurements (at 00:00 UTC and 10:00 UTC) of 0 °C isothermal height within 6 h. The time difference for these events can be as small as 1 h to as large as 5 h and 40 min. Due to the limitation in radiosonde data resolution, linear interpolation technique is applied to the temperature and height data. From Table 1, it can be observed that for these recorded events, the range of 0 °C isothermal height is from around 4500 m to 5100 m with very small variations throughout the whole year. This is because Singapore is in the equatorial region where seasonal temperature fluctuation is very small compared to the subtropical and temperate regions.
In order to determine the threshold value of ρ HV for the detection of the top boundary of the convective rain cell melting layer and ensure that this detected top boundary corresponds to the 0 °C isothermal height obtained from the radiosonde data, the 0 °C isothermal height with its corresponding ρ HV for each convective rain cell is plotted in Figure 7. Among the recorded events, the time difference between the recorded dual-polarized radar data and the closest radiosonde data are divided into 3 categories: 2 convective rain cells are detected within 2 h of the radiosonde, 6 convective rain cells are detected within 3 h and all the events are within 6 h as listed in Table 1.
From Figure 7, the ρ HV values at 0 °C isothermal heights for all the 13 events fall into the range of 0.94 to 0.965, which are all less than the threshold of 0.97 proposed in the Giangrande model [1]. Therefore, for the convective rain cell melting layer detection, the threshold of 0.97 is too high and can cause overestimation. From the analysis of results shown in Figure 7, data with less time difference is found to be more concentrated together due to the relatively small drifting effect. In order to propose an appropriate ρ HV value for convective rain cell melting layer detection, we focus on the data with 0 °C isothermal height that is less than 3 h apart. It can be observed that most of ρ HV values are around 0.95 in Figure 7.
Therefore, the proposed criterion for convective rain cell melting layer detection in this study is given as: For convective rain cell, if the measured cross correlation coefficient ρ HV is smaller than 0.95, this level is treated to be in the melting layer.

4. Results and Discussion

4.1. Performance Evaluation of Proposed Threshold

In order to evaluate the performance of the proposed threshold for detecting the top boundary of the convective rain melting layer, a scatter plot between the 0 °C isothermal height and the top boundary of the melting layer detected by the new proposed threshold and by the Giangrande model [1] are both plotted in Figure 8. The black line is y = x , which represents when the height of the melting layer top boundary is equal to the 0 °C isothermal height. From Figure 8, the top boundary of the melting layer detected by using the new proposed threshold ( ρ HV = 0.95 ) are observed much closer to the 0 °C isothermal heights, and the threshold ( ρ HV = 0.97 ) from the Giangrande model tends to overestimate the convective melting layer top heights.
By applying the new proposed threshold ( ρ HV = 0.95 ) , the melting layer top and bottom heights are estimated for each convective rain cell as shown in Figure 9a. By taking the difference between the melting layer top height and bottom height, the thickness of the convective rain cell melting layer can be determined. The histograms of convective rain melting layer thickness by using the two different thresholds (proposed threshold of 0.95 and Giangrande threshold of 0.97) are plotted in Figure 9b with the bin size of 250 m. It can be observed that for the convective rain melting layer thickness detected by the proposed threshold ( ρ HV = 0.95 ) , the minimum thickness is around 500 m, and the maximum is around 1500 m with most of the thickness around 1000 m. While for the convective rain melting layer thickness detected by using the Giangrande threshold ( ρ HV = 0.95 ) , the minimum thickness is around 1250 m, and maximum is around 2500 m with most of the thickness around 1750 m. As discussed in the previous section, the threshold from the Giangrande model tends to overestimate the convective melting layer top heights, therefore it also overestimates the thickness of the convective rain melting layer.
As reported in [17], the convective rain melting layer thickness is about 1.5 to 2 times that of the stratiform rain melting layer. The stratiform rain melting layer thickness is found to be around 500 m [1,22,25]. Therefore, the convective rain cell melting layer is around 750 to 1000 m. Using the Giangrande model, the thickness of convective rain melting layer is around 3 to 4 times that of the stratiform rain melting layer height as shown in Figure 9b. Clearly, the model overestimates the thickness of the convective rain melting layer. From our proposed model, the convective rain melting layer is found to be approximately 2 times that of the stratiform rain melting layer (Figure 9), this is consistent with those reported in [17]. Therefore, the new proposed threshold is more accurate for detecting the convective rain melting layer thickness.

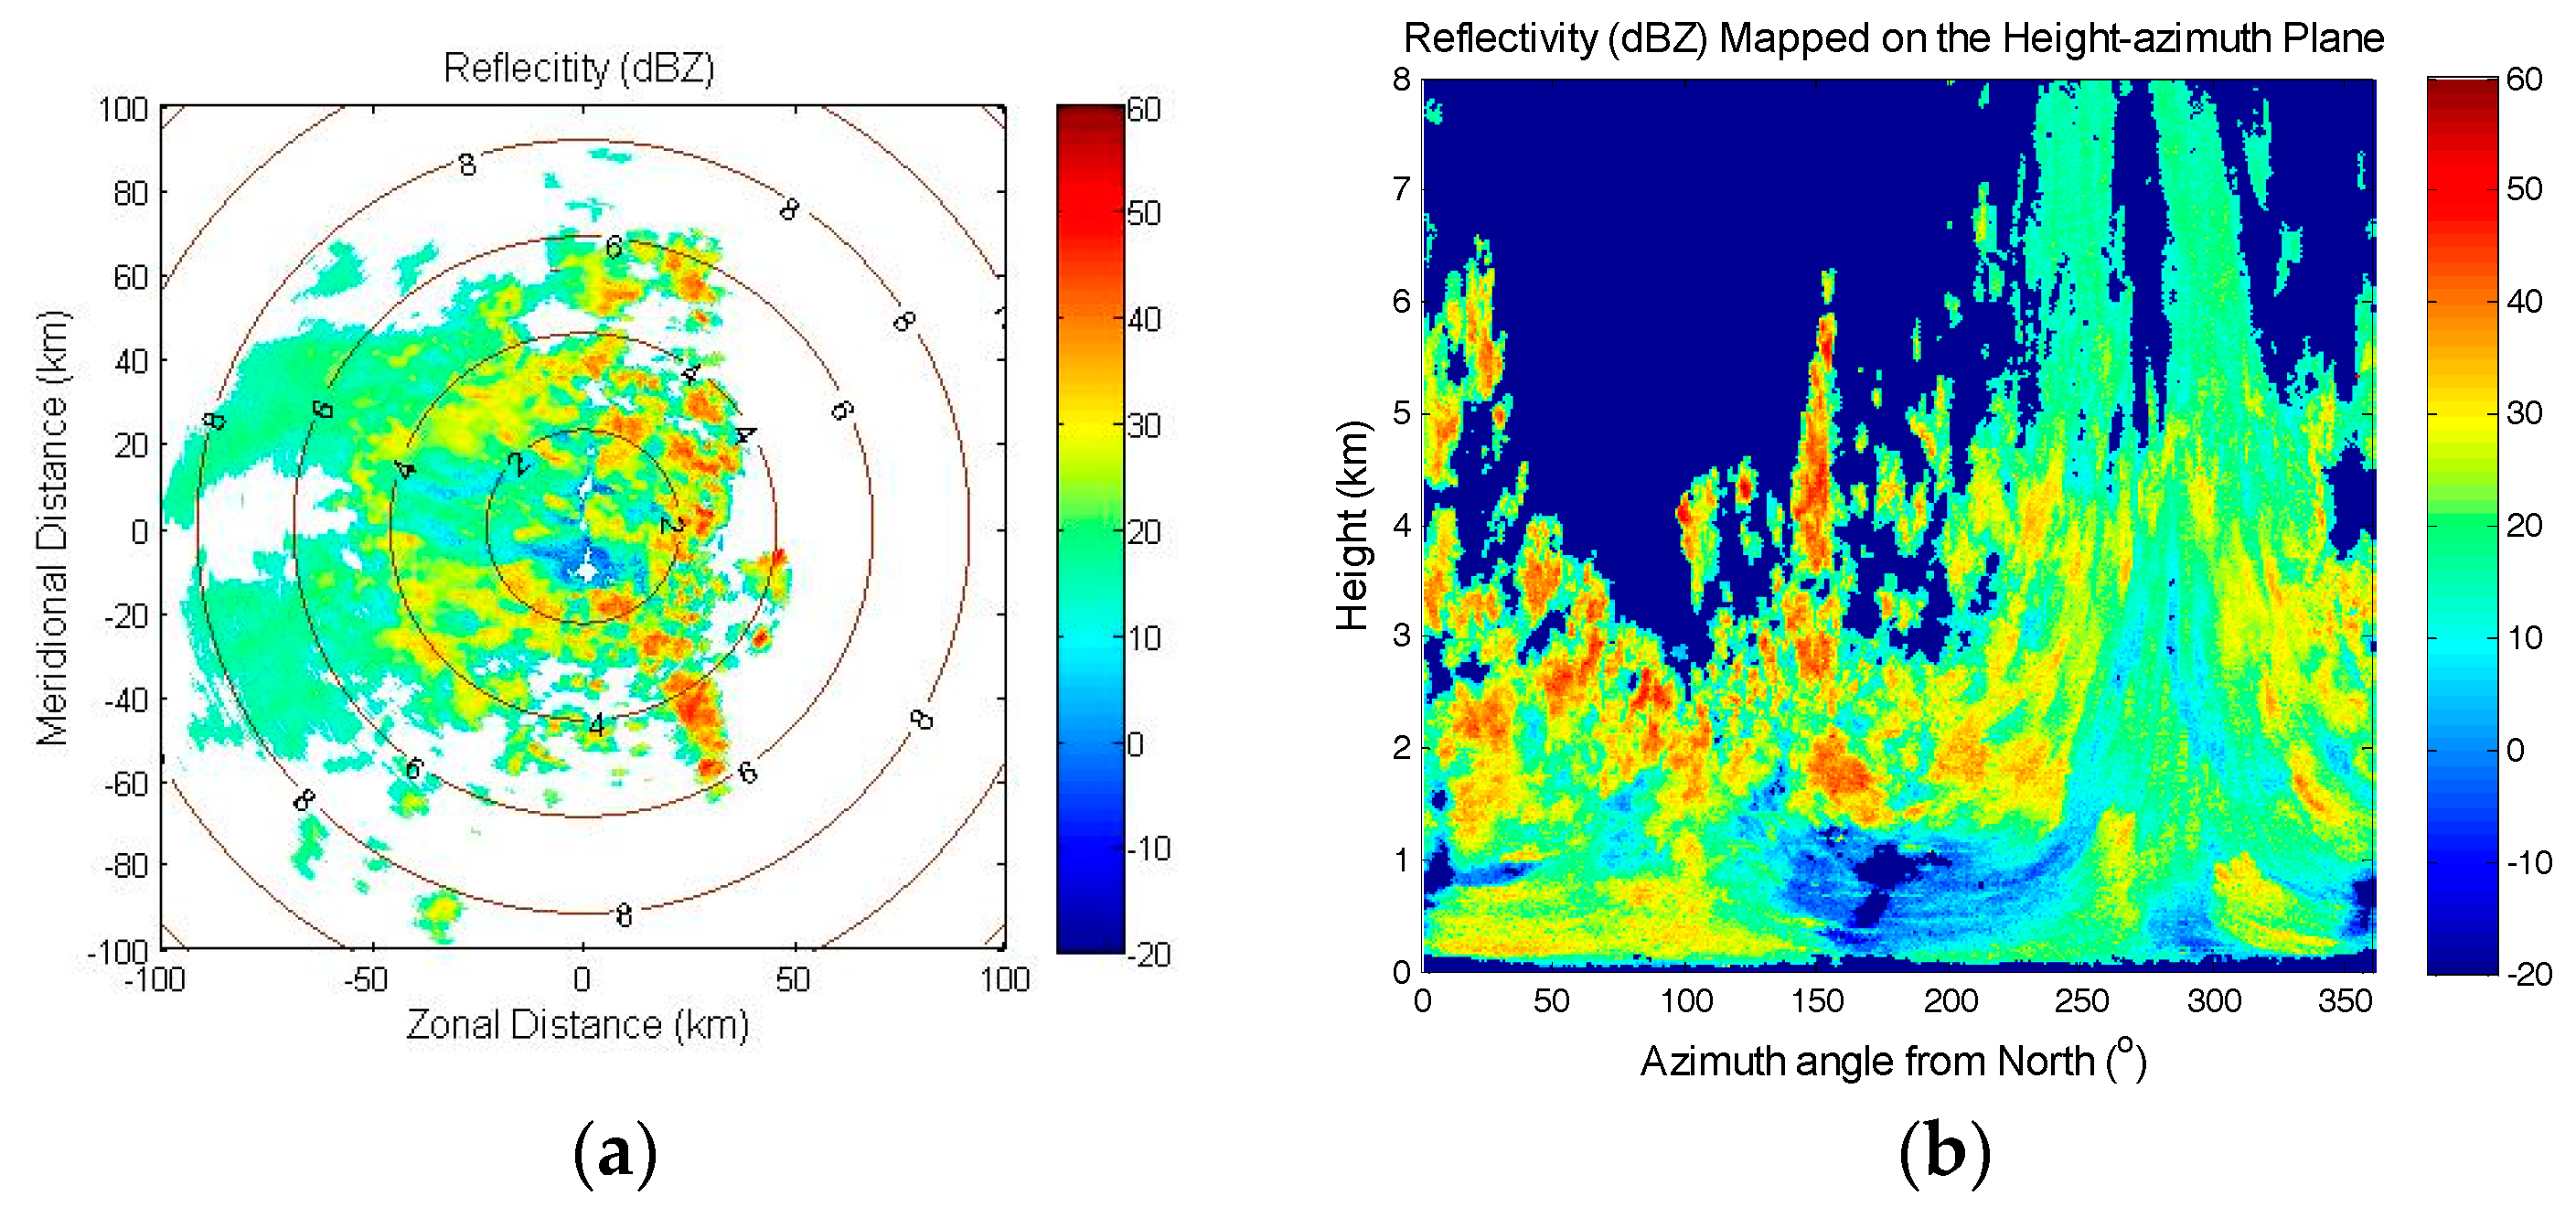
4.2. Special Case for Convective Rain

One special case with convective rain updraft effect recorded at 14:55 UTC on the 14th June 2014 as shown in Figure 10 was identified through processing the dual-polarized radar data. Figure 10a shows many simultaneous small-scale convective rain cells scattered over the eastern part. To study the vertical structure of these small-scale convective rain cells, the radar reflectivity mapped on the height-azimuth plane for Figure 10a is plotted in Figure 10b. The maximum reflectivity of this convective rain event is recorded at an azimuth angle of 150° with a maximum reflectivity of 52.5 dBZ (i.e., rainfall rate of 95 mm/h). This represents a heavy convective rain event and the rain cell height extends up to above 6 km a.g.l. This height is around 1 km higher than the average 0 °C isothermal heights which is reported in [24] to be within (4.2 km, 5.5 km) (processed from one-year radiosonde temperature vertical profiles in Singapore [24]). In [1,19,25], it was reported that the 0 °C isothermal height is close to the top boundary of the melting layer and the rain height. Therefore, the raindrops around 6 km a.g.l. in this convective rain event is most probably due to the lifting effect from an updraft phenomenon. For this type of convective rain events, the melting layer cannot clearly be identified due to the mixing of raindrops with the melting layer region.

5. Conclusions

In this paper, S-band dual-polarized radar data are processed for the analysis of the melting layer structure for both convective and stratiform rains in the tropical region, especially for the convective rain. By investigating three radar measurements ( ρ HV , Z , Z DR ), the cross-correlation coefficient ρ HV is found to be the best indicator for the identification of the melting layer particularly for convective rain cells.
By studying the heights of maximum reflectivity for stratiform rain cells and convective rain cells, a method is proposed to differentiate and categorize stratiform rain cell and convective rain cell. 13 convective rain cells melting layers with associated radiosonde temperature profiles are found in the year of 2014 and 2015. Taking 0 °C isothermal height from radiosonde profile as the top boundary for the melting layer, it is found that for convective rain events in the tropical region, the threshold for melting layer detection shall be revised as ρ HV = 0.95 . By applying this newly proposed threshold, the thickness of convective rain melting layer is found to be more accurate. The detected melting layer thickness for convective rain is around 1000 m, which is around 2 times that of the melting layer thickness of the stratiform rain.
In addition, a special case of convective rain cell is investigated. The maximum reflectivity of this convective rain cell extends up to above 6 km due to the lifting effect. For this type of convective rain events, the melting layer cannot clearly be identified due to the mixing of raindrops within the melting layer region.

Author Contributions

Conceptualization, F.Y., Y.H.L., Y.S.M. and J.T.O.; Methodology, F.Y., Y.H.L., Y.S.M. and J.T.O.; Software, F.Y.; Formal Analysis, F.Y., Y.H.L., Y.S.M. and J.T.O.; Investigation, F.Y., Y.H.L., Y.S.M. and J.T.O.; Resources, F.Y. and Y.H.L.; Writing-Original Draft Preparation, F.Y.; Writing-Review & Editing, F.Y., Y.H.L. and Y.S.M.; Visualization, F.Y.; Supervision, Y.H.L. and Y.S.M.; Funding Acquisition, Y.H.L.

Funding

This research was funded in part by the Defence Science and Technology Agency, Singapore.

Acknowledgments

The authors would like to thank Department of Atmospheric Science from University of Wyoming for providing the data used in this paper. We also thank the anonymous reviewers for their suggestions for improving this paper.

Conflicts of Interest

The authors declare no conflict of interest.

References

  1. Giangrande, S.E.; Krause, J.M.; Ryzhkov, A.V. Automatic designation of the melting layer with a polarimetric prototype of the WSR-88D radar. J. Appl. Meteorol. 2007, 47, 1354–1364. [Google Scholar] [CrossRef]
  2. Zhang, W.; Karhu, S.I.; Salonen, E.T. Predictions of radiowave attenuations due to a melting layer of precipitation. IEEE Trans. Antennas Propag. 1994, 42, 492–500. [Google Scholar] [CrossRef]
  3. Romo, J.A.; Maruri, M.; Pérez-Fontán, F.; Fernández, I. Characterization of maximum radar reflectivity height during stratiform rain events. IEEE Trans. Antennas Propag. 2012, 60, 4884–4891. [Google Scholar] [CrossRef]
  4. Lerber, A.; Moisseev, D.; Leinonen, J.; Koistinen, J.; Hallikainen, M.T. Modeling Radar Attenuation by a Low Melting Layer with Optimized Model Parameters at C-Band. IEEE Trans. Geosci. Remote Sens. 2015, 53, 724–737. [Google Scholar] [CrossRef]
  5. Pujol, O.; Mesnard, F.; Sauvageot, H. Effects of Melting Layer in Airborne Meteorological X-Band Radar Observations. IEEE Trans. Geosci. Remote Sens. 2012, 50, 2318–2324. [Google Scholar] [CrossRef]
  6. Russchenberg, H.W.J.; Ligthart, L.P. Backscattering by and propagation through the melting layer of precipitation: A new polarimetric model. IEEE Trans. Geosci. Remote Sens. 1996, 34, 3–14. [Google Scholar] [CrossRef]
  7. Raynaud, L.; Chenerie, I.; Lemorton, J. Modeling of radiowave scattering in the melting layer of precipitation. IEEE Trans. Geosci. Remote Sens. 2000, 38, 1574–1584. [Google Scholar] [CrossRef]
  8. Marzano, F.S.; Bauer, P. Sensitivity analysis of airborne microwave retrieval of stratiform precipitation to the melting layer parameterization. IEEE Trans. Geosci. Remote Sens. 2001, 39, 75–91. [Google Scholar] [CrossRef]
  9. Panagopoulos, A.D.; Arapoglou, P.M.; Cottis, P.G. Satellite communications at Ku, Ka, and V bands: Propagation impairments and mitigation techniques. IEEE Commun. Surv. Tutor. 2004, 6, 2–14. [Google Scholar] [CrossRef]
  10. Vivekanandan, J.; Zrnic, D.S.; Ellis, S.M.; Oye, R.; Ryzhkov, A.V.; Straka, J. Cloud microphysics retrieval using S-band dual-polarization radar measurements. Bull. Am. Meteorol. Soc. 1999, 80, 381–388. [Google Scholar] [CrossRef]
  11. Wilson, C.L.; Tan, J.; Goddard, J.W.F.; Ong, J.T. Radar Vertical Profiles and Melting Layer Studies from an S-Band Doppler Polarization-Diversity Radar Campaign in Singapore. Available online: https://ams.confex.com/ams/30radar/techprogram/paper_21517.htm (accessed on 1 November 2018).
  12. Wilson, C.L.; Tan, J. Melting layer studies in Singapore: experimental results from an S-band doppler polarisation-diversity radar. Phys. Chem. Earth Part B: Hydrol. Ocean. Atmos. 2000, 25, 1129–1132. [Google Scholar] [CrossRef]
  13. Kalogiros, J.; Anagnostou, M.N.; Anagnostou, E.N.; Montopoli, M.; Picciotti, E.; Marzano, F.S. Correction of polarimetric radar reflectivity measurements and rainfall estimates for apparent vertical profile in stratiform rain. J. Appl. Meteorol. Climatol. 2013, 52, 1170–1186. [Google Scholar] [CrossRef]
  14. Matrosov, S.Y.; Kingsmill, D.E.; Martner, B.E.; Ralph, F.M. The utility of X-band polarimetric radar for quantitative estimates of rainfall parameters. J. Hydrometeorol. 2005, 6, 248–262. [Google Scholar] [CrossRef]
  15. Teshiba, M.S.; Chilson, P.B.; Ryzhkov, A.V.T.; Schuur, J.; Palmer, R.D. A combined wind profiler and polarimetric weather radar method for the investigation of precipitation and vertical velocities. J. Atmos. Ocean. Technol. 2008, 26, 1940–1955. [Google Scholar] [CrossRef]
  16. Shusse, Y.; Nakagawa, K.; Takahashi, N.; Satoh, S.; Iguchi, T. Characteristics of polarimetric radar variables in three types of rainfalls in Baiu front event over the East China Sea. J. Meteorol. Soc. Jpn. 2009, 87, 865–875. [Google Scholar] [CrossRef]
  17. Shusse, Y.; Takahashi, N.; Nakagawa, K.; Satoh, S.; Iguchi, T. Polarimetric radar observation of the melting layer in a convective rainfall system during the rainy season over the East China sea. J. Appl. Meteorpl. Climatol. 2011, 50, 354–367. [Google Scholar] [CrossRef]
  18. Department of Atmospheric Science, University of Wyoming. Available online: http://weather.uwyo.edu/upperair/sounding.html (accessed on 31 October 2018).
  19. Wolfensberger, D.; Scipion, D.; Berne, A. Detection and characterization of the melting layer based on polarimetric radar scans. Q. J. R. Meteorol. Soc. 2015, 142, 108–124. [Google Scholar] [CrossRef] [Green Version]
  20. Alexander, V.R.; Scott, E.G.; Terry, J.S. Rainfall estimation with a polarimetric prototype of WSR-88D. J. Appl. Meteorol. 2004, 44, 502–515. [Google Scholar]
  21. Capsoni, C.; Luini, L.; Paraboni, A.; Riva, C.; Martelluci, A. A new prediction model of rain attenuation that separately accounts for stratiform and convective rain. IEEE Trans. Antennas Propag. 2009, 57, 196–203. [Google Scholar] [CrossRef]
  22. Fabry, F.; Zawadzki, I. Long-term radar observations of the melting layer of precipitation and their interpretation. J. Atmos. Sci. 1995, 52, 838–851. [Google Scholar] [CrossRef]
  23. Hall, W.; Rico-Ramirez, M.A.; Kramer, S. Classification and correction of the bright band using an operational C-band polarimetric radar. J. Hydrol. 2015, 531, 248–258. [Google Scholar] [CrossRef] [Green Version]
  24. Model Comparison for Estimating Cloud Liquid Water Content and Attenuation in Tropical Region. Available online: https://0-ieeexplore-ieee-org.brum.beds.ac.uk/document/7848226 (accessed on 1 November 2018).
  25. ITU-R: Recommendation P.839-3. Rain Height Model for Prediction Methods. Propagation in Non-Ionized Media 2001. Available online: https://www.itu.int/rec/R-REC-P.839-3-200102-S/en (accessed on 1 November 2018).
Figure 1. Site locations of Changi airport and NEA upper air observatory.
Remotesensing 10 01740 g001
Figure 2. Radiosonde altitude and temperature measured at 10:00 UTC on 21 April 2014 with the indication of 0 °C isothermal height.
Remotesensing 10 01740 g002
Figure 3. Dual-polarized radar PPI images of Z for (a) stratiform rain only, (b) convective rain only, and (c) stratiform rain together with convective rain.
Remotesensing 10 01740 g003
Figure 4. Dual-polarized radar PPI images of (a) ρ HV , and (b) Z DR at 05:45 UTC on 21st April 2014 with an elevation angle of 5°.
Remotesensing 10 01740 g004
Figure 5. Radar reflectivity PPI for two separated rain events at 05:45 UTC on 21 April 2014.
Remotesensing 10 01740 g005
Figure 6. Averaged vertical profiles of (a) ρ HV , (b) Z and (c) Z DR at the same height for convective rain cell and stratiform rain cell at 05:45 UTC on 21st April 2014.
Remotesensing 10 01740 g006
Figure 7. Scatter plot between the 0 °C isothermal height and the corresponding ρ HV value for convective rain melting layer.
Remotesensing 10 01740 g007
Figure 8. Scatter plot between 0 °C isothermal height and convective rain melting layer top height detected using two different thresholds.
Remotesensing 10 01740 g008
Figure 9. (a) Melting layer bottom and top heights of convective rain cell (b) Histogram of convective rain cell melting layer thickness using two different thresholds.
Remotesensing 10 01740 g009
Figure 10. Radar reflectivity measured at 14:55 UTC on 14th June 2014 (a) PPI image (b) mapped on the height–azimuth plane.
Remotesensing 10 01740 g010
Table 1. Convective rain melting layer events with closest radiosonde data.
EventTime (UTC)Time Difference Comparing with Radiosonde0 °C Isothermal Height (m)Height of Maximum Reflectivity
04 Jan 201418:405 h 20 min47752092
05 Jan 201420:253 h 35 min4663675
21 Apr 201405:454 h 15 min51022135
05 Jun 201406:153 h 45 min48981133
14 Jun 201405:504 h 10 min50901961
30 Nov 201423:001 h48202593
04 Dec 201401:251 h 25 min47411830
12 Aug 201502:202 h 20 min47642462
01 Oct 201521:402 h 20 min4578174
27 Oct 201521:003 h47271155
08 Dec 201518:205 h 40 min5041218
12 Dec 201514:104 h 10 min49991133
13 Dec 201507:452 h 15 min49552114

