Instantaneous Top-of-Atmosphere Albedo Comparison between CERES and MISR over the Arctic


1
Department of Atmospheric Sciences, University of Illinois at Urbana-Champaign, Urbana, IL 61801, USA
2
Department of Physics, University of Auckland, Auckland 1142, New Zealand
3
Jet Propulsion Laboratory, California Institute of Technology, Pasadena, CA 91109, USA
*
Author to whom correspondence should be addressed.
Remote Sens. 2018, 10(12), 1882; https://0-doi-org.brum.beds.ac.uk/10.3390/rs10121882
Submission received: 9 October 2018
/
Revised: 15 November 2018
/
Accepted: 21 November 2018
/
Published: 25 November 2018
(This article belongs to the Special Issue MISR)
Abstract
:The top-of-atmosphere (TOA) albedo is one of the key parameters in determining the Arctic radiation budget, with continued validation of its retrieval accuracy still required. Based on three years (2007, 2015, 2016) of summertime (May–September) observations from the Clouds and the Earth’s Radiant Energy System (CERES) and the Multi-angle Imaging SpectroRadiometer (MISR), collocated instantaneous albedos for overcast ocean and snow/ice scenes were compared within the Arctic. For samples where both instruments classified the scene as overcast, the relative root-mean-square (RMS) difference between the sample albedos grew as the solar zenith angle (SZA) increased. The RMS differences that were purely due to differential Bidirectional Reflectance Factor (BRF) anisotropic corrections () were estimated to be less than 4% for overcast ocean and overcast snow/ice when the SZA ≤ 70°. The significant agreement between the CERES and MISR strongly increased our confidence in using the instruments overcast cloud albedos in Arctic studies. Nevertheless, there was less agreement in the cloud albedos for larger solar zenith angles, where the RMS differences of reached 13.5% for overcast ocean scenes when the SZA > 80°. Additionally, inconsistencies between the CERES and MISR scene identifications were examined, resulting in an overall recommendation for improvements to the MISR snow/ice mask and a rework of the MISR Albedo Cloud Designation (ACD) field by incorporating known strengths of the standard MISR cloud masks.
1. Introduction
The top-of-atmosphere (TOA) albedo, which is defined as the fraction of incoming solar irradiance that is scattered back to space by the earth-atmosphere system, is one of the key quantities in determining the global energy balance [1,2]. Since a decrease of ~0.01 in the global mean albedo is equivalent to direct radiative forcing at the surface of doubling carbon dioxide in the atmosphere [3], accurate TOA albedo monitoring is crucial to both the examination of the Earth’s radiation budget (ERB) and in understanding how the Earth’s system is changing. Recently, changes in the Arctic TOA albedo have become a strong focus of research given the rapidly retreating Arctic sea ice extent, which is recognized as one of the most profound climate changes associated with global warming [4]. During the melt season, the white reflective surfaces of snow-covered ice and bare ice gradually form relatively dark ponded sea ice with some of it ultimately getting replaced by the dark ocean. This change is seen as Arctic darkening as observed from space when uncompensated by other changes, such as an increase in cloudiness. Pistone et al. [5] argued that the shortwave radiative forcing at the TOA associated with Arctic darkening was equivalent to 25% of the global CO2 direct forcing during the study period (1979–2011). Such a large sensitivity of the Arctic climate to the ice-albedo feedback raises the importance of obtaining reliable estimates of the Arctic TOA albedo from the Earth-orbiting satellite sensors.
The TOA albedo monitoring systems can be broadly divided into broadband and narrowband sensors, which have been well summarized along with the respective pros and cons in Reference [6]. As one of the best products in characterizing the Earth’s TOA albedo, the Clouds and the Earth’s Radiant Energy System (CERES) TOA albedo datasets have been widely used in Arctic studies [5,7,8,9,10]. However, the quality assessment of the datasets is severely limited by there being few other available TOA albedo datasets available for comparison, particularly datasets that have collocated field-of-views (FOVs) in space and time. Since there are no direct measurements of TOA albedos, but only retrievals from the instantaneous radiances, current CERES TOA instantaneous albedos are mostly evaluated by performing consistency checks between oblique- and nadir-view retrievals, using either CERES along-track observations or spatially and temporally collected MODIS/MISR radiances [11,12,13]. Based on the merged Single Scanner Footprint TOA/Surface Fluxes/Clouds and MISR (SSFM) dataset [14], for example, Su et al. [13] found that the CERES SW flux consistency due to ADM uncertainty was ~6% for cloud conditions over snow/ice surfaces. Whether or not these methods provide unbiased error estimates is currently unknown. Comparisons with other independent albedo datasets provide an excellent way of elucidating the quality of and confidence in each dataset, and in understanding the potential areas requiring improvements.
Amongst the other independent TOA albedo datasets, such as the Scanning Radiometer for Radiation Balance (ScaRaB) [15] and the Geostationary Earth Radiation Budget (GERB) [16], only the Multi-angle Imaging SpectroRadiometer (MISR) [17] stands out as an excellent basis to compare against the CERES because it is on board the same Terra satellite platform as the CERES. Thus, its albedo dataset offers a unique opportunity to evaluate the performance of CERES TOA albedo retrievals using MISR and CERES overlapped near-nadir swaths when the CERES is in its cross-track mode of operations [11]. An early study by Sun et al. [18] showed that the CERES cloud albedo is highly consistent with the MISR cloud albedo for the low- and mid-latitude ocean regions. This was in agreement with Zhan and Davies [19], who showed that zonal trends of low- and mid-latitude albedo from the CERES and MISR corresponded well with each other after accounting for intercalibration differences. Nevertheless, Zhan and Davies [19] pointed out an unexpectedly large discrepancy between the CERES and MISR zonal albedo trends within the polar regions, suggesting the need to quantitatively compare the CERES and MISR TOA albedo products specifically within the Arctic region.
The objective of this study was to investigate the consistency of instantaneous CERES and MISR TOA albedos within the Arctic. Given that the MISR adopts the CERES angular distribution models (ADMs) for clear-sky albedo retrievals but applies the radiative transfer model (RTM)-based approach for cloud albedo estimates, we focused on quantifying the instruments overcast albedo retrieval differences that were functions of both the surface type and solar zenith angle. In the following assessment, three years (2007, 2015 and 2016) of CERES and MISR Level-2 instantaneous TOA albedo products were collected. This was followed by collocating MISR samples to each CERES FOV, as well as estimating the equivalent MISR operational albedos over the (20 km)2 CERES FOV. Finally, these collocated CERES and MISR TOA albedos were used to examine scene-dependent cloud albedo consistencies and to explore the scene classification performances.
2. Datasets
To achieve these aforementioned objectives, several datasets from both the CERES and MISR were collected for the Arctic sunlit months (May–October) in three years: 2007, 2015, and 2016. These three years were chosen to provide ample samples for statistical significance, with 2007 processed by the MISR project as the test-year for examining the new snow and ice mask (see below). These datasets are summarized in Table 1 and described in the following sub-sections.
2.1. CERES
The CERES albedo retrieval is based on a set of combined empirical and theoretical ADMs [20,21]. These scene-dependent ADMs were developed using a similar technique to Suttles et al. [22] but are based on actual CERES measurements to remove bias from the differential resolution between ADMs and observations [23]. Cloud properties included in the CERES Terra standard Level-2 product, namely the Single Scanner Footprint TOA/Surface Fluxes and Clouds (SSF), are inferred from coincident spectral measurements from MODIS.
The scene-dependent CERES shortwave albedo retrieval algorithm has been detailed in many studies [20,21,24]. In general, the CERES defines a footprint (20 km spatial resolution at nadir) as partly cloudy (PCL) once the imager-derived cloud fraction (f) is greater than 0.1%, and as overcast (OVC) if f ≥ 99% [21]. When the underlying surface is open water, the selection of ADMs depends on both the cloud types (liquid water, ice, or mixed phase) and a composite cloud parameter [ln] that is determined from the imager-based f and cloud optical depth (τ). The angular bin intervals are 2° for the solar zenith angle (SZA, ), viewing zenith angle (VZA, ), and the relative azimuth angle (RAZ, ). The ADMs over snow and ice surfaces were developed separately by Kato [20]. The snow and ice scenes were divided into three independent categories: permanent snow, fresh snow, and sea ice. Whilst the permanent snow scenes are limited to Greenland and Antarctica, fresh snow and sea ice are defined over land and water, respectively. The CERES uses daily snow and ice maps from the National Snow and Ice Data Centre (NSIDC), which ensures the timely update of snow and ice variations during the melt seasons. It should be noted that the CERES uses a predetermined monthly regional snow map for all three snow/ice types, accounting for the possible variations in the reflected radiance from changes in the microphysical properties of sea ice and snow [20]. While analysis showed that distinguishing the bright and dark surfaces improved albedo retrievals at the higher viewing and solar zenith angles, it also revealed that the albedo estimated from oblique (50° ≤ ≤ 60°) views differed from the nadir estimations with an overall RMS error of 9% [11]. Further study by Corbett and Su [25] found that most of the inconsistency can be removed by considering the sastrugi effect, which is implemented in the current operational Edition 4A products. In this study, we focused on examining the cloud albedo consistency of the CER_SSF_Terra-FM1-MODIS_Edition4A dataset with MISR, while its previous version (CER_SSF_Terra-FM1-MODIS_Edition3A) was also checked for the cases of large albedo inconsistency (e.g., at high solar zenith angles and overcast ocean).
2.2. MISR
Unlike the CERES, which is mainly based on empirical ADMs, the MISR takes advantage of its near-simultaneous multi-angle observing strategy. Up to nine reflected shortwave spectral radiances are viewed from a target within seven minutes at nadir and at 26.1°, 45.6°, 60° and 70.5° forward and aft of nadir along the satellite track, in four spectral bands: 0.446 ± 0.021 μm (Blue), 0.558 ± 0.015 μm (Green), 0.672 ± 0.011 μm (Red), and 0.866 ± 0.020 μm (NIR) [26]. Owing to the unique feature of deriving albedos from nine near-simultaneous measurements, the MISR is capable of retrieving accurate albedos for inhomogeneous clouds, especially for the oblique sun [17]. The MISR current albedo dataset (MISR_AM1_TC_ALBEDO_F05_0011) provides three different albedo products: local, restrictive, and expansive. The standard local albedos are defined for (2.2 km)2 subregions and account for the angular variation of BRF. These local albedos are then summed appropriately to obtain the restrictive albedos (i.e., the ratio of the reflected flux registered at the reflecting surfaces, as defined by the Reflectance-Layer Reference Altitude derived stereoscopically by the MISR, to the downwelling TOA irradiance) and the expansive albedos (i.e., the ratio of the reflected flux passing through the TOA registered at 30 km altitude to the downwelling TOA irradiance). In this study, we examined the restrictive albedo because it was closest to the CERES definition of albedo [17,18].
The MISR uses different methods to retrieve clear-sky and cloudy local albedos. The clear-sky local albedo is derived from a weighted average of the nine albedo estimates based on the CERES ADMs. Thus, it involves several issues such as the mismatched wavelength (MISR observations are narrowband but CERES ADMs are broadband) and the mismatched spatial resolution (observations are (2.2 km)2 but ADMs are (20 km)2). For the cloudy scenes, the MISR applies one of three techniques (i.e., deterministic, stochastic, and Solid Angle Weighting (SAW)) to correct azimuthal variation for each of the nine solid angle bins (SABs, one SAB corresponds to one MISR camera) [17]. The deterministic method is established by a plane-parallel model and targets homogeneous clouds. Owing to the large variety of cloud heterogeneities, failure in applying a deterministic method would result in the use of the stochastic approach, which are generic models derived from a large series of 3D radiative transfer simulations to provide for improved azimuthal corrections. The SAW method is applied to the An camera and is used if neither the deterministic nor stochastic methods succeed for other cameras. The SAW method is also used for all SABs if the region is established to be No Retrieval (NR) by the MISR Albedo Cloud Designation (ACD) field.
MISR employs a very different scene identification algorithm as compared to the CERES. For the snow and ice mask, the MISR uses monthly maps that call a region snow- and ice-covered if four or more days in the month had more than a 6% snow/ice fraction. Therefore, it could introduce biases in the melt season. The MISR operational albedo product adopts an ACD field (2.2 km)2 for its cloud classification, which is based solely on the Stereoscopically Derived Cloud Mask (SDCM) [17]. The SDCM uses a stereoscopic approach that calls a (1.1 km)2 footprint cloudy if the stereo-derived height is more than 562 m above the surface height. Within the Albedo processing system, an ACD field is designated as cloudy if any of the four sub-region SDCM values are classified as cloudy, otherwise it is designated as either clear (all four SDCM values are clear) or NR (all other cases). Given the inherent limitation of the SDCM, it has been observed that using this cloud mask classification may assign clear-sky ocean (which does not provide sufficient contrast to do the stereo matching) as NR and fail to detect clouds (or fog) with extremely low cloud top heights [27,28].
As cloud designation is an important part in classifying scene types, its performance in operational CERES and MISR albedo products needs to be systematically examined. Thus, we also included five other MISR standard cloud mask products [29] in four different MISR datasets (Table 1). The original SDCM and an updated SDCM were extracted from the MISR TC_STEREO and TC_CLOUD dataset, respectively. The Radiometric Camera-by-Camera Cloud Mask (RCCM) is a terrain-referenced cloud mask and is obtained from the MISR GRP_RCCM product [30,31,32], and is calculated independently for all nine cameras. As this study focused on the near-nadir albedo retrievals, only the An camera RCCM was used. Both the Angular Signature Cloud Mask (ASCM) [29,33] and the Consensus Cloud Mask (CCM) were obtained from the MISR TC_CLASSIFIERS product [34]. The ASCM is a D-camera terrain-referenced cloud mask and it uses band-differenced angular signatures [35] based on the two most oblique cameras viewing forward scattering radiation [33]. The CCM is a cloud mask that combines the results of the SDCM, RCCM, and ASCM. The CCM was originally designed pre-launch to be used within the MISR albedo processing system, but it was never implemented. The CCM calls a (2.2 km)2 region overcast if all four (1.1 km)2 pixels are classified as high confident cloudy by any of three cloud masks (i.e., ASCM, RCCM, and SDCM). As the CCM uses feature-referenced RCCM regardless of the underlying surface types, it would both overestimate the cloud fractions over snow/ice surfaces and assign NR for clear ocean pixels because the stereo-heights are not retrievable. To overcome these known problems, we introduced the best-estimate cloud fraction (CF) cloud mask (2.2 km resolution), which applies terrain-referenced RCCM, ASCM, and SDCM cloud mask(s) for open water and snow/ice surfaces, respectively, following much of the logic used to produce the MISR Cloud Fraction by Altitude product [36,37]. The performances of these cloud masks over different surface types is detailed in Section 4.2.
3. Instantaneous Albedo Collocation and Calculation
We chose a large area (poleward of 60° N) covering a long time period to accumulate a sufficient number of valid samples. All the aforementioned datasets (Table 1) from the CERES and MISR were collected and collocated. Table 2 summarizes the criteria for data selection, and “n/a” means the parameter was not specified to the particular instrument. Since the MISR uses a different scene identification scheme from the CERES, the collocated samples were further binned by MISR scene type when examining the consistency of the instruments albedo retrieval algorithms as described below. Moreover, the MISR assigns all the measured raw radiances (275 m) to a Reflecting Layer Reference Altitude (RLRA) surface (2.2 km), either to the top or side of a cloudy column [17]. The pre-processing results from some RLRA surfaces being obscured at oblique views, including in the cross-track direction, and it leads to the redistribution of all the radiance observations. In other words, a high obscuration within the MISR An-camera would indicate a high degree of cloud-top-altitude variability and it may result in a bias in the mean An-camera BRF over a CERES footprint, which would propagate to the MISR-CERES narrow-to-broadband analyses below. Thus, only MISR samples with more than 90% top-unobscured An-camera observations were considered in this study.
Within the Arctic, the data selection criteria given in Table 2 reduces the sampling significantly, relative to all the CERES retrievals within the broad CERES swath. Only ~17% of the CERES footprints had a VZA < 10°, of which ~40% were overcast. Overcast cloud over a uniform surface type observed by the CERES in the near-nadir (<10°) direction accounted for ~4% of all CERES samples across its full swath. Of these samples, only half passed the >90% unobscured RLRA criterion of the MISR. The analysis below was specific to these particular scene-types and viewing conditions. Issues of representativeness to a broader set of scene types and viewing conditions are discussed in Section 5.
Since the CERES and MISR are on board the same satellite platform, Terra, some of the footprints are collocated. However, the instantaneous footprints will only intersect in near-nadir directions due to the different operational scan modes between CERES FM1 (which is stuck in the cross-track sampling mode after 2002) and MISR (push-broom sampling). To collocate the samples, we applied an approach similar to the one used by Zhan and Davies [19], who used the MISR Toolkit (MTK). The MTK was developed by the Jet Propulsion Laboratory and it provides an interface to access the MISR datasets, including geolocation information. Further details on the MTK can be found on the MISR website https://eosweb.larc.nasa.gov/project/misr/tools/misr_toolkit.
For a CERES near-nadir FOV with a valid shortwave radiance and corresponding reflected flux, an MtkRegion R with CERES center latitude, longitude, that was expanded by 100 km was set by the MTK, which does not handle small region collocation properly. This was followed by using R to collect all the available MISR samples (2.2 km spatial resolution) within the region. Then, the great-circle distances (GD) between each MISR sample and the CERES were calculated. MISR samples with GD ≤ 10 km were then used in the following analysis. For a typical CERES nadir FOV with 20-km spatial resolution, the median number of valid MISR 2.2 km pixels was 64. Thus, any CERES FOV with less than 62 MISR pixels were excluded in the comparison. Although the proposed collocation may have introduced some potential errors, they should have been relatively small because the missing pixels were along the boundary of the CERES FOV.
The collocated MISR spectral radiances were then converted to BRFs and averaged for each CERES FOV. To estimate the corresponding MISR broadband BRF, we developed a set of scene-dependent narrow-to-broadband (NTB) BRF conversions that related the MISR red and Near Infrared (NIR) bands BRF to the CERES unfiltered broadband BRF as follows:
where , and were the CERES broadband BRF, and MISR red and NIR BRF, respectively. c0, c1 and c2 were the regression coefficients from a linear regression analysis, and were a function of both the solar zenith angles and surface types. The solar zenith angles were stratified into 10° bins to match the operational NTB bin size. The surface type, on the other hand, was either 100% ocean or 100% snow/ice (separated for sea ice, fresh snow, and permanent snow) as classified by the CERES. Unlike the previous studies [14,18], we did not further bin the samples by viewing the zenith angle, relative viewing azimuth angle, cloud fraction, etc. This is because we inherently chose nadir observations ( ≤ 10°) over overcast scenes (f ≥ 99.9%). Moreover, our results showed that using additional data such as MISR blue and green radiances, precipitable water, or effective cloud top height did not improve the narrow-to-broadband BRF conversion, which was consistent with Sun et al. [18].
As an example, Table 3 shows the coefficients, as well as relative RMS differences, of the MISR narrow-to-broadband BRF conversion over the CERES overcast ocean scenes. The coefficients of determination were extremely high for all the solar zenith angle ranges, implying these linear regressions were robust. The overall relative RMS differences in the MISR broadband BRF conversions were ~5% when solar zenith angles were less than 80°, with a slightly larger RMS difference (6.2%) for more oblique sun angles. Note that the reported RMS difference should include both the narrow-to-broadband BRF conversion error and sampling error. Here, the sampling error consisted of both the collocation of the instantaneous FOVs and the mismatched boundary pixels. Compared to the reported RMS difference of ~3% in Sun et al. [18], the larger integrated error mainly resulted from the larger sampling error caused by both using the coarse resolution MISR BRFs and not accounting for the CERES point spread function.
The relative RMS differences of MISR broadband BRF conversion were smaller for overcast snow/ice scenes. Table 4 shows the results for the collocated CERES overcast sea ice case. Except for the extremely high solar zenith angles, it was clear that the relative RMS differences were generally less than 5%, which was similar for overcast fresh snow (not shown). For overcast permanent snow scenes (not shown), the RMS difference from both the sampling error and the NTB BRF conversion error was even lower, being ~3% for all solar zenith angles. As we adopted the same methodology to retrieve the collocated samples, the sampling errors should be the same in all cases. Thus, the smaller RMS difference for the overcast snow/ice scenes compared to overcast ocean scenes may be because variations in cloud properties (e.g., optical depth) were more important over dark ocean surfaces than over bright snow/ice surfaces.
For the corresponding MISR broadband restrictive albedo (), instead of directly using the operational (35.2 km)2 data, we recalculated the based on the collocated (2.2 km)2 samples following the same approach referred to in the MISR Level 2 Top-of-Atmosphere Albedo Algorithm Theoretical Basis Document (ATBD) [17] and updated by Catherine Moroney [38] for the narrow-to-broadband conversion strategy. Firstly, we calculated the cosine of the solar zenith angle () of all the MISR samples. If any within the CERES-MISR collocated region was <0.04, the was not calculated. Following the ATBD, the can be expressed as:
where is the sum of the top-leaving contribution calculated from MISR broadband local albedos, which is a linear combination of the red and NIR local albedos (for cloudy scenes). is the side-leaving contribution that is a solid angle weighted side-leaving BRF of the collocated samples. In the standard MISR product, is estimated by applying the same narrow-to-broadband conversion coefficients (as the local albedo conversion) to red and NIR side-leaving contributions.
Note that these conversion coefficients only depend on the solar zenith angles and were developed by Sun et al. [18]. Although the coefficients were derived for overcast ocean scenes within low-/mid-latitudes, the MISR applies them to produce both broadband cloudy local albedos and restrictive/expansive albedos regardless of the surface type. Thus, the reported NTB albedo conversion errors (Table 1 in Reference [18]) cannot be directly used and the “real” error embedded in the albedo NTB conversion () needs to be reformulated. Here we assumed that the difference of the NTB conversion error () between BRF and albedo was similar for different surface types and SZA ranges. Bearing this assumption in mind, the scene-dependent NTB albedo conversion can be estimated from for each surface type (ocean, sea ice, fresh snow, and permanent snow) and solar zenith angle range. According to Sun et al. [18], approximately 2% and 3% RMS errors have been found for the MISR BRF and albedo NTB conversion, respectively. We then applied the resulting difference (2.2%) to be subtracted from the scene-dependent BRF NTB conversion error (Table 3 and Table 4) to estimate the error of the MISR albedo NTB conversion for different surface types and SZA ranges.
4. Results
4.1. Instantaneous SW Albedo Comparison
Based on the aforementioned methodology, Figure 1 shows the 2-D SW BRF and albedo histogram of the collocated samples in this study. In total, there were 1,497,817; 321,433; 84,543; and 120,335 valid samples over the CERES overcast (f ≥ 99.9%) ocean, sea ice, fresh snow and permanent snow scenes, respectively. Although the CERES identified many more overcast scenes over the ocean, the number of independent samples for all four cases, especially for all solar zenith angle ranges (Table 3 and Table 4), was sufficient to draw statistically significant conclusions.
For the CERES overcast ocean FOVS, Figure 1a, 1b show the collocated broadband BRFs and albedos, respectively. Overall, the relative RMS difference between the two instruments instantaneous broadband BRFs is 5.5% (Figure 1a). This RMS difference was due to sampling errors and narrow-to-broadband BRF conversion errors. If both instrument teams had derived identical corrections for the BRF anisotropy of these overcast scenes, the resulting broadband albedos should have shown a similar pattern as the respective BRFs. However, the TOA albedos are much more scattered (Figure 1b). Although most SW albedo samples were also along the diagonal, many samples significantly deviated from each other. Especially, there was an “up tail” (“right tail”) implying that the MISR (CERES) estimated much larger albedos than the CERES (MISR). Both “tails” resulted in the overall relative RMS difference of the collocated broadband albedos up to 16.4%. This suggested that a systematical RMS difference of 15.5% () was found between the CERES and MISR overcast ocean albedo retrievals, resulting from differential scene identification (), differential BRF anisotropic correction (), and the difference of NTB conversion between the BRFs and albedos (). They are further examined in the subsections below.
Results of the broadband BRFs and albedos over snow/ice scenes were separated for overcast sea ice (Figure 1c,d), overcast fresh snow (Figure 1e,f), and overcast permanent snow (Figure 1g,h), as they showed distinct features. Compared to the overcast ocean case, the broadband BRFs between the CERES and MISR showed a smaller RMS difference of ~4% for both sea ice and fresh snow, and as low as 3% over permanent snow. Together with the overcast ocean case, the relatively small RMS difference of the broadband BRFs for all four CERES scene types indicated the validity of both the proposed collocation method and the sample-binning strategy. Moreover, the collocated broadband albedos of sea ice and fresh snow were much less scattered than the overcast ocean case, resulting in a much smaller RMS difference of the broadband albedos (~7%). Thus, the RMS difference between the CERES and MISR albedos due to the overall retrieval algorithm ( + + ) was ~6% for the CERES overcast sea ice and fresh snow scenes. Note that the much smaller RMS difference compared to the overcast ocean case did not mean a closer agreement of the overcast albedo retrieval algorithm between the CERES and MISR for sea ice and fresh snow. This will be discussed further in Section 4.1.2. For the CERES overcast permanent snow scenes (Figure 1h), the RMS difference of the collocated TOA albedos was the largest (15%) amongst the three snow/ice surface types, despite the smallest RMS difference of collocated BRFs (3%). These large inconsistent albedos originated from the evident “left tail” shown in Figure 1h, implying the MISR estimated much lower albedos than the CERES.
In general, whilst there is a strong consistency of the collocated broadband BRFs between the CERES and MISR for both overcast ocean and snow/ice cases, the corresponding broadband albedos substantially differ from each other. However, most of the inconsistencies are associated with the apparent tails as shown in Figure 1b,h. As the BRF anisotropy corrections were scene-dependent for both instruments, separating the effect of the different scene classifications () was crucial for determining the cloud albedo uncertainties that were purely due to the BRF anisotropy corrections (). In the following assessment, we separated the collocated samples into consistent and inconsistent groups. For each CERES FOV, the corresponding MISR cloud fraction was estimated from its ACD field by counting the cloudy (2.2 km)2 pixels over the total number of MISR samples. Note that No Retrieval values in the MISR ACD fields were treated as “clear” because the local albedos were based on the SAW method, which does not account for azimuthal correction. The consistent scenes then meant that the MISR also classified the samples as overcast (f > 99%) and with the same kind of underlying surfaces (surface percentage > 99%). The inconsistent scenes formed the rest of the samples. To further examine the albedo consistency with respect to the solar zenith angles, we binned the two groups by 10° solar zenith angle intervals (the same bin interval used in the NTB BRF conversion).
4.1.1. Overcast Ocean
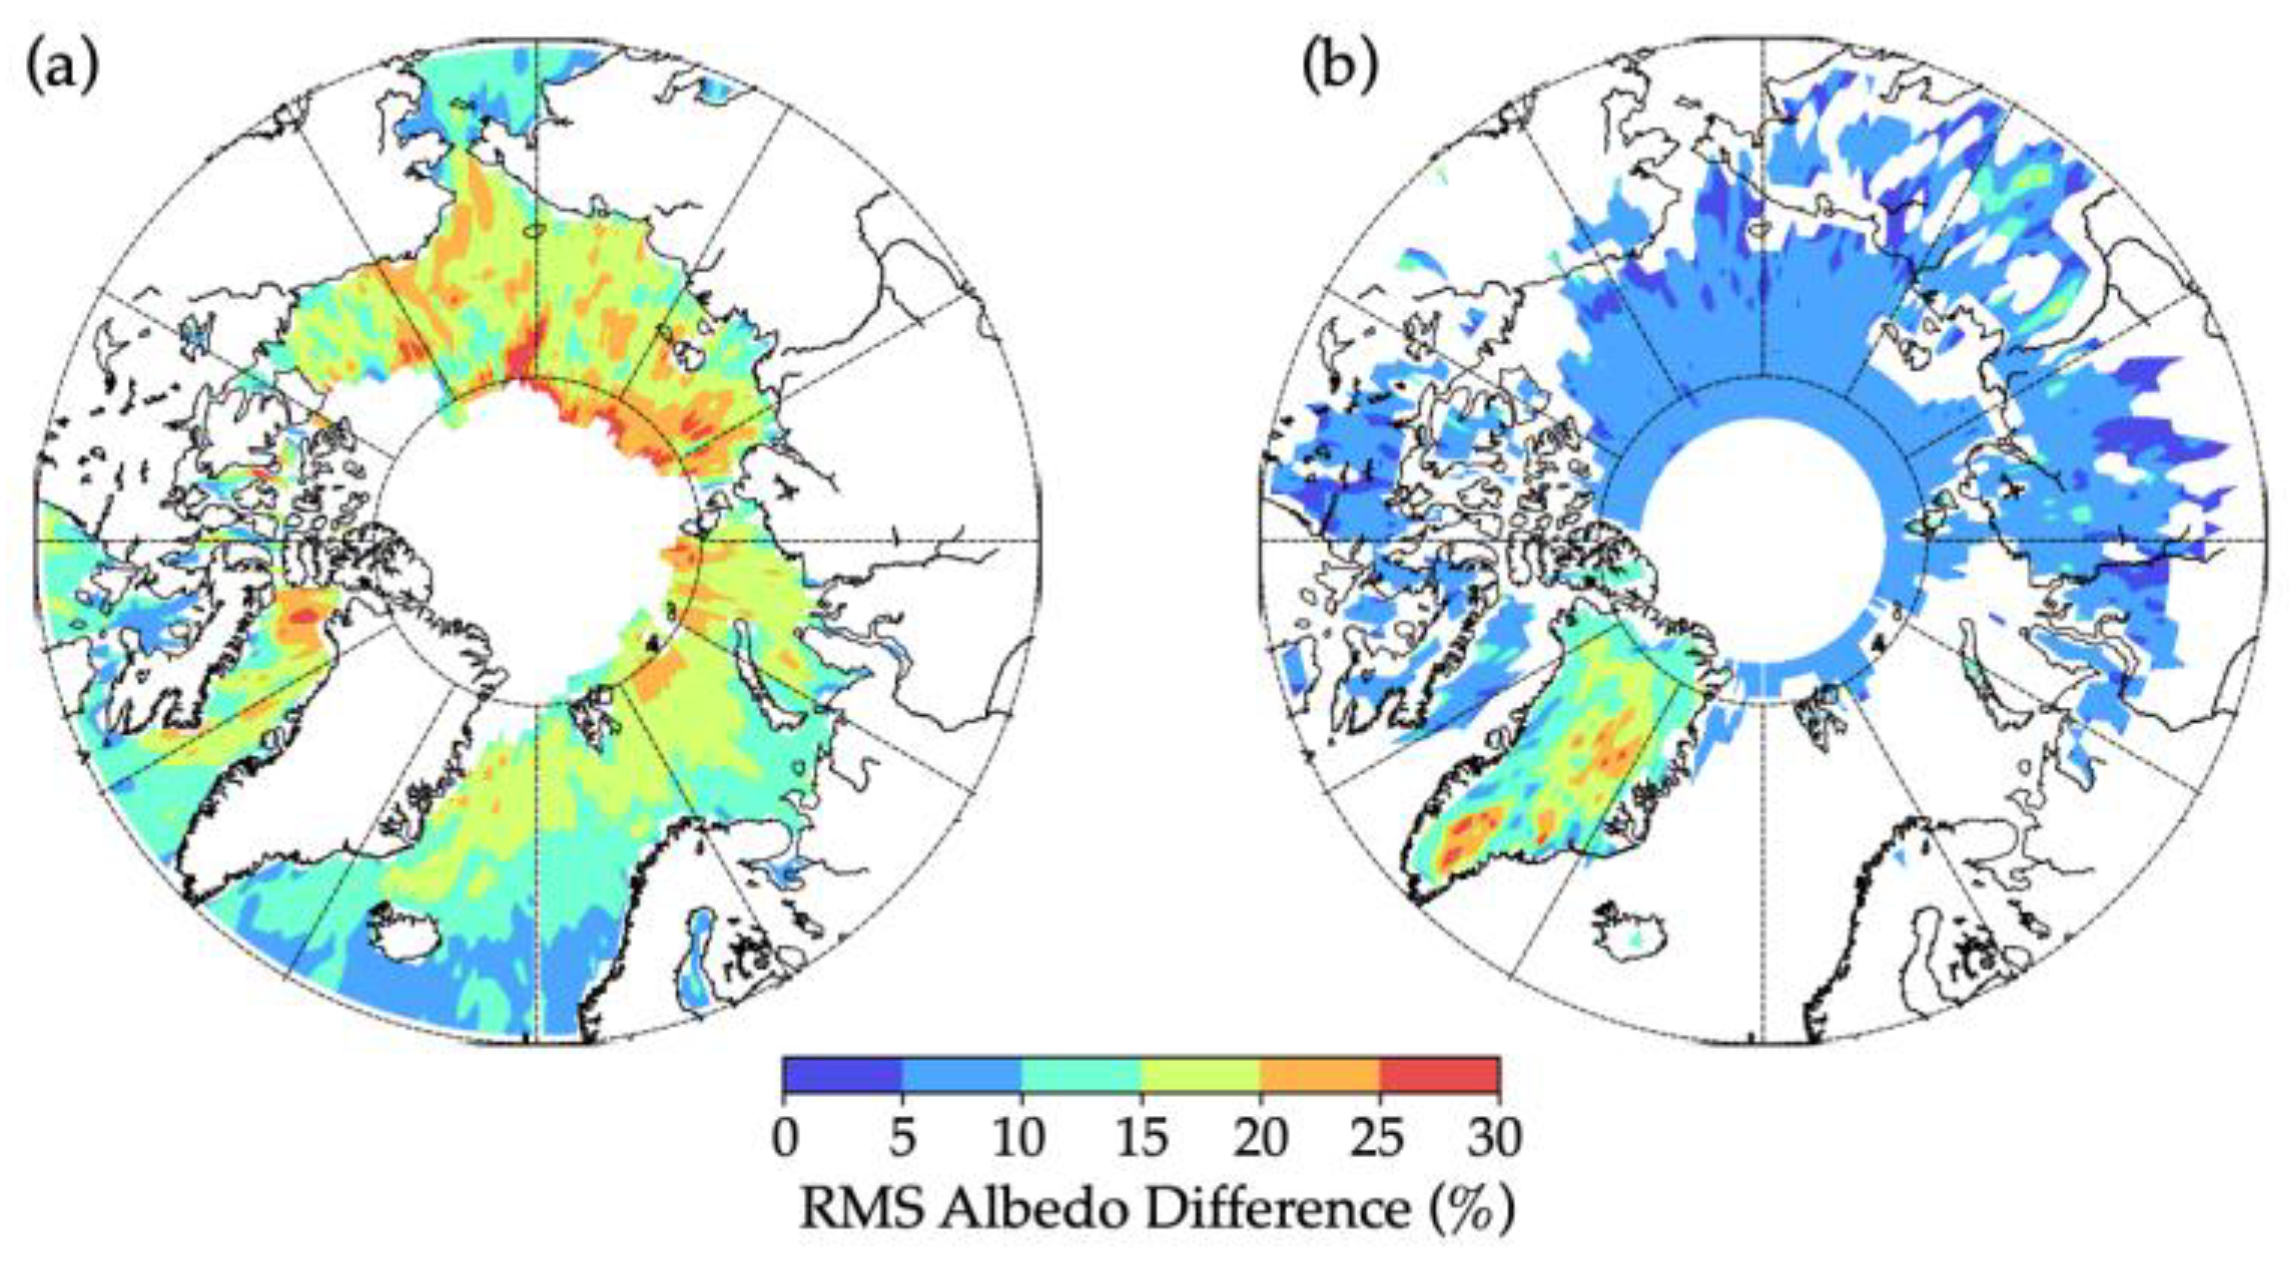
For the collocated CERES and MISR albedo retrievals over overcast ocean scenes, Figure 2a shows the distributions of the regional (1° 1°) relative RMS differences between the CERES and MISR albedos. To achieve statistically significant results, we only considered regions with more than 20 valid samples. It was clear that the RMS differences were generally large, reaching up to 30% along the perennial sea ice margins. Among the sampling errors, narrow-to-broadband conversion errors, scene classification errors, and ADM errors, we found that the exceptionally large RMS differences were mainly the result of the different scene classifications adopted by the two instruments. Among the total ~1.5 million valid collocated CERES overcast ocean samples, only ~0.6 million (40%) were also classified as overcast ocean by the MISR. This could be a drawback in the operational MISR albedo scene classification scheme that results from both the snow/ice mask and the Cloud Designation field. Since the MISR uses a monthly snow/ice map, it may overestimate the sea ice area where the sea-ice extent changes rapidly, such as within the seasonal sea ice regions. To eliminate the potential cloud albedo inconsistency caused by differences in sea ice masks, we only analyzed the collocated samples with consistent CERES and MISR surface classifications. In addition to overestimating the sea ice scenes, the MISR tends to underestimate the cloud amounts compared to the CERES, which adopts cloud properties based on MODIS measurements [21]. Since the samples in this study were all determined as overcast by the CERES, we calculated the corresponding cloud fractions based on the MISR ACD field. A detailed analysis of the scene identification consistency is discussed in Section 4.2. In general, inconsistent cloud masks account for more than 80% of the samples with inconsistent scene identification. Since the mismatched scene classification directly affects the selection of anisotropy coefficients when retrieving the TOA albedo, it needs to be considered to examine the cloud albedo accuracy. Thus, we separated the collocated ocean samples into consistent (n = 615405) and inconsistent (n = 882412) overcast scenes in the following study.
Figure 3 shows the comparisons of the TOA broadband albedo for the consistent (left column) and inconsistent (right column) overcast ocean scenes for all the available samples (Figure 3a,b), for a moderate SZA range (Figure 3c,d), and for a very high SZA range (Figure 3e,f). Plots of the other three SZA ranges (i.e., SZA ∈ [40°, 50°), [60°, 70°) and [70°, 80°)) were omitted here as they showed similar patterns with the case of SZA ∈ [50°, 60°). Detailed results are shown in Table 5. Generally speaking, the two instruments showed good agreement when they had consistent scene classifications, especially for solar zenith angles less than 80°. The relative RMS difference for all the scene-consistent overcast ocean albedos was 7.4% (Figure 3a) and rose up to 20.6% for all the scene- inconsistent samples (Figure 3b). As shown in Figure 1b, an “upper tail” and a “right tail” are two causes that result in the large RMS difference of the overall overcast ocean albedos. Whilst the “top tail” was observable in both the scene-consistent and scene-inconsistent cases, the “right tail” was only shown in the scene-inconsistent case. This implied that most of the MISR albedos that were biased high relative to the CERES resulted from applying clear-sky anisotropic corrections to pixels actually containing cloud, which may also explain why a number of the MISR restrictive albedos exceeded 1.0.
As these scene-consistent samples were distributed evenly for each SZA bin (~100,000 for each bin), statistically significant results could be drawn. The mean CERES near-nadir BRF (albedo) of each SZA interval decreased (increased) gradually from 0.41 (0.45) for SZA ∈ [40°, 50°) to 0.30 (0.57) for SZA ∈ [80°, 90°), implying that clouds scattered sunlight more and more anisotropically with an increasing SZA. Both the relative RMS differences (Table 5) and mean biases were generally small for moderate SZA ranges, indicating that both instruments had estimated highly agreed cloud albedos at the mean level. Despite SZA (50–60°) having the largest number of samples, it showed the lowest albedo RMS difference (4.9%), as well as the smallest mean bias (0.2%). However, the albedo RMS difference increased significantly to 7.4% (70° ≤ SZA < 80°) and soared up to 14.7% at very high solar zenith angles (80° ≤ SZA < 90°, Figure 3e). These systematic differences at a very high SZA implied that the CERES estimated much larger albedos than the MISR, leading to the “upper tail” shown in Figure 1, and contributing to most of the large albedo discrepancies as shown in the scene-consistent overcast ocean case.
Since the albedo retrievals at low sun elevations are a well-known challenge, it is hard to tell which instrument gives better estimations. On one hand, an early study by Stephens [39] suggested that cloud albedo at a large solar zenith angle generally exceeds 0.7 when the cloud liquid water path is larger than 30 g/m2, which is a common amount for the summer Arctic clouds [40]. On the other hand, Diner et al. [17] argued that RMS errors of cloud albedos could be significantly reduced if more than one angle was used, especially when the solar zenith angles were greater than 70°. The latter argument is somewhat further supported by the comparison between the older CERES Edition 3A and the latest CERES Edition 4A dataset (not shown). Comparing to Edition 3A, the new CERES version lowered the original large albedos toward the MISR but may have over-corrected them. We strongly recommend for future studies to examine these differences further.
Although scene-consistent overcast ocean samples showed consistent albedo retrievals between the CERES and MISR, they only accounted for 40% of the total samples. However, the remaining scene-inconsistent samples indicated significant differences in the retrieved albedos. Figure 3b shows the albedo comparison between the CERES Edition 4A and the MISR for all the inconsistent scenes. Similar patterns were also found for the CERES Edition 3A dataset (not shown). The right tail becomes more evident as the solar zenith angle increases. The mean relative difference increased dramatically from 6.8% for 40° ≤ SZA < 50° to more than 17.7% for 80° ≤ SZA < 90°. Combined with the “up tail” in the very high SZA scenes, the relative RMS difference of the retrieved albedo reached the largest value of 31.7% among all the scene types (Table 5). These large deviations in albedos could result from the incorrect application of the albedo retrieval models. Clear ocean anisotropic factors are much less than the overcast ocean anisotropic factors, and both of them decrease with increasing SZA [21]. After incorrectly applying the clear ocean anisotropic factor to the cloudy ocean BRFs, it was expected that the MISR would estimate larger TOA albedos than the CERES. Since these spurious large albedos must not correspond to the clear ocean scenes, it also implied that the MISR SDCM occasionally failed to identify clouds over the Arctic ocean.
Overall, TOA albedos from the CERES and MISR showed good consistency for the consensus overcast ocean scenes, especially when the solar zenith angles were not extremely high (SZA < 80°). For the CERES Edition 4A, accounting for of 2.2% (Section 3) and of 5.5% (Figure 1a), the RMS difference between the MISR and CERES overcast albedo retrievals purely due to the ADMs difference () was estimated to be 5.4% for 40° ≤ SZA < 90° and 2.9% for 40° ≤ SZA < 80°. The latter value was close to the mean ADMs difference of 3.8% over low- and mid-latitude overcast 1° 1° ocean regions [18]. The small suggested that both instruments had achieved accurate BRF anisotropic corrections of overcast ocean scenes. However, we do note an underestimation of the CERES albedos relative to the MISR at large SZA for consistent scene types. With the large reduction in CERES albedos from Edition 4A relative to 3A (not shown), we had a suspicion that the CERES Edition 4A may have overcompensated for the correction from Edition 3A, given the sensibility of the MISR results. Finally, for the inconsistent scene type group, we note that the MISR may suffer serious scene identification issues, both for the sea ice mask and Cloud Designation field used within the albedo product—this is explored further in Section 4.2, with recommendations for improvements.
4.1.2. Overcast Snow/Ice
Figure 2b shows the regional RMS differences of collocated CERES and MISR SW albedos over CERES overcast snow/ice scenes. Recall that the CERES defines permanent snow (PS) scenes over Greenland, and fresh snow (FS) and sea ice (SI) scenes over land and water. Distinct performances of overcast albedos between the CERES and MISR over SI/FS and PS are clearly illustrated. Compared to the overcast ocean case, the RMS differences between the CERES and MISR are much smaller for regions other than Greenland, which is the only place classified as permanent snow within the Arctic. This suggests that either the scene classification or the anisotropic corrections (or both) are largely different over the permanent snow scenes. In addition, the two instruments do not show good scene classification consistency over ice/snow, which will be further investigated in Section 4.2. To avoid the impacts of distinct cloud identifications on quantifying the albedo consistencies that purely resulted from the retrieval methods, we separated the collocated snow/ice samples into consistent (nSI = 70,027, nFS = 43,887, nPS = 19,643) and inconsistent (nSI = 251,406, nFS = 76,448, nPS = 64,900) overcast cases. The much smaller number of valid samples may be partly due to the difficulties that both the CERES and MISR have in detecting cloud over snow/ice.
As three types of snow/ice samples are largely restricted to specific regions, the number of overcast snow/ice samples are strongly SZA-dependent. For example, more than 50% of the collected overcast sea ice samples were within the SZA range of [60°, 70°), and the overcast fresh snow between SZA = 40° and SZA = 60° accounted for 91% of the total samples. Thus, Figure 4 shows the results of the albedo comparisons for the different solar zenith angle intervals that have the largest sample percentages. Detailed numeric results are listed in Table 5. Clearly, the two albedo products were in good agreement for scene-consistent cases, despite a systematic positive bias for the MISR relative to CERES. For overcast sea ice albedos, the relative RMS difference was less than 5% for moderate solar zenith angles (SZA < 70°). With increasing the solar zenith angle, the MISR tended to estimate larger albedos than the CERES, with relative differences increasing from −3.2% for 40° ≤ SZA < 50° to 3.2% for 70° ≤ SZA < 80°. However, for extremely large solar zenith angles (80° ≤ SZA < 90°), the two instruments were largely inconsistent. The relative difference and RMS difference reached up to 13.8% and 16.6%, respectively. The distinct performances of moderate SZA and high SZA were also observed for both overcast fresh snow and permanent snow albedos, except for a longer tail towards the lower albedo end.
The scene-inconsistent overcast albedos over snow/ice scenes are illustrated in Figure 4 (right column), with the same SZA ranges to the left figures. Unlike the systematic positive bias as shown in the inconsistent overcast ocean case, the majority of the albedo samples of SI and FS had good agreement between the CERES and MISR. This could be explained as follows. We found that most of the inconsistent overcast snow/ice scenes were classified as partly cloudy by the MISR, which reduced the differences of MISR albedos between overcast and clear snow/ice scenes, since the MISR coarse resolution restrictive albedos were calculated from the fine resolution local albedos. More importantly, the anisotropic factors of overcast FS/SI were very close to the factors of clear FS/SI. Thus, consistent TOA albedos could be achieved even by selecting incorrect retrieval models. However, this issue is not resolved for PS, as shown by the evident left tail in Figure 4f. This implies much smaller MISR TOA albedos as compared to the CERES and it causes the large RMS differences within Greenland (Figure 2b). The reason for this discrepancy may result from the much more isotropic clear PS than overcast PS at the nadir direction. Since clear PS anisotropic factors are larger and closer to unity than overcast PS anisotropic factors, the incorrect applications of the clear PS model to the cloudy PS BRFs may explain these spurious low albedos (0.3–0.4) for overcast PS scenes.
Similar to the overcast ocean case, the CERES and MISR also derived highly consistent anisotropic corrections of overcast snow/ice scenes, especially for solar zenith angles less than 80°. Given the combined and the narrow-to-broadband BRF conversion error of 4.2% (SI), 3.6% (FS), and 2.5% (PS), the RMS difference between the MISR and CERES Edition 4A albedos due to the model differences was estimated to be 3.2% (SI), 3.9% (FS), and 8.4% (PS) for SZA ∈ [40°, 90°). When we excluded the very high SZA case (SZA ∈ [80, 90)), the RMS differences could be further reduced to 2.7% (SI), 2.4% (FS), and 7.3% (PS). By comparing to the CERES Edition 3A product (not shown), the new version showed slightly better agreement with the MISR at all solar zenith angles. This improvement fulfilled the expectations of the CERES science team [25]. However, there were remarkably large discrepancies in the scene classifications between the two instruments. Although it introduced a much smaller impact on the retrieved TOA albedos for SI and FS than overcast ocean, it was responsible for the spurious left tail over the PS scenes. Thus, analyzing the scene identification differences between the CERES and MISR is important to confidently use the albedo products from both the CERES and MISR.
4.2. Scene Classification Analysis
Since the MISR restrictive albedo was based on its local albedos with 2.2 km spatial resolution, biased scene determinations would result in incorrect applications of the retrieval models which would then propagate to the retrieved restrictive albedos. This issue appears to be especially important for overcast ocean and permanent snow as discussed in previous sections. Figure 5 summarizes the differences of MISR scene identification over CERES overcast samples. It is clear that the percentages of consistent scene classifications were less than 50% for all cases, with an extremely low consistency (~20%) over overcast sea ice scenes as classified by the CERES. Although the MISR shows the largest scene consistency for CERES overcast ocean scenes (blue bars in Figure 5a), approximately 20% of the total samples were found to be misclassified as sea ice. This is related to the operational MISR sea ice mask, which labelled a 2.5° × 2.5° region as snow/ice-covered if four or more days in the month had more than a 6% snow/ice fraction. Relative to the CERES snow/ice mask, this would result in an overestimation of snow/ice cover, which is illustrated as a large inconsistency over the CERES ocean scenes (yellow and grey bars in Figure 5a).
To make recommendations for improvements, we tested several changes to the snow/ice mask while constraining ourselves to the original snow/ice data source as required by the MISR mission. Specifically, the original 2.5-degree monthly snow/ice mask was compared against two versions of 1-degree daily snow/ice mask generated from the Near-Real-Time SSM/I-SSMIS EASE-Grid Daily Global Ice Concentration and Snow Extent data [41]. The only difference between the two versions was the applied threshold: one (T6) uses the heritage threshold of 6% and the other (T15) adopts a threshold of 15% as suggested by the National Snow and Ice Data Center (NSIDC). After applying the aforementioned method to 4-months (June, July, August, September) of reprocessed MISR TC_ALBEDO data in 2007, the collocated CERES-MISR samples were collected and checked for surface classification inconsistency. Table 6 briefly summarizes the results. In general, we found that T6 outperformed both the original and T15 as it largely reduced the inconsistency for the CERES ocean scenes whilst retaining similar inconsistencies for snow/ice scenes.
In addition to the surface classification inconsistency, Figure 5 implies that the MISR ACD field, which is generated from the SDCM as described in Section 2, is significantly different compared to the CERES cloud mask for CERES overcast scenes. Only half (51%) of the CERES overcast scenes were also recognized as overcast by the MISR over ocean. The proportion of the agreement reduced to 37% when the underlying surface was permanent snow, and as low as 21% over sea ice. About 14% (22%) of the CERES overcast ocean (sea ice) samples were classified as clear (f < 1%) by the MISR cloud fractions computed from the ACD field. Note that the ACD field was computed within the MISR albedo processing stream and it was not part of the operational cloud classifiers (which included various measures of cloud fraction that have been assessed for quality) found within the MISR Level 2 and 3 cloud products. Therefore, it is necessary to compare the different MISR cloud classifiers when developing future versions of the albedo algorithm. Besides the SDCM, the MISR also provides the RCCM and ASCM for cloud detection. As noted in Section 2, cloud fractions over the CERES footprint are calculated here for comparison from the 2.2 km Cloud Designation field (which is based on the old stereo algorithm), the new 1.1 km SDCM (that is based on the latest version of the MISR stereo algorithm), the 1.1 km terrain-referenced ASCM and An-camera RCCM, the 2.2 km Consensus Classifier (which combines feature-referenced SDCM, ASCM, and An-RCCM as described in the L2 ATBD [29]), and our Best Estimate Cloud Fraction (as described in Section 2, following a similar logic found in the MISR Cloud Fraction by Altitude (CFbA) Product [36]). The CFbA product was used within the GEWEX Cloud Assessment Report [37], which compared all publicly accessible satellite cloud products (e.g., cloud fraction, altitude, optical depth).
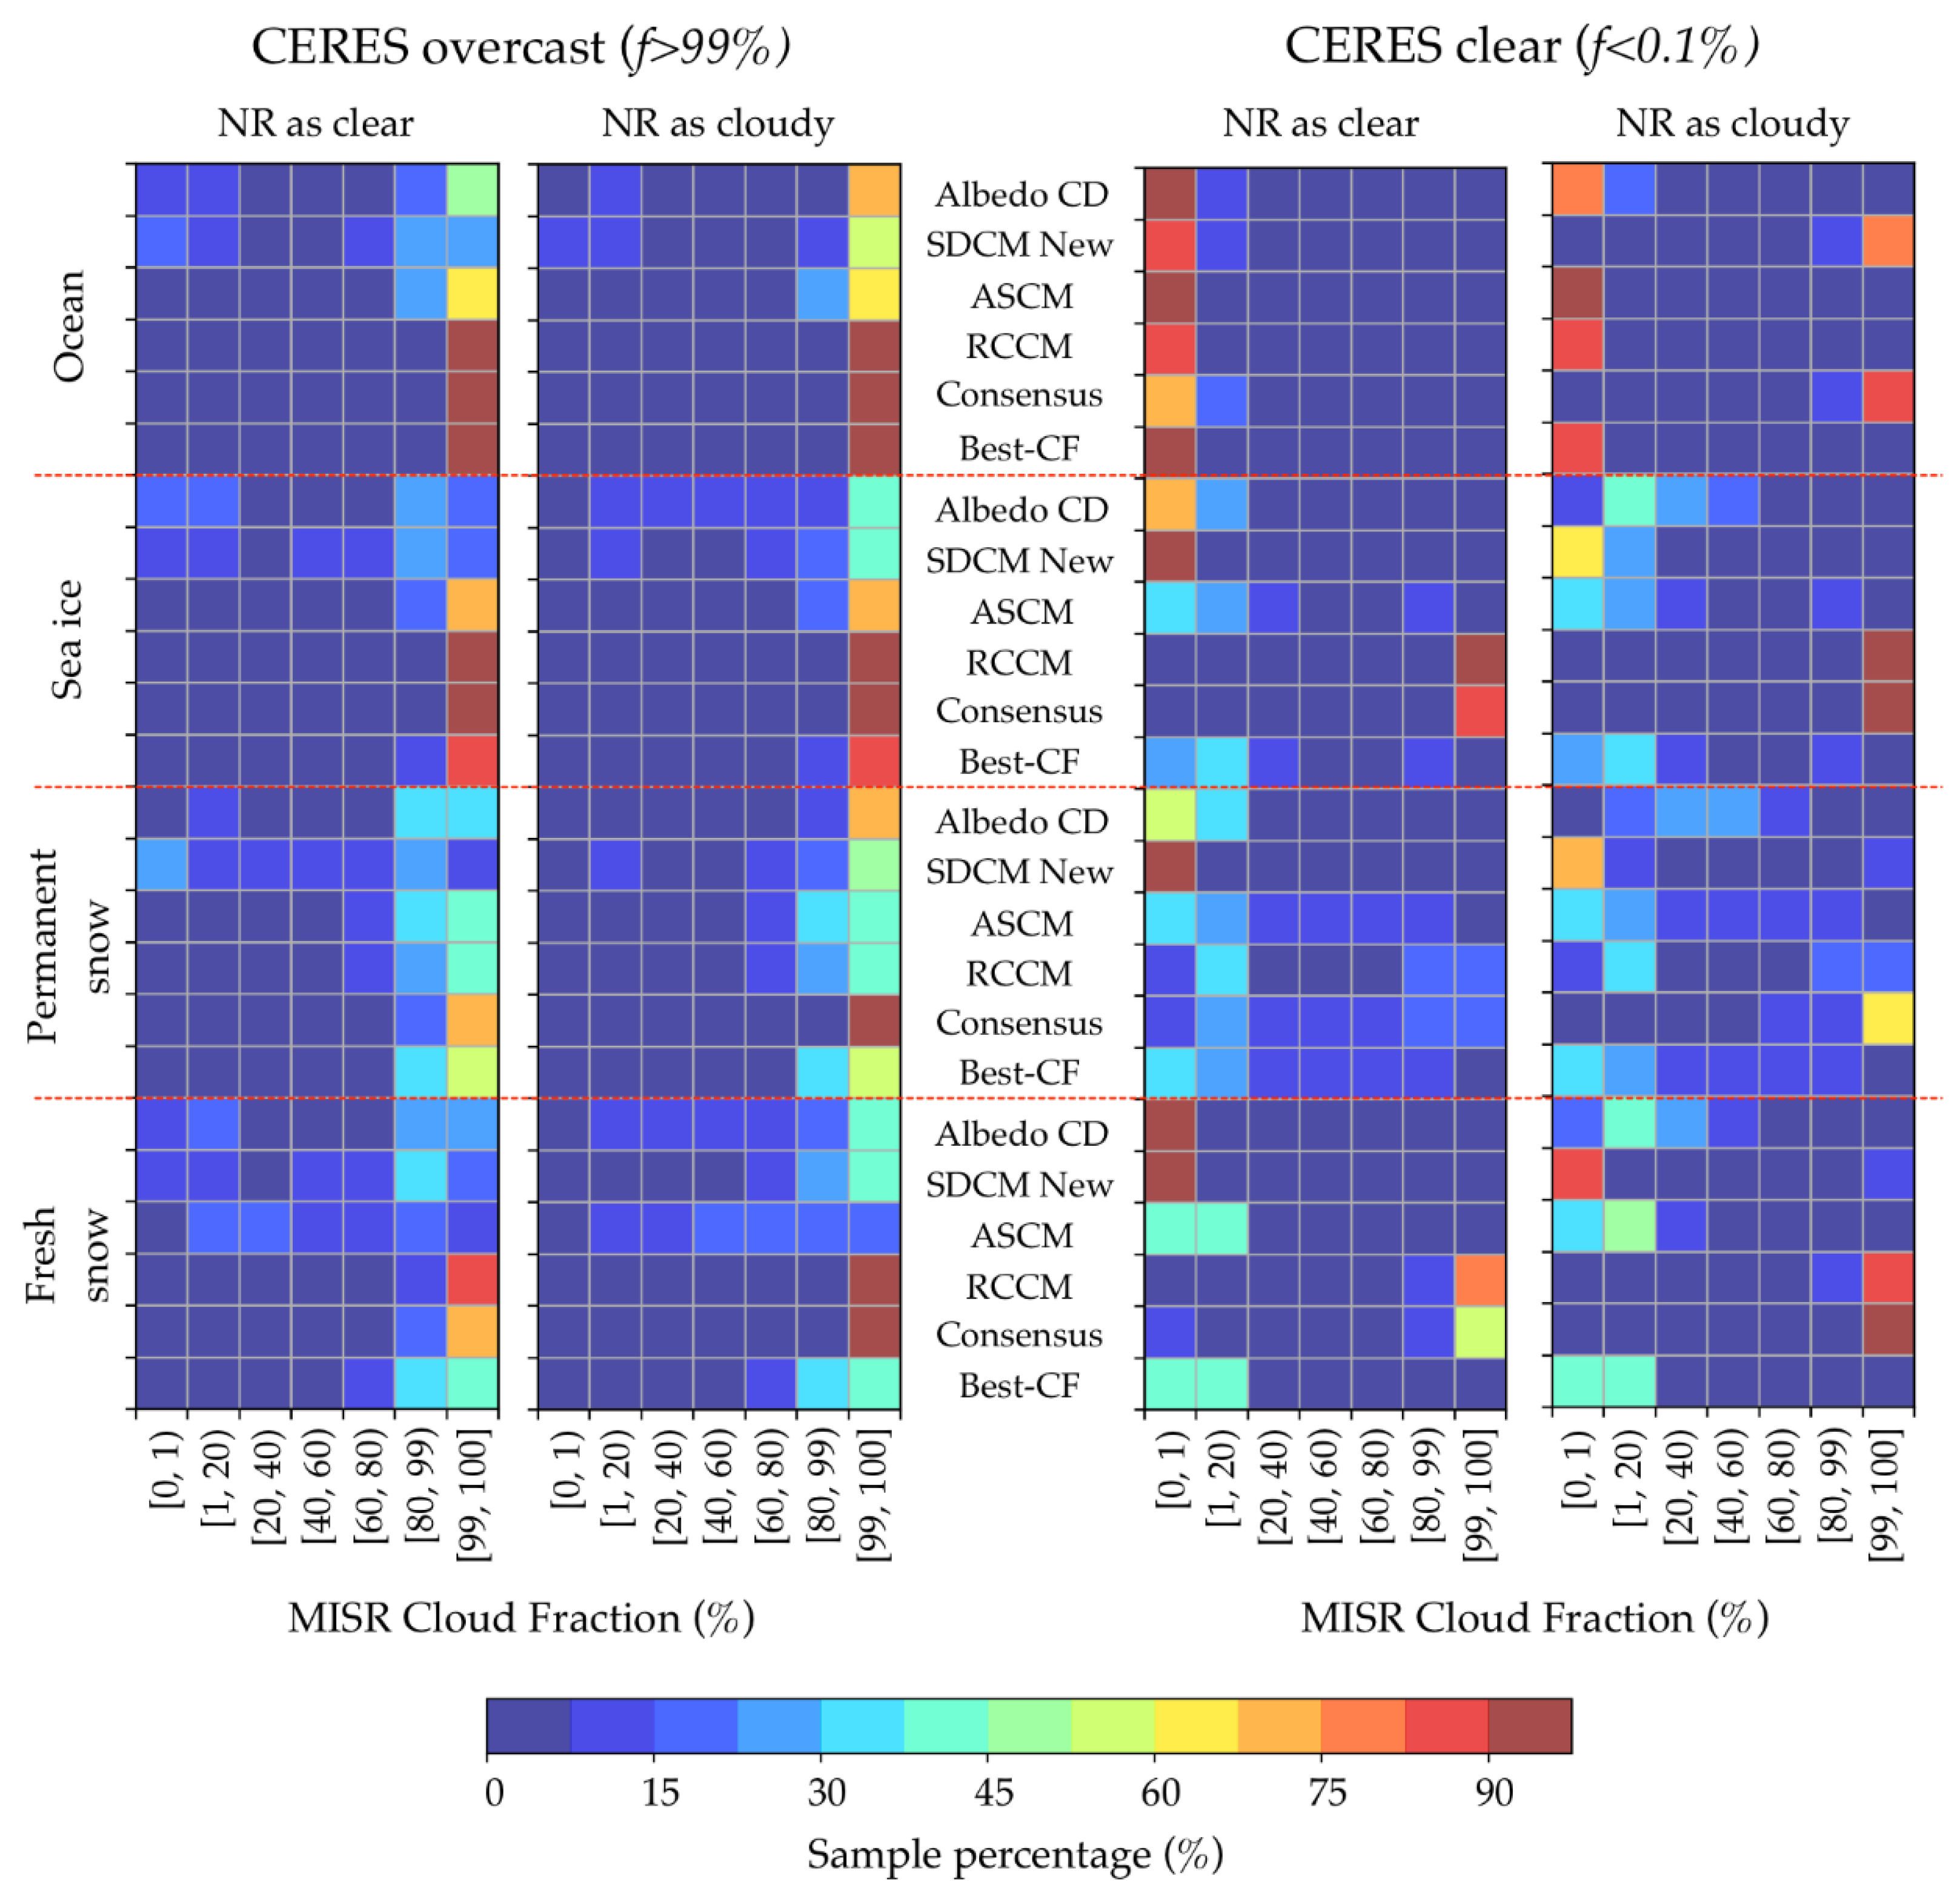
To illustrate the performances of the different MISR cloud masks, Figure 6 shows the sample distributions of the different MISR cloud masks both for all the collocated CERES overcast samples and for the collocated CERES clear (f < 0.1%) samples during the same period. As there were a number of MISR cloud masks that were flagged as No Retrieval (NR) rather than clear or cloudy, the impact of the NR samples was evaluated by treating the NR values as either clear or cloudy.
While the old SDCM is currently used to generate the (2.2 km)2 albedo Cloud Designation in the standard TOA albedo product, it does not outperform the other cloud masks especially over snow/ice surfaces. For the CERES overcast ocean cases (NR as clear), the six MISR cloud masks (designations) showed distinct results. The overcast sample consistency ranged from 99% for RCCM down to 26% for the new SDCM, which mostly resulted from the latter failing to retrieve a value for many samples. As the SDCM relies on the stereo-derived height, it is suggested that the NR reported by the SDCM over ocean and PS are actually clear, since the very smooth clear ocean and PS return NR from stereo, whilst both the “clear” and “cloudy” are low (below 562 m threshold of SDCM) and high clouds, respectively [28]. This argument was validated in the CERES clear ocean case, where most of the collocated MISR samples were labelled as NR by the new SDCM. For the other MISR cloud masks, ASCM did not show good agreement (~60%) with respect to the CERES cloud classifications, which had better consistency with both consensus and best-CF cloud masks.
For the CERES overcast snow/ice case, the Consensus Cloud Mask (with NR as cloudy) showed the greatest consistency with the CERES cloud classification compared to the other MISR cloud masks. However, this did not mean that the Consensus Cloud Mask provided a better cloud mask to be used in the production of MISR albedos. The logic in constructing the Consensus Cloud Mask tends to make it a clear-conservative cloud mask (i.e., it will be cloudier than it really is), which would favor its comparison with the CERES overcast in the way the comparison has been done. One can see from the CERES clear cases (f < 0.1%) that the Consensus Cloud Mask and the RCCM showed the least consistency with the CERES. Not surprisingly, it was the Best-CF that had the best agreement with both CERES overcast and clear classifications, especially over sea ice surfaces (Figure 6). Keeping in mind that the comparison used the CERES as a reference truth. Given cloud classification over snow and ice could be problematic for the CERES [20], we must be mindful that that the MISR Best-CF may well be a better dataset. In the GEWEX Cloud Assessment report [37], the MISR CFbA produced total cloud amounts that were closer to the mean of all the participating satellite missions than the CERES by several percent. Regardless, it was clearly evident that the MISR albedo product would benefit by reformulating its Cloud Designation field to use a combination of the MISR cloud masks in order to take advantage of the known strengths of individual cloud masks over different surface types, as was done in the MISR CFbA product and the Best-CF computed here.
5. Discussion
Compared to previous studies [11,12,13,18,42], this study makes an original contribution as follows. Firstly, the accuracy of the CERES instantaneous TOA albedo retrievals has yet to be systematically analyzed. Most of the aforementioned studies focused on examining the regional mean errors [11,42]. While providing a general impression of the CERES performance, the studies do little to help further quantify its albedo uncertainties or provide a direction for future improvements, particularly with regard to the known larger errors in the proposed theoretical models and observations [11,43,44]. Secondly, as the first direct comparison of the instantaneous CERES and MISR albedos, Sun et al. [18] examined the albedo consistency over 1° × 1° overcast ocean regions between 75° S–75° N. However, the results neither included the entire Arctic region nor accounted for the SZA-dependent uncertainties in the estimated zonal RMS errors (the authors Figure 3c). These early uncertainty estimations addressed the issue of angular inconsistency in the retrieved CERES TOA albedos [11]. Considering that the largest variation of the CERES anisotropic factor to cloud properties (e.g., cloud optical depth) is found at near-nadir [45], it remains necessary to examine the performance of the CERES near-nadir albedo retrievals as functions of scene types and solar zenith angles. Thirdly, the MISR has provided its own TOA albedo product that has yet to be fully compared with others. The well-developed radiative transfer simulations and nine-angle configurations led us to believe that the MISR may achieve a comparable or better performance in retrieving cloud albedos, particularly under low sun conditions.
Thus, this study focused on examining the consistency of the instantaneous SW albedo retrieved from the CERES and MISR over the Arctic. Based on features of the two instruments, a set of criteria was firstly applied to select qualified CERES-MISR collocated samples (Table 2). Owing to the different scanning configurations, we did not include albedo samples from oblique angles in the CERES cross-track sampling mode. We focused on the overcast albedo retrievals, since there are known issues of MISR clear-sky local albedos (fine resolution) that constitute the clear portion in its restrictive albedos (coarse resolution). Furthermore, we excluded CERES mixed-scenes as the ADMs were essentially determined from the single-scene ADMs [21]. Applying these criteria resulted in 4% of the total CERES FOVs being used, which was further reduced to 2% after collocating with the MISR samples. Despite the small percentage of total data, the samples were carefully selected to ensure that the three uncertainty components (, , ) could be quantified from BRF and albedo comparisons. These collocated samples were also representative of the overcast near-nadir CERES samples. Similar sample distributions were found for both the CERES albedos and mean logarithm of cloud optical depths (ln), for example, the mean (standard deviation) of ln was 2.3 (0.8) and 2.4 (0.7) for the overcast near-nadir CERES dataset and the CERES-MISR collocated dataset, respectively. Moreover, as the CERES team has examined the consistency of instantaneous TOA albedos estimated from near-nadir and oblique-viewing angles [11,12,13], perhaps the results of this study can be further applied to estimate the CERES overcast albedo uncertainties for off-nadir samples.
To determine the MISR broadband TOA albedos for the collocated CERES FOVs, an updated collocation method using the MisrToolkit was developed. The corresponding MISR broadband restrictive albedos were then retrieved strictly following the operational algorithm. Since the MISR albedo narrow-to-broadband conversion coefficients were designed originally for overcast ocean scenes [18], the conversion RMS errors cannot be directly used. To have a better estimate of the scene-dependent MISR NTB albedo conversion error, we assumed that the difference between the NTB BRF conversion and NTB albedo conversion () was the same for different scene types. The assumption was feasible as we binned the data in the same manner and used the same two MISR spectral bands (i.e., red and NIR) to conduct the linear regression. Whilst can be calculated (~2.2%) from Sun et al. [18], the RMS error of the corresponding NTB albedo conversion can be estimated from the NTB BRF conversion errors listed in Table 3 and Table 4.
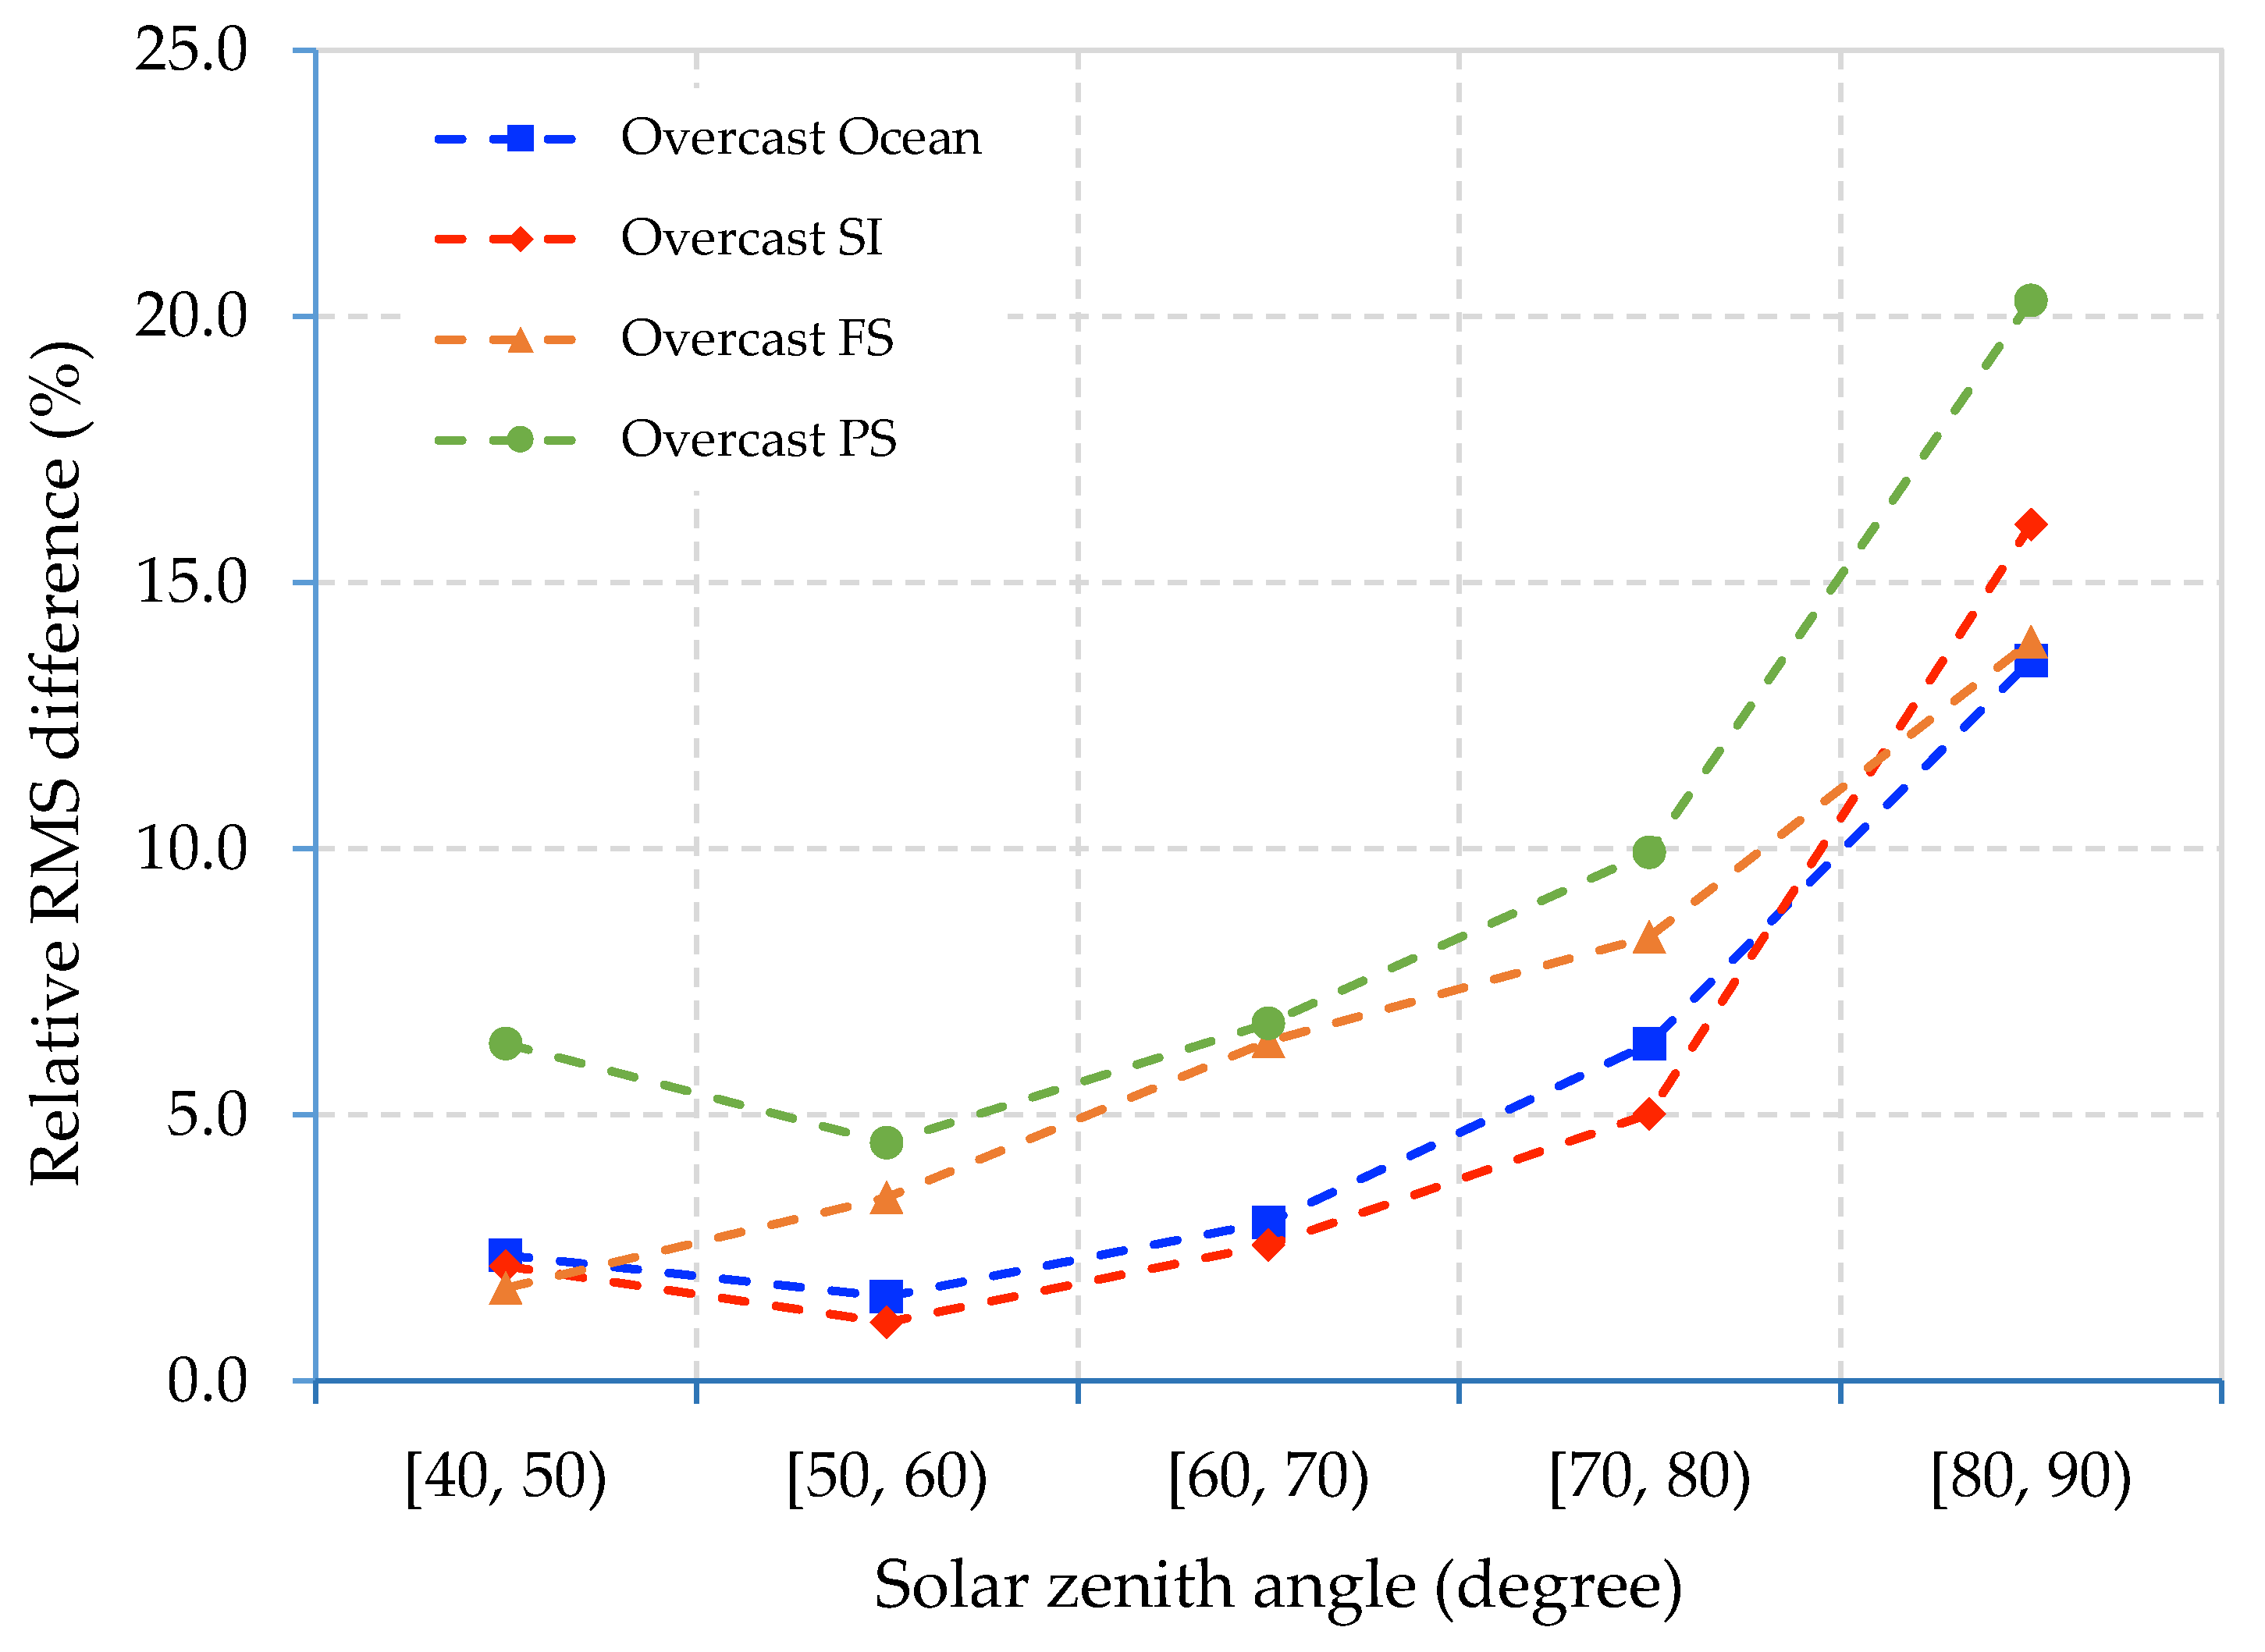
Considering the RMS differences of collocated overcast albedos over consistent scenes (Table 5), the RMS differences between the CERES and MISR instantaneous overcast albedos purely due to the differential BRF anisotropic correction () are shown in Figure 7 as functions of both surface types and solar zenith angles. The overall relative RMS difference, ranges from 3.2% for overcast sea ice to 8.4% for overcast permanent snow. It should be noted that these values cannot be directly used as the overcast albedo uncertainty due to the significant dependence of the albedo agreement on the solar zenith angles (Figure 7). The retrieval algorithm differences of overcast scenes were generally less than 5% when the SZA was less than 70° and increased dramatically with the increasing SZA, reaching up to ~14% (~20%) when the SZA exceeded 80° over ocean (snow/ice). In comparison, Sun et al. [18] found that the ADM difference was ~4% for the overcast ocean albedos between the CERES and MISR for solar zenith angles ≤ 75°. The highly consistent results for the overcast ocean case confirmed the validity of the proposed quantification approach and enhanced our confidence in the overcast snow/ice results. However, the for solar zenith angles SZA ≥ 70° remain large, suggesting more efforts are needed to improve the TOA albedo retrievals at high solar zenith angles.
Additionally, we showed that the largest discrepancy between CERES overcast albedo samples and MISR albedos for those same samples in the Arctic originated from the MISR scene identification algorithm, which overestimates sea ice coverage and significantly underestimates Arctic low clouds. Whilst using a higher resolution (daily instead of monthly) snow/ice mask with the heritage threshold could largely improve the sea ice misclassification, adopting a Albedo Cloud Designation field from a combination of SDCM, RCCM, and ASCM does improve MISR scene classification by drawing upon the known strengths of the MISR cloud for each underlying surface type. Instead of using the strategy embedded in the current consensus cloud mask (i.e., SDCM + ASCM + RCCM), and certainly in the current Albedo Cloud Designation field (old SDCM only), we separated cloud mask combinations based on the underlying surface types following a much more reasonable logic similar to what was done within the MISR CFbA product (SDCM+ASCM for snow/ice, RCCM for open water). On average, we showed that results from our approach were much more consistent with CERES cloud classifications than all the other MISR standard cloud mask products (Figure 6). The remaining inconsistencies were mostly over snow/ice surfaces where the CERES also suffers from cloud classification issues. Moreover, a systematic analysis of NR occurrence may provide a more accurate cloud mask for the downstream product such as TOA albedo, as it uses SAW for these samples. Lastly, the misclassified clouds impact the TOA albedo retrievals to different degrees, depending on the difference of anisotropic corrections between the cloudy and clear scenes. Specifically, significant positive biases and negative biases have been observed over ocean and permanent snow, respectively. Both fresh snow and sea ice are not strongly influenced by the cloud misclassification; however, it is because of similar anisotropic corrections for cloudy and clear scenes.
6. Conclusions
In summary, we examined the consistency of TOA overcast albedos between the CERES and MISR over the Arctic. We found that most of the large errors in the albedos resulted from the distinct scene classifications adopted by the CERES and MISR albedo retrieval algorithms. MISR tends to overestimate snow/ice cover and the current Albedo Cloud Designation field (based on old SDCM) overlooks low clouds. Focusing on the collocated CERES-MISR SW albedos with consistent scene identifications, we showed a remarkable agreement between the CERES and MISR overcast albedo retrieval algorithms ( ~ 5%) for a solar zenith angle less than 70°. This suggested that both instruments derived consistent radiance anisotropy corrections of cloud scenes and this enhanced our confidence in using the instruments datasets within the Arctic. Nevertheless, the strong SZA-dependent also addressed the importance of considering the solar zenith angle while estimating the corresponding regional and monthly mean albedo uncertainties.
Author Contributions
Y.Z. conceived the research and designed the experiments. Y.Z. performed the data analysis and data visualization with critical discussions with L.D.G., R.D., and C.M. The manuscript was drafted by Y.Z. but all authors were involved in revisions. All authors read and approved the final manuscript.
Funding
This research was funded by subcontract 1460339 and 147871 from the California Institute of Technology/Jet Propulsion Laboratory to the University of Auckland and the University of Illinois, respectively, and by sponsorship from the Chinese Scholarship Council. This work was also supported in part by the Blue Waters sustained-petascale computing project, which is supported by the National Science Foundation (NSF) under Award OCI-0725070 and Award ACI-1238993, and in part by the State of Illinois, USA. This work was also partially supported from the NASA ACCESS program under contract NNX16AMO7A and from the NSF Division of Polar Program under contract 16-03544.
Acknowledgments
The original CERES and MISR datasets were obtained from the NASA Langley Research Center Atmospheric Science Data Center, https://eosweb.larc.nasa.gov/.
Conflicts of Interest
The authors declare no conflict of interest.
References
- Stephens, G.L.; O’Brien, D.; Webster, P.J.; Pilewski, P.; Kato, S.; Li, J. The albedo of Earth: The Albedo of Earth. Rev. Geophys. 2015, 53, 141–163. [Google Scholar] [CrossRef]
- Wielicki, B.A.; Harrison, E.F.; Cess, R.D.; King, M.D.; Randall, D.A. Mission to Planet Earth: Role of Clouds and Radiation in Climate. Bull. Am. Meteorol. Soc. 1995, 76, 2125–2153. [Google Scholar] [CrossRef] [Green Version]
- Wielicki, B.A. Changes in Earth’s Albedo Measured by Satellite. Science 2005, 308, 825. [Google Scholar] [CrossRef] [PubMed]
- Hassol, S.J. Impacts of a Warming Arctic: Arctic Climate Impact Assessment; Cambridge University Press: Cambridge, UK; New York, NY, USA, 2004; ISBN 978-0-521-61778-9. [Google Scholar]
- Pistone, K.; Eisenman, I.; Ramanathan, V. Observational determination of albedo decrease caused by vanishing Arctic sea ice. Proc. Natl. Acad. Sci. USA 2014, 111, 3322–3326. [Google Scholar] [CrossRef] [PubMed] [Green Version]
- Song, Z.; Liang, S.; Wang, D.; Zhou, Y.; Jia, A. Long-term record of top-of-atmosphere albedo over land generated from AVHRR data. Remote Sens. Environ. 2018, 211, 71–88. [Google Scholar] [CrossRef]
- Porter, D.F.; Cassano, J.J.; Serreze, M.C.; Kindig, D.N. New estimates of the large-scale Arctic atmospheric energy budget. J. Geophys. Res. 2010, 115. [Google Scholar] [CrossRef] [Green Version]
- Choi, Y.-S.; Kim, B.-M.; Hur, S.-K.; Kim, S.-J.; Kim, J.-H.; Ho, C.-H. Connecting early summer cloud-controlled sunlight and late summer sea ice in the Arctic: Arctic cloud, sunlight, and sea ice. J. Geophys. Res. Atmos. 2014, 119, 11087–11099. [Google Scholar] [CrossRef]
- Kim, Y.; Kim, H.-R.; Choi, Y.-S.; Kim, W.; Kim, H.-S. Development of statistical seasonal prediction models of Arctic Sea Ice concentration using CERES absorbed solar radiation. Asia-Pac. J. Atmos. Sci. 2016, 52, 467–477. [Google Scholar] [CrossRef]
- Zhan, Y.; Davies, R. September Arctic sea ice extent indicated by June reflected solar radiation. J. Geophys. Res. Atmos. 2017, 122, 2194–2202. [Google Scholar] [CrossRef]
- Loeb, N.G.; Kato, S.; Loukachine, K.; Manalo-Smith, N.; Doelling, D.R. Angular Distribution Models for Top-of-Atmosphere Radiative Flux Estimation from the Clouds and the Earth’s Radiant Energy System Instrument on the Terra Satellite. Part II: Validation. J. Atmos. Ocean. Technol. 2007, 24, 564–584. [Google Scholar] [CrossRef]
- Loeb, N.G.; Loukachine, K.; Manalo-Smith, N.; Wielicki, B.A.; Young, D.F. Angular Distribution Models for Top-of-Atmosphere Radiative Flux Estimation from the Clouds and the Earth’s Radiant Energy System Instrument on the Tropical Rainfall Measuring Mission Satellite. Part II: Validation. J. Appl. Meteorol. 2003, 42, 1748–1769. [Google Scholar] [CrossRef]
- Su, W.; Corbett, J.; Eitzen, Z.; Liang, L. Next-generation angular distribution models for top-of-atmosphere radiative flux calculation from CERES instruments: Validation. Atmos. Meas. Tech. 2015, 8, 3297–3313. [Google Scholar] [CrossRef]
- Loeb, N.G.; Sun, W.; Miller, W.F.; Loukachine, K.; Davies, R. Fusion of CERES, MISR, and MODIS measurements for top-of-atmosphere radiative flux validation. J. Geophys. Res. 2006, 111. [Google Scholar] [CrossRef] [Green Version]
- Kandel, R.; Viollier, M.; Raberanto, P.; Duvel, J.P.; Pakhomov, L.A.; Golovko, V.A.; Trishchenko, A.P.; Mueller, J.; Raschke, E.; Stuhlmann, R.; International ScaRaB Scientific Working Group (ISSWG). The ScaRaB Earth Radiation Budget Dataset. Bull. Am. Meteorol. Soc. 1998, 79, 765–783. [Google Scholar] [CrossRef] [Green Version]
- Harries, J.E.; Russell, J.E.; Hanafin, J.A.; Brindley, H.; Futyan, J.; Rufus, J.; Kellock, S.; Matthews, G.; Wrigley, R.; Last, A.; et al. The Geostationary Earth Radiation Budget Project. Bull. Am. Meteorol. Soc. 2005, 86, 945–960. [Google Scholar] [CrossRef] [Green Version]
- Diner, D.J.; Davies, R.; Várnai, T.; Moroney, C.; Borel, C.; Gerstl, S.A.W.; Nelson, D.L. MISR Level 2 Top-of-Atmosphere Albedo Algorithm Theoretical Basis. Available online: https://eospso.gsfc.nasa.gov/sites/default/files/atbd/atbd-misr-08.pdf (accessed on 23 November 2018).
- Sun, W.; Loeb, N.G.; Davies, R.; Loukachine, K.; Miller, W.F. Comparison of MISR and CERES top-of-atmosphere albedo. Geophys. Res. Lett. 2006, 33. [Google Scholar] [CrossRef] [Green Version]
- Zhan, Y.; Davies, R. Intercalibration of CERES, MODIS, and MISR reflected solar radiation and its application to albedo trends: Intercalibration: CERES, MODIS, and MISR. J. Geophys. Res. Atmos. 2016, 121, 6273–6283. [Google Scholar] [CrossRef]
- Kato, S. Top-of-atmosphere shortwave broadband observed radiance and estimated irradiance over polar regions from Clouds and the Earth’s Radiant Energy System (CERES) instruments on Terra. J. Geophys. Res. 2005, 110. [Google Scholar] [CrossRef]
- Loeb, N.G.; Kato, S.; Loukachine, K.; Manalo-Smith, N. Angular Distribution Models for Top-of-Atmosphere Radiative Flux Estimation from the Clouds and the Earth’s Radiant Energy System Instrument on the Terra Satellite. Part I: Methodology. J. Atmos. Ocean. Technol. 2005, 22, 338–351. [Google Scholar] [CrossRef]
- Suttles, J.T.; Green, R.N.; Minnis, P.; Smith, G.L.; Staylor, W.F.; Wielicki, B.A.; Walker, I.J.; Young, D.F.; Taylor, V.R.; Stowe, L.L. Angular Radiation Models for Earth-Atmosphere System (Volume I—Shortwave Radiation); NASA Langley Research Center: Hampton, VA, USA, 1988.
- Di Girolamo, L.; Várnai, T.; Davies, R. Apparent breakdown of reciprocity in reflected solar radiances. J. Geophys. Res. Atmos. 1998, 103, 8795–8803. [Google Scholar] [CrossRef] [Green Version]
- Su, W.; Corbett, J.; Eitzen, Z.; Liang, L. Next-generation angular distribution models for top-of-atmosphere radiative flux calculation from CERES instruments: Methodology. Atmos. Meas. Tech. 2015, 8, 611–632. [Google Scholar] [CrossRef]
- Corbett, J.; Su, W. Accounting for the effects of sastrugi in the CERES clear-sky Antarctic shortwave angular distribution models. Atmos. Meas. Tech. 2015, 8, 3163–3175. [Google Scholar] [CrossRef] [Green Version]
- Diner, D.J.; Beckert, J.C.; Reilly, T.H.; Bruegge, C.J.; Conel, J.E.; Kahn, R.A.; Martonchik, J.V.; Ackerman, T.P.; Davies, R.; Gerstl, S.A.W.; et al. Multi-angle Imaging SpectroRadiometer (MISR) instrument description and experiment overview. IEEE Trans. Geosci. Remote Sens. 1998, 36, 1072–1087. [Google Scholar] [CrossRef]
- Wu, D.L.; Lee, J.N. Arctic low cloud changes as observed by MISR and CALIOP: Implication for the enhanced autumnal warming and sea ice loss: ARCTIC LOW CLOUD CHANGES. J. Geophys. Res. Atmos. 2012, 117. [Google Scholar] [CrossRef]
- Genkova, I.; Wilson, M.; Yang, Y.; Zhao, G.; Chapman, B.; Snodgrass, E.; Mazzoni, D.; Di Girolamo, L. The synergy of the MISR cloud masks for global cloud climatology. In Proceedings of the Remote Sensing of Clouds and the Atmosphere X, Bruges, Belgium, 19–22 September 2005. [Google Scholar]
- Diner, D.J.; Davies, R.; Di Girolamo, L.; Horvath, A.; Moroney, C.; Muller, J.-P.; Paradise, S.R.; Wenkert, D.; Zong, J. MISR Level 2 Cloud Detection and Classification Algorithm Theoretical Basis. Available online: https://eospso.gsfc.nasa.gov/sites/default/files/atbd/atbd-misr-07.pdf (accessed on 23 November 2018).
- Diner, D.J.; Di Girolamo, L.; Clothiaux, E.E. MISR Level 1 Cloud Detection Algorithm Theoretical Basis. Available online: https://eospso.gsfc.nasa.gov/sites/default/files/atbd/atbd-misr-06.pdf (accessed on 23 November 2018).
- Zhao, G.; Di Girolamo, L. A Cloud Fraction versus View Angle Technique for Automatic In-Scene Evaluation of the MISR Cloud Mask. J. Appl. Meteorol. 2004, 43, 860–869. [Google Scholar] [CrossRef]
- Yang, Y.; Di Girolamo, L.; Mazzoni, D. Selection of the automated thresholding algorithm for the Multi-angle Imaging SpectroRadiometer Radiometric Camera-by-Camera Cloud Mask over land. Remote Sens. Environ. 2007, 107, 159–171. [Google Scholar] [CrossRef] [Green Version]
- Di Girolamo, L.; Wilson, M.J. A first look at band-differenced angular signatures for cloud detection from MISR. IEEE Trans. Geosci. Remote Sens. 2003, 41, 1730–1734. [Google Scholar] [CrossRef]
- Di Girolamo, L.; Moroney, C.; Davies, R.; Mazzoni, D.; Di Girolamo, L.; Moroney, C.; Davies, R.; Di Girolamo, L.; Mazzoni, D.; Moroney, C.; et al. MISR Level 2 Top-of- Atmosphere/Cloud Products Quality Statement. 2007. Available online: https://eosweb.larc.nasa.gov/PRODOCS/misr/Quality_Summaries/L2_Cloud_Products.html (accessed on 23 November 2018).
- Di Girolamo, L.; Davies, R. A Band-Differenced Angular Signature Technique for Cirms Cloud Detection. IEEE Trans. Geosci. Remote Sens. 1994, 32, 7. [Google Scholar] [CrossRef]
- Di Girolamo, L.; Menzies, A.; Zhao, G.; Mueller, K.; Moroney, C.; Diner, D.J. MISR Level 3 Cloud Fraction by Altitude Algorithm Theoretical Basis. Available online: https://eospso.gsfc.nasa.gov/sites/default/files/atbd/MISR_CFBA_ATBD.pdf (accessed on 23 November 2018).
- Stubenrauch, C.J.; Rossow, W.B.; Kinne, S.; Ackerman, S.; Cesana, G.; Chepfer, H.; Di Girolamo, L.; Getzewich, B.; Guignard, A.; Heidinger, A.; et al. Assessment of Global Cloud Datasets from Satellites: Project and Database Initiated by the GEWEX Radiation Panel. Bull. Am. Meteorol. Soc. 2013, 94, 1031–1049. [Google Scholar] [CrossRef] [Green Version]
- Moroney, C.; Jet Propulsion Laboratory, California Institute of Technology, Pasadena, CA, USA. Personal communication, 2018.
- Stephens, G.L. Radiation Profiles in Extended Water Clouds. II: Parameterization Schemes. J. Atmos. Sci. 1978, 35, 2123–2132. [Google Scholar] [CrossRef] [Green Version]
- Liu, S.; Heygster, G.; Zhang, S. Comparison of CloudSat cloud liquid water paths in arctic summer using ground-based microwave radiometer. J. Ocean Univ. China 2010, 9, 333–342. [Google Scholar] [CrossRef]
- Brodzik, M.J.; Stewart, J.S. Near-Real-Time SSM/I-SSMIS EASE-Grid Daily Global Ice Concentration and Snow Extent, Version 5. 2016. Available online: https://nsidc.org/data/NISE/versions/5 (accessed on 23 November 2018).
- Loeb, N.G.; Wielicki, B.A.; Doelling, D.R.; Smith, G.L.; Keyes, D.F.; Kato, S.; Manalo-Smith, N.; Wong, T. Toward Optimal Closure of the Earth’s Top-of-Atmosphere Radiation Budget. J. Clim. 2009, 22, 748–766. [Google Scholar] [CrossRef]
- Cox, S.J.; Stackhouse, P.W.; Gupta, S.K.; Mikovitz, J.C.; Zhang, T.; Hinkelman, L.M.; Wild, M.; Ohmura, A. The Nasa/Gewex Surface Radiation Budget Project: Overview and Analysis. Available online: http://ams.confex.com/ams/pdfpapers/112990.pdf (accessed on 23 November 2018).
- Zhang, Y. Calculation of radiative fluxes from the surface to top of atmosphere based on ISCCP and other global data sets: Refinements of the radiative transfer model and the input data. J. Geophys. Res. 2004, 109. [Google Scholar] [CrossRef] [Green Version]
- Loeb, N.G.; Manalo-Smith, N.; Kato, S.; Miller, W.F.; Gupta, S.K.; Minnis, P.; Wielicki, B.A. Angular Distribution Models for Top-of-Atmosphere Radiative Flux Estimation from the Clouds and the Earth’s Radiant Energy System Instrument on the Tropical Rainfall Measuring Mission Satellite. Part I: Methodology. J. Appl. Meteorol. 2003, 42, 240–265. [Google Scholar] [CrossRef]
Figure 1.
All collocated CERES-MISR instantaneous samples of near-nadir SW BRFs and SW albedos for (a,b) CERES overcast ocean scenes; (c,d) CERES overcast sea ice scenes; (e,f) CERES overcast fresh snow scenes; and (g,h) CERES overcast permanent snow scenes. Bin size is 0.01 for both BRF and albedo plots.

Figure 2.
Distribution of regional (1° × 1°) overcast albedo RMS differences for (a) ocean and (b) snow/ice.
Figure 2.
Distribution of regional (1° × 1°) overcast albedo RMS differences for (a) ocean and (b) snow/ice.

Figure 3.
Comparison of CERES and MISR instantaneous overcast albedos over the Arctic ocean for (a,c,e) consistent scene type, and (b,d,f) inconsistent scene type for solar zenith angle (SZA) ∈ [40°, 90°], [50°, 60°), and [80°, 90°).
Figure 3.
Comparison of CERES and MISR instantaneous overcast albedos over the Arctic ocean for (a,c,e) consistent scene type, and (b,d,f) inconsistent scene type for solar zenith angle (SZA) ∈ [40°, 90°], [50°, 60°), and [80°, 90°).

Figure 4.
Same as Figure 3 but for (a,b) overcast fresh snow with solar zenith angle (SZA) between 40° and 50°, (c,d) overcast permanent snow with SZA between 50° and 60°, and (e,f) overcast sea ice with SZA between 60° and 70°.
Figure 4.
Same as Figure 3 but for (a,b) overcast fresh snow with solar zenith angle (SZA) between 40° and 50°, (c,d) overcast permanent snow with SZA between 50° and 60°, and (e,f) overcast sea ice with SZA between 60° and 70°.

Figure 5.
Stacked sample percentage (%) of MISR scene identifications for (a) CERES overcast ocean, (b) overcast sea ice, (c) overcast permanent snow, and (d) overcast fresh snow based on all three-year collocated data.
Figure 5.
Stacked sample percentage (%) of MISR scene identifications for (a) CERES overcast ocean, (b) overcast sea ice, (c) overcast permanent snow, and (d) overcast fresh snow based on all three-year collocated data.

Figure 6.
Sample distribution of collocated (20 km)2 CERES-MISR samples for six MISR cloud masks (Albedo Cloud Designation (CD), Stereoscopically Derived Cloud Mask (SDCM) new, Angular Signature Cloud Mask (ASCM), Radiometric Camera-by-Camera Cloud Mask (RCCM)-An, Consensus, Best-CF) over CERES overcast (f > 99%), and clear (f < 0.1%) scenes by treating No Retrieval (NR) cloud mask values as clear and as cloudy. Note that both ASCM and RCCM are terrain-referenced.

Figure 7.
Relative RMS differences (%) of overcast TOA albedo retrieval algorithms between the CERES and MISR as a function of solar zenith angle ranges.
Figure 7.
Relative RMS differences (%) of overcast TOA albedo retrieval algorithms between the CERES and MISR as a function of solar zenith angle ranges.


Table 1.
Datasets used in this study.
| Instrument | Dataset | Purpose |
|---|---|---|
| CERES | CER_SSF_Terra-FM1-MODIS_Edition4A | albedo comparison |
| CER_SSF_Terra-FM1-MODIS_Edition3A | ||
| MISR | MISR_AM1_TC_ALBEDO_F05_0011 | |
| MISR_AM1_TC_STEREO_F08_0017 | cloud mask consistency check | |
| MISR_AM1_TC_CLOUD_F01_0001 | ||
| MISR_AM1_GRP_RCCM_GM_F04_0025 | ||
| MISR_AM1_TC_CLASSIFIERS_F07_0013 |
Table 2.
Data selection criteria for albedo collocation.
| Parameter | CERES Value | MISR Value |
|---|---|---|
| Viewing zenith angle | ≤10° | ≤10° |
| Cloud fraction | ≥99.9% | n/a |
| Surface type | Open water, Permanent snow, Fresh snow, Sea ice | n/a |
| Surface type percentage | 100% | n/a |
| Unobscured percentage | n/a | ≥90% (An Camera) |
Table 3.
Coefficients c0, c1, and c2 for conversion of the Multi-angle Imaging SpectroRadiometer (MISR) Red and Near Infrared (NIR) spectral Bidirectional Reflectance Factors (BRFs) to broadband BRF for collocated Clouds and the Earth’s Radiant Energy System (CERES) overcast ocean scenes, as well as the corresponding relative root-mean-square (RMS) differences (, and coefficients of determination (R2).
| c0 | c1 | c2 | Number of Samples | R2 | ||
|---|---|---|---|---|---|---|
| [40°, 50°) | 0.0493 | 0.5782 | 0.1017 | 318240 | 5.2 | 0.98 |
| [50°, 60°) | 0.0507 | 0.8565 | −0.1861 | 429684 | 5.2 | 0.98 |
| [60°, 70°) | 0.0512 | 0.762 | −0.0884 | 238810 | 5.4 | 0.98 |
| [70°, 80°) | 0.0471 | 0.2805 | 0.4128 | 325160 | 4.5 | 0.97 |
| [80°, 90°) | 0.0505 | 0.1334 | 0.5518 | 185923 | 6.2 | 0.95 |
Table 4.
Same as Table 3, but for collocated CERES overcast sea ice scenes.
Table 4.
Same as Table 3, but for collocated CERES overcast sea ice scenes.
| c0 | c1 | c2 | Number of Samples | R2 | ||
|---|---|---|---|---|---|---|
| [40°, 50°) | 0.036 | 0.5545 | 0.1681 | 9358 | 4.5 | 0.93 |
| [50°, 60°) | 0.115 | 0.6389 | −0.0237 | 72292 | 4.6 | 0.82 |
| [60°, 70°) | 0.1032 | 0.6383 | −0.015 | 166951 | 4.8 | 0.84 |
| [70°, 80°) | 0.1014 | 0.5963 | 0.0157 | 68865 | 4.2 | 0.88 |
| [80°, 90°) | 0.1253 | 0.5485 | −0.0076 | 3967 | 4.7 | 0.90 |
Table 5.
The relative root-mean-square (RMS) difference (%) and relative mean bias (%, in parentheses) between CERES and MISR collocated TOA SW albedos within the Arctic for different solar zenith angle (, unit: degree) ranges and over different surface types (ocean, sea ice (SI), fresh snow (FS), and permanent snow (PS)).
| Consistent Scene Classification | |||||
| Surface type | |||||
| Ocean | 5.2 (1.7) | 4.9 (0.2) | 5.7 (1.0) | 7.4 (−0.5) | 14.7 (5.7) |
| SI | 4.4 (−3.2) | 4.1 (1.9) | 4.9 (3.0) | 6.1 (3.2) | 16.6 (13.8) |
| FS | 4.0 (0.5) | 4.9 (3.1) | 7.1 (4.5) | 8.7 (4.7) | 14.2 (10.9) |
| PS | 6.6 (1.8) | 5.3 (4.2) | 7.1 (5.2) | 10.1 (8.0) | 20.4 (18.6) |
| Inconsistent Scene Classification | |||||
| Ocean | 11.9 (6.8) | 19.6 (13.2) | 16.5 (10.0) | 24.2 (12.6) | 31.7 (17.7) |
| SI | 8.3 (−5.0) | 5.7 (1.6) | 6.4 (1.6) | 8.0 (2.1) | 18.0 (13.8) |
| FS | 7.1 (-1.5) | 6.7 (1.8) | 9.5 (2.2) | 10.6 (3.6) | 17.2 (11.6) |
| PS | 17.7 (−6.7) | 18.0 (−5.7) | 14.6 (−1.0) | 18.0 (−0.5) | 22.6 (9.2) |
Table 6.
Surface classification inconsistency (%) between CERES and MISR over nadir CERES samples in 4-month (June, July, August, September) in 2007.
Table 6.
Surface classification inconsistency (%) between CERES and MISR over nadir CERES samples in 4-month (June, July, August, September) in 2007.
| CERES Surface Type | MISR Operational Snow/Ice Mask | MISR T6 | MISR T15 |
|---|---|---|---|
| Overcast ocean | 17.6 | 6.2 | 5.7 |
| Overcast sea ice | 0.1 | 0.2 | 2.4 |
| Overcast fresh snow | 10.8 | 13.1 | 24.9 |
| Overcast permanent snow | 2.2 | 3.7 | 13.5 |
© 2018 by the authors. Licensee MDPI, Basel, Switzerland. This article is an open access article distributed under the terms and conditions of the Creative Commons Attribution (CC BY) license (http://creativecommons.org/licenses/by/4.0/).
Share and Cite
MDPI and ACS Style
Zhan, Y.; Di Girolamo, L.; Davies, R.; Moroney, C. Instantaneous Top-of-Atmosphere Albedo Comparison between CERES and MISR over the Arctic. Remote Sens. 2018, 10, 1882. https://0-doi-org.brum.beds.ac.uk/10.3390/rs10121882
AMA Style
Zhan Y, Di Girolamo L, Davies R, Moroney C. Instantaneous Top-of-Atmosphere Albedo Comparison between CERES and MISR over the Arctic. Remote Sensing. 2018; 10(12):1882. https://0-doi-org.brum.beds.ac.uk/10.3390/rs10121882
Chicago/Turabian StyleZhan, Yizhe, Larry Di Girolamo, Roger Davies, and Catherine Moroney. 2018. "Instantaneous Top-of-Atmosphere Albedo Comparison between CERES and MISR over the Arctic" Remote Sensing 10, no. 12: 1882. https://0-doi-org.brum.beds.ac.uk/10.3390/rs10121882
Note that from the first issue of 2016, this journal uses article numbers instead of page numbers. See further details here.