Article

GPS Time Series Analysis from Aboa the Finnish Antarctic Research Station

1
Department of Geodesy and Geodynamics, Finnish Geospatial Research Institute FGI, Geodeetinrinne 2, FI-02430 Masala, Finland
2
Geomorphology and glaciology, Department of Physical Geography, Stockholm University, 114 19 Stockholm, Sweden
3
Department of Remote Sensing and Photogrammetry, Finnish Geospatial Research Institute FGI, Geodeetinrinne 2, FI-02430 Masala, Finland
*
Author to whom correspondence should be addressed.
Remote Sens. 2018, 10(12), 1937; https://0-doi-org.brum.beds.ac.uk/10.3390/rs10121937
Submission received: 30 October 2018 / Revised: 23 November 2018 / Accepted: 28 November 2018 / Published: 1 December 2018
(This article belongs to the Special Issue Environmental Research with Global Navigation Satellite System (GNSS))

Abstract

:
Continuous Global Positioning System (GPS) observations have been logged at the Finnish Antarctic research station (Aboa) since February 2003. The station is located in Dronning Maud Land, East Antarctica. Almost 5000 daily observation files have been archived based on yearly scientific expeditions. These files have not been fully analysed until now. This study reports for the first time on the consistent and homogeneous data processing and analysis of the 15-year long time series. Daily coordinates are obtained using Precise Point Positioning (PPP) processing based on two approaches. The first approach is based on the Kalman filter and uses the RTKLIB open source library to produce daily solutions by unconventionally running the filter in the forward and backward direction. The second approach uses APPS web service and is based on GIPSY scientific processing engine. The two approaches show an excellent agreement with less than 3 mm rms error horizontally and 6 mm rms error vertically. The derived position time series is analysed in terms of trend, periodicity and noise characteristics. The noise of the time series was found to be power-law noise model with spectral index closer to flicker noise. In addition, several periodic signals were found at 5, 14, 183 and 362 days. Furthermore, most of the horizontal movement was found to be in the North direction at a rate of 11.23 ± 0.09 mm/y, whereas the rate in the East direction was estimated to be 1.46 ± 0.05 mm/y. Lastly, the 15-year long time series revealed a movement upwards at a rate of 0.79 ± 0.35 mm/y. Despite being an unattended station, Aboa provides one of the most continuous and longest GPS time series in Antarctica. Therefore, we believe that this research increases the awareness of local geophysical phenomena in a less reported area of the Antarctic continent.

Graphical Abstract

1. Introduction

Antarctica is an important area due to its ongoing glaciation and contemporary climate-driven rapid changes. Geodetic and geophysical observations on Holocene changes in Antarctica will give us unique information when studying global climate-change related phenomena. Long time series of geodetic and geophysical stations provide data explaining parts of the interaction between solid earth, cryosphere, hydrosphere and atmosphere. They are also essential as ground truth when data from satellite missions are analysed.
Finland joined the Antarctic Treaty in 1984, became consultative party in 1989 and full member of the Scientific Committee on Antarctic Research (SCAR) in 1990 [1,2]. Five years later after signing the treaty, the Finnish research station, Aboa, was established in Dronning Maud Land (DML), East Antarctica. All Aboa activities were gathered under the general heading of the Finnish Antarctic Research Program (FINNARP). The first FINNARP expedition took place during the Antarctic summer of 89/90. Since then, a total number of 26 FINNARP expeditions have been arranged during the Antarctic summers (http://www.antarctica.fi/). There were no expeditions during the summers of 90/91, 94/95, 96/97 and 98/99. The research activities associated with the expeditions have been mainly financed by the Academy of Finland via regular calls for Antarctic research issued every fourth year. In addition, universities and research institutions invest financial resources of their own for Antarctic research [2].
In recent years, the Finnish Antarctic research has focused on geodesy [3,4,5], glaciology [6,7,8], geology and geophysics [9,10,11,12,13], air quality and climate change [14,15,16,17,18], meteorological and space physics [19,20,21,22], marine and structural technology [23,24], oceanography and marine biology [25,26]. Typically, the research work has been undertaken at Aboa and surrounding areas. These research activities have sometimes been complemented with trips and overnight stays to more distant locations, including the coast. In addition, foreign researchers have participated in the FINNARP expeditions and Finnish researchers have worked at foreign research stations and on board of foreign vessels. For example, Finnish researchers have performed ozone and ultraviolet (UV) research at the Argentine Marambio research station, cosmic rays research at the Italian-French Dome Concordia station, or marine and sea-ice research on South African R/V Agulhas II. Absolute and relative gravity measurements have been done at the Norwegian Troll station, Russian Novolazarevskaya station, Indian Maitri station, and South African SANAE IV station. SCAR GPS measuring campaigns have been conducted at several locations, including Swedish Wasa station neighbouring Aboa. Furthermore, logistic and research support has been provided to international collaborators, e.g., satellite controlled meteorological balloons on behalf of the Smith College, USA (http://www.antarctica.fi/).
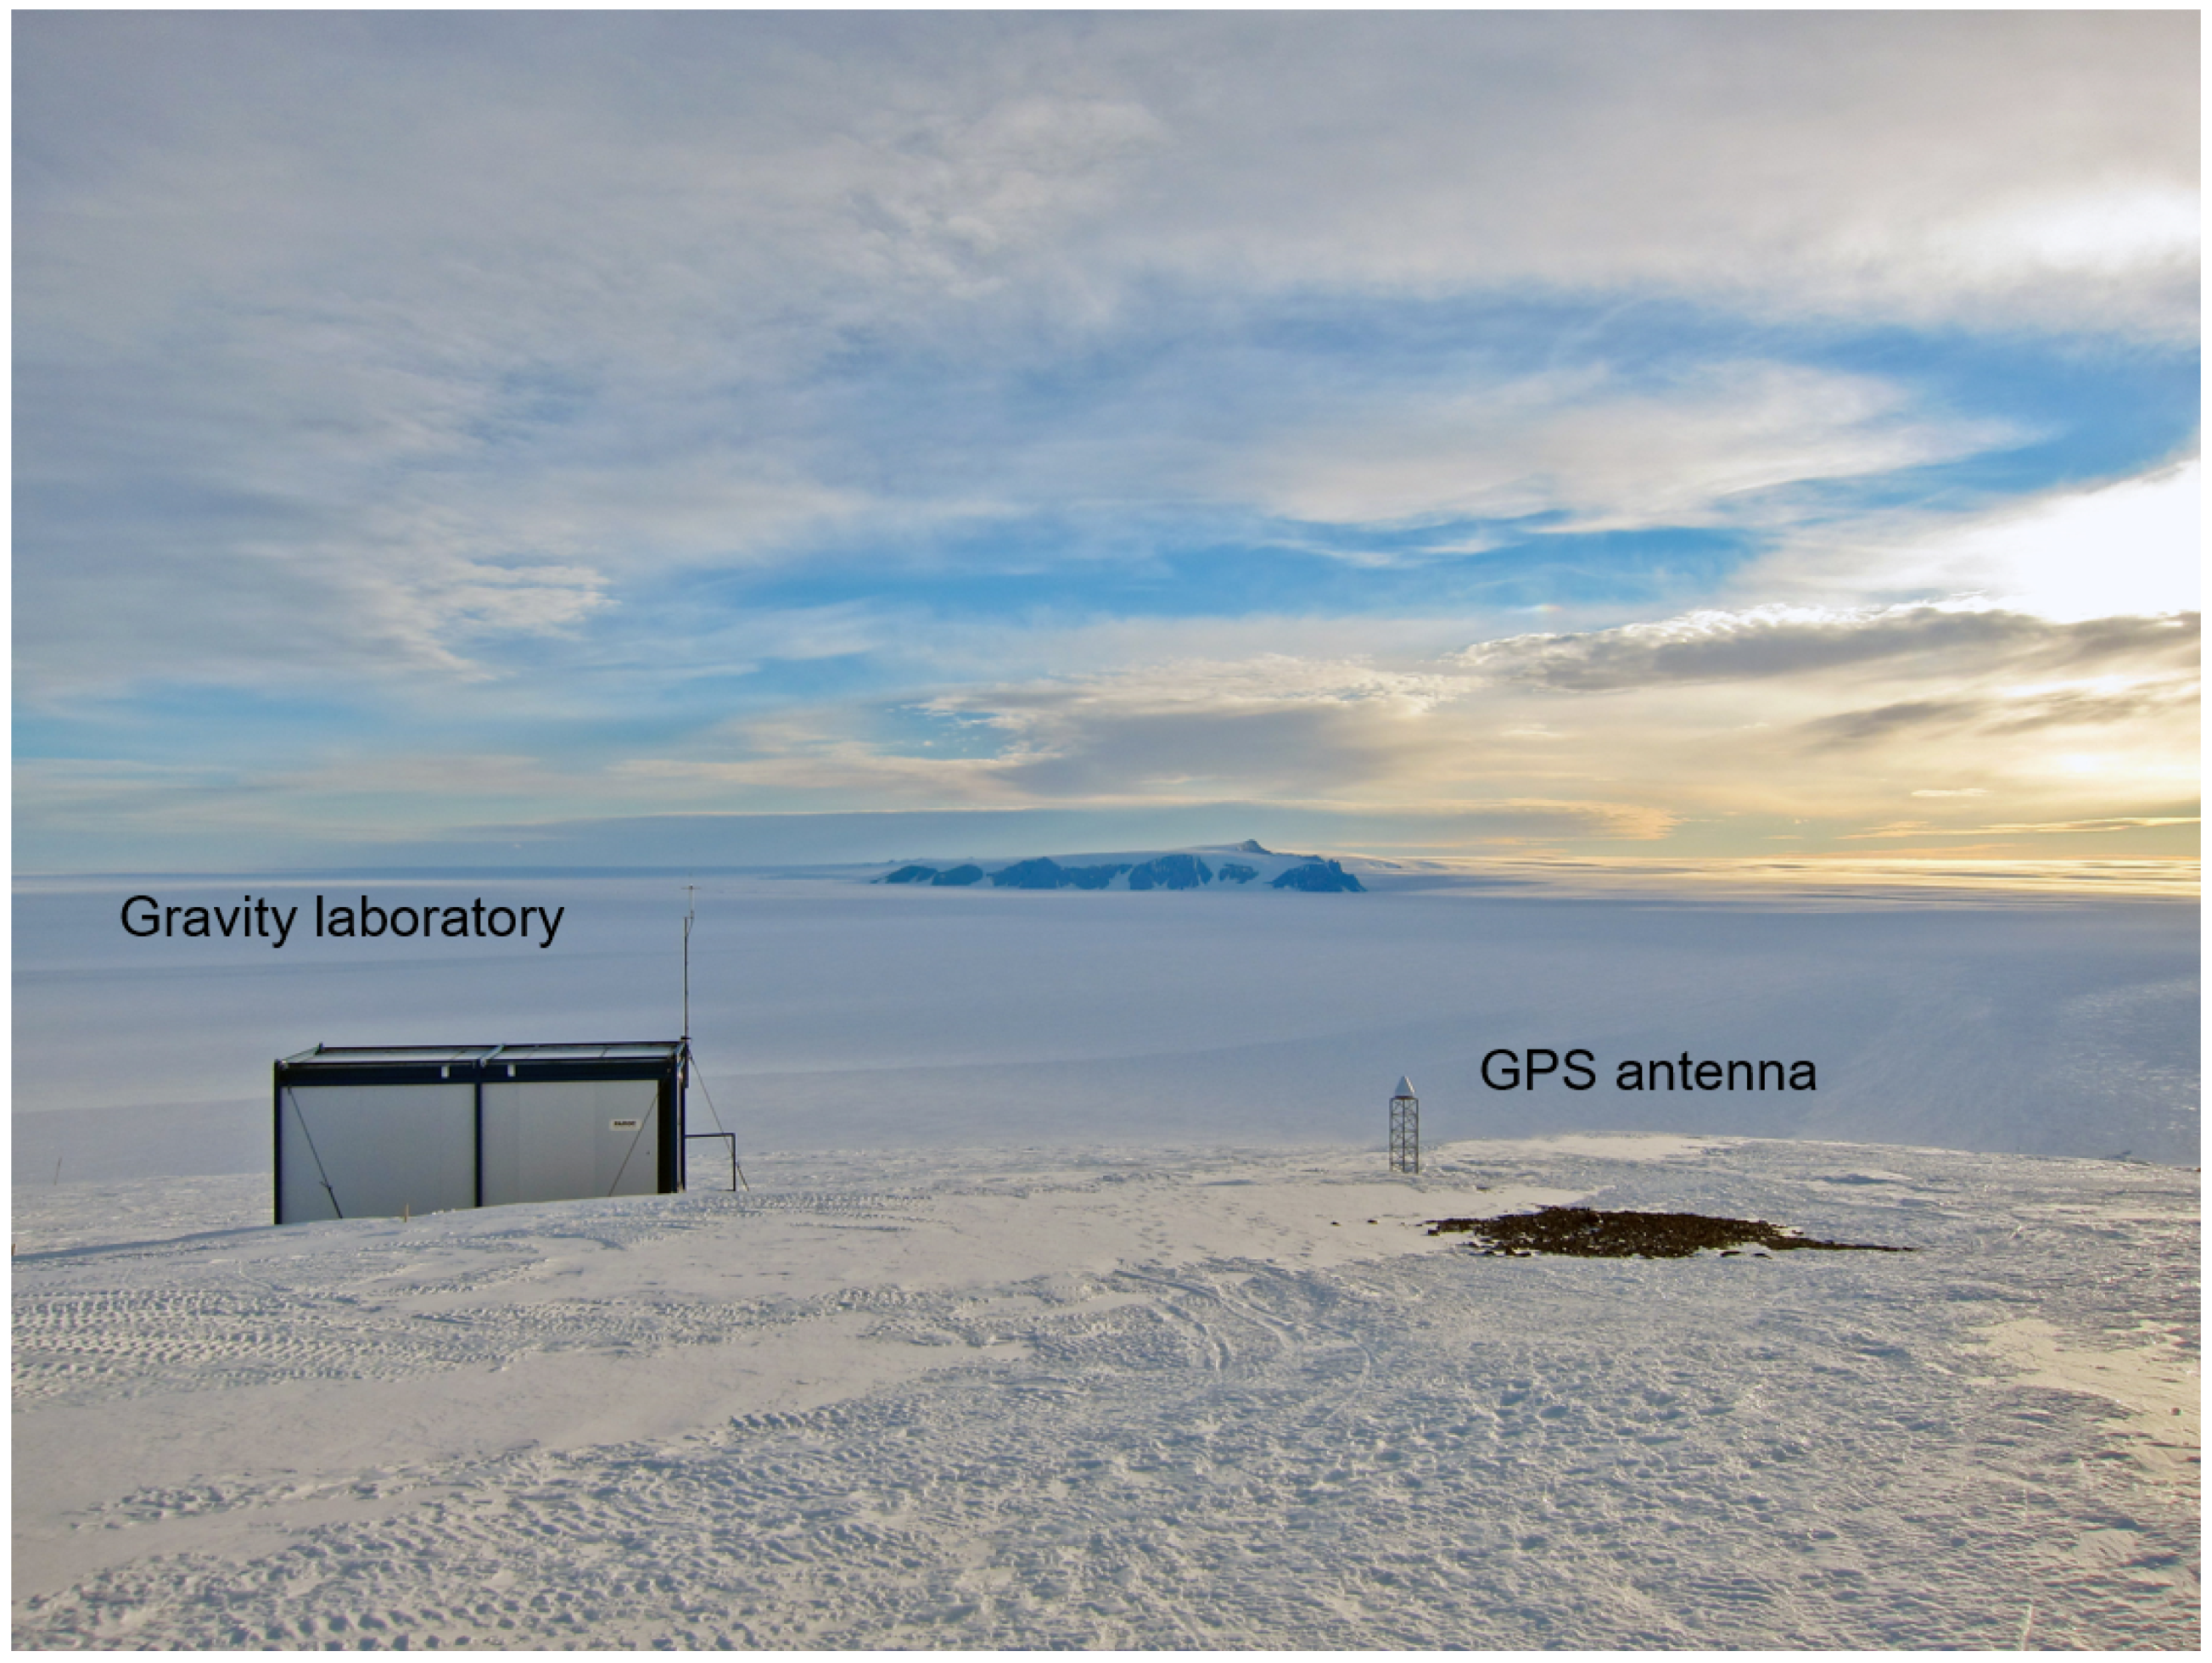
Currently, the Aboa research station is equipped with several automated year-round measuring instruments, such as continuous GPS tracking equipment (2003), an automatic weather station (2004), and an automatic seismometre (2007). In addition, Finnish researchers have deployed other automated year-round measuring instruments outside Aboa, such as automated weather stations at the top of the Basen nunatak and near the coast, automated buoy at sea to measure the vertical temperature profile of sea ice, and cosmic ray detectors. All these measuring instruments ensure the collection of significant sample series and the continuation of long-term time series data in accordance with Finland’s Antarctic research strategy [2].
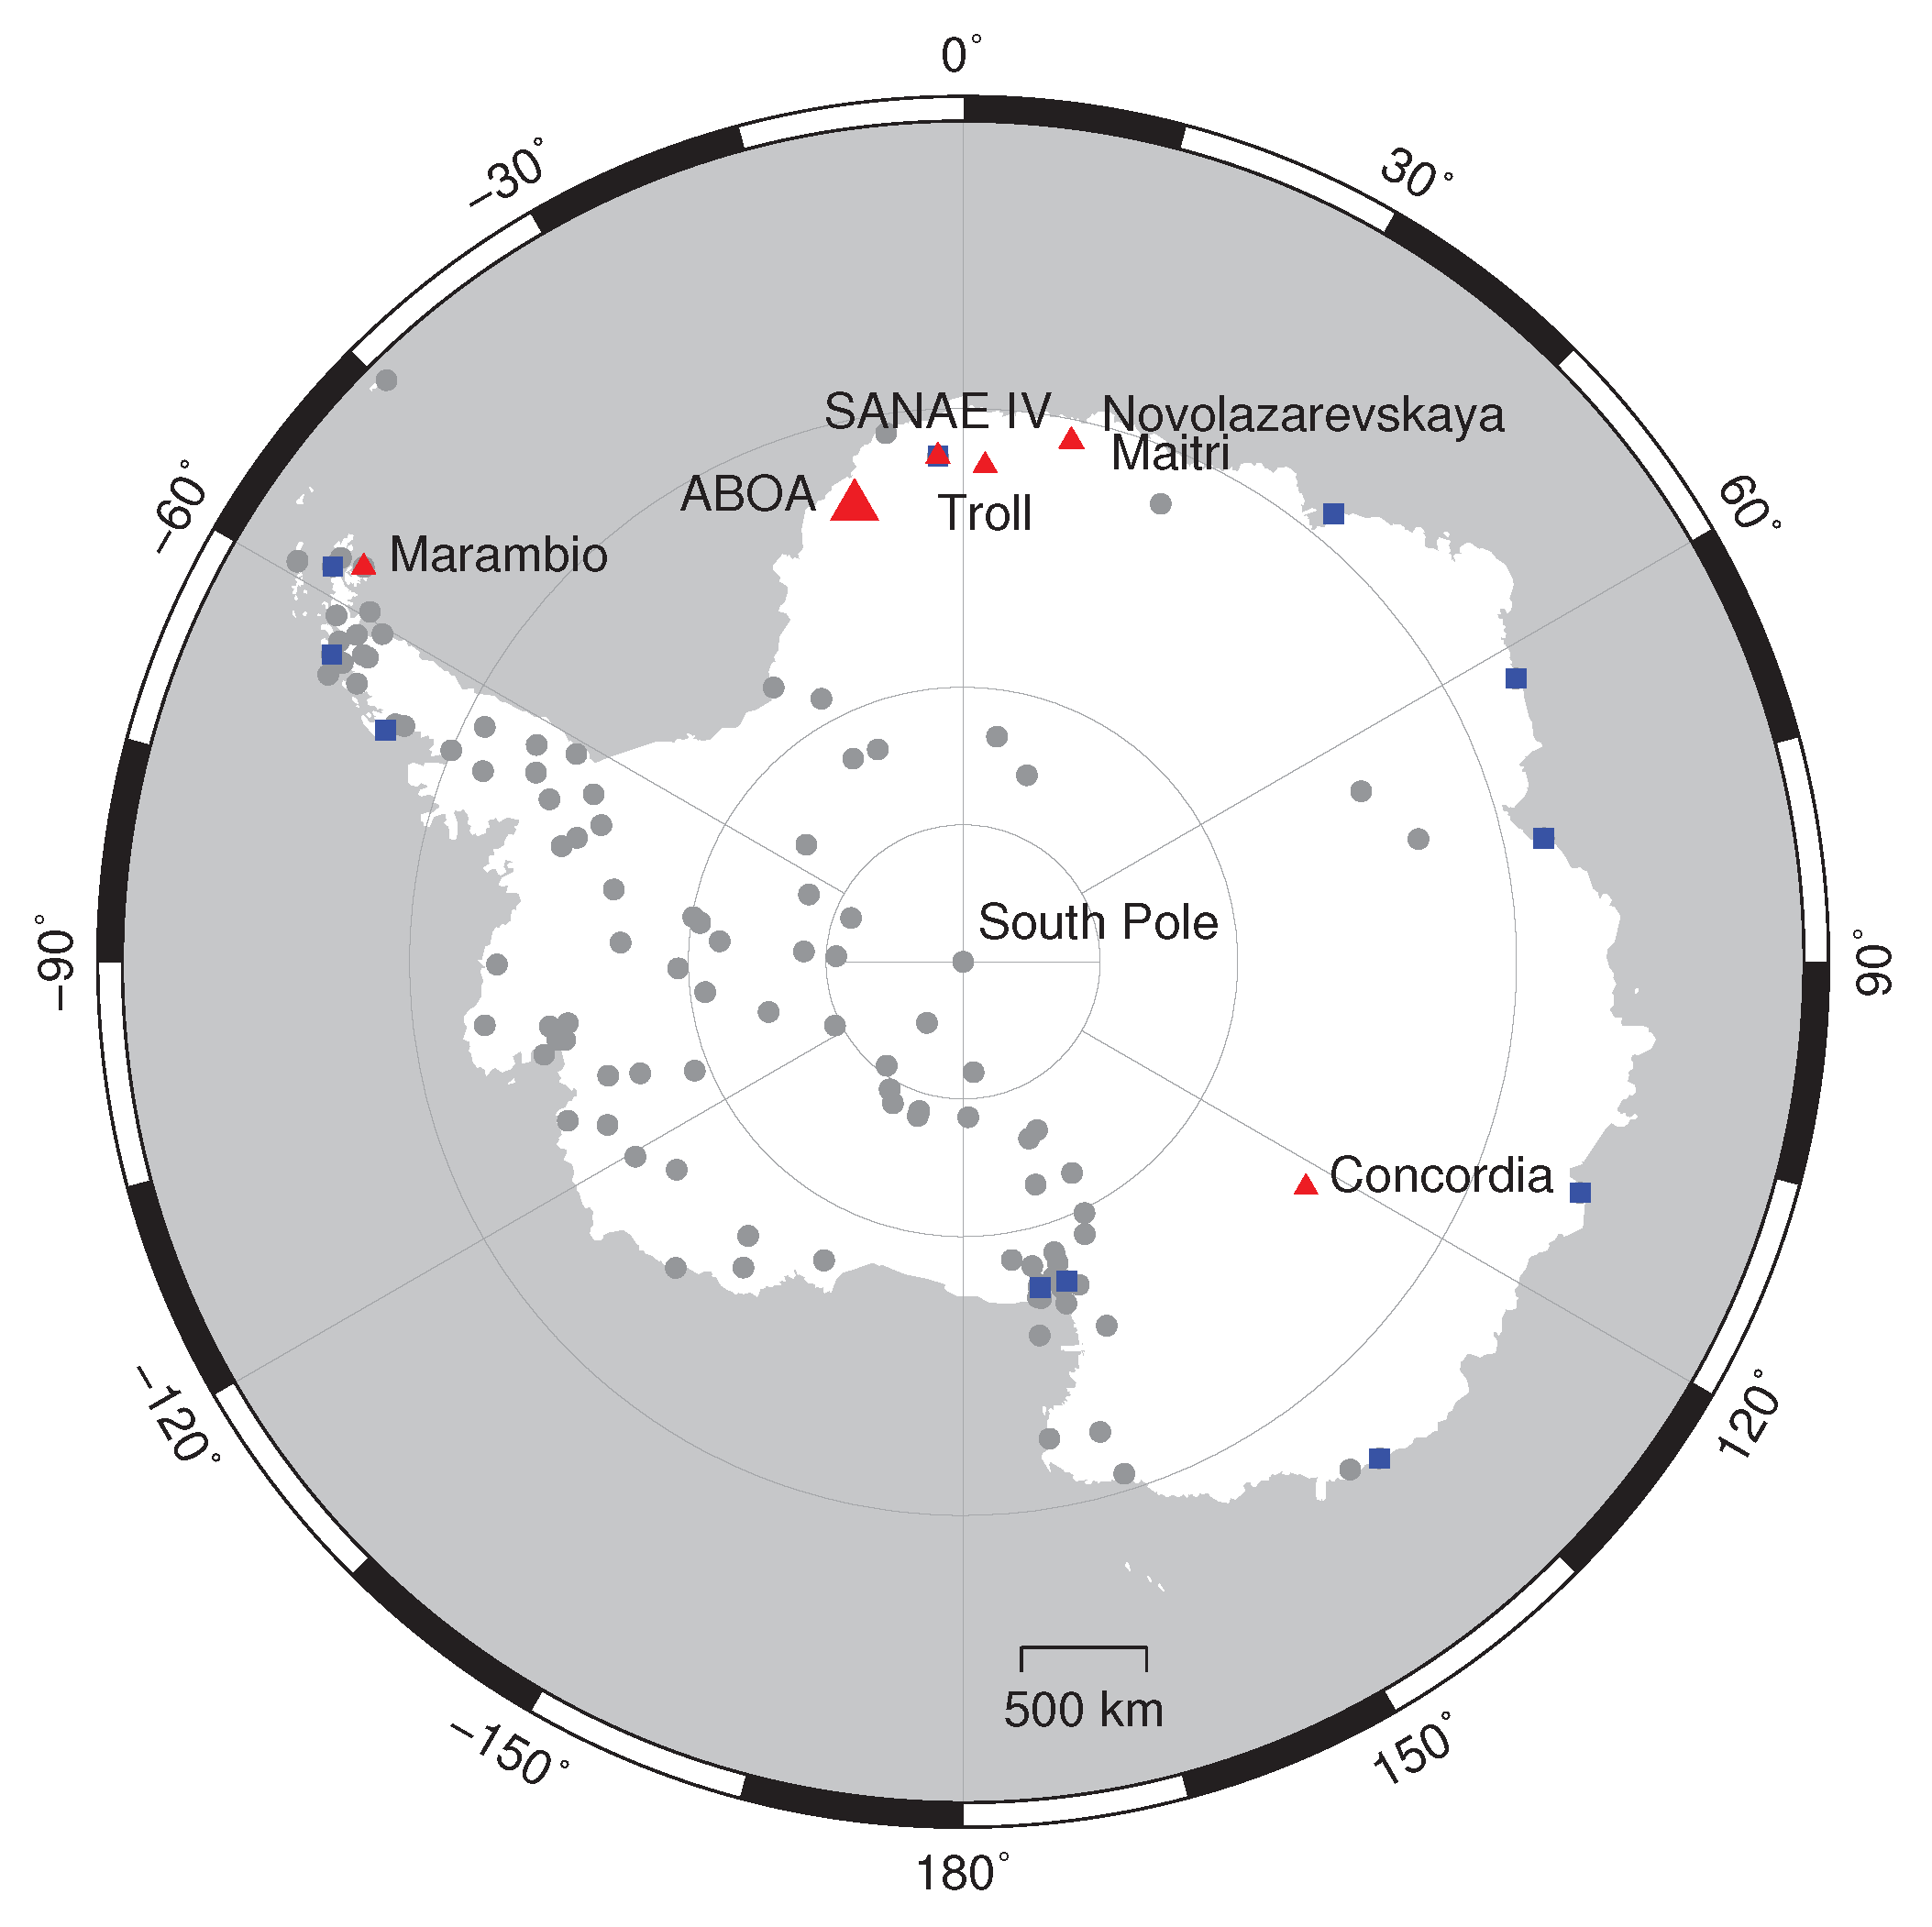
Numerous GPS and/or GNSS (Global Navigation Satellite System) continuous and episodic stations have been established in Antarctica in the last two decades (Figure 1). The development has lead to GPS becoming an essential component of geophysical and meteorological research for studying fundamental solid Earth and atmospheric processes that drive natural hazards, weather, and climate [27]. The first GPS measurements in Antarctica were conducted in the early 90s. The main objective was to gain detailed insights into the tectonic behaviour of the Antarctic plate [28,29]. The accumulation of the measurements allowed the definition of a precise reference frame [30]. Later, Thomas et al. [5] analysed GPS data from more than 50 stations across Antarctica. The authors estimated a more complete and precise vertical velocity field that allowed them to observe increase in uplift rates in the northern Antarctic peninsula after 2002–2003. Plate tectonics and vertical deformation studies also triggered the development of local or regional-scale projects [31,32]. Long time series of continuous GPS data have been used to constrain and test the reliability of glacial isostatic adjustment (GIA) models [33,34,35]. Furthermore, GPS measurements in Antarctica have allowed atmospheric studies, such as ionospheric scintillation [36,37] or ground-based water vapour retrieval [38,39].
Aboa is an important GPS station in Antarctica due to the sparsity of bedrock sites, especially in East Antarctica. As seen in Figure 1, most of the sites are located in West Antarctica, whereas the number of sites is much lower in East Antarctica. In addition, the distances between the sites are rather large and limited to coastal regions of the continent where bedrock can be found. Furthermore, only a limited number of sites provide continuous GPS observations. As of 26 October 2018 (http://www.igs.org/network), there are only 13 active permanent International GNSS Service (IGS) stations [40] on the Antarctic continent and only 10 of them have longer continuous time series than Aboa. This study covers a time span of 15 years. This is two times longer than in [5] who used data for 1959 days between 2003 and 2010, whereas [42,43] used reduced time periods. [42] covered a period of 1415 days between 2009 and 2013, while [43] analysed a time series derived for the 2010–2013 period. Furthermore, [33] computed a series of theoretical expected site velocity uncertainty for 5, 10, and 20-year long time series. Their computations show that the uncertainty decreases with the length of time series. Therefore, our results have the benefit of longer time series and thus higher reliability. Our study is the first to include an in-depth analysis of all available Aboa GPS data.
The rest of the paper is as follows. Section 2 describes the material and methods used to generate and analyse the coordinates time series. Section 3 reports the numerical results of our study. Section 4 discusses the obtained results and their relationship with other published data. Section 5 summarises the main achievements, the importance of our study and the way how our work will continue.

2. Materials and Methods

2.1. Site Description and Equipment

The Finnish Antarctic research station (Aboa) was established in 1989 [8]. The station is located in the western part of the Dronning Maud Land, approx. 130 km from the coast, on Basen nunatak in the northern part of the Kraul mountain range at 73.0437 S, 13.4071 W, and 485 m elevation above sea level. Aboa is occupied only during the Antarctic summers. The GPS permanent station was setup during the 2002/2003 Antarctic expedition. It became operational on 31 January 2003 at 10:10 UT [3].
The Aboa station tracks only GPS satellite signals. The station is equipped with an Ashtech choke ring antenna (ASH701945CM) covered with an Ashtech conical SNOW antenna dome. The antenna has remained unchanged since the beginning of the operation. It has been installed on bedrock on the top of a 1.5 m tall steel mast (Figure 2). Installation on the top of the mast is necessary since the snow environment changes constantly at the site. The height of snow has been close to the antenna height during several seasons, whereas during other seasons the bedrock below the mast appears visible. The GPS receiver is a Javad EURO80 GDA card (JPS HE GDA) custom-fitted into a metal enclosure. The choice of the receiver was made based on the low power usage (1.8–2.4 W) of the Javad receiver since the battery power is limited at Aboa during the winter months. For the same reason, the data is obtained only once per year during the FINNARP expeditions to Aboa. Actually, two identical receivers are used. The FINNARP expedition changes receivers at Aboa and returns the one from the previous year to FGI for data download and maintenance. This strategy allows for the FINNARP expedition to always have spare receiver in case of instrument failure during the previous winter season. Further technical information is given in [3].

2.2. Observation Data

Daily GPS observation files have been logged continuously at Aboa since 1 February 2003. The files have been retrieved on a yearly basis following the annual Antarctic expedition. The last observation day in the current archive is 8 December 2017. As a result, the covered period accounts for almost 15 years. The on-site observations were logged into the receiver manufacturer format and translated to RINEX (Receiver INdependent EXchange) format, version 2.11 using teqc utility [44] upon retrieval. The files include GPS-only observations at the epoch rate of 30 s. Epoch wise, the number of tracked satellites varied between 4 and 15, with a median number of 10 satellites per each epoch of observation.
Figure 3 gives the yearly distribution of the existing observation files. The overall daily availability is 91% (i.e., 4924 available days out of 5425 possible days). The largest gap of 381 days occurred after the 2006/2007 expedition. All files in 2006 and the first 17 days of 2007 were lost due to an unknown reason. Moreover, two other medium-length gaps were identified. One of the gaps occurred in 2008 and counted for 52 days between day-of-year 174 and 226. This was identified with the loss of power during the Antarctic winter. The other gap happened in 2010 and counted for 23 days between day-of-year 013 and 036. Furthermore, 13 days are missing in July 2004 as well as the last 8 days of December 2004. The other identified gaps count for less than 4 days. All together there are 23 gaps in the daily time series. Despite being an unattended GPS station, there is 100% daily availability for five years (2009, 2013, 2014, 2015 and 2016).

2.3. Data Processing

GPS observation data for high-precision applications are typically processed based on two basic approaches: relative positioning and point positioning.
Relative positioning allows estimating the position of a new point with respect to another known, reference point [45,46]. Baseline between a pair of points is observed and processed by forming double-differenced (DD) code and phase observations and solving for the integer phase ambiguities. DD approach (i.e., difference between-receivers and between-satellites) removes the observation errors common to both ends of the baseline, such as satellite orbital errors, satellite clock biases and receiver clock biases. In addition, errors due to troposphere and ionosphere reflection are eliminated or mitigated due to the correlation with the distance between the two points. The longer the distance, the higher the residual errors. Therefore, relative positioning may be extended to a local or regional network. However, the approach becomes computationally cumbersome if the number of stations within such a network increases significantly [27].
Precise Point Positioning (PPP) [47] uses un-differenced, dual-frequency, code and phase observations from a single user receiver along with precise satellite orbit and clock products. The dual-frequency observations are used to form ionosphere-free linear combinations in order to remove the first order ionospheric effects. Unlike in DD relative positioning, PPP has no baseline constraint and thus does not require simultaneous observations at two points. Although PPP itself uses data from a single station only, computation of the satellite orbits and clocks needed for its implementation require the use of a global tracking network [48]. Moreover, PPP requires more careful handling of all error sources affecting the satellite observations than DD relative positioning [49,50]. Furthermore, the physical models (e.g., Earth tides, antenna phase centre corrections) used in the PPP processing should be consistent with those used in the generation of the precise products. The parameters estimated with PPP processing are the 3D point position, the receiver clock, the zenith tropospheric delay and the non-integer ambiguity for each satellite. PPP positions are computed directly in the terrestrial frame in which the satellite orbits and clock parameters are given [27]. The current frame realisation is International Terrestrial Reference Frame (ITRF) 2014 [51].
A variety of tools for precise GPS/GNSS observation data processing have been developed at academic, research, and commercial institutions. They may be grouped into scientific, commercial and open-source software packages. In addition, numerous free online and commercial services exist. Table 1 summarises the most common GPS data processing packages and services.
In this work, we chose the PPP approach instead of the DD to estimate station velocities independently of the other stations’ data. The DD solution would be strongly dependent of the reference velocities of the sparsely located ITRF stations and also affected by the data quality of the reference stations. Our PPP daily positions at Aboa were estimated using the following two tools: RTKLIB open-source package (http://www.rtklib.com/) and Automatic Precise Positioning Service (APPS) web-service (http://apps.gdgps.net), respectively. The former is a versatile tool that enables scientific processing of the data via numerous parameters, some with default values. Nevertheless, the tool requires a high level of understanding of the processing engine to exploit its potential and flexibility. On the other hand, APPS is an easy to use web service based on the GIPSY processing engine. The user uploads the file to the cloud server and receives back a summary processing report in text format. The service allows only a few options to be changed by the user. APPS service use was intended for validation purposes. We describe below how the observation data were processed using the above tools.

2.3.1. PPP Processing Settings (RTKLIB)

RTKLIB open-source package consists of a portable program library and several application libraries designed for GNSS standard and precise positioning. The package is distributed under the open source initiative. The current release is version 2.4.2, whereas the development version is 2.4.3b29. We used the latter one. In addition, RTKLIB supports various positioning modes: single, differential, baseline, static, kinematic, real-time, or post-processing. We exploited the PPP mode in this work. Furthermore, RTKLIB employs un-differenced measurement equations and Extended Kalman Filter (EKF) estimation in order to obtain the final solutions. The mathematical formulation is explained in detail in the Appendix E.8 of the package manual.
As mentioned, PPP requires precise products. In this work, PPP solutions were produced using the final satellite orbits, final clock product with a sampling of 5 s, and weekly final Earth rotation parameter products from Centre for Orbit Determination in Europe (CODE). The products were taken from the homogeneous CODE reprocessing, release 2017 [52]. They were available until the end of 2014. Afterwards, we used the operational products [53]. Further corrections were derived using several mathematical models and standard conventions. The elevation cutoff angle was set to 10 degrees. This is a best compromise between the quantity and quality of data for high-latitude regions [39]. An elevation-dependent weighting scheme was adopted with separate constant and elevation-dependent terms. The estimated parameters were station coordinates, receiver clock, troposphere parameters and float ambiguities. The estimated coordinates were obtained in ITRF2008 [54] before 29 January 2017 and ITRF2014 afterwards.
Table 2 gives an overview of the various error components and corrections used in our PPP processing.

2.3.2. PPP Combined Daily Solutions (RTKLIB)

EKF is a recursive estimator that does not require all previous data to be saved and reprocessed when a new measurement is taken [61]. Thus, the estimated solution converges and its quality improves over time. PPP convergence time and positioning performance depend on several factors, such as the sampling interval of the precise products, the length of the observation session, the observation epoch rate, the observation quality, the receiver type, the multipath level, the geographical location, the number of tracked satellites and constellations, the positioning mode, and the ambiguity resolution [50,62,63]. For example, in static PPP, 20 min are needed for 95% of solutions to reach a horizontal accuracy of 20 cm [62]. Nevertheless, sub-centimetre accuracy levels are achievable for the 24-h data set [50,62]. Figure 4 depicts the convergence process for the forward and backward solutions at Aboa on 1 January 2017.
Typically, the filter is run in the forward direction and the solutions over the convergence period must be discarded. To cope with this, we used an unconventional way to run the filter. We run the filter twice, i.e. in both the forward and backward directions. This is possible only in post-processing mode. Next, the forward and backward solutions are joined into one combined solution using the inverse variance weighting approach. The following equation is used:
X c m b = X f w d · Q f w d 1 + X b w d · Q b w d 1 Q f w d 1 + Q b w d 1
where the X and Q denote the position vector and its associated variance co-variance matrix from the forward ( f w d ), backward ( b w d ) and combined ( c m b ) solution, respectively.
As a result, the limitations coming from the convergence period are removed. The combined solution has a consistent standard deviation at each observation epoch. Figure 5 depicts the combined solution at Aboa on 1 January 2017.
Finally, we chose the median coordinates of the daily combined solution as the daily representative to form the coordinate time series.

2.3.3. Validation Solution Processing Settings (APPS, GIPSY-OASIS)

All available observation data at Aboa were also processed using the APPS web-service. The main intent was for validation purposes. APPS solution is based on the GIPSY-OASIS 6.4 software and uses Jet Propulsion Laboratory (JPL) final orbit and clock precise products. The web-interface allowed us to set two parameters: the elevation cut off angle was set to 10°, whereas the observation weighting scheme was chosen s r t q ( s i n ) . The station positions were estimated at 5 min intervals. All other processing parameters and correction models were defined automatically by the service and inaccessible to the user. According to the information on the service webpage, several signal and ground models were also applied by GIPSY, such as GPS yaw attitude, phase windup, GMT troposphere mapping function, a-priori hydrostatic delay as function of the station height above the ellipsoid, a-priori constant value for the wet delay of 10 cm, tropospheric gradients, relativity, pole and solid tides, ocean tides, and second order ionospheric delay. APPS produces several GIPSY and generic output files, including a summary of the PPP processing. APPS provides coordinates in ITRF2014 starting 5 June 2018.

2.4. Time-Series Analysis

PPP processing provides positions estimates (X, Y, Z) in an Earth-fixed, Earth-centred terrestrial reference frame in which the precise orbit are provided, i.e. ITRF2008 and/or ITRF2014. The Cartesian coordinates are then transformed into topocentric (or levelled) coordinates for a more intuitive and meaningful interpretation. Therefore, the coordinate time series are provided in terms of local displacements in the North, East and Up (N, E, U) directions with respect to the position at an initial epoch. We define the position of the topocentric origin in the geometrical centre of the time series.
Typically, time series analysis includes outlier detection, offsets and displacements identification, noise characterisation, trend and seasonal estimation, and residual analysis. The most popular analysis tools are GGMatlab (TSView) [64], FODITS [65], CATS [66], and Hector [67]. TSView is written in Matlab and complements the GAMIT/GLOBK package, FODITS is embedded into the Bernese GNSS software [68], whereas CATS and Hector are C/C++ written independent command line routines. Hector (http://segal.ubi.pt/hector/) is able to deal with missing data without the need for interpolation to fill in the gaps in the time series. Additionally, the parameter estimation is based on the Maximum Likelihood Estimation (MLE) method. Furthermore, Hector supports all the analyses mentioned earlier. Therefore, it was our choice for the coordinate time series analysis. Version 1.6 was used in this study.
Figure 6 depicts the entire data collection, processing and analysis work flow diagram.

2.5. Environmental Loading Factors

The loading of the crust due to environmental factors, such as varying atmospheric and hydrological conditions as well as non-tidal ocean variations are well known, but not implemented in the GNSS computation. The loading factors have generally amplitudes of a few millimetres up to a few centimetres in the Antarctic continent, but as the phenomena show a clear annual variability it may distort especially campaign measurements as well as long term trends.
We compared pre-computed loading time series from three service providers as shown in Table 3. These services provide pre-computed time series (EOST and IML) and gridded data (GFZ) of hydrological loading, non-tidal atmospheric loading and non-tidal ocean loading. All services provide data in both centre-of-the-mass (CM) and centre-of-the-solid-earth (CE/CF) frame. All three services have similarities and differences. They all provide data starting from approximately 1980 and update their products continuously. There are altogether 20 different products available, but only two non-tidal ocean and two atmospheric loading products cover the whole time period (2003–2017). We decided not to use the hydrological loading computed from hydrologic models as the models have severe problems on ice covered regions and cannot reliably present the annual variability.

3. Results

3.1. PPP-Derived Coordinate Time Series

This section reports on the quality of the PPP-derived coordinate time series at Aboa in terms of internal precision, accuracy and postfit observation residuals.
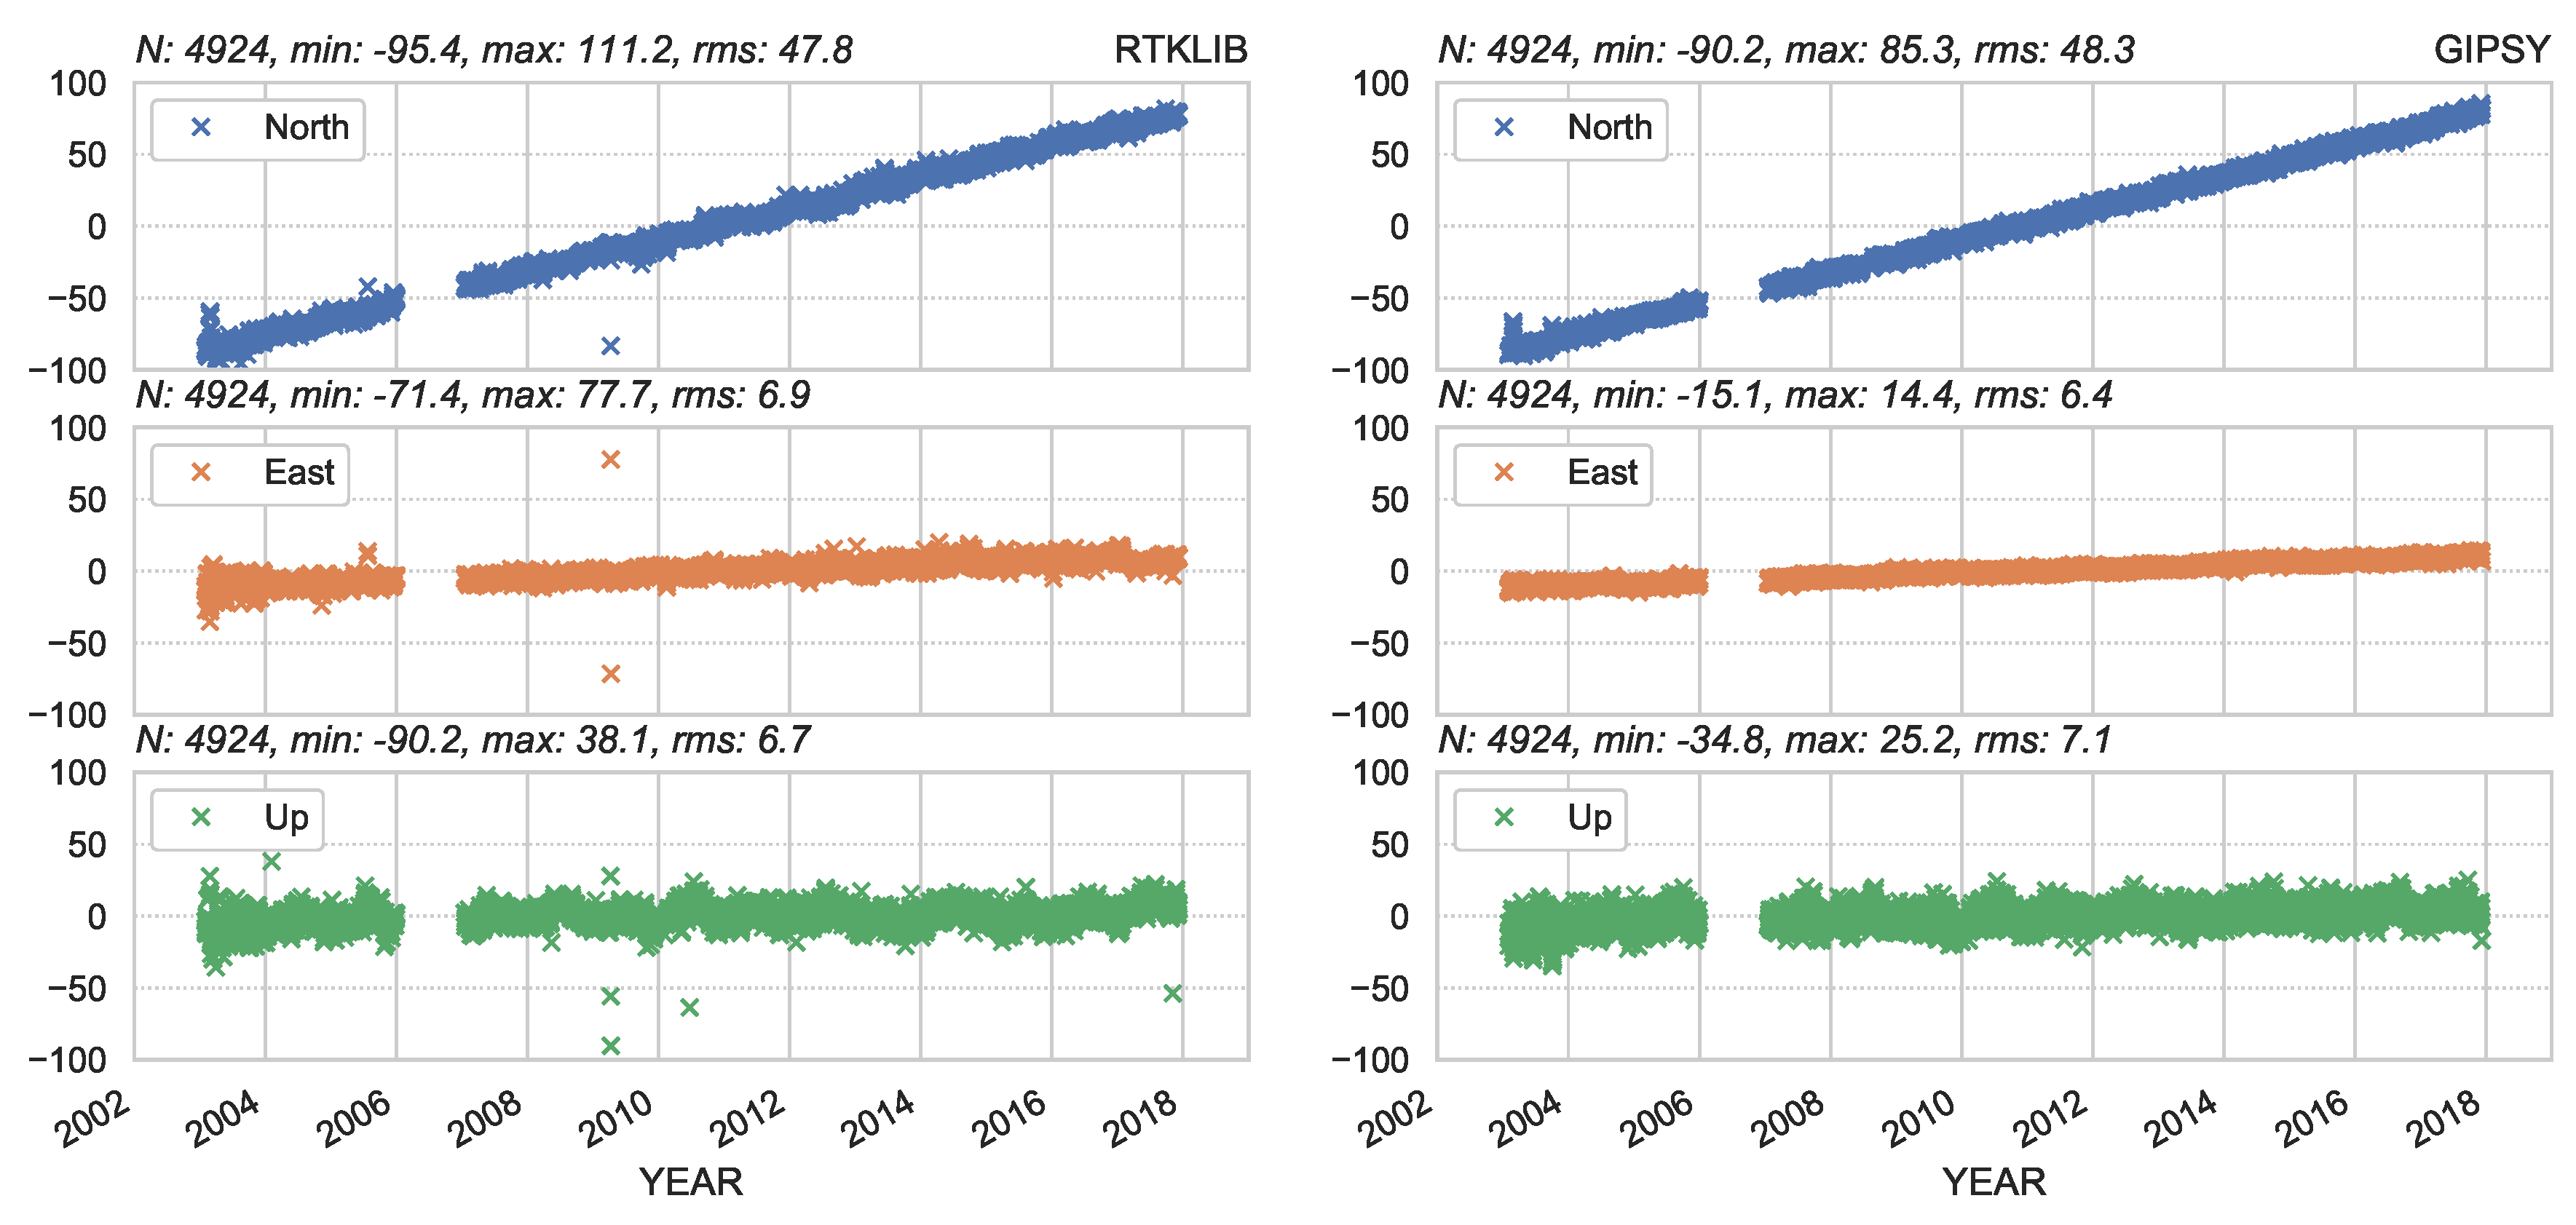
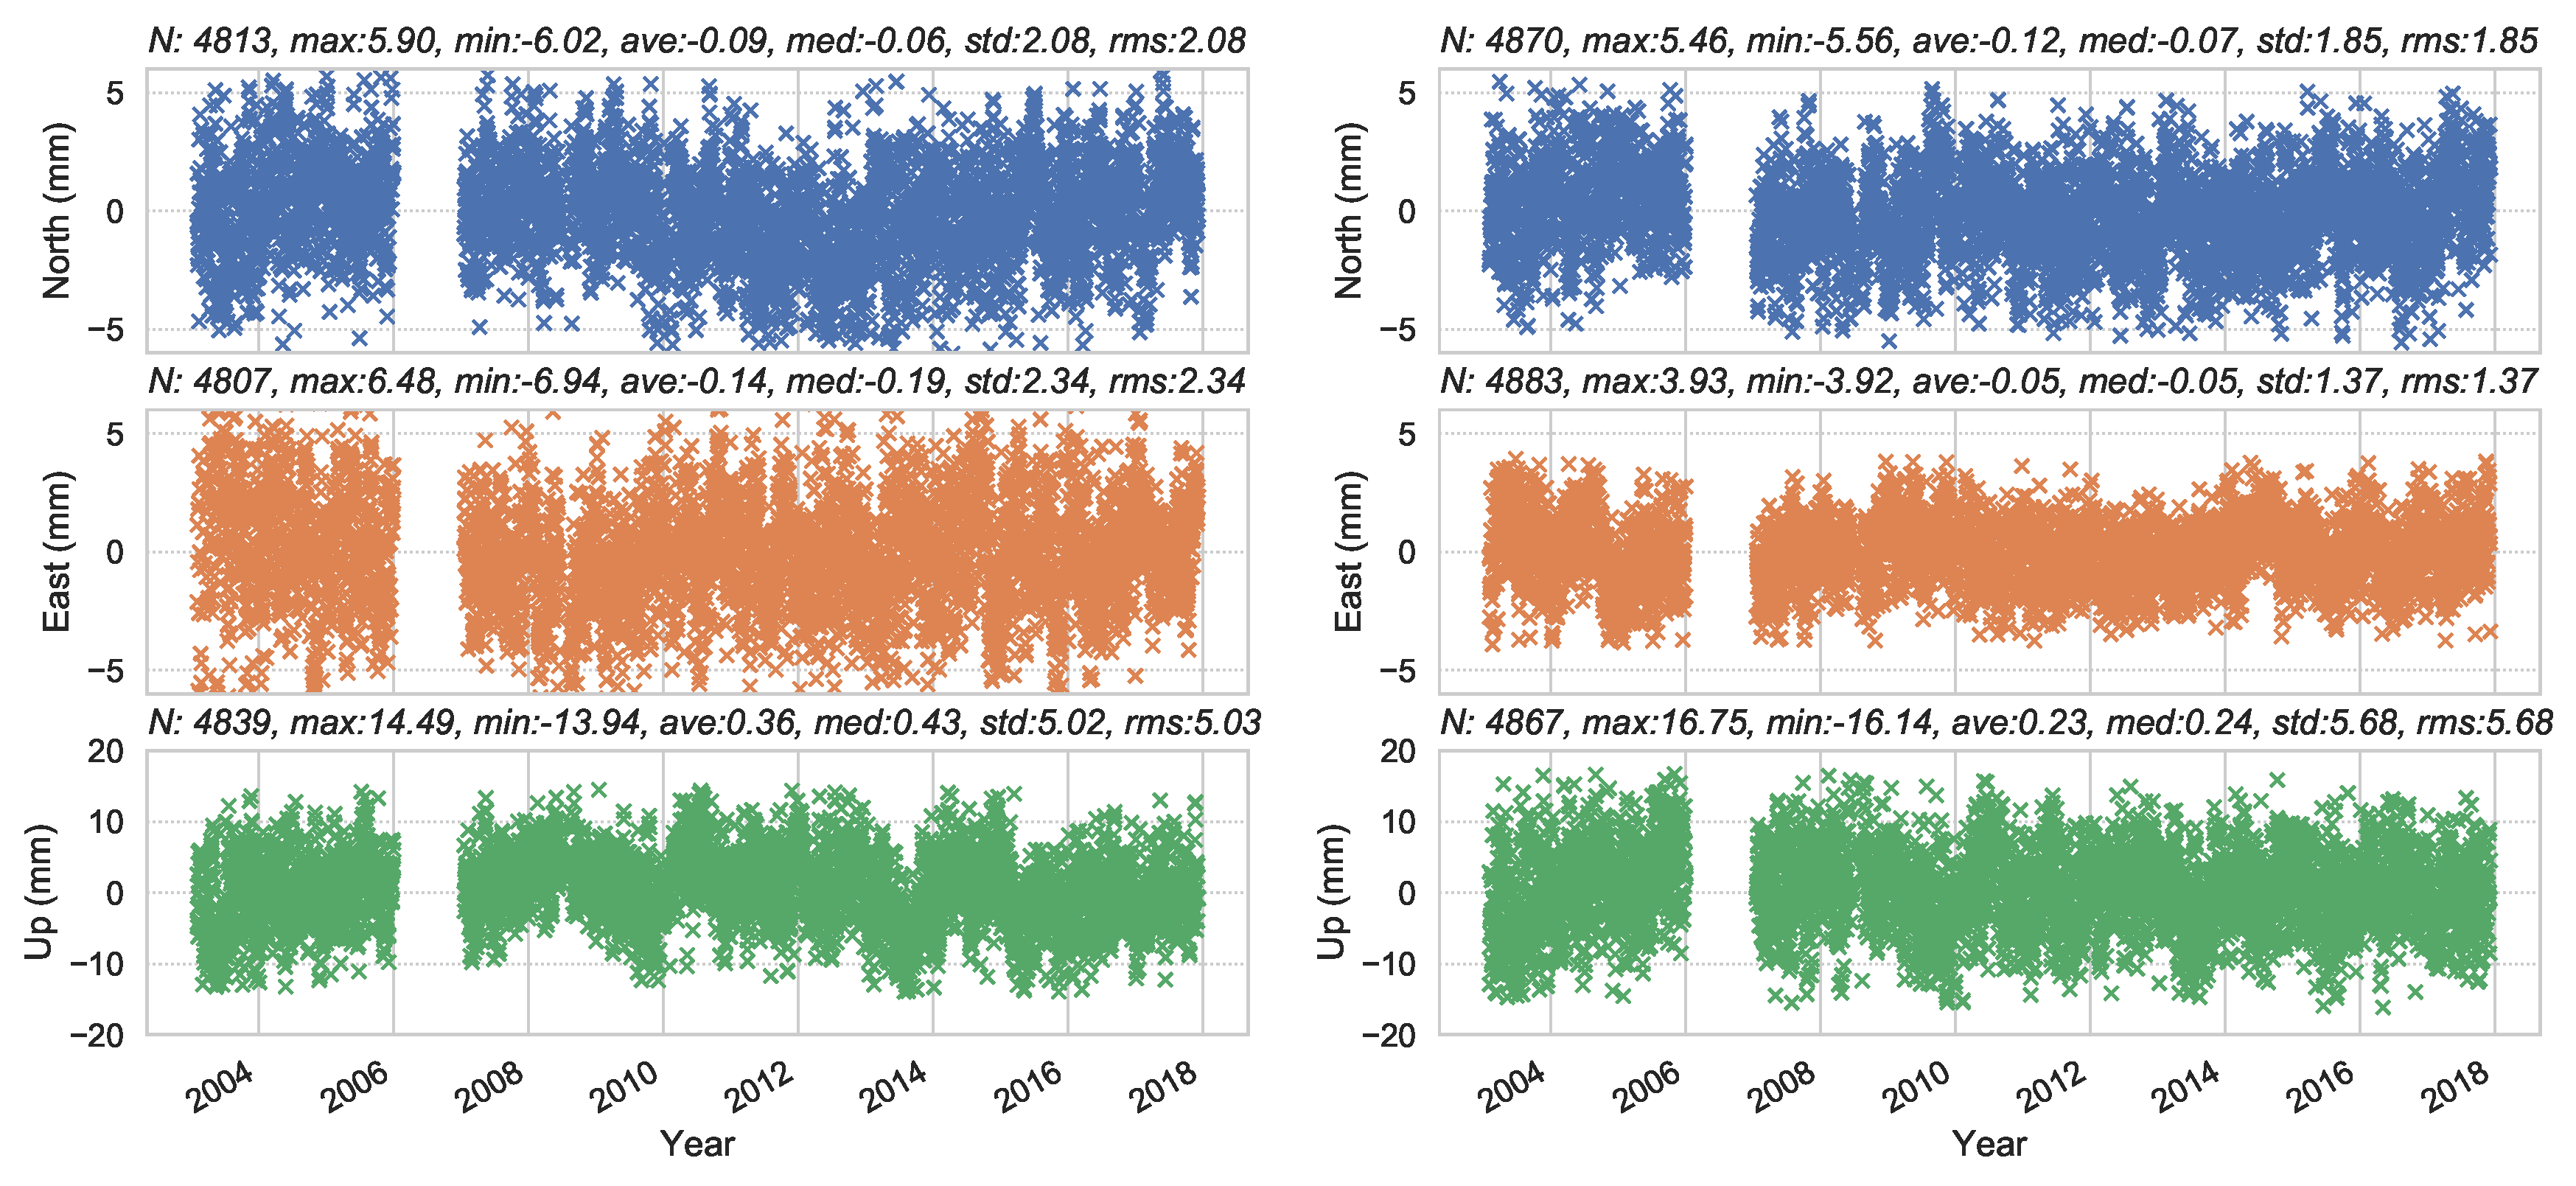
Figure 7 illustrates the topocentric coordinate time series at Aboa from the RTKLIB and GIPSY processing, respectively. The origin of the topocentric system is set to the mean coordinates over the entire period. Whereas the GIPSY solution shows no noticeable outlier, the RTKLIB solution exhibits a few obvious outliers. In addition, the RTKLIB solution appears somehow noisier. Nevertheless, both time series appear to follow a similar trend.
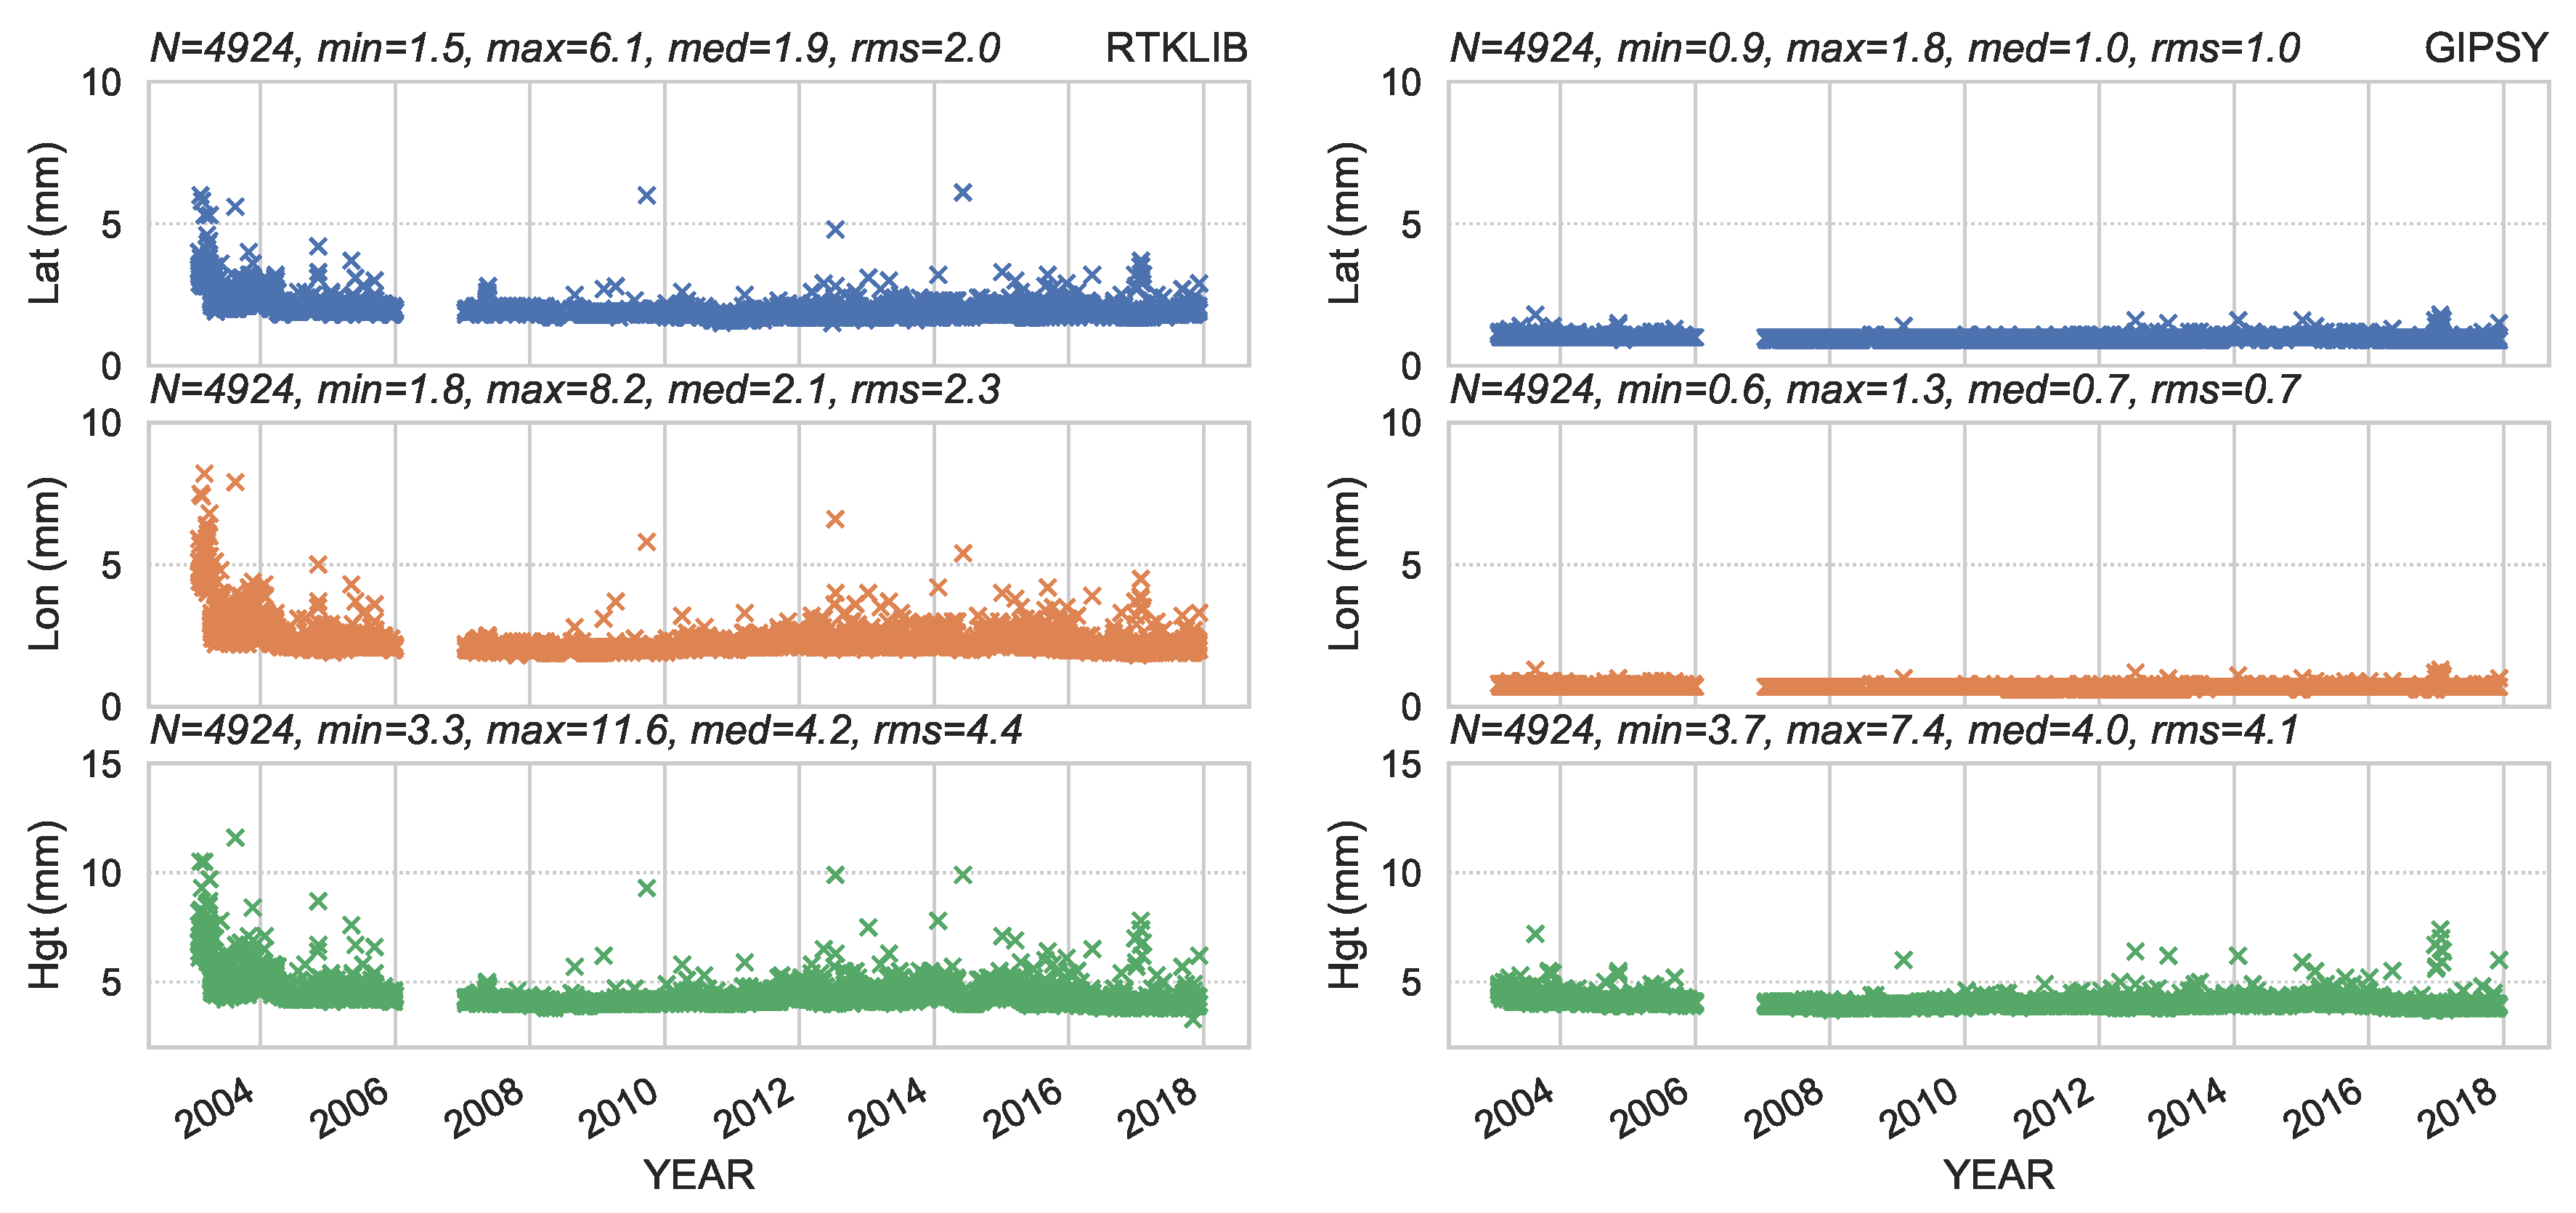
Figure 8 depicts the standard deviation of the estimated position as given by the processing engine. The median standard deviation along all the directions is below 5 mm. In the horizontal direction, the median precision is around 2 mm for RTKLIB and less than 1 mm for the GIPSY solution, respectively. In the vertical direction, both solutions exhibit about 4 mm median standard deviation. The GIPSY solution appears a little more robust for the entire interval period, whereas the RTKLIB solution exhibits larger standard deviations in the beginning of the time series. A significant improvement is visible in 2004. However, this may not be attributed to the processing engine but perhaps to the data quality or the difference in the precise products used by the two solutions. One may suspect a weaker performance of the products, perhaps in the Antarctic region, before April 2004. After that, the standard deviations appear rather consistent despite episodic mild jumps for a few days. Although these small differences, we can conclude that both time series are robust.
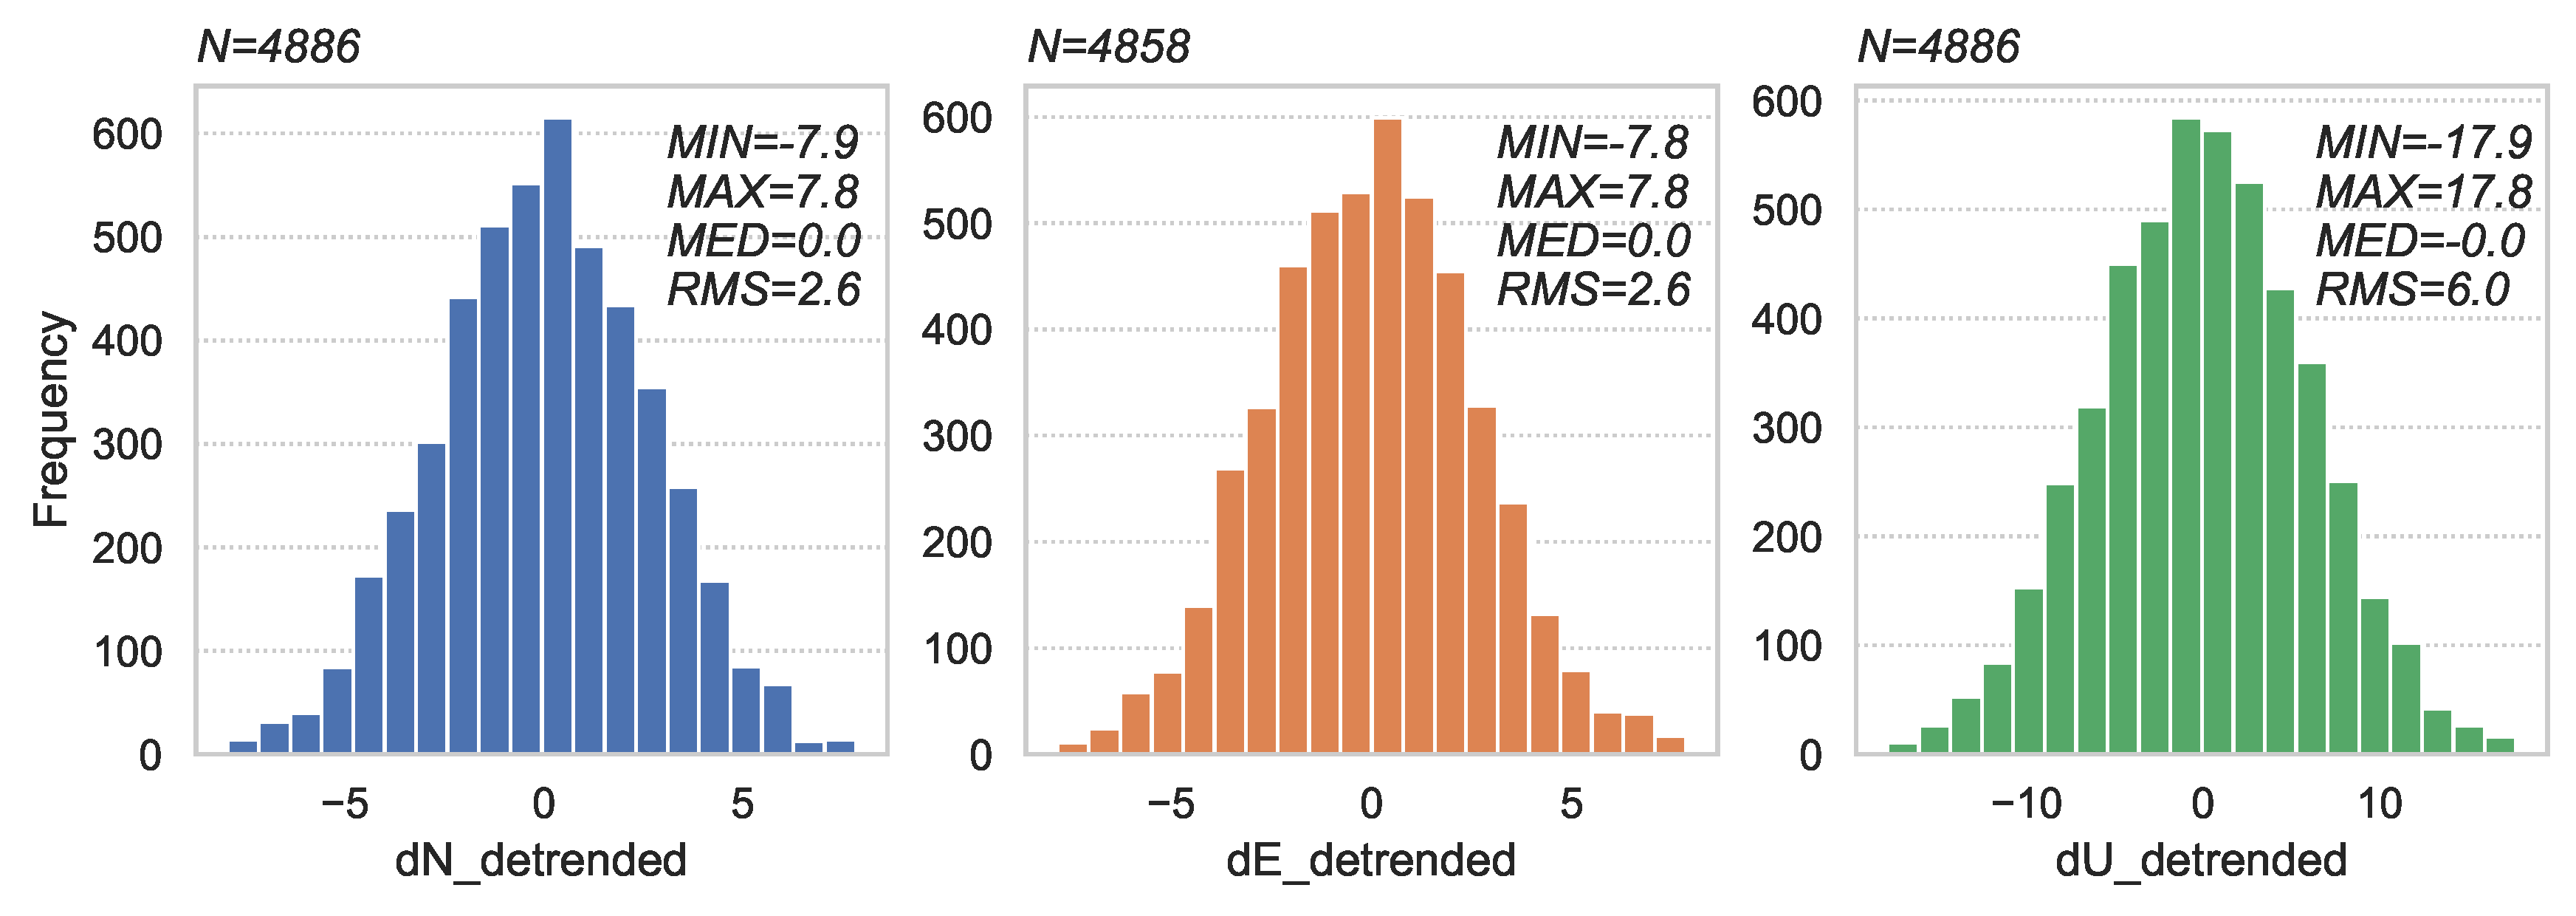
Figure 9 illustrates the accuracy of the RTKLIB solution with respect to the GIPSY solution as error distribution histograms of the local offsets. The accuracy validation requires that both series are expressed in the same frame. Thus, the RTKLIB coordinates were first transformed from ITRF2008 to ITRF2014. Then, the differences in Cartesian coordinates were calculated. These differences were converted to local NEU offsets for a more meaningful interpretation. Next, the outliers and trend were removed using a reiterative linear regression algorithm combined with the IQR (inter quartile range) robust statistic and a threshold of 2.2 for outlier removal. This threshold is roughly equivalent to the 3-sigma and it works well in our experiences. This process was carried out individually for each axis. The detrended offsets show peak-to-peak variations of less than ±8 mm for the North and East directions. The variations on the Up direction are twice as large and account for ±18 mm. Overall, 2.6 mm rms (root mean square) is obtained along the horizontal directions, whereas 6.0 mm rms is computed for the vertical direction. Table 4 summarises the conventional and robust statistics. These statistics confirm an excellent agreement between the two solutions.
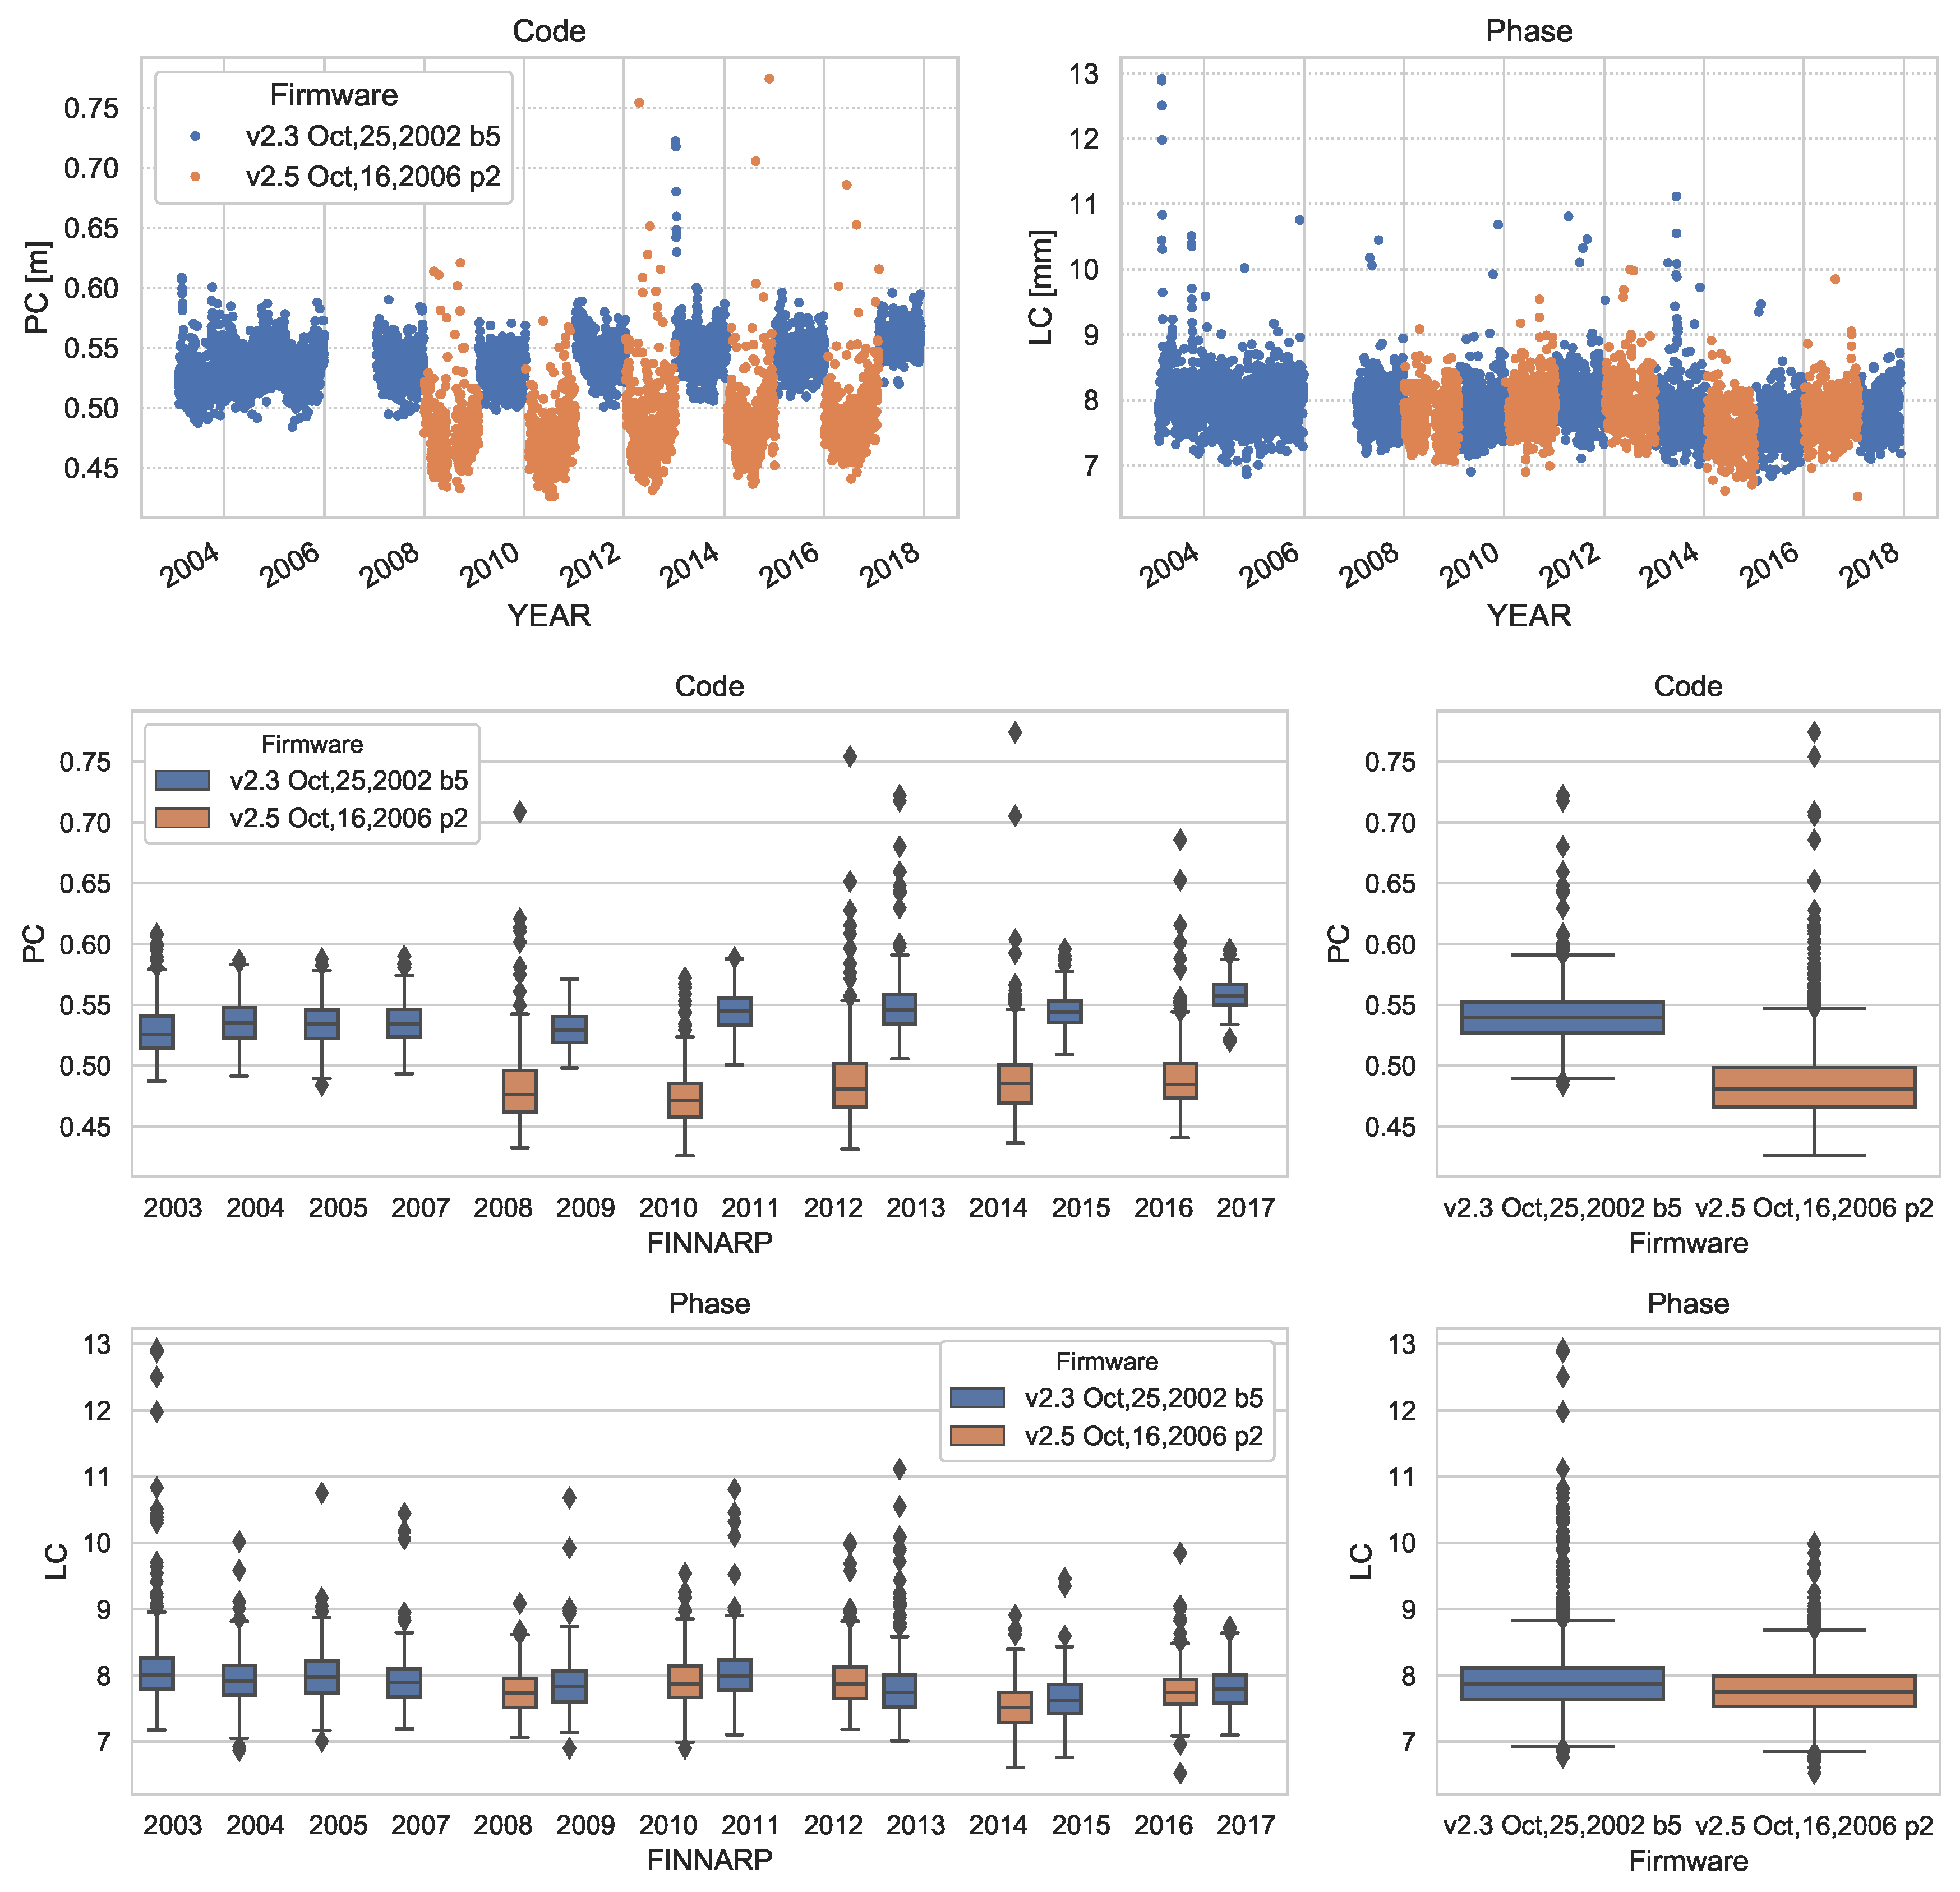
Figure 10 shows the code and phase observation post-fit observation residuals as obtained from GIPSY processing. The code residuals indicate a dual behaviour over time. This comes from the usage of two receivers mentioned in Section 2.1. The receivers have been switched during the yearly FINNARP expedition, usually at year end/start.

3.2. Time Series Analysis

It is generally accepted that the GPS coordinate time series contain some form of temporally correlated noise along the expected white noise [33]. The effect of this noise has direct effect on the uncertainty of the estimated parameters. We used Hector [67] software that enables modelling the temporal correlation of the data and thus providing more realistic uncertainty estimates.
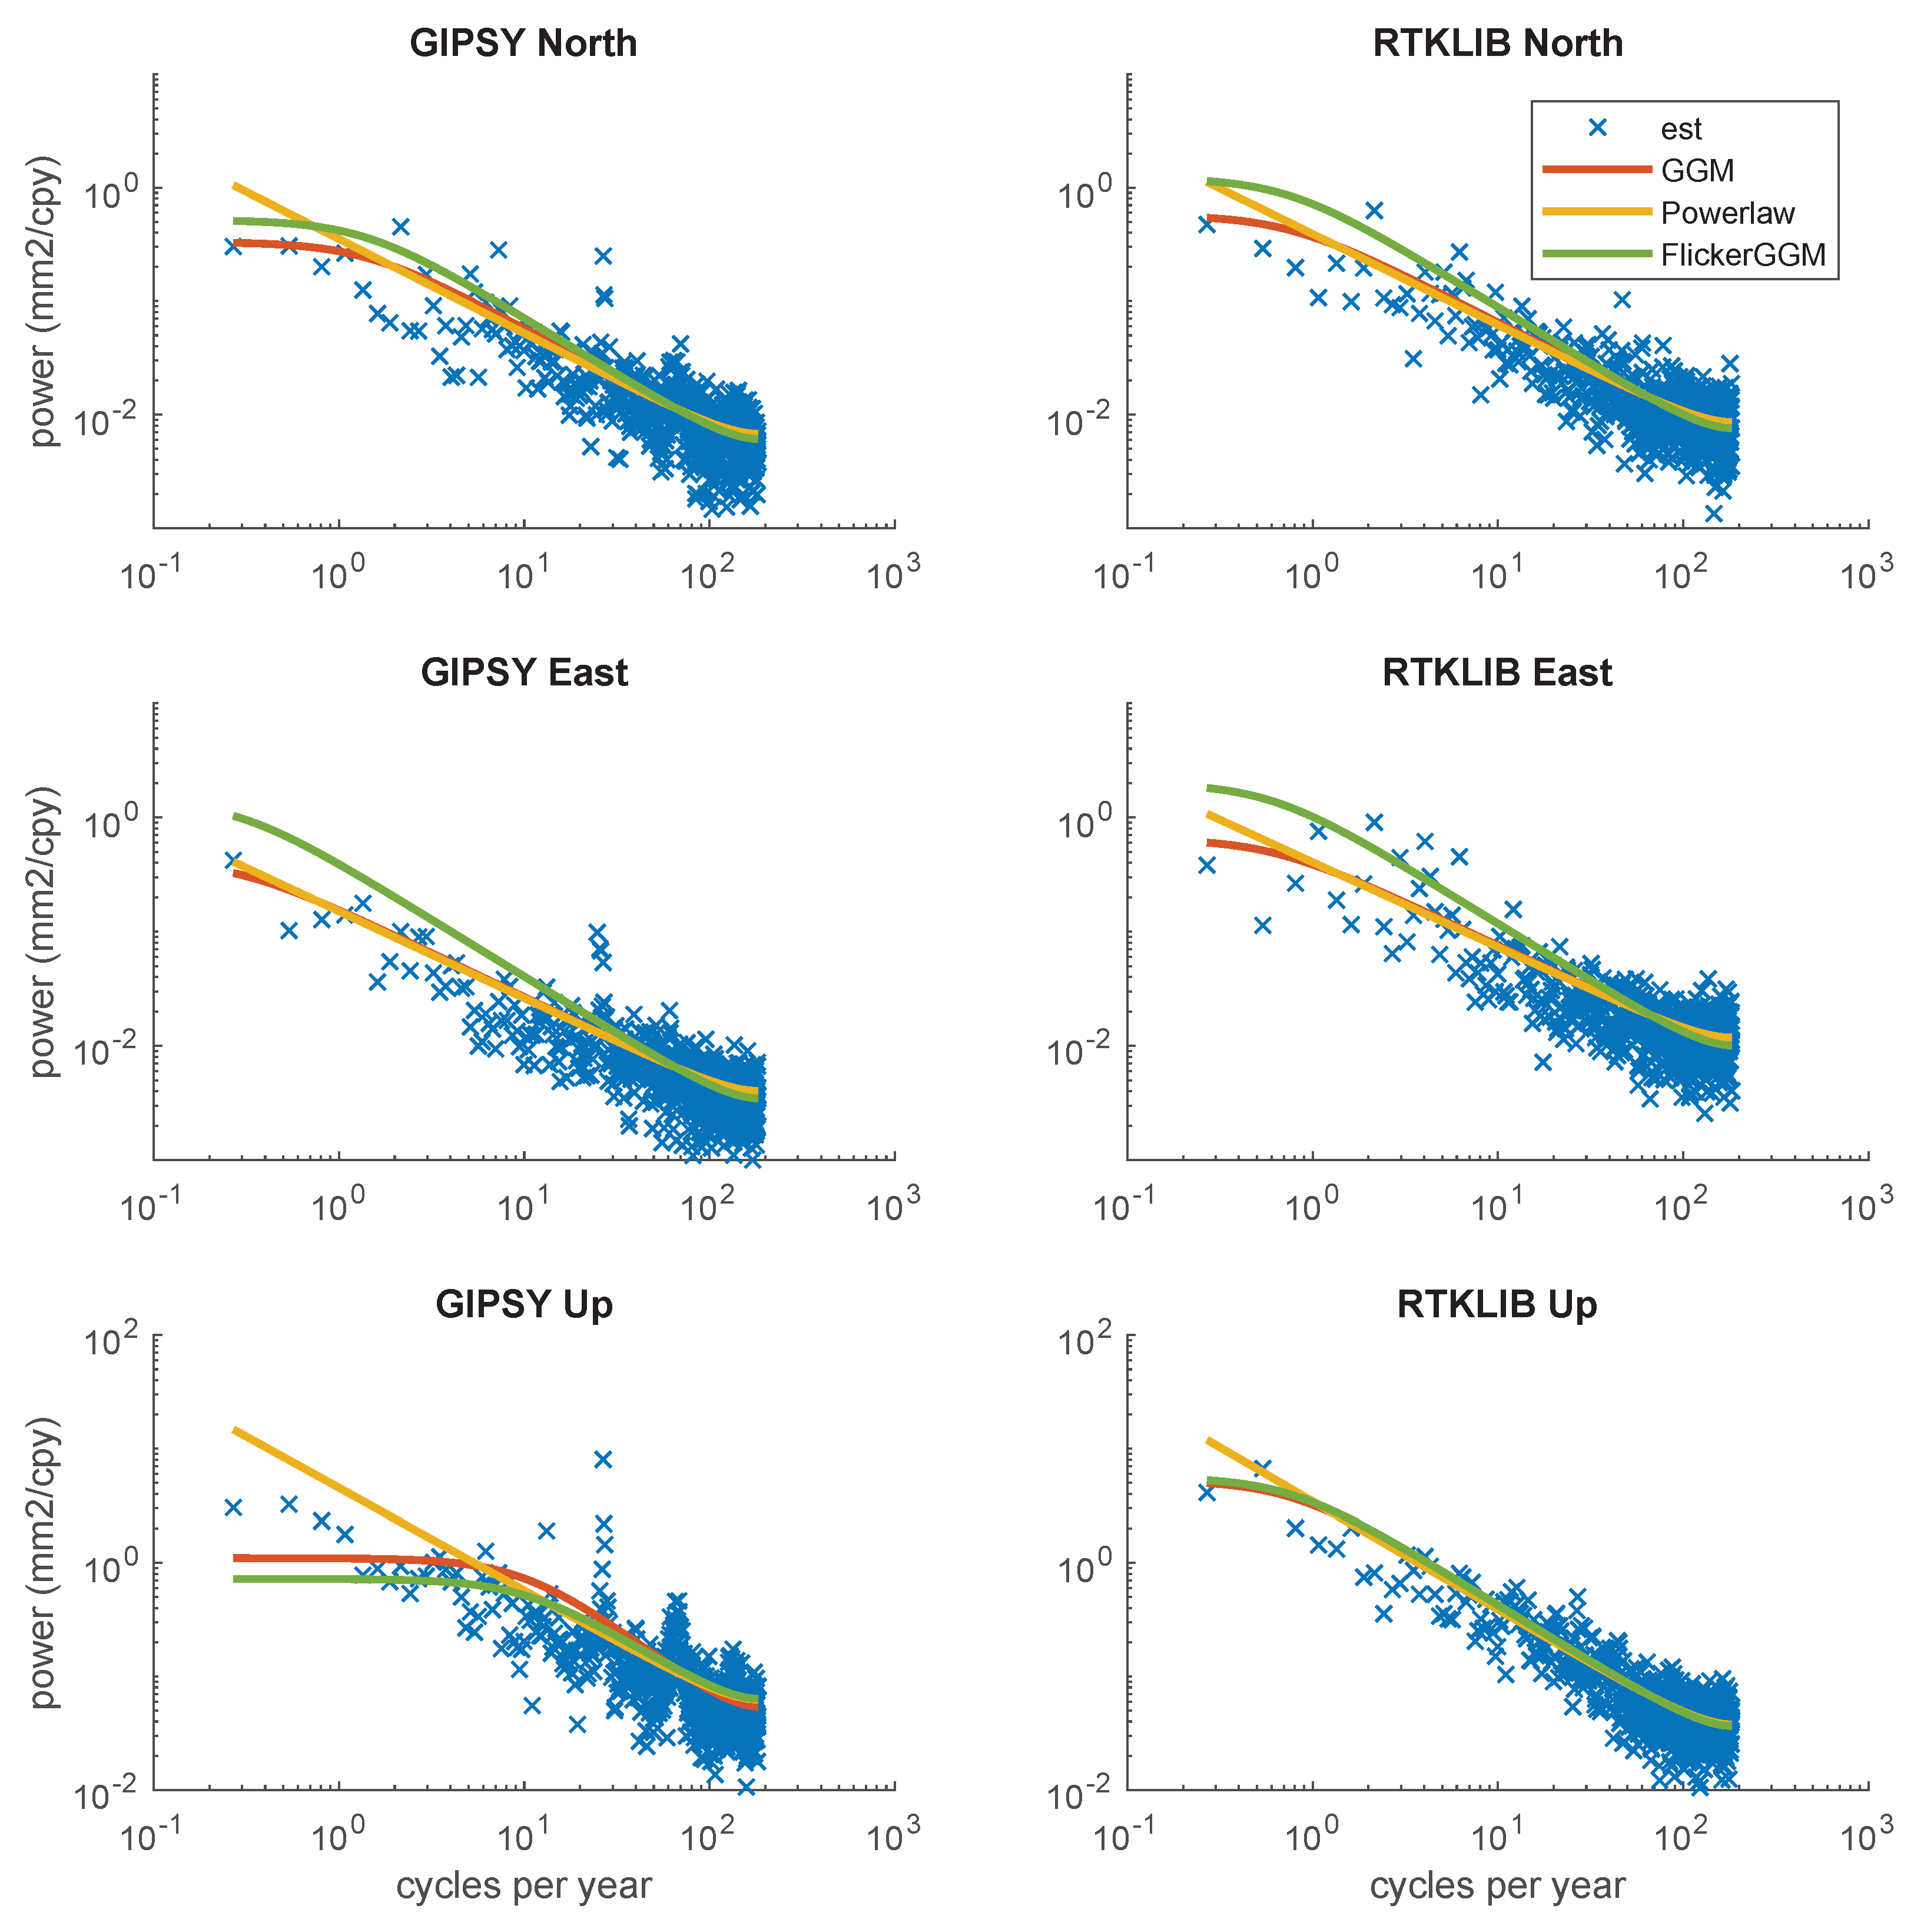
First, daily Cartesian coordinate time series were converted to local NEU coordinates with respect to the mean position, and the time series of each component was analysed separately. We found only one discontinuity in the time series analysis. It was linked to the switch from IGb08 to IGS14 in CODE’s operational solutions, which were used for the RTKLIB solution. Therefore, we solved an offset in the case of RTKLIB time series at 29 January 2017. The frame of the JPL products (used in the GIPSY solution) was the same for the entire period of the time series. Second, we removed the outliers using an IQR factor of 2.2. In addition, the offsets as well as annual and semiannual effects were taken into account in the outlier rejection. About 50 epochs (i.e., 1%) were rejected from the GIPSY solution and 100 epochs (i.e., 2%) from the RTKLIB solution, respectively. Third, we estimated the trends using three different noise models: Generalised Gauss-Markov (GGM), power-law (PL) and flicker noise implementation of the Hector (FlickerGGM). Typically, the white noise is added to the model, but in our time series the fraction for white noise was zero and, therefore, it was omitted from the model. The choice of the final model was based on the analysis of the power spectral analysis (PSD) and the Akaike and Bayesian information criteria (AIC/BIC). The model with lowest AIC or BIC values should fit best the time series.
Figure 11 depicts the PSD plots, whereas Table 5 and Table 6 summarise the AIC/BIC values. The results suggest that the GGM and PL models fit mostly equally best to the estimated spectrum. For the GIPSY Up component, the AIC/BIC analysis supports more GGM model, but the PSD plot shows that none of the model fits very well to the data. There are a few power peaks at roughly 27 cpy and 60–70 cpy corresponding roughly 14 and 5 day cycle, respectively. Those peaks probably cause the misfit of the models to the estimated spectrum.
Aboa coordinate time series contain temporally correlated coloured noise which spectral index is closer to flicker noise. The noise of the horizontal components is characterised by an average spectral index κ = 0.8 and average amplitude of 5 mm/y 0.20 , whereas the noise of the vertical component has similar nature κ = 0.9 but three times larger amplitude, i.e. 16 mm/y 0.22 .
Figure 12 depicts the coordinate residuals after removing the outliers, trend, annual and semiannual periodic signals. The rms error is reduced to less than 2 mm for the horizontal components and below 6 mm for the vertical component.
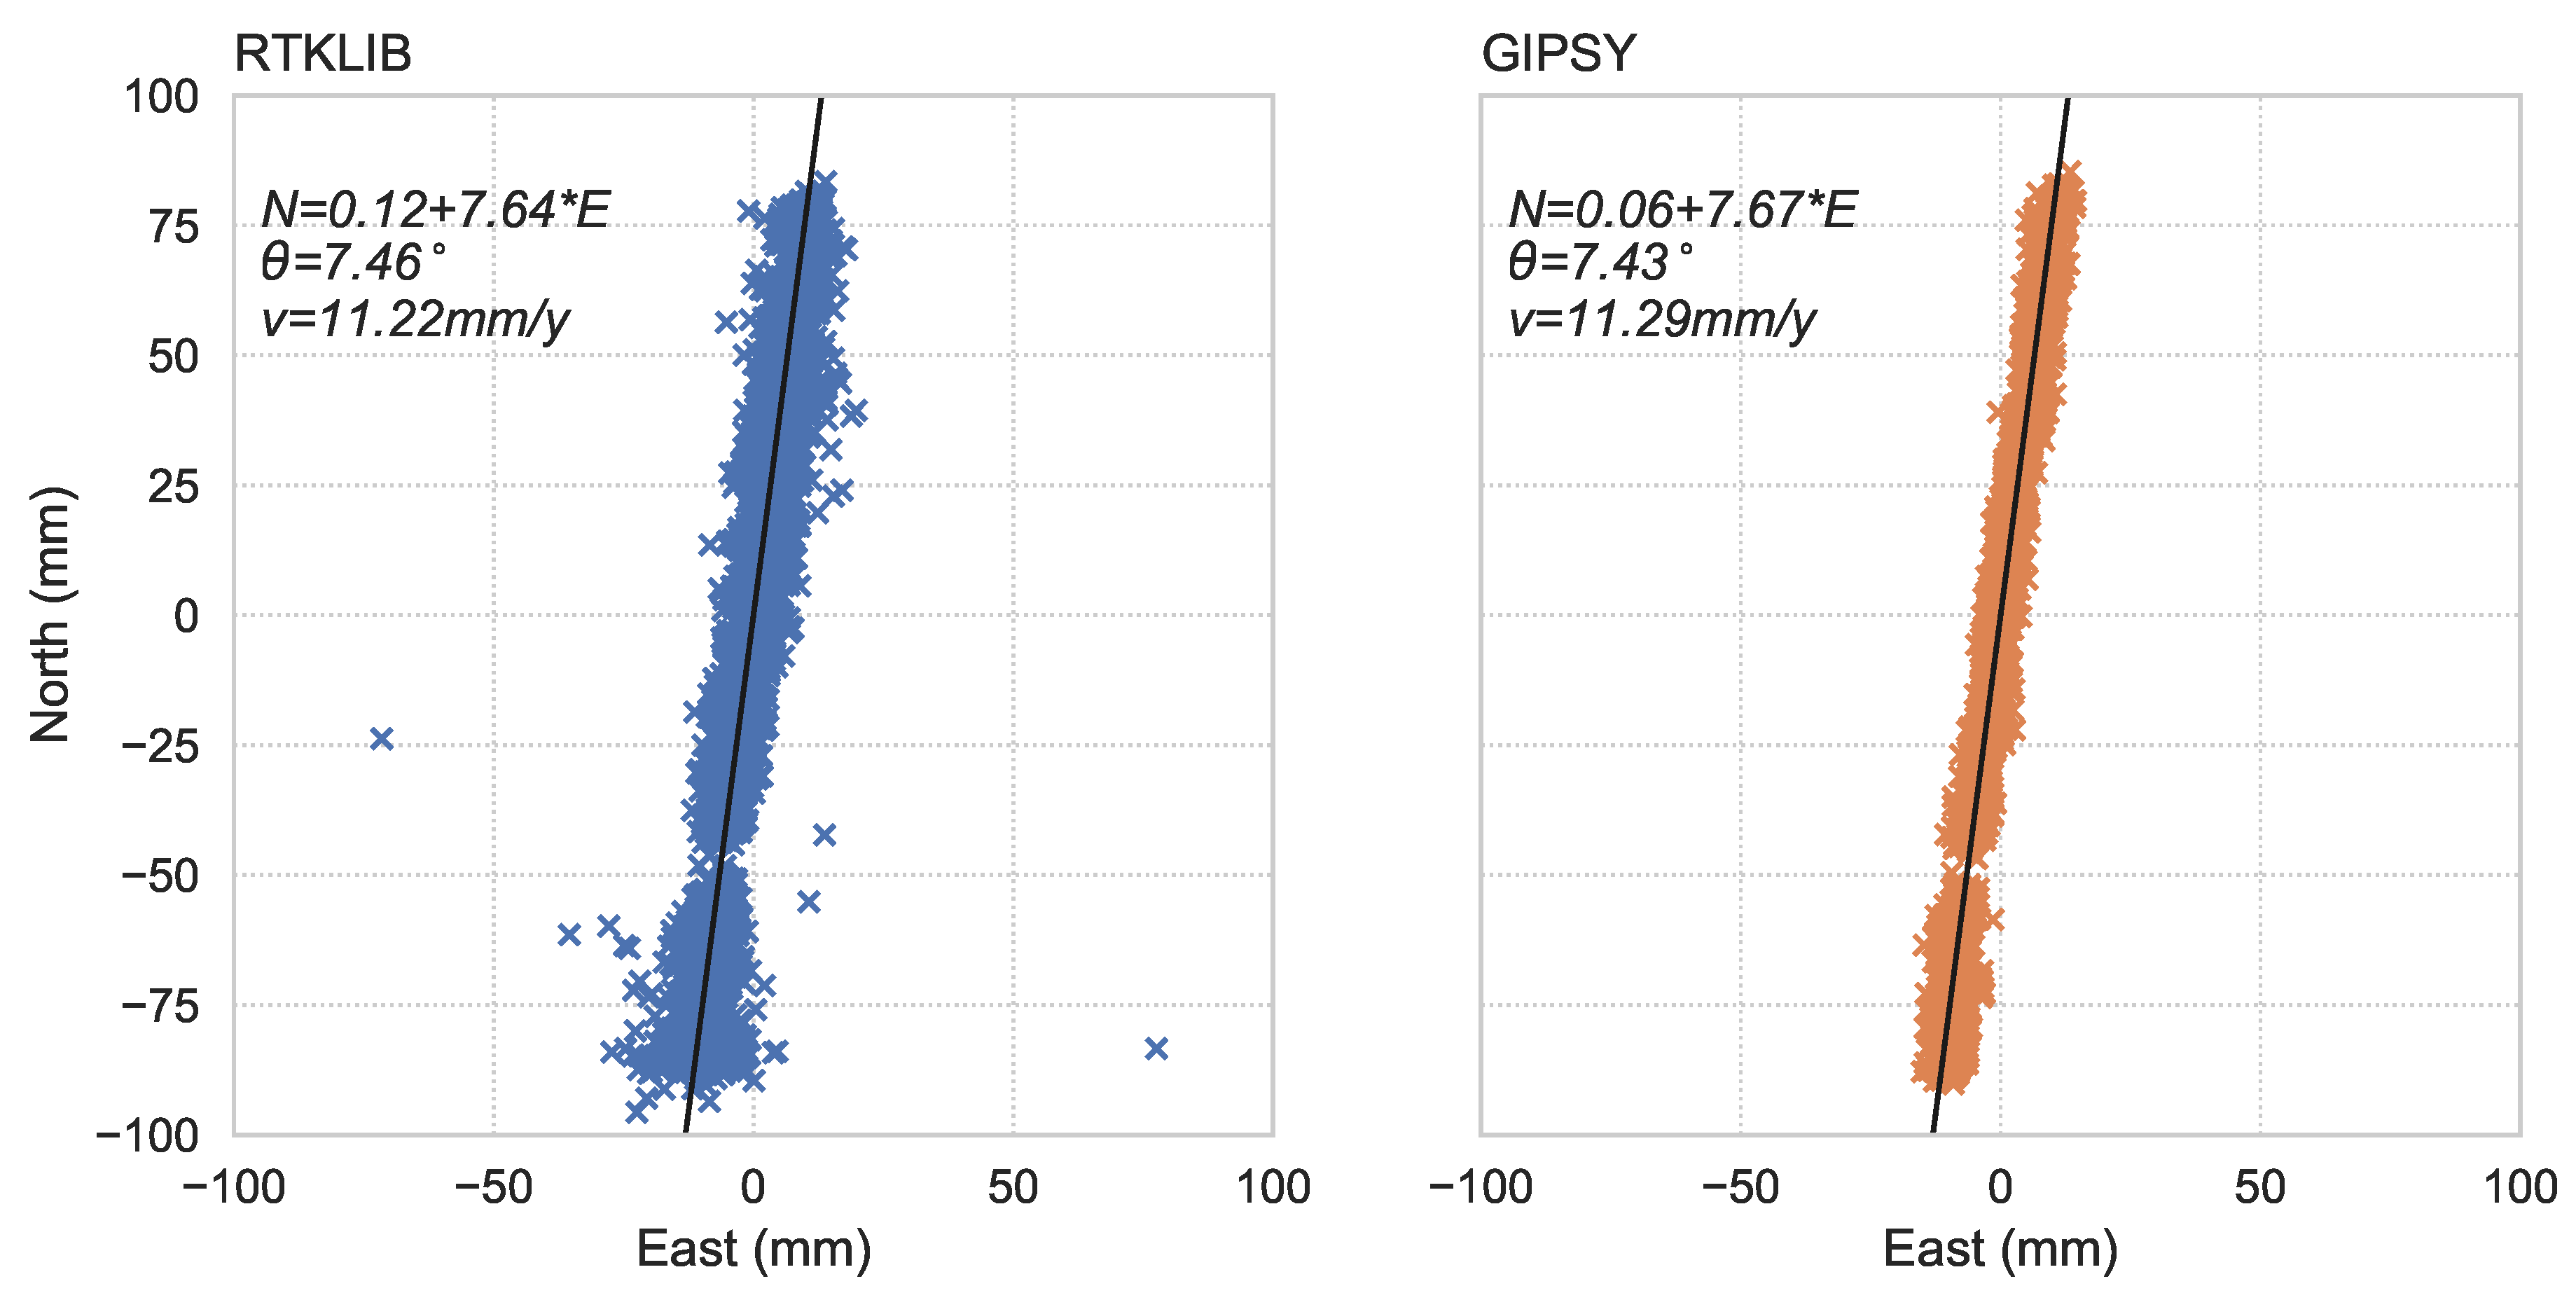
Figure 13 displays the horizontal movement. Since the beginning of operation on 1 February 2003, Aboa station has moved about 175.5 mm in the North direction at a rate of 11.23 ± 0.09 mm/y and about 29.5 mm in the East direction at a rate of 1.46 ± 0.05 mm/y (see Table 5 and Table 6).
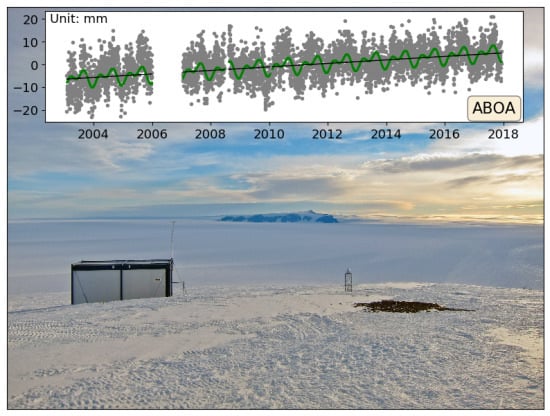
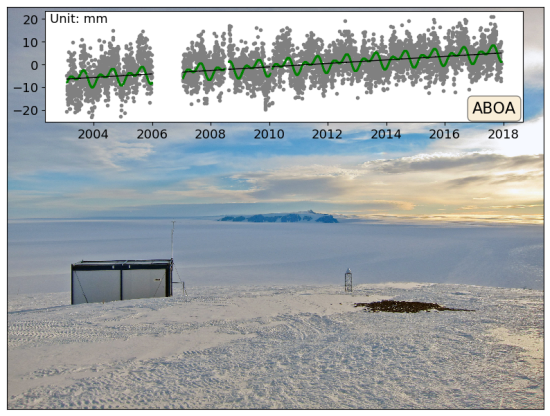
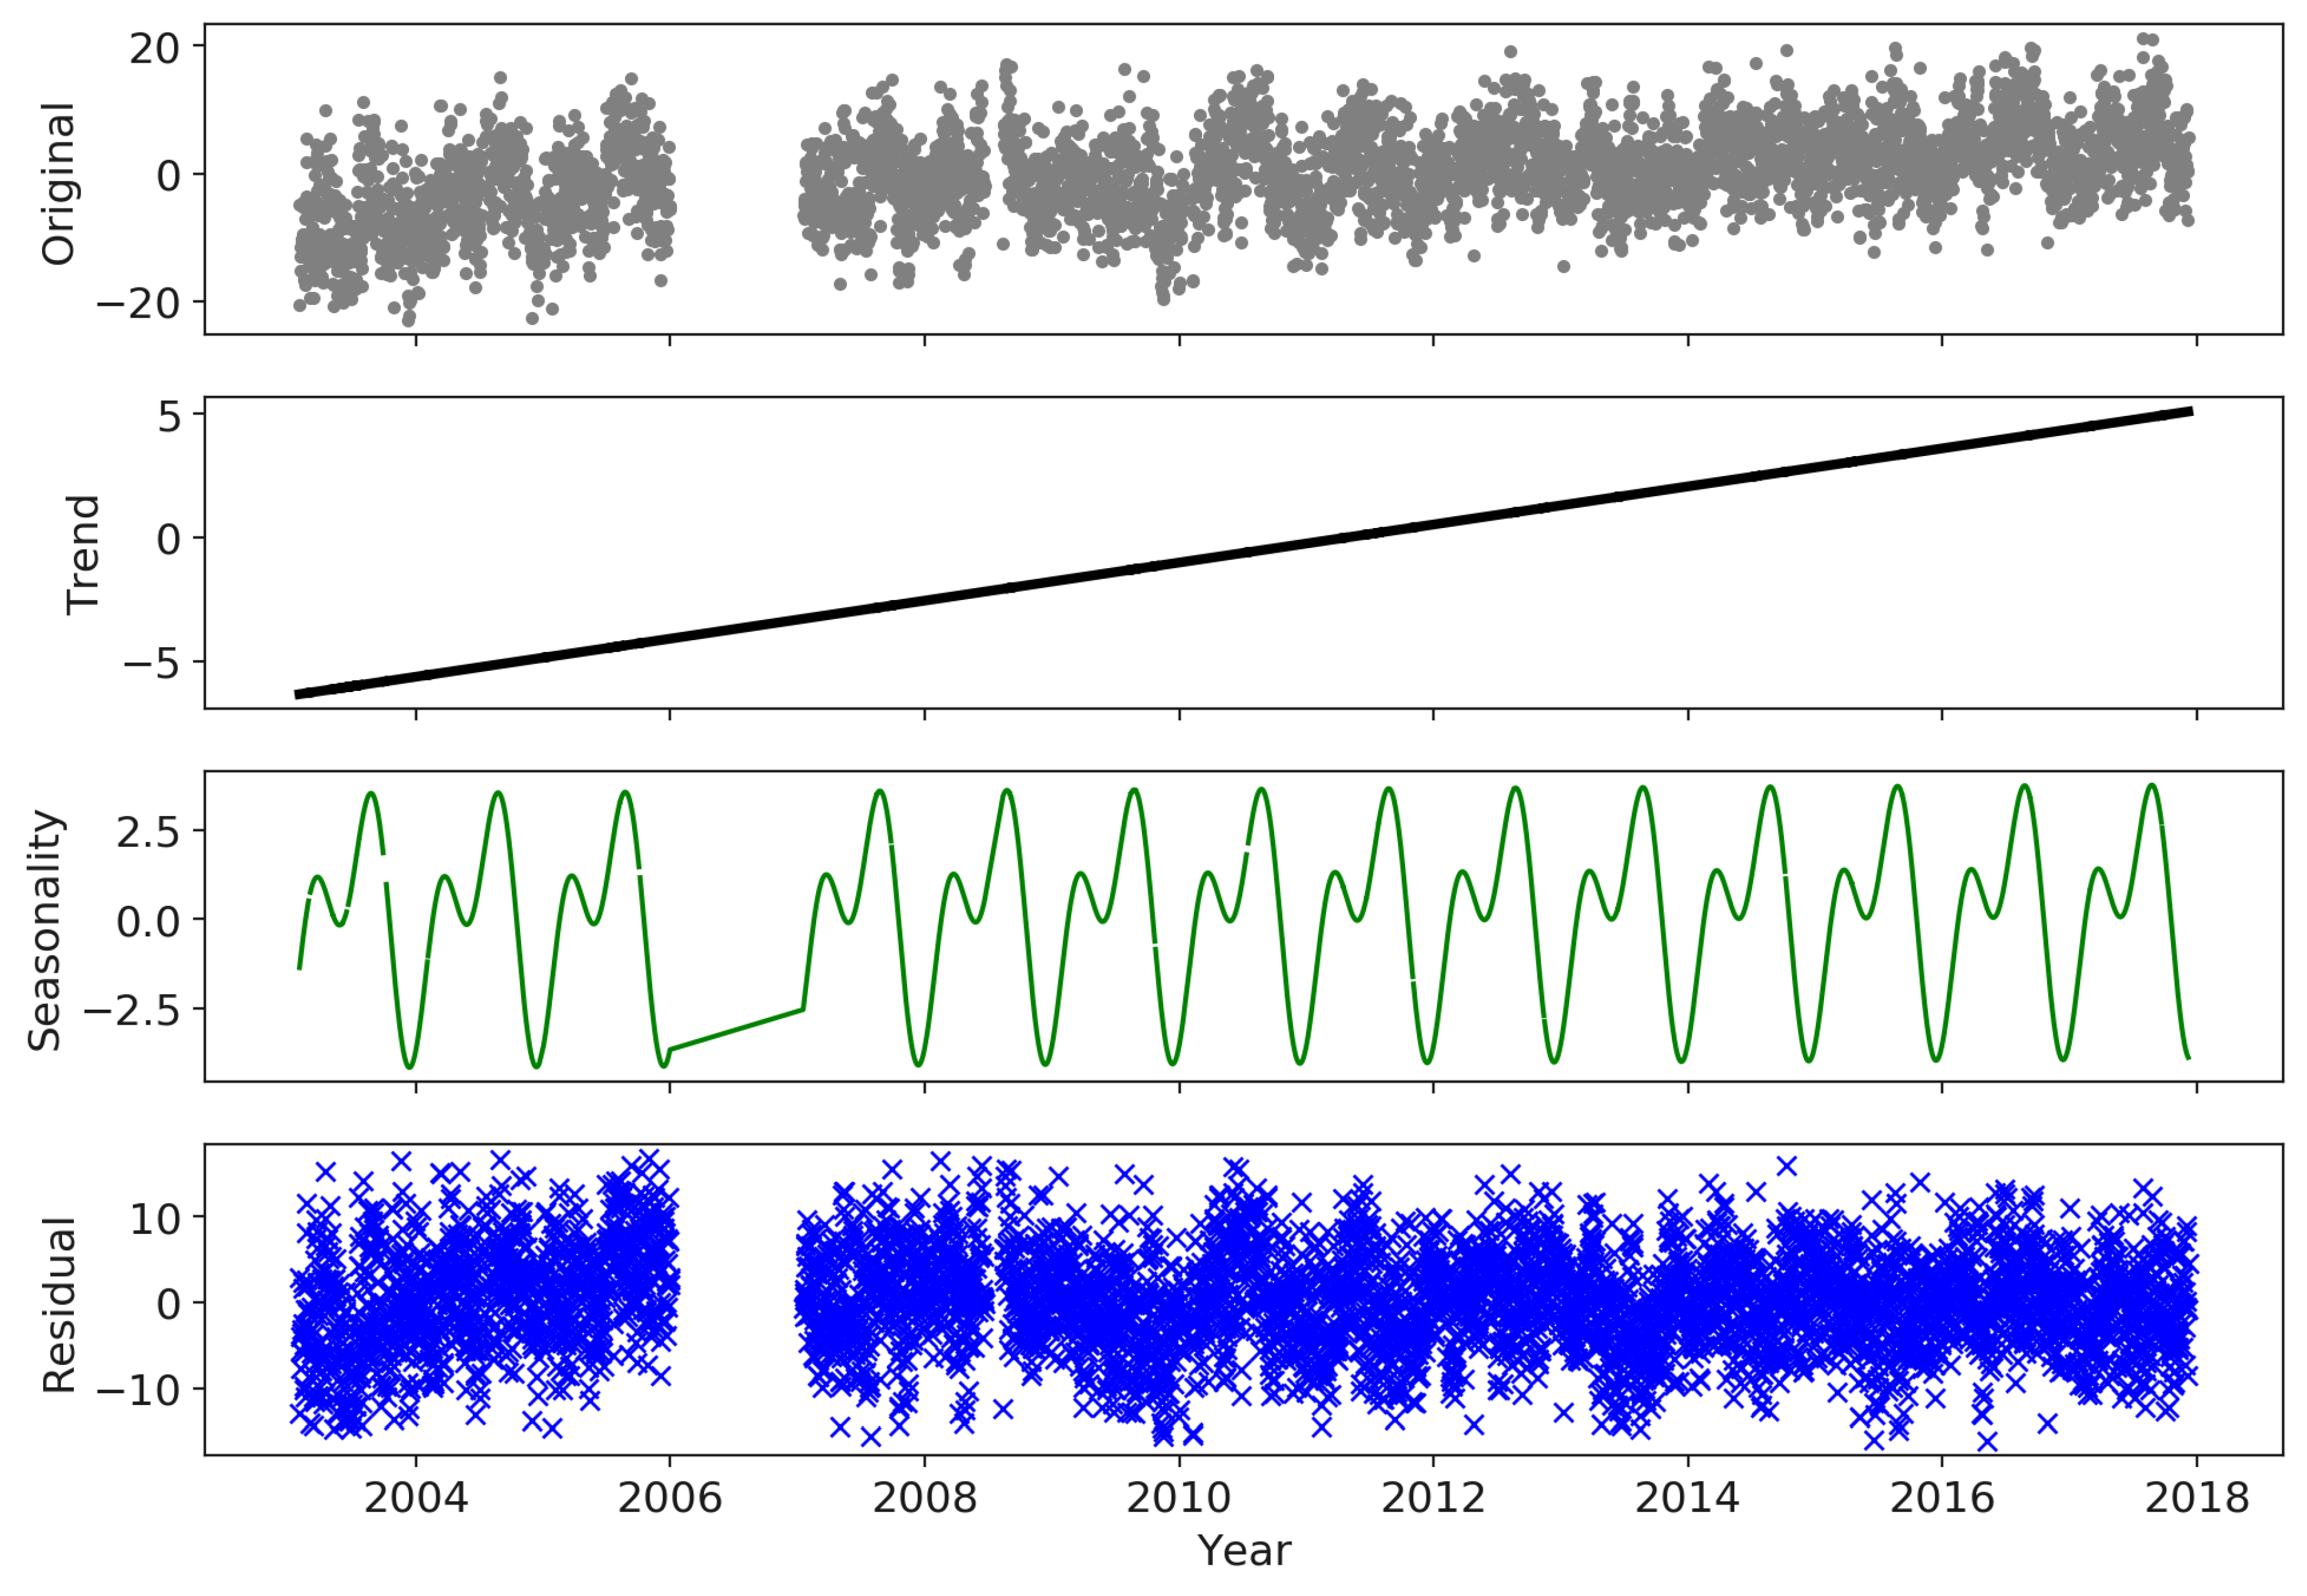
Figure 14 illustrates the movement in the vertical direction and its signal decomposition. The vertical movement consists of a linear trend and seasonal signals. The trend was found to be upwards at a rate of 0.79 ± 0.35 mm/year. The seasonal signals include annual and semiannual components. The amplitude of the annual signal was estimated to be 2.43 ± 0.57 mm, whereas the amplitude of the semiannual signal was estimated to be 2.14 ± 0.42 mm. The maximum amplitude is reached on 23/24 August while the minimum in 13 December. However, these seasonal signals are modelled under the assumption of constant yearly amplitude. Whereas such assumption allows to determine a significant part of the variation, it does not capture the inter-annual variations.

3.3. Environmental Loading

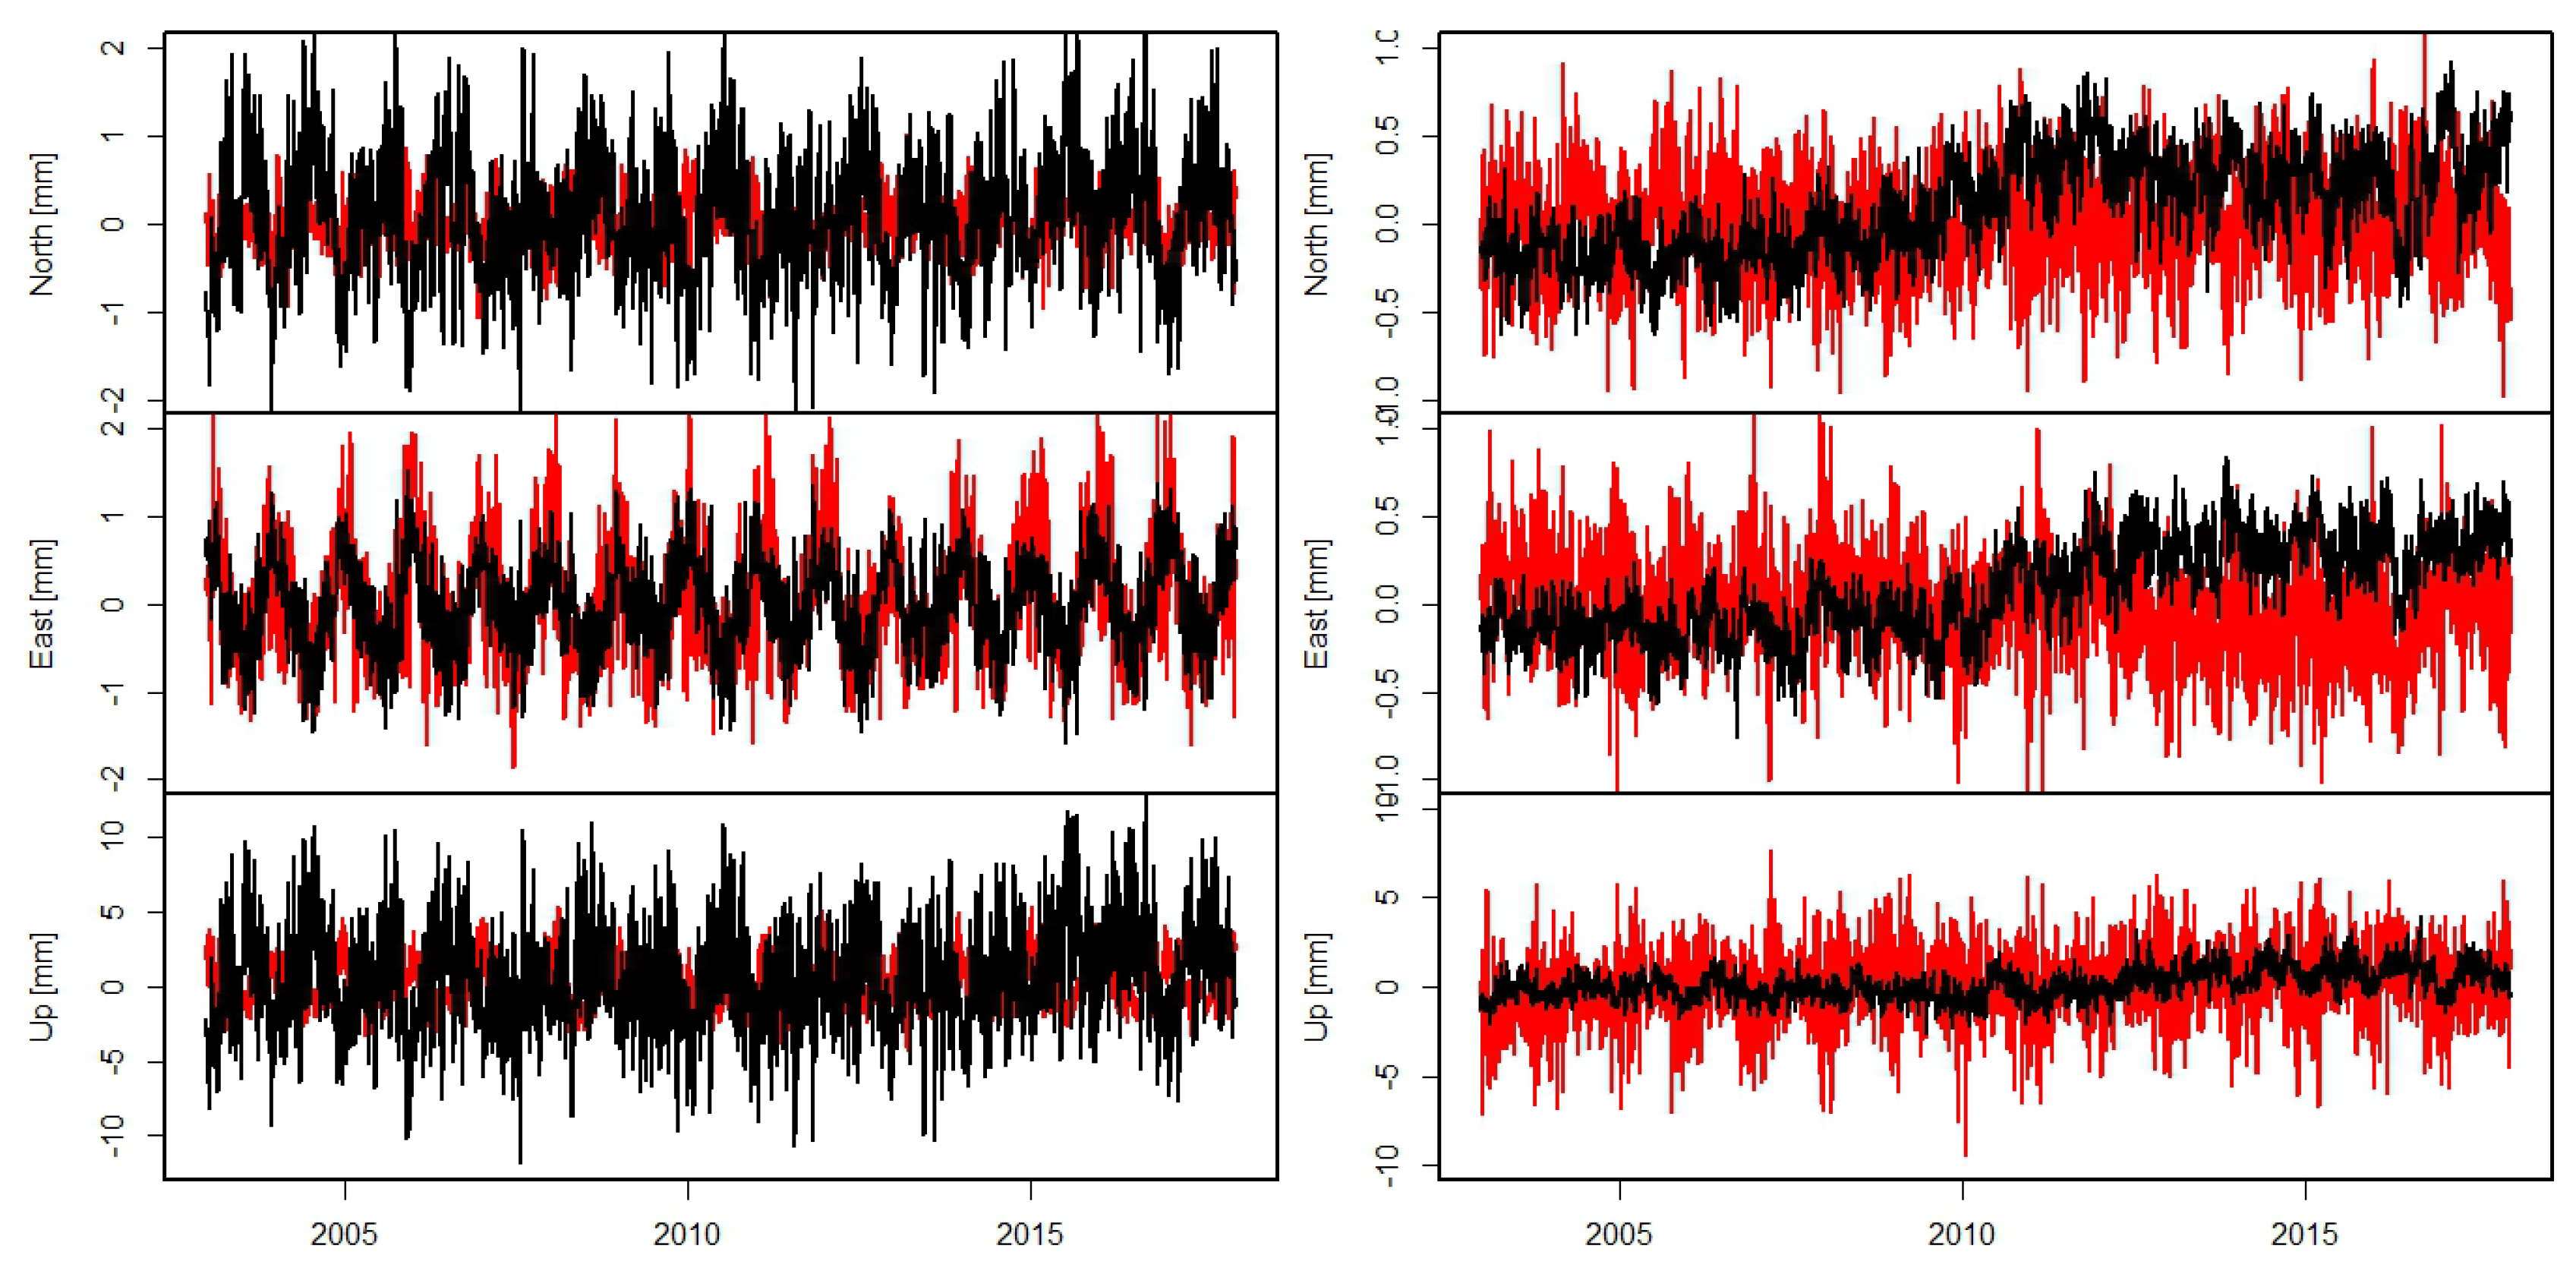
The four time series that were used are depicted in Figure 15. The black curves are computed by the EOST. Their atmospheric loading is computed using the ECMWF operational model with 3 h resolution, averaged to daily values. The non-tidal loading is from the ECCO2 ocean bottom pressure model [72], which provides daily values. The red curves were interpolated from the GFZ loading grid using bilinear interpolation. The atmospheric loading is computed from the same 3 h ECMWF operational model, but for the non-tidal ocean loading the MPIOM model [73] is used with 3 h resolution. The atmospheric loading shows a variability of few millimetres in the horizontal components and a few centimetres in the vertical. The non-tidal ocean shows a smaller variation both in vertical and horizontal.
We studied the effect of the environmental loading on the time series rms and trends. We did the time series analysis before and after removing the atmospheric and non-tidal ocean loading. The effect was unremarkable, as removing the loading affected the trend below the 0.01 mm level and increased the residual rms in all three components. For example, using the EOST products, the trend of the up-component decreased from 0.79 to 0.74 mm/year and the uncertainty for the trend increased from 0.35 to 0.48 mm/year. The residual rms increased from 5.7 to 6.1 mm.

4. Discussion

4.1. What Do Aboa Results Tell to Us?

Two PPP-based solutions were produced, compared and validated. These solutions agree very well despite several differences in the processing engine and precise products in use. The achieved level of agreement (2.6 and 6.0 mm in rms error in horizontal and vertical, respectively) brings confidence in the quality of the PPP-derived coordinate time series and its analysis findings.
Although the receivers are identical, they have different firmware versions. For code residuals, median rms error accounts for 0.54 m in case of firmware version 2.3, whereas 0.48 m accounts for the firmware version 2.5. It is clear that the version 2.5 brings an improvement in the code tracking of a 10%. Moreover, the receiver with firmware version 2.3 exhibits a mild upwards trend in the code residual. This might be a sign of the equipment ageing. Furthermore, the Antarctic cold environment might also effect the tracking performance as the residuals over the Antarctic winter are slightly lower than the residuals over the Antarctic summer. For the phase residuals, there is little difference between the two firmware versions, with median rms around 7.6 mm. Despite several days exhibiting larger errors, more than 95% of the phase residuals are below 9 mm.
The annual and semiannual signals are well-known in GNSS time series and they are also visible in these time series. In addition, the vertical time series of the GIPSY solutions showed periodical signals at roughly 5, 14 and 27 day period at the Up component of the GIPSY solution. The 14 day signals have similar periods as the aliased periods resulted when combining unmodelled short-period tidal signals i.e., diurnal O1 tide and semidiurnal M2 tide [74,75]. The biweekly period might also be related to semi-monthly Mf tide. On the other hand, the time series reveals no clear draconitic signal at 351.2 days as reported in several studies [76,77]. According to the Rayleigh criterion, a time series longer than 25 years would be needed to be able to distinguish between the tropical year (365.25 y) and the GPS draconitic year (351.2 y) periodic signals.
Taking the environmental loading factors into account did not reduce the rms or the seasonality of the time series. Some components were maybe slightly affected, but no major improvements could be spotted. This is in accordance with our previous studies with Fennoscandian stations. We found that taking the environmental loading into account may or may not reduce the standard deviation in the time series [78]. Even when there is a clear visual correlation, the reduction of, for example non-tidal ocean loading, may not necessarily improve the results [79]. The effect on trend is not clear either, as the hydrologic or atmospheric models may not be that stable over decadal time scales. The usage of reprocessed atmospheric models is likely to reduce this uncertainty.
The choice of the noise model affects at a maximum 0.08 mm/y to the estimated trend (GIPSY Up component), but the estimated uncertainties are on average three times larger for the PL model. In addition, the RTKLIB solution includes larger annual variability compared to the GIPSY solution. The semiannual amplitudes are roughly on the same level. Furthermore, the GIPSY and RTKLIB velocity estimates differ 0.1 mm/y horizontally and 0.3–0.4 mm/y vertically. The difference in vertical velocity estimates also supports the choice of PL noise model for more realistic uncertainty estimation. The choice of PL noise is in agreement with other general studies [33,80,81,82].
The residuals may suggest a different trend for the 2003–2006 period. This can be supported by studies on the snow mass changes in Antarctica showing a significant increase in snow mass after the 2006 in the area of Aboa [83]. Increase of snow mass should be visible as decrease of the vertical rate. Basically, we could estimate a multitrend solution. However, in practice the uncertainty would be very large for the first solution (three first years) and non-usable. On the other hand, we validated our results by estimating trends using data only between 2007 and 2018 (not showed here). The estimated rates were very close to the estimate of the full time series. The uncertainties were slightly larger due to the shorter time span as expected.

4.2. How Do Our Results Relate to Other Published Data?

The horizontal motion describes mainly the dynamics of the tectonic plates. There are no published values on the horizontal rates for Aboa. On the other hand, Rülke et al. [84] reported on a campaign-based GPS horizontal rates at Wasa, a Swedish benchmark located 200 m from Aboa, used in several SCAR measuring campaigns. Using the DD approach and a 7.9 year time span, the authors estimated 10.4 ± 1 mm/y in the North direction and 0.5 ± 1 mm/y in the East direction that is within 1 mm/y from our results.
There are several global plate models including Antarctica based on either geological or geodetic data. For a comparison, we generated the plate motion velocities for Aboa as summarised in Table 7.
Our GPS-derived horizontal rates at Aboa agree on 1 mm/y level for the north component, but varies up to 4 mm/y in the east component. The closest agreement is with the GEODVEL model. Also, the agreement with the ITRF2014 model is very good on the level of 0.3 mm/y. These models are based on geodetic data. The geological models (NNR-MORVEL56, MORVEL 2010) agree GEODVEL and our results very well in the North component but they differ 3 mm/year in the East component. This difference is partially explained in Altamimi et al. [85], who found a large global X-rotation rate between ITRF2008 and the NNR-MORVEL56 model equivalent to a systematic bias of 2.5 mm/y at the Earth surface.
The vertical rates from our two solutions are lower than those reported in several studies that have included Aboa in their results. Also, the uncertainty of our result is the lowest when comparing to other published values with reported uncertainties. Thomas et al. [5] reported 1.13 mm/y elastically adjusted GPS vertical rate for Aboa. Elastic response of the crust is caused by contemporaneous ice mass change and is interlaced in the vertical rate with a more long term trend. Their GPS-derived rate was 1.4 ± 0.84 mm/y, while the modelled elastic rate was 0.27 mm/y. In addition, they reported 0.09 mm/y ICESat elastic rate for Aboa. These findings are based on 1959 days of observations between 2003–031 and 2010–011. [42] assessed estimated GIA uplift rates with a set of elastic-corrected GPS vertical velocities at 67 Antarctic sites from 2009 to 2014 inclusive. However, Aboa data was limited to 2013-01-08. They reported an observation rate of 1.54 ± 0.84 mm/y. In addition, the authors reported predicted vertical rates at Aboa from several GIA models. Table 8 summarises these values. Liu et al. [43] used similar GPS processing results as [42] but the start of the time series of beginning of 2010. After applying a spatio-temporal filtering, they found a vertical rate of 2.05 ± 0.50 for Aboa. Rülke et al. [84] did not include Aboa but reported 3.2 mm/y campaign-based GPS vertical rate at Wasa. Using ICESat observation, they report −1.2 mm/y elastic correction for Wasa. They also report the vertical rates predicted by two GIA models: W12a (1.3 mm/y) and IJ05R2 (0.7 mm/y). Their findings were based on 7.9 year time interval. An in-depth geophysical analysis of all the vertical rates (both from GPS analysis and GIA modelling) is beyond of the scope of this study. Such comparison needs extensive analysis and comprehension of the different assumptions behind each of the models above.

5. Conclusions

We estimated horizontal rates of 11.23 ± 0.09 mm/y for the East component and 1.46 ± 0.05 mm/y for the North component for Aboa in East Antarctica. These results reflect the dynamic properties of the Antarctic tectonic plate. They are in an excellent agreement with the motions derived from the GEODVEL and ITRF2014 velocity models. In vertical, the Aboa’s uplift rate is 0.79 ± 0.35 mm/y including all ongoing geophysical signals (e.g., GIA signals and current mass changes). The time series showed that the trends at Aboa have been constant since 2007 despite potential mass changes during the period of this study.
The location of the Aboa station is unique and the GPS results obtained provides valuable data for geophysical studies especially in East Antarctica. The unique location also brings challenges to the data processing as conventional models and methods have deficiencies for Antarctica. We produced rates with the highest accuracy and realistic uncertainties. Our vertical estimates are the most robust ones available for Aboa due to the thorough raw data analysis, the validation of processing and the amount of data. Our results will contributes to the ongoing discussion on better understanding the impact of Antarctica on our planet. For more in-depth geophysical interpretation, we will analyse the data history of absolute gravity measurements carried out at Aboa and include a larger scale GNSS analysis in the future.

Author Contributions

C.-O.A. conceptualised the manuscript idea, designed the methodology, produced the GPS time series; S.L. prepared the RINEX files and conducted the time series analyses; M.N. analysed the environmental loading; H.K. and J.N. were responsible for the maintenance of the receivers and of the data acquisition; M.P. offered supervision; J.N. and J.H. acquired the funding for the project leading to this publication; C.-O.A. wrote the original draft and main text; and all the others commented and reviewed the manuscript.

Funding

This research was funded by Academy of Finland grant number 305867.

Acknowledgments

Finnish Antarctic Research Program (FINNARP) logistics is acknowledged for providing maintenance and operational support for the Aboa GPS station (http://www.antarctica.fi/). Finnish Geospatial Research Institute (FGI) is acknowledged for the financial and logistic contribution to several FINNARP Antarctic expeditions (https://www.maanmittauslaitos.fi/en/research). In this paper, Figure 1 was generated with the Generic Mapping Tools (version 5.3.1, http://gmt.soest.hawaii.edu/) whereas all the other figures were generated with Matplotlib (version 3.0.1, https://matplotlib.org/).

Conflicts of Interest

The authors declare no conflict of interest.

References

  1. Dudeney, J.R.; Peltier, W.; Navarro, F. Antarctic Research in Finland 1998–2005. Technical Report 13, Academy of Finland. 2006. Available online: https://www.aka.fi/fi/akatemia/julkaisut/julkaisusarja/ (accessed on 30 November 2018).
  2. Coordination Committee for Antarctic Research. Finland’s Antarctic Research Strategy 2014. Technical Report 20, Ministry of Education and Culture, Finland. 2014. Available online: http://julkaisut.valtioneuvosto.fi/handle/10024/75249 (accessed on 30 November 2018).
  3. Koivula, H.; Mäkinen, J. Geodetic activities at Finnish Antarctic Research Station ABOA. In Proceedings of the 5th International Antarctic Geodesy Symposium (AGS’03), Lviv, Ukraine, 15–17 September 2003; pp. 1–4. [Google Scholar]
  4. Mäkinen, J.; Amalvict, M.; Shibuya, K.; Fukuda, Y. Absolute gravimetry in Antarctica: Status and prospects. J. Geodyn. 2007, 43, 339–357. [Google Scholar] [CrossRef]
  5. Thomas, I.D.; King, M.A.; Bentley, M.J.; Whitehouse, P.L.; Penna, N.T.; Williams, S.D.P.; Riva, R.E.M.; Lavallee, D.A.; Clarke, P.J.; King, E.C.; et al. Widespread low rates of Antarctic glacial isostatic adjustment revealed by GPS observations. Geophys. Res. Lett. 2011, 38. [Google Scholar] [CrossRef] [Green Version]
  6. Grinsted, A.; Moore, J.; Spikes, V.B.; Sinisalo, A. Dating Antarctic blue ice areas using a novel ice flow model. Geophys. Res. Lett. 2003, 30. [Google Scholar] [CrossRef] [Green Version]
  7. Granberg, H.B.; Cliche, P.; Mattila, O.P.; Kanto, E.; Leppäranta, M. A snow sensor experiment in Dronning Maud Land, Antarctica. J. Glaciol. 2009, 55, 1041–1051. [Google Scholar] [CrossRef]
  8. Järvinen, O.; Mattila, O.P.; Sinisalo, A.; Leppäranta, M. Snow Research in the Dronning Maud Land within the Finnish Antarctic Research Program in 1989–2014. Geophysica 2014, 50, 27–48. [Google Scholar]
  9. Ruotoistenmäki, T.; Lehtimäki, J. Geophysical and Geodetic Studies of Bedrock, Permafrost and Continental Ice in Queen Maud Land, Antarctica. Geophysica 2009, 45, 63–76. [Google Scholar]
  10. Valppu, H.; Strand, K.; Huusko, A. Spectral analysis of physical properties of the Prydz Bay sediments, Antarctica for identifying cycles for the last five million years. Geophysica 2009, 45, 215–223. [Google Scholar]
  11. Strand, K.; Köykkä, J.; Lamminen, J. Late Eocene Glaciofluvial to Glaciomarine transition in the Lambert Graben: Constraints from lithofacies and mineralogy of ODP Site 1166 sediments, Prydz Bay, Antarctica. Geol. Soc. Lond. Spec. Publ. 2013, 381, 183–197. [Google Scholar] [CrossRef]
  12. Luttinen, A.V.; Heinonen, J.S.; Kurhila, M.; Jourdan, F.; Mänttäri, I.; Vuori, S.K.; Huhma, H. Depleted Mantle-sourced CFB Magmatism in the Jurassic Africa–Antarctica Rift: Petrology and 40 Ar/39 Ar and U/Pb Chronology of the Vestfjella Dyke Swarm, Dronning Maud Land, Antarctica. J. Petrol. 2015, 56, 919–952. [Google Scholar] [CrossRef]
  13. Heinonen, J.S.; Luttinen, A.V.; Whitehouse, M.J. Enrichment of 18O in the mantle sources of the Antarctic portion of the Karoo large igneous province. Contrib. Mineral. Petrol. 2018, 173, 21. [Google Scholar] [CrossRef]
  14. Virkkula, A.; Asmi, E.; Teinilä, K.; Frey, A.; Aurela, M.; Timonen, H.; Mäkelä, T.; Samuli, A.; Hillamo, R.; Aalto, P.P.; et al. Review of aerosol research at the Finnish Antarctic research station Aboa and its surroundings in Queen Maud Land, Antarctica. Geophysica 2009, 45, 163–181. [Google Scholar]
  15. Kyrö, E.M.; Kerminen, V.M.; Virkkula, A.; Dal Maso, M.; Parshintsev, J.; Ruíz-Jimenez, J.; Forsström, L.; Manninen, H.E.; Riekkola, M.L.; Heinonen, P.; et al. Antarctic new particle formation from continental biogenic precursors. Atmos. Chem. Phys. 2013, 13, 3527–3546. [Google Scholar] [CrossRef] [Green Version]
  16. Karpechko, A.Y.; Maraun, D.; Eyring, V. Improving Antarctic Total Ozone Projections by a Process-Oriented Multiple Diagnostic Ensemble Regression. J. Atmos. Sci. 2013, 70, 3959–3976. [Google Scholar] [CrossRef] [Green Version]
  17. Sipilä, M.; Sarnela, N.; Jokinen, T.; Henschel, H.; Junninen, H.; Kontkanen, J.; Richters, S.; Kangasluoma, J.; Franchin, A.; Peräkylä, O.; et al. Molecular-scale evidence of aerosol particle formation via sequential addition of HIO3. Nature 2016, 537, 532–534. [Google Scholar] [CrossRef] [PubMed]
  18. Asmi, E.; Neitola, K.; Teinilä, K.; Rodriguez, E.; Virkkula, A.; Backman, J.; Bloss, M.; Jokela, J.; Lihavainen, H.; de Leeuw, G.; et al. Primary sources control the variability of aerosol optical properties in the Antarctic Peninsula. Tellus B Chem. Phys. Meteorol. 2018, 70, 1–17. [Google Scholar] [CrossRef]
  19. Vihma, T.; Launiainen, J.; Pirazzini, R. 20 years of Finnish research on boundary-layer meteorology and air-ice-sea interaction in the Antarctic. Geophysica 2009, 45, 7–26. [Google Scholar]
  20. Hole, L.R.; Bello, A.P.; Roberts, T.J.; Voss, P.B.; Vihma, T. Measurements by controlled meteorological balloons in coastal areas of Antarctica. Antarct. Sci. 2016, 28, 387–394. [Google Scholar] [CrossRef]
  21. Nygård, T.; Tisler, P.; Vihma, T.; Pirazzini, R.; Palo, T.; Kouznetsov, R. Properties and temporal variability of summertime temperature inversions over Dronning Maud Land, Antarctica. Q. J. R. Meteorol. Soc. 2017, 143, 582–595. [Google Scholar] [CrossRef]
  22. Poluianov, S.; Usoskin, I.; Mishev, A.; Moraal, H.; Kruger, H.; Casasanta, G.; Traversi, R.; Udisti, R. Mini Neutron Monitors at Concordia Research Station, Central Antarctica. J. Astron. Space Sci. 2017, 32, 281–287. [Google Scholar] [CrossRef]
  23. Lensu, M.; Kujala, P.; Kulovesi, J.; Lehtiranta, J.; Suominen, M. Measurements of Antarctic sea ice thickness during the ice transit of S.A. Agulhas II. In Proceedings of the 23rd International Conference on Port and Ocean Engineering under Arctic Condition, Trondheim, Norwa, 14–18 June 2015. [Google Scholar]
  24. Suominen, M.; Bekker, A.; Kujala, P.; Soal, K.; Lensu, M. Visual antarctic sea ice condition observations during austral summers 2012–2016. In Proceedings of the 24th International Conference on Port and Ocean Engineering under Arctic Conditions, Busan, Korea, 11–16 June 2017. [Google Scholar]
  25. Bennetts, L.G.; O’Farrell, S.; Uotila, P. Brief communication: Impacts of ocean-wave-induced breakup of Antarctic sea ice via thermodynamics in a stand-alone version of the CICE sea-ice model. Cryosphere 2017, 11, 1035–1040. [Google Scholar] [CrossRef] [Green Version]
  26. Luhtanen, A.M.; Eronen-Rasimus, E.; Oksanen, H.M.; Tison, J.L.; Delille, B.; Dieckmann, G.S.; Rintala, J.M.; Bamford, D.H. The first known virus isolates from Antarctic sea ice have complex infection patterns. FEMS Microbiol. Ecol. 2018, 94, fiy028. [Google Scholar] [CrossRef] [PubMed]
  27. Bock, Y.; Melgar, D. Physical applications of GPS geodesy: A review. Rep. Prog. Phys. 2016, 79, 106801. [Google Scholar] [CrossRef] [PubMed]
  28. Dietrich, R.; Dach, R.; Engelhardt, G.; Ihde, J.; Korth, W.; Kutterer, H.J.; Lindner, K.; Mayer, M.; Menge, F.; Miller, H.; et al. ITRF coordinates and plate velocities from repeated GPS campaigns in Antarctica—An analysis based on different individual solutions. J. Geod. 2001, 74, 756–766. [Google Scholar] [CrossRef]
  29. Dietrich, R.; Rülke, A.; Ihde, J.; Lindner, K.; Miller, H.; Niemeier, W.; Schenke, H.W.; Seeber, G. Plate kinematics and deformation status of the Antarctic Peninsula based on GPS. Glob. Planet. Chang. 2004, 42, 313–321. [Google Scholar] [CrossRef]
  30. Dietrich, R.; Rülke, A. A Precise Reference Frame for Antarctica from SCAR GPS Campaign Data and Some Geophysical Implications. In Geodetic and Geophysical Observations in Antarctica: An Overview in the IPY Perspective; Capra, A., Dietrich, R., Eds.; Springer: Berlin/Heidelberg, Germany, 2008; pp. 1–10. [Google Scholar] [CrossRef]
  31. Capra, A.; Mancini, F.; Negusini, M. GPS as a geodetic tool for geodynamics in northern Victoria Land, Antarctica. Antarct. Sci. 2007, 19, 107–114. [Google Scholar] [CrossRef]
  32. Zanutta, A.; Negusini, M.; Vittuari, L.; Cianfarra, P.; Salvini, F.; Mancini, F.; Sterzai, P.; Dubbini, M.; Galeandro, A.; Capra, A. Monitoring geodynamic activity in the Victoria Land, East Antarctica: Evidence from GNSS measurements. J. Geodyn. 2017, 110, 31–42. [Google Scholar] [CrossRef]
  33. King, M.A.; Altamimi, Z.; Boehm, J.; Bos, M.; Dach, R.; Elosegui, P.; Fund, F.; Hernández-Pajares, M.; Lavallee, D.; Mendes Cerveira, P.J.; et al. Improved Constraints on Models of Glacial Isostatic Adjustment: A Review of the Contribution of Ground-Based Geodetic Observations. Surv. Geophys. 2010, 31, 465–507. [Google Scholar] [CrossRef] [Green Version]
  34. Nield, G.A.; Barletta, V.R.; Bordoni, A.; King, M.A.; Whitehouse, P.L.; Clarke, P.J.; Domack, E.; Scambos, T.A.; Berthier, E. Rapid bedrock uplift in the Antarctic Peninsula explained by viscoelastic response to recent ice unloading. Earth Planet. Sci. Lett. 2014, 397, 32–41. [Google Scholar] [CrossRef] [Green Version]
  35. Martín-Español, A.; Zammit-Mangion, A.; Clarke, P.J.; Flament, T.; Helm, V.; King, M.A.; Luthcke, S.B.; Petrie, E.; Rémy, F.; Schön, N.; et al. Spatial and temporal Antarctic Ice Sheet mass trends, glacio-isostatic adjustment, and surface processes from a joint inversion of satellite altimeter, gravity, and GPS data. J. Geophys. Res. Earth Surf. 2016, 121, 182–200. [Google Scholar] [CrossRef] [Green Version]
  36. Alfonsi, L.; Cilliers, P.J.; Romano, V.; Hunstad, I.; Correia, E.; Linty, N.; Dovis, F.; Terzo, O.; Ruiu, P.; Ward, J.; et al. First Observations of GNSS Ionospheric Scintillations From DemoGRAPE Project. Space Weather 2016, 14, 704–709. [Google Scholar] [CrossRef]
  37. Siegfried, M.R.; Medley, B.; Larson, K.M.; Fricker, H.A.; Tulaczyk, S. Snow accumulation variability on a West Antarctic ice stream observed with GPS reflectometry, 2007–2017. Geophys. Res. Lett. 2017, 44, 7808–7816. [Google Scholar] [CrossRef]
  38. Thomas, I.D.; King, M.A.; Clarke, P.J.; Penna, N.T. Precipitable water vapor estimates from homogeneously reprocessed GPS data: An intertechnique comparison in Antarctica. J. Geophys. Res. Atmos. 2011, 116. [Google Scholar] [CrossRef] [Green Version]
  39. Negusini, M.; Petkov, B.H.; Sarti, P.; Tomasi, C. Ground-Based Water Vapor Retrieval in Antarctica: An Assessment. IEEE Trans. Geosci. Remote Sens. 2016, 54, 2935–2948. [Google Scholar] [CrossRef]
  40. Dow, J.M.; Neilan, R.E.; Rizos, C. The International GNSS Service in a changing landscape of Global Navigation Satellite Systems. J. Geod. 2009, 83, 191–198. [Google Scholar] [CrossRef] [Green Version]
  41. Blewitt, G.; Hammond, W.C.; Kreemer, C. Harnessing the GPS data explosion for interdisciplinary science. Eos 2018, 99. [Google Scholar] [CrossRef]
  42. Martín-Españool, A.; King, M.A.; Zammit-Mangion, A.; Andrews, S.B.; Moore, P.; Bamber, J.L. An assessment of forward and inverse GIA solutions for Antarctica. J. Geophys. Res. Solid Earth 2016, 121, 6947–6965. [Google Scholar] [CrossRef] [Green Version]
  43. Liu, B.; King, M.; Dai, W. Common mode error in Antarctic GPS coordinate time-series on its effect on bedrock-uplift estimates. Geophys. J. Int. 2018, 214, 1652–1664. [Google Scholar] [CrossRef]
  44. Estey, L.H.; Meertens, C.M. TEQC: The Multi-Purpose Toolkit for GPS/GLONASS Data. GPS Solut. 1999, 3, 42–49. [Google Scholar] [CrossRef]
  45. Dong, D.N.; Bock, Y. Global Positioning System Network analysis with phase ambiguity resolution applied to crustal deformation studies in California. J. Geophys. Res. Solid Earth 1989, 94, 3949–3966. [Google Scholar] [CrossRef]
  46. Blewitt, G. Carrier phase ambiguity resolution for the Global Positioning System applied to geodetic baselines up to 2000 km. J. Geophys. Res. Solid Earth 1989, 94, 10187–10203. [Google Scholar] [CrossRef]
  47. Zumberge, J.F.; Heflin, M.B.; Jefferson, D.C.; Watkins, M.M.; Webb, F.H. Precise point positioning for the efficient and robust analysis of GPS data from large networks. J. Geophys. Res. Solid Earth 1997, 102, 5005–5017. [Google Scholar] [CrossRef] [Green Version]
  48. Kouba, J.; Lahaye, F.; Tétreault, P. Precise Point Positioning. In Handbook of Global Navigation Satellite Systems; Teunissen, P.J., Montenbruck, O., Eds.; Springer International Publishing: Cham, Switzerland, 2017; pp. 723–751. [Google Scholar] [CrossRef]
  49. Andrei, C.O.; Chen, R.; Kuusniemi, H.; Hernández-Pajares, M.; Juan, J.M.; Salazar, D. Ionosphere Effect Mitigation for Single-frequency Precise Point Positioning. In Proceedings of the 22st International Technical Meeting of the Satellite Division (ION GNSS-2009), Savannah, Georgia, 22–25 September 2009; pp. 2508–2517. [Google Scholar]
  50. Andrei, C.O.; Salazar, D.; Chen, R. Performance analysis of the Precise Point Positioning technique at BUCU IGS station. RevCAD J. Geod. Cadastre 2010, 10, 9–20. [Google Scholar]
  51. Altamimi, Z.; Rebischung, P.; Métivier, L.; Collilieux, X. ITRF2014: A new release of the International Terrestrial Reference Frame modeling nonlinear station motions. J. Geophys. Res. Solid Earth 2016, 121, 6109–6131. [Google Scholar] [CrossRef] [Green Version]
  52. Susnik, A.; Dach, R.; Villiger, A.; Maier, A.; Arnold, D.; Schaer, S.; Jaeggi, A. CODE Reprocessing Product Series. 2016. Available online: http://ftp.aiub.unibe.ch/REPRO_2015/CODE/ (accessed on 30 November 2018). [CrossRef]
  53. Dach, R.; Schaer, S.; Arnold, D.; Prange, L.; Sidorov, D.; Stebler, P.; Villiger, A.; Jaeggi, A. CODE Final Product Series for the IGS. 2018. Available online: http://ftp.aiub.unibe.ch/CODE/ (accessed on 30 November 2018). [CrossRef]
  54. Altamimi, Z.; Collilieux, X.; Métivier, L. ITRF2008: An improved solution of the international terrestrial reference frame. J. Geod. 2011, 85, 457–473. [Google Scholar] [CrossRef]
  55. Rothacher, M.; Schmid, R. ANTEX: The Antenna Exchange Format Version 1.4. 2010. Available online: ftp://igs.org/pub/station/general/antex14.txt (accessed on 30 November 2018).
  56. Saastamoinen, J. Contributions to the theory of atmospheric refraction. Bull. Géod. 1946–1975 1973, 107, 13–34. [Google Scholar] [CrossRef]
  57. Boehm, J.; Niell, A.; Tregoning, P.; Schuh, H. Global Mapping Function (GMF): A new empirical mapping function based on numerical weather model data. Geophys. Res. Lett. 2006, 33. [Google Scholar] [CrossRef] [Green Version]
  58. IERS Conventions (2010). IERS Technical Note No. 36; Paperback; Print Version; Verlag des Bundesamts für Kartographie und Geodäsie: Frankfurt am Main, Germany, 2010; 179p. [Google Scholar]
  59. Lyard, F.; Lefevre, F.; Letellier, T.; Francis, O. Modelling the global ocean tides: modern insights from FES2004. Ocean Dyn. 2006, 56, 394–415. [Google Scholar] [CrossRef]
  60. Wu, J.; Wu, S.; Hajj, G.; Bertinger, W.; Lichten, S. Effects of antenna orientation on GPS carrier phase. Manuscr. Geod. 1993, 18, 91–98. [Google Scholar]
  61. Maybeck, P.S. Mathematics in Science and Engineering. In Stochastic Models, Estimation, and Control; Academic Press: Cambridge, MA, USA, 1979; Volume 141. [Google Scholar]
  62. Seepersad, G.; Bisnath, S. Challenges in Assessing PPP Performance. J. Appl. Geod. 2014, 8, 205–222. [Google Scholar] [CrossRef]
  63. Choy, S.; Bisnath, S.; Rizos, C. Uncovering common misconceptions in GNSS Precise Point Positioning and its future prospect. GPS Solut. 2017, 21, 13–22. [Google Scholar] [CrossRef]
  64. Herring, T. MATLAB Tools for viewing GPS velocities and time series. GPS Solut. 2003, 7, 194–199. [Google Scholar] [CrossRef]
  65. Ostini, L.; Dach, R.; Meindl, M.; Schaer, S.; Hugentobler, U. FODITS: A New Tool of the Bernese GPS Software. In Proceedings of the 2008 European Reference Frame (EUREF), Brussels, Belgium, 18–21 June 2008; Torres, J.A., Hornik, H., Eds.; 2008. [Google Scholar]
  66. Williams, S.D.P. CATS: GPS coordinate time series analysis software. GPS Solut. 2008, 12, 147–153. [Google Scholar] [CrossRef]
  67. Bos, M.S.; Fernandes, R.M.S.; Williams, S.D.P.; Bastos, L. Fast error analysis of continuous GNSS observations with missing data. J. Geod. 2013, 87, 351–360. [Google Scholar] [CrossRef]
  68. Dach, R.; Lutz, S.; Walser, P.; Fridez, P. (Eds.) Bernese GNSS Software Version 5.2. User Manual; Bern Open Publishing, Astronomical Institute, University of Bern: Bern, Switzerland, 2006. [Google Scholar] [CrossRef]
  69. Petrov, L. The International Mass Loading Service. arXiv, 2015; arXiv:physics.geo-ph/1503.00191. [Google Scholar]
  70. Gegout, P.; Boy, J.P.; Hinderer, J.; Ferhat, G. Modeling and Observation of Loading Contribution to Time-Variable GPS Sites Positions. In Gravity, Geoid and Earth Observation; Mertikas, S.P., Ed.; Springer: Berlin/Heidelberg, Germany, 2010; pp. 651–659. [Google Scholar] [CrossRef]
  71. Dill, R.; Dobslaw, H. Numerical simulations of global-scale high-resolution hydrological crustal deformations. J. Geophys. Res. Solid Earth 2013, 118, 5008–5017. [Google Scholar] [CrossRef] [Green Version]
  72. Menemenlis, D.; Campin, J.M.; Heimbach, P.; Hill, C.; Lee, T.; Nguyen, A.; Schodlok, M.; Zhang, H. ECCO2: High resolution global ocean and sea ice data synthesis. Mercator Ocean Q. Newslet. 2008, 31, 13–21. [Google Scholar]
  73. Marsland, S.J.; Haak, H.; Jungclaus, J.H.; Latif, M.; Röske, F. The Max-Planck-Institute global ocean/sea ice model with orthogonal curvilinear coordinates. Ocean model. 2003, 5, 91–127. [Google Scholar] [CrossRef] [Green Version]
  74. Penna, N.T.; Stewart, M.P. Aliased tidal signatures in continuous GPS height time series. Geophys. Res. Lett. 2003, 30. [Google Scholar] [CrossRef] [Green Version]
  75. Penna, N.T.; King, M.A.; Stewart, M.P. GPS height time series: Short-period origins of spurious long-period signals. J. Geophys. Res. Solid Earth 2007, 112. [Google Scholar] [CrossRef] [Green Version]
  76. Ray, J.; Altamimi, Z.; Collilieux, X.; van Dam, T. Anomalous harmonics in the spectra of GPS position estimates. GPS Solut. 2008, 12, 55–64. [Google Scholar] [CrossRef]
  77. Amiri-Simkooei, A.R. On the nature of GPS draconitic year periodic pattern in multivariate position time series. J. Geophys. Res. Solid Earth 2013, 118, 2500–2511. [Google Scholar] [CrossRef] [Green Version]
  78. Nordman, M.; Mäkinen, J.; Virtanen, H.; Johansson, J.M.; Bilker-Koivula, M.; Virtanen, J. Crustal loading in vertical GPS time series in Fennoscandia. J. Geodyn. 2009, 48, 144–150. [Google Scholar] [CrossRef] [Green Version]
  79. Nordman, M.; Virtanen, H.; Nyberg, S.; Mäkinen, J. Non-tidal loading by the Baltic Sea: Comparison of modelled deformation with GNSS time series. GeoResJ 2015, 7, 14–21. [Google Scholar] [CrossRef]
  80. Williams, S.D.P.; Bock, Y.; Fang, P.; Jamason, P.; Nikolaidis, R.M.; Prawirodirdjo, L.; Miller, M.; Johnson, D.J. Error analysis of continuous GPS position time series. J. Geophys. Res. Solid Earth 2004, 109. [Google Scholar] [CrossRef] [Green Version]
  81. Langbein, J. Noise in GPS displacement measurements from Southern California and Southern Nevada. J. Geophys. Res. Solid Earth 2008, 113. [Google Scholar] [CrossRef] [Green Version]
  82. Klos, A.; Bos, M.S.; Bogusz, J. Detecting time-varying seasonal signal in GPS position time series with different noise levels. GPS Solut. 2017, 22, 21. [Google Scholar] [CrossRef]
  83. Groh, A.; Horwath, M. The method of tailored sensitivity kernels for GRACE mass change estimates. In Proceedings of the EGU General Assembly Conference Abstracts, Vienna, Austria, 17–22 April 2016; Volume 18. [Google Scholar]
  84. Rülke, A.; Dietrich, R.; Capra, A.; Cisak, J.; Dongchen, E.; Eiken, T.; Fox, A.; Hothem, L.D.; Johnston, G.; Malaimani, E.C.; et al. The Antarctic Regional GPS Network Densification: Status and Results. In IAG 150 Years; Rizos, C., Willis, P., Eds.; Springer International Publishing: Cham, Switzerland, 2016; pp. 133–139. [Google Scholar] [CrossRef]
  85. Altamimi, Z.; Métivier, L.; Collilieux, X. ITRF2008 plate motion model. J. Geophys. Res. Solid Earth 2012, 117. [Google Scholar] [CrossRef] [Green Version]
  86. Kreemer, C.; Blewitt, G.; Klein, E.C. A geodetic plate motion and Global Strain Rate Model. Geochem. Geophys. Geosyst. 2014, 15, 3849–3889. [Google Scholar] [CrossRef] [Green Version]
  87. Argus, D.F.; Gordon, R.G.; DeMets, C. Geologically current motion of 56 plates relative to the no-net-rotation reference frame. Geochem. Geophys. Geosyst. 2011, 12. [Google Scholar] [CrossRef] [Green Version]
  88. Argus, D.F.; Gordon, R.G.; Heflin, M.B.; Ma, C.; Eanes, R.J.; Willis, P.; Peltier, W.R.; Owen, S.E. The angular velocities of the plates and the velocity of Earth’s centre from space geodesy. Geophys. J. Int. 2010, 180, 913–960. [Google Scholar] [CrossRef]
  89. DeMets, C.; Gordon, R.G.; Argus, D.F. Geologically current plate motions. Geophys. J. Int. 2010, 181, 1–80. [Google Scholar] [CrossRef] [Green Version]
Figure 1. Location of the Finnish research station Aboa within the Antarctic continent. The red triangles show the location of the research stations visited by the Finnish researchers during the Antarctic summers. The blue squares denote the IGS GPS stations for which the time series are longer than 15 years [40]. The grey dots show the location of other episodic and/or continuous GPS stations established in Antarctica and reported by the Nevada State Laboratory [41].
Remotesensing 10 01937 g001
Figure 2. Aboa GPS antenna (right) next to the gravity laboratory (left) where the receiver is located (Photo Credit: Jyri Näränen, 2012).
Remotesensing 10 01937 g002
Figure 3. Yearly distribution of the daily observation files logged at Aboa between 1 February 2003 (2003–032) and 8 December 2017 (2017–342).
Remotesensing 10 01937 g003
Figure 4. Convergence time for the PPP forward (FWD) and backward (BWD) solutions at Aboa on 1 January 2017.
Remotesensing 10 01937 g004
Figure 5. Daily PPP combined (CMB) solution at Aboa on 1 January 2017. Forward (FWD) and backward (BWD) solutions were combined using the inverse variance weighting approach. The solutions are expressed in terms of North, East, Up (N,E,U) offsets with respect to the mean position. The time is expressed in the seconds of day (SOD).
Remotesensing 10 01937 g005
Figure 6. Work flow diagram of the present study.
Remotesensing 10 01937 g006
Figure 7. Coordinate time series at Aboa in terms of local displacements in the North, East and Up directions with respect to the mean coordinates of the time series for both solutions: RTKLIB (left) and GIPSY (right) [unit: mm].
Remotesensing 10 01937 g007
Figure 8. Internal precision in terms of standard deviation of the two solutions: RTKLIB (left) and GIPSY (right) [unit: mm].
Remotesensing 10 01937 g008
Figure 9. Error distribution of the RTKLIB solution with respect to the GIPSY solution in terms of local NEU offsets. Outlier and trend removal was carried out before computing the differences [unit: mm].
Remotesensing 10 01937 g009
Figure 10. Daily postfit code and phase observation residuals at Aboa for the 15-year long time series.
Remotesensing 10 01937 g010
Figure 11. Power spectral density plots for both solutions and all components.
Remotesensing 10 01937 g011
Figure 12. North, East, Up residuals at Aboa after removing the trend and seasonal signals for the RTKLIB (left) and GIPSY (right) time series [unit: mm].
Remotesensing 10 01937 g012
Figure 13. Scatter plot and direction of the horizontal vector at Aboa between 1 February 2003 (2003–032) and 8 December 2017 (2017–342).
Remotesensing 10 01937 g013
Figure 14. Signal decomposition for the vertical direction at Aboa between 1 February 2003 (2003–032) and 8 December 2017 (2017–342) [unit: mm].
Remotesensing 10 01937 g014
Figure 15. Environmental loading time series at Aboa between 2003–2017: atmospheric loading (left) and non-tidal ocean loading (right). The red curve is from GFZ loading service and black curve is from EOST. For more details, see the text.
Remotesensing 10 01937 g015
Table 1. Precise GPS observation data processing software packages and services.
ToolTypeExamples
SoftwarescientificBernese, GIPSY-OASIS II, GAMIT/GLOBK/TRACK, NAPEOS, PANDA
packagecommercialTrimble Business Centre, GrafNav, etc.
open-sourceRTKLIB , GPSTk, gLAB
Servicefree on-lineAUSPOS, OPUS, SCOUT, APPS, CSRS-PPP, GAPS, magicPPP, CenterPoint RTX
commercialAtlas (Hemisphere), CORRECT-PPP (NOVATEL), OmniSTAR, RTX (Trimble), StarFire (Fugro), Ultra (Veripos), etc.
Table 2. Methods of correction for various observation errors in our PPP data processing strategy.
SourceErrorMethod of Correction
satelliteorbitCODE a precise orbit products in standard product 3 (SP3) format with sampling rate of 15 min [52,53]
clock offsetCODE precise clock product in extended RINEX clock format (CLK) with sampling rate of 5 s [52,53]
phase center offset and variationsIGS ANTEX b maps [55]
atmosphereIonophereIonosphere-free linear combination (1st order term only). Higher order corrections were not applied.
TroposphereSaastamoinen model [56] for a-priori dry tropospheric delay using standard atmosphere. The wet tropospheric delay together with horizontal gradients were estimated. Global Mapping Function (GMF) [57] to estimate the delays along the line of sight.
receiverphase center offset and variationsIGS ANTEX maps [55]
differential code biasesnot applied as the receiver reported P1 observable
siteSolid Earth tideIERS2010 conventions [58]
displacementsPole tideCODE weekly ERP files [52,53]; IERS2010 conventions [58]
Ocean Loading tideFES2004 model c [59]
othersPhase windupwavelength dependent [60]
Phase ambiguityestimated as float number
Table 3. Environmental loading services.
ServiceReferenceLink
International Mass Loading Service[69]http://massloading.net/
EOST loading service[70]http://loading.u-strasbg.fr/index.php
GFZ service[71]https://isdc.gfz-potsdam.de/esmdata/loading/
Table 4. Conventional and robust statistics to assess the accuracy of RTKLIB solution with respect to GIPSY solution [unit: mm].
ConventionalNorthEastUpRobust StatisticsNorthEastUp
Count488648584886
Min−7.9−7.8−17.9Q1 (25%)−1.8−1.8−4.1
Max7.87.817.8Q3 (75%)1.81.84.1
Spread15.815.735.6IQR3.63.68.2
Avg0.00.00.0MED0.00.00.0
Std2.62.66.0MAD1.81.84.1
Rms2.62.66.0
Table 5. Estimated trend and seasonality parameters for different noise models for the GIPSY solution.
ComponentNoise ModelVelocity (mm/y)Annual (mm)Semiann. (mm)AICBIC
NorthFlickerGGM11.20 ± 0.030.23 ± 0.120.26 ± 0.1217,712.217,757.7
GGM11.20 ± 0.030.19 ± 0.100.24 ± 0.1117,694.517,752.9
Powerlaw11.23 ± 0.090.22 ± 0.120.24 ± 0.1117,704.517,756.4
EastFlickerGGM1.46 ± 0.050.38 ± 0.150.22 ± 0.1015,048.715,094.2
GGM1.46 ± 0.030.36 ± 0.100.18 ± 0.0814,970.115,028.6
Powerlaw1.46 ± 0.050.36 ± 0.100.18 ± 0.0714972.615024.5
UpFlickerGGM0.71 ± 0.042.31 ± 0.232.07 ± 0.2328,733.628,779.0
GGM0.71 ± 0.052.31 ± 0.282.07 ± 0.2828,674.928,733.3
Powerlaw0.79 ± 0.352.43 ± 0.572.14 ± 0.4228,736.128,788.0
Table 6. Estimated trend and seasonality parameters for different noise models for the RTKLIB solution.
ComponentNoise ModelVelocity (mm/y)Annual (mm)Semiann. (mm)AICBIC
NorthFlickerGGM11.10 ± 0.051.44 ± 0.230.37 ± 0.1618,598.618650.4
GGM11.09 ± 0.041.43 ± 0.160.35 ± 0.1218,553.918,618.7
Powerlaw11.14 ± 0.091.44 ± 0.170.33 ± 0.1218,558.418,616.7
EastFlickerGGM1.49 ± 0.060.85 ± 0.260.29 ± 0.1519,952.420,004.2
GGM1.48 ± 0.040.83 ± 0.170.22 ± 0.1119,850.119,914.9
Powerlaw1.50 ± 0.090.82 ± 0.170.22 ± 0.1119,855.019,913.3
UpFlickerGGM0.38 ± 0.113.11 ± 0.491.12 ± 0.3726,283.426,335.2
GGM0.39 ± 0.113.10 ± 0.481.11 ± 0.3626,287.026,351.9
Powerlaw0.45 ± 0.343.11 ± 0.501.13 ± 0.3526,297.326,355.6
Table 7. Tectonic plate motion at Aboa site using various plate motion models in the NNR* frame of the Antarctic plate. The velocity and speed are given in mm/y. Azimuth is measured clockwise from the North and expressed in degrees.
ModelReferenceN Vel. [mm/y]E Vel. [mm/y]Speed [mm/y]Azimuth [deg]
GSRM v2.1[86]12.383.0312.7513.77
ITRF2014 [2016][51]11.491.2211.556.05
ITRF2008[85]10.860.6610.883.46
NNR-MORVEL56[87]11.164.6012.0822.41
GEODVEL 2010[88]11.131.4311.227.30
MORVEL 2010[89]11.164.6112.0822.42
This study 11.231.4611.327.40
* NNR or no-net_rotation frame refers to the reference frame for a given model of plate motion that yields zero for the integral of the vector cross-product v x r over the surface of the Earth.
Table 8. Predicted vertical movement at Aboa from different GIA models [42].
ModelUP Vel. [mm/y]ModelUP Vel. [mm/y]ModelUP Vel. [mm/y]
W121.32A130.65G141.79
IJ05R20.24AGE1b0.19RATES1.89
ICE-6G3.24R091.93

