Climate Data Records from Meteosat First Generation Part I: Simulation of Accurate Top-of-Atmosphere Spectral Radiance over Pseudo-Invariant Calibration Sites for the Retrieval of the In-Flight Visible Spectral Response


Abstract
:
1. Introduction
2. Background
- Pseudo-invariant pixel identification and simulation For each target type, pixels corresponding to the identification criteria described in Section 3 are extracted in the processed MVIRI images. The mean DC value over the selected area is estimated from the so-called RECT2LP MFG native format [14] were the North and South detector values have already been equalized and georectified to the geostationary reference grid [15]. The simulation of the TOA spectral radiances is described in Section 5 and their accuracy evaluation in Section 4.
- SRF retrieval The MVIRI/VIS band SRF and its spectral degradation is estimated from the extracted DC values and simulated spectral radiances [6].
- FCDR generation and evaluation. TOA reflectance with associated uncertainty is the main outcome of the MVIRI/VIS band FCDR [16]. Geometry of illumination and observation and all sources of uncertainties are also included. It constitutes a major improvement with respect to the current MVIRI file format that does not include these ancillary values [17].
3. Identification of Pseudo-Invariant Pixels
3.1. Bright Desert
3.2. Open Ocean
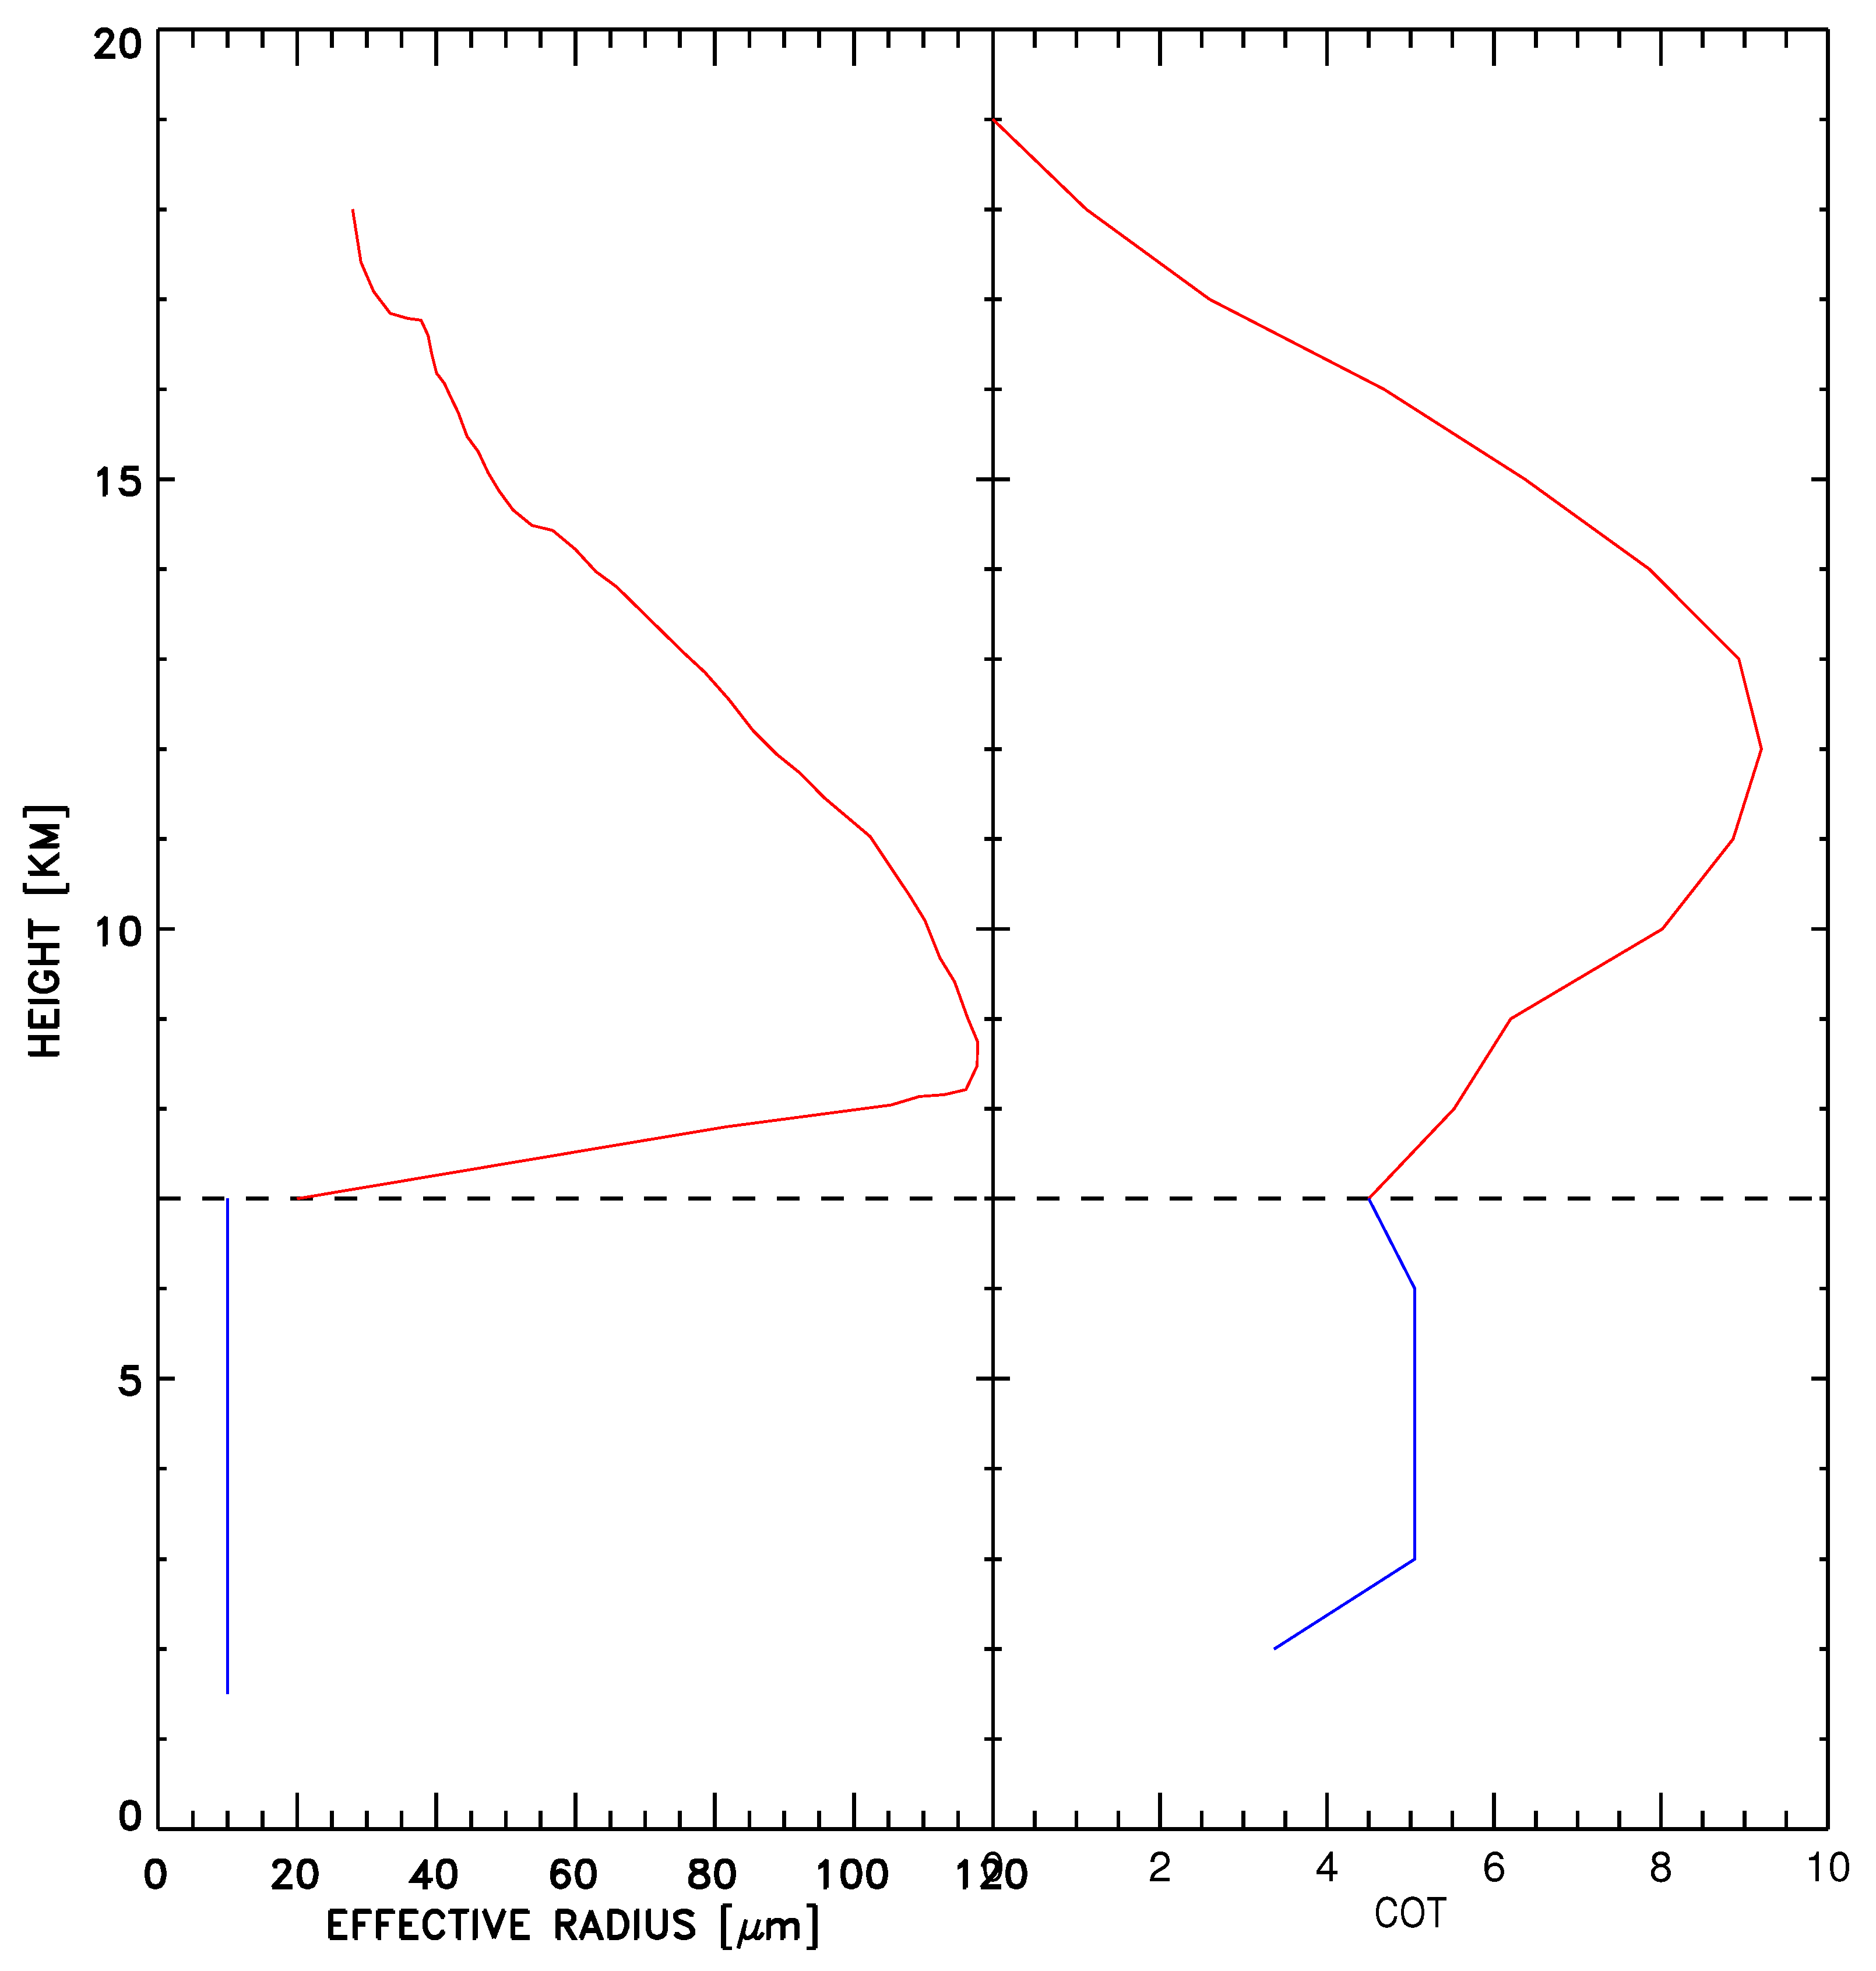
3.3. Deep Convective Cloud
- Viewing and illumination zenith angles should be lower than 30 to minimize DCC reflectance anisotropy effects;
- The scattering angles should be larger than 5 to avoid the backscattering direction [20];
- DCC brightness temperature in the MVIRI/IR band should be smaller than 205 K [21];
- A uniformity test is applied on DC values of the thermal and VIS bands. A pixel is identified as DCC if the spatial uniformity of the 5 × 5-pixel window centered on that pixel fulfils the following conditionswith where is the number of pixels within the selected window, is the mean DC value in that window and is the threshold value set to 0.02.
4. TOA Spectral Radiance Simulation
4.1. Overview
4.2. Bright Desert
4.3. Open Ocean
4.4. Deep Convective Cloud
5. TOA Radiance Simulation Accuracy Evaluation
5.1. TOA BRF Analysis
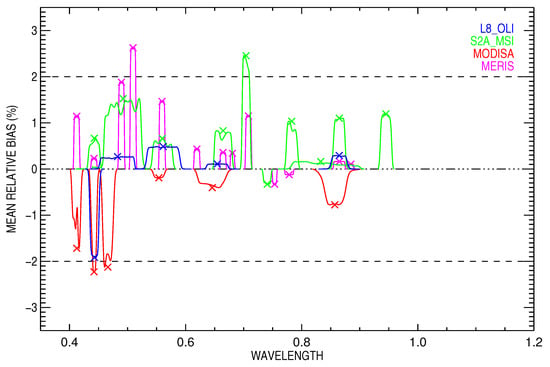
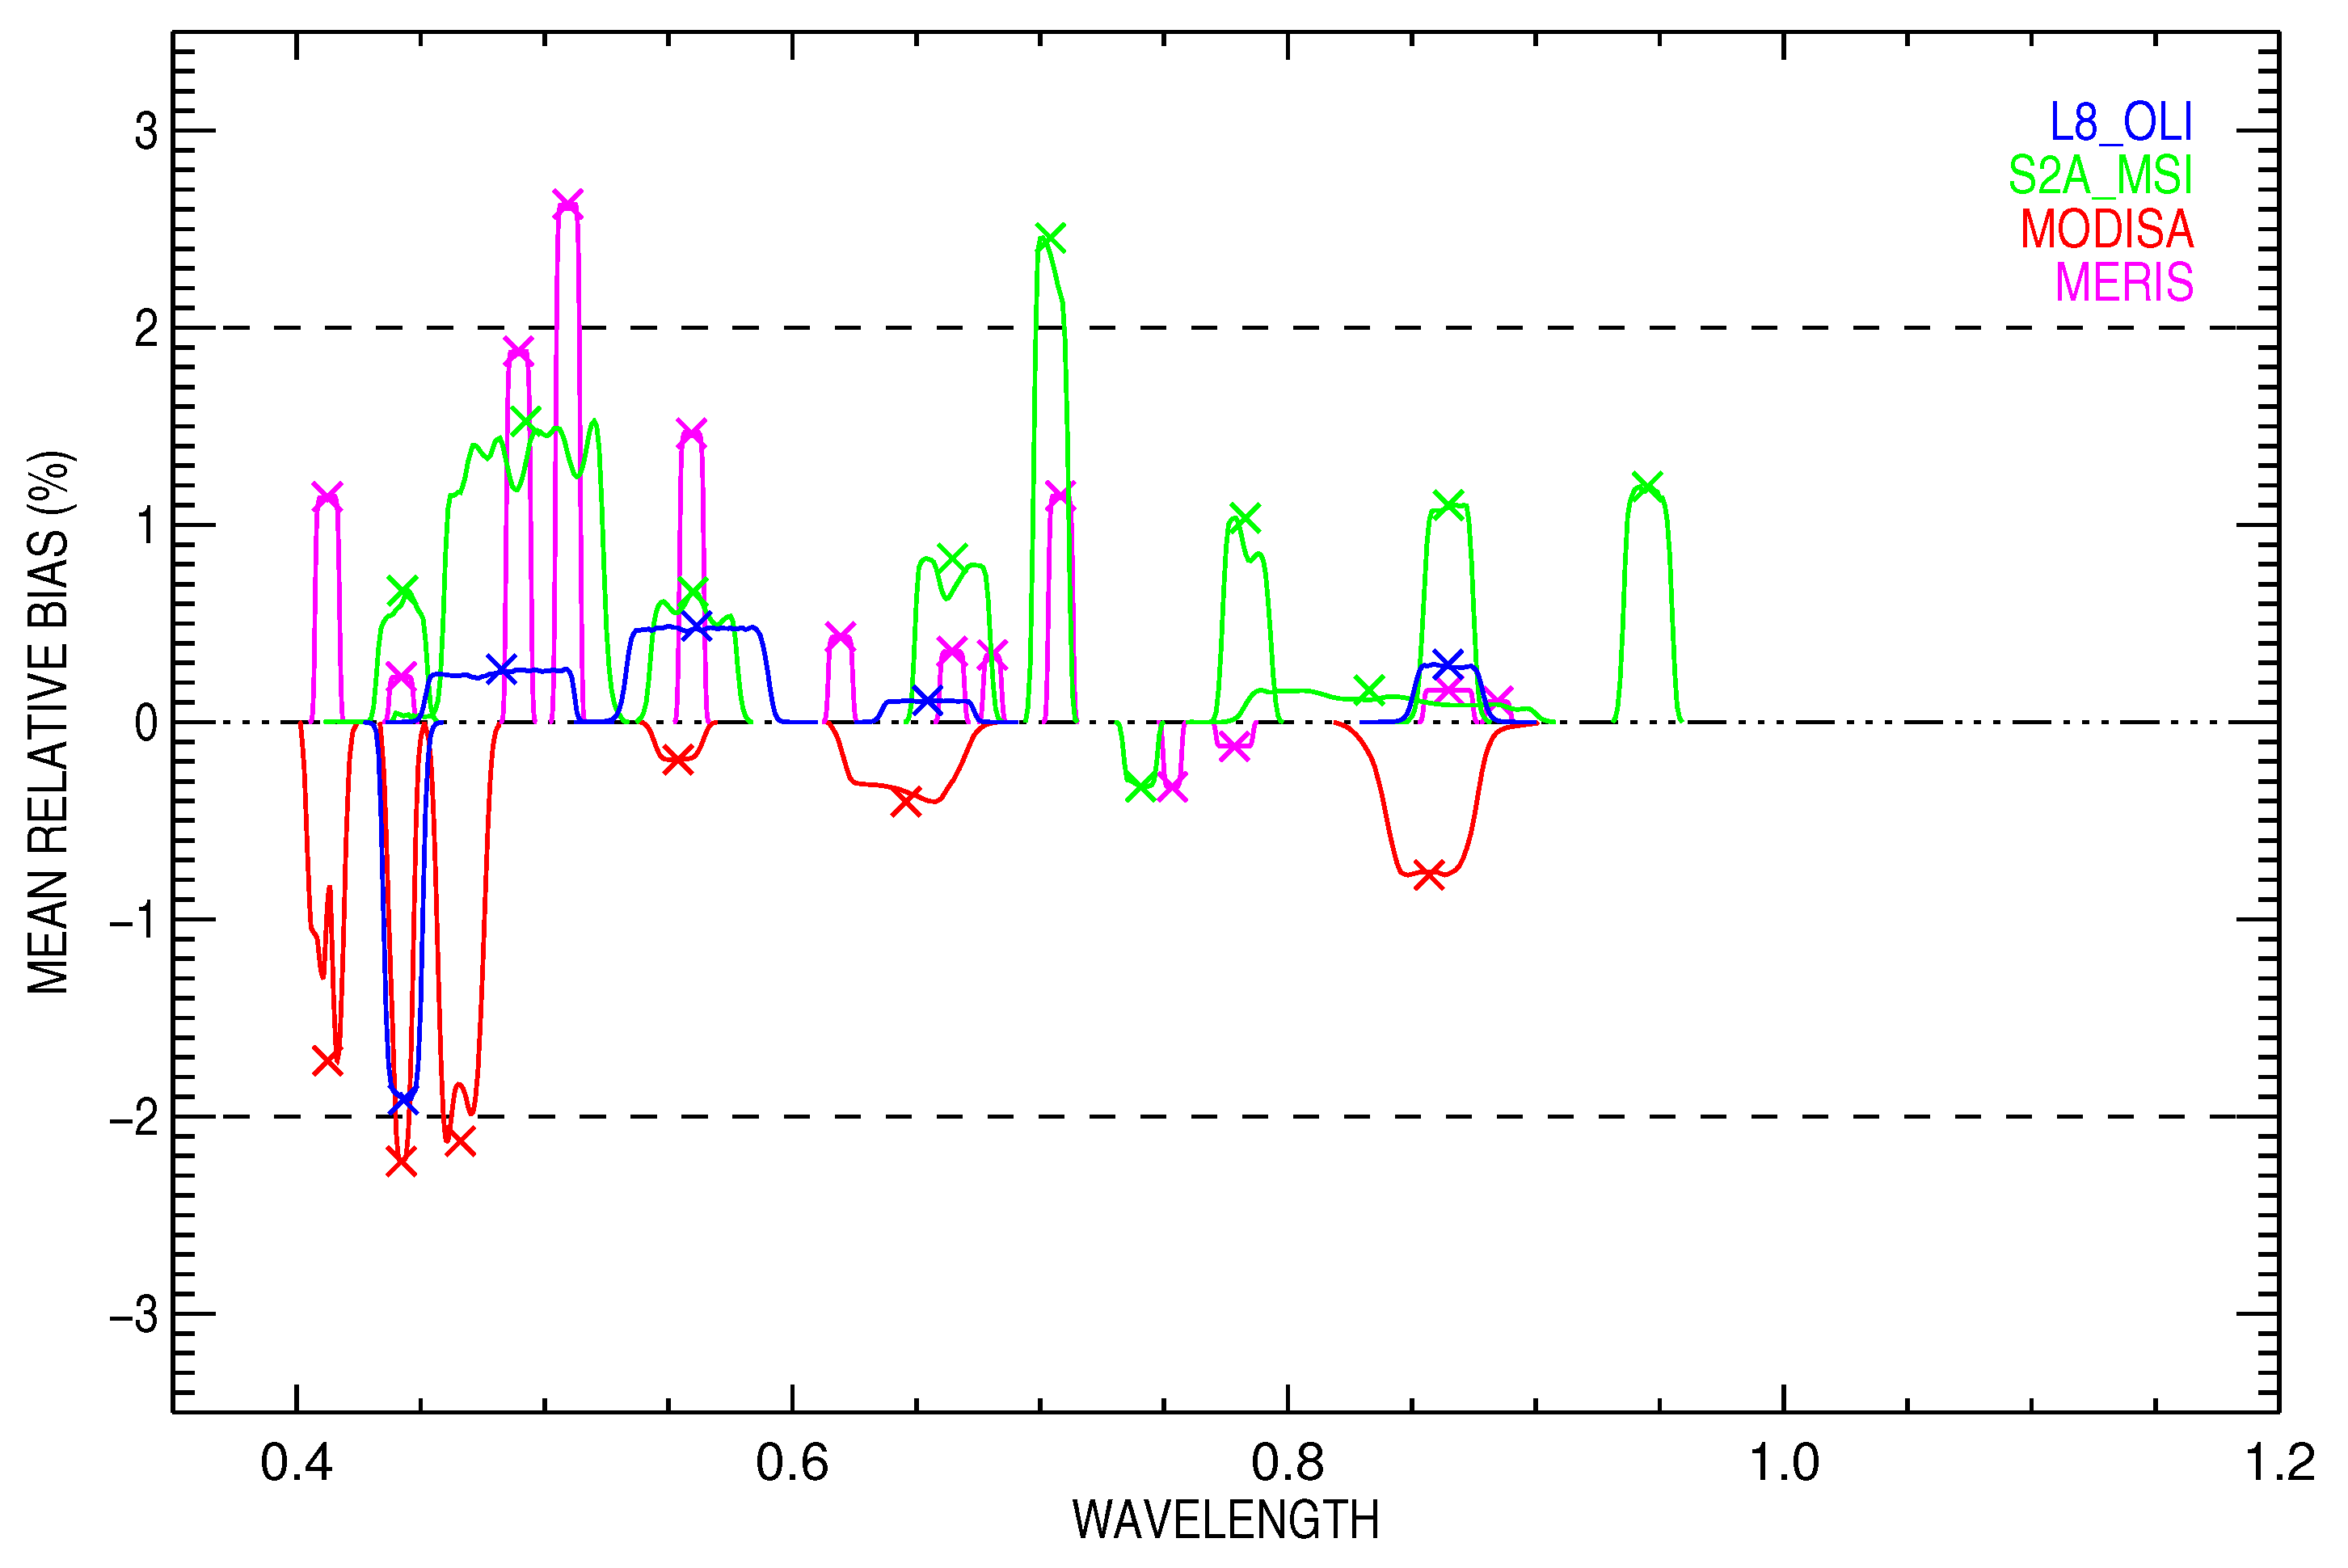
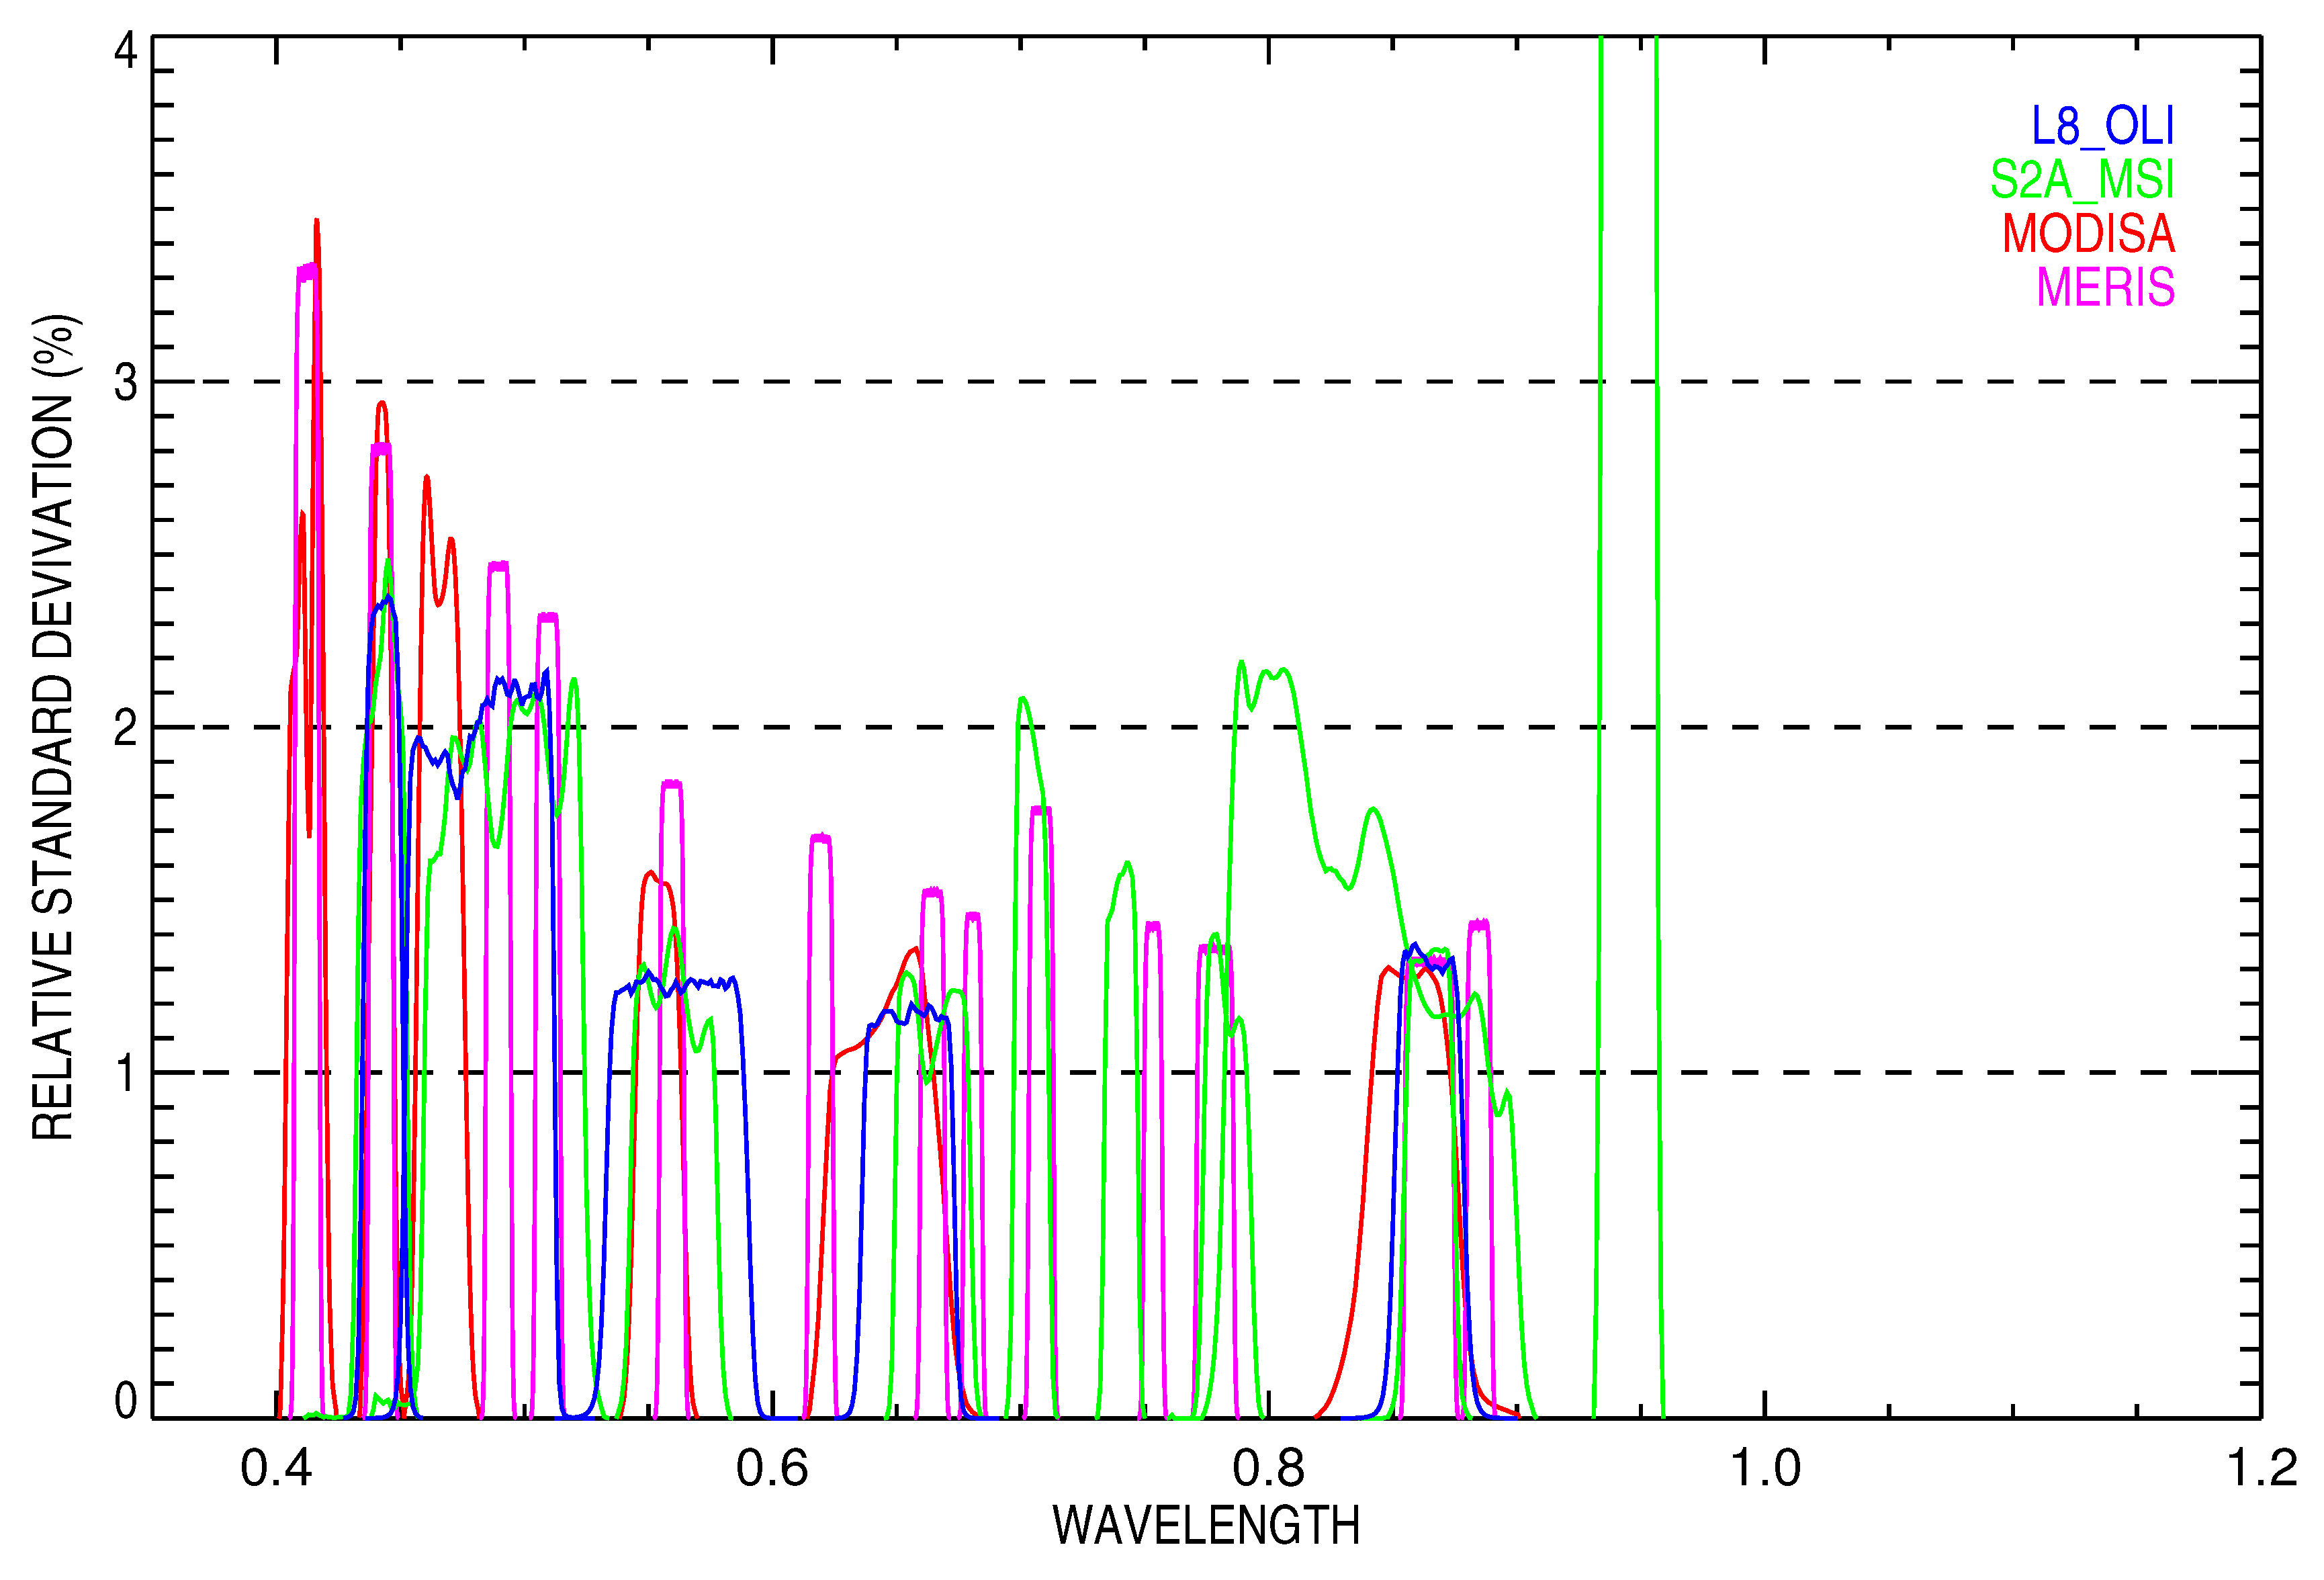
5.2. Spectral Consistency across Targets
6. Conclusions
Author Contributions
Funding
Conflicts of Interest
Abbreviations
| AOT | Aerosol Optical Thickness |
| BIPM | Bureau International des Poids et Mesures (International Bureau of Weights and Measures) |
| BRF | Bidirectional Reflectance Factor |
| CDR | Climate Data Record |
| CEOS | Committee on Earth Observation Satellites |
| CGMS | Coordination Group for Meteorological Satellites |
| COT | Cloud Optical Thickness |
| DC | Digital Count |
| DCC | Deep Convective Cloud |
| ECMWF | European Centre for Medium-Range Weather Forecasts |
| FCDR | Fundamental Climate Data Record |
| FIDUCEO | Fidelity and Uncertainty in Climate Data Records from Earth Observation |
| HRVIS | High Resolution VISible |
| INDOEX | INDian Ocean EXperiment |
| IODC | Indian Ocean Data Coverage |
| IR | InfraRed |
| MFG | Meteosat First Generation |
| MERIS | MEdium Resolution Imaging Spectrometer |
| MODIS | MOderate Resolution Imaging Spectroradiometer |
| MSG | Meteosat Second Generation |
| MSI | Multi-Spectral Instrument |
| MVIRI | Meteosat Visible and InfraRed Imaged |
| OLI | Operational Land Imager |
| PICS | Pseudo-Invariant Calibration Site |
| RTM | Radiative Transfer Model |
| SEVIRI | Spinning Enhanced Visible and Infrared Imager |
| SI | International System of Units |
| SRF | Sensor Response Function |
| SSCC | SEVIRI Solar Channel Calibration |
| TOA | Top-Of-Atmosphere |
| VIS | VISible |
| ZDM | Zero-Dregree Mission |
References
- Govaerts, Y.M. Correction of the Meteosat-5 and -6 VIS band relative spectral response with Meteosat-7 characteristics. Int. J. Remote Sens. 1999, 20, 3677–3682. [Google Scholar] [CrossRef]
- Loew, A.; Govaerts, Y. Towards Multidecadal Consistent Meteosat Surface Albedo Time Series. Remote Sens. 2010, 2, 957–967. [Google Scholar] [CrossRef] [Green Version]
- Decoster, I.; Govaerts, Y.M.; Baudrez, E.; Dewitte, S.; Velazquez, A.; Blazquez, A.; Cornelis, J. Evidence of pre-launch characterization problem of Meteosat-7 visible spectral response. Remote Sens. Lett. 2013, 4, 1008–1017. [Google Scholar] [CrossRef]
- Xiong, X.; Fulbright, J.; Angal, A.; Wang, Z.; Geng, X.; Butler, J. Assessment of MODIS and VIIRS solar diffuser on-orbit degradation. Proc. SPIE 2015. [Google Scholar] [CrossRef]
- Govaerts, M.Y. Exploitation of the Meteosat Archive for climate monitoring: Expectations and limitations. In Proceedings of the 1999 EUMETSAT Meteorological Satellite Data User’s Conference, Copenhagen, Denmark, 6–10 September 1999; pp. 255–262. [Google Scholar]
- Quast, R.; Giering, R.; Govaerts, Y.M.; Rüthrich, F.; Roebeling, R. Climate Data Records from Meteosat First Generation Part II: Retrieval of the In-Flight Visible Spectral Response. Remote Sens. 2018, in press. [Google Scholar]
- Govaerts, Y.M.; Clerici, M.; Clerbaux, N. Operational Calibration of the Meteosat Radiometer VIS Band. IEEE Trans. Geosci. Remote Sens. 2004, 42, 1900–1914. [Google Scholar] [CrossRef]
- Ramanathan, V.; Crutzen, P.J.; Lelieveld, J.; Mitra, A.P.; Althausen, D.; Anderson, J.; Andreae, M.O.; Cantrell, W.; Cass, G.R.; Chung, C.E.; et al. Indian Ocean Experiment: An integrated analysis of the climate forcing and effects of the great Indo-Asian haze. J. Geophys. Res. Atmos. 2001, 106, 28371–28398. [Google Scholar] [CrossRef] [Green Version]
- Govaerts, Y.M.; Clerici, M. SEVIRI Solar Channel Calibration—Algorithm Specification Document; Technical Report EUM/MSG/SPE/411, Version 1.2; EUMETSAT: Darmstadt, Germany, 2001. [Google Scholar]
- Cosnefroy, H.; Leroy, M.; Briottet, X. Selection and characterization of Saharan and Arabian desert sites for the calibration of optical satellite sensors. Remote Sens. Environ. 1996, 58, 101–114. [Google Scholar] [CrossRef]
- Govaerts, Y.M. Operational vicarious calibration of MFG/MVIRI and MSG/SEVIRI solar channels. In Proceedings of the 9th International Symposium on Physical Measurements and Signatures in Remote Sensing, Beijing, China, 17–19 October 2005; Liang, S., Liu, J., Li, X., Liu, R., Schaepman, M., Eds.; ISPRS Working Groups VII/1: Beijing, China, 2005; Volume XXXVI, pp. 446–448. [Google Scholar]
- Uppala, S.M.; KÅllberg, P.W.; Simmons, A.J.; Andrae, U.; Bechtold, V.D.C.; Fiorino, M.; Gibson, J.K.; Haseler, J.; Hernandez, A.; Kelly, G.A.; et al. The ERA-40 re-analysis. Q. J. R. Meteorol. Soc. 2005, 131, 2961–3012. [Google Scholar] [CrossRef] [Green Version]
- Astruc, P. METEOSAT Transition Programme Imaging Chain: Calibration Data; Technical Report MTP.88.E.318; Eumetsat: Darmstadt, Germany, 1997. [Google Scholar]
- Van Dahl, M. MTP CF to INGATE (MPEF) Interface Control Document; Technical Report EUM/TSS/ICD/14/778737; EUMETSAT: Darmstadt, Germany, 2016. [Google Scholar]
- Wolf, R. LRIT/HRIT Global Specification; Technical Report CGMS 03; CGMS: Geneva, Switzerland, 1999. [Google Scholar]
- Reuthrich, F.; Quast, R.; Govaerts, Y.M.; John, V.O.; Roebeling, R.; Wooliams, E.; Schulz, J. Climate Data Records from Meteosat First Generation Part III: Recalibration and Uncertainty Tracing of the Visible channel on METEOSAT 2-7 using Reconstructed, Spectrally Changing Response Functions. Remote Sens. 2018, in press. [Google Scholar]
- EUMETSAT. Meteosat First Generation User Handbook; Technical Report EUM/OPS/USR/10/1537; EUMETSAT: Darmstadt, Germany, 2011. [Google Scholar]
- Govaerts, Y.M. Sand Dune Ridge Alignment Effects on Surface BRF over the Libya-4 CEOS Calibration Site. Sensors 2015, 15, 3453–3470. [Google Scholar] [CrossRef] [Green Version]
- Govaerts, Y.; Sterckx, S.; Adriaensen, S. Use of simulated reflectances over bright desert target as an absolute calibration reference. Remote Sens. Lett. 2013, 523–531. [Google Scholar] [CrossRef]
- Baum, A.; Yang, P.; Heymsfield, J.; Bansemer, R.; Cole, H.; Merrelli, A.; Schmitt, G.; Wang, C. Ice cloud single-scattering property models with the full phase matrix at wavelengths from 0.2 to 100 μm. J. Quant. Spectrosc. Radiat. Transf. 2014, 146, 123–139. [Google Scholar] [CrossRef]
- Doelling, D.R.; Morstad, D.; Scarino, B.R.; Bhatt, R.; Gopalan, A. The Characterization of Deep Convective Clouds as an Invariant Calibration Target and as a Visible Calibration Technique. IEEE Trans. Geosci. Remote Sens. 2013, 51, 1147–1159. [Google Scholar] [CrossRef]
- BIPM. Evaluation of Measurement Data—Guide to the Expression of the Uncertainty in Measurement. Technical Report JCGM 100:2008 GUM 1995 with Minor Corrections. 2008. Available online: https://ncc.nesdis.noaa.gov/documents/documentation/JCGM_100_2008_E.pdf (accessed on 5 December 2018).
- Govaerts, Y.M.; Clerici, M. Evaluation of radiative transfer simulations over bright desert calibration sites. IEEE Trans. Geosci. Remote Sens. 2004, 42, 176–187. [Google Scholar] [CrossRef]
- Emde, C.; Buras-Schnell, R.; Kylling, A.; Mayer, B.; Gasteiger, J.; Hamann, U.; Kylling, J.; Richter, B.; Pause, C.; Dowling, T.; et al. The libRadtran software package for radiative transfer calculations (version 2.0.1). Geosci. Model Dev. 2016, 9, 1647–1672. [Google Scholar] [CrossRef] [Green Version]
- Gasteiger, J.; Emde, C.; Mayer, B.; Buras, R.; Buehler, S.A.; Lemke, O. Representative wavelengths absorption parameterization applied to satellite channels and spectral bands. J. Quant. Spectrosc. Radiat. Transf. 2014, 148, 99–115. [Google Scholar] [CrossRef]
- Dee, D.P.; Uppala, S.M.; Simmons, A.J.; Berrisford, P.; Poli, P.; Kobayashi, S.; Andrae, U.; Balmaseda, M.A.; Balsamo, G.; Bauer, P.; et al. The ERA-Interim reanalysis: Configuration and performance of the data assimilation system. Q. J. R. Meteorol. Soc. 2011, 137, 553–597. [Google Scholar] [CrossRef]
- Sohn, B.J.; Choi, M.J.; Ryu, J. Explaining darker deep convective clouds over the western Pacific than over tropical continental convective regions. Atmos. Meas. Tech. 2015, 8, 4573–4585. [Google Scholar] [CrossRef] [Green Version]
- Sterckx, S.; Livens, S.; Adriaensen, S. Rayleigh, Deep Convective Clouds, and Cross-Sensor Desert Vicarious Calibration Validation for the PROBA-V Mission. IEEE Trans. Geosci. Remote Sens. 2013, 51, 1437–1452. [Google Scholar] [CrossRef]
- Cox, C.; Munk, W. Measurement of the Roughness of the Sea Surface from Photographs of the Sun’s Glitter. J. Opt. Soc. Am. 1954, 44, 838–850. [Google Scholar] [CrossRef]
- Shettle, E.P.; Fenn, R.W. Models for the Aerosols of the Lower Atmosphere and the Effects of Humidity Variations on Their Optical Properties. 1979. Available online: http://web.gps.caltech.edu/~vijay/Papers/Aerosol/SF79-Aerosol-Models-part1of4.PDF (accessed on 5 December 2018).
- Russell, P.B.; Livingston, J.M.; Pueschel, R.F.; Bauman, J.J.; Pollack, J.B.; Brooks, S.L.; Hamill, P.; Thomason, L.W.; Stowe, L.L.; Deshler, T.; et al. Global to microscale evolution of the Pinatubo volcanic aerosol derived from diverse measurements and analyses. J. Geophys. Res. 1996, 101, 18745–18764. [Google Scholar] [CrossRef]
- Vernier, J.P.; Thomason, L.W.; Pommereau, J.P.; Bourassa, A.; Pelon, J.; Garnier, A.; Hauchecorne, A.; Blanot, L.; Trepte, C.; Degenstein, D.; et al. Major influence of tropical volcanic eruptions on the stratospheric aerosol layer during the last decade. Geophys. Res. Lett. 2011, 38. [Google Scholar] [CrossRef] [Green Version]
- Thomason, L. SAGE II Stratospheric Aerosol Data Products; Technical Report; NASA Langley Atmospheric Science Data Center: Hampton, VA, USA, 1998.
- Delwart, S.; Preusker, R.; Bourg, L.; Santer, R.; Ramon, D.; Fischer, J. MERIS inflight spectral calibration. Int. J. Remote Sens. 2007, 28, 479–496. [Google Scholar] [CrossRef]
- Gascon, F.; Bouzinac, C.; Thépaut, O.; Jung, M.; Francesconi, B.; Louis, J.; Lonjou, V.; Lafrance, B.; Massera, S.; Gaudel-Vacaresse, A.; et al. Copernicus Sentinel-2A Calibration and Products Validation Status. Remote Sens. 2017, 9, 584. [Google Scholar] [CrossRef]
- Govaerts, Y.M.; Arriaga, A.; Schmetz, J. Operational Vicarious Calibration of the MSG/SEVIRI Solar Channels. Adv. Space Res. 2001, 28, 21–30. [Google Scholar] [CrossRef]
- Govaerts, Y.M. Impact of the SEVIRI HRV Spectral Response Characterisation on the Effective Radiance Estimation; Technical Report MET/MEM/99.015; EUMETSAT: Darmstadt, Germany, 1999. [Google Scholar]
- Chen, W.; Zhao, H.; Li, Z.; Jing, X.; Yan, L. Uncertainty Evaluation of an In-Flight Absolute Radiometric Calibration Using a Statistical Monte Carlo Method. IEEE Trans. Geosci. Remote Sens. 2015, 53, 2925–2934. [Google Scholar] [CrossRef]
- Mishra, N.; Helder, D.; Angal, A.; Choi, J.; Xiong, X. Absolute Calibration of Optical Satellite Sensors Using Libya 4 Pseudo Invariant Calibration Site. Remote Sens. 2014, 6, 1327–1346. [Google Scholar] [CrossRef] [Green Version]


| Parameter Name | PICS Type | Uncertainty | Reference |
|---|---|---|---|
| Surface reflectance | Desert | 5–10% | [19] |
| Surface wind speed | Ocean | 10% | [26] |
| Surface wind direction | Ocean | 10% | [26] |
| Surface pressure | Desert, ocean | 10% | [26] |
| Aerosol optical thickness | Desert, ocean | MAX{30%, 0.02} | [7,19] |
| Total column water vapor | Desert, ocean | 10% | [26] |
| Cloud optical thickness | DCC | 40 | [21,27] |
| Cloud ice particle radius | DCC | 10 m | [21,27] |
| Platform | Radiometer | Version | Nbr. of Obs. |
|---|---|---|---|
| AQUA | MODIS | Collection 5 | 859 |
| Envisat | MERIS | Third Reprocessing | 865 |
| Sentinel-2 | MSI | Baseline 02.07 | 60 |
| Landsat-8 | OLI | Collection 1 | 54 |
| Band | a | Slope | Slope Uncert. | |||||
|---|---|---|---|---|---|---|---|---|
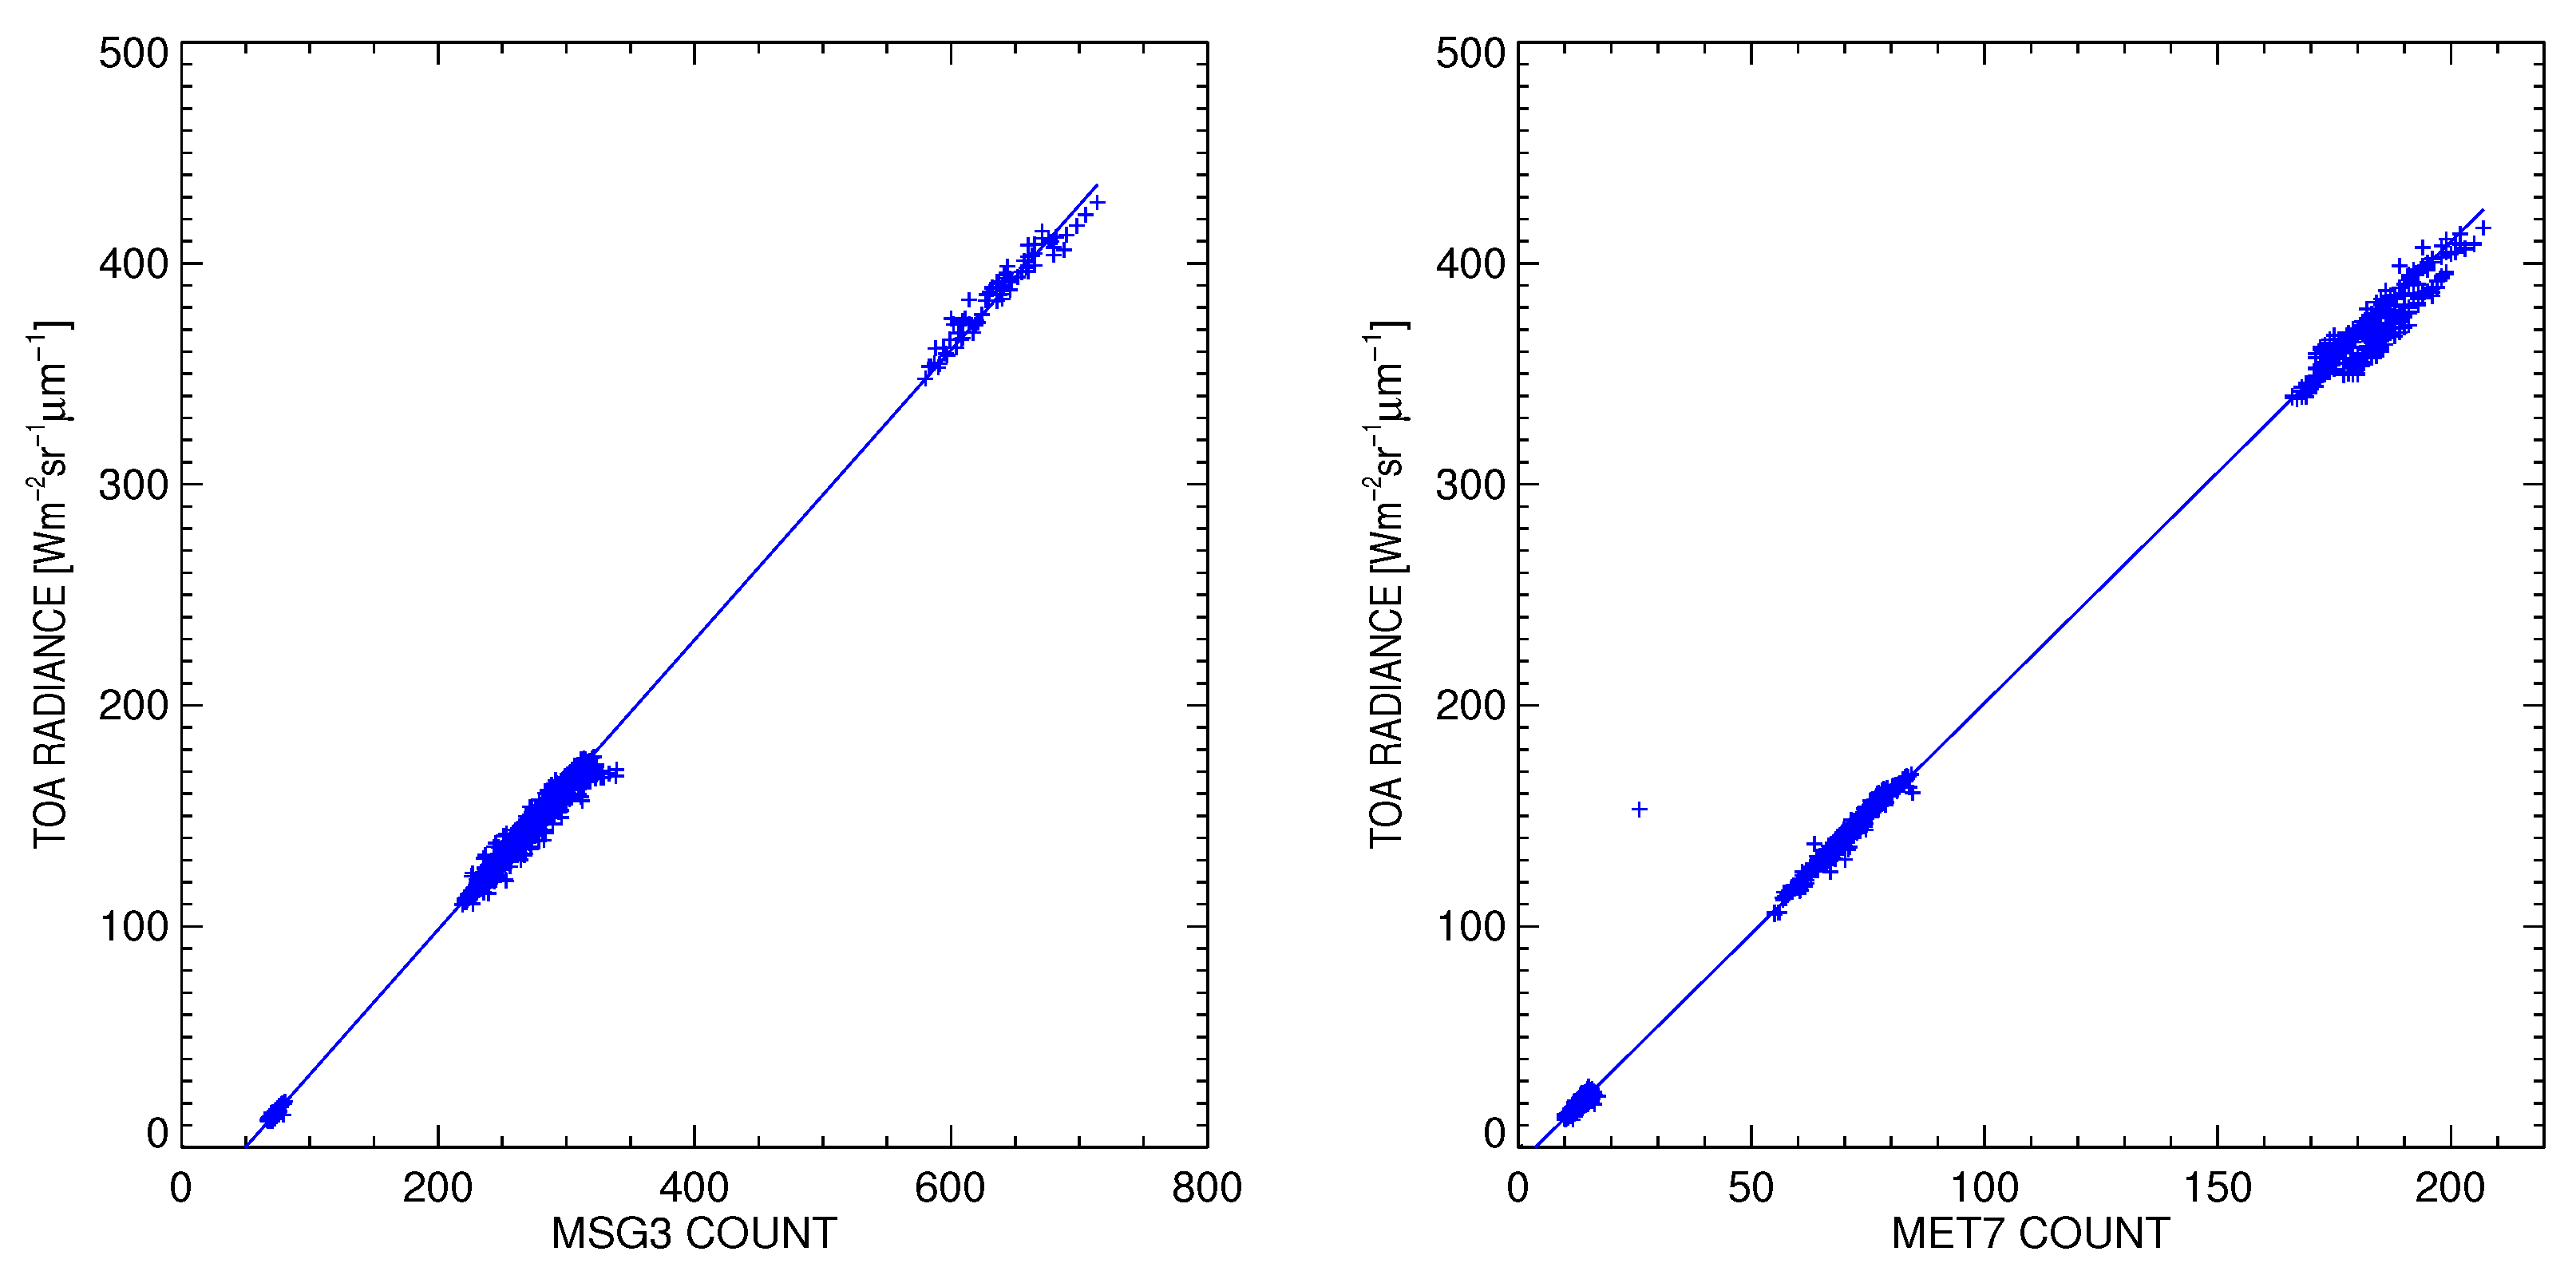
| MSG-3/SEVIRI/HRVIS | 0.658 | 0.017 | 0.656 | 0.003 | 49.81 | 0.924 | 51.06 | 0.252 |
| MET-7/MVIRI/VIS | 2.242 | 0.226 | 2.090 | 0.011 | 3.68 | 0.096 | 4.87 | 0.120 |
| HRVIS | VIS | |||||
|---|---|---|---|---|---|---|
| Target | Nbr | Nbr | ||||
| Sea | 564 | 0.659 | 0.040 | 661 | 2.424 | 0.180 |
| Desert | 813 | 0.658 | 0.015 | 670 | 2.167 | 0.212 |
| DCC | 214 | 0.661 | 0.013 | 421 | 2.079 | 0.040 |
| All | 1591 | 0.658 | 0.017 | 1752 | 2.242 | 0.226 |
© 2018 by the authors. Licensee MDPI, Basel, Switzerland. This article is an open access article distributed under the terms and conditions of the Creative Commons Attribution (CC BY) license (http://creativecommons.org/licenses/by/4.0/).
Share and Cite
Govaerts, Y.M.; Rüthrich, F.; John, V.O.; Quast, R. Climate Data Records from Meteosat First Generation Part I: Simulation of Accurate Top-of-Atmosphere Spectral Radiance over Pseudo-Invariant Calibration Sites for the Retrieval of the In-Flight Visible Spectral Response. Remote Sens. 2018, 10, 1959. https://0-doi-org.brum.beds.ac.uk/10.3390/rs10121959
Govaerts YM, Rüthrich F, John VO, Quast R. Climate Data Records from Meteosat First Generation Part I: Simulation of Accurate Top-of-Atmosphere Spectral Radiance over Pseudo-Invariant Calibration Sites for the Retrieval of the In-Flight Visible Spectral Response. Remote Sensing. 2018; 10(12):1959. https://0-doi-org.brum.beds.ac.uk/10.3390/rs10121959
Chicago/Turabian StyleGovaerts, Yves M., Frank Rüthrich, Viju O. John, and Ralf Quast. 2018. "Climate Data Records from Meteosat First Generation Part I: Simulation of Accurate Top-of-Atmosphere Spectral Radiance over Pseudo-Invariant Calibration Sites for the Retrieval of the In-Flight Visible Spectral Response" Remote Sensing 10, no. 12: 1959. https://0-doi-org.brum.beds.ac.uk/10.3390/rs10121959