Article

Spatiotemporal Evolution of Postseismic Deformation Following the 2001 Mw7.8 Kokoxili, China, Earthquake from 7 Years of Insar Observations

1
State Key Laboratory of Earthquake Dynamics, Institute of Geology, China Earthquake Administration, Beijing 100029, China
2
Department of Earth and Planetary Science and Berkeley Seismology Lab, University of California, Berkeley, CA 94708, USA
*
Author to whom correspondence should be addressed.
Remote Sens. 2018, 10(12), 1988; https://0-doi-org.brum.beds.ac.uk/10.3390/rs10121988
Submission received: 27 September 2018 / Revised: 18 November 2018 / Accepted: 25 November 2018 / Published: 8 December 2018
(This article belongs to the Special Issue Remote Sensing of Tectonic Deformation)

Abstract

:
The 2001 Mw7.8 Kokoxili earthquake, which occurred in the north Tibetan Plateau, ruptured ~400 km of the westernmost portion of the Kunlun fault and produced significant time-dependent postseismic deformation over a large area around the rupture zone and nearby regions. To analyze the postseismic deformation features along different sections of the coseismic surface rupture, we describe the total cumulative postseismic deformation near the center of the rupture and produce velocity maps for the whole observation period and six sub-periods, using InSAR observations (ENVISAT/ASAR, 2003–2010) on five descending tracks. The results indicate that the postseismic deformation is asymmetrically distributed across the fault over a very broad area of ~300 km × 500 km. The south side of the fault exhibits larger displacements and a wider area of deformation that is steadily decaying from near-field to far-field, while the north side displays a narrow, rapidly diminishing deformation field. The maximum cumulative displacement in 2003–2010 reaches up to ~45–60 mm and the LOS peak-to-trough average velocity offset in 2003–2010 reaches ~13–16 mm/yr at ~92.5°E. The short-term postseismic velocity estimates in the six sub-periods reflect significant spatial variation and temporal differences on different sections. Motions to the south of the two ends of the rupture zone show more rapid velocity decay compared to near the main central rupture zone. The time- and distance-dependent timeseries of postseismic surface displacement reveal exponential decay in the near-field and a nearly linear trend in the far-field of the fault.

Graphical Abstract

1. Introduction

Time-dependent postseismic deformation produced by megathrust ruptures or great continental events can last decades or even hundreds of years, and it can reveal important and detailed information on the crustal and mantle rheology at depth, fault frictional properties, the relocking process, and the mechanics of major active faults in the seismic zone [1,2]. In recent decades, the deep rheological properties of the lithosphere beneath the Tibetan Plateau have received much interest. Several research groups used postseismic deformation observations on the surface to infer the lower-crust/mantle viscosity at depth (e.g., [3,4,5,6,7,8,9]). The substantial and long-lived postseismic deformation following the 2001 Mw7.8 Kokoxili (Tibet) earthquake (KKEQ) can provide new and important insights into the rheological structure and properties of the lithosphere in the north Tibetan Plateau. It is important to better understand the active deformation processes of the Kunlun fault (KF) to help characterize the future seismic risk in this region. Therefore, it is necessary to precisely measure and interpret the postseismic surface deformation transients following the KKEQ.
The KKEQ is the largest historic earthquake on the KF [10]. It ruptured the western segment of the KF with mainly left-lateral strike slip and produced a 420-km-long surface rupture zone with the maximum coseismic displacement reaching ~7.6 m at ~93°E [10,11,12,13]. Before the KKEQ, five M > 7 earthquakes, including the 1902 M 7.0 Xiugou, 1937 M 7.5 Tuosuo Lake, 1963 M 7.1 Alake Lake, 1973 M 7.3 Mani and 1997 Mw7.6 Manyi earthquakes, occurred on the KF in the last century [14] (Figure 1a). The study of stress evolution following these six strong events indicates that some unruptured segments, such as the Xidatan fault [15], have experienced substantial stress accumulation. More importantly, these segments show little evidence of historic ruptures in the past few hundred years and seem to be likely sites for future earthquakes [13,14,16]. In addition to the coseismic stress change, postseismic relaxation and associated stress loading can be expected to further increase seismic hazard on these segments in the following decades. Thus, the overall postseismic deformation associated with the KKEQ and its detailed spatiotemporal evolution are important for stress transfer analysis and earthquake hazard assessment in surrounding area.
However, the postseismic deformation reflects the integrated effect of multiple postseismic deformation mechanisms (i.e., afterslip, poroelastic rebound and viscous relaxation), and it remains a challenge to quantitatively separate the contributions to surface motions from various processes. It is commonly interpreted that viscous relaxation dominates the long period and long wave-length components of surface deformation, while afterslip plays the leading role in the short term following a strong strike-slip earthquake. In fact, various relaxation mechanisms may act over a specific period and show different temporal behaviors along different fault segments, especially for the strong KKEQ with a long surface rupture. It is therefore of great importance to identify and characterize the spatiotemporal evolution of postseismic deformation to effectively distinguish different postseismic deformation mechanisms and to further study the rheological structure at depth.
Interferometric Synthetic Aperture Radar (InSAR) and timeseries analysis techniques can be utilized to precisely measure the postseismic crustal deformation over a long period following large earthquakes [17,18,19,20]. Particularly, in the northern Tibet Plateau along the KF zone, where GPS sites are scarce, InSAR observations provide an irreplaceable advantage in obtaining large-scale and continuous deformation fields (Figure 1). The GPS stations to measure postseismic deformation following the KKEQ are mainly distributed along a NE profile located across the eastern part of the 2001 rupture [21,22]. However, InSAR data processing challenges in this region make it difficult to accurately detect and capture the deformation signal of interest throughout the mountainous areas near the KF [18,19,20]. In addition, the crustal deformation in the postseismic phase is small with a typical magnitude of order mm to cm, ambiguities exist between the tectonic signal and orbital ramps or long-wavelength atmospheric artefacts, and there is severe radar phase decorrelation in the mountainous region [19,20].
Previous studies mainly focused on postseismic cumulative displacements following the KKEQ to constrain the rheological properties of the lower crust in the central Bayanhar block. Several studies have concentrated on how to resolve the postseismic deformation evolution and to identify its spatiotemporal variations following this strong event. Wen et al. [9] use InSAR time-series analysis on five adjacent descending Envisat tracks 448, 176, 405, 133 and 362 to obtain the cumulative postseismic displacements between 2003 and 2007, which is useful to infer deep mechanical processes responsible for the observed postseismic deformation and to determine the rheological structure of the upper lithosphere of the central Tibetan plateau. Ryder et al. [8] obtain the cumulative postseismic displacement during 2003–2004 on five descending tracks 448, 176, 405, 362 and 90 and on ascending track 355 to interpret the first-order pattern of line-of-sight (LOS) deformation, and consider a displacement time-series on a single track 176 to understand the temporal decay of postseismic stress relaxation. Qiao et al. [23], Ren and Wang [24] and He et al. [5] carried out GPS measurements at 16 sites during 2001–2002, nearly 1 year after the mainshock. They document that almost 50 percent of the observed postseismic deformation (from 3 weeks to 1 yr) occurred during the first two observation weeks. This indicates that the deformation rates were very rapid (~130 cm/yr) following the onset of the KKEQ and rapidly decreased to ~26 cm/yr by March 2001. Zhao et al. [25] present GPS velocities and timeseries during 1998–2014 on the Chinese mainland. In addition, Garthwaite et al. [26] present an InSAR analysis of large-scale interseismic deformation during 2003–2009 on major faults and postseismic deformation across the KF using a >1000-km-long swath along track 176 across the Tibetan plateau. These studies show that the KKEQ has induced long-term and large-area perturbations of crustal deformation around the KF zone.
In this study, we focus on InSAR measurements of the large-scale postseismic deformation covering almost the entire rupture and its spatiotemporal evolution following the KKEQ, during 2003–2010 (from the 2nd to the 7th year after the mainshock). We separate the tectonic signal from residual orbital ramps and atmospheric phase screen (APS) noise on five ~100 km wide and ~400 km long Envisat/ASAR descending tracks, which allows us to produce broad LOS velocity maps over the whole study period and for each sub-period. We also compare our result for 2003–2010 with GPS measurements observed in 2001–2002 and 2009–2014. In complement to previous studies in this region, we aim to provide new insights into the postseismic deformation triggered by the KKEQ to improve our knowledge of how postseismic deformation varies spatially and temporally along the ~400-km-long coseismic rupture. Here, we focus on improving the measurements of post-KKEQ deformation using 7 years of InSAR observations. Future work will utilize these data and available GPS measurements to improve mechanical models of this deformation, determine underlying postseismic deformation processes, and assess their role in regional stress interactions and earthquake hazard.

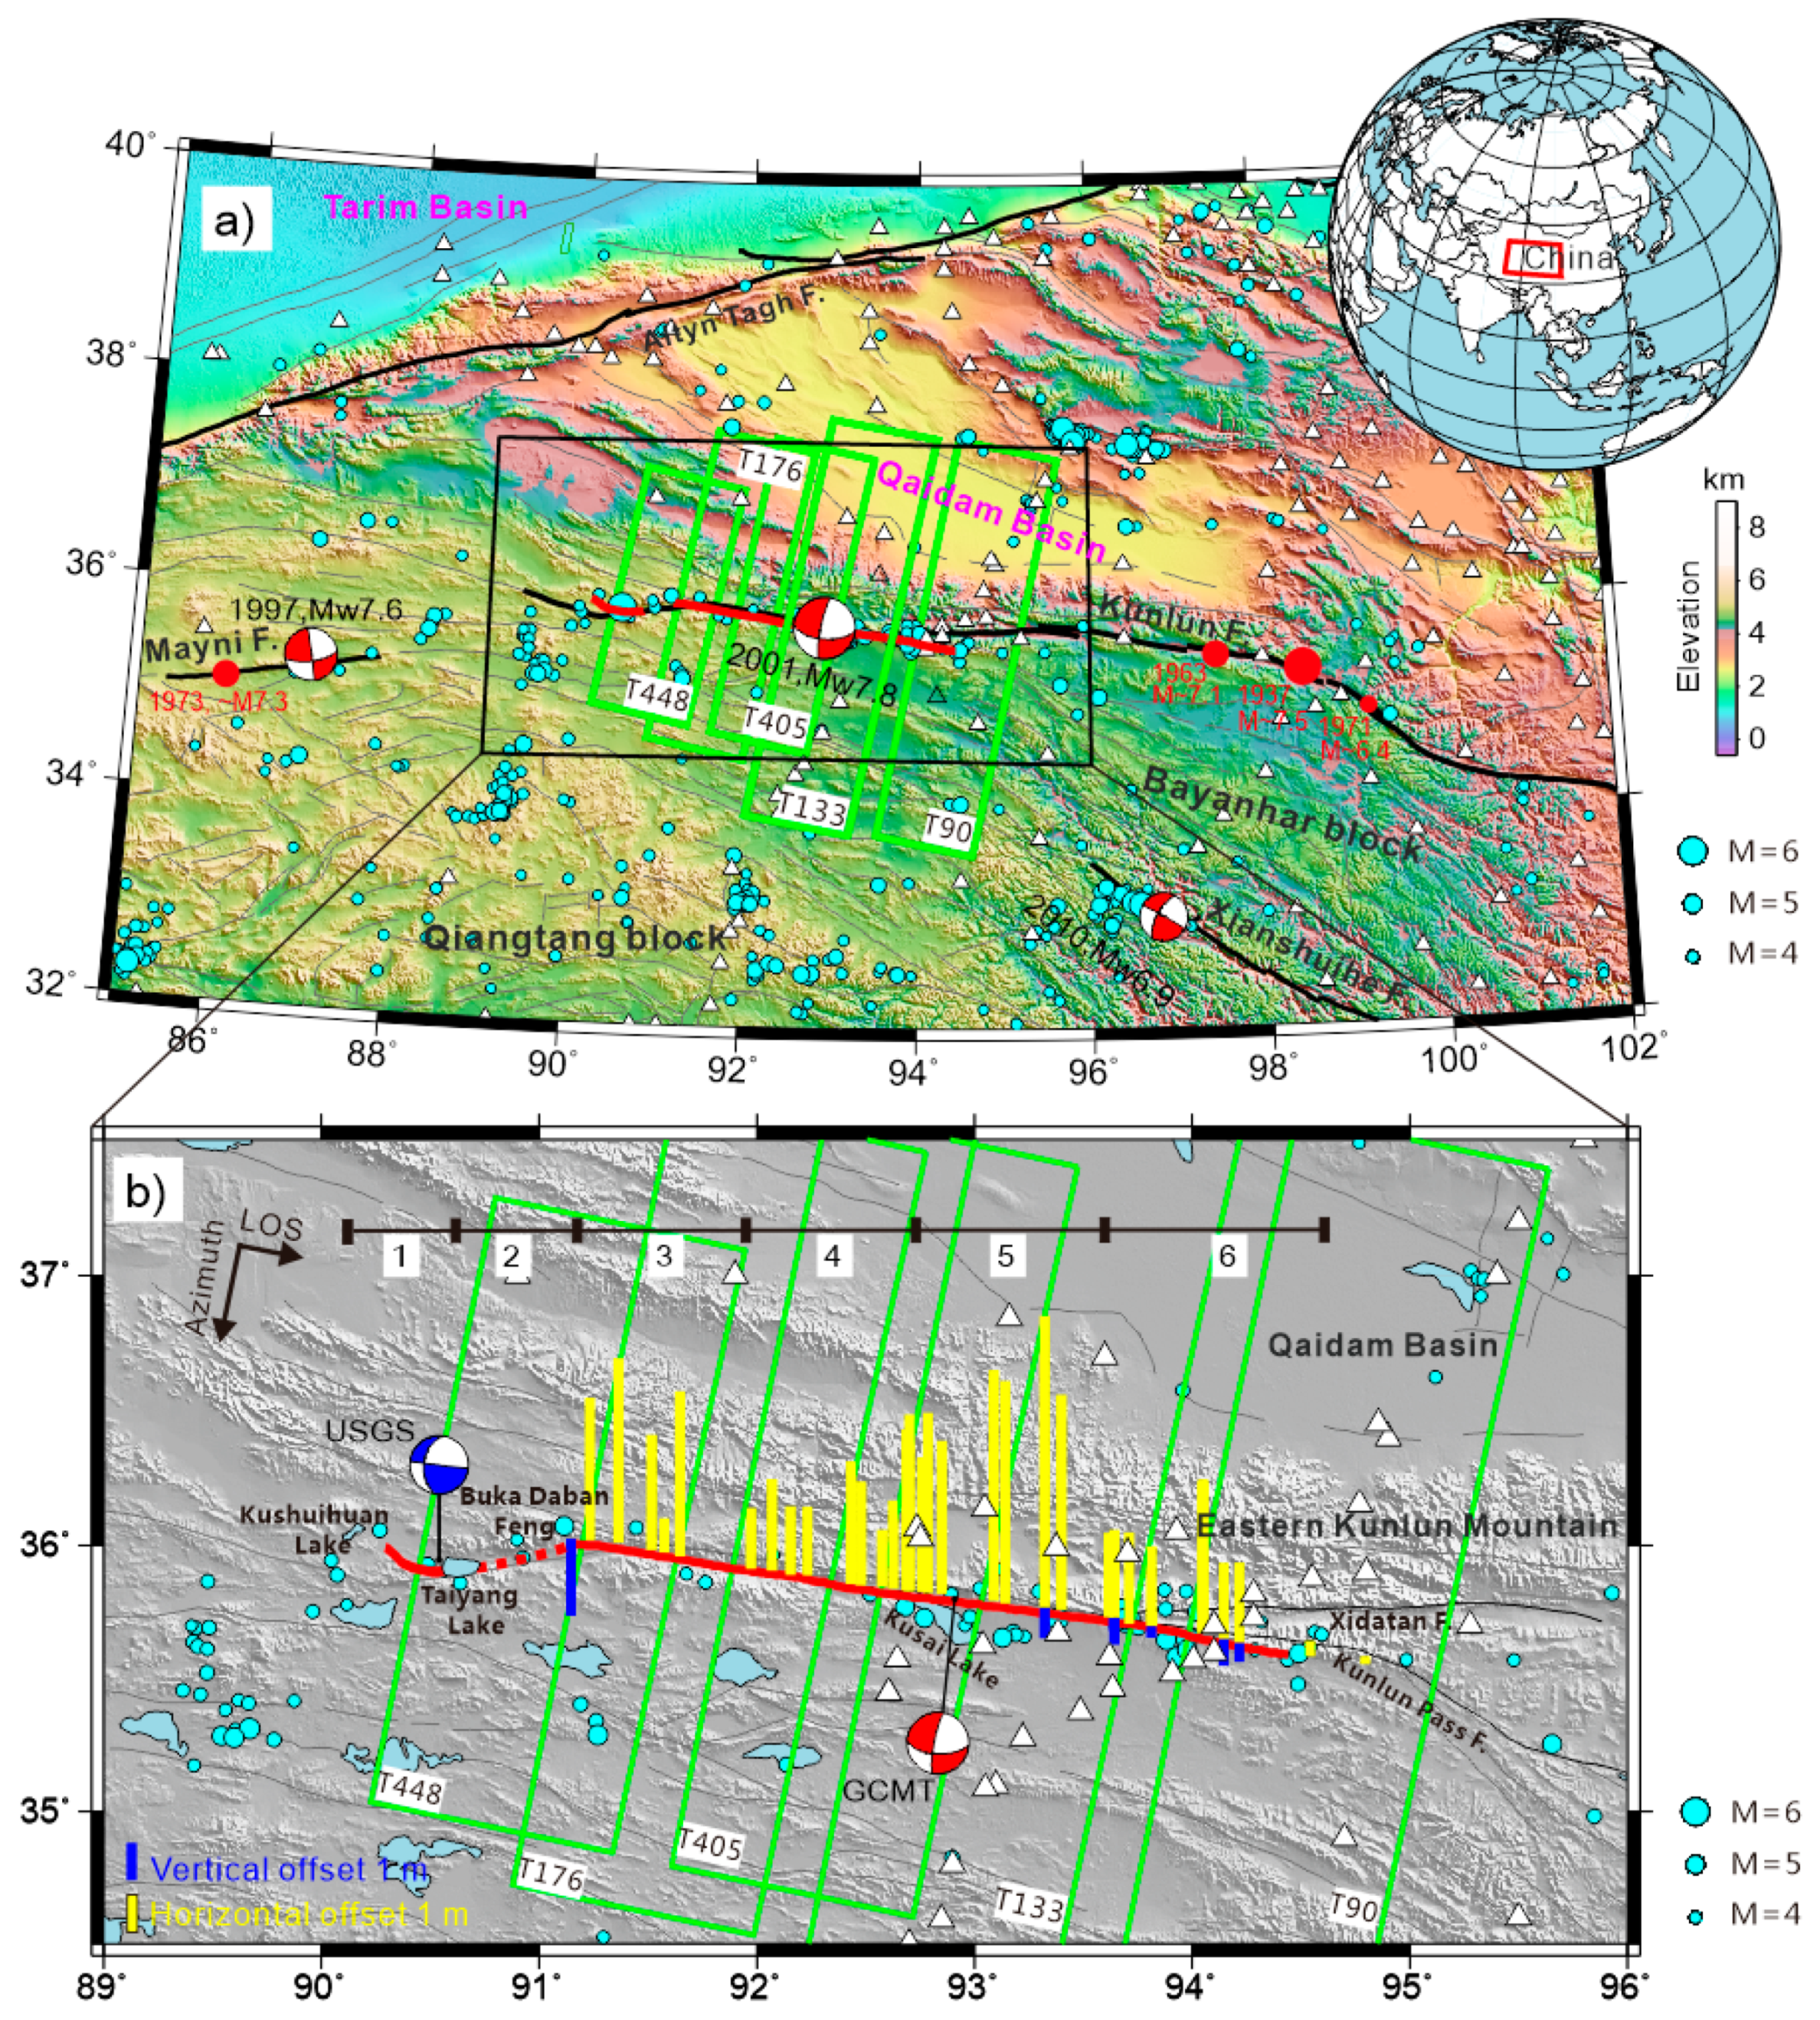
2. The Tectonic Setting and Overview of the 2001 Kokoxili Earthquake

The left-lateral strike-slip KF is considered one of the major active faults accommodating the eastward extrusion of the central and northern Tibetan Plateau as a result of the continuing continental collision between India and Asia plates [14,27]. It extends ~1500 km from 86°E to 105°E along the southern front of the Eastern Kunlun Mountains (Figure 1a). The KF divides the northern part of the Tibetan Plateau into two geologically and tectonically different units, the southern Tibetan Plateau with an average elevation of ~4500 m, and lower lying northeast Tibet ~3500 m on average [31]. The KF can be divided into seven first-order segments, Weixueshan, Kusai Lake, Xidatan-Dongdatan, Alakhu, Anyemaqinshan, Maqin, and Minshan segments from west to east, according to fault strikes, seismic activities and large-scale geometrical complexities, such as pull-apart basins, releasing or restraining bends (e.g., [10,14]). The 2001 event occurred mainly along the Kusai Lake segment of the KF.
The KF zone is seismically active due to the relative movement of the Qiangtang and Bayanhar blocks with respect to the Qaidam Basin to the north [27] (Figure 1a). The long-term, millennial slip rate along the western and central segment of the KF (~94°E–99°E) has been estimated at 9–16 mm/yr from dated geomorphic marker offsets over late Pleistocene to Holocene times [13,14,16,32]. The decadal left-lateral strike-slip rate of the KF measured by GPS since the 1990s near ~95°E is also 10–12 mm/yr [33,34], compatible with geologically inferred slip rates. Previous studies indicate a relatively uniform slip rate along the ~900 km long western and central segments (~92°E–101°E), while the rates gradually decrease towards the east. Kirby et al. [31] document slip rate gradients along the eastern ~150 km (~101°E–103°E) of the KF from >10 to <2 mm/yr.
The KKEQ mainly ruptured the westernmost portion of the KF and produced a long rupture zone with a total length of ~420 km [10,28] (Figure 1b). This strong event initiated along the strike-slip segment west of Taiyang Lake before breaking in an oblique-normal event along the step-over and rapidly propagated eastward [35]. It ultimately produced a ~30 km surface rupture along the western section to the west of Taiyang Lake, and a continuous ~350 km long rupture zone to the east of the Bukadaban Peak, including the Bukadaban Peek section, the western Kusai section, the eastern Kusai section and the Kunlun Pass section [10,11,12,36] (Figure 1b). These two surface rupture zones are separated by a ~45-km-long extensional step-over corridor, where no obvious surface ruptures are reported. These sections correspond to sub-faults with different coseismic displacements and can be independently identified from the surface morphology and geometry of the fault [10,11,28]. Near the eastern termination of the coseismic surface rupture, the event propagated along the Kunlun Pass fault (KPF) southeastward instead of the Xidatan segment of the KF fault (referred to as Xidatan fault hereafter) to the east, and includes a modest reverse component together with the strike-slip component (Figure 1b). To explain these phenomena, Klinger et al. [36] report evidence for barriers due to changes in fault strike at the junction area between the end of the eastern Kusai section and the western part of the Xidatan fault.
The horizontal offsets measured by field investigation, InSAR data and optical satellite images [10,11,37] range between 2 and 8 m. The coseismic slip reaches a maximum of about ~8 m east of the GCMT moment centroid (~93.5°E, near Kusai Lake, Figure 1b). Lasserre et al. [11] resolve the slip distribution at depth based on dense InSAR data (from ERS SAR images) and estimate a maximum left-lateral strike-slip offset of ~8 m at depths between 0 and 5 km in two areas, 50 km west and 100 km east of the earthquake centroid (GCMT). The observed coseismic displacements appear to be highly variable along different sections of the surface rupture. This indicates that fault geometry plays a dominant role in controlling the rupture propagation [11].

3. Data and Methods

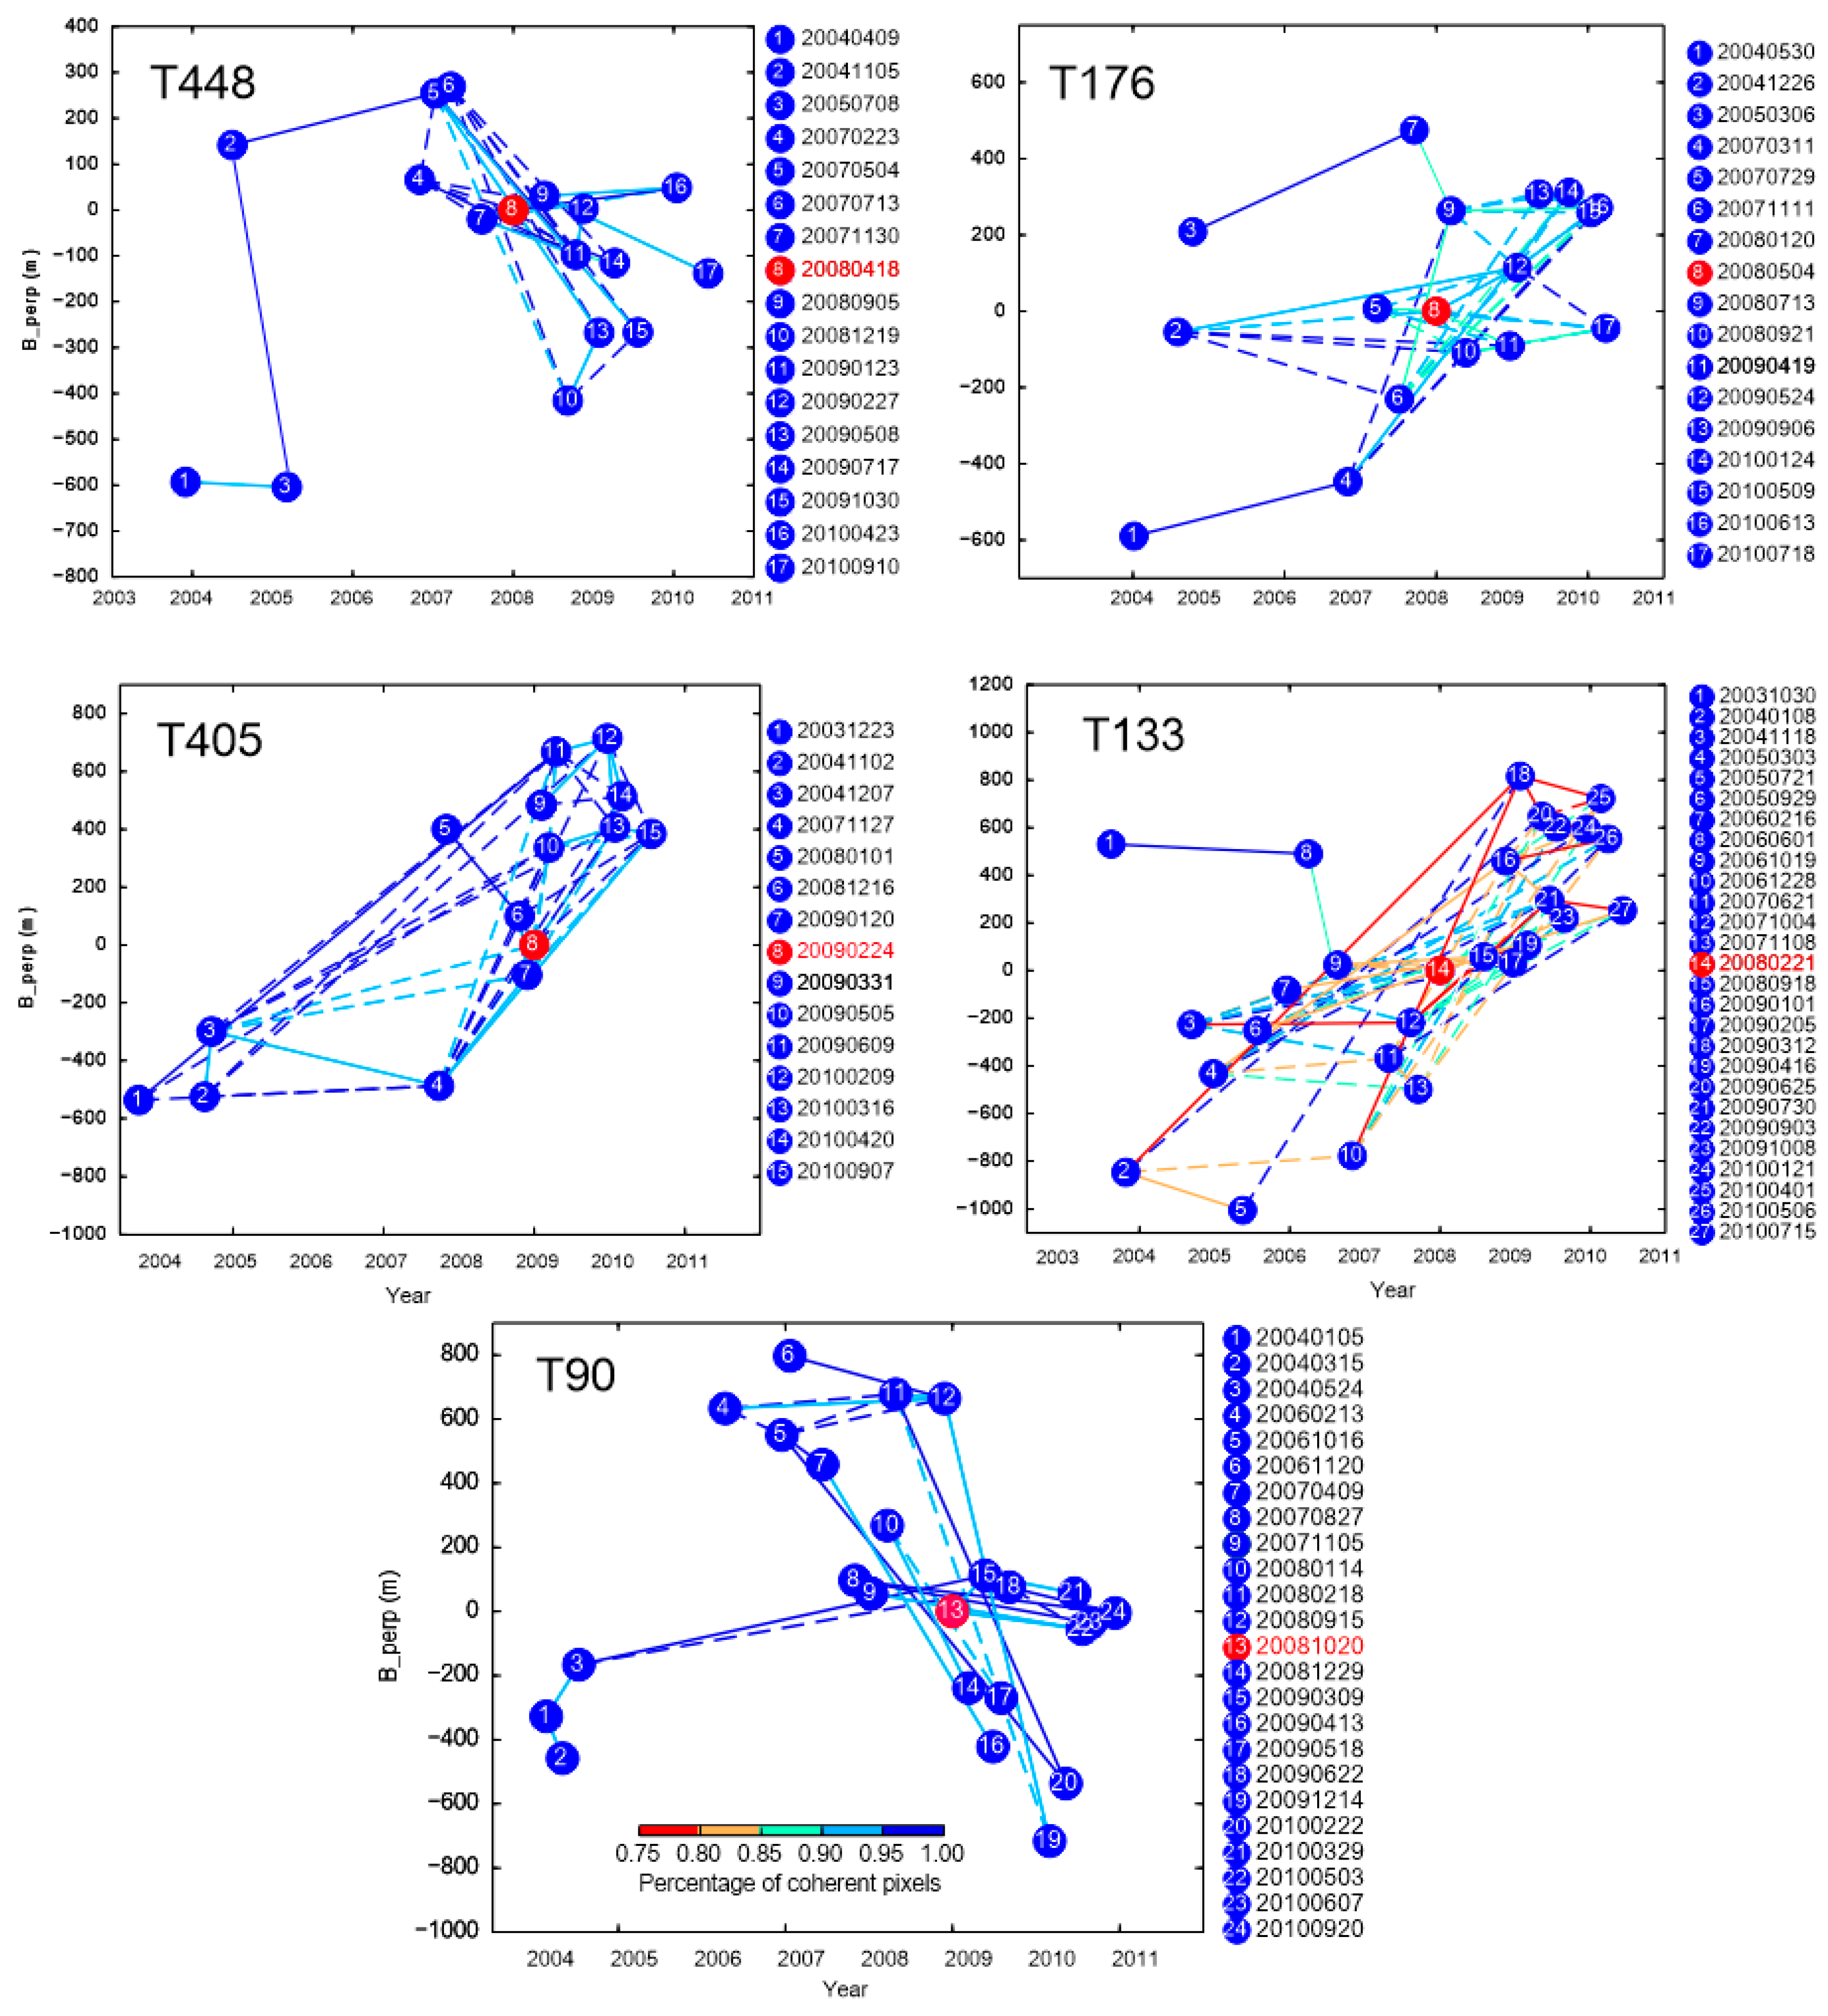
3.1. SAR and GPS Datasets and Interferogram Formation

We use long-swath Envisat ASAR data from the European Space Agency (ESA) on five descending tracks, 448, 176, 405, 133 and 90, spanning the 2003–2010 period to measure the postseismic deformation following the KKEQ (Figure 1). Each track is ~400 km long and ~100 km wide with overlapping areas, which together cover the entire coseismic rupture between 90.5°E and 96°E (Figure 1a). We use the complete dataset of 17, 17, 15, 27 and 24 SAR images in swath mode (IS2) on tracks 448, 176, 405, 133 and 90, respectively, to construct interferograms (Figure 2; Table 1). A NE-SW survey-mode GPS profile operated by CMONOC (Crustal Motion Observation Network of China) obliquely crosses the surface rupture of the KKEQ in its eastern half [24,25] (Figure 1b). We use the GPS observations 2001–2002 and 2009–2014 to compare with our InSAR measurements.
In order to carry out a detailed analysis of the postseismic deformation and its spatiotemporal characteristics, we generate deformation fields for different periods after the mainshock, including the whole study period 2003–2011, and sub-periods 2003–2006, 2004–2007, 2005–2008, 2006–2009, 2007–2010, 2008–2011. We construct 568 (i.e., T448:53, T176:154, T405:112, T133:124, T90:125) differential interferograms in total using the GAMMA software [39,40] (Figure 2; Table 1). The networks of interferograms linking all SAR acquisitions are generated according to their perpendicular orbit (<200 m) and temporal baselines (<3 years), which also ensures redundancy of interferometric pairs. To improve the coherence of the final velocity maps in high mountainous areas, we also generate some interferograms with long perpendicular or temporal baselines to connect as many acquisitions as possible (Figure 2). In this study, we concentrate on the regional-scale postseismic deformation pattern, hence the interferograms are multi-looked by 25 looks in range and 125 looks in azimuth (~500 m × 500 m) to improve the efficiency of calculation and to reduce the noise of data points. A 3-arc-second (90 m) Shuttle Radar Topography Mission (SRTM) digital elevation model (DEM) and precise orbital information are utilized to flatten each interferogram. Then, we use a power spectrum filter to smooth the noise and Minimum Cost Flow (MCF) algorithm to unwrap the interferograms [41].

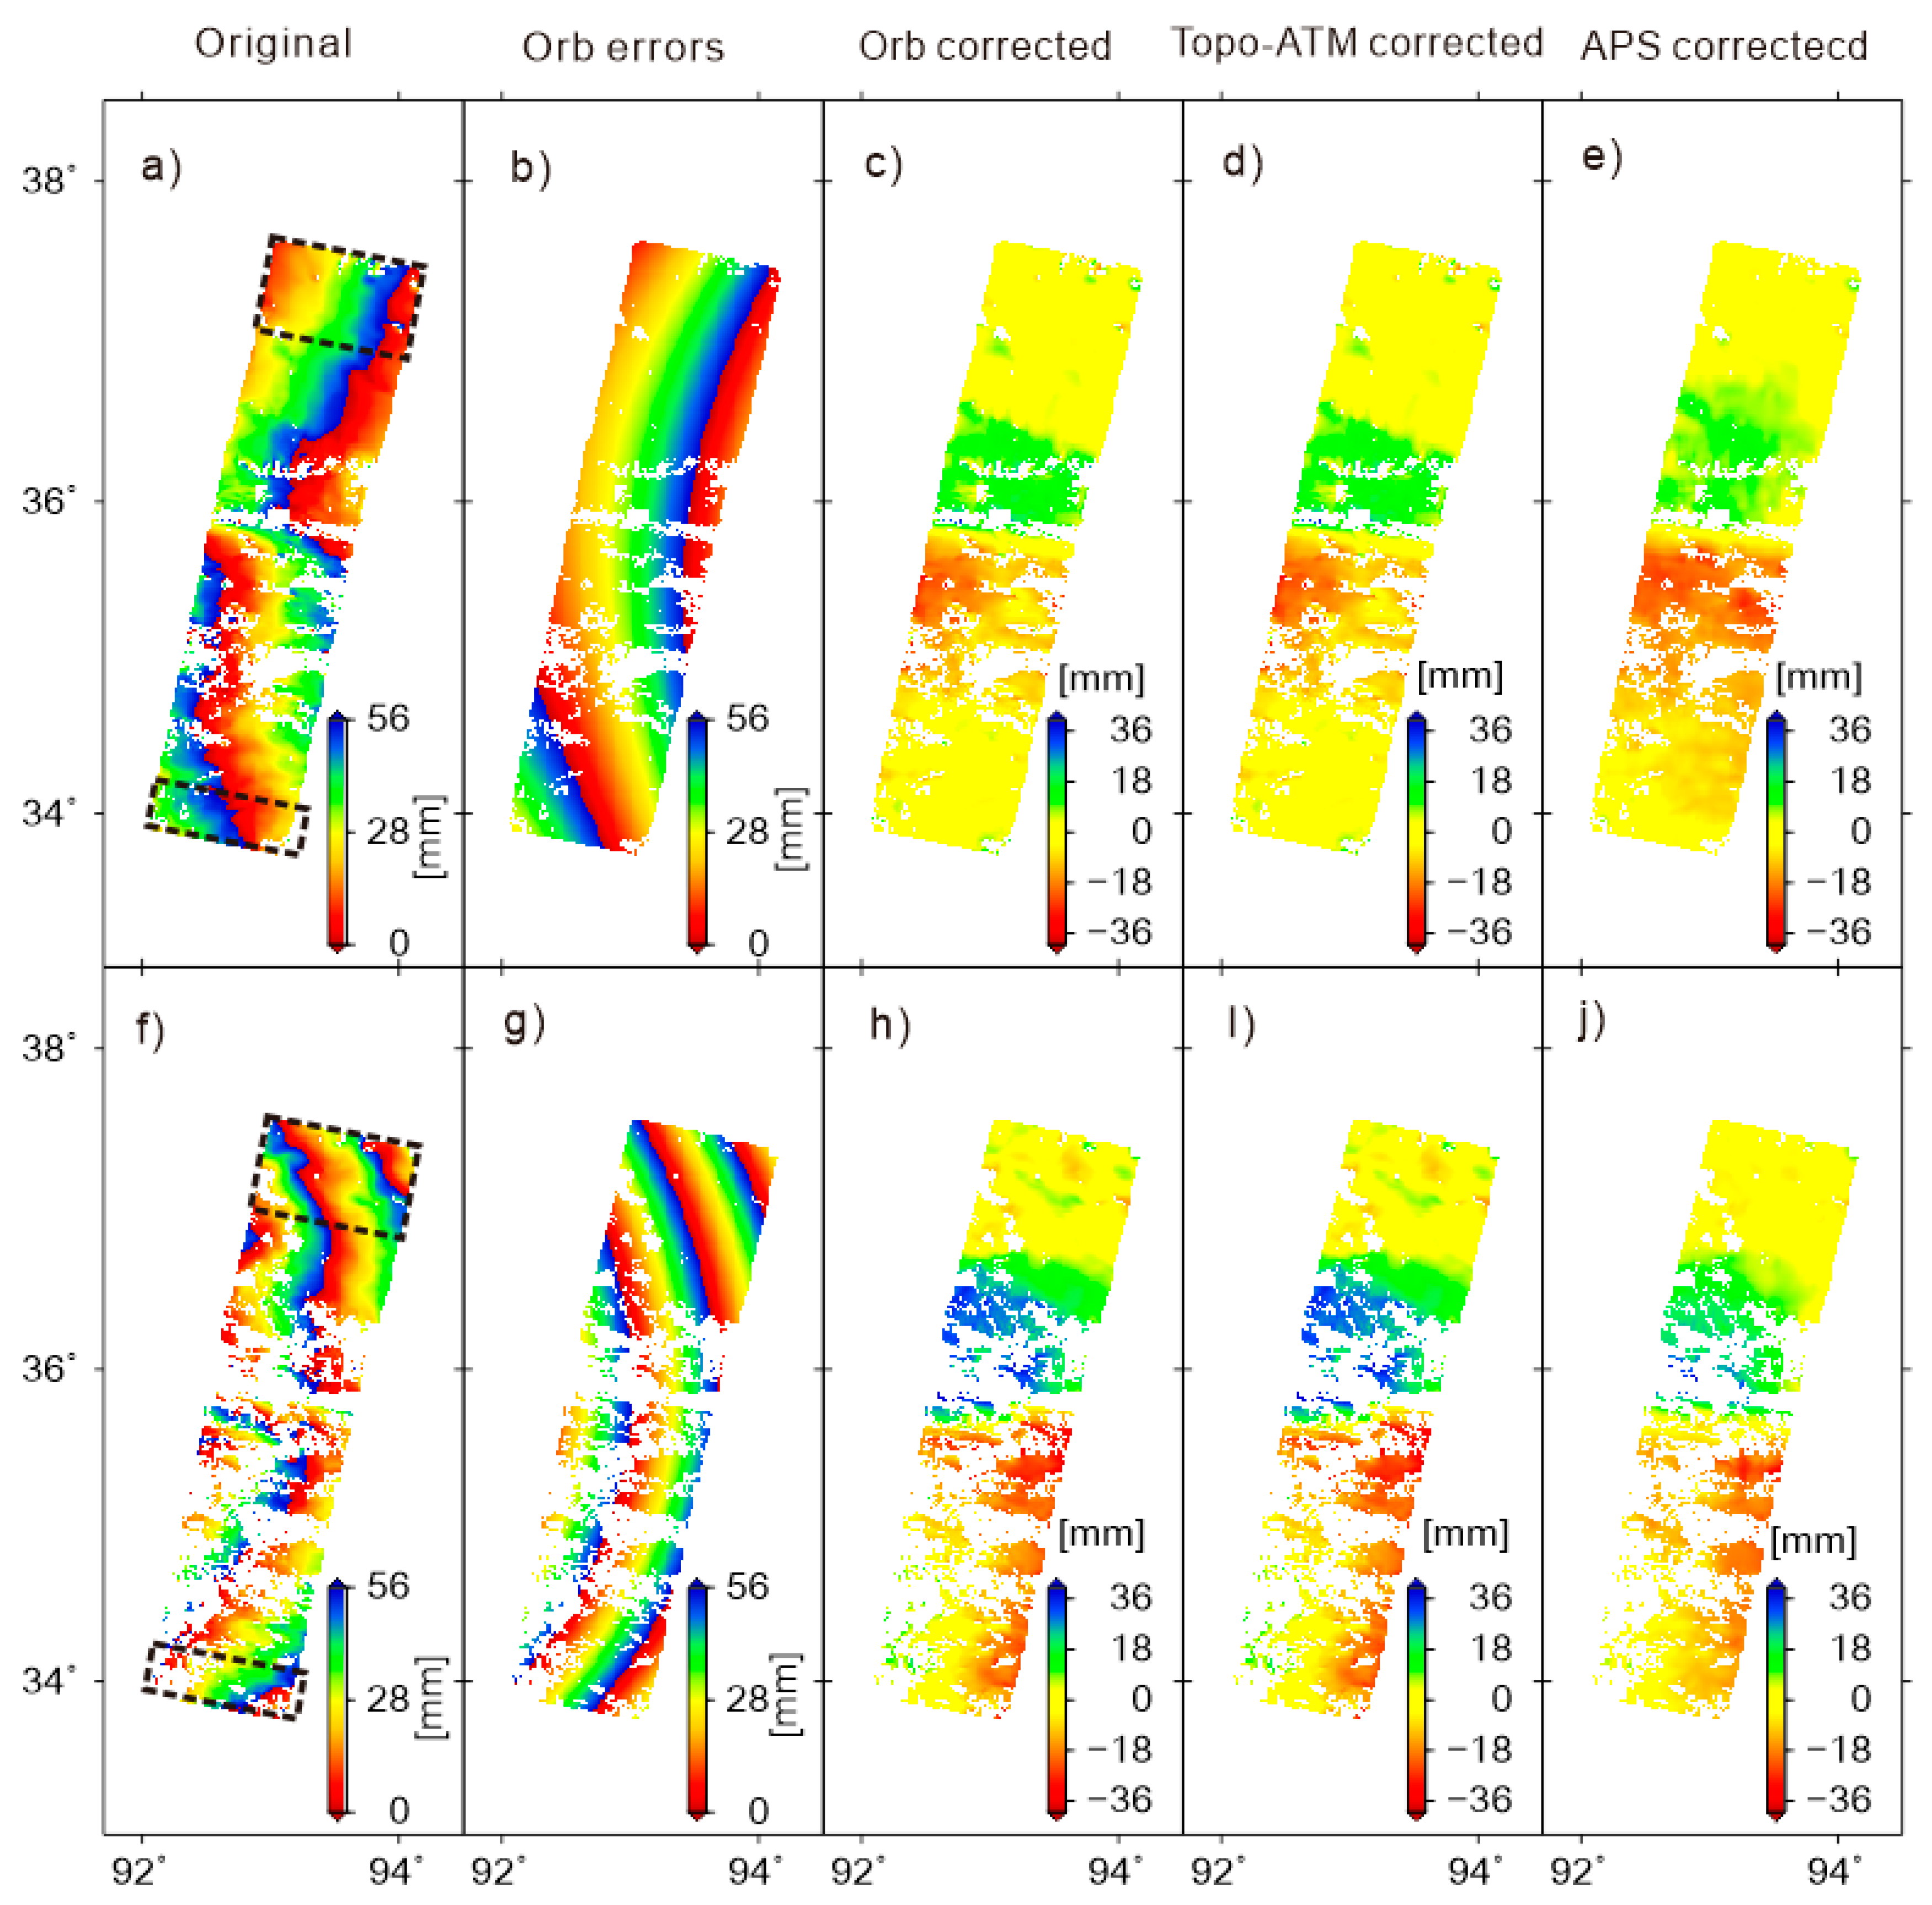
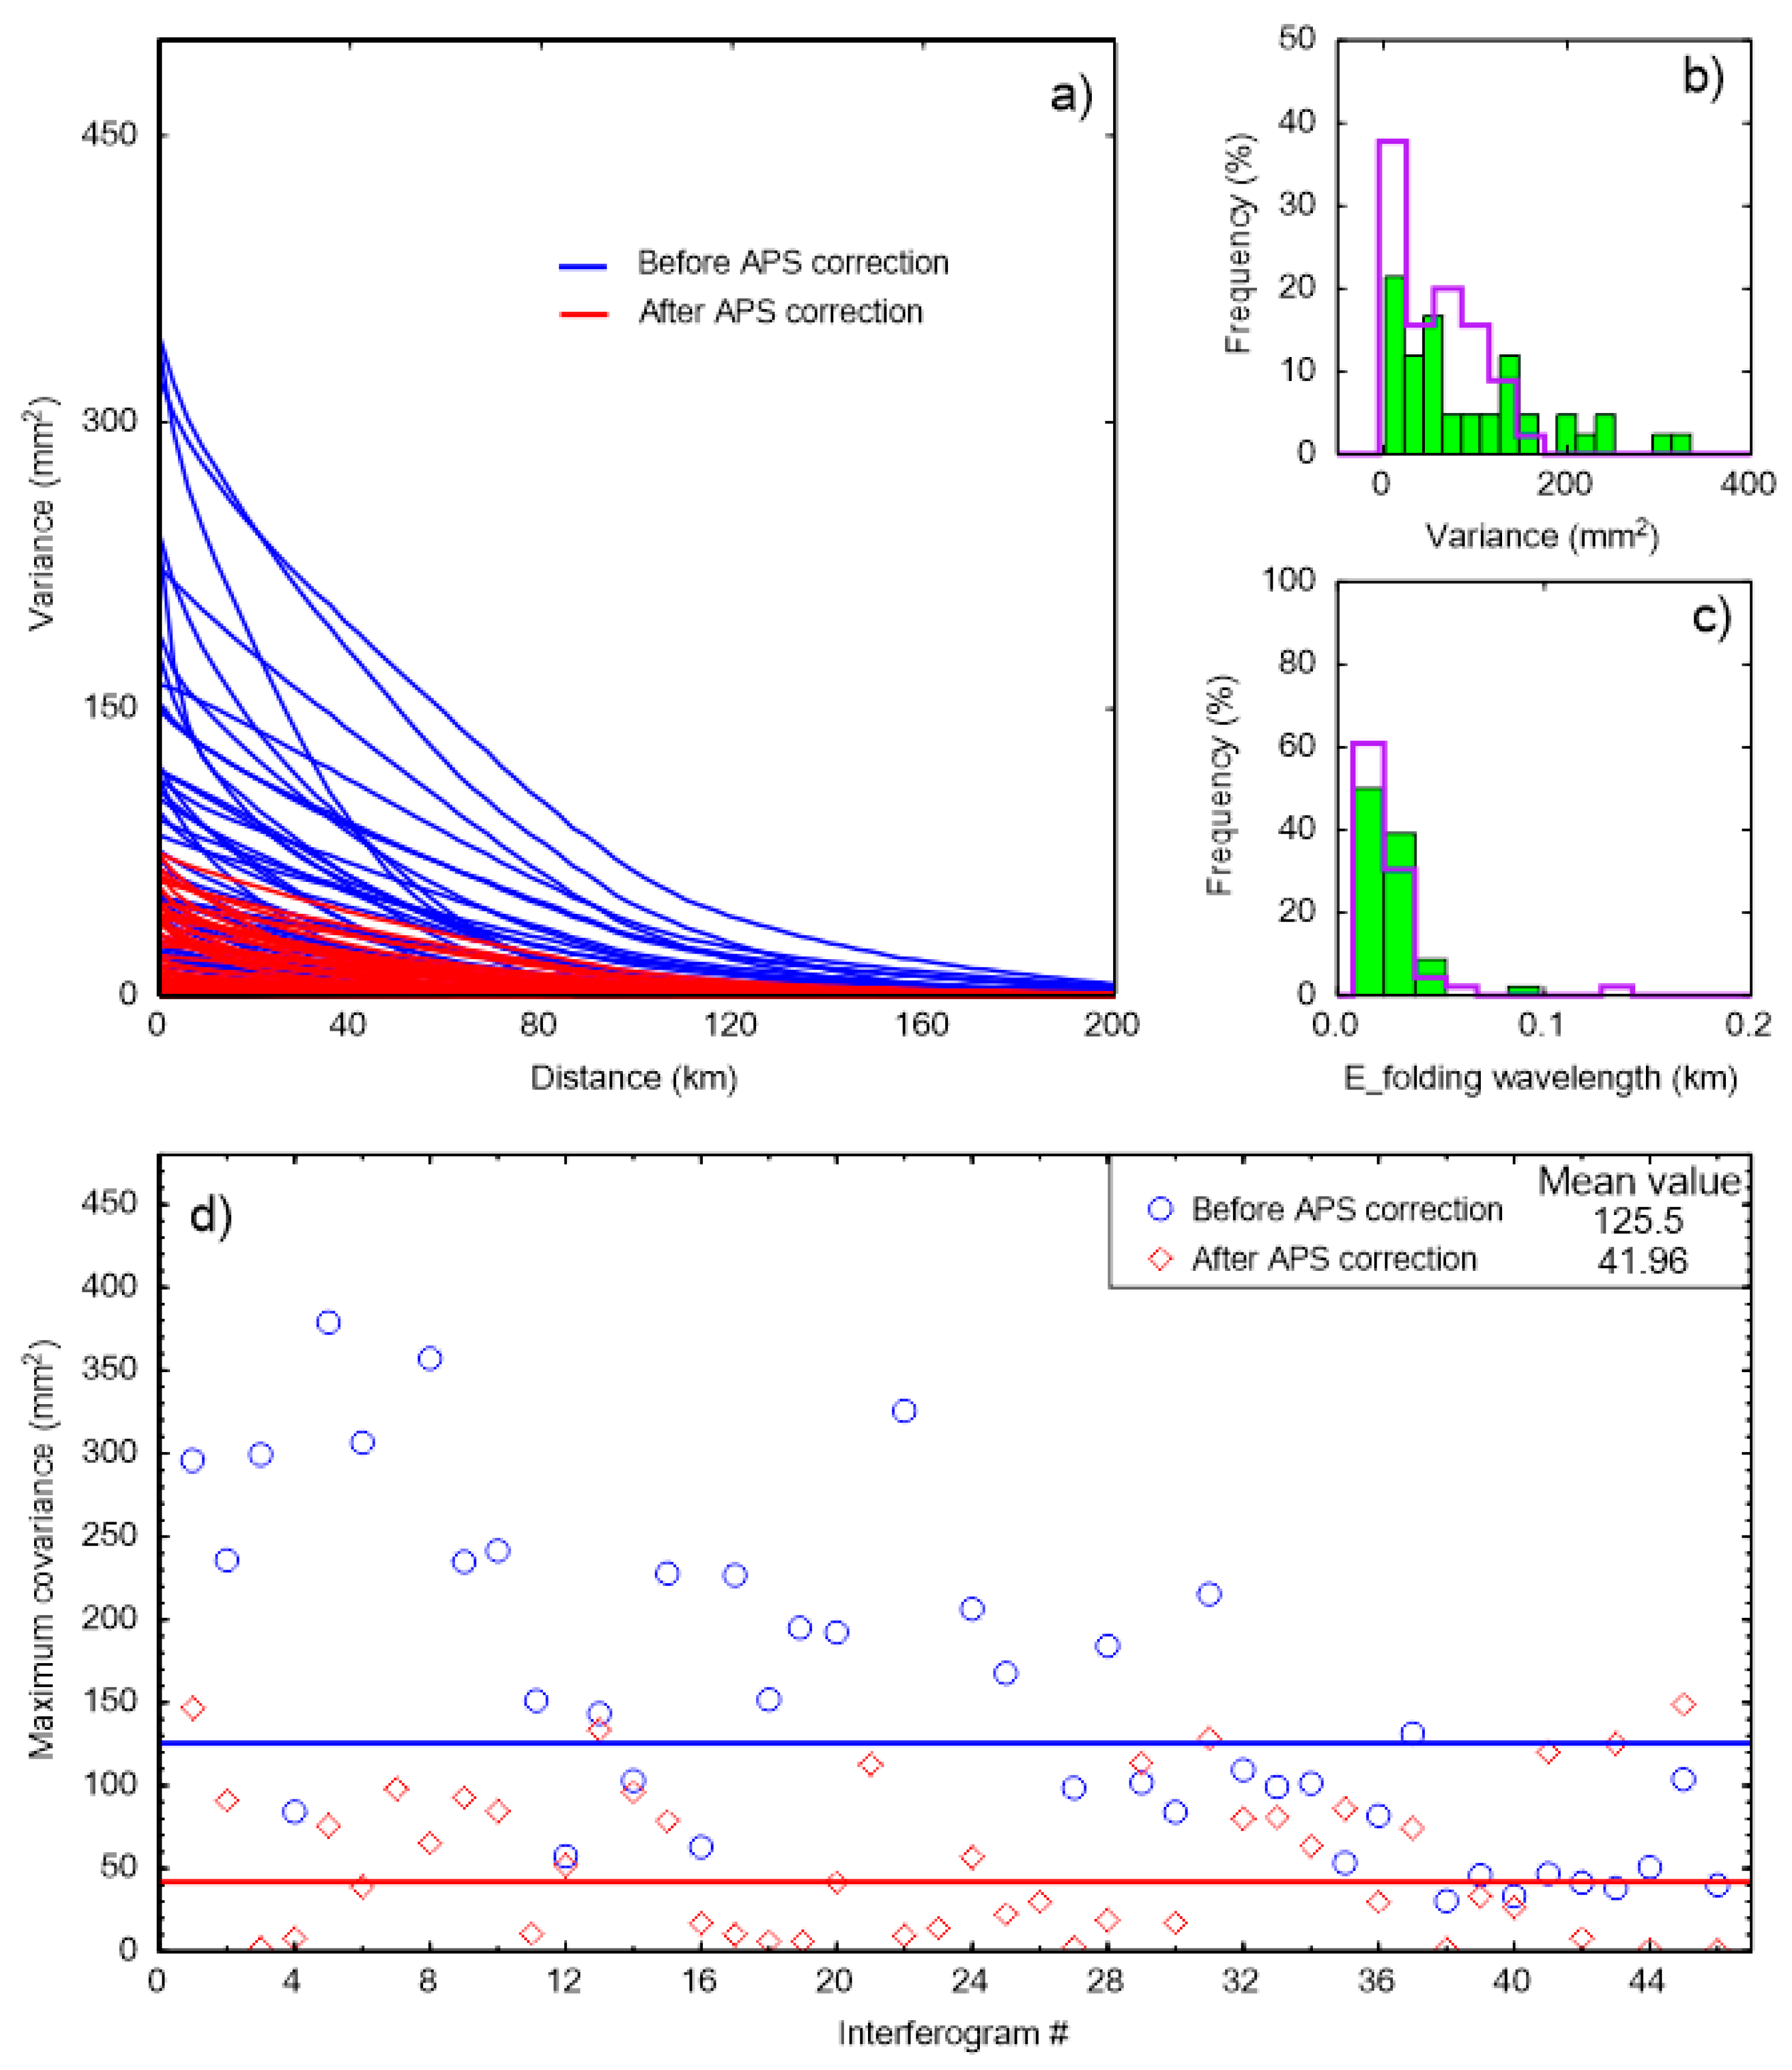
3.2. Methods of Velocity Map Estimation

Because of the limitations of decorrelation especially in the near field of the KF, we choose those interferograms with coherent signal across the fault for further processing. The number of selected interferograms on the five tracks used in this study is shown in Table 1. The severe incoherence is mainly caused by geometrical decorrelation (caused by larger perpendicular baselines), snow at high altitudes, lakes on the south side of the fault, and steep terrain particularly in the Eastern Kunlun mountain area (Figure 1b). The selected interferograms are checked for unwrapping errors by a phase closure technique on a pixel-by-pixel basis [42], and those pixels with unwrapping error are excluded from our analysis. After this step, there are still two major phase errors, orbital ramp and atmospheric delay errors, affecting the extraction of tectonic signals in further analysis [42,43,44,45]. We use the Poly-Interferogram Rate and Time-series Estimator (π-RATE) software, a package using a network-based approach to remove and mitigate various phase errors in interferograms [45]. We derive short-term postseismic velocity maps for six periods following the KKEQ on each InSAR track covering six sections along the 2001 surface rupture. The process of velocity map estimation and time series analysis on the basis of phase error correction can be described in four steps:
Step 1. Orbital Error Correction
Residual orbital ramps dominate the phase signal in the correctly unwrapped interferograms due to the imprecise orbit information (Figure 3). Long-wavelength components of postseismic deformation phase can be erroneously removed in the correction of orbit error, hence the extent or magnitude of postseismic deformation may be aliased at this stage. There are two proposed methods employed in previous studies to address this problem: (1) using an a priori velocity model constructed by GPS data, subtracting the simulated deformation field (generated by this velocity map and interferometric time spans) from each interferogram before orbit error correction, and then adding it back before estimating the final velocity map [19,26]; (2) defining a ‘far-field’ area in the interferogram without obvious tectonic deformation signal and using this region to re-estimate the baseline parameters [42,45]. Considering that we can find a true far-field with little postseismic signal on both ends of the long swaths, we choose the second method in efforts to remove the orbital contribution (Figure 3). We apply a quadratic orbital correction to five ~400 km long InSAR tracks. Linear ramp corrections have also been tested but provide a relatively poor fit to our data, as has been reported elsewhere [26,46]. Note that in addition to orbital errors, this correction will remove long-wavelength components of atmospheric phase delay.
Step 2. Atmospheric Error Correction
The atmospheric delay contribution, commonly referred to as atmospheric phase screen (APS), is divided into a turbulent component (non-topography-related atmospheric error) and stratified component (topography-related atmospheric error). The turbulent component with shorter wavelength shows the behavior of variation in both the temporal and spatial domains. The stratified component shows a strong correlation with the topography due to varying thickness of the tropospheric layer [47], in which case it can be modeled and mitigated by empirical phase-elevation correction methods using a linear regression algorithm [47,48]. We use an empirical phase-elevation correction by calculating a single linear function between the phase and the SRTM DEM based on the network approach proposed by Elliott et al. [43] to remove the topography-related atmospheric error. Then, we apply a spatiotemporal filter to mitigate the non-topography-related atmospheric disturbances. Here, the spatiotemporal filter consists of a Gaussian temporal filter with length 0.5 yr and a Butterworth spatial filter with an adaptive window size constrained by variance and covariance using a best fit 1-D covariance exponential function [49]: cij = σ2e−dij , where cij is the covariance between two pixels i and j, σ2 is the variance, dij is the distance between pixels, and α is a scaling constant. Subsequent data stacking is also helpful to reduce the atmospheric phase noise. This strategy is effective in significantly reducing the level of noise in interferograms (e.g., references [26,45,50]).
Figure 4 shows the 1-D covariance functions and maximum covariance for 46 interferograms on track 176 before and after APS correction. The mean variance and e-folding wavelength are 165 mm2 and 0.05 km before APS estimation (Figure 4b,c) and 84 mm2 and 0.04 km after APS estimation, respectively. We find a considerable reduction in average maximum covariance from 125.5 to 41.96 after APS correction.
Step 3. Rate Map Estimation
According to data availability, we divide all the corrected interferograms on each track into several groups corresponding to different periods after the KKEQ to detect temporal variations and spatial patterns along different sections of the 2001 rupture zone. Here we compute the average velocities for the whole observation period and six sub-periods to capture the temporal variations. We obtain the spatiotemporal sequence of postseismic velocity fields by stacking all the corrected interferograms in various periods. The stacking algorithm is performed for each pixel even if it is not always coherent in the interferograms, which can ensure more InSAR velocity measurements in high mountainous regions especially in the nearfield of the KF. A weighted least squares inversion is applied to derive the best fit velocity and its uncertainties for each pixel in the interferograms [45]. This procedure is weighted by a variance-covariance matrix that defines the temporal and spatial correlation between interferograms [42]. We choose to remove unreliable pixels from the velocity maps that have less coherent observations than a defined number of independent epochs (stacking for the whole period: 8–12, for the sub-periods: 3–8). We also excluded the pixels with RMS misfits greater than an a priori value, here 3–4 mm/yr.
Step 4. Time Series Construction
Next, we calculate the temporal change of the cumulative postseismic displacements following the KKEQ using a timeseries algorithm. Track 133 has the best coherence among all five tracks over the whole study period (2003–2010), and has a large number of available interferograms, allowing for further timeseries analysis. Therefore, we choose T133 to investigate the time and distance dependences of the postseismic deformation near the moment centroid of the KKEQ (Figure 1b). Some error sources, such as residual atmospheric errors, decorrelation or thermal noise, may still remain in the corrected interferograms and further smoothing is essential to mitigate that phase noise [18,51]. The LOS observations in each interferogram and its corresponding start and end date are used to invert incremental displacement relative to a reference time (the earliest start date of all acquisitions) by a smoothed least-squares approach [51]. A temporal Laplacian smoothing operator is introduced to better constrain the time series:
[ G γ 2 ] [ v ] = [ d 0 ]
where 2 is a finite difference approximation of the Laplacian smoothing operator, γ is temporal smoothing factor, G and v are constructed from the time-spans and the mean velocities between consecutive acquisition dates of all interferograms. Here, we choose to constrain the smoothness of the velocities between the successive acquisitions rather than the incremental displacements because of our expectations of obtaining temporally smooth velocities even if the acquisition of SAR images is not evenly distributed. Then the inverted velocities are integrated over selected timespans to calculate the displacements at consecutive dates. The smoothing factor is determined by a trade-off curve of misfit versus solution roughness to obtain the best fit time series. We estimate exponentially decaying velocities based on an iterative weighted least squares method to gain a first order idea of the temporal decay of postseismic displacement [7,8,44].

4. Results

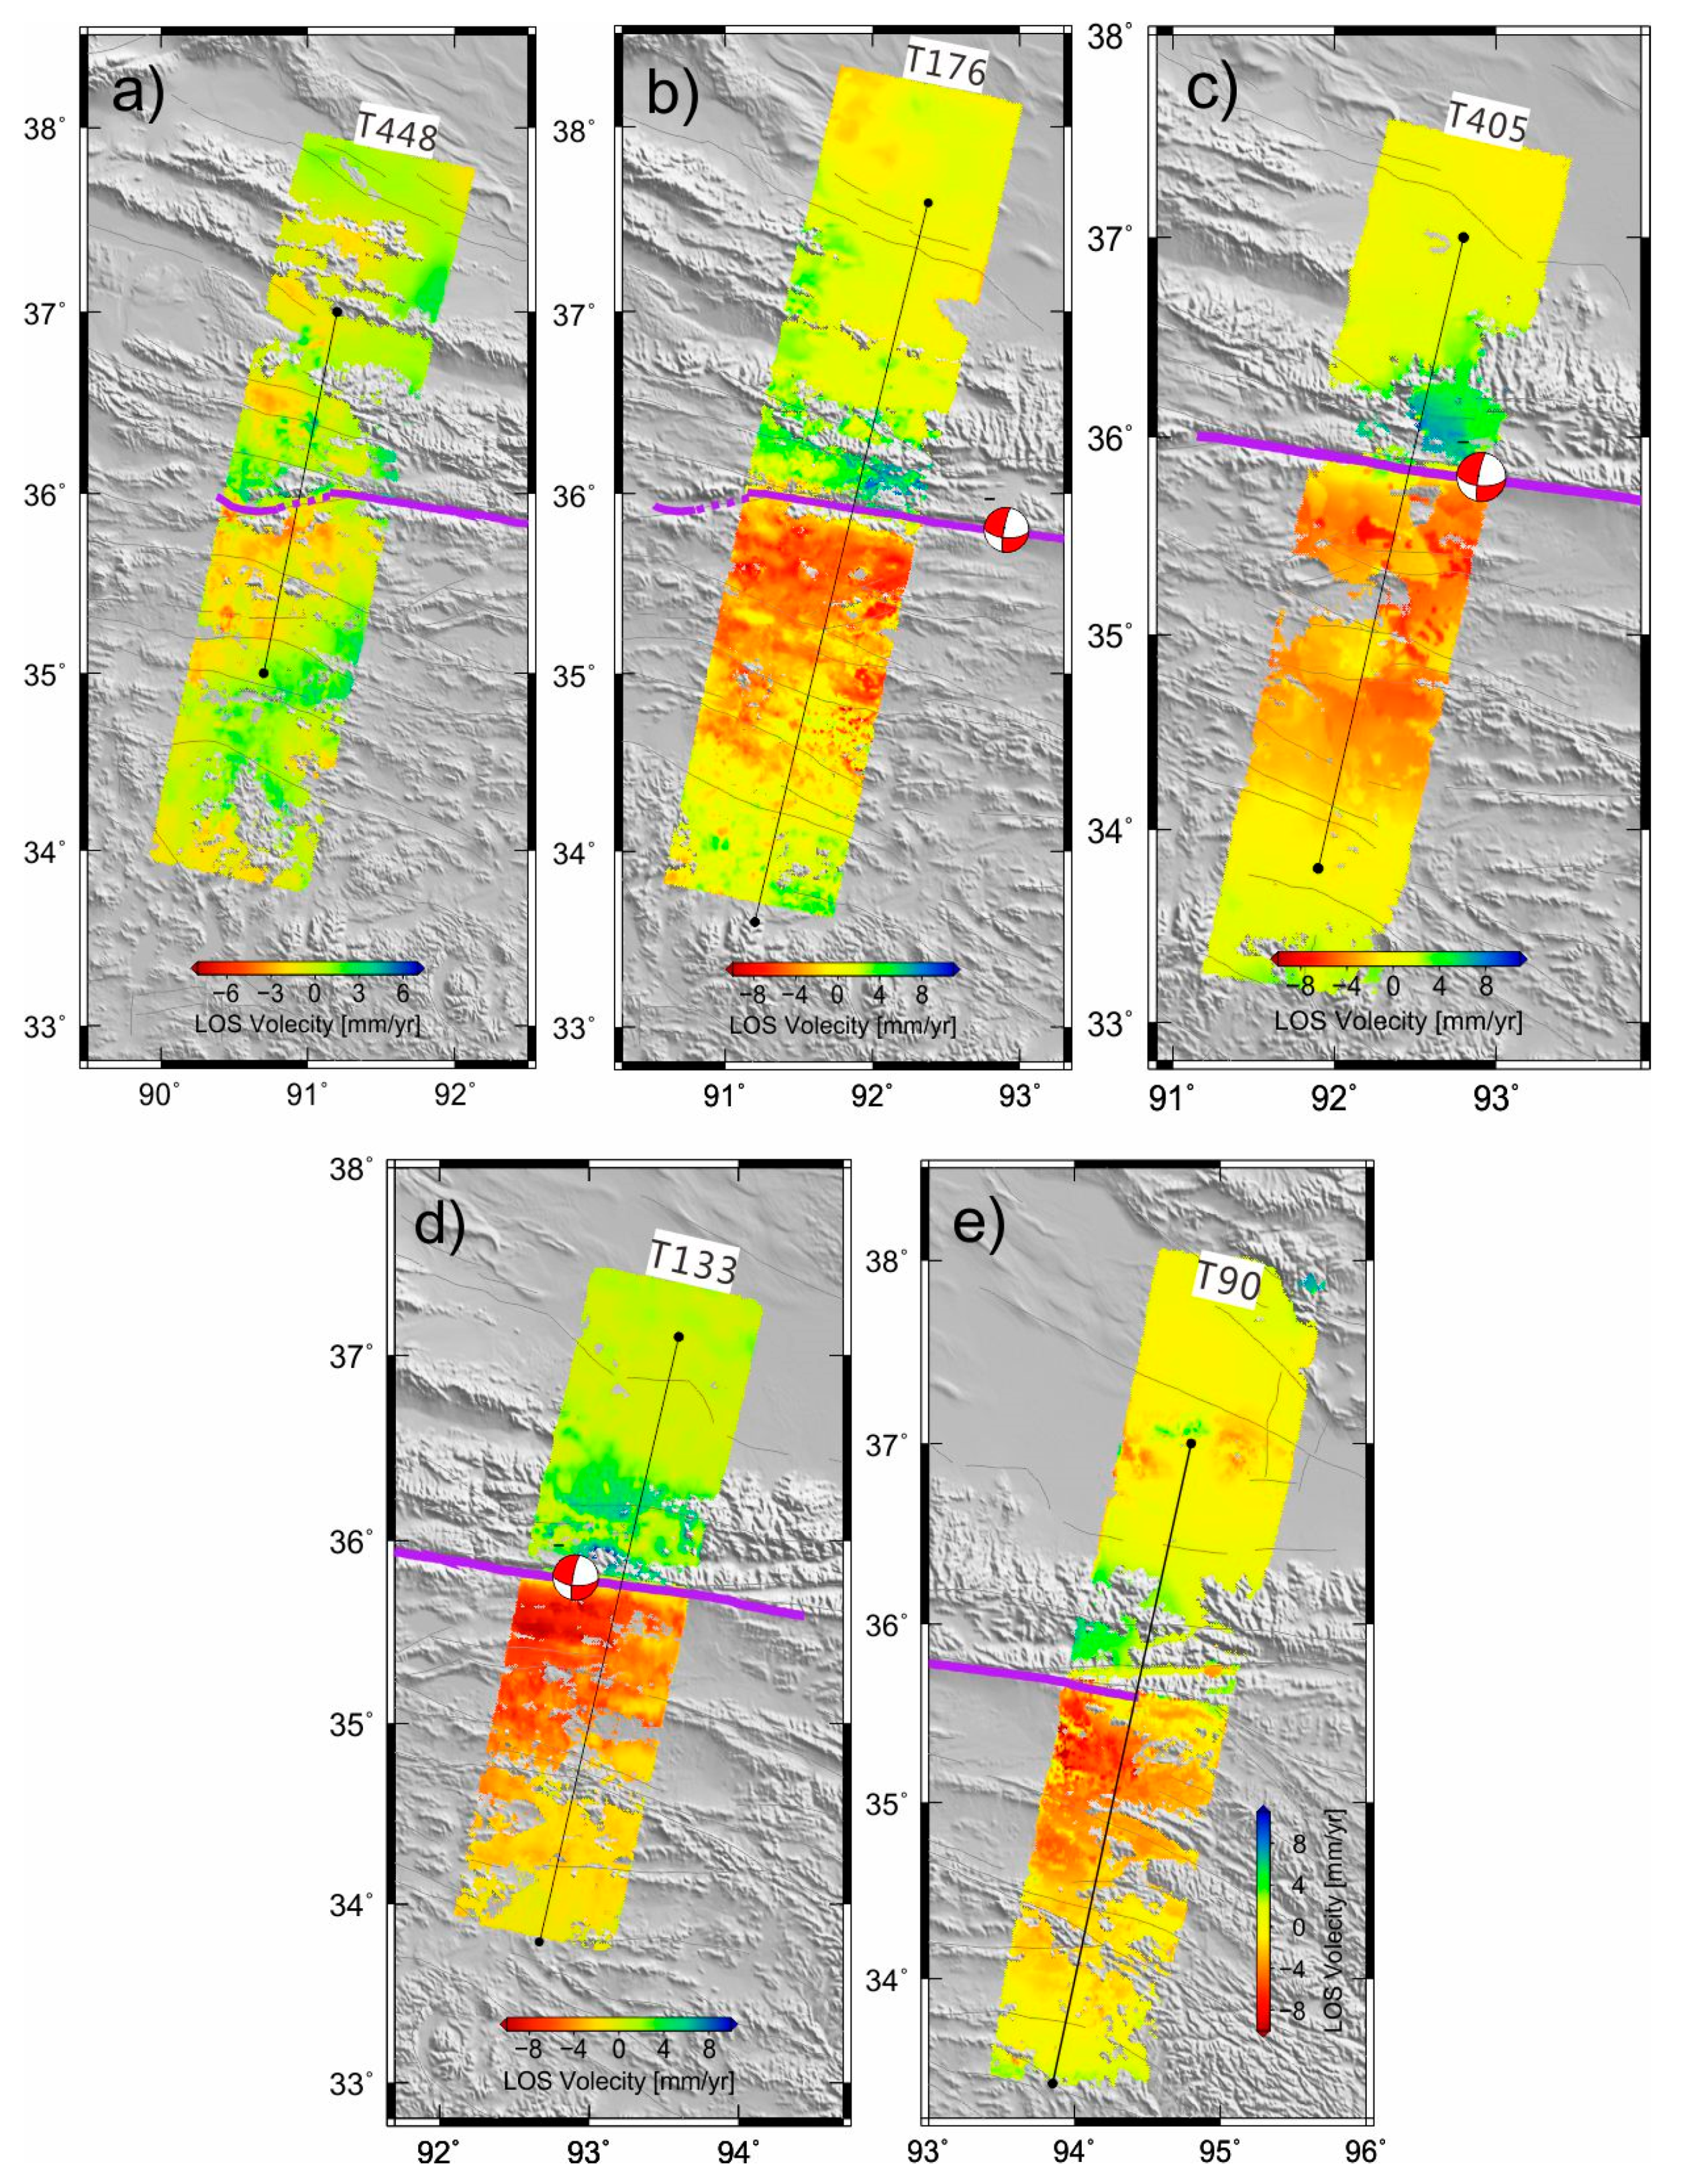
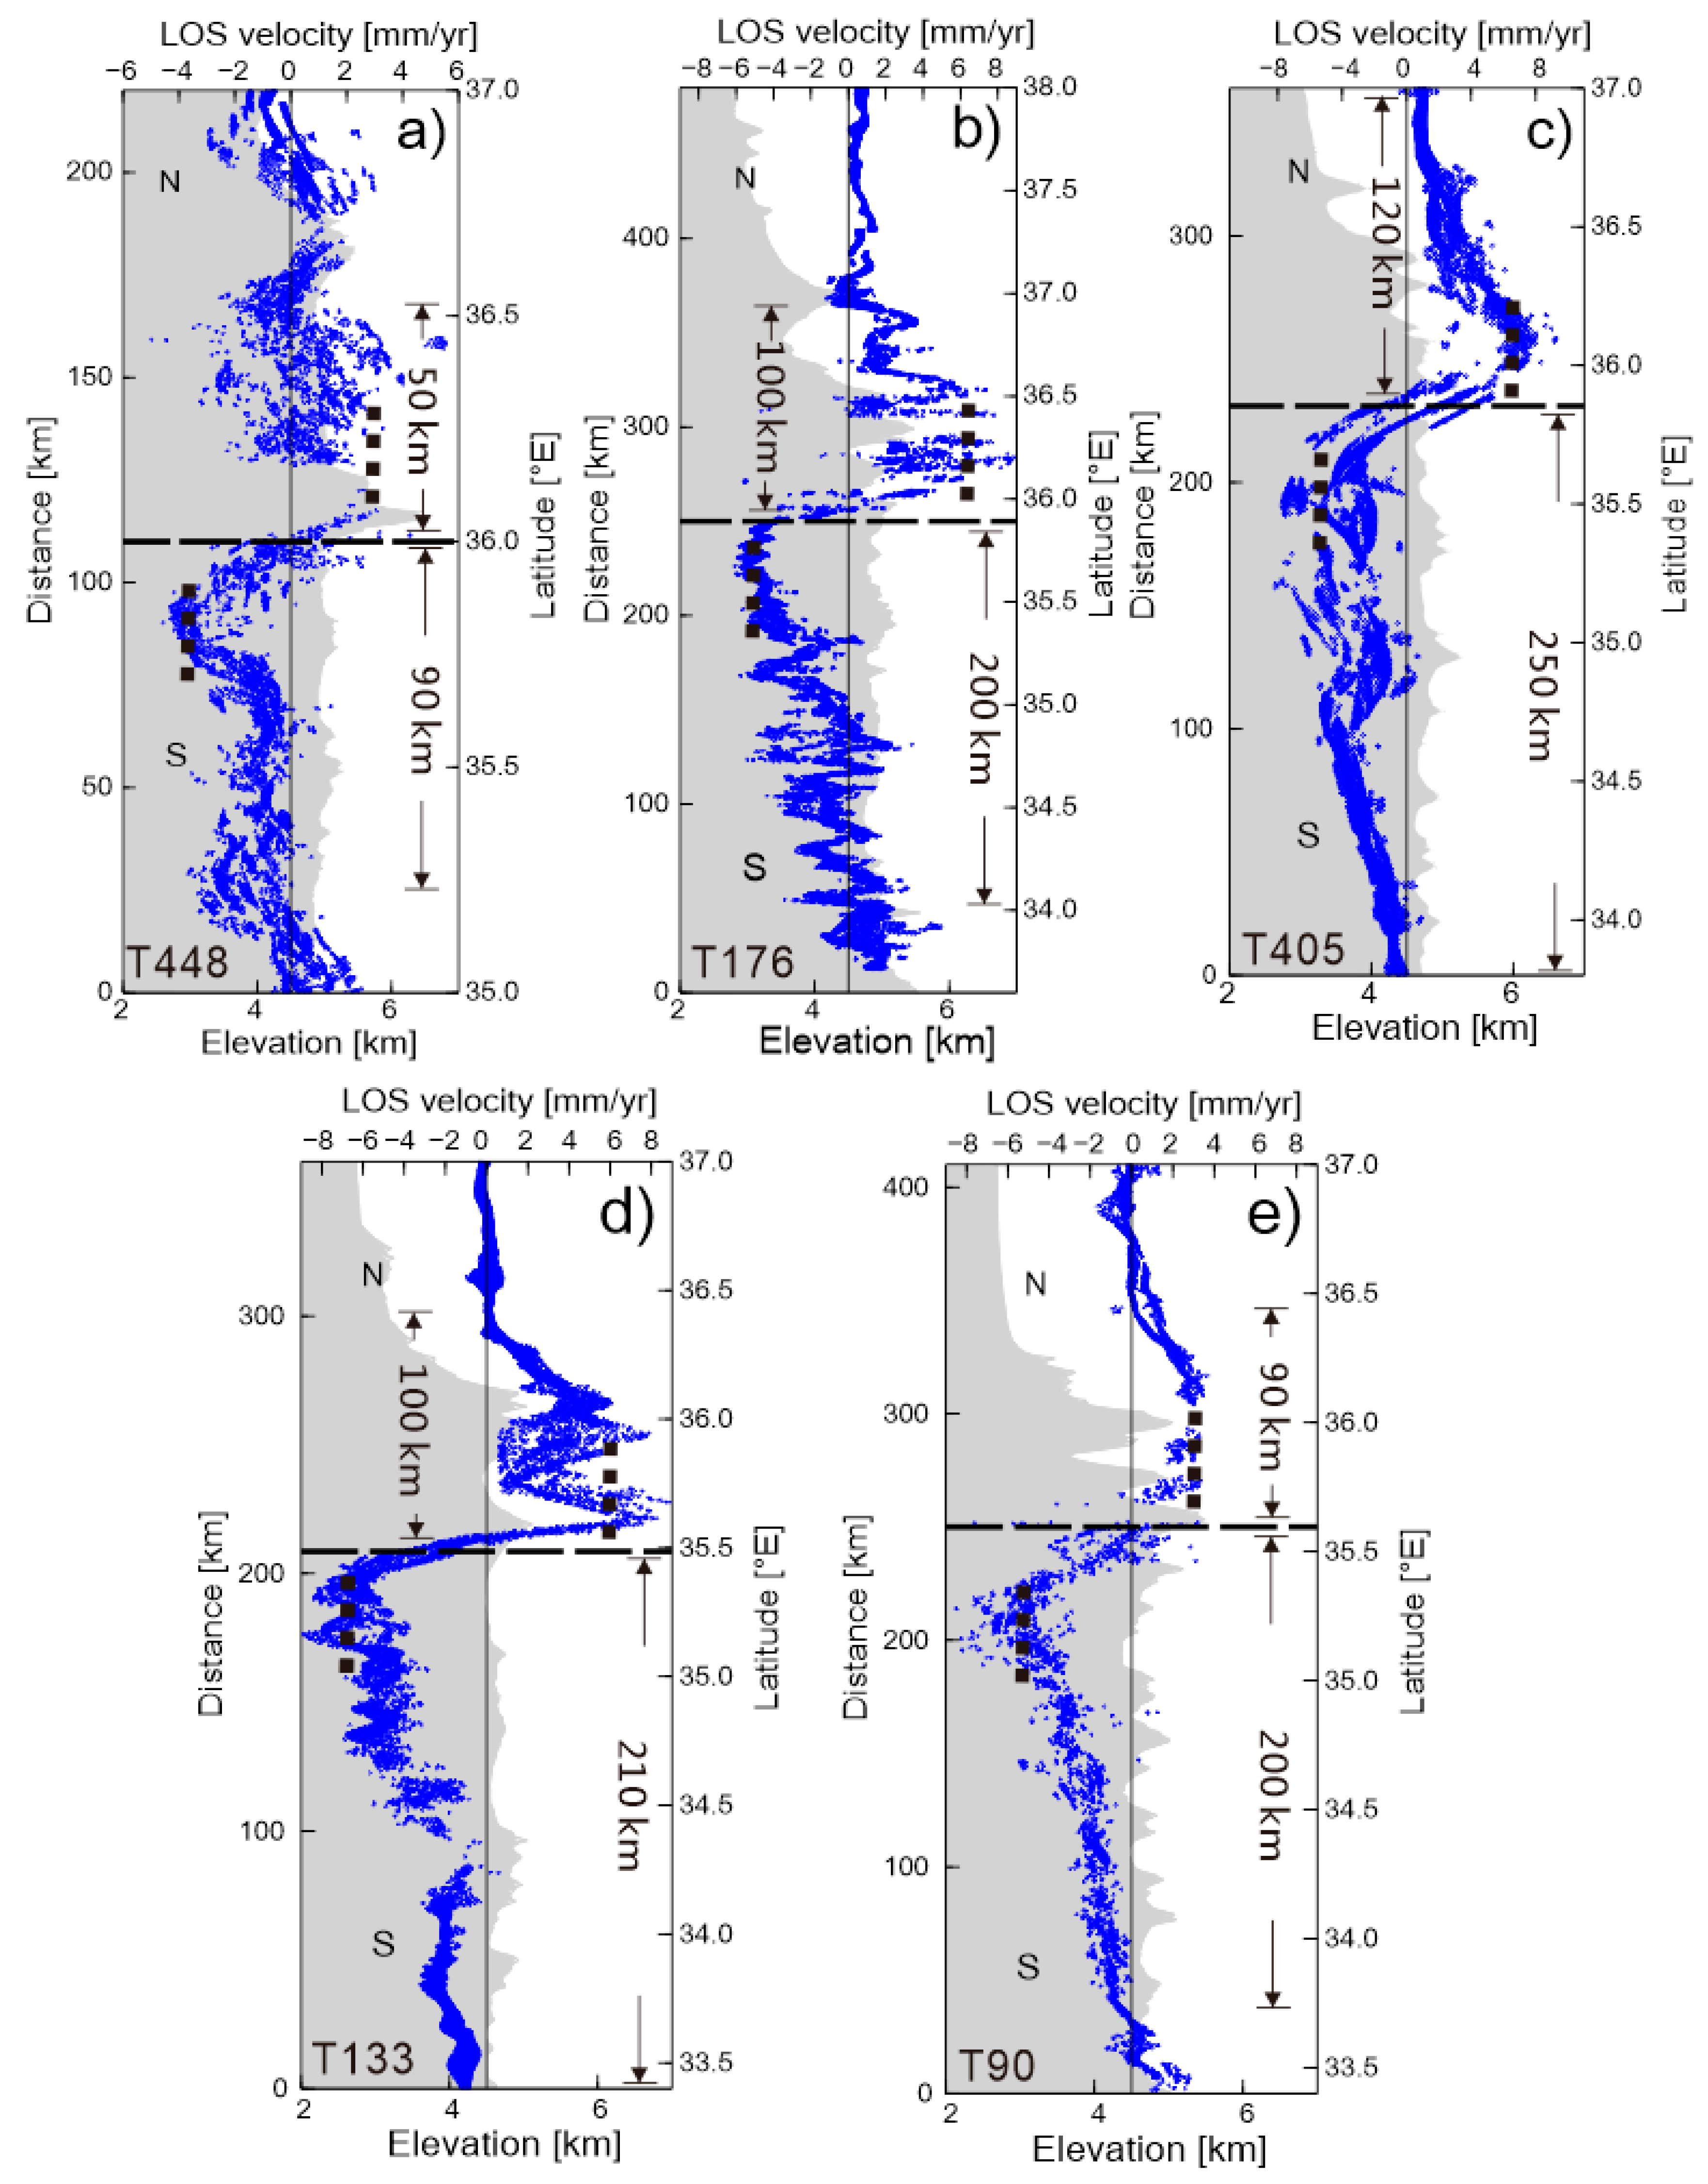
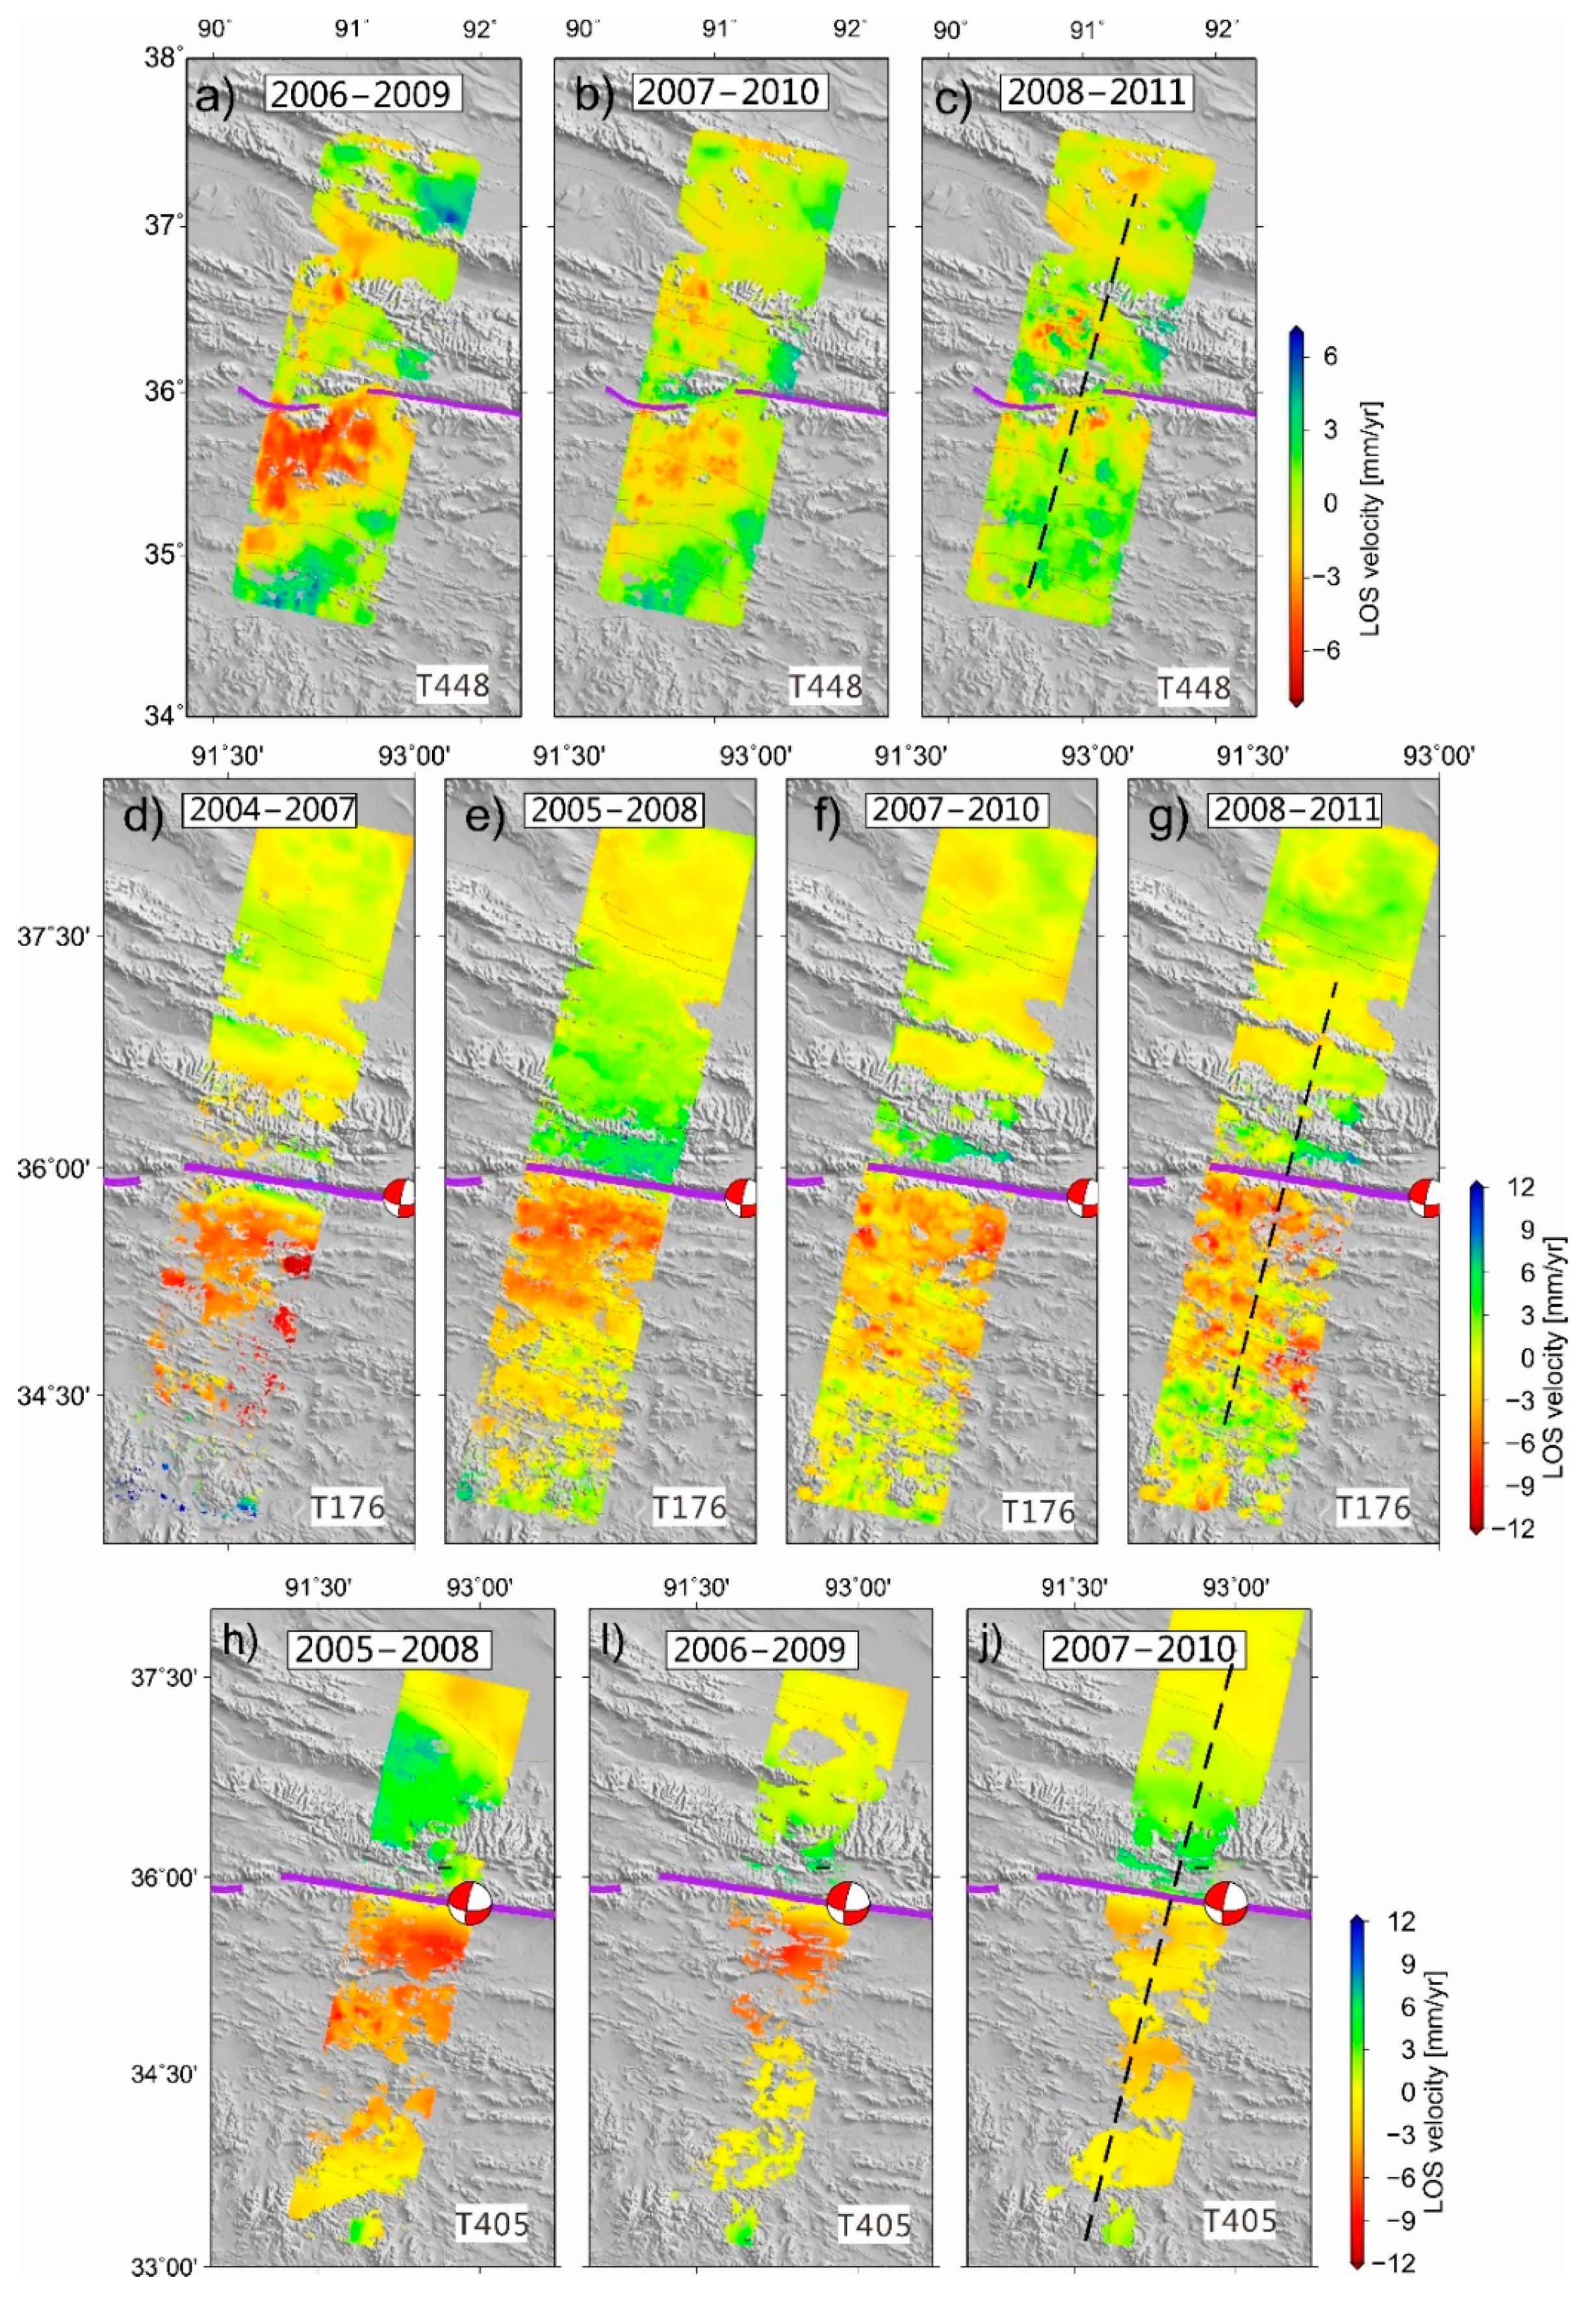
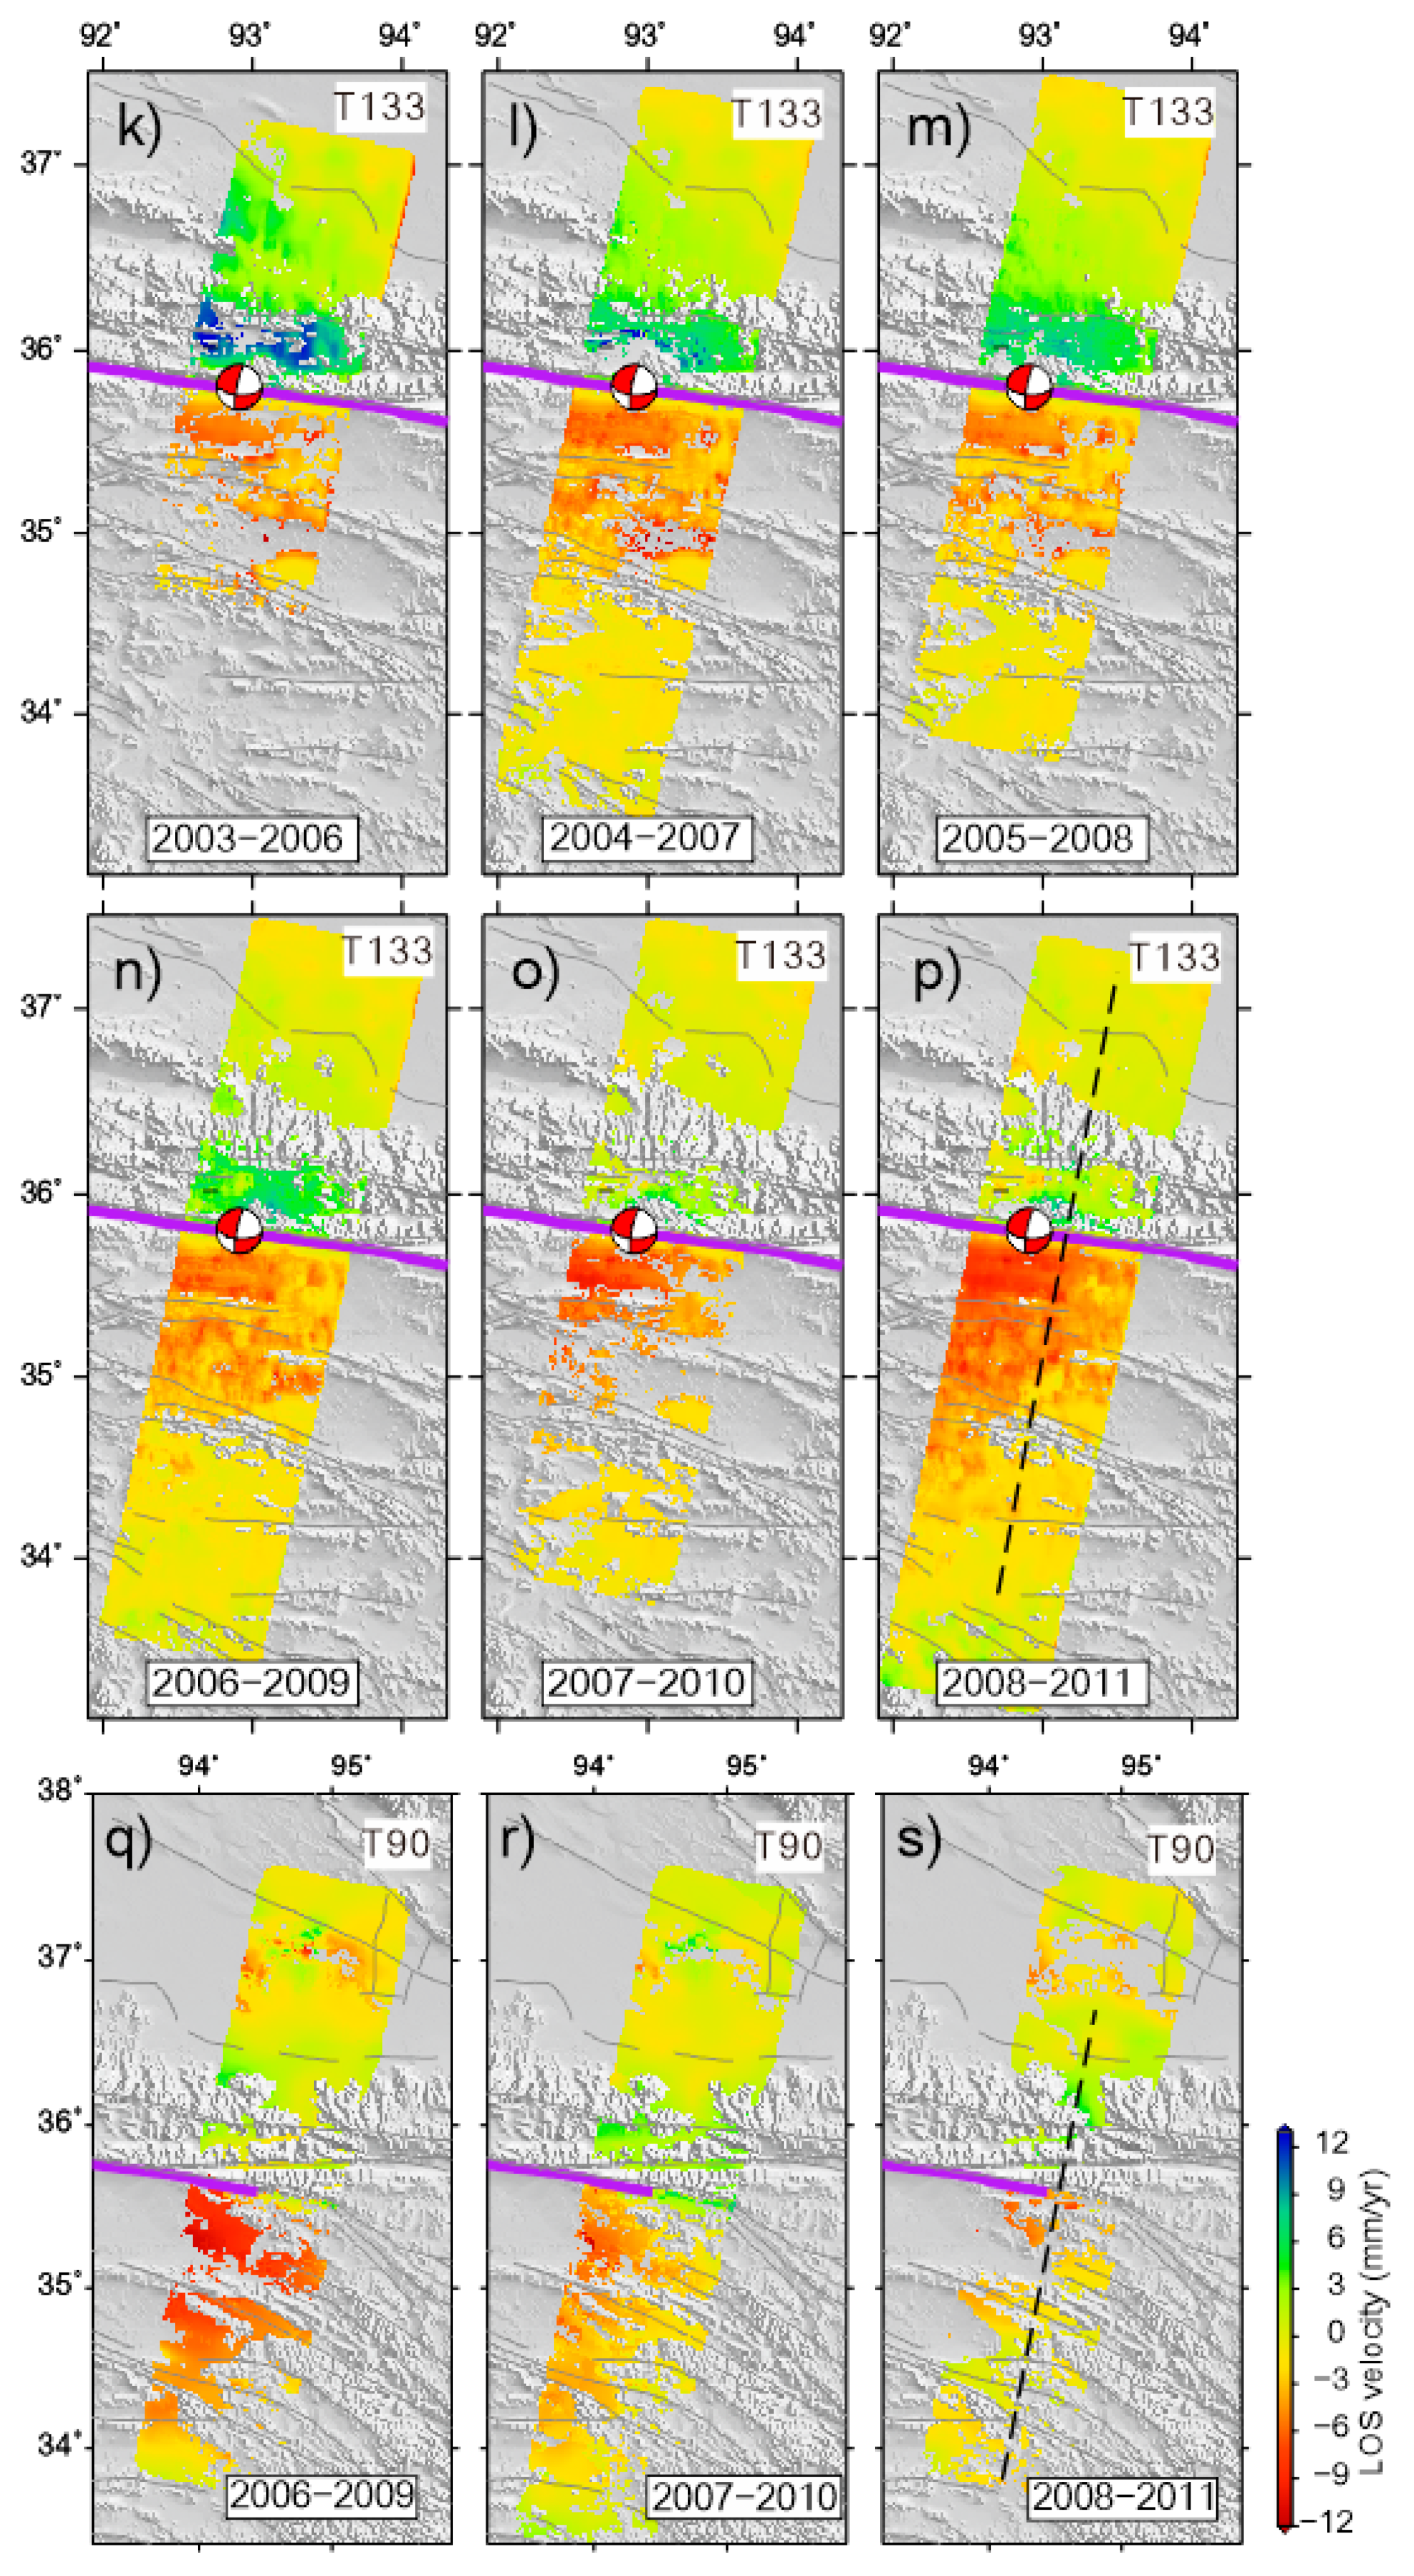
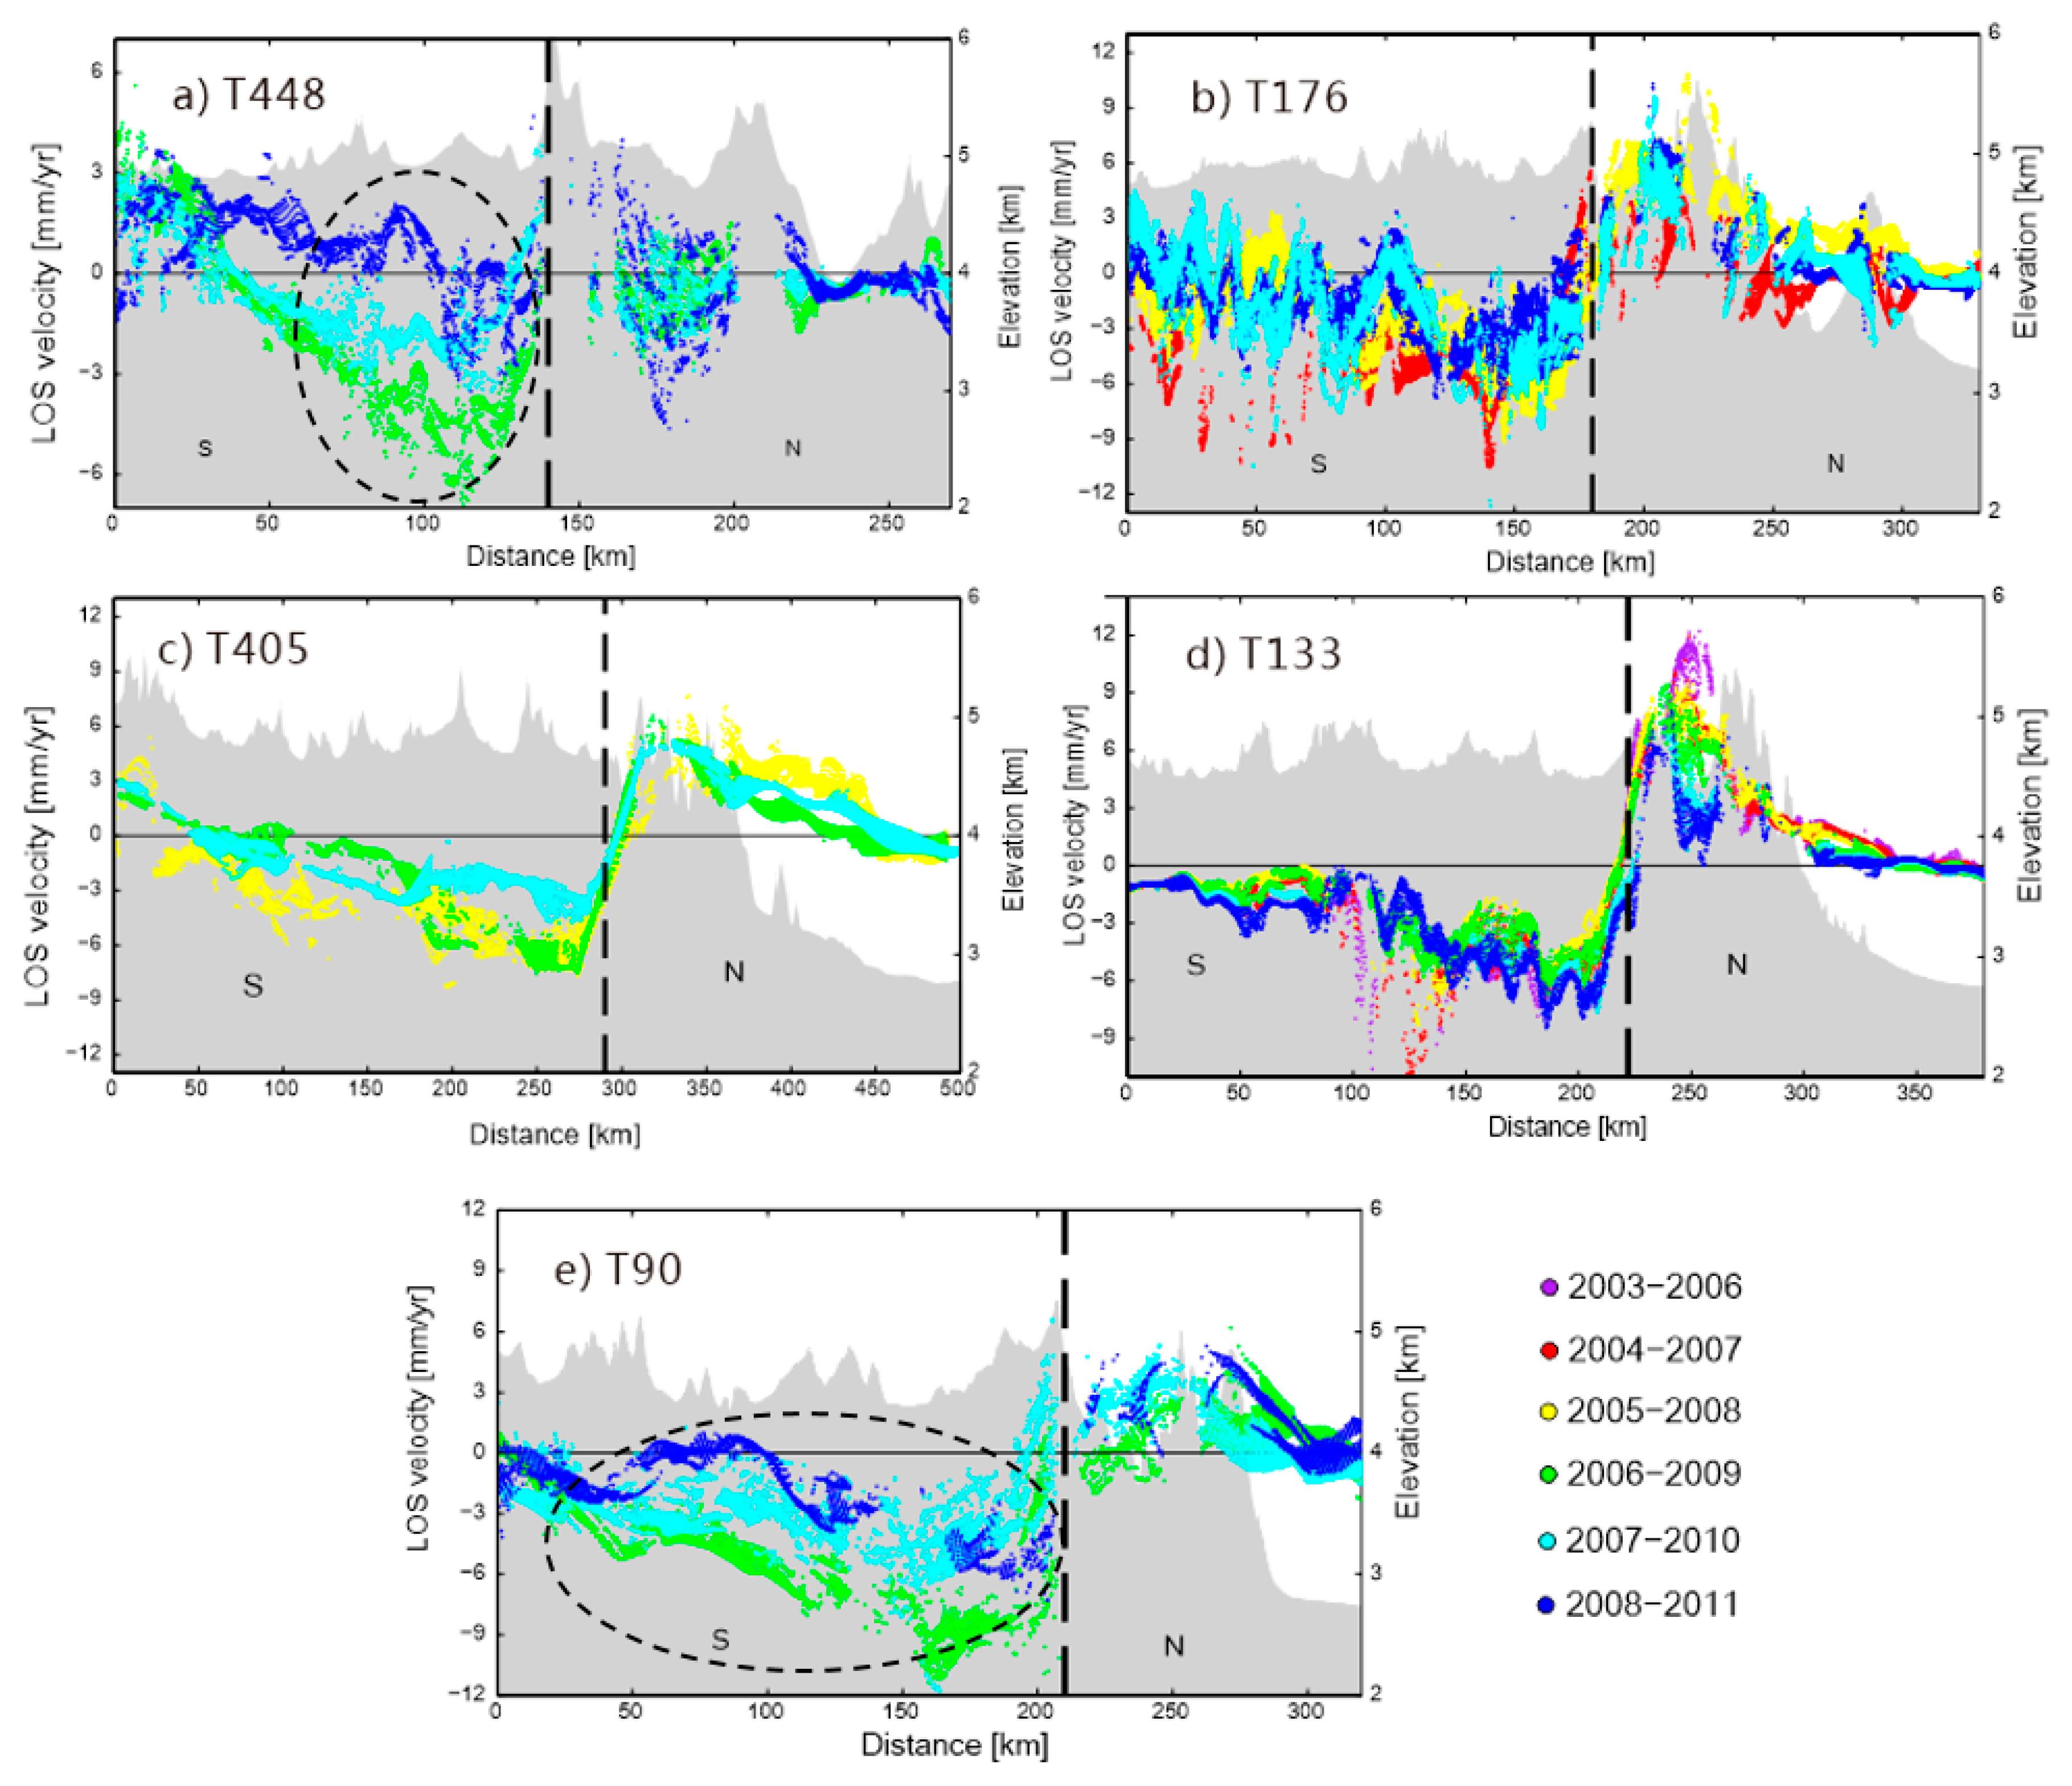
4.1. Postseismic Deformation Features in Different Fault Sections

We generate long-swath (100 km × 500 km) InSAR postseismic average velocity maps during the whole observation period and six sub-periods on five descending tracks (Figure 5, Figure 6, Figure 7 and Figure 8). These short-term and long-term velocity snapshots provide detailed knowledge of the deformation extent, distribution pattern and evolution process for the six sections along the 2001 rupture zone. As an exceptional case, only one interferogram during 2004–2007 on track 176 is involved (Table 2). The average-velocity image sequences shown in Figure 7 help us reconstruct deformation histories and clearly identify evolution characteristics for various sections along the 2001 rupture.
(1) 
The western end and the extensional corridor (T448)
This part of the fault is composed of the ~26-km-long western rupture section and the ~50 km extensional step-over corridor. The rupture initiated in the extensional corridor, but no surface expression of rupture is found in this pull-apart basin [10,52]. Correspondingly, the postseismic deformation here observed by T448 features a relatively weak and narrowly distributed signal on both sides of the fault (Figure 5a). The near-fault differential LOS rate revealed by the long-term LOS velocity map in 2003–2010 is 3–4 mm/yr at ~90.5°E, and the suggested width of the postseismic deformation zone at ~90.5°E is ~50 km and ~90 km on the northern and southern sides of the fault, respectively (Figure 6a).
We further resolve short-term postseismic displacement velocity maps on this track in three sub-periods of 2006–2009, 2007–2010 and 2008–2011 (Figure 7a–c). As shown in these maps of average velocities, the remarkable postseismic deformation is distributed on the south side of the fault covering both the west end and the extensional corridor, with a suggested deformation width of ~90 km. A relatively weak and narrow deformation zone in the northern part of the fault can also be identified. A rapid decay of postseismic deformation rates on the southern side of the fault can be clearly observed in the short-term deformation velocity sequences. We estimate the peak-to-trough velocity offset as ~4–6 mm/yr in the LOS direction during 2006–2009, then it decreases to ~2–3 mm/yr in 2007–2010 and ~1–2 mm/yr in 2008–2011 (Figure 8a).
(2) 
The Bukadaban Peak section (T176)
The Bukadaban Peak section is adjacent to the extensional corridor and experienced large horizontal left-lateral surface offsets of ~4.8 m during the coseismic rupture [10] (Figure 1b), hence the postseismic deformation is more obvious. The long-term postseismic deformation signal here, observed by T176, is more prominent and is characteristic of a much wider distribution on the south side of the fault (Figure 5b). The postseismic LOS peak-to-trough velocity offset of ~8–12 mm/yr across the fault is clearly observed around ~91.5°. A ~300-km-wide, ~100 km to the north and ~200 km to the south, deformation zone extends from the 34°N to 37°N (Figure 6b).
We derive four short-term postseismic velocity maps during 2004–2007, 2005–2008, 2007–2010 and 2008–2011 (Figure 7d–g). The deformation is dominated by the near-field postseismic signal across the fault over a broad area. The first-order feature of temporal decay of postseismic deformation is the evolution of the pattern of asymmetric deformation for the areas to the north and south of the fault. The deformation on the north side before 2008 (Figure 7e) shows a wider distribution and larger magnitude than that in subsequent periods, while the width of the deformation zone and the magnitude of the velocities in the south varies slightly (Figure 7 and 7). The velocity profiles (Figure 8b) across the fault exhibit high noise and magnitude fluctuations, and we do not identify the rapid postseismic velocity decay on the south side of the fault as observed in T448 (Figure 8a).
(3) 
The western Kusai section (T405)
The western Kusai section is located in the middle of the main rupture zone where the maximum coseismic horizontal displacement reached ~4.5 m [10]. The notable postseismic deformation measured by T405 during 2003–2010 is distributed over a much broader area in this section (Figure 5c) and it shows higher peak-to-trough velocity differences. The 20-km-wide profiles indicate that the postseismic LOS velocity differences across the fault reached ~12–14 mm/yr at ~92.5°E (Figure 6c). In addition, significant postseismic deformation decreases from near-field to far-field on both sides of the fault, producing a ~250-km-wide deformation zone to the south and ~120-wide-deformation zone to the north (Figure 6c).
We produced three postseismic velocity maps during 2005–2008, 2006–2009 and 2007–2010 on track 405 (Figure 7h–j). These short-term postseismic velocity maps display a similar behavior of asymmetric temporal evolution as observed on the Bukadaban Peek section on both sides of the fault, but the deformation zone seems to extend to greater distances than was seen for the Bukadaban Peek section. Profiles in all periods across the fault show peak-to-trough velocity differences of ~12–14 mm/yr at about 50–70 km from the fault (Figure 8c).
(4) 
The eastern Kusai section (T133)
The eastern Kusai segment is located near the GCMT moment centroid, where the coseismic deformation is the largest. The maximum left-lateral surface offset of ~7.6 m was measured by field investigation [10] and InSAR data suggest ~7 m of slip along this section [11], leading to the most significant postseismic motion here observed by T133 (Figure 5d). The profiles across the fault indicate that the 2003–2010 postseismic LOS velocities reached ~13–16 mm/yr at ~93°E (Figure 6d). This is the highest postseismic velocity gradient across the fault that we have measured in this study. The data suggest a ~210-km-wide deformation zone to the south and ~100-km-wide deformation zone to the north.
We were able to resolve six short-term postseismic velocity maps during 2003–2006, 2004–2007, 2005–2008, 2006–2009, 2007–2010 and 2008–2011 on track 133 in Figure 7k–p, respectively, revealing the entire temporal evolution for this region. Following the 2001 KKEQ, the eastern Kusai section experienced a gradual spatiotemporal decay of postseismic velocity to the south of the fault, whereas the northern part of the fault exhibits a relatively rapid decrease in postseismic rate (Figure 7). The comparison of the six period profiles (Figure 8d) suggests that the near-field postseismic velocity, ~5–8 mm/yr in the south side, is almost stable, while the near-field postseismic velocity on the north side of the fault decreases from ~6–8 mm/yr to ~4–6 mm/yr. Therefore, the postseismic deformation to the south side of the fault is still distributed over a large area in the later sub-periods of 2007–2010 and 2008–2011, while only a narrow zone of postseismic deformation is clearly visible north of the fault (Figure 7k–p).
(5) 
The Kunlun Pass section (T90)
The Kunlun Pass segment is located at the eastern termination of the rupture, and it presents a modest reverse component in addition to the dominant strike-slip during the coseismic rupture [10] (Figure 1b). The 2003–2010 postseismic deforming area observed by T90 on the south side is much broader than that on the north side (Figure 5e). We observe the gradual termination of the postseismic deformation along the 2001 rupture on the north side, while the postseismic deformation in the south appears to extend further eastward beyond the coverage of T90. Profiles across the fault reveal a maximum velocity gradient in the LOS direction across the fault of ~8–10 mm/yr. It also shows a width of the deformation zone of ~90 km and ~200 km on the north and south sides of the fault, respectively (Figure 6e).
We prepared three short-term postseismic velocity maps during 2006–2009, 2007–2010 and 2008–2011 on track 90 in Figure 7q–s, respectively. The velocity maps show an increasing loss of phase coherence due to the high elevation and steep terrain in this region (Figure 7q–s). The prominent feature is the rapid decay of both the magnitude and the extent of the postseismic velocities in the southern part in comparison to the northern part. We estimate near-fault velocity differences of 12–15 mm/yr around 95°E in 2006–2009, 6–8 mm/yr in 2007–2010, and 5–7 mm/yr in 2008–2011 (Figure 8e). This fast temporal decay behavior is similar to that observed in the westernmost section.

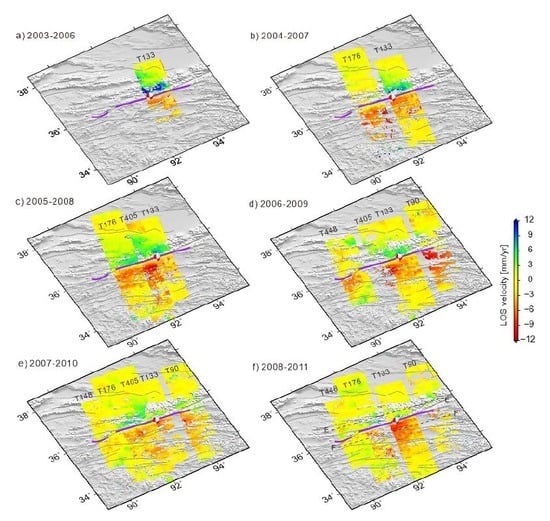
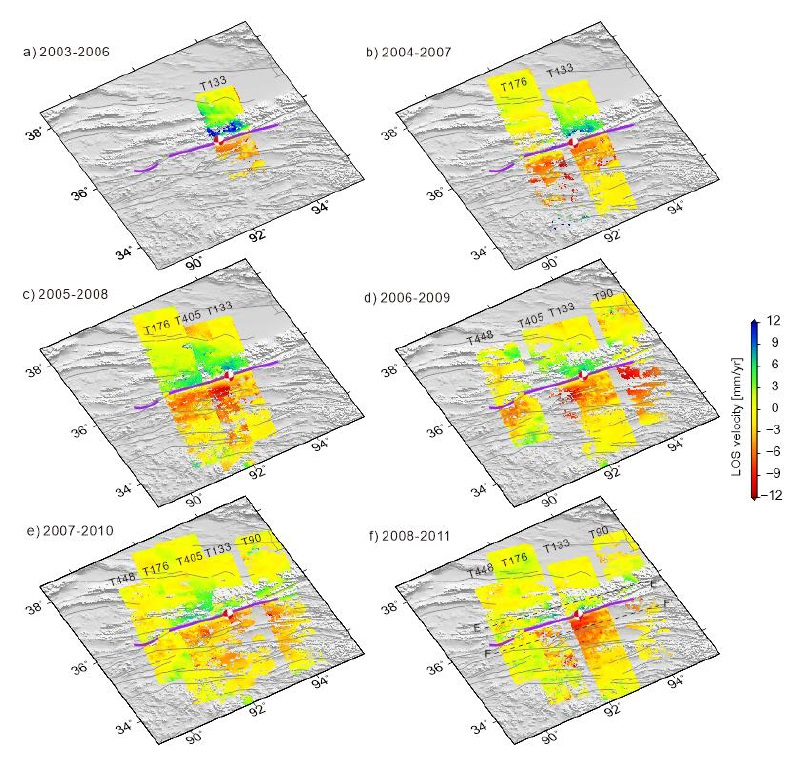
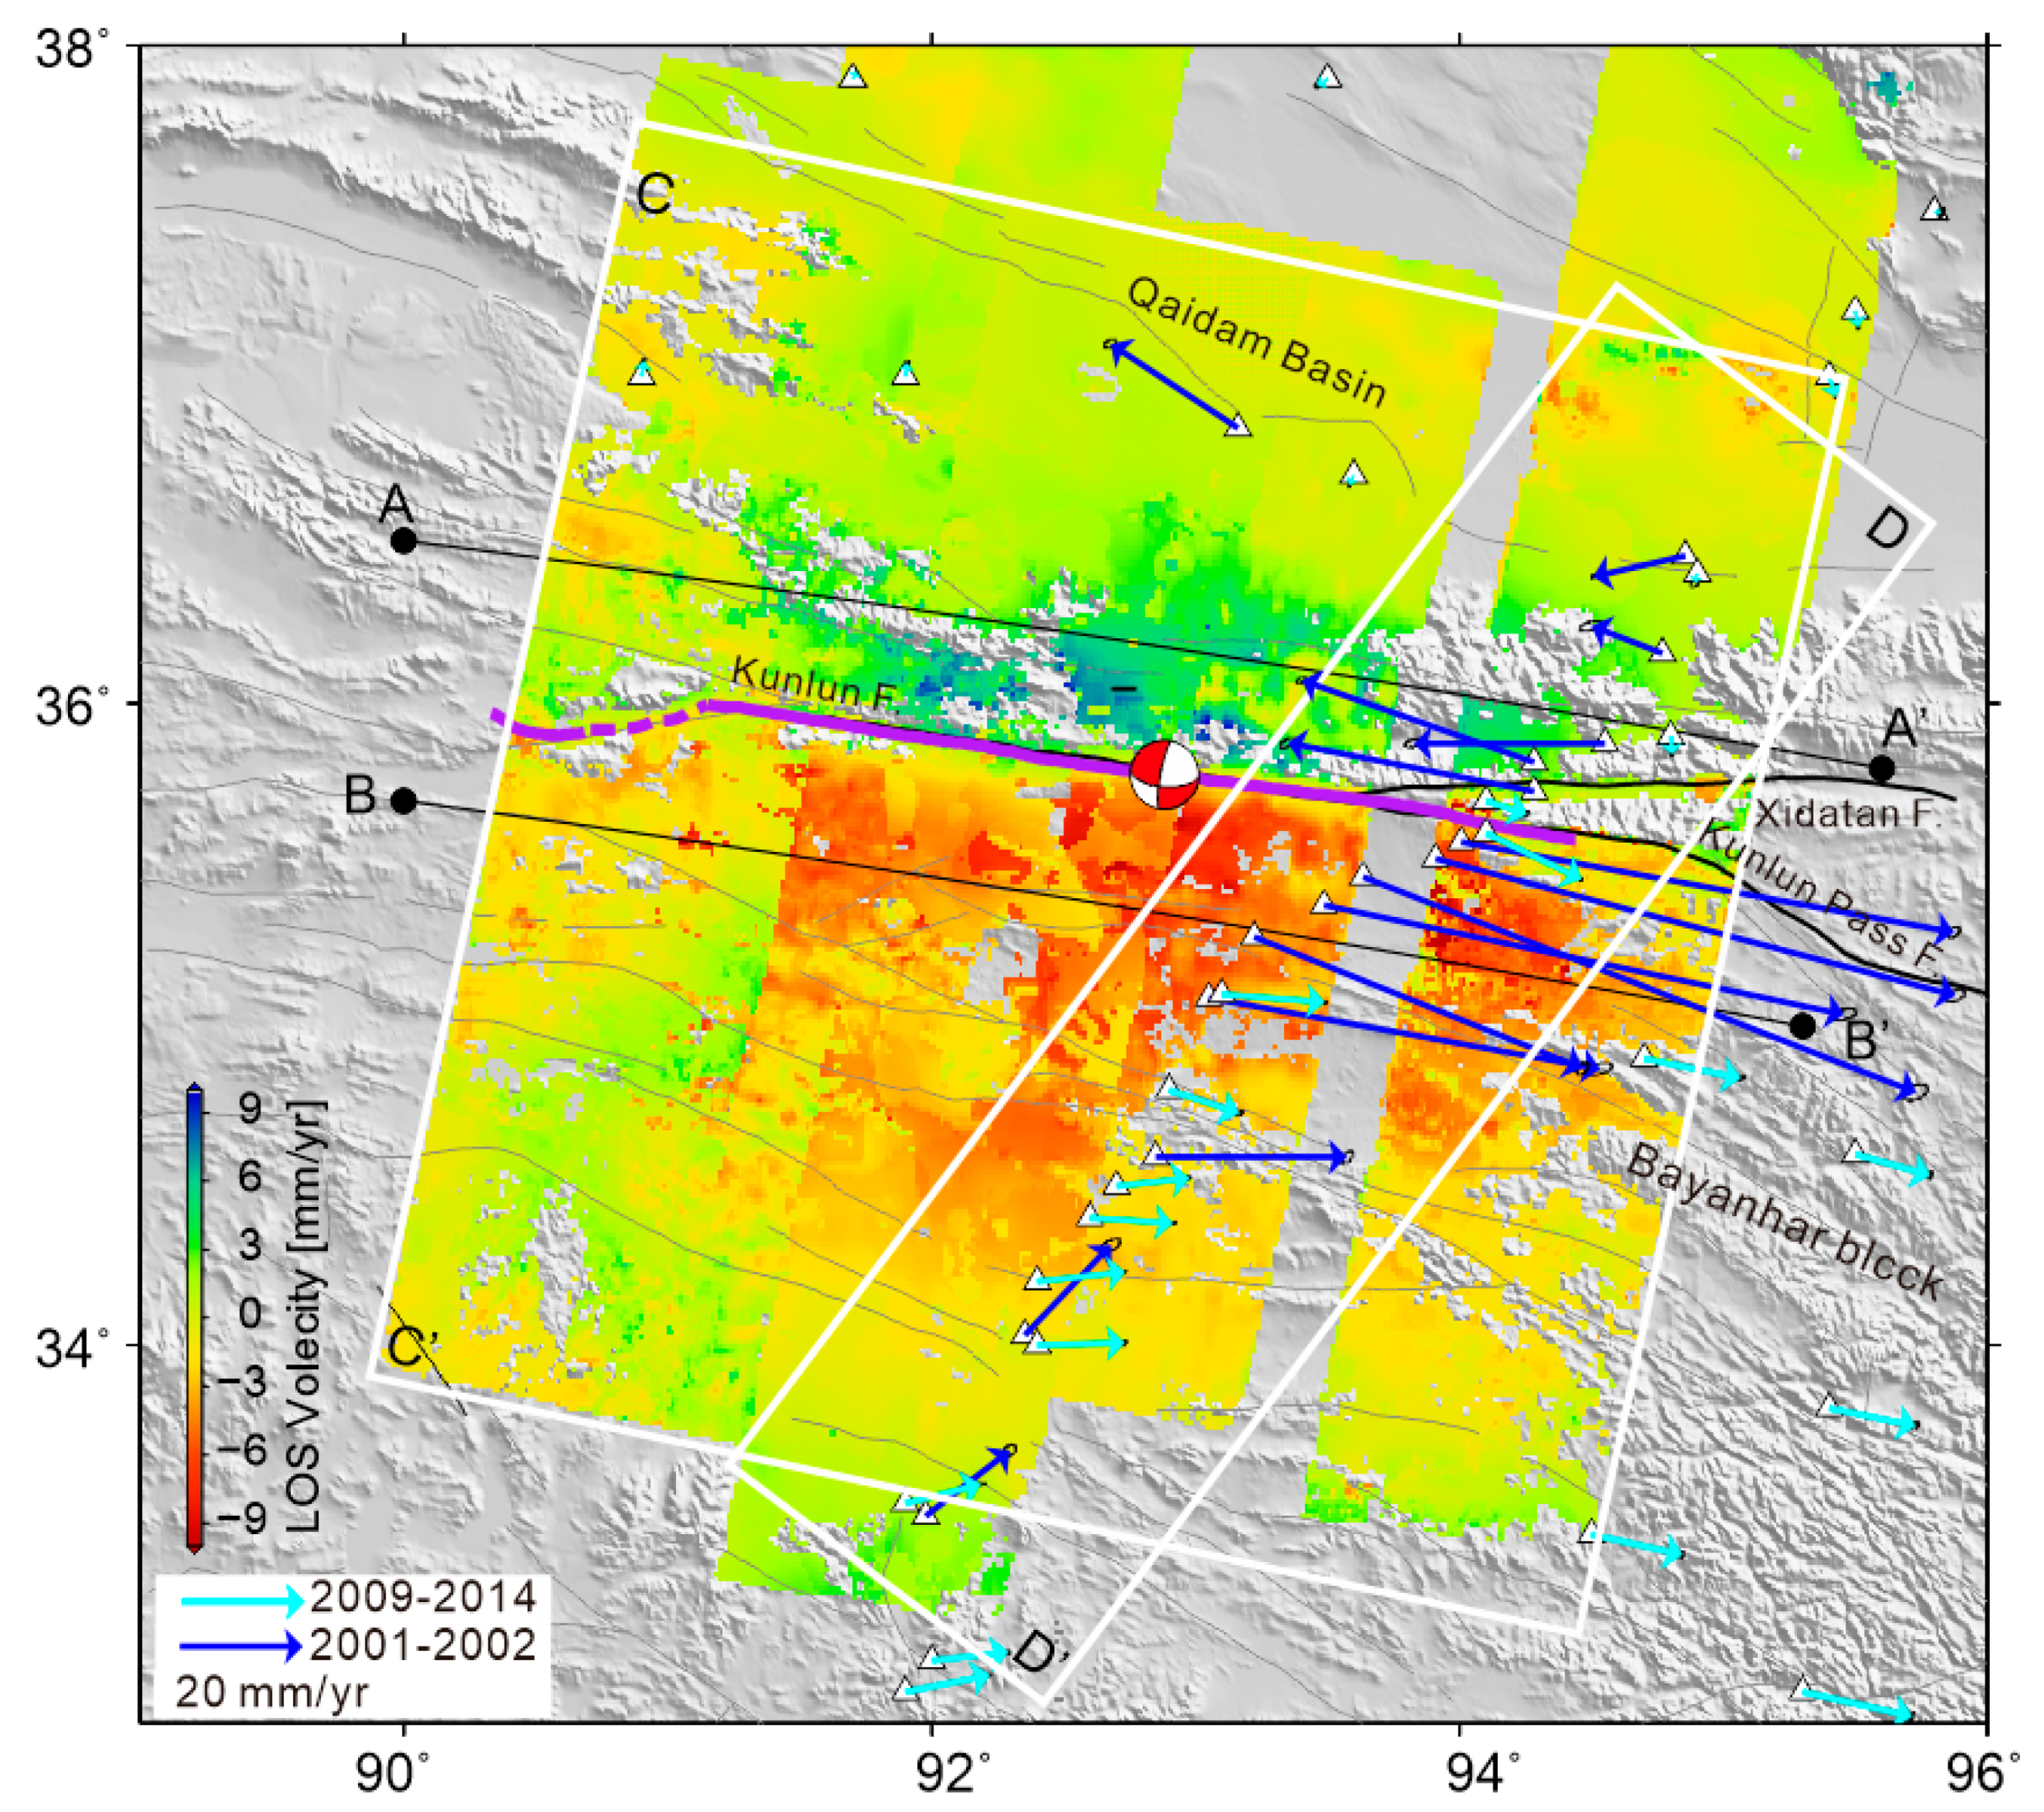
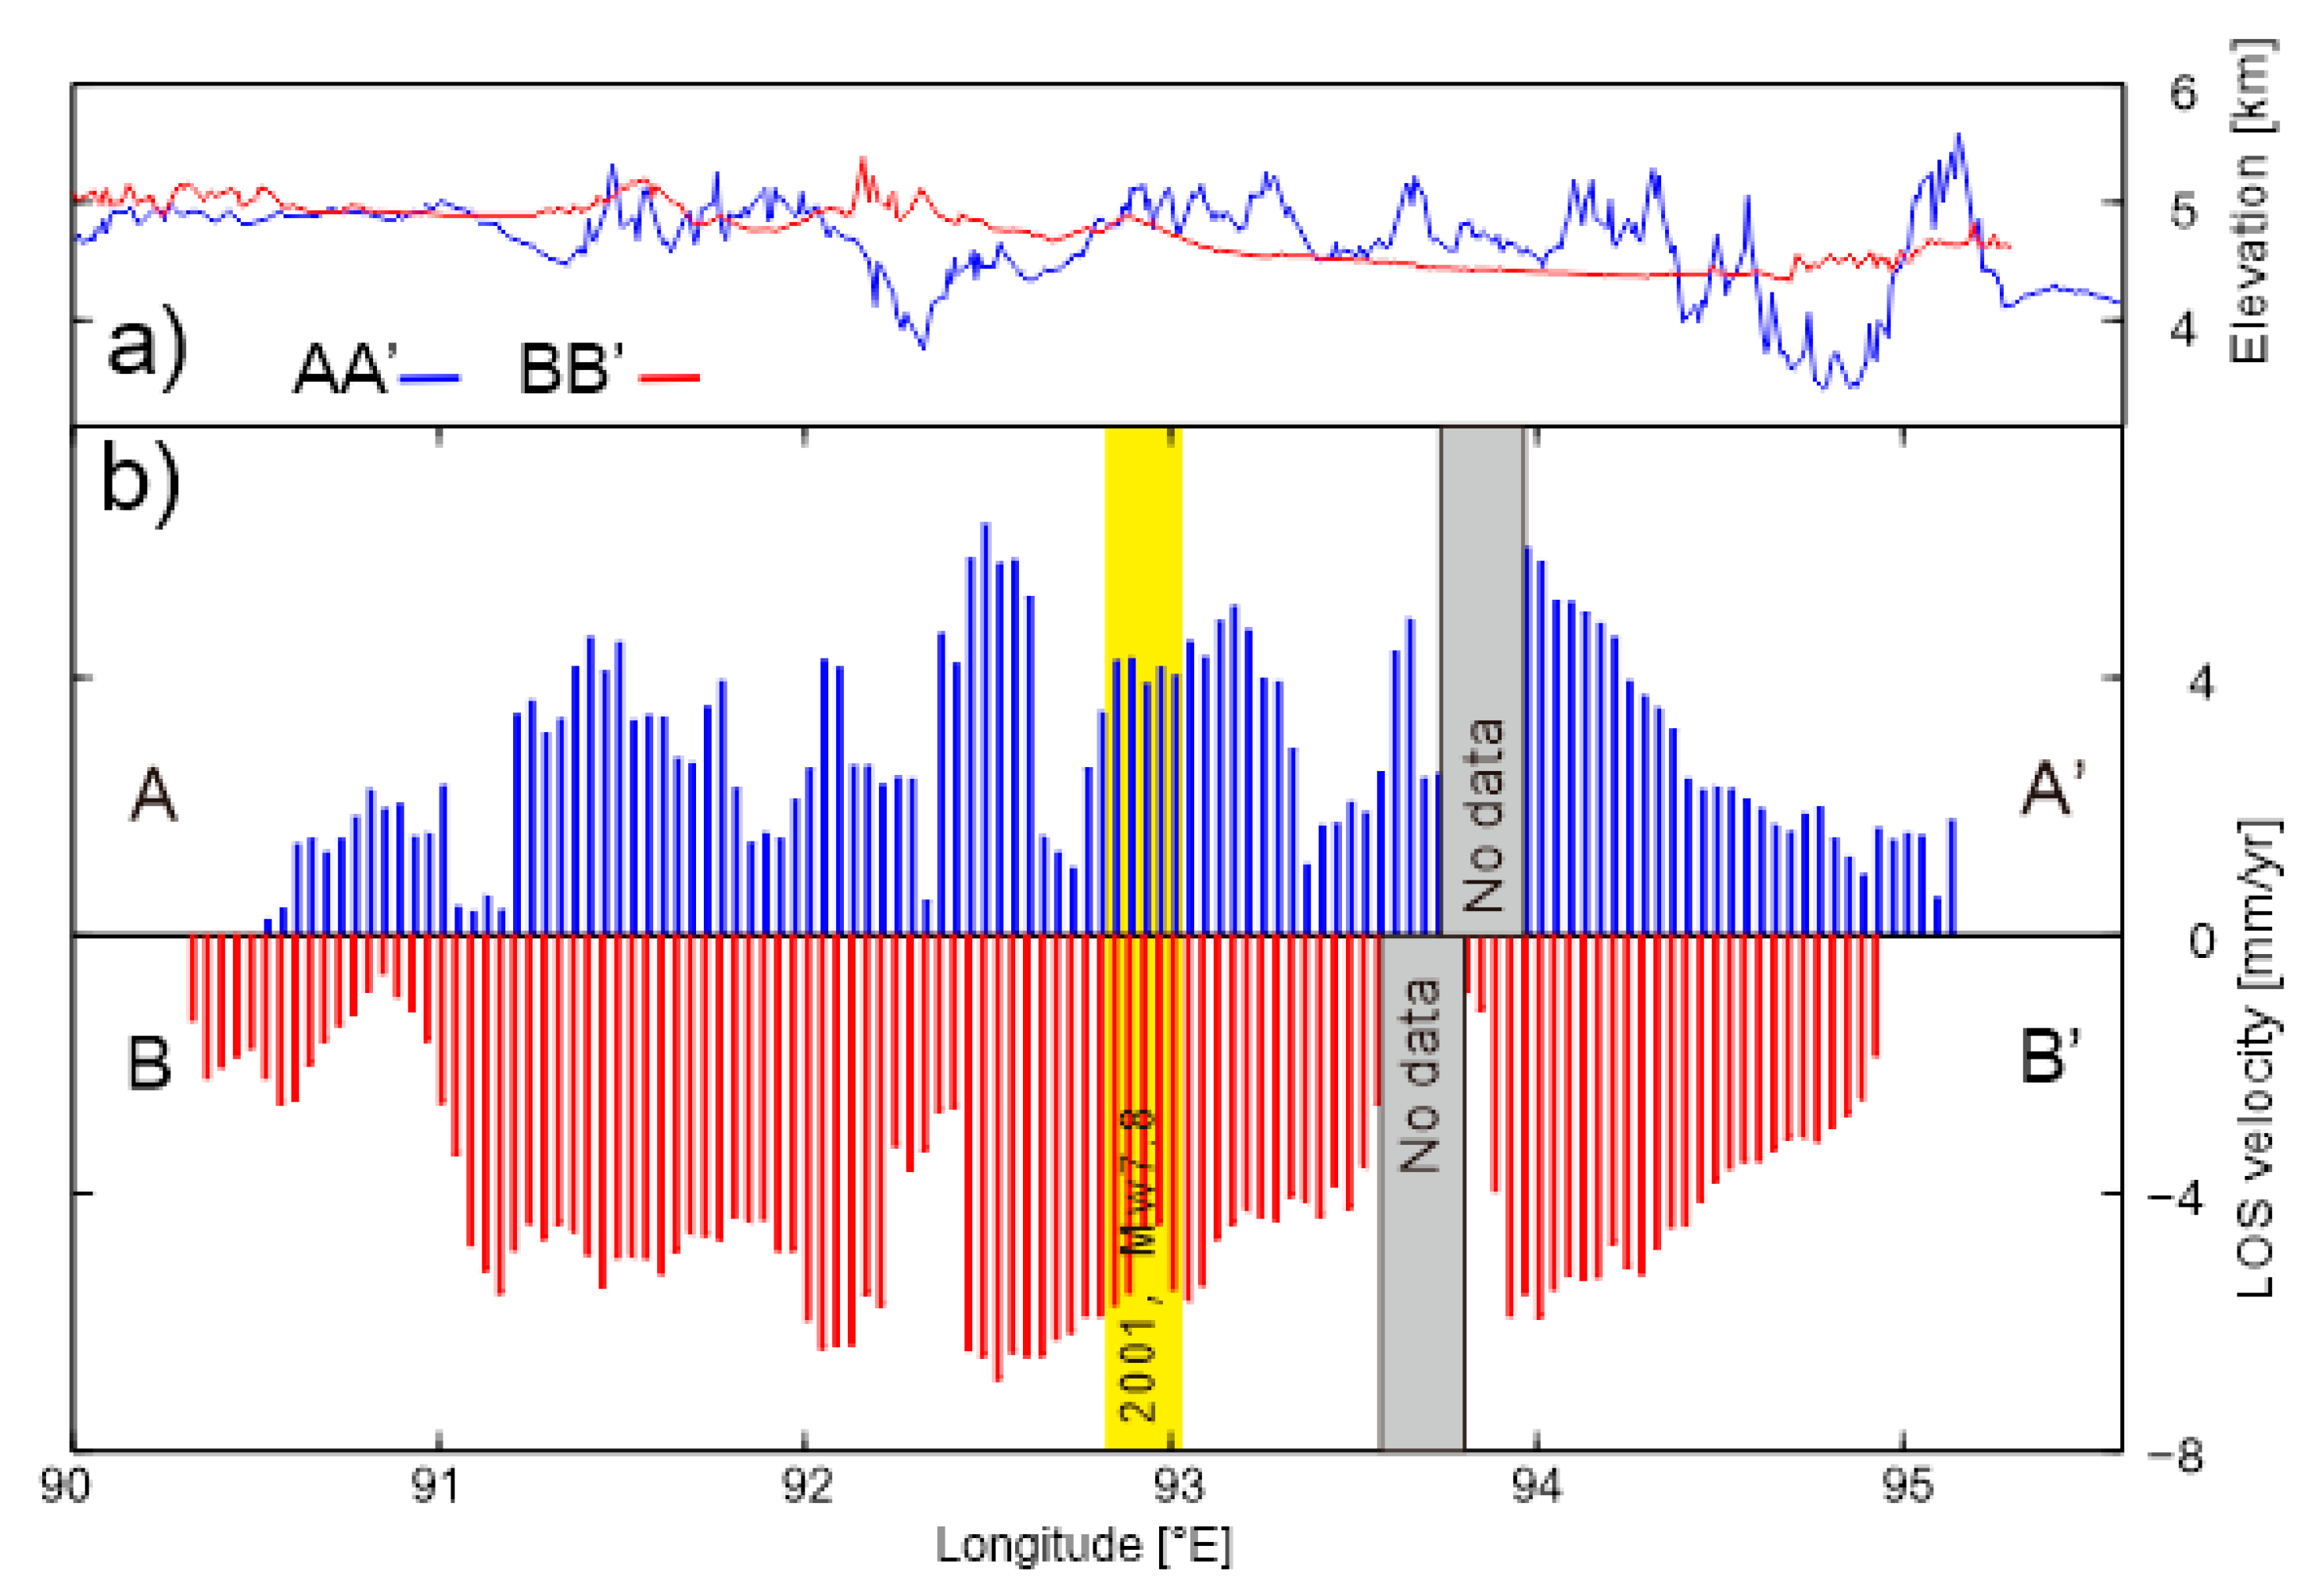
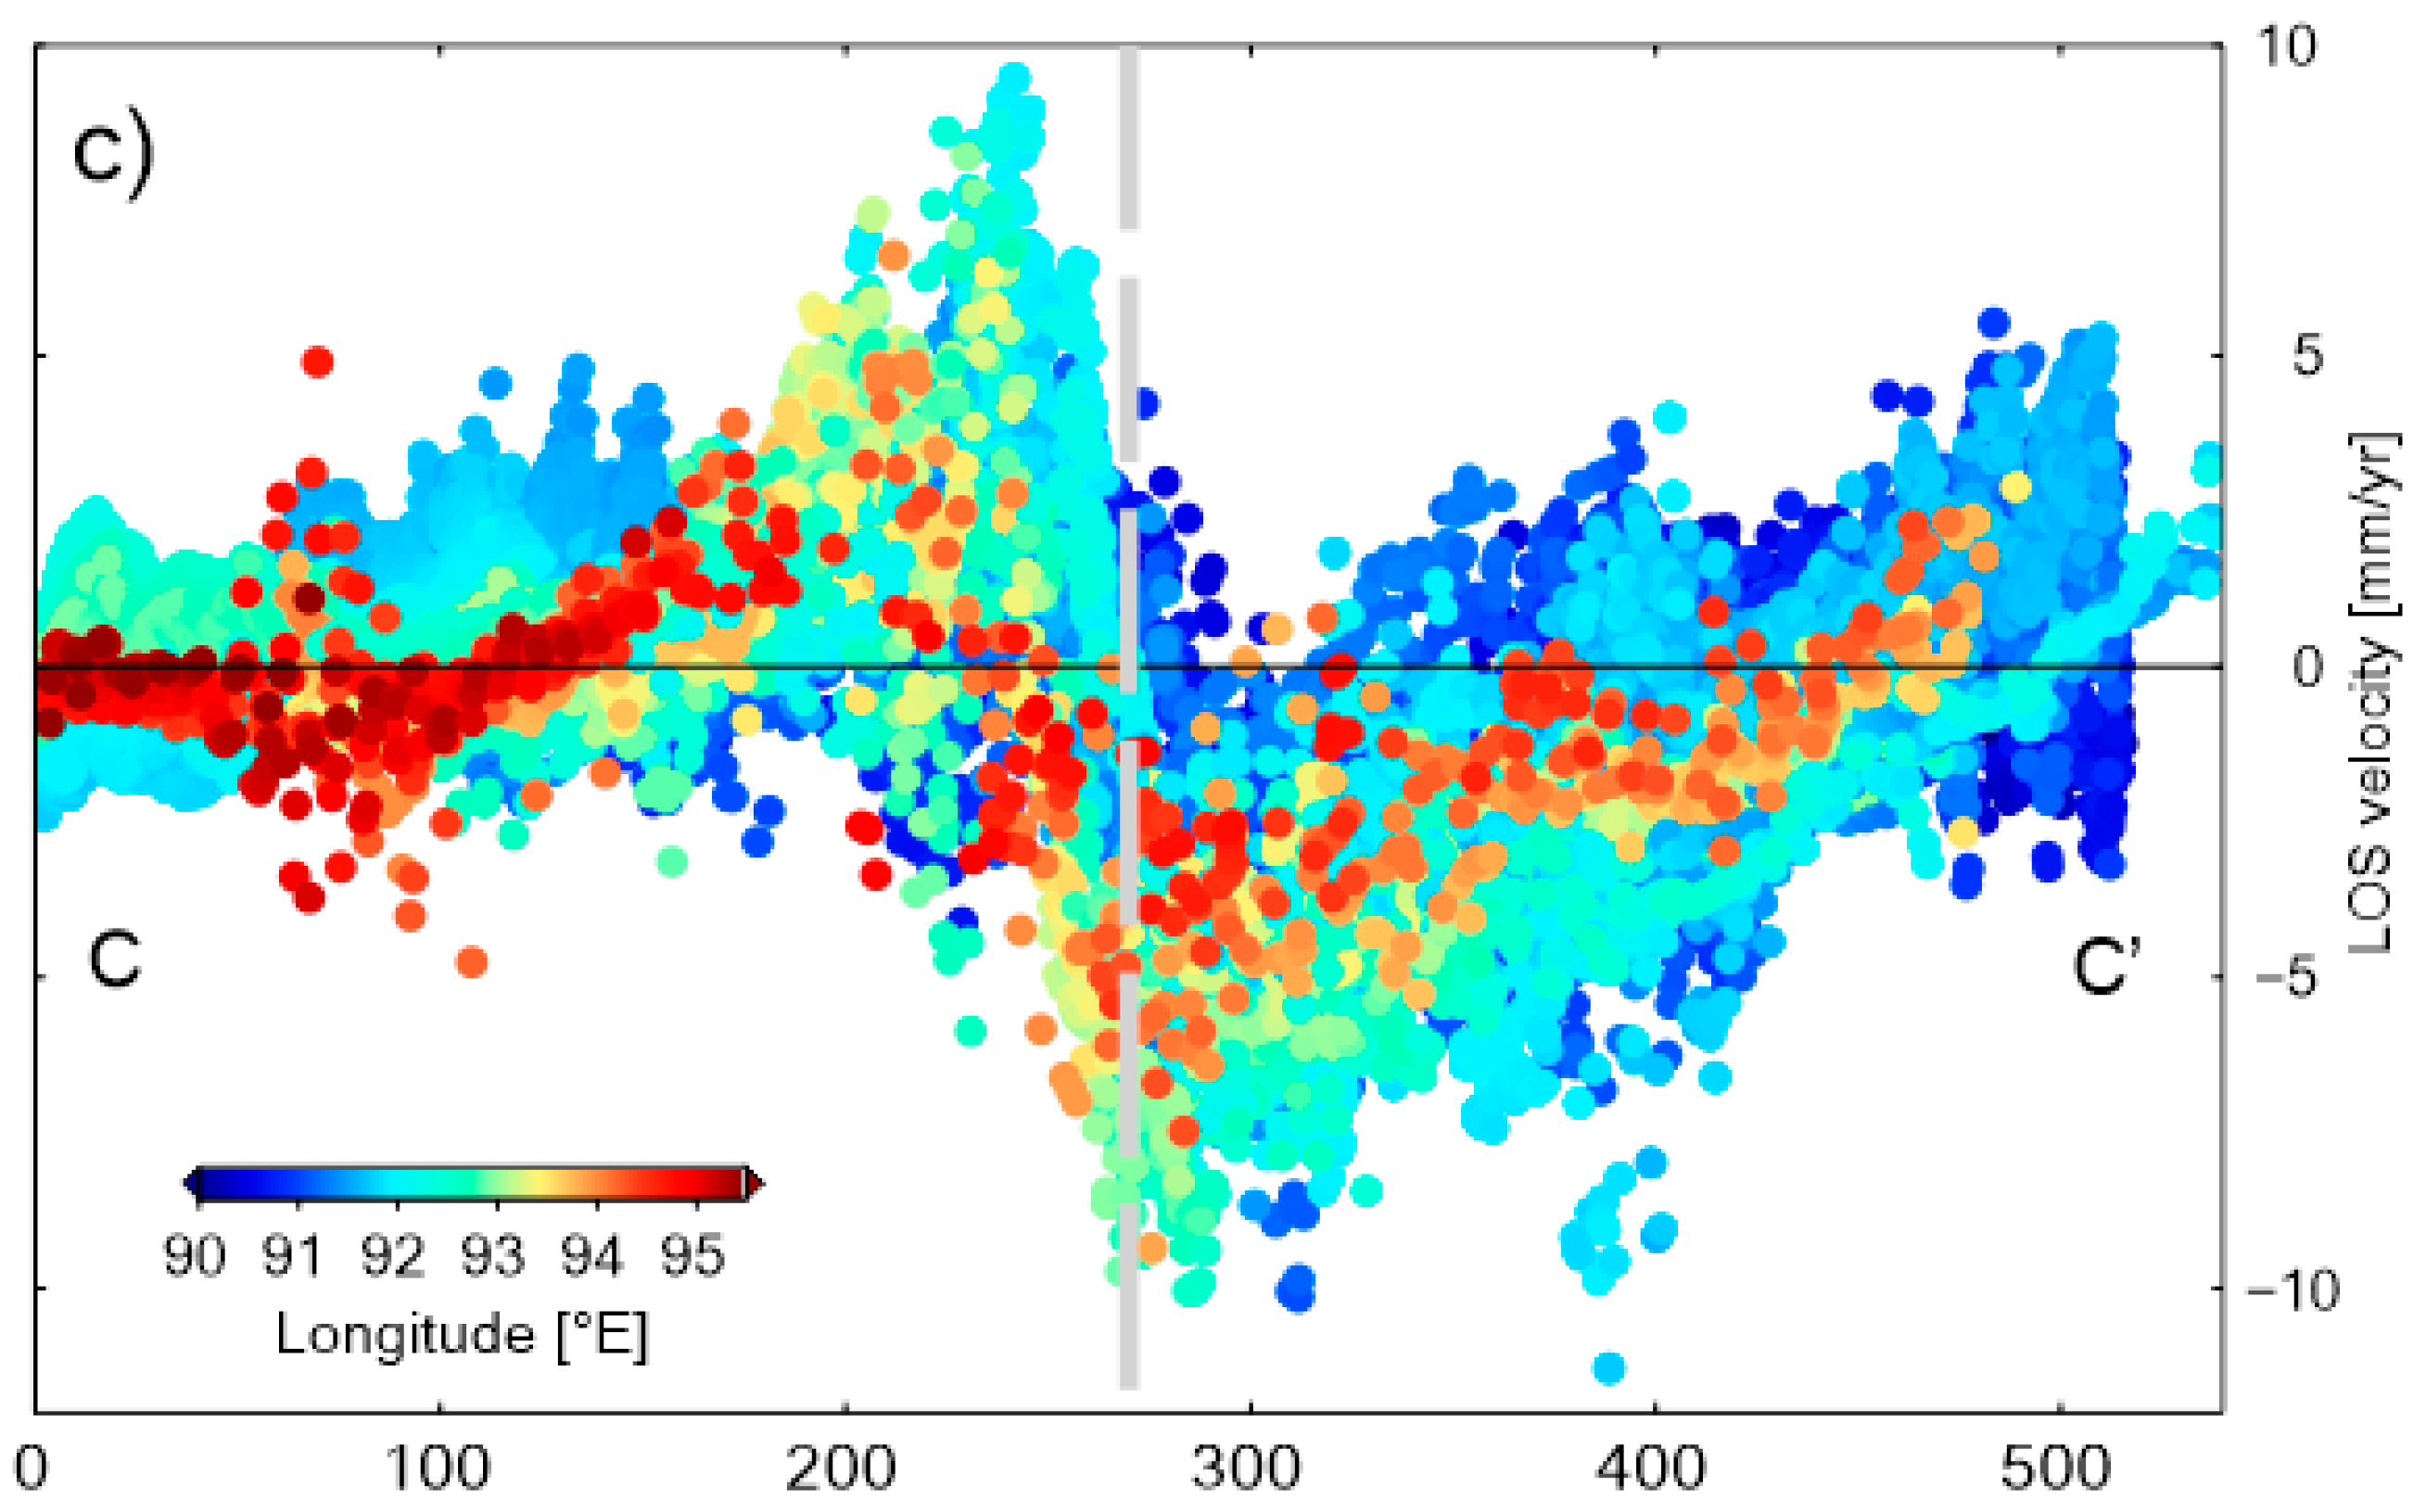
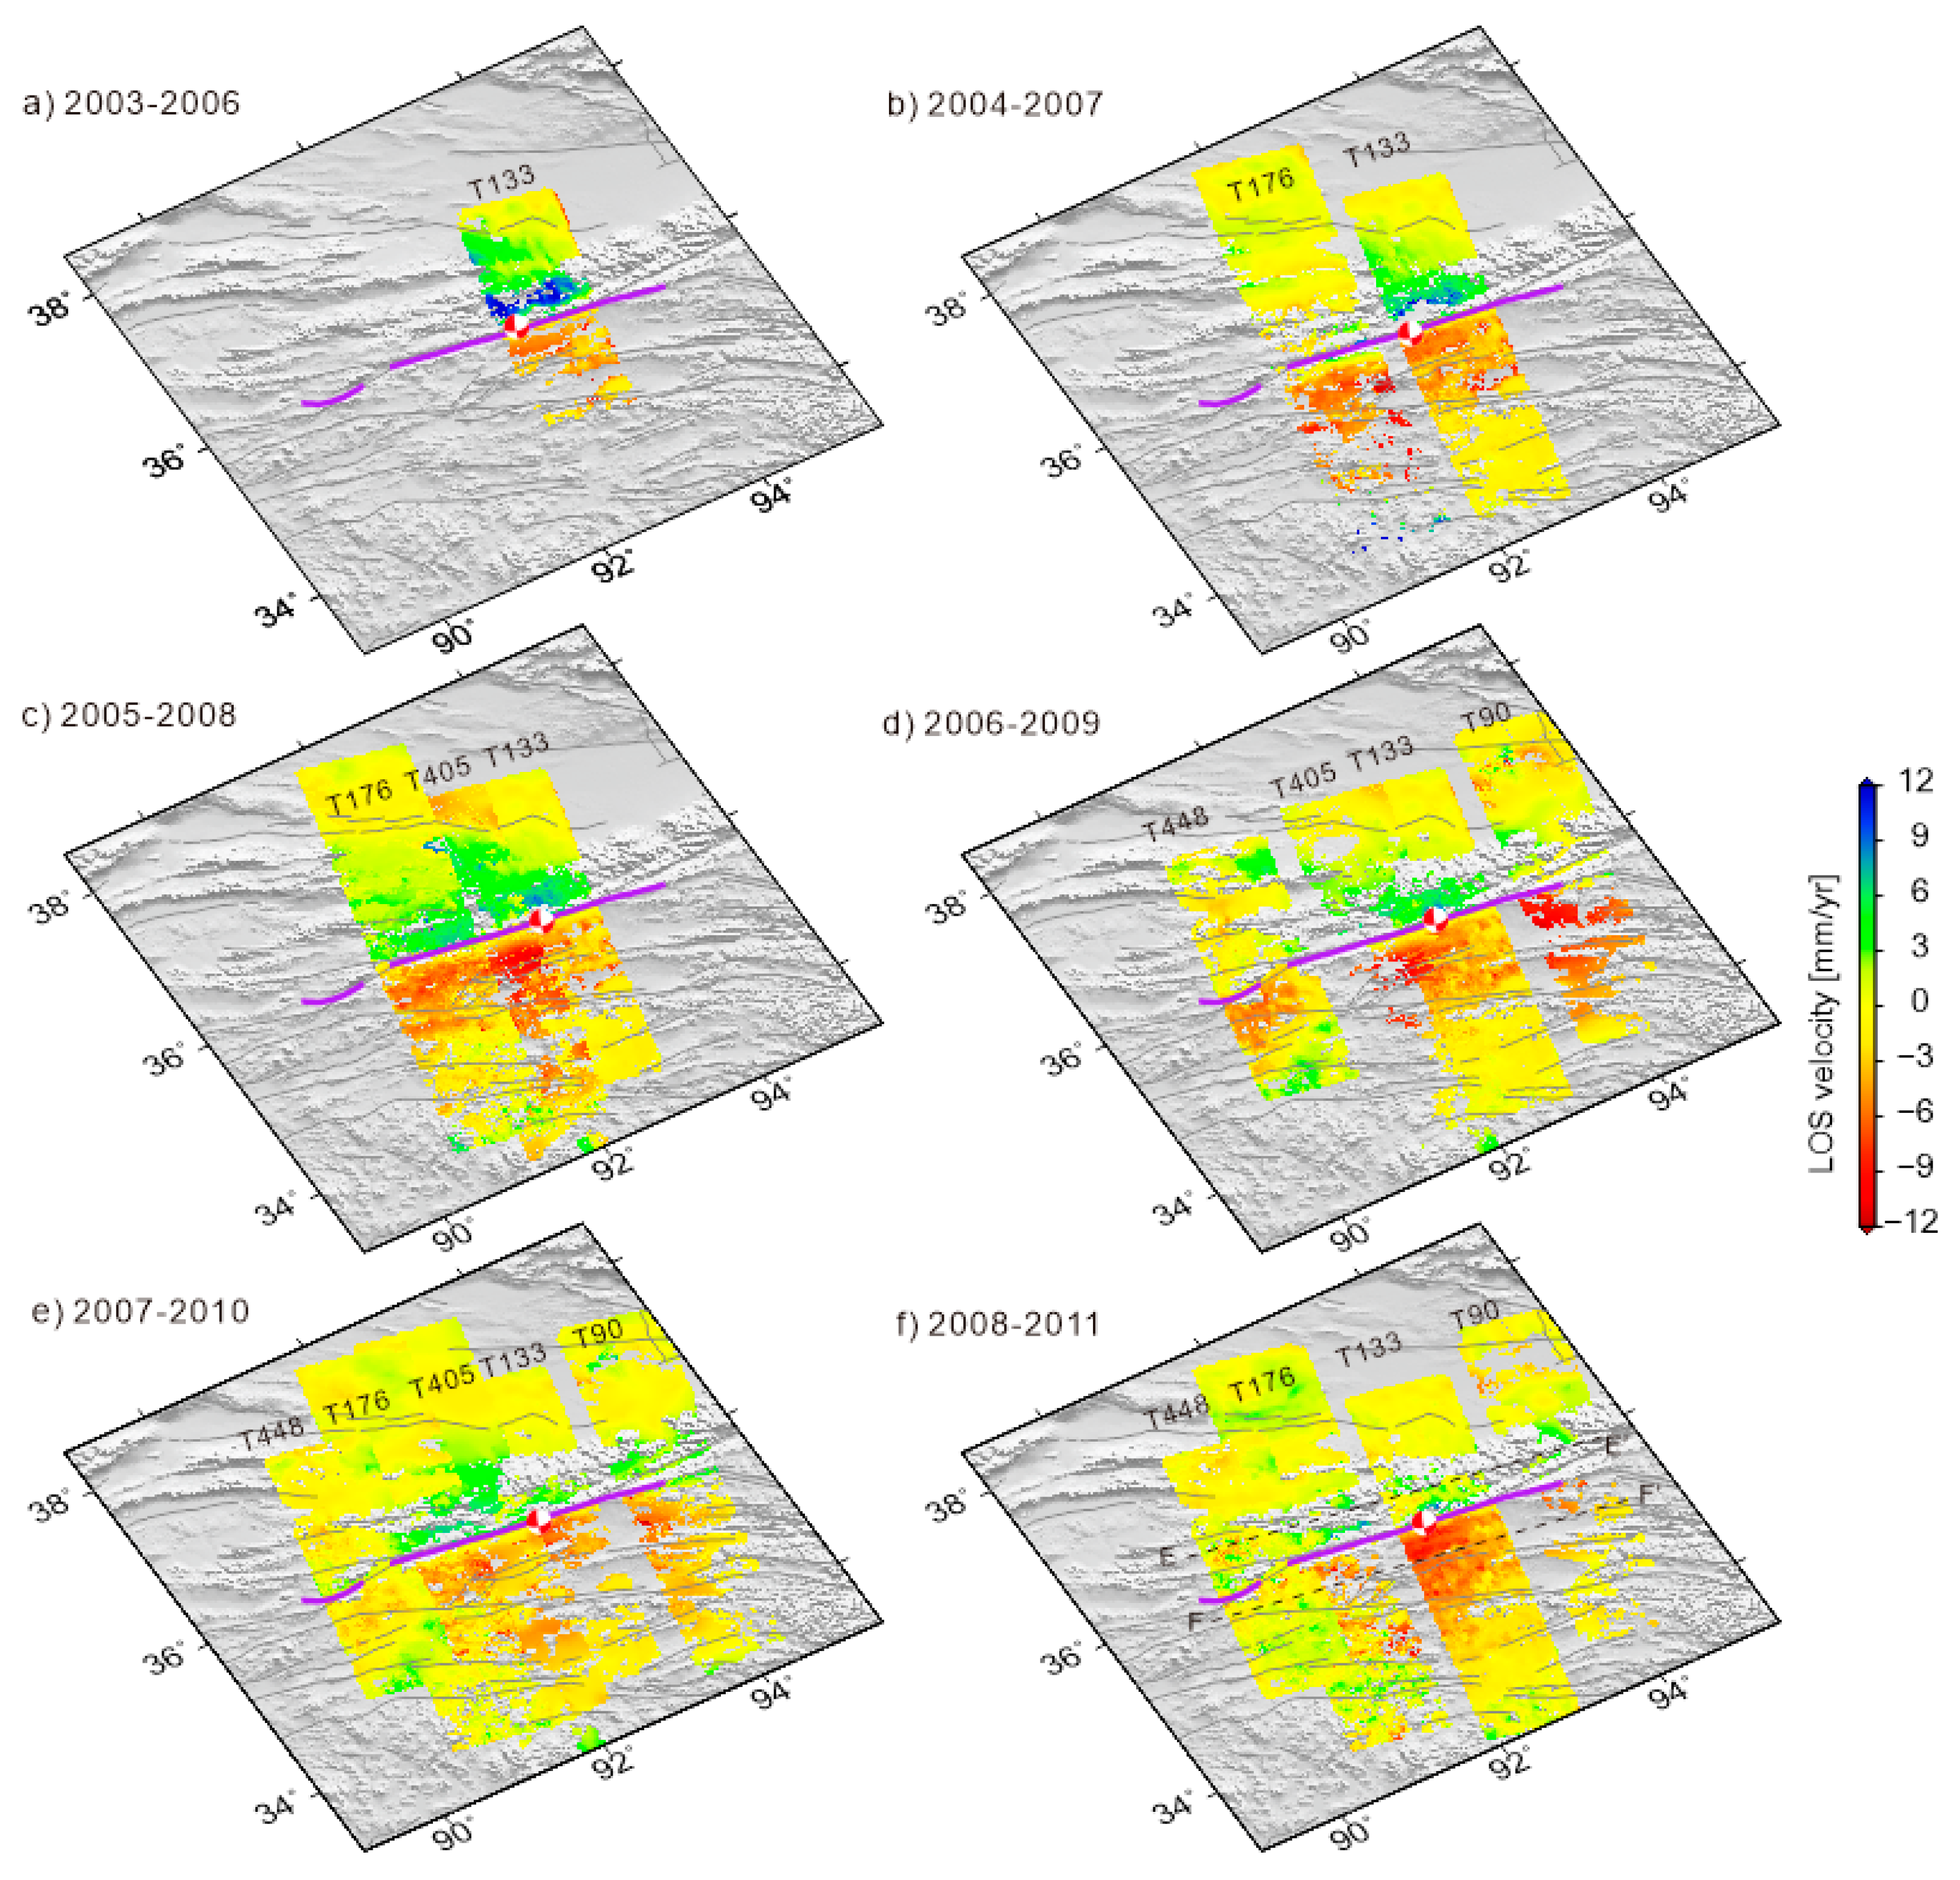
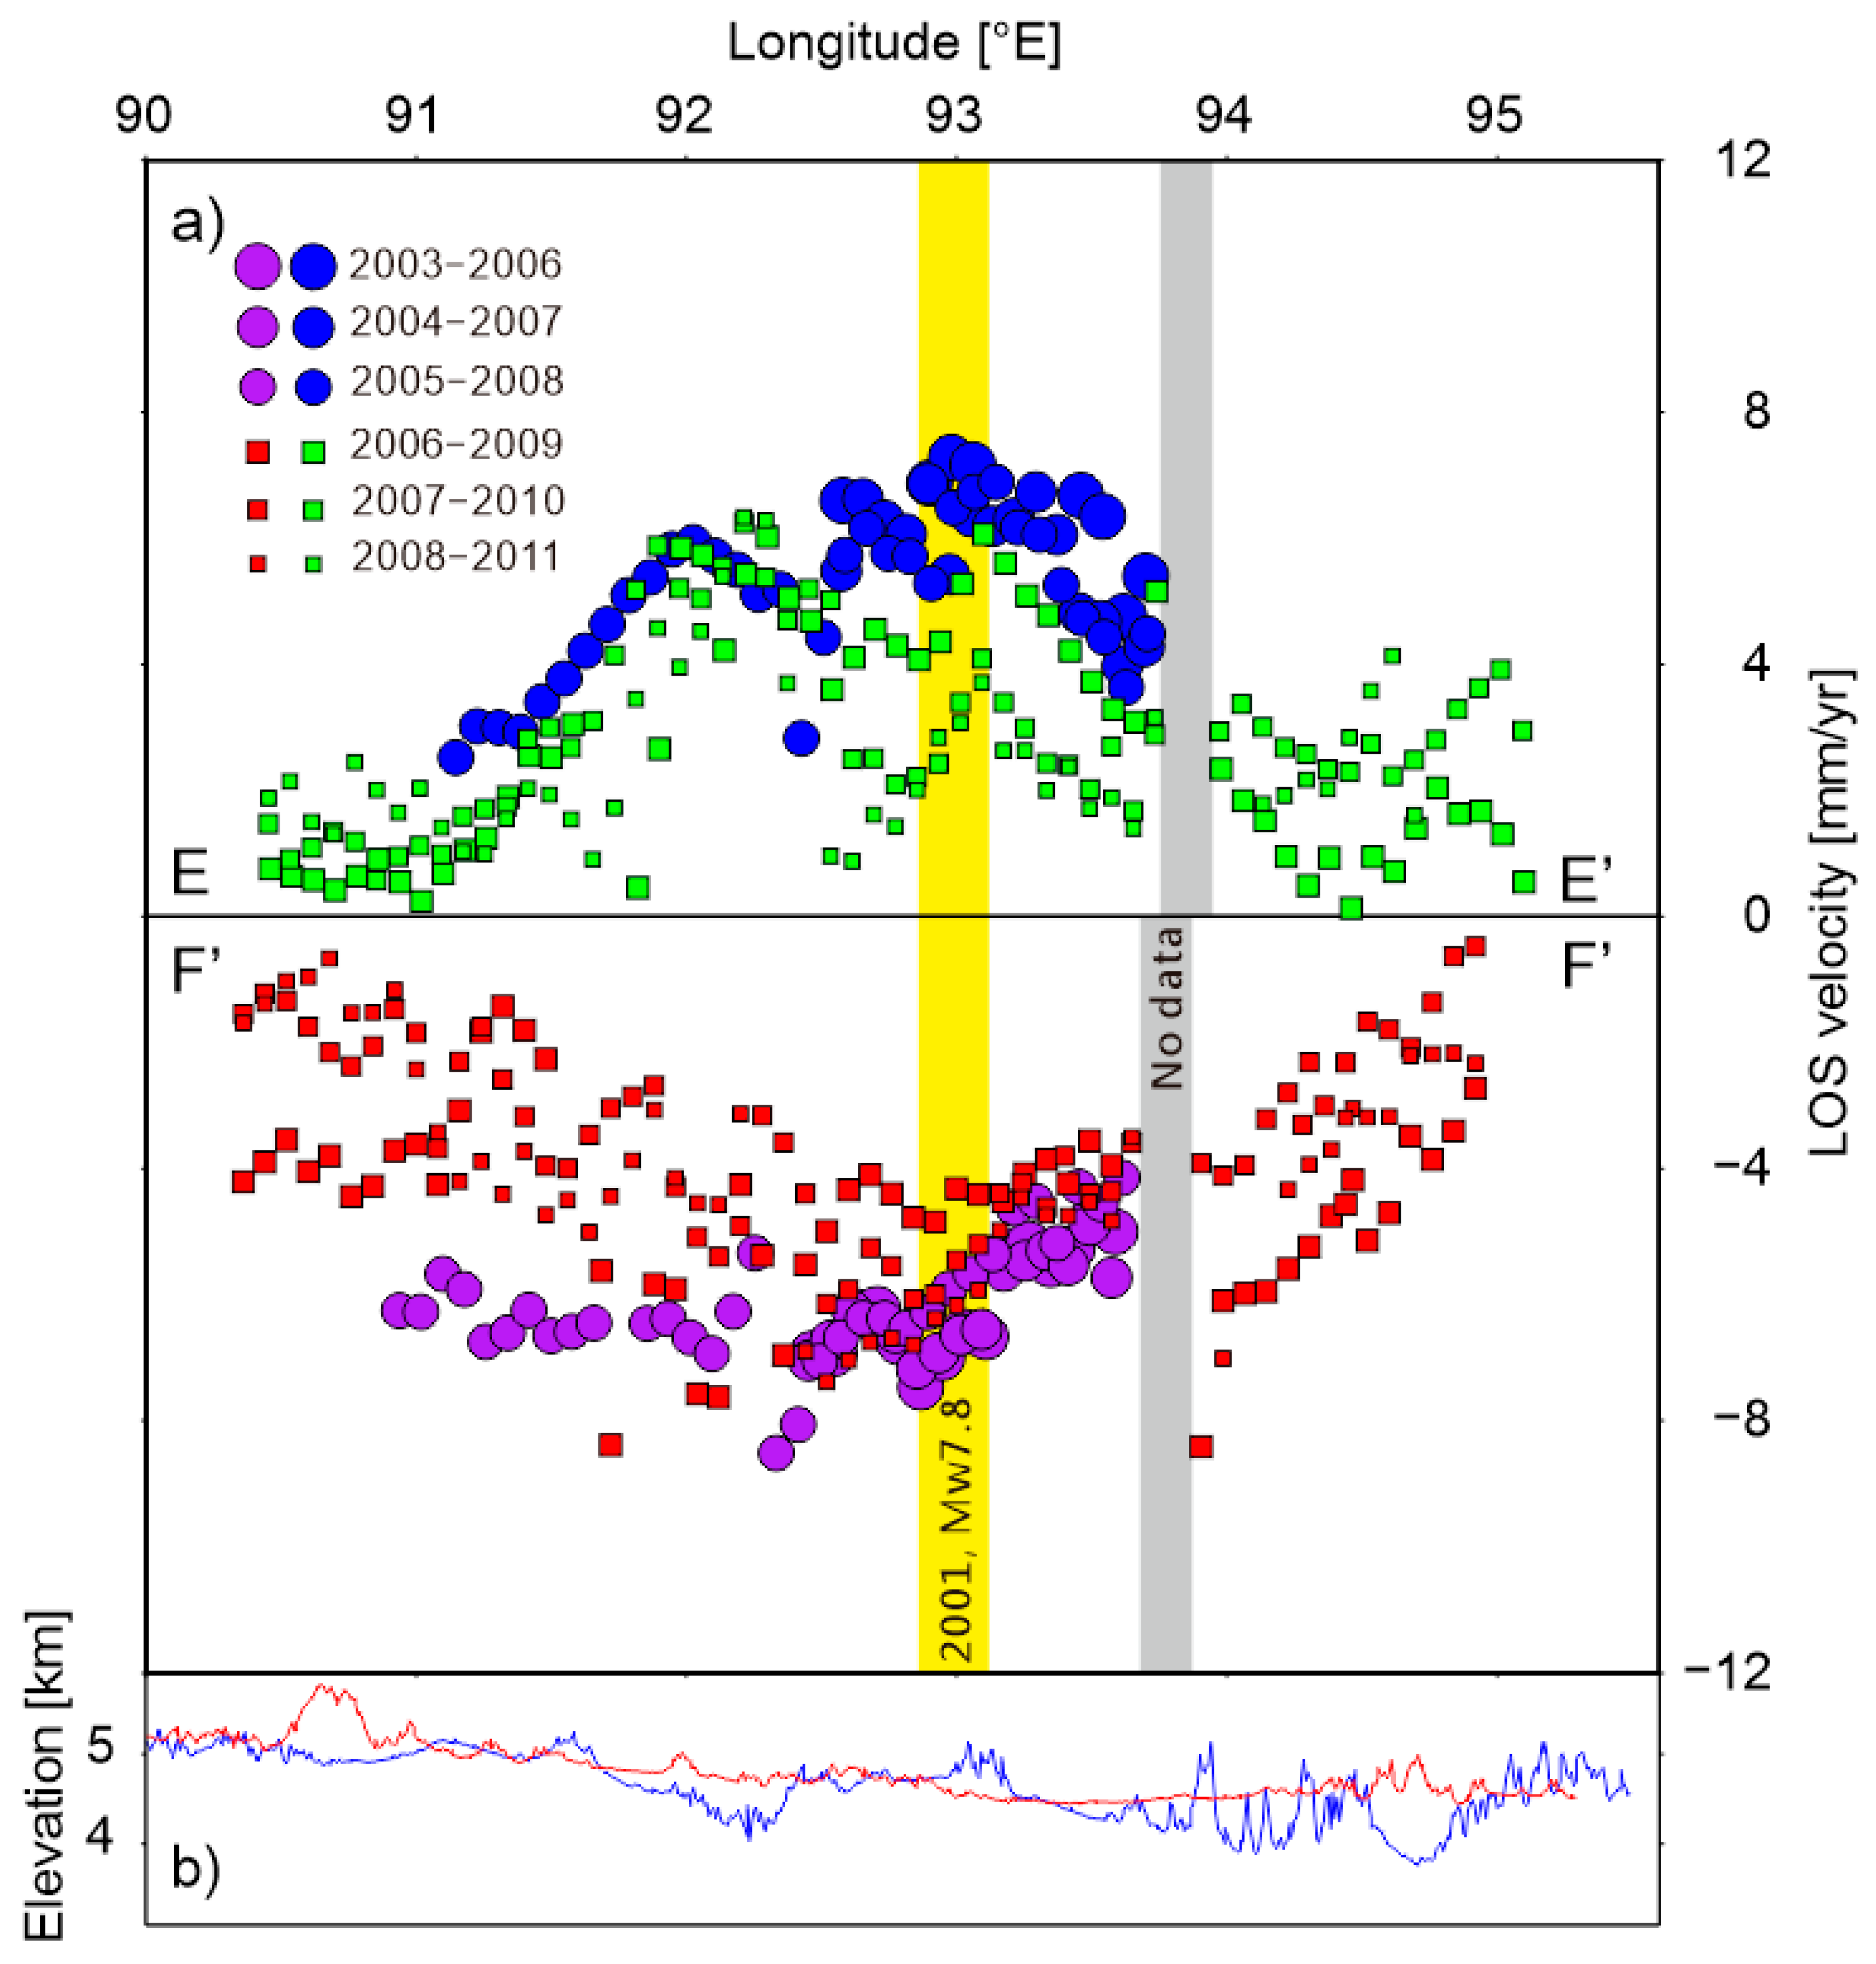
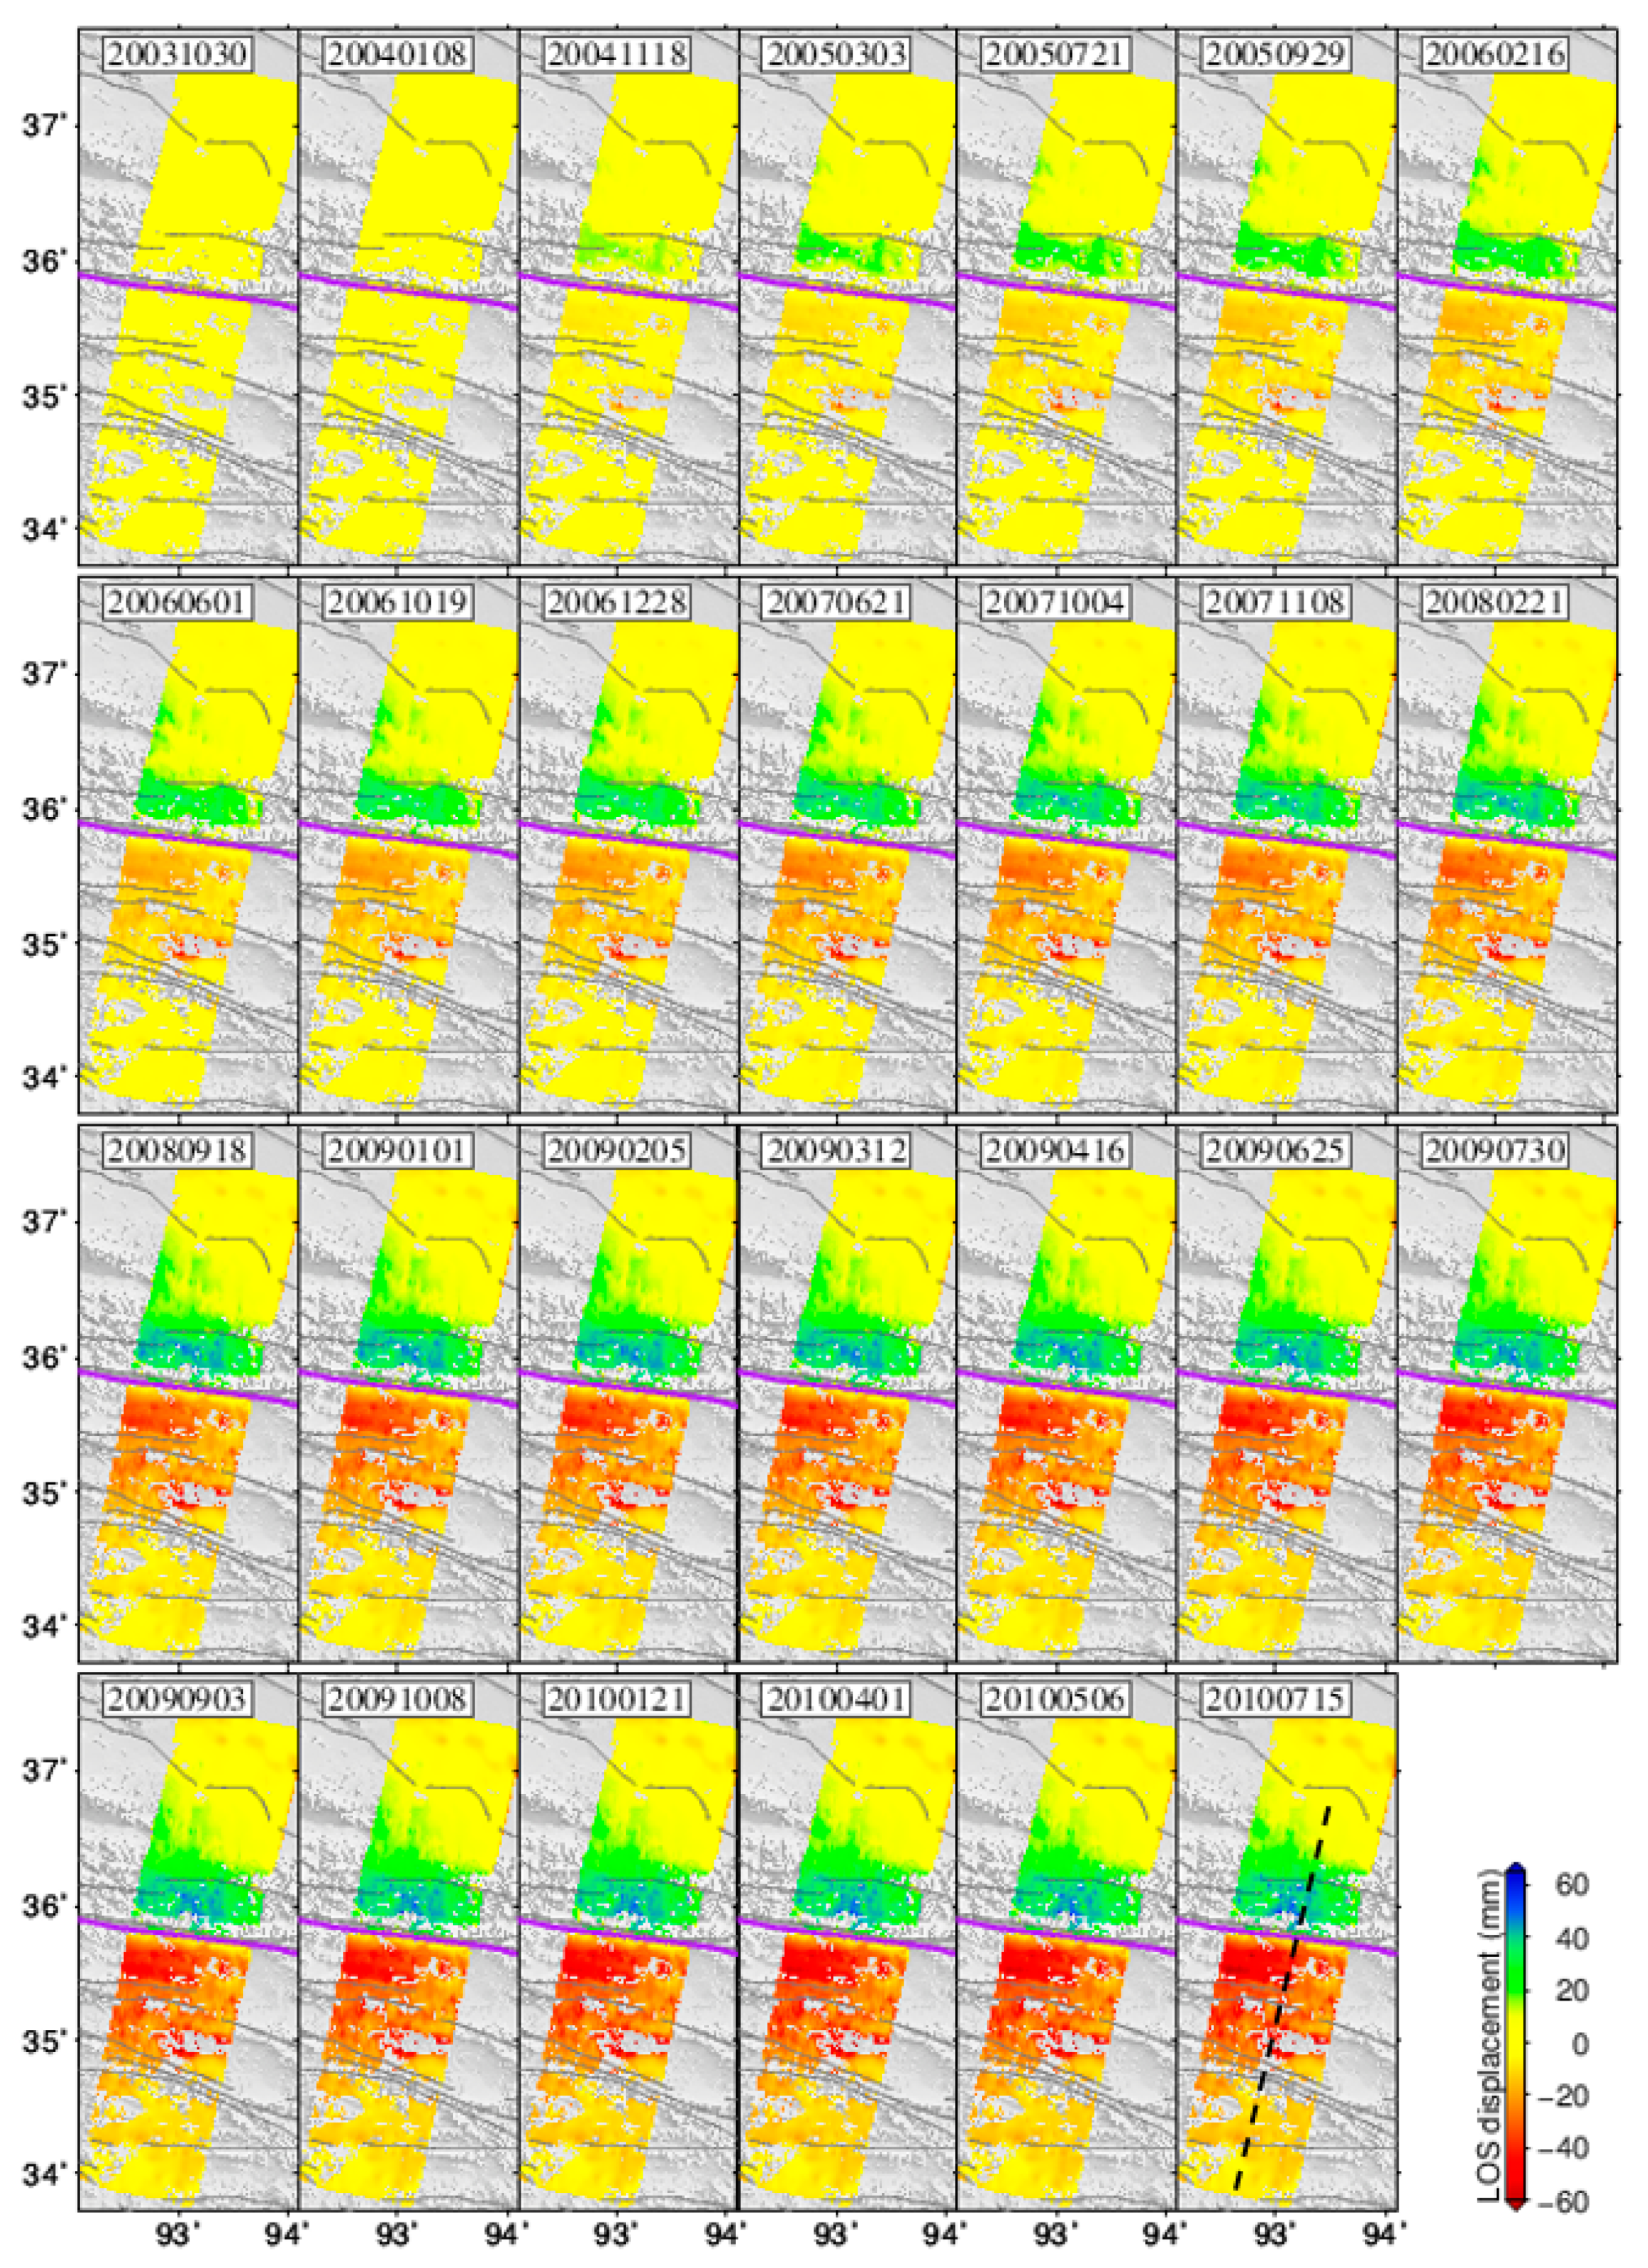
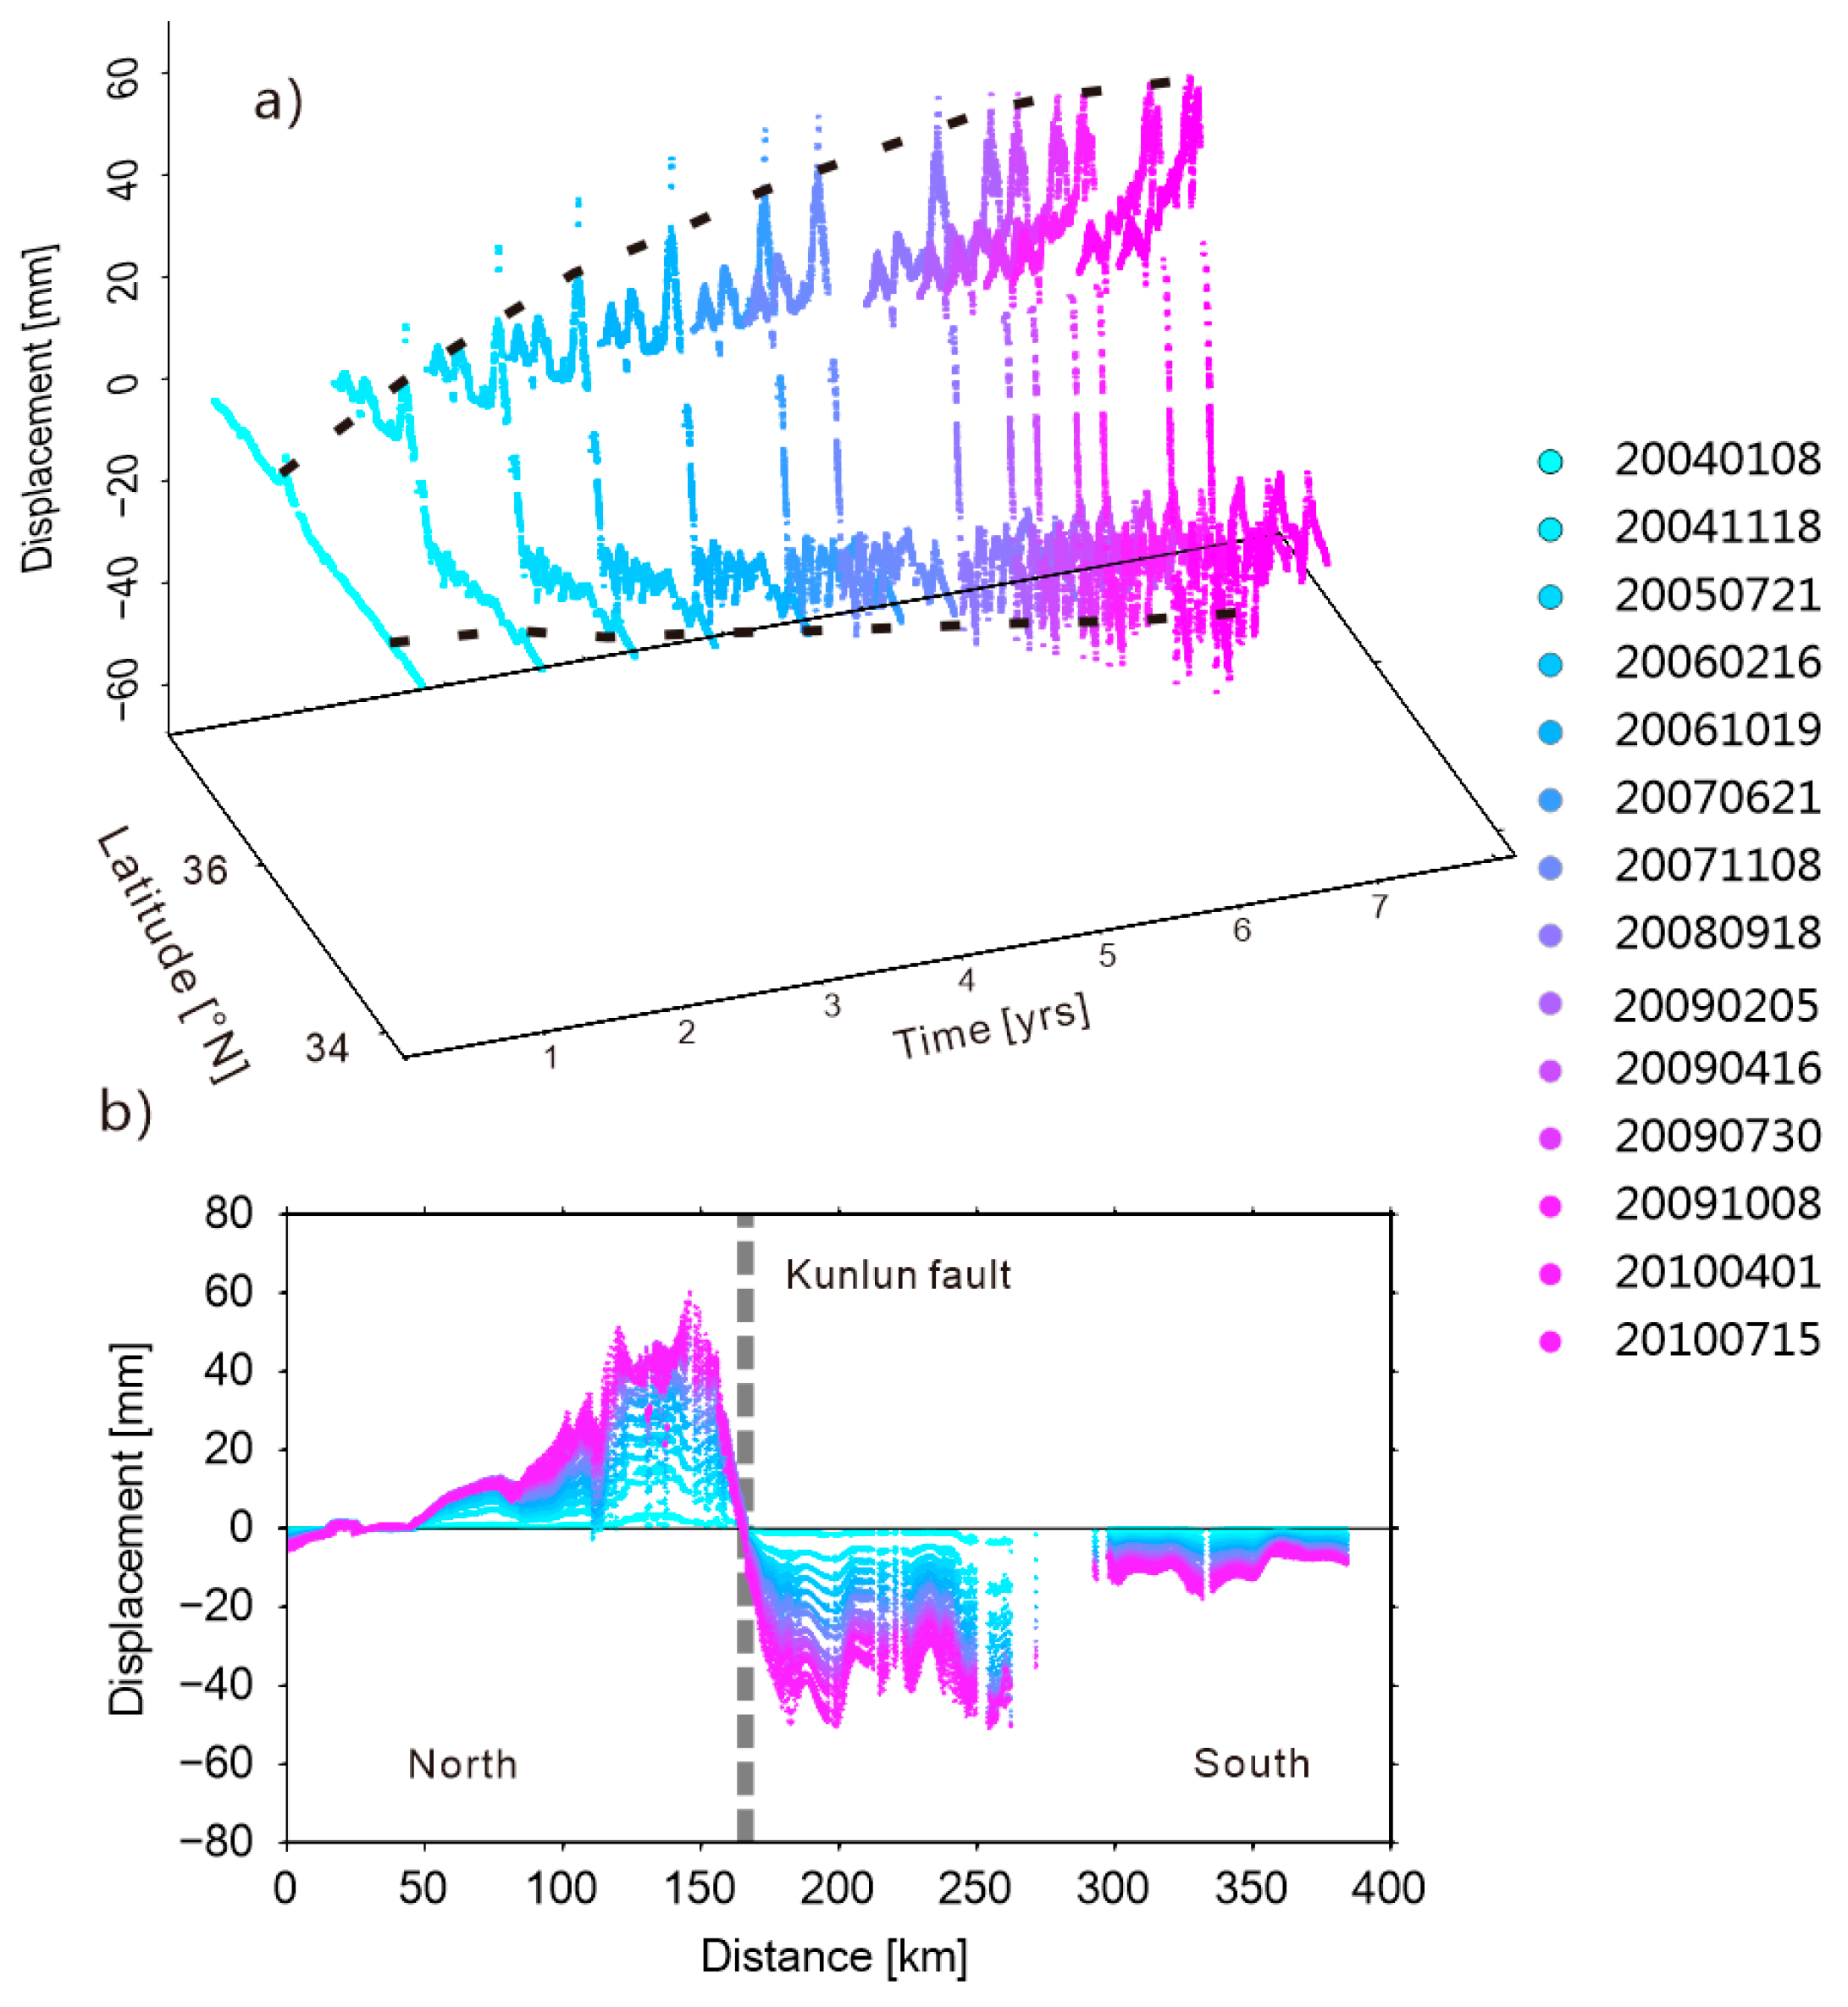
4.2. The Whole Pattern and Spatiotemporal Evolution of the Postseismic Deformation

We show the entire postseismic displacement velocity field observed in 2003–2010, the collage of short-term velocity maps for five descending tracks and different profiles in Figure 9, Figure 10, Figure 11 and Figure 12. These InSAR postseismic velocity maps allow us to derive two first-order features of the postseismic deformation evolution both along and across the 2001 rupture.
First, the long-term postseismic deformation with spatially continuous distribution following the KKEQ covers a very large area of ~300 km × 500 km around the coseismic rupture zone (Figure 9). The postseismic displacement field is characterized by two opposite elongate lobes, the smaller one with positive velocity values (moving away from the satellite) on the north side of the KF and the larger one with negative velocity values (moving toward the satellite) on the south side of the fault. This implies a predominantly left-lateral sense of motion of the postseismic deformation. The highest-amplitude signal is observed in the near-field of the KF, near the GCMT epicentral area (around 93°E in the eastern and western Kusai section) in particular, then it decreases towards far-field and towards the lateral tips of the 2001 rupture (Figure 10).
Both the short-term and long-term postseismic deformation fields feature highly asymmetric spatial extent, velocity magnitude and gradient across the KF (Figure 9, Figure 10, Figure 11 and Figure 12). For the long-term postseismic deformation field, the significant asymmetric distribution is clearly revealed by all five tracks (Figure 9). Furthermore, the LOS velocity on the north side decays rapidly with distance, while on the south side it decreases more smoothly to the far-field (Figure 6). Along the southern boundary of the Qaidam basin, some obvious postseismic signal, ~1–3 mm/yr, is visible, but it does not extend further north into the interior of this relatively stable basin (Figure 9). The spatial extent of postseismic deformation to the north of the fault experiences a temporal reduction towards the fault, while the width of the deformation zone to the south of the fault remains nearly constant (Figure 11).
Second, we can identify significant differences in the postseismic deformation pattern, extent and evolution process at the two ends of the ruptured fault (Figure 8 and Figure 12). The 2001 event ruptured with a reverse and normal component in the Kunlun Pass section and the extensional corridor, respectively [52]. In addition, the fault strike changed a lot in these two areas. Both the long-term and short-term deformation velocity fields indicate that the magnitude of average velocity and the width of the deformation zone in the Kunlun Pass segment (eastern end of the 2001 rupture) is significantly larger than those observed at the western end and along the extensional corridor (Figure 9 and Figure 11). The rapid postseismic velocity decay can be clearly identified in both regions (Figure 8). In contrast with the central part (~91.5°E–94°E), the postseismic velocities to the south of the fault decay with time in each sub-period (Figure 8 and Figure 12).

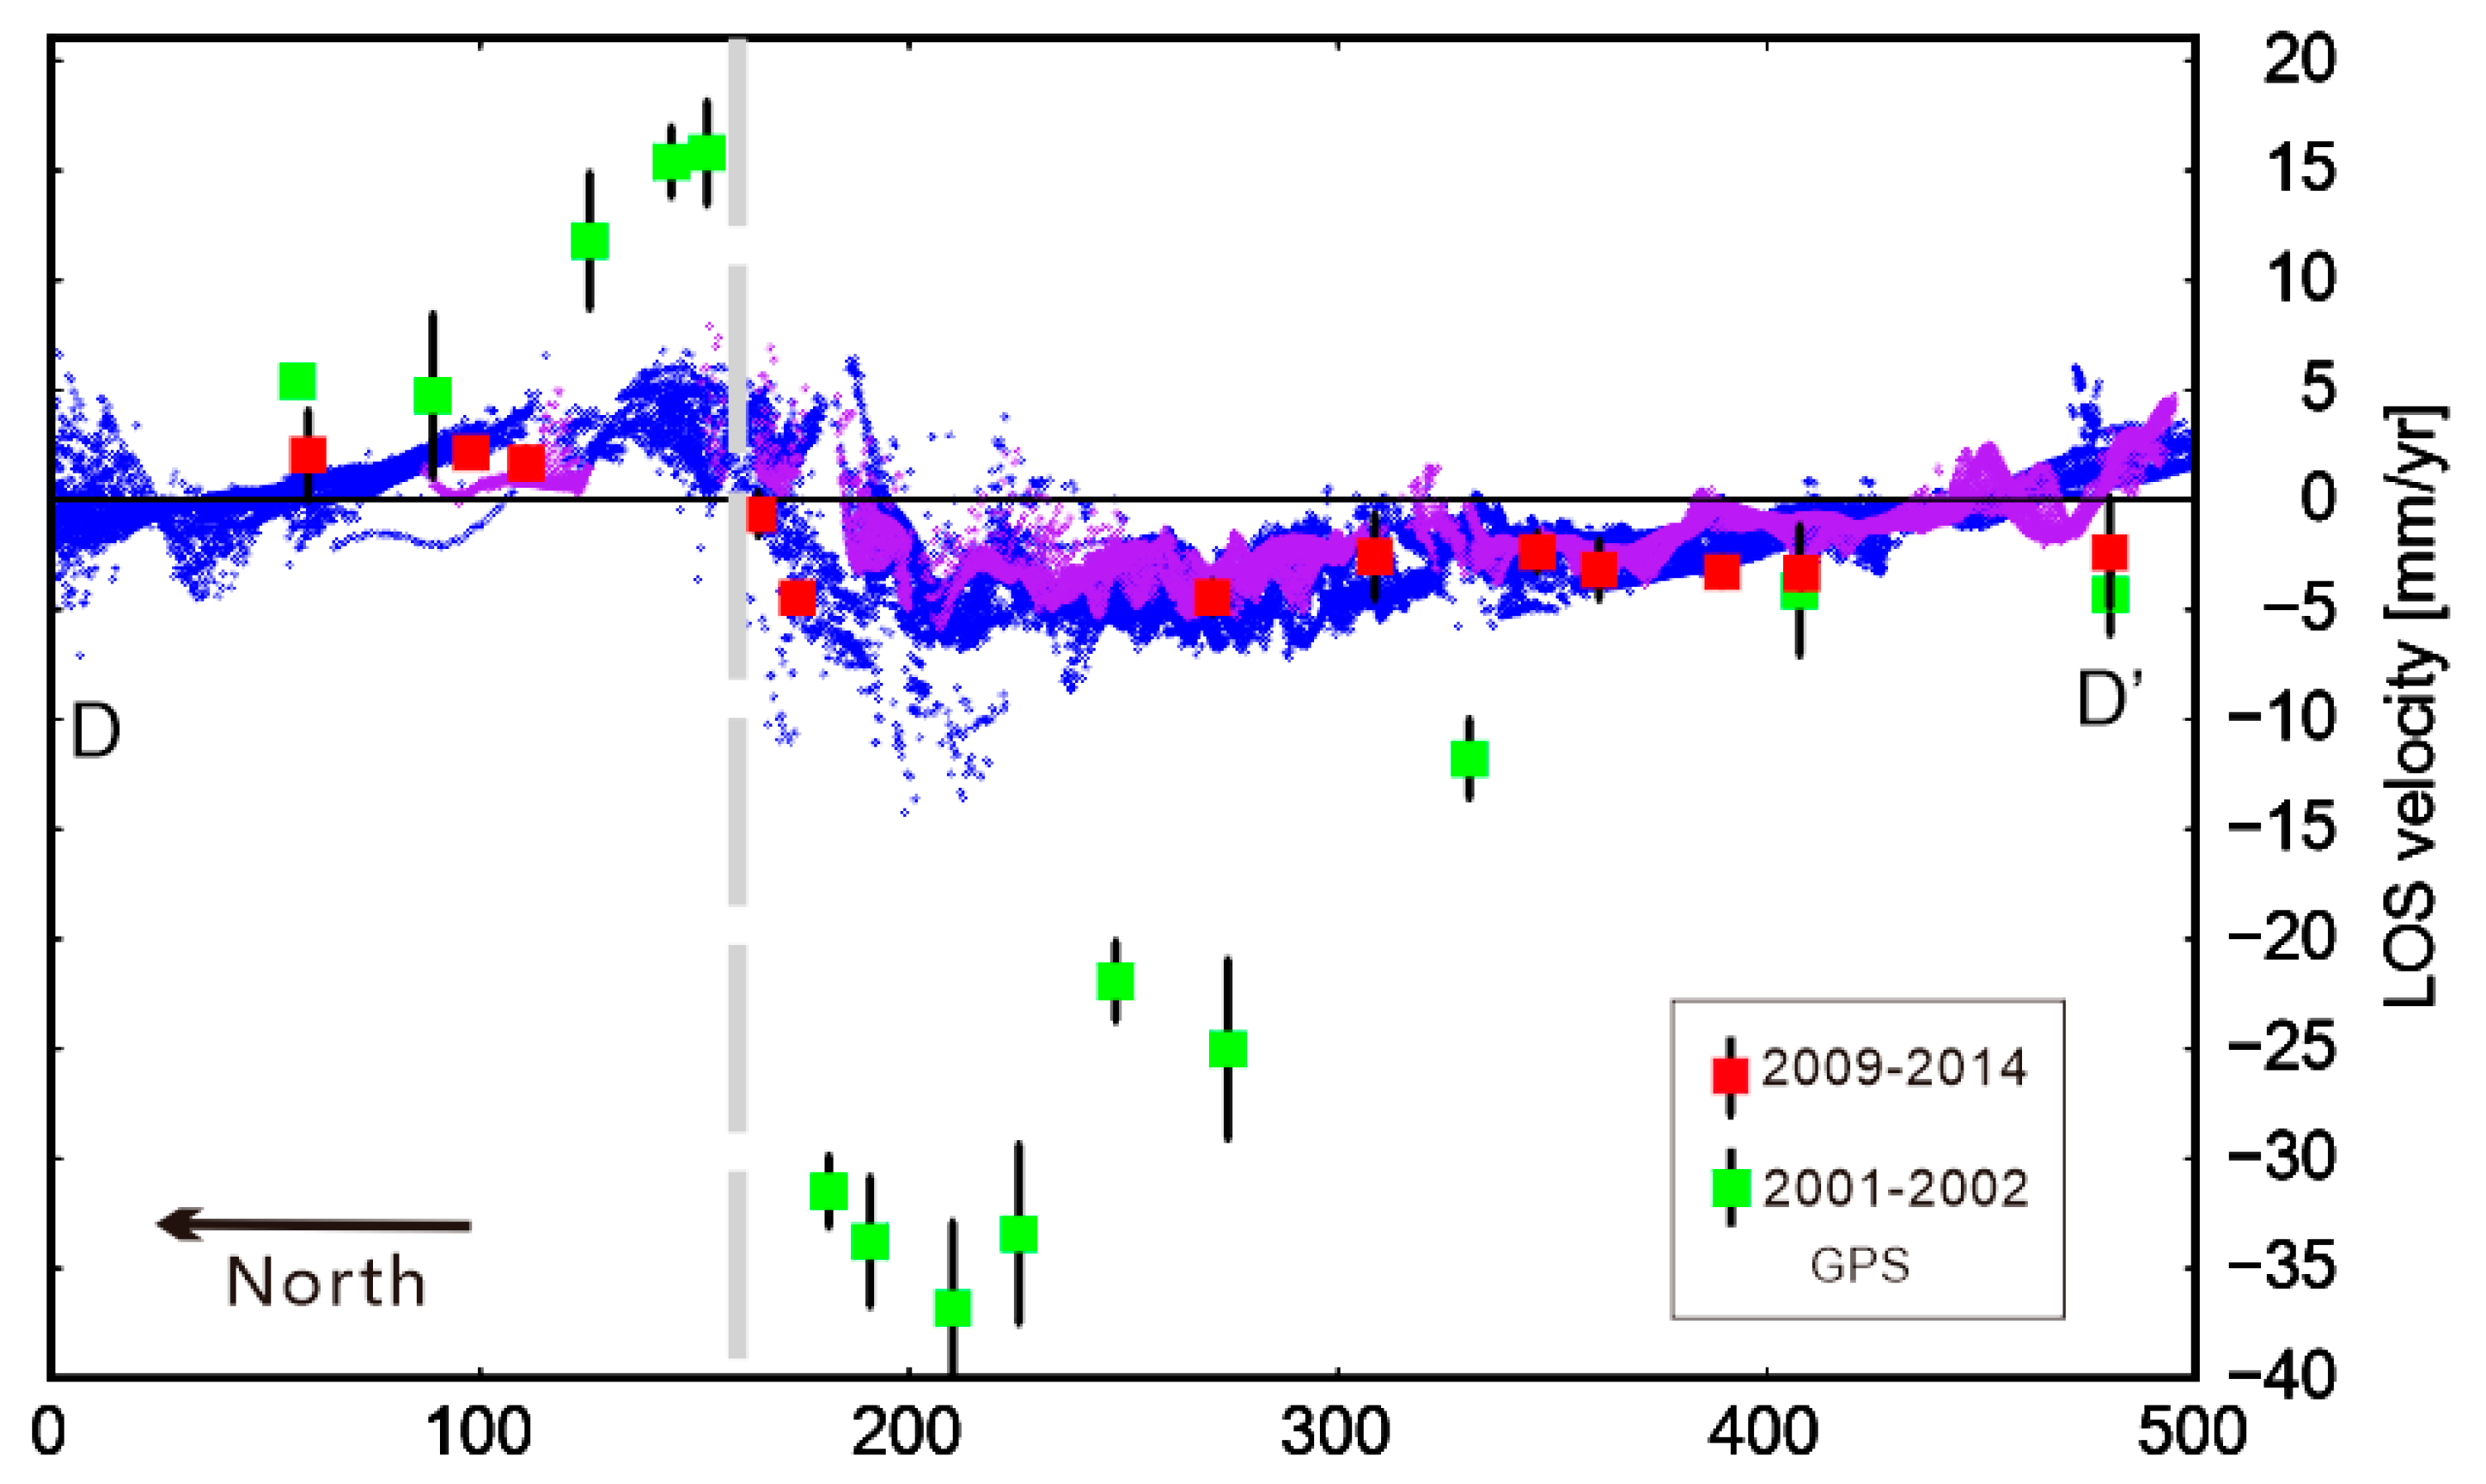
4.3. Comparison with GPS Velocity Observation

There are GPS observations along a transect obliquely crossing the fault, that provide an opportunity for comparative study [23,24,25]. We compare our InSAR observations with GPS horizontal velocities acquired during the period of 2001–2002 [23] and 2009–2014 [25]. These two sets of GPS velocities provided by Qiao et al. [23] and Zhao et al. [25] include 14 and 12 campaign/continuous stations, respectively, repeatedly observed two or three times (Profile DD’ in Figure 9). The horizontal GPS velocities are projected into the LOS direction for comparison with the InSAR measurements (Figure 13). It’s obvious that the postseismic velocity in the near-field of the fault quickly decayed between the 2001–2002 and 2003–2010 periods, suggesting a rapid short-term response following the KKEQ. In the 2003–2010 and 2009–2014 periods, the observations from InSAR and GPS show similar variations from near-field to far-field. Quantitively, the data suggest ~50 mm/yr (GPS) between 2001 and 2002 and ~10–12 mm/yr (InSAR & GPS) between 2003 and 2010 for the LOS postseismic peak-to-trough velocity differences between the two sides of the fault (near ~94°E, Figure 13).

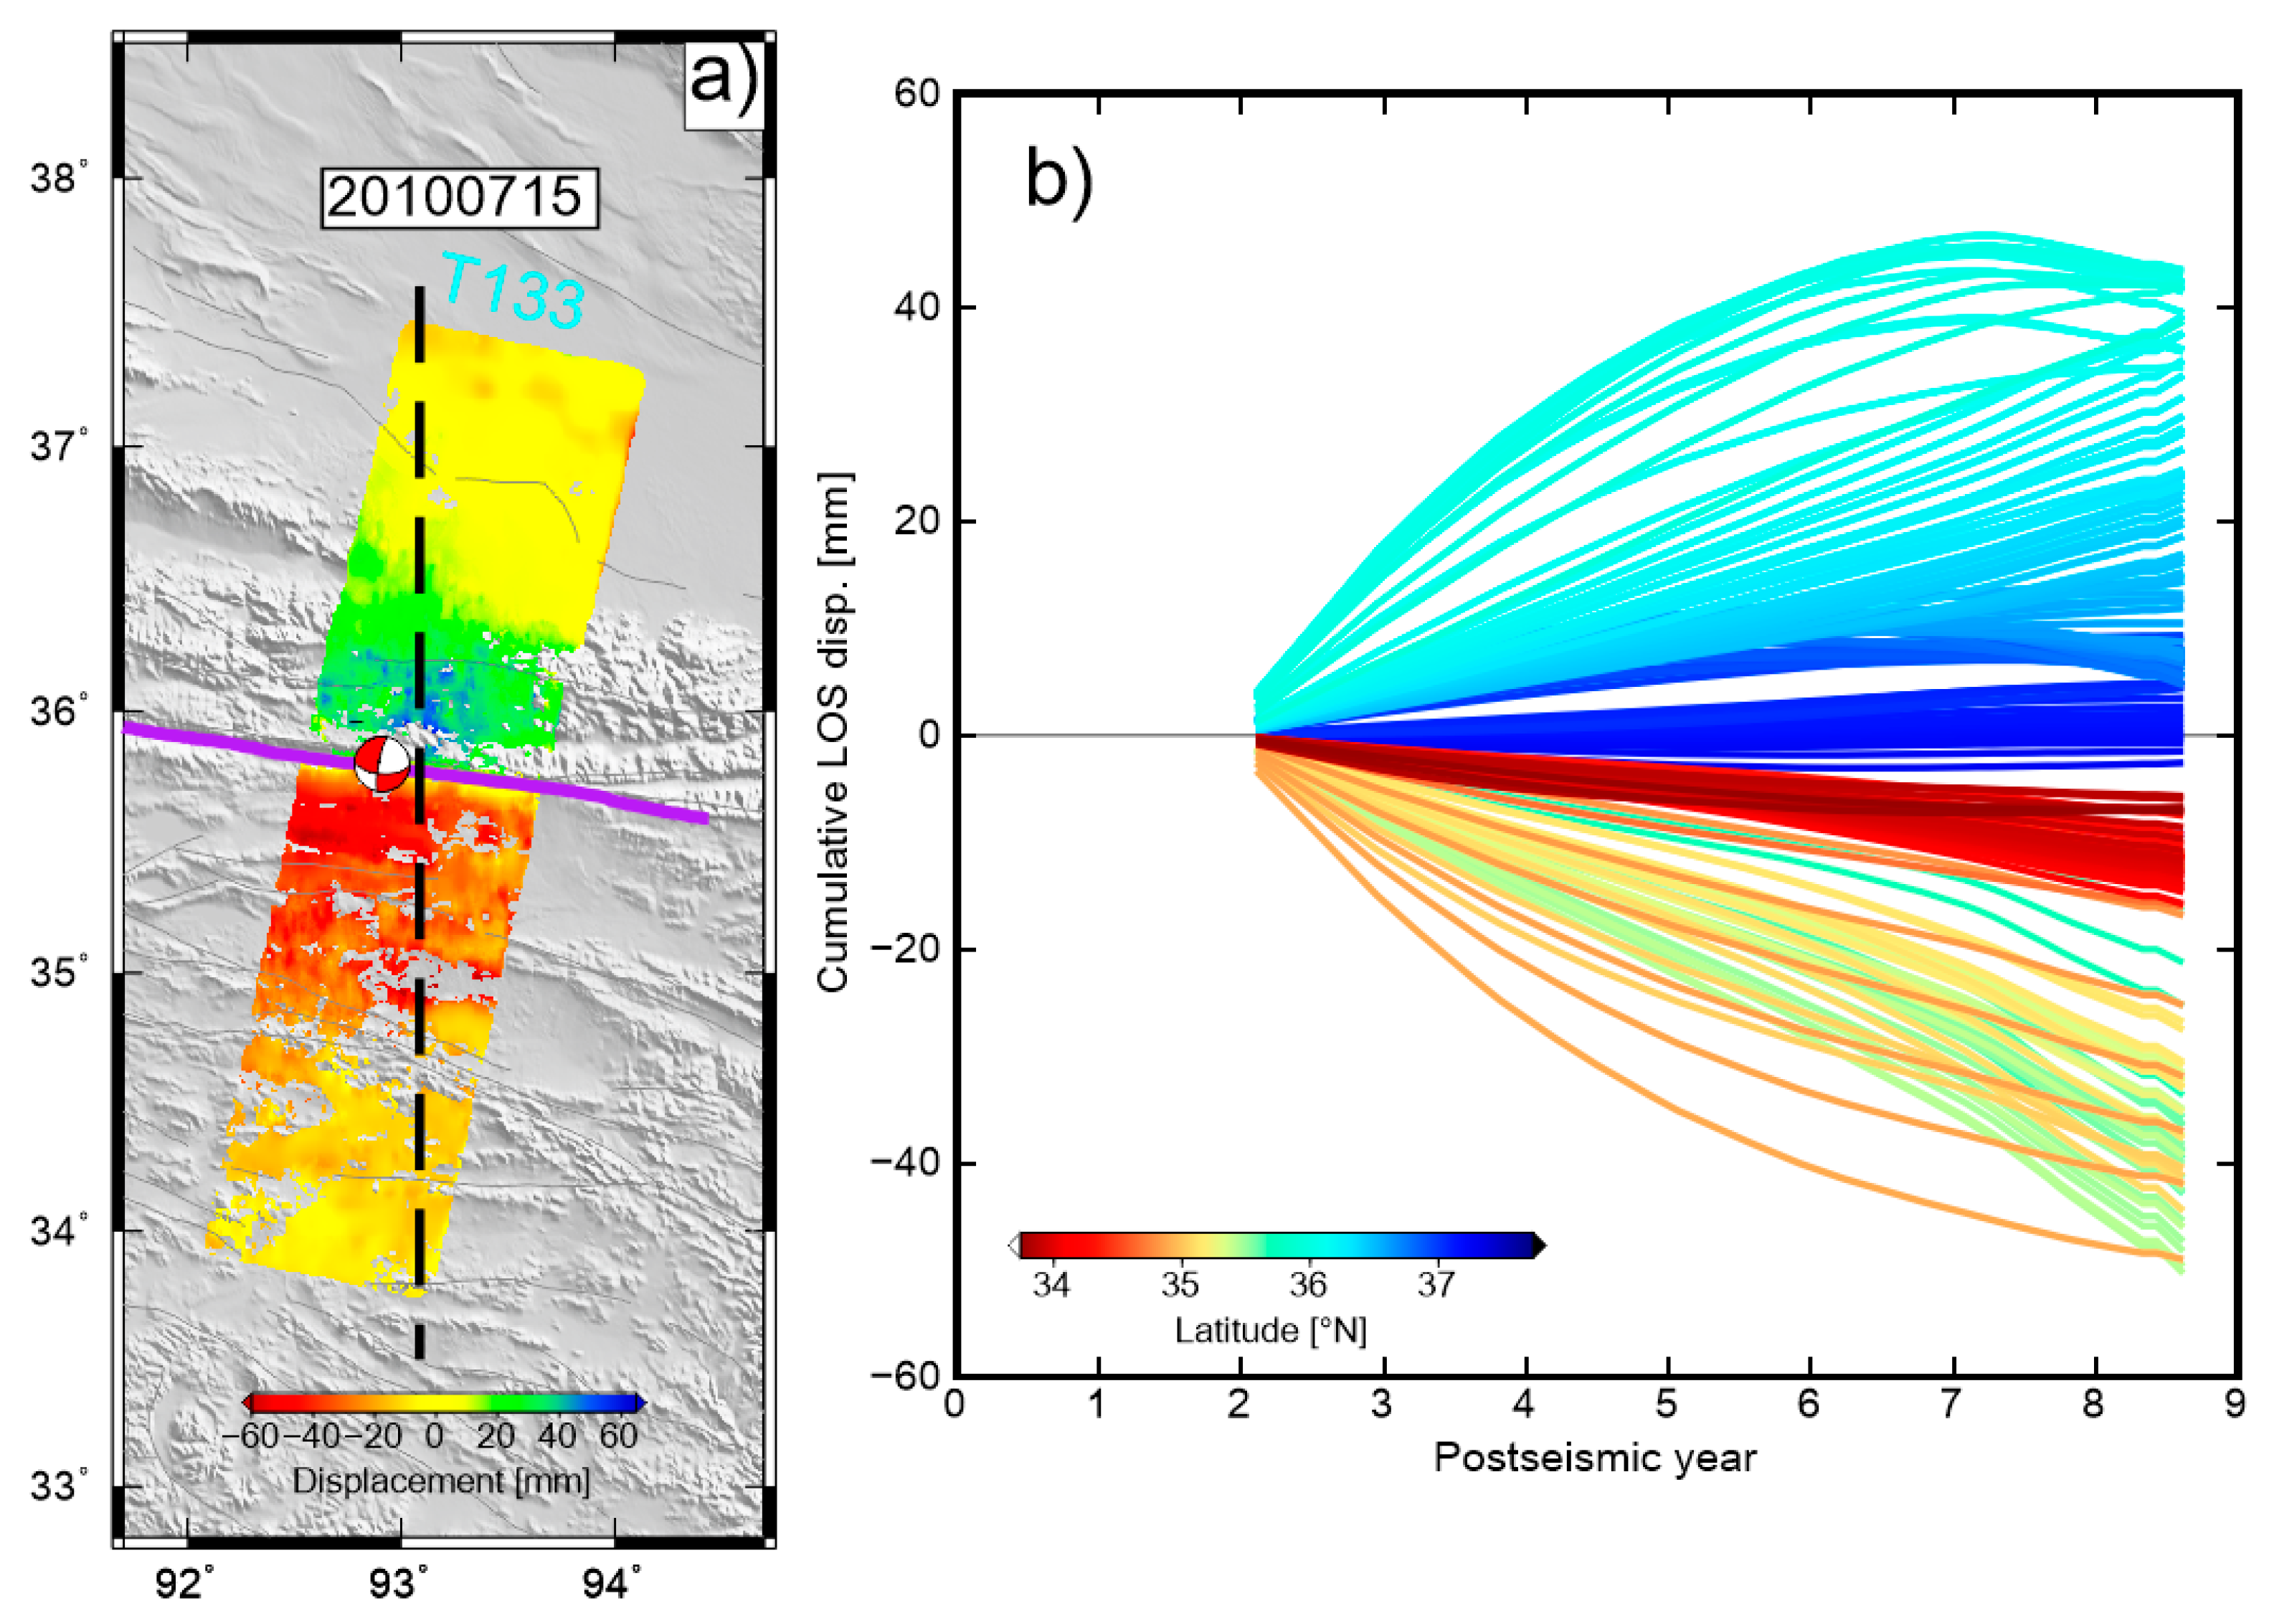
4.4. Timeseries Analysis along T133

We resolve the time and distance dependent timeseries of postseismic surface deformation in the epicentral area using the SAR dataset on T133 crossing the KF near the section of peak coseismic moment release. Figure 14 demonstrates the distribution of time-evolving cumulative LOS displacements at 27 acquisition dates following the mainshock referred to the first acquisition date, 30 October 2003. The patterns in these maps reveal the long and different deformation histories for the near- and far-field on two sides of the fault. The near-field displacements reach a maximum of ~60 mm around 93°E on both sides of the fault and the extent of deformation on the southern side is much larger than that on the northern side. The temporal variation of LOS displacements as a function of time is exhibited in Figure 15 and Figure 16. The contrasting nearly linear trend in the farfield and an approximately exponential decay in the nearfield display the time and distance dependent variation characteristics of the postseismic deformation.

5. Discussion and Conclusions

Significant trade-off between residual orbital ramps, atmospheric errors, and tectonic signals make resolving long time-span and large-coverage InSAR velocity maps a challenging task. For the ~300–400 km long-swath interferograms used in this study, the removal of quadratic residual orbital errors presents a first challenge [20]. To better estimate the orbital ramp superimposed on a highly asymmetric deformation field in the long-swath interferogram, we constrain the quadratic model ramp that is removed from the data relying on the two “far-field” regions on either end of the swaths (dashed rectangles in Figure 3a). The postseismic deformation zone is distributed over a very broad area, especially on the south side of the fault extending far south to ~33.8°N around ~92°E (Figure 9). This indicates that the postseismic deformation following the KKEQ appears to have affected the region further south than previous InSAR studies suggested [8,9]. Our result is consistent with the GPS observation in 2001–2002 in terms of spatial distribution of postseismic deformation [23,24,25] (Figure 9). The second challenge comes from atmospheric errors, including the variable radar phase delay in the stratified atmosphere and a turbulent mixing component. Global weather models, such as ERA-I from the European Center for Medium Range Weather Forecasts, can be utilized to calculate the atmospheric artifacts close to the acquisition time (i.e., within a few hours) of each SAR images [20,53,54,55]. Because of the coarse spatial resolution (~75 km) of each grid node in the ERA-I model, only medium to long wavelength atmospheric phase errors can be effectively corrected by this method. We choose to correct the interferograms using the phase-elevation correction and a spatiotemporal filter, which has been proven to significantly mitigate the shorter wavelength atmospheric noise in each acquisition [26] (Figure 4). Overall, the magnitude of postseismic velocity during 2003–2006 in our spatiotemporal evolution result is consistent with that reported by preceding researches [8,9], which indicated cumulative peak-to-trough displacement of ~20–30 cm during 2003–2005 (see Figure 11a).
Our spatiotemporal observations provide constraints on the evolution of large-scale postseismic deformation in 2003–2010 following the KKEQ, illustrating contrasting patterns and features along and across the 2001 rupture. Two notable features can be clearly identified, which are also major differences from previous studies. First, the highly asymmetrical distribution of postseismic deformation observed by both InSAR during 2003–2010 and GPS data in the first 3 months after the earthquake (Figure 9 and Figure 13). For the almost vertical strike-slip KF, a plausible explanation is that postseismic deformation here is mainly controlled by relaxation in the presence of across-fault contrasts in the effective viscosity and crustal structure between the Bayanhar block to the south and the Qaidam block to the north [5,8]. Crustal thickness changes at ~95°E, from 70 km beneath the Bayanhar block and East Kunlun Mountain to 50 km beneath the Qaidam basin, have been documented by Karplus et al. [56]. The rheological complexity at depth should be further explored before any reliable conclusion is made.
Second, the temporal decay behavior on the easternmost and westernmost section and along the central part on the main KF are different (~91.5°E–93.5°E) (Figure 11). More rapid decay rates of the postseismic deformation over three periods in the southern part of the fault are detected at the two ends of the 2001 rupture (Figure 8a,e), whereas rates notably decayed only to the north of the rupture in the central sections. However, the obvious postseismic deformation with narrower distribution and small velocity in the western section and extensional corridor show different spatial features compared with the postseismic deformation around the Kunlun Pass fault, where much larger deformation distribution area and velocity magnitude are revealed (Figure 7a–c,q–s). Interestingly, these two areas correspond to the initiation and termination of the rupture as well as two major changes of fault orientation [36,37]. In addition, the coseismic slip distribution constrained by InSAR observations [11] indicate that the slip on the fault plane in these two areas is lower than that along the main KF (i.e., >5 m slip within the upper 10 km of the main KF vs. up to 4 m slip between 15 and 20 km at the extremities). Such variations in postseismic deformation decay could be due to distinct coseismic stress disturbances, fault geometry changes or different rheological properties along the fault.
From the features of surface deformation distribution mentioned above, we speculate that the rapid postseismic deformation decay on the westernmost section might be mainly governed by stress-driven afterslip at shallower depth, while in the easternmost section it appears to be influenced or controlled by multiple factors. However, the abrupt drop of postseismic deformation velocity on the south side of the fault from ~6 mm/yr to ~1–2 mm/yr within ~100 km (94°E–95°E; see profile BB’ in Figure 10b), also obvious in Figure 12, implies that the role of the restraining bend in the easternmost section cannot be ignored when explaining the along-strike variations of postseismic deformation decay. The much wider distribution of postseismic deformation following the KKEQ compared to the coseismic motions, and the associated continuous postseismic stress build-up across the region are expected to promote possible triggering on nearby faults in the future, including along the Xidatan fault and the KPF (Figure 1a).

Author Contributions

Conceptualization, D.Z., C.Q., and B.R. Data curation, D.Z. and W.G. Formal analysis, D.Z. and C.Q. Investigation, D.Z. Methodology, W.G. Project administration, C.Q. and B.R. Resources, C.Q. Supervision, C.Q. and X.S. Validation, C.Q., B.R., W.G. and G.Z. Visualization, D.Z. Writing—original draft, D.Z. Writing—review & editing, X.S., B.R., W.G. and G.Z.

Funding

This work was supported by the National Natural Science Foundation of China (No. 41872229), the National Key Laboratory of Earthquake Dynamics (No. LED2015A03), the Basic Scientific Funding of Institute of Geology, China Earthquake Administration (No. IGCEA1809), and the National Aeronautics and Space Administration (NASA) Earth Surface and Interior (ESI) focus area (No. NNX17AE01G).

Acknowledgments

All Envisat data were acquired from the European Space Agency (ESA). The figures were produced using Generic Mapping Tools (GMT) software. The π-rate software developed by Hua Wang and applied for stacking is freely available online (http://homepages.see.leeds.ac.uk/~earhw/software/pi-rate/index.html).

Conflicts of Interest

The authors declare no conflicts of interest.

References

  1. Burgmann, R.; Dresen, G. Rheology of the lower crust and upper mantle: Evidence from rock mechanics, geodesy, and field observations. Annu. Rev. Earth Planet. Sci. 2008, 36, 531–567. [Google Scholar] [CrossRef]
  2. Pollitz, F.; Burgmann, R.; Banerjee, P. Post-seismic relaxation following the great 2004 Sumatra-Andaman earthquake on a compressible self-gravitating Earth. Geophys. J. Int. 2006, 167, 397–420. [Google Scholar] [CrossRef] [Green Version]
  3. Diao, F.Q.; Xiong, X.; Wang, R.J. Mechanisms of transient postseismic deformation following the 2001 Mw 7.8 Kunlun (China) earthquake. Pure Appl. Geophys. 2011, 168, 767–779. [Google Scholar] [CrossRef]
  4. Hetland, E.A.; Zhang, G. Effect of shear zones on post-seismic deformation with application to the 1997 Mw 7.6 Manyi earthquake. Geophys. J. Int. 2014, 198, 259–269. [Google Scholar] [CrossRef] [Green Version]
  5. He, P.C.; Wang, M.; Wang, Q.; Shen, Z.K. Rheological structure of lithosphere in northern Tibet inferred from postseismic deformation of the Mw7.8 Kokoxili earthquake. Chin. J. Geophys. 2018, 62, 531–544, (In Chinese with English abstract). [Google Scholar]
  6. Hilley, G.E.; Bürgmann, R.; Zhang, P.Z.; Molnar, P. Bayesian inference of plastosphere viscosities near the Kunlun Fault, northern Tibet. Geophys. Res. Lett. 2005, 32, L01302. [Google Scholar] [CrossRef]
  7. Ryder, I.; Parsons, B.; Wright, T.J.; Funning, G.J. Post-seismic motion following the 1997 Manyi (Tibet) earthquake: InSAR observations and modelling. Geophys. J. Int. 2007, 169, 1009–1027. [Google Scholar] [CrossRef] [Green Version]
  8. Ryder, I.; Bürgmann, R.; Pollitz, F. Lower crustal relaxation beneath the Tibetan Plateau and Qaidam Basin following the 2001 Kokoxili earthquake. Geophys. J. Int. 2011, 187, 613–630. [Google Scholar] [CrossRef] [Green Version]
  9. Wen, Y.; Li, Z.; Xu, C.; Ryder, I.; Bürgmann, R. Postseismic motion after the 2001 Mw 7.8 Kokoxili earthquake in Tibet observed by InSAR time series. J. Geophys. Res. 2012, 117, B08405. [Google Scholar] [CrossRef]
  10. Xu, X.W.; Chen, W.; Ma, W.; Yu, G.; Chen, G. Surface rupture of the Kunlunshan earthquake (Ms 8.1), northern Tibetan plateau, China. Seismol. Res. Lett. 2002, 73, 884–892. [Google Scholar] [CrossRef]
  11. Lasserre, C.; Peltzer, G.; Crampé, F.; Klinger, Y.; Van Der Woerd, J.; Tapponnier, P. Coseismic deformation of the 2001 Mw = 7.8 Kokoxili earthquake in Tibet, measured by synthetic aperture radar interferometry. J. Geophys. Res. 2005, 110, B12408. [Google Scholar] [CrossRef]
  12. Lin, A.; Fu, B.; Guo, J.; Zeng, Q.; Dang, G.; He, W.; Zhao, Y. Co-seismic strike-slip and rupture length produced by the 2001 Ms 8.1 Central Kunlun earthquake. Science 2002, 296, 2015–2017. [Google Scholar] [CrossRef] [PubMed]
  13. Van der Woerd, J.; Mériaux, A.-S.; Klinger, Y.; Ryerson, F.; Gaudemer, Y.; Tapponnier, P. The 14 November 2001, Mw = 7.8 Kokoxili earthquake in northern Tibet (Qinghai province, China). Seismol. Res. Lett. 2002, 73, 125–135. [Google Scholar] [CrossRef]
  14. Van der Woerd, J.; Tapponnier, P.; Ryerson, F.; Meriaux, A.-S.; Meyer, B.; Gaudemer, Y.; Finkel, R.; Caffee, M.; Zhao, G.; Xu, Z. Uniform Post-glacial slip-rate along the central 600 km of the Kunlun fault (Tibet), from 26Al, 10Be and 14C dating of riser offsets, and climatic origin of the regional morphology. Geophys. J. Int. 2002, 148, 356–388. [Google Scholar] [CrossRef]
  15. Xiong, X.; Shan, B.; Zheng, Y.; Wang, R. Stress transfer and its implication for earthquake hazard on the Kunlun Fault, Tibet. Tectonophysics 2010, 482, 216–225. [Google Scholar] [CrossRef] [Green Version]
  16. Van der Woerd, J.; Ryerson, F.J.; Tapponnier, P.; Gaudemer, Y.; Finkel, R.; Meriaux, A.S.; Caffee, M.; Zhao, G.; He, Q. Holocene left-slip rate determined by cosmogenic surface dating on the Xidatan segment of the Kunlun fault (Qinghai, China). Geology 1998, 26, 695–698. [Google Scholar] [CrossRef]
  17. Burgmann, R.; Rosen, P.A.; Fielding, E.J. Synthetic aperture radar interferometry to measure Earth’s surface topography and its deformation. Annu. Rev. Earth Planet. Sci. 2000, 28, 169–209. [Google Scholar] [CrossRef]
  18. Hooper, A.; Segall, P.; Zebker, H. Persistent scatterer interferometric synthetic aperture radar for crustal deformation analysis, with application to Volcan Alcedo, Galapagos. J. Geophys. Res. 2007, 112, B07407. [Google Scholar] [CrossRef]
  19. Fialko, Y. Interseismic strain accumulation and the earthquake potential on the southern San Andreas fault system. Nature 2006, 441, 968–971. [Google Scholar] [CrossRef] [Green Version]
  20. Daout, S.; Doin, M.-P.; Peltzer, G.; Lasserre, C.; Socquet, A.; Volat, M.; Sudhaus, H. Strain Partitioning and Present-Day Fault Kinematics in NW Tibet from Envisat SAR Interferometry. J. Geophys. Res. 2018, 123, 2462–2483. [Google Scholar] [CrossRef]
  21. Freymueller, J.; Wang, Q. Asymmetric postseismic deformation following the 2001 Kokoxili earthquake requires heterogeneity in material properties. In Proceedings of the EGS-AGU-EUG Joint Assembly, Nice, France, 6–11 April 2003. [Google Scholar]
  22. Shen, Z.-K.; Zeng, Y.; Wang, M.; Wang, Q.; Wang, Q.-L.; Wan, Y.; Gan, W.; Zhang, Z. Postseismic deformation modeling of the 2001 Kokoxili earthquake, western China. In Proceedings of the EGS-AGU-EUG Joint Assembly, Nice, France, 6–11 April 2003. [Google Scholar]
  23. Qiao, X.J.; Wang, Q.; Du, R.L.; You, X.Z.; Tan, K. Characteristics of crustal deformation relating to Ms8.1 Kunlun Earthquake. J. Geod. Geodyn. 2002, 22, 6–11, (In Chinese with English abstract). [Google Scholar]
  24. Ren, J.; Wang, M. GPS measured crustal deformation of the Ms8.1 Kunlun earthquake on November 14th 2001 in Qinghai-Xizang plateau. Quat. Sci. 2005, 25, 34–44, (In Chinese with English abstract). [Google Scholar]
  25. Zhao, B.; Huang, Y.; Zhang, C.; Wang, W.; Tan, K.; Du, R. Crustal deformation on the Chinese mainland during 1998–2014 based on GPS data. Geod. Geodyn. 2015, 6, 7–15. [Google Scholar] [CrossRef]
  26. Garthwaite, M.C.; Wang, H.; Wright, T.J. Broadscale interseismic deformation and fault slip rates in the central Tibetan Plateau observed using InSAR. J. Geophys. Res. 2013, 118, 5071–5083. [Google Scholar] [CrossRef] [Green Version]
  27. Tapponnier, P.; Xu, Z.; Roger, F.; Meyer, B.; Arnaud, N.; Wittlinger, G.; Yang, J. Oblique stepwise rise and growth of the Tibet Plateau. Science 2001, 294, 1671–1677. [Google Scholar] [CrossRef] [PubMed]
  28. Chen, J.; Chen, Y.K.; Ding, G.Y.; Tian, Q.J.; Wang, Z.J.; Shan, X.J.; Ren, J.W.; Zhao, R.B.; Wang, Z.C. Surface rupture zones of the 2001 earthquake Ms 8.1 west of Kunlun Pass, northern Qinghai-Xizang Plateau. Quat. Sci. 2003, 23, 629–639, (In Chinese with English abstract). [Google Scholar]
  29. Deng, Q.D.; Lan, Y.K.; Yang, X.P.; Min, W.; Chu, Q.Z. Active Tectonic Map of China; Earthquake Press: Beijing, China, 2007. [Google Scholar]
  30. Wang, W.; Qiao, X.; Yang, S.; Wang, D. Present-day velocity field and block kinematics of Tibetan Plateau from GPS measurements. Geophys. J. Int. 2017, 208, 1088–1102. [Google Scholar] [CrossRef]
  31. Kirby, E.; Harkins, N.; Wang, E.; Shi, X.; Fan, C.; Burbank, D. Slip rate gradients along the eastern Kunlun fault. Tectonics 2007, 26, TC2010. [Google Scholar] [CrossRef]
  32. Li, H.; Van der Woerd, J.; Klinger, Y.; Tapponnier, P.; Qi, X.; Yang, J.; Zhu, Y. Slip rate on the Kunlun Fault and recurrence time of great earthquake comparable to the 14/11/2001, Mw 7.8 Kokoxili earthquake at Hongshui Gou. Earth Planet. Sci. Lett. 2005, 237, 285–299. [Google Scholar]
  33. Wang, Q.; Zhang, P.Z.; Freymueller, J.T.; Bilham, R.; Larson, K.M.; Lai, X.A.; You, X.; Liu, J. Present-day crustal deformation in China constrained by global positioning system measurements. Science 2001, 294, 574–577. [Google Scholar] [CrossRef]
  34. Zhang, P.Z.; Shen, Z.; Wang, M.; Gan, W.; Bürgmann, R.; Molnar, P.; Wang, Q.; Niu, Z.; Sun, J.; Wu, J.; et al. Continuous deformation of the Tibetan Plateau from global positioning system data. Geology 2004, 32, 809–812. [Google Scholar] [CrossRef]
  35. Bouchon, M.; Vallée, M. Observation of long supershear rupture during the magnitude 8.1 Kunlunshan earthquake. Science 2003, 301, 824–826. [Google Scholar] [CrossRef] [PubMed]
  36. Klinger, Y.; Michel, R.; King, G.C.P. Evidence for an earthquake barrier model from Mw ∼ 7.8 Kokoxili (Tibet) earthquake slip-distribution. Earth Planet. Sci. Lett. 2006, 242, 354–364. [Google Scholar] [CrossRef]
  37. Klinger, Y.; Xu, X.; Tapponnier, P.; Van der Woerd, J.; Lasserre, C.; King, G. High-resolution satellite imagery mapping the rupture and slip distribution of the Mw=7.8, November 14, 2001 Kokoxili earthquake (Kunlun, Tibet, China). Bull. Seismol. Soc. Am. 2005, 95, 1970–1987. [Google Scholar] [CrossRef]
  38. Kruskal, J.B. On the shortest spanning subtree of a graph and the traveling salesman problem. Proc. Am. Math. Soc. 1956, 7, 48–50. [Google Scholar] [CrossRef]
  39. Werner, C.; Wegmüller, U.; Strozzi, T.; Wiesmann, A. GAMMA SAR and interferometric processing software. In Proceedings of the ERS-Envisat Symposium, Gothenburg, Sweden, 16–20 October 2000. [Google Scholar]
  40. Werner, C.; Wegmüller, U.; Strozzi, T. Processing strategies for phase unwrapping for InSAR applications. In Proceedings of the European Conference on Synthetic Aperture Radar (EUSAR 2002), Cologne, Germany, 4–6 June 2002. [Google Scholar]
  41. Goldstein, R.M.; Werner, C.L. Radar interferogram filtering for geophysical applications. Geophys. Res. Lett. 1998, 25, 4035–4038. [Google Scholar] [CrossRef] [Green Version]
  42. Biggs, J.; Wright, T.; Zhong, L.; Parsons, B. Multi-interferogram method for measuring interseismic deformation: Denali Fault, Alaska. Geophys. J. Int. 2007, 170, 1165–1179. [Google Scholar] [CrossRef] [Green Version]
  43. Elliott, J.R.; Biggs, J.; Parsons, B.; Wright, T.J. InSAR slip rate determination on the Altyn Tagh Fault, northern Tibet, in the presence of topographically correlated atmospheric delays. Geophys. Res. Lett. 2008, 35, L12309. [Google Scholar] [CrossRef]
  44. Wang, H.; Wright, T.J.; Biggs, J. Interseismic slip rate of the northwestern Xianshuihe fault from InSAR data. Geophys. Res. Lett. 2009, 36, L03302. [Google Scholar] [CrossRef]
  45. Wang, H.; Wright, T.J.; Yu, Y.; Lin, H.; Jiang, L.; Li, C.; Qiu, G. InSAR reveals coastal subsidence in the Pearl River Delta, China. Geophys. J. Int. 2012, 191, 1119–1128. [Google Scholar] [CrossRef]
  46. Pagli, C.; Wang, H.; Wright, T.J.; Calais, E.; Lewi, E. Current plate boundary deformation of the Afar rift from a 3-D velocity field inversion of InSAR and GPS. J. Geophys. Res. 2014, 119, 8562–8575. [Google Scholar] [CrossRef] [Green Version]
  47. Hanssen, R.F. Radar Interferometry-Data Interpretation and Error Analysis; Kluwer Academic Publishers: Dordrecht, The Netherlands, 2001. [Google Scholar]
  48. Taylor, M.; Peltzer, G. Current slip rates on conjugate strike-slip faults in central Tibet using synthetic aperture radar interferometry. J. Geophys. Res. 2006, 111, B12402. [Google Scholar] [CrossRef]
  49. Parsons, B.; Wright, T.; Rowe, P.; Andrews, J.; Jackson, J.; Walker, R.; Khatib, M.; Talebian, M.; Bergman, E.; Engdahl, E.R. The 1994 Sefidabeh (eastern Iran) earthquakes revisited: New evidence from satellite radar interferometry and carbonate dating about the growth of an active fold above a blind thrust fault. Geophys. J. Int. 2006, 164, 202–217. [Google Scholar] [CrossRef]
  50. Jolivet, R.; Lasserre, C.; Doin, M.-P.; Guillaso, S.; Peltzer, G.; Dailu, R.; Sun, J.; Shen, Z.K.; Xu, X. Shallow creep on the Haiyuan fault (Gansu, China) revealed by SAR interferometry. J. Geophys. Res. 2012, 117, B06401. [Google Scholar] [CrossRef]
  51. Schmidt, D.A.; Burgmann, R. Time-dependent land uplift and subsidence in the Santa Clara valley, California, from a large interferometric synthetic aperture radar data set. J. Geophys. Res. 2003, 18, 2416. [Google Scholar] [CrossRef]
  52. Tocheport, A.; Rivera, L.; Van der Woerd, J. A study of the 14 November 2001 Kokoxili earthquake: History and geometry of the rupture from teleseismic data and field observations. Bull. Seismol. Soc. Am. 2006, 96, 1729–1741. [Google Scholar] [CrossRef]
  53. Doin, M.-P.; Lasserre, C.; Peltzer, G.; Cavalié, O.; Doubre, C. Corrections of stratified tropospheric delays in SAR interferometry: Validation with global atmospheric models. J. Appl. Geophys. 2009, 69, 35–50. [Google Scholar] [CrossRef]
  54. Doin, M.-P.; Lodge, F.; Guillaso, S.; Jolivet, R.; Lasserre, C.; Ducret, G.; Grandin, R.; Pathier, E.; Pinel, V. Presentation of the small baseline NSBAS processing chain on a case example: The Etna deformation monitoring from 2003 to 2010 using ENVISAT data. In Proceedings of the Fringe Symposium, Frascati, Italy, 19–23 September 2011. [Google Scholar]
  55. Jolivet, R.; Grandin, R.; Lasserre, C.; Doin, M.-P.; Peltzer, G. Systematic InSAR tropospheric phase delay corrections from global meteorological reanalysis data. Geophys. Res. Lett. 2011, 38, L17311. [Google Scholar] [CrossRef]
  56. Karplus, M.S.; Zhao, W.; Klemperer, S.L.; Wu, Z.; Mechie, J.; Shi, D.; Brown, D.; Chen, C. Injection of Tibetan crust beneath the south Qaidam Basin: Evidence from INDEPTH IV wide-angle seismic data. J. Geophys. Res. 2011, 116, B07301. [Google Scholar] [CrossRef]
Figure 1. (a) Tectonic map of the central Tibetan Plateau showing the main active faults (bold black lines, modified from Tapponnier et al. [27]). Cyan dots indicate the seismicity (M > 4) between 2001 and 2011 from USGS (https://earthquake.usgs.gov). T448, T405, T176, T133 and T90 refer to the five descending Envisat/ASAR tracks used in our study, marked by green boxes. The Global Centroid Moment Tensor (GCMT) focal mechanisms of the 1997 Mw7.6 Manyi, 2001 Mw7.8 Kokoxili and 2010 Mw6.9 Yushu earthquakes are shown. Surface ruptures of the Kokoxili earthquake from field investigation are shown by red lines, modified from Xu et al. [10] and Chen et al. [28]. Grey lines indicate the active faults [29]; (b) Detailed map of horizontal (yellow bars) and vertical offsets (blue bars) and surface ruptures (red lines) from field studies of the 2001 Kokoxili earthquake. The six segments of the surface rupture are delimited by black blod lines: 1 (western section), 2 (extensional corridor), 3 (Bukadaban Peek section), 4 (western Kusai section), 5 (eastern Kusai section), 6 (Kunlun Pass section). The focal mechanisms of the 2001 Kokoxili earthquake from USGS and GCMT are presented in blue and red at their hypocenter and moment centroid locations, respectively. The white triangles in (a,b) represent the GPS stations operated by the Crustal Motion Observation Network of China [25,30]. The black arrows indicate azimuth and line-of-sight (LOS) directions of descending Envisat tracks.
Remotesensing 10 01988 g001
Figure 2. Perpendicular and temporal baseline plot showing the network of interferograms on five descending tracks 448, 176, 405, 133 and 90 used in this study. The dates listed on the right of each subplot are SAR acquisitions corresponding to the labelled blue circles, the red circles mark the master images for each track. The lines present the interferometric pairs coloured according to the fraction of successfully unwrapped pixels normalized to the interferogram with the best coherence on each track. The solid lines are selected interferograms derived by the minimum spanning tree algorithm (MST) [38].
Remotesensing 10 01988 g002
Figure 3. Two examples of InSAR phase error corrections for interferograms (20050929–20090730, 20061019–20090205) on track 133; (a,f) Original unwrapped interferograms; (b,g) Estimates of quadratic orbital ramp errors; (c,h) Interferograms following orbital error correction; (d,i) Interferograms corrected for topographically correlated atmospheric delay errors;. (e,j) Interferograms corrected using spatiotemporal filters to mitigate residual atmospheric phase screen (APS). Note that different color scales are applied for some subplots. The black boxes in (a,f) are defined as “far-field” and are used to construct the quadratic model in the orbital error correction.
Remotesensing 10 01988 g003
Figure 4. (a) Covariance as an exponential function of distance for 44 interferograms on track 176 before (blue) and after (red) atmospheric phase screen (APS) correction; (b,c) Variance and e-folding wavelength of the exponential function for the interferograms on track 176 before and after (green filled and purple unfilled histograms, respectively) APS correction; (d) Maximum covariance of the interferograms on track 176 before (blue circles) and after (red diamonds) APS correction. Lines indicate the mean values of all the maximum covariences before (blue) and after (red) APS correction.
Remotesensing 10 01988 g004
Figure 5. Line of sight (LOS) postseismic surface velocities (2003–2010) following the 2001 Kokoxili earthquake for each InSAR track, 448 (a), 176 (b), 405 (c), 133 (d) and 90 (e), from west to east. Fault traces, focal mechanism and surface ruptures caused by the 2001 event are as in Figure 1. The dark line in each panel is the profile location for plots in Figure 6.
Remotesensing 10 01988 g005
Figure 6. Fault-perpendicular profiles of postseismic LOS velocities (2003–2010) within 10 km along the five lines described in Figure 5, 448 (a), 176 (b), 405 (c), 133 (d) and 90 (e). The black arrows delimit the approximate width of the near-fault postseismic deformation zone on the southern (S) and northern (N) sides of the KF (represented by black dashed line). The black dashed lines indicate approximate location of peak velocity values on either side of the fault.
Remotesensing 10 01988 g006
Figure 7. Average line of sight (LOS) postseismic velocity maps for track 448 (ac), 176 (dg), 405 (hj), 133 (kp) and 90 (qs). Fault traces, beach ball and surface ruptures caused by the 2001 event are as in Figure 1. The dark line in (c,g,j,p,s) is the profile location in Figure 8.
Remotesensing 10 01988 g007aRemotesensing 10 01988 g007b
Figure 8. Comparison of postseismic velocity profiles in six periods for different segments along the KF, 448 (a), 176 (b), 405 (c), 133 (d) and 90 (e), (profile locations see Figure 7). The black dashed ellipses in (a,e) outline areas to the south of the KF where the rapid decay of postseismic deformation is clearly identified.
Remotesensing 10 01988 g008
Figure 9. Collage of postseismic LOS rate maps (2003–2010) on five descending tracks 448, 176, 405, 133 and 90. Fault traces, focal mechanism and surface ruptures caused by the 2001 Kokoxili earthquake are as in Figure 1. AA’, BB’, CC’, and DD’ indicate four profile locations for plots in Figure 10 and Figure 13. White triangles show the sites of postseismic GPS observations. The blue (observed in 2001–2002) and cyan (observed in 2009–2014) vectors are GPS velocities from Qiao et al. [23], Ren and Wang [24] and Zhao et al. [25].
Remotesensing 10 01988 g009
Figure 10. (a) Elevation variation along profiles AA’ and BB’ in Figure 9; (b) InSAR Line of sight (LOS) postseismic deformation velocity in 2003–2010 along profiles AA’ (blue bars) and BB’ (red bars). The yellow bar indicates the moment centroid (GCMT) of the 2001 Kokoxili earthquake; (c) InSAR velocity profile (2003–2010) along fault-perpendicular direction in CC’ encompassing the five tracks to show the variations both along and across the fault. The dot color indicates the longitude of position along the Kunlun fault. Vertical grey lines in (c) mark rough position of the Kunlun fault traces. The locations of profile AA’, BB’ and CC’ are shown in Figure 9.
Remotesensing 10 01988 g010aRemotesensing 10 01988 g010b
Figure 11. InSAR postseismic velocity maps in different periods following the 2001 event covering the whole rupture on five overlapping tracks: (a) 2003–2006; (b) 2004–2007; (c) 2005–2008; (d) 2006–2009; (e) 2007–2010 and (f) 2008–2011. The purple lines denote the 2001 surface rupture. The beach ball represents the focal mechanism of the 2001 event. The black dash lines in (f) are profile locations along the fault.
Remotesensing 10 01988 g011
Figure 12. (a) Comparison of postseismic velocities profiles in parallel-fault direction in six periods to show temporal and spatial characteristics of the postseismic deformation in the southern and northern side of the fault (for profile locations EE’ and FF’ see in Figure 11). The yellow bar denotes the moment centroid (GCMT) of the 2001 Kokoxili earthquake; (b) Elevation variation along profiles EE’ and FF’.
Remotesensing 10 01988 g012
Figure 13. Comparison of postseismic InSAR LOS velocity at ~94°E and GPS observations projected along the across-fault profile DD’ shown in Figure 9. Green and red squares with 2-sigma errors bars represent the LOS-converted horizontal GPS velocities observed in 2001–2002 and 2009–2014, respectively. Blue and purple dots indicate the InSAR velocity observation during 2003–2010 and 2008–2011, respectively.
Remotesensing 10 01988 g013
Figure 14. Smoothed InSAR timeseries for Envisat descending track 133. Line of sight (LOS) cumulative displacements are referenced to the first acquisition date, 30 October 2003. Negative range change is toward satellite. The surface ruptures caused by the 2001 Kokoxili earthquake and the active faults are as in Figure 1b. Black dashed line in the last snapshot indicates the location of the profile shown in Figure 15.
Remotesensing 10 01988 g014
Figure 15. The 3D (a) and plane view (b) of fault perpendicular profiles of line of sight (LOS) cumulative displacement across the Kunlun fault on track 133 as a function of time, color-coded by their acquisition date relative to 30 October 2003. The grey dashed line shows the approximate location of the Kunlun fault. The profile is taken from the central T133 timeseries and its location is shown in Figure 14.
Remotesensing 10 01988 g015
Figure 16. (a) Snapshot of the line of sight (LOS) InSAR timeseries on track 133 at acquisition date 15 July 2010 relative to 30 October 2003. The 2001 ruptures, the active faults and the focal mechanism are as in Figure 1b. The black dashed line shows the location of the north-south profile shown on panel b; (b) Range change time series showing varying cumulative displacements in near- and far-field. The color of each curve is based on its latitude.
Remotesensing 10 01988 g016
Table 1. Details of SAR data in our study.
TrackFault Sections Coverage 1Observation PeriodsNumber of AcquisitionsNumber of InterferogramsNumber of Selected InterferogramsDescending/AscendingIncidence Angle (°)
4481 and 22004–2010175331Descending~33
17632004–20101711246Descending~33
40542003–20101515444Descending~33
13352003–20102712471Descending~33
9062004–20102412529Descending~33
1 The first-order segmentation of the Kunlun fault along 2001 rupture (see their locations in Figure 1b): 1 (western section), 2 (extensional corridor), 3 (Bukadaban Peek section), 4 (western Kusai section), 5 (eastern Kusai section) and 6 (Kunlun Pass section).
Table 2. Number of the interferograms on five descending tracks used in each sub-period to derive the temporal evolution of the postseismic deformation.
Track2003–20062004–20072005–20082006–20092007–20102008–2011
448///102513
176/16/1727
405//334/
1333510192833
90///31310

