Article

The Spatio-Temporal Evolution of River Island Based on Landsat Satellite Imagery, Hydrodynamic Numerical Simulation and Observed Data

1
School of Marine Sciences, Nanjing University of Information Science and Technology, Nanjing 210044, China
2
Key Lab of Marine Science and Numerical Modeling, First Institute of Oceanography, State Oceanic Administration, Qingdao 266061, China
3
Department of Atmospheric and Oceanic Sciences, University of California, Los Angeles, CA 90095, USA
4
Laboratory for Regional Oceanography and Numerical Modeling, Qingdao National Laboratory for Marine Science and Technology, Qingdao 266237, China
*
Author to whom correspondence should be addressed.
Remote Sens. 2018, 10(12), 2046; https://0-doi-org.brum.beds.ac.uk/10.3390/rs10122046
Submission received: 22 November 2018 / Revised: 11 December 2018 / Accepted: 12 December 2018 / Published: 16 December 2018

Abstract

:
A river island is a shaped sediment accumulation body with its top above the water’s surface in crooked or branching streams. In this paper, four river islands in Yangzhong City in the lower reaches of the Yangtze River were studied. The spatio-temporal evolution information of the islands was quantitatively extracted using the threshold value method, binarization model, and cluster analysis, based on Thematic Mapper (TM) and Enhanced Thematic Mapper+ (ETM+) images of the Landsat satellite series from 1985 to 2015. The variation mechanism and influencing factors were analyzed using an unstructured-grid, Finite-Volume Coastal Ocean Model (FVCOM) hydrodynamic numerical simulation, as well as the water-sediment data measured by hydrological stations. The annual average total area of these islands was 251,224.46 m2 during 1985–2015, and the total area first increased during 1985–2000 and decreased later during 2000–2015. Generally, the total area increased during these 30 years. Taipingzhou island had the largest area and the biggest changing rate, Xishadao island had the smallest area, and Zhongxinsha island had the smallest changing rate. The river islands’ area change was influenced by river runoff, sediment discharge, and precipitation, and sediment discharge proved to be the most significant natural factor in island evolution. River island evolution was also found to be affected by both runoff and oceanic tide. The difference in flow-field caused silting up in the Leigongdao Island and the head of Taipingzhou Island, and a serious reduction in the middle and tail of Taipingzhou Island. The method used in this paper has good applicability to river islands in other rivers around the world.

Graphical Abstract

1. Introduction

Naturally formed river islands can be divided into lithoid islands and alluvial islands, according to their nature. Most of the islands in the lower reaches of the Yangtze River (hereinafter referred to as LRYR) are alluvial islands, which are formed by the silting up of flood plains. Some islands are above the mean water level, and suspended load covers the top of these islands during the flood period. Some other islands are always above the surface water even during floods. Baguazhou Island in LRYR, Chongming Island in the Yangtze Estuary, and Juzizhou Island in the Xiangjiang River in China are typical river islands. The formation of river islands usually takes a very long time, such as Jiangxinzhou Island in the Maanshan section of the Yangtze River, where porcelains from the Tang Dynasty were excavated. This shows that some islands formed over a period of one thousand years. On 8 November 2017, the main bank of Taipingzhou, the main island of Yangzhong City in LRYR collapsed, leaving a hole 240 m wide and 150 m deep. Several residential houses were also swept into the river, causing huge property losses. Thus, research on river islands in Yangzhong City not only has positive practical significance, but also provides references for the management and protection of other islands in LRYR.
The middle and lower reaches of the Yangtze River are hot-spots for research because of its economic status. Many studies focus on the main stream and drainage basin of the middle and lower reaches of the Yangtze River [1,2,3,4,5]. The spatio-temporal evolution of four natural lakes in this basin—Dongting Lake, Poyang Lake, Chaohu Lake, and Taihu Lake—were analyzed from 2002 to 2013. Precipitation and changes in river inflow were observed to be important influencing factors [6]. The opening of the Three Gorges Dam also affected the air temperature and vegetation change characteristics in the basin [7]. River islands usually experience erosion in the flood season and silting-up in the dry season [8]. The change in watershed hydrological pattern can impact the undeveloped wetland environment [9].
Some other scholars have also studied river islands [10,11,12,13,14]. Eight river islands in the Mawutong section of the Yangtze River were quantitatively researched. Their lengths increased at various rates during 1979–2006 [15,16]. The evolution of river islands in the Nanjing section in LRYR were extracted, and sediment discharge was found to be the most significant influencing factor [17]. The sediment supply from the Yangtze River was also found to affect the coastline of the Zhoushan Islands around the Yangtze Estuary [18]. Satellite remote sensing has been an efficient means to study river islands. Landsat and Google Earth images were used to analyze the changes of the islands in the middle and lower reaches of the Yangtze River [19]. Some studies of the river island in Majuli River in India about the erosion and land utilization were based on remote sensing data [20,21,22,23]. River islands have an impact on the circulation distribution in the branching channel [24]. The evolution of river islands is affected by many factors, including levels of runoff and sediment. The islands which lie at higher elevations may be more stable, according to a study of some islands in the Piave River in Italy [25].
Few scholars [15,16,17] have quantitatively extracted river islands and systematically analyzed the factors that affect their evolution. With the development of remote sensing technology and computing power, the study of river islands has become realistic and efficient. In this study, Landsat Thematic Mapper (TM)/Enhanced Thematic Mapper+ (ETM+) images were applied to extract four river islands in Yangzhong City in LRYR from 1985 to 2015. The objectives of this study were: (i) To obtain the continuous, long-term, spatio-temporal variation features of these river islands, including their areas and shapes; (ii) to estimate the factors that influenced the islands’ evolution, including precipitation, runoff discharge, and sediment discharge; and (iii) to investigate how the distribution of flow field affected the erosion or deposition of river islands.

2. Study Area and Data
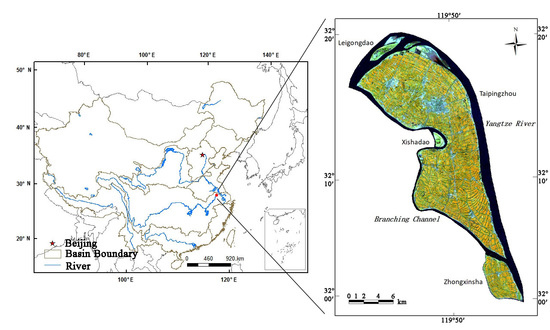
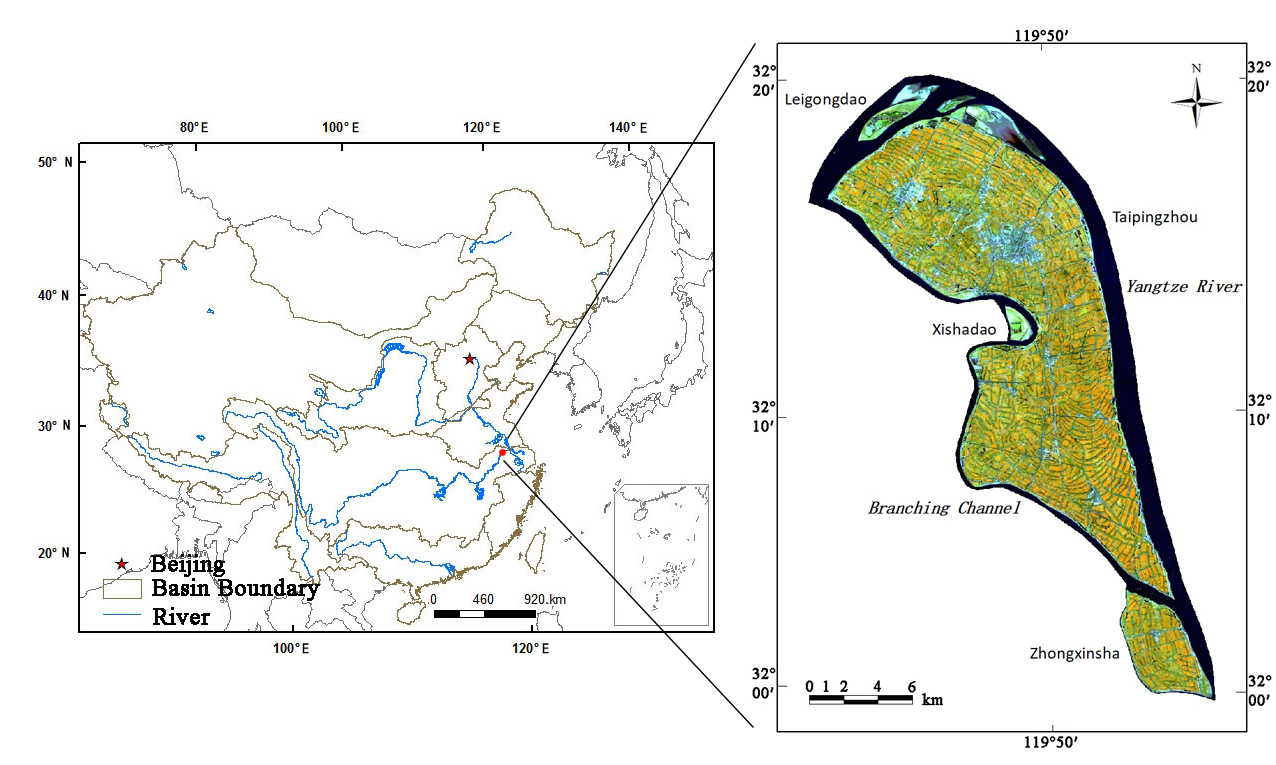
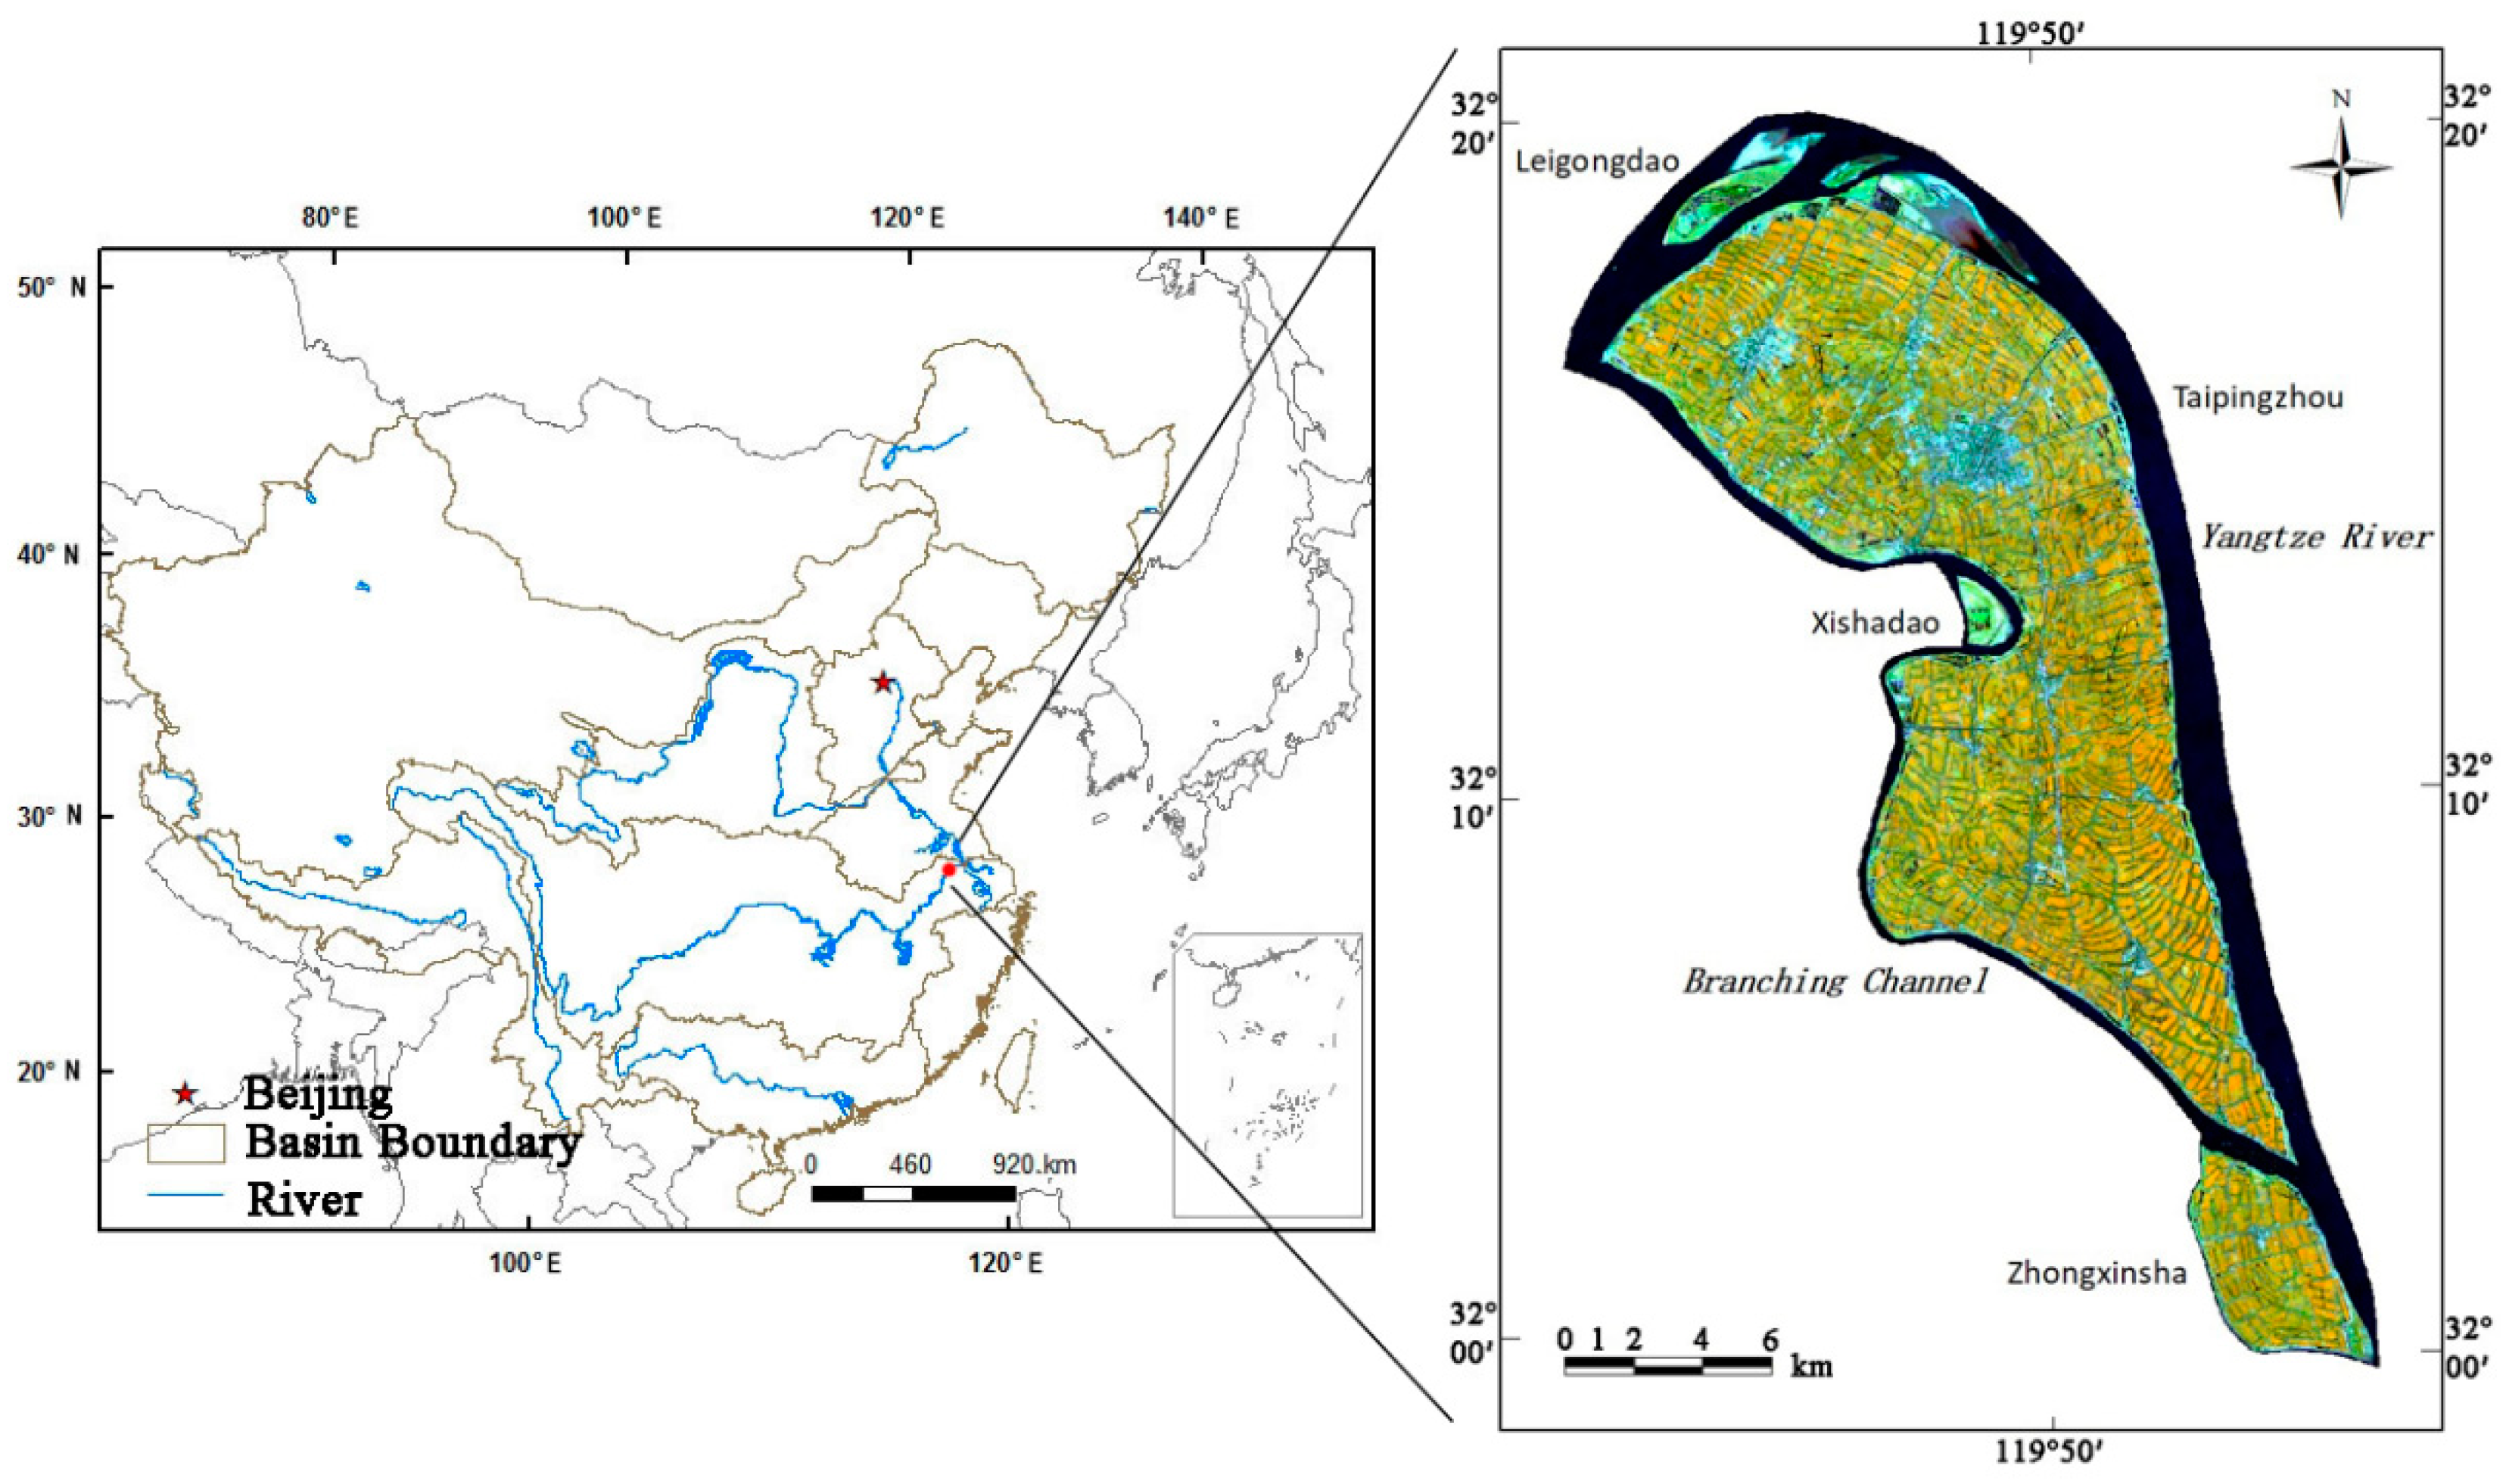
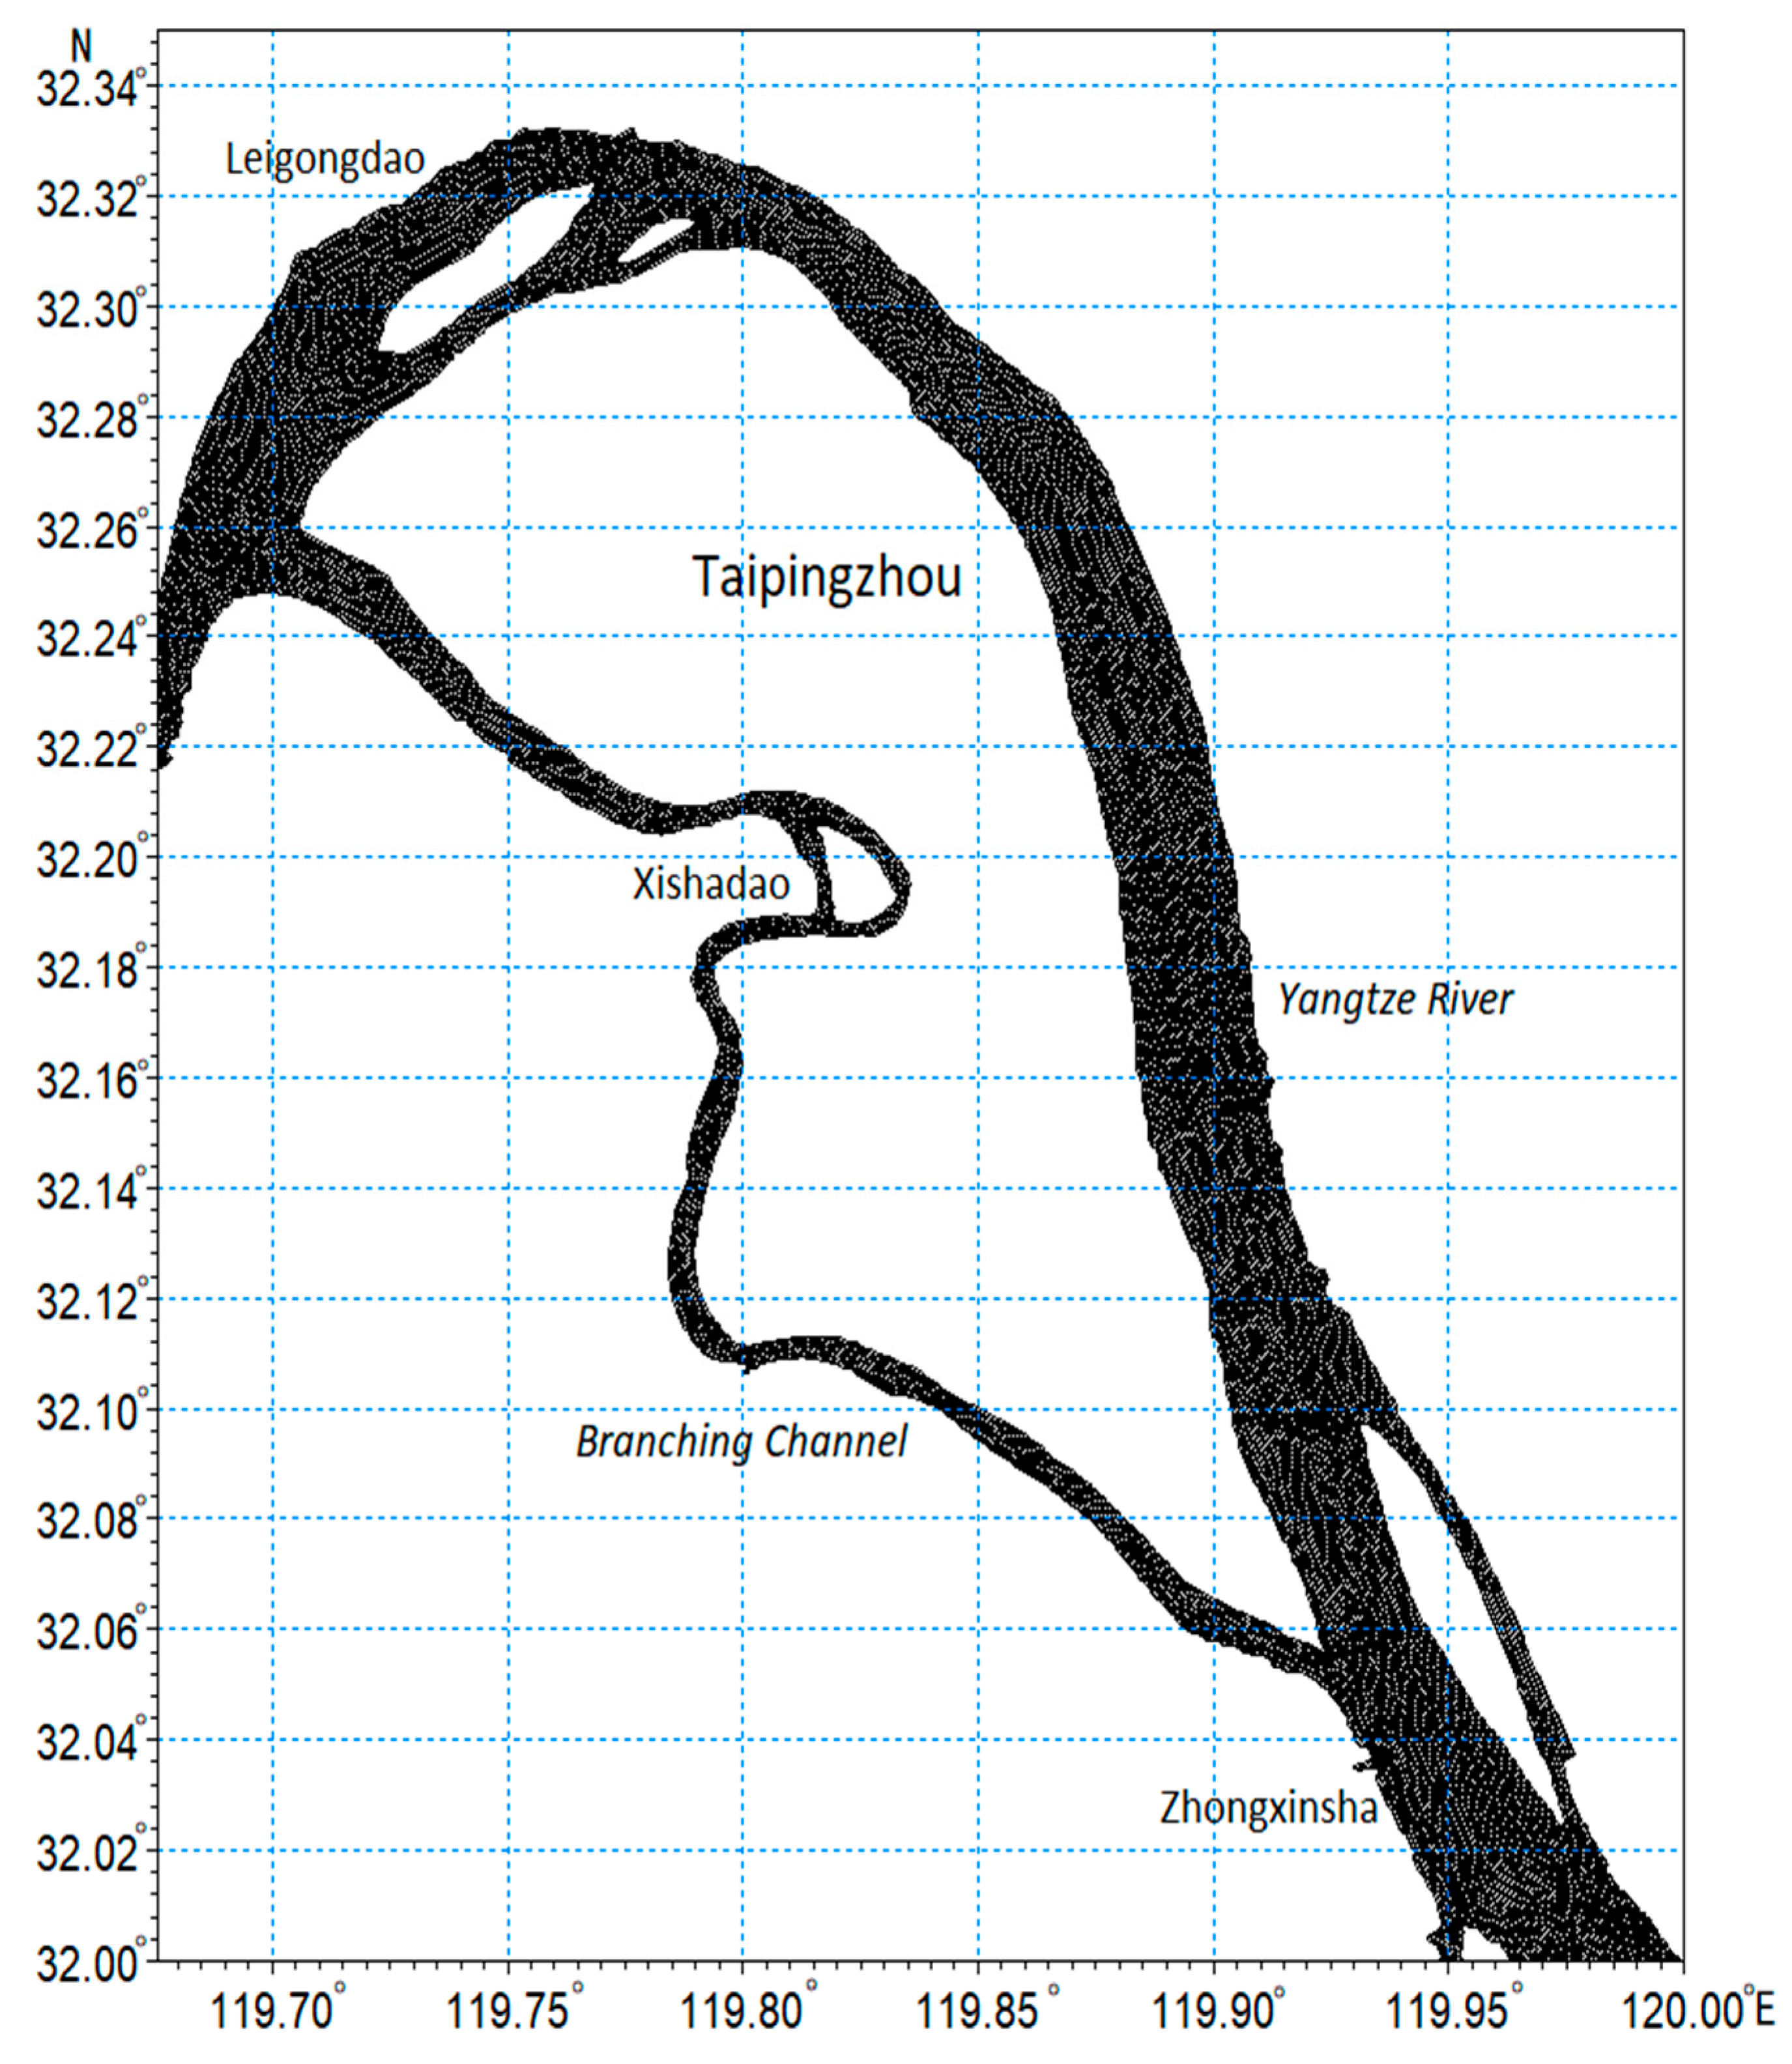
2.1. Study Area

The Yangtze River (also known as the Changjiang River) is more than 6300 km long. It is the third longest river in the world, after the Nile River in Africa and the Amazon River in South America. Many river islands grow in LRYR. Yangzhong City, located in the south of Jiangsu Province along LRYR, is composed of four river islands: Leigongdao, Taipingzhou, Xishadao, and Zhongxinsha. The location of the city and the four islands are shown in Figure 1. Yangzhong City is located in the northern subtropical monsoon climate zone, with an average annual temperature of 17.2 °C, an annual precipitation of 1203 mm, four seasons, and an altitude of 4–4.5 m [26]. The whole area is slightly tilted in a northwest to southeast direction. Yangzhong has more than 102 km of the Yangtze River coastline. The coastline has high-grade anchoring and operating conditions for shipping. Taipingzhou Island, the main island of Yangzhong, is the second largest island in the Yangtze River next to Chongming Island. Yangzhong City is an alluvial plain in the Yangtze River. The bedrock of each island is part of the Yangtze Ancient Land. The upper layer is the Yangtze River alluvium, and the materials of the surface layer are fine particles. The middle layer is the sandbar core, and the core is surrounded by hogback consists of coarser materials. They are all river sediments of yellow or brownish-yellow sand clay (secondary loess) belonging to the Holocene, Cenozoic, Quaternary period. At the beginning of the Quaternary period, neotectonic movement was relatively active, and external forces, such as the Yangtze River flow, played a leading role in shaping the Yangzhong islands.

2.2. Data

2.2.1. Remote Sensing Data

The satellite images of the study area were selected from Landsat TM and ETM+, which were taken in 1985, 1990, 1995, 2000, 2005, 2010, and 2015. The main image information is summarized in Table 1. In order to reduce the influence of water and cloud on area extraction, the images in the dry season and with no cloud cover were chosen. The 2014 image was used instead of the 2015 image because of the lack of data.

2.2.2. Hydrological Data

The hydrological data, including those on runoff and sediment discharge, were measured by the Datong and Jiujiang hydrological stations, which were located in the upper reaches of the study area. Table 2 shows the information on the hydrological stations. The data comes from the Jiangsu Province Water Resources Bulletin [27], China River Sediment Bulletin [28], and Changjiang Sediment Bulletin [29] using the statistics.

2.2.3. Meteorological Data

This study applied meteorological data where precipitation, wind, and heat flux were used. The precipitation data was measured by Nanjing reference climatological station. This station was very close to Yangzhong City, and its information is reported in Table 3. The annual precipitation was calculated from the monthly precipitation. The wind field and heat flux data, with a spatial and temporal resolution of 0.125° × 0.125° and 6 h, respectively, was obtained from the Climate Forecast System version 2 (CFSv2) provided by the National Center for Environmental Prediction (NCEP), College Park, USA.

3. Methods

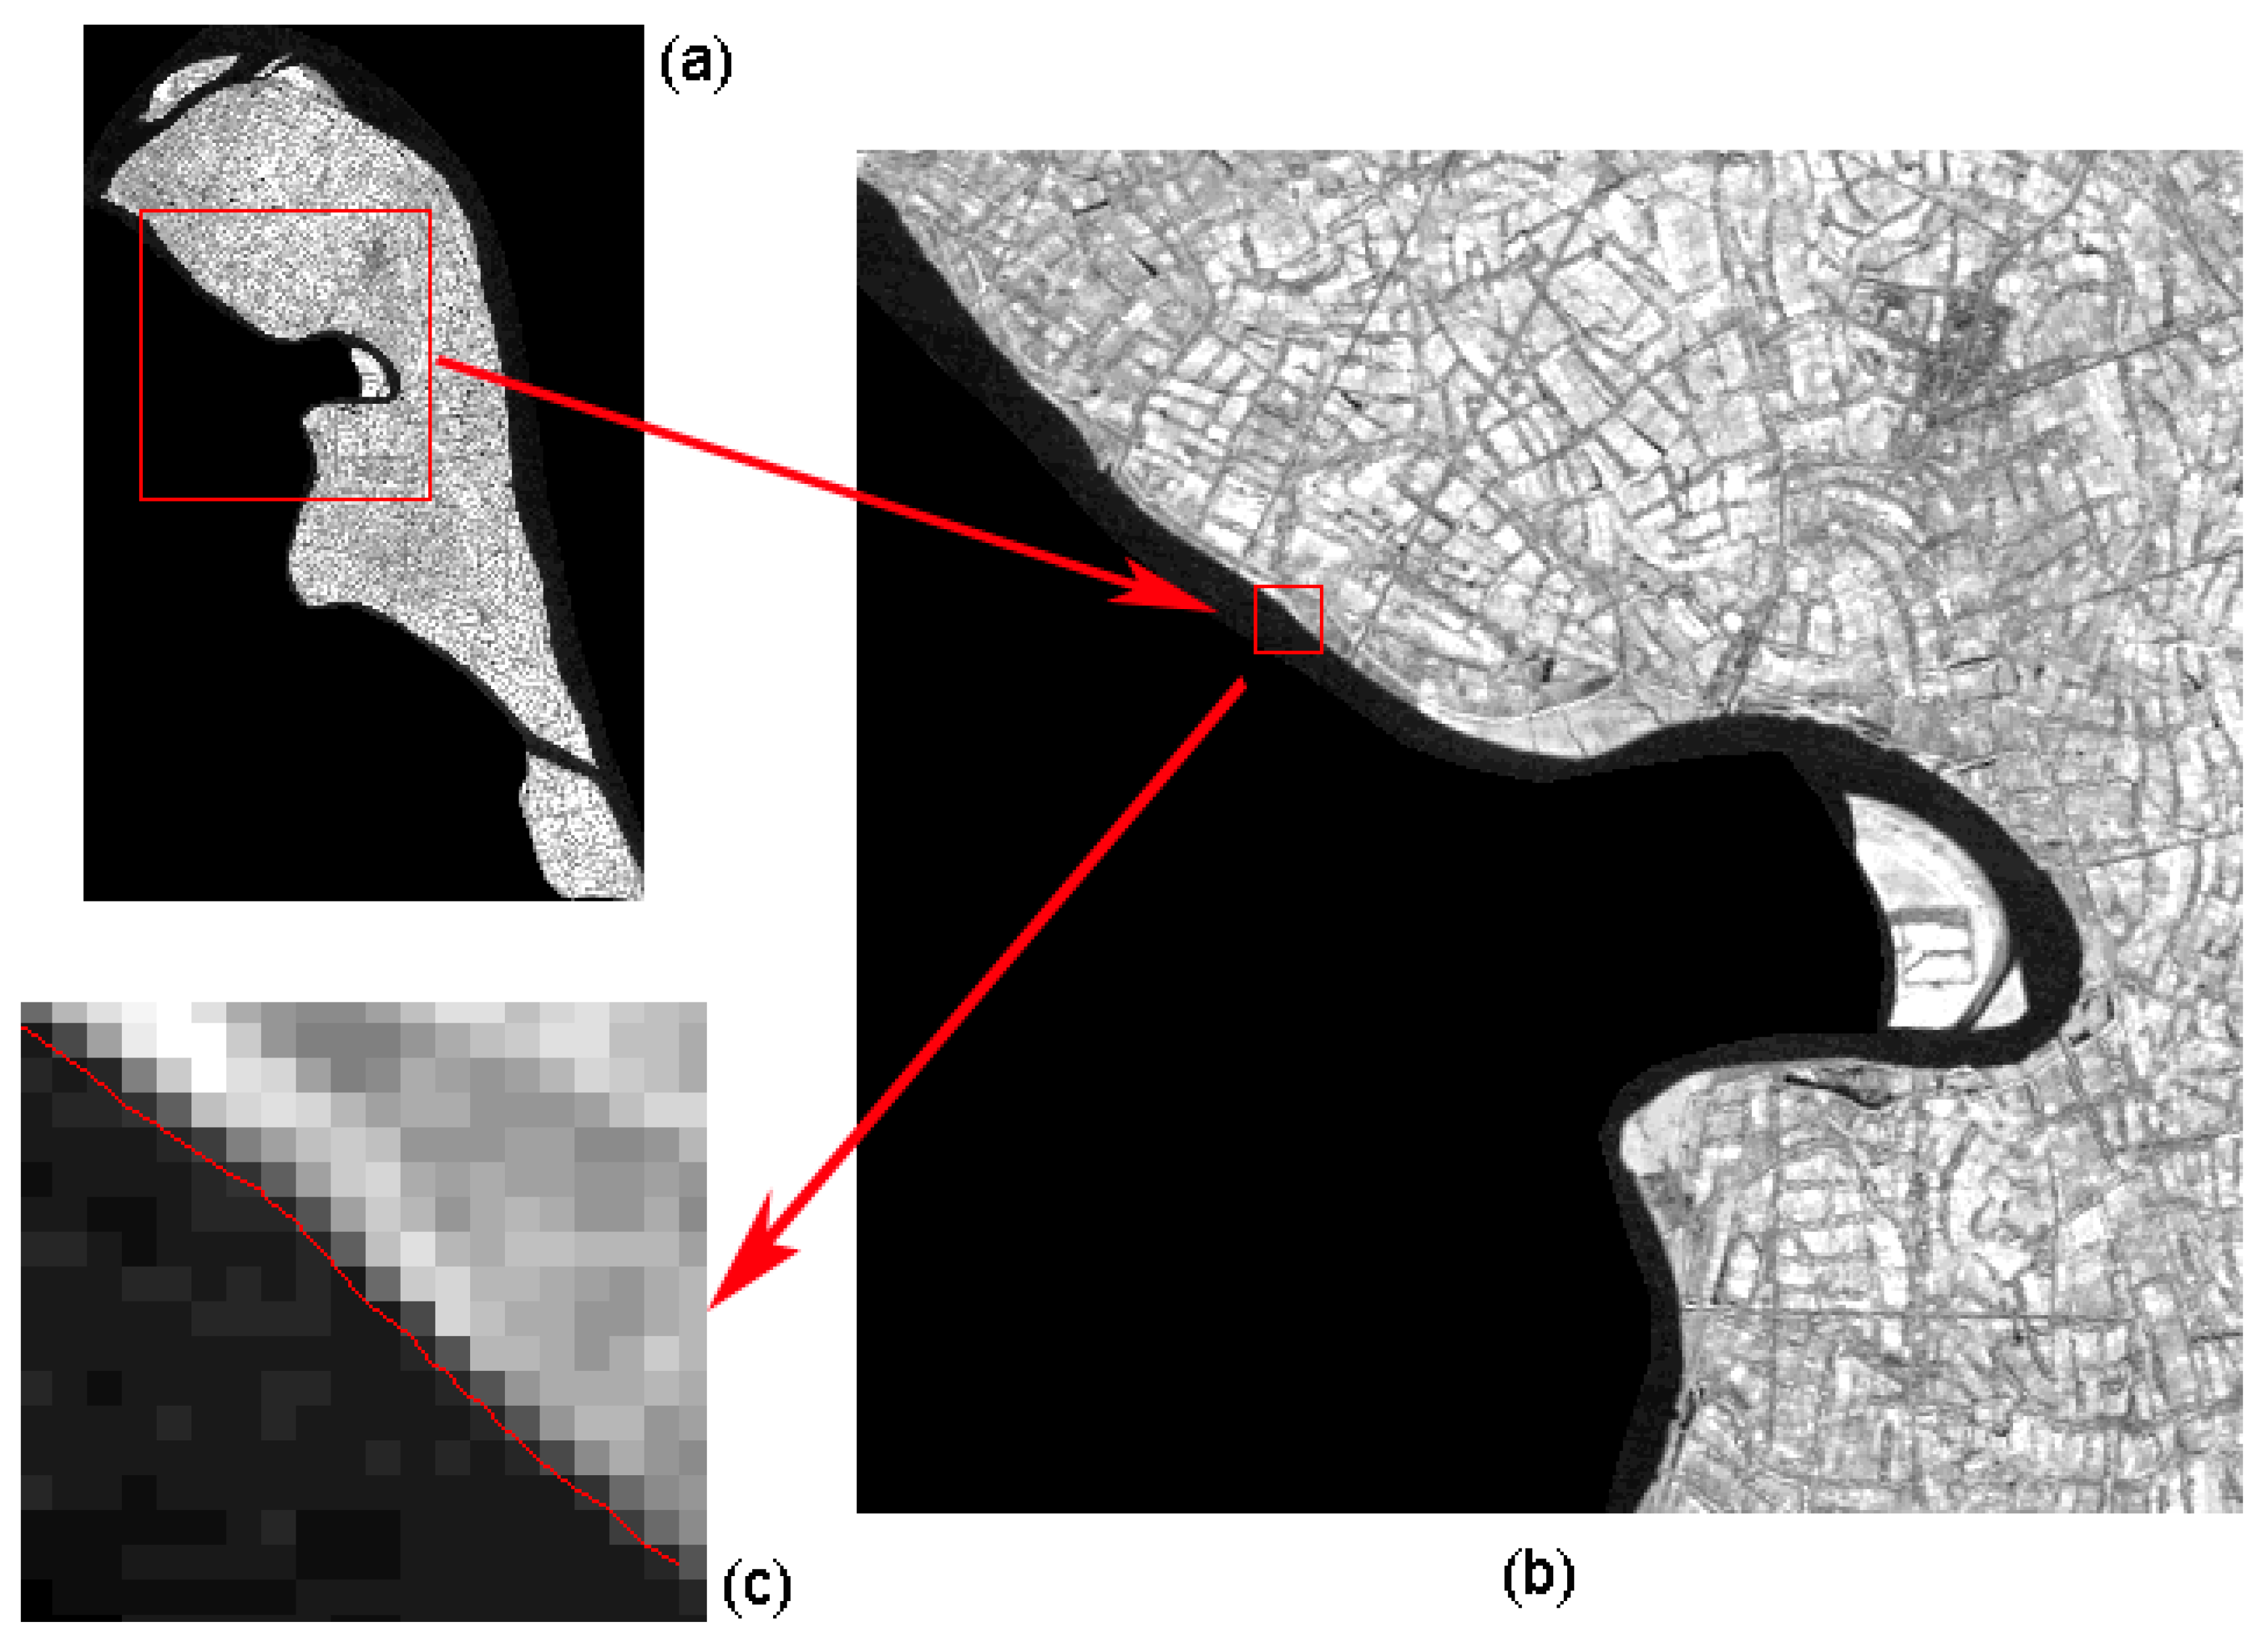
3.1. Image Preprocessing

The main cover feature on the river island was vegetation. As the fourth band of TM and ETM+ images is a near-infrared band, which can distinguish vegetation from water, the fourth band was selected. There were four TM images, and the other three were ETM+ images (Table 1). The ETM+ sensor of the Landsat 7 satellite malfunctioned on 31 May 2003 and black stripes appeared over 25% on the captured images. The SLC (Scan Lines Corrector)-OFF model was used to repair the three images. The UTM (Universal Transverse Mercator)-WGS (World Geodetic System) 84 projection of the original images was converted to Sample Lambert Azimuthal Equal Area projection. Geometric registration was carried out on the images due to the geometric distortion caused by satellites and sensors during the image acquisition process. Finally, the study area was extracted using the same ROI (Region of Interest).

3.2. River Island Extraction Method

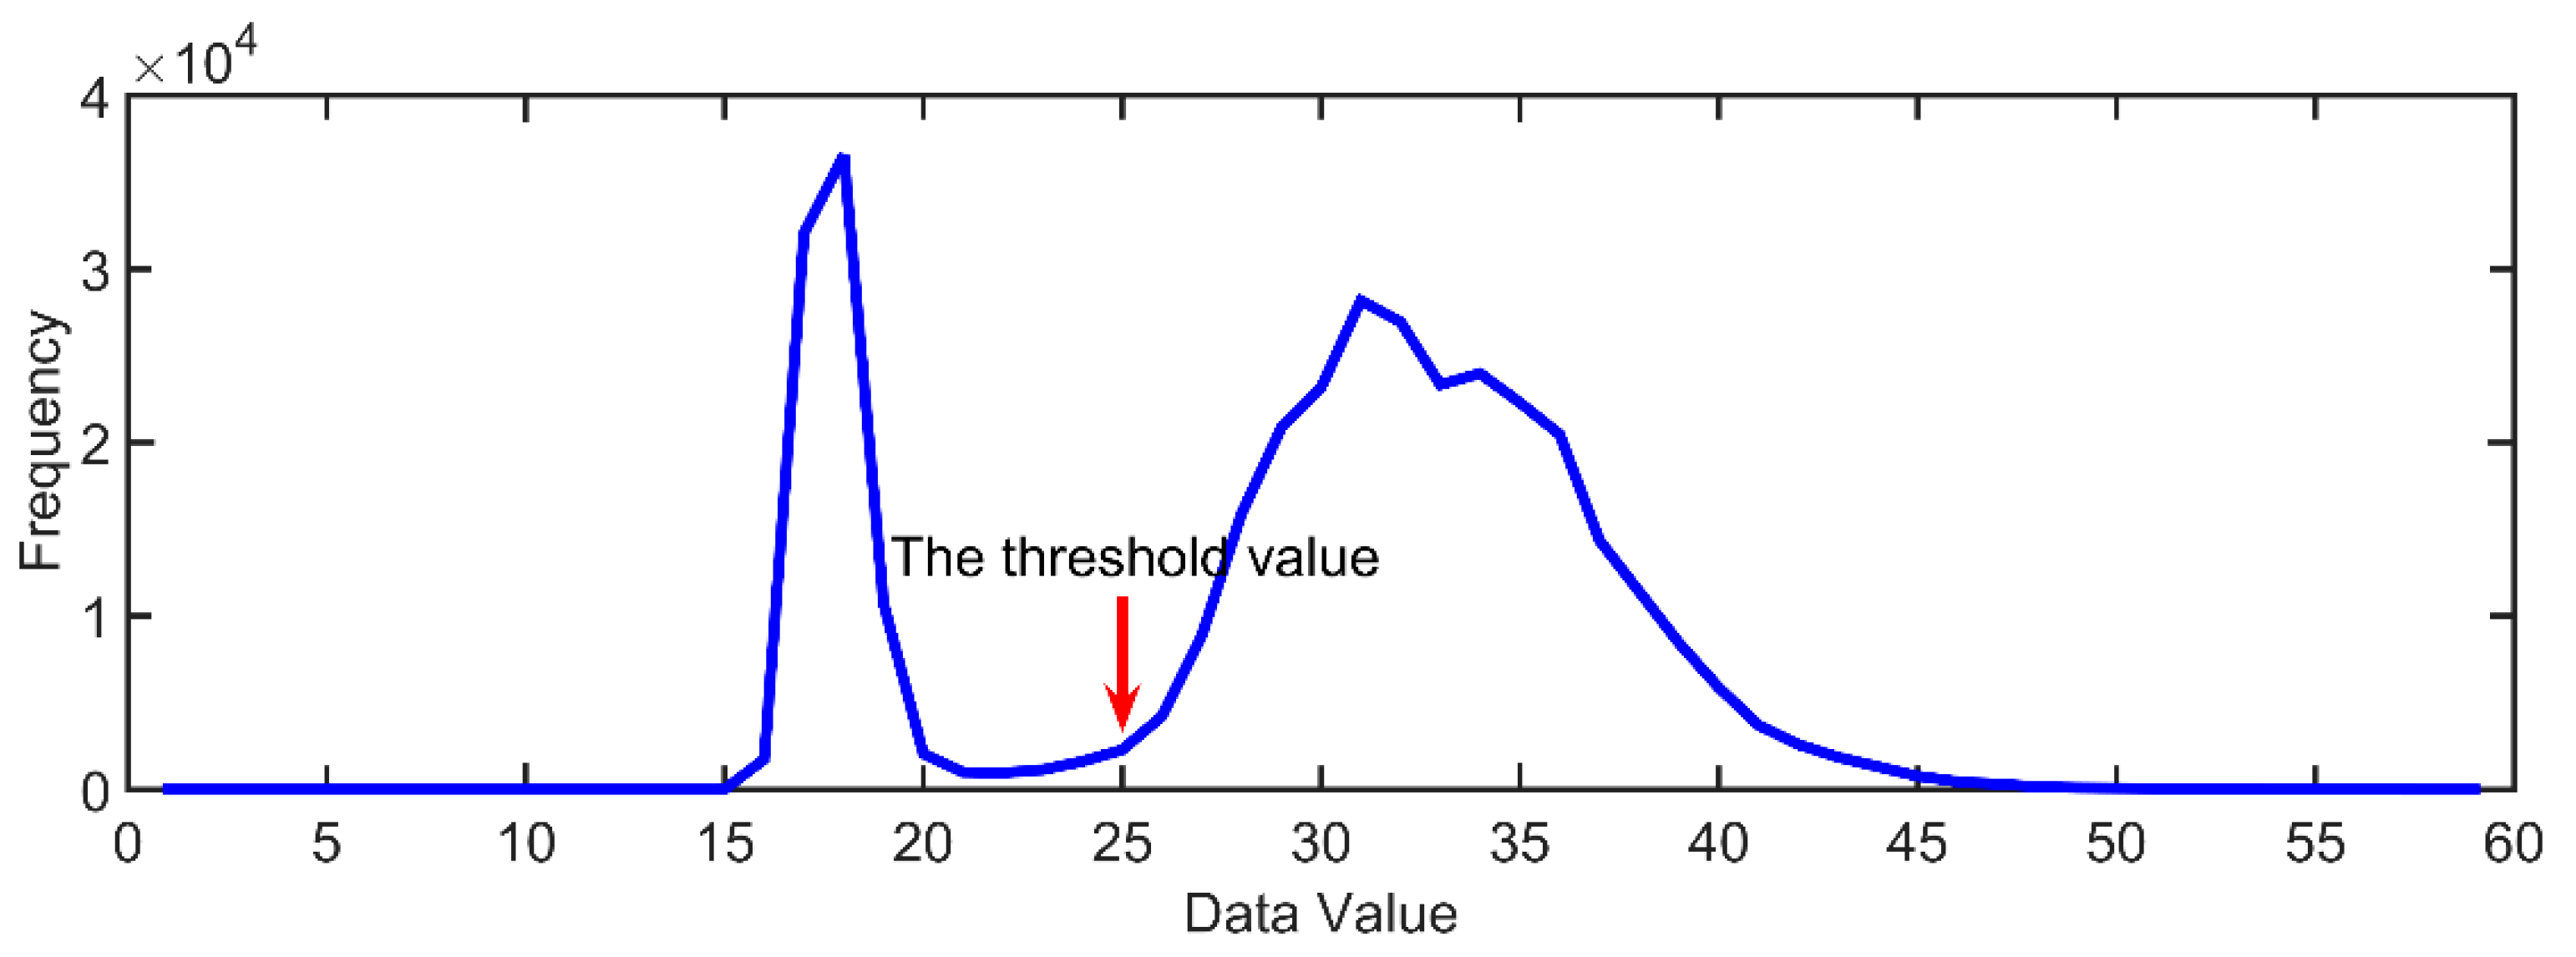
3.2.1. Threshold Value Method

The threshold method uses the difference in reflectivity (or the gray value of one pixel) between a certain feature and the background feature in a certain band to determine a certain value which distinguishes between these two features. There is a significant difference between the reflectivity of water and land because of the large amount of sediment, chlorophyll, and other substances in the water of the Yangtze River. Based on this difference, the threshold method can effectively distinguish between water and land. Through the interpretation and prior knowledge of the images, the optimal threshold value that can accurately distinguish between water and land can be obtained (Figure 2) by sampling a single image at least hundreds of times to determine the threshold of the image. In such a way, the validation of the threshold value was performed, and the result shows that the threshold was accurate (Figure 3). The same method was used for the other six images, and the respective threshold values for the seven images were obtained (Table 4).

3.2.2. Binarization Model

After obtaining the threshold value of the single-band image, the binarization operation model was used to distinguish the islands from the Yangtze River. A pixel whose luminance value is greater than or equal to the threshold value was determined as land, and is represented by 1; the rest is represented by 0, indicating the background or water. The binarization model can be represented as:
β = { 1    i f   α γ 0    o t h e r w i s e
where β is the binarized image (Figure 4), α is the gray value of each pixel of the image, and γ is the threshold value between the land and water values.

3.2.3. Cluster Analysis

Cluster analysis was carried out after the images’ binarization. The K-means method was used to conduct unsupervised classification on the images which is a typical distance-based clustering algorithm where the distance is used as the evaluation index of similarity. The closer the distance between two objects is, the greater the similarity. The classified images lacked spatial continuity. Using the Clump Classes function in ENVI (the Environment for Visualizing Images), mathematical morphological operators were used to cluster and merge adjacent similar classification regions to eliminate noise. The images after the cluster analysis were vectorized in ENVI, and the area of river islands was calculated by using the geometric calculation function in ArcGIS developed in Redlands, USA.

3.3. Hydrodynamic Numerical Simulation

An Unstructured Grid, Finite-Volume Coastal Ocean Model (FVCOM) was successfully established in 2000 by a research team led by Chen, University of Massachusetts-Dartmouth, USA [30,31]. The model includes the momentum equation, continuous equation, temperature-salt conservation equation, and state equation. The numerical model uses the finite volume method (FVM), which has the advantage of accurate and fast calculation, and adopts an unstructured triangular mesh, which can better fit the coastline boundary and the seabed topography. This advantage makes FVCOM very adaptable when simulating areas near the shore and with a complex shoreline. It also has good effects when simulating rivers and lakes. The governing equations of FVCOM is:
u t + u u x + v u y + w u z f v = 1 ρ 0 P x + z ( K m u z ) + F u
v t + u v x + v v y + w v z + f u = 1 ρ 0 P y + z ( K m v z ) + F v
P z = ρ g
u x + u y + w z = 0
T t + u T x + v T y + w T z = z ( K h T z ) + F T
S t + u S x + v S y + w S z = z ( K h S z ) + F S
ρ = ρ ( T , S )
where x , y , and z represent the east, north, and vertical coordinate axes in the rectangular coordinate system. u , v , and w are the velocity components in the x , y , and z directions. T is the temperature, S is the salinity, P is the pressure, f is the Coriolis parameter, g is the gravitational acceleration, K m is the vertical rotation viscosity coefficient, K h is the vertical rotation diffusion coefficient of heat, F u and F v represent the horizontal momentums, and F T and F S are the diffusion terms of heat and salinity.
The FVCOM model uses an unstructured triangular mesh. In this study, SMS (Surface Water Modeling System) software was used to generate the mesh. The space range was 32° N–32.35° N, 119.68° E–120° E. The Yangtze River shoreline and the boundary of the islands were extracted from Google Earth, with a grid spatial resolution of 500 m (Figure 5).
The daily runoff data used in the model was measured from the Jiujiang Hydrological Station. The wind field and heat flux were obtained from the CFSv2 dataset provided by NCEP. The tidal harmonic constant given by the 16 tidal constituents, including M2, S2, N2, K2, K1, O1, P1, Q1, MU2, NU2, T2, L2, 2N2, J1, M1, and OO1, was used in the outer boundary of the Yangtze River estuary. The tidal harmonic constant and constituents were calculated from the global tidal numerical model, NAOTide. The vertical direction was divided into 10 even layers in the model. The internal mode of the time step is 4 s, and the outer one is 0.4 s. The calculation time is from January 1st to 15th, 2015.

3.4. Correlation Analysis

The Pearson correlation was used to analyze the relationship between the area change of the river islands and the cumulative amount of each impact factor. The calculation formula for the area change of islands is:
Δ A ( k 5 , k ) = A k A k 5
where k is the year, A k is the area of these four islands in the following year, A k 5 is the area of the islands in the previous year, and Δ A ( k 5 , k ) is the area change during this time. The calculation formula of the cumulative amount of influence factors over a period is:
S ( k 5 , k ) = S k 5 + S k 4 + S k 3 + S k 2 + S k 1
where S k 5 is the value of the influencing factor of ( k 5 ) year, S k 4 is the value of the influencing factor of ( k 4 ) year, S k 3 is the value of the influencing factor of ( k 3 ) year, S k 2 is the value of the influencing factor of ( k 2 ) year, S k 1 is the value of the influencing factor of ( k 1 ) year, and S ( k 5 , k ) is the cumulative amount of the influencing factor between ( k 5 ) year and k year. The calculation formula of the correlation coefficient is:
R A S = i = 1 n [ ( Δ A ( k 5 , k ) Δ A ¯ ) ( S ( k 5 , k ) S ¯ ) ] i = 1 n ( Δ A ( k 5 , k ) Δ A ¯ ) 2 i = 1 n ( S ( k 5 , k ) S ¯ ) 2
where R A S is the correlation coefficient, Δ A ¯ is the average area change of islands during the 30 years, and S ¯ is the average value of the influencing factor during the 30 years. Here, n is six.

4. Results

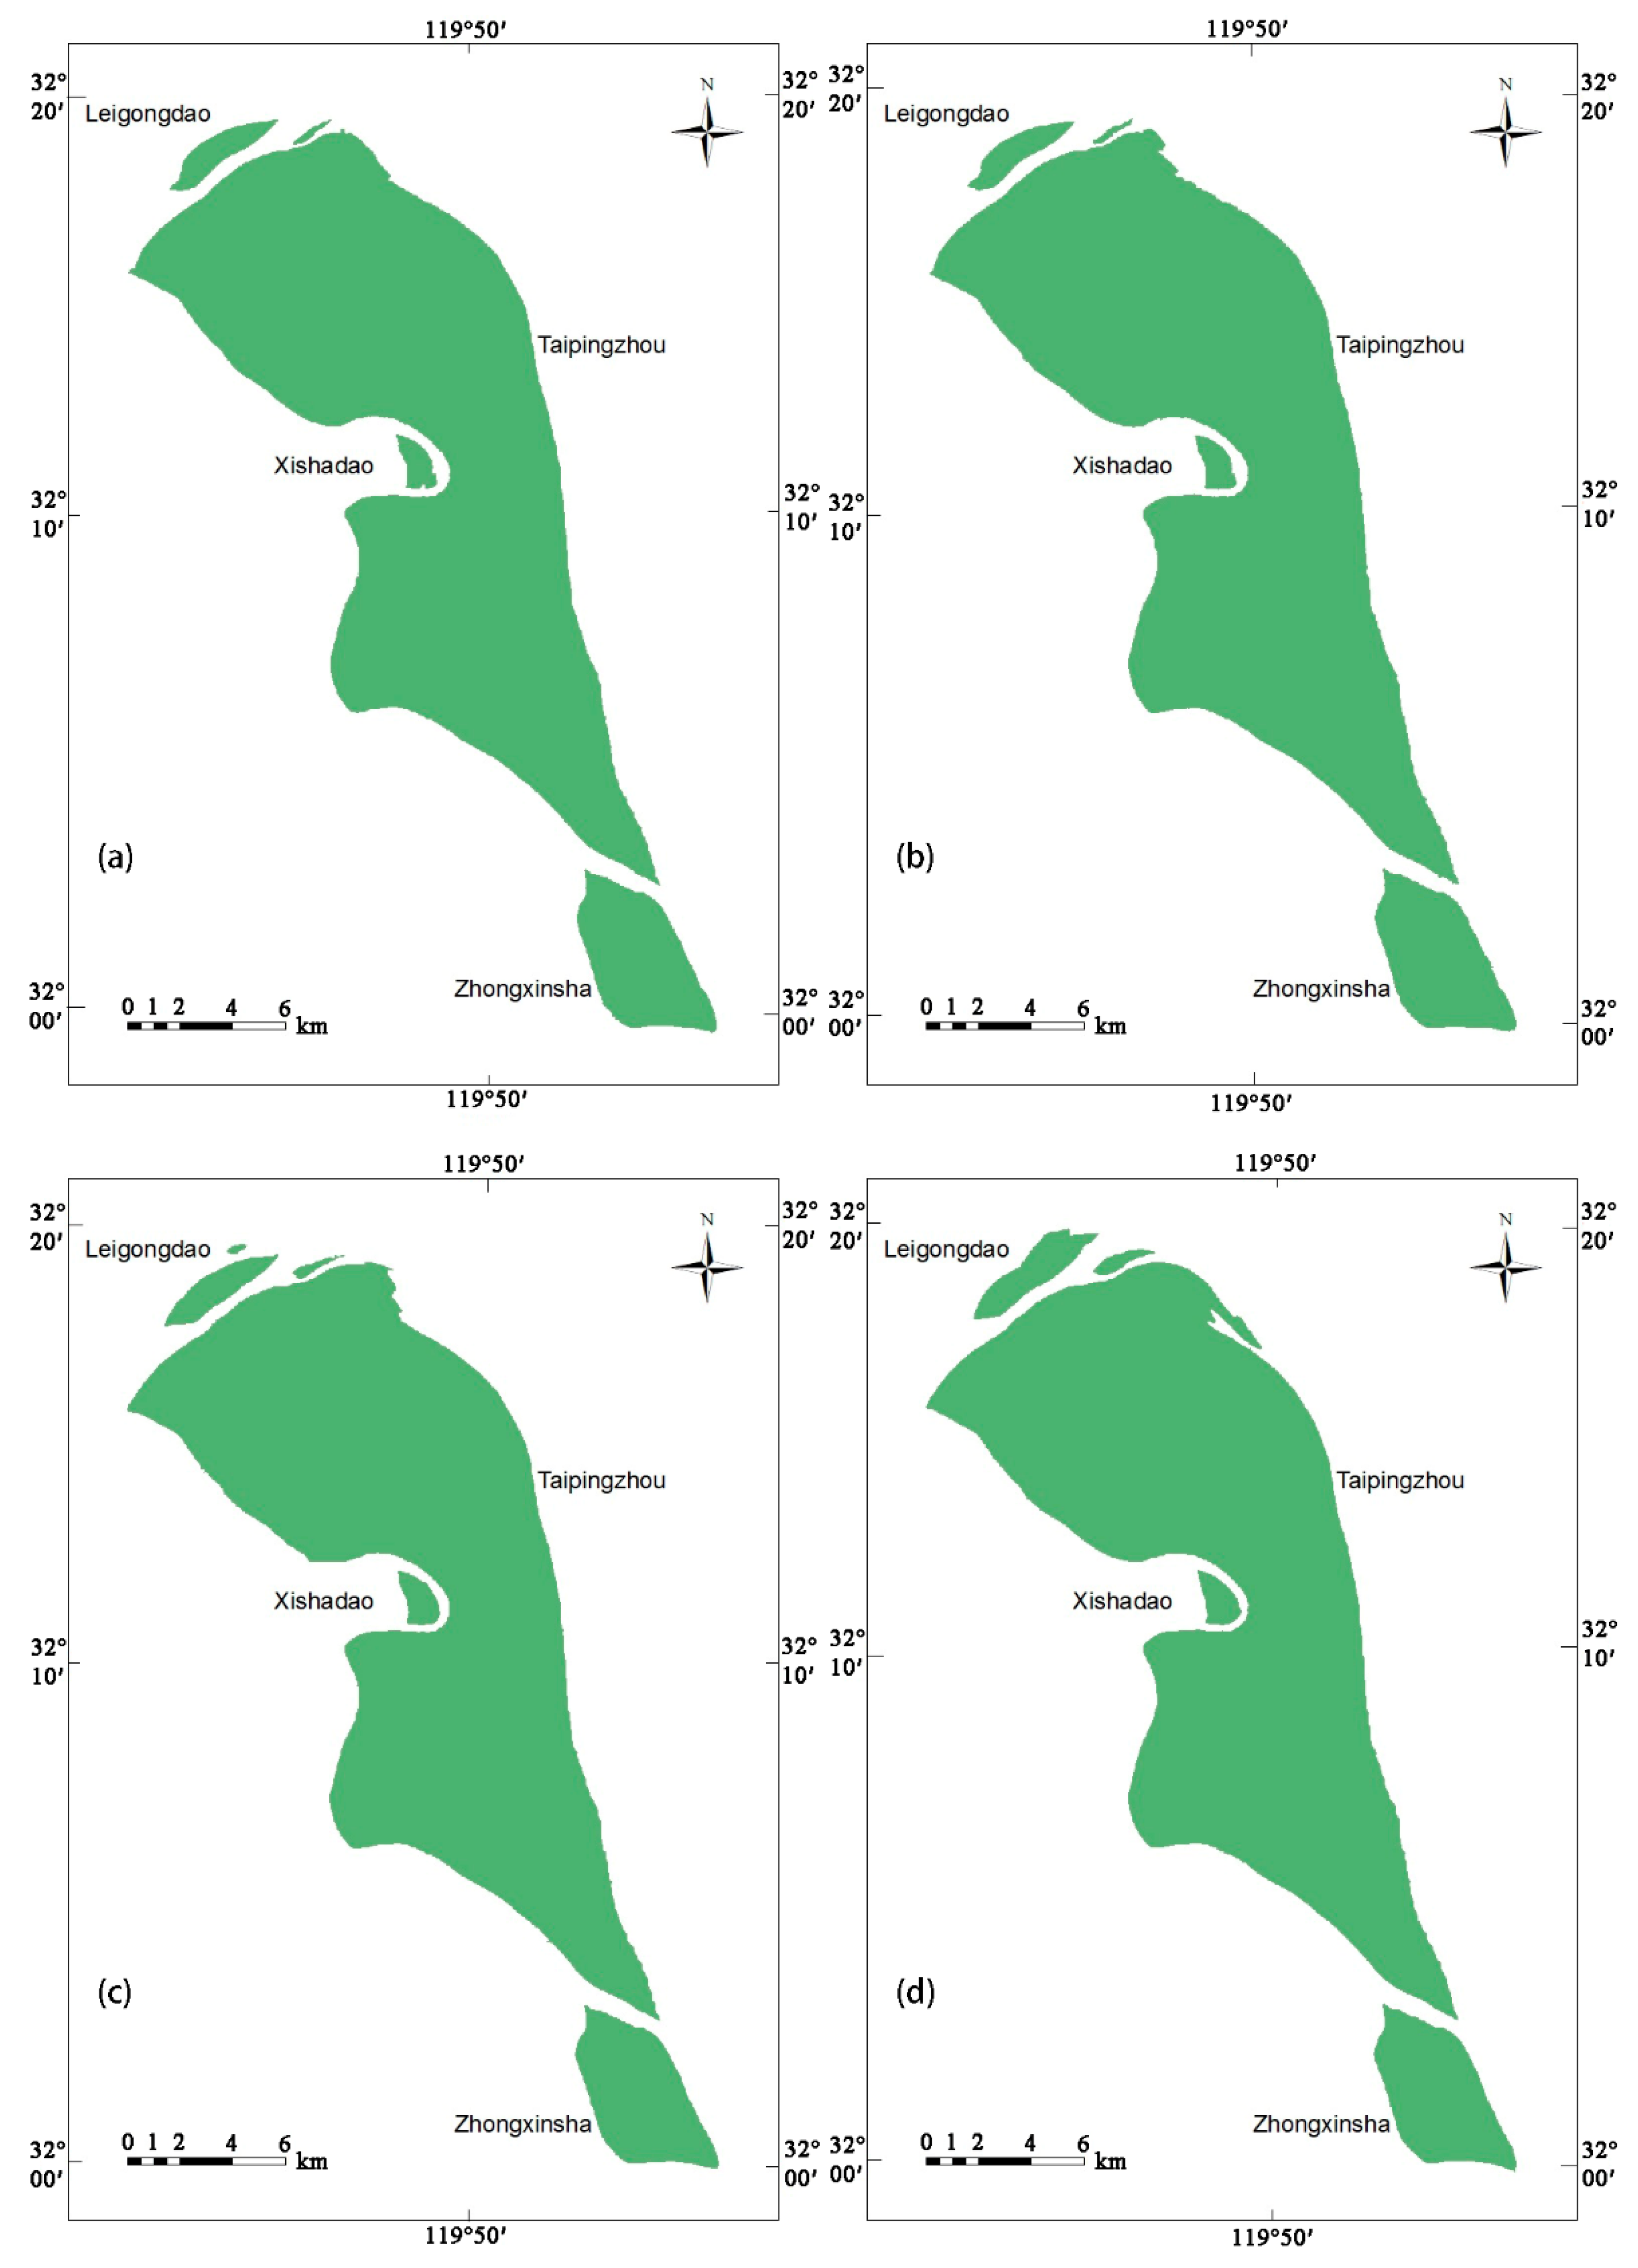
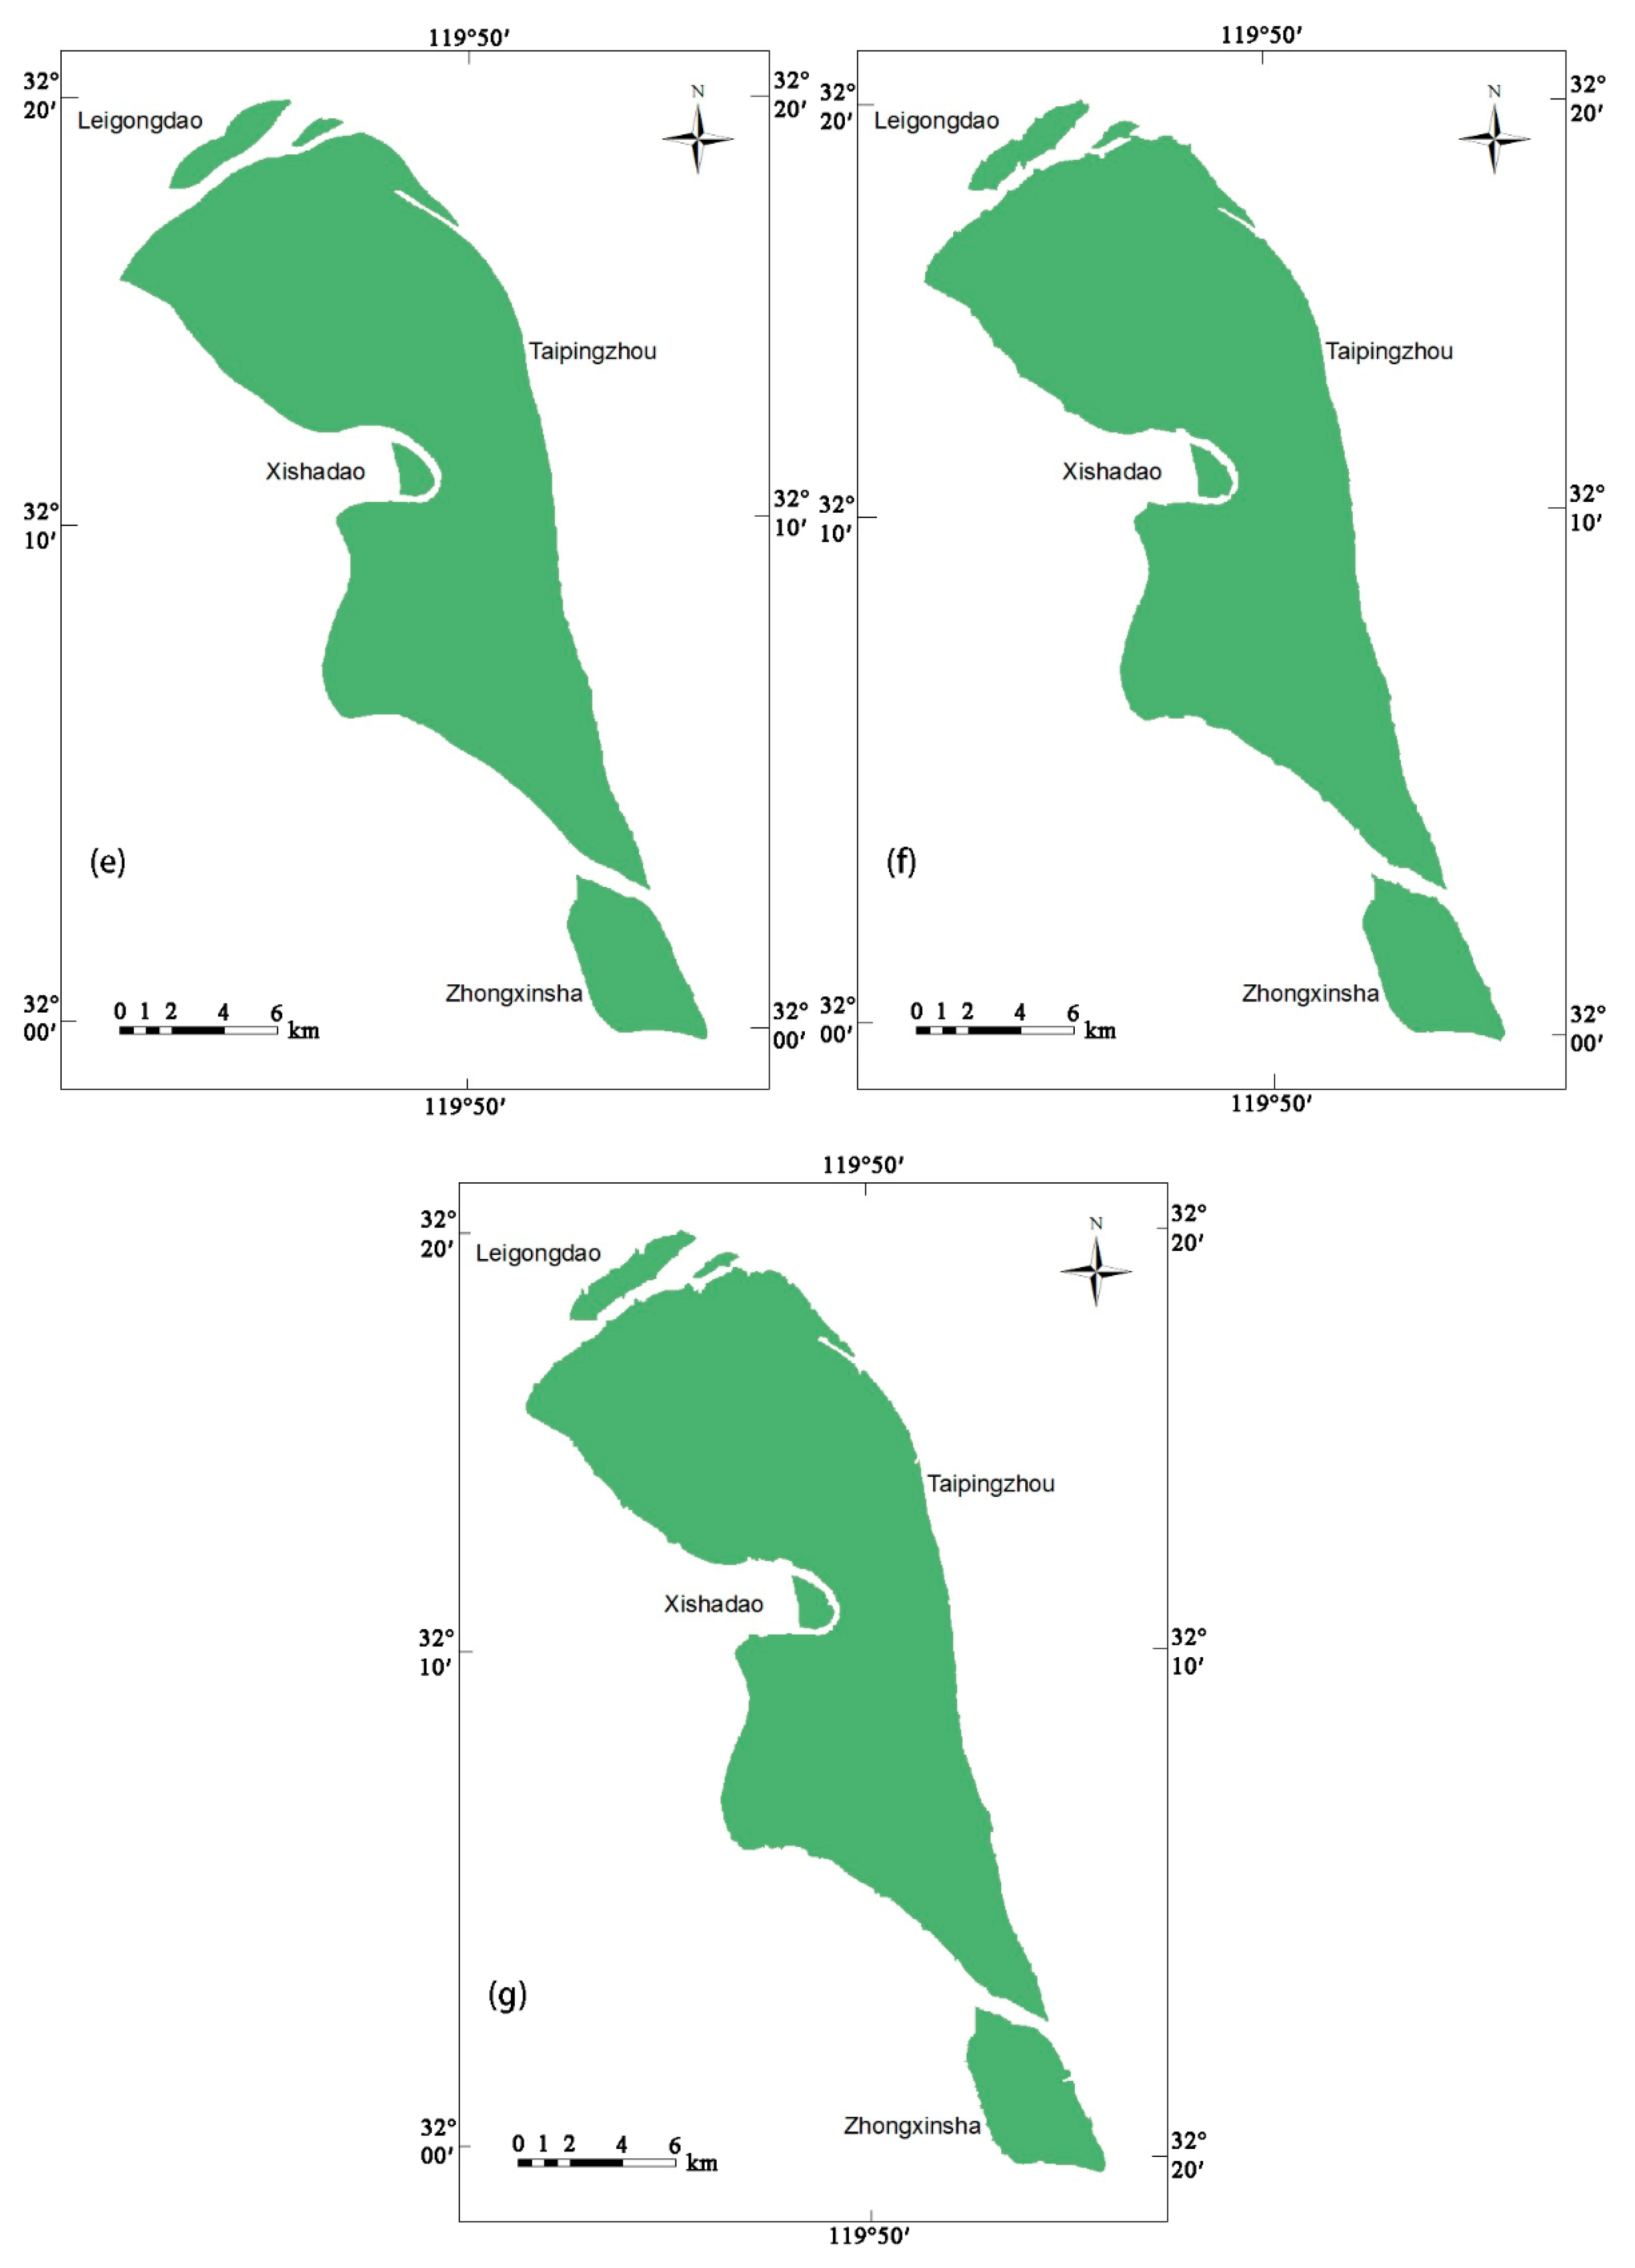
4.1. River Island Shape Changes

By establishing a binarization model and clustering the remote sensing images, the area of the four islands could be extracted during different periods (Figure 6). From the figure, it can be seen that, in general, the shape of the four islands in the past 30 years have not changed much; however, the individual islands have changed greatly in localized areas. In the northeastern part of Leigongdao Island, a large piece of land developed around the year of 2000, and around 2005, this new area slightly reduced. A large piece of land also grew at the northern end of Taipingzhou Island, and it has still not disappeared. The other two islands, Xishadao Island and the Zhongxinsha Island, did not change much in shape. Compared to previous studies [15,16,17], the island’s extraction was more accurate, removing the noise generated by the island’s lakes.

4.2. River Island Area Changes

The remote sensing image extraction were geometrically calculated by ArcGIS (Figure 7). For the past 30 years, it was found that the average areas in order from largest to smallest were Taipingzhou, Zhongxinsha, Leigongdao, and Xishadao. During this period, the average area of Leigongdao was 4730.66 m2, showing an overall trend of growth with an average annual growth rate of 45.93 m2. Taipingzhou is the main island of Yangzhong City and the largest of the four islands. Its average area is 224,653.63 m2, with an average annual growth rate of 76.89 m2, which is the fastest-growing among the four islands. Xishadao has the smallest area, with an average annual area of 2036.44 m2 and an average annual growth rate of 4.44 m2. The annual average area of the Zhongxinsha is 19,803.73 m2, with an average annual growth rate of 2.49 m2, which is the smallest growth rate. In the past 30 years, the average total area of Yangzhong’s four islands has been 251,224.46 m2. In general, it showed a trend of rapid growth and slow erosion (Figure 8). Before 2000, the total area continued to grow, with an average annual growth of 517.08 m2. After 2000, the total area experienced a decline, with an average annual reduction of 257.58 m2.

5. Discussion

5.1. Meteorological and Hydrological Influencing Factors

The evolution of the river islands was found to be affected by material input and water erosion. The external materials were mainly sediment particles in the river water. Erosion of the island is mainly caused by river water and rain. Statistics of the annual runoff (Figure 9) and the annual sediment discharge (Figure 10) measured by the upstream Datong hydrological station, and the annual precipitation (Figure 11) measured by the Nanjing Climate Station from 1985 to 2015 were calculated. It was found that there was no obvious decrease or increase in annual runoff and precipitation, but their fluctuations were relatively large. The annual sediment discharge showed a significant decrease, but its fluctuation was small.
Correlation analysis was carried out to analyze the relationship between the area change of the islands (Table 5) and the cumulative amount of annual runoff, annual sediment discharge, and annual precipitation during the same time interval. Previous studies analyzed the effects of runoff and sediment transport on river islands, but did not discuss the impact of precipitation. The results show that the change in island area is proportional to the cumulative annual runoff, annual sediment discharge, and annual precipitation (Figure 12, Figure 13 and Figure 14), with correlation coefficients of 0.56, 0.73, and 0.50, respectively. The moderate correlation indicates that within a certain range, the area of the islands increases with an increase in levels of runoff, sediment, and precipitation, and decreases with their respective decrease. The largest correlation coefficient is between sediment discharge and area change, indicating that the sediment discharge is the most important natural factor affecting the evolution of islands.

5.2. The Influence of Flow Field Distribution on the Scouring and Silting in River Islands

In addition to the effects of runoff, sediment, and precipitation, the river islands’ evolution was also found to be related to the Yangtze River water potential in which they were located. The Yangtze River originates from the southwest side of Geladaindong Peak in the Tanggula Mountains of the Qinghai-Tibet Plateau. It flows to the east for more than 6000 km, and has thousands of tributaries along the way. When it reaches downstream, it carries a large volume of fresh water, which contains a lot of sediment. The four islands of Yangzhong City are all greatly affected by the fresh water flowing down from the upper reaches. However, the lower reaches of the Yangtze River are also affected by the tides of the ocean. The tidal limit is located at the Datong Hydrological Station [32], meaning that the Yangzhong islands are also affected by the tides. The ocean circulation model, FVCOM was used to simulate the flow field in the region. The width of the branching channel between Zhongxinsha and the continent was small, and the water flow was small. Its impact on the island was found to be very small, so the flow field of the branching channel is not discussed here; only the flow field of the main channel is discussed. Figure 15a shows the average surface flow field from 1 to 15 January, 2015, in the Yangzhong section of the Yangtze River. It can be seen that the overall surface current is down the Yangtze River, indicating that the island is mainly affected by runoff. However, the area is affected by the runoff and the tide, and the flow field is not constant. For example, at 13:00 on 1 January, the surface current in the upper half area is downstream, while in the lower half it is countercurrent (Figure 15b); at 15 o’clock, the surface current is all upstream (Figure 15c). Both of these situations were caused by fluctuations of the tidal current caused by ocean tides, thus changing the flow field in the region. By calculating the average surface current over a period, it was found that the flow velocity at the head of the four islands was significantly smaller than that at the tail of the islands (Figure 15d), which caused the deposition of sediment at the head to be larger than that at the tail. It was also found that the current at the head flowed toward the north bank instead of the island body, while the current at the middle and the end flowed to the island body, which caused the erosion at the middle and the end to be larger than that at the head. This observation is able to explain the phenomenon that a large area of land appeared at the head of Leigongdao and Taipingzhou, but Taipingzhou had no new land at the end. For the first time, the high-resolution FVCOM model was applied to simulate the flow field in the river island region, providing hydrodynamic factors for the evolution of the river island.
In addition, the Three Gorges Dam and its reservoir, sand mining, vegetation cover, and other factors were also found to have an impact on the development of the river islands. The storage of water in the Three Gorges Reservoir and many other reservoirs was found to directly lead to a decrease in the water’s sediment content and reduced the input of external material, which is necessary for the development of islands [33]. Human activities, such as sand mining in the river, also reduced the sediment concentration. The higher the vegetation coverage and the richer the vegetation types, the less water and soil was lost on the island. In recent years, reparation of the river embankment dam has played a role in the protection of the islands to a certain extent.

6. Conclusions

This paper used the threshold method to establish a binarization model, based on TM and ETM+ remote sensing images of Landsat series satellites. Through remote-sensing digital image processing methods, information about the four river islands in LRYR during different periods were extracted and analyzed. The correlation coefficient between the area of the islands and runoff, sediment discharge, and precipitation was then calculated, the flow field in the study area was simulated, and the factors affecting the evolution of the river islands was analyzed. The conclusions are as follows:
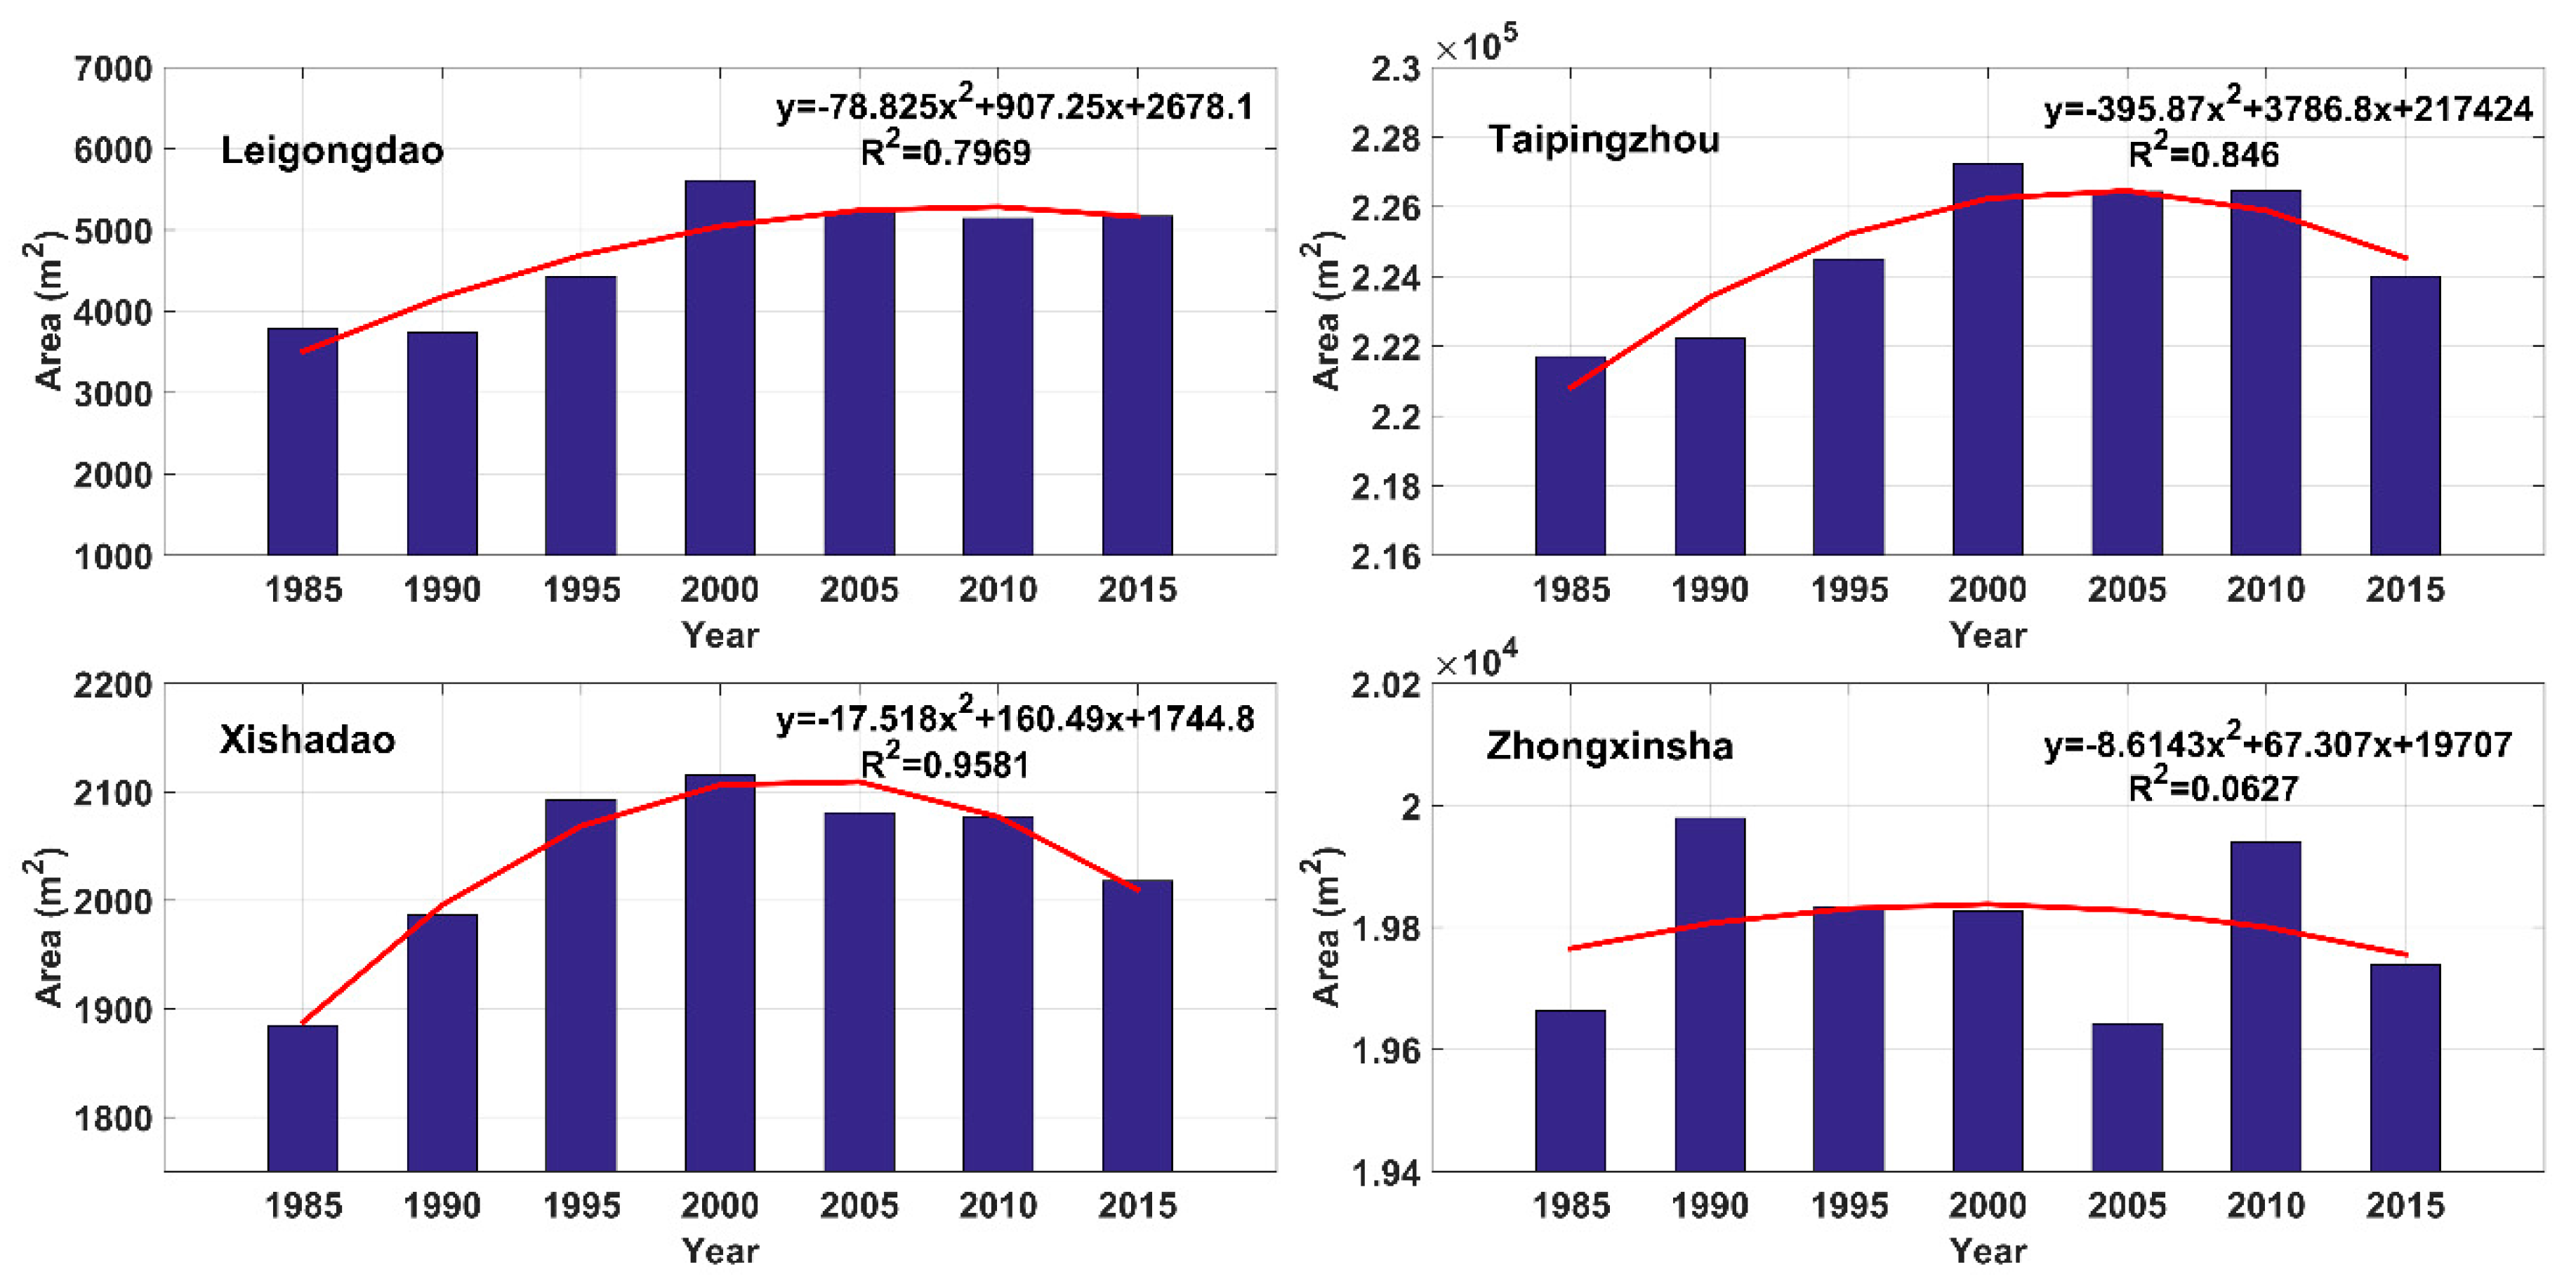
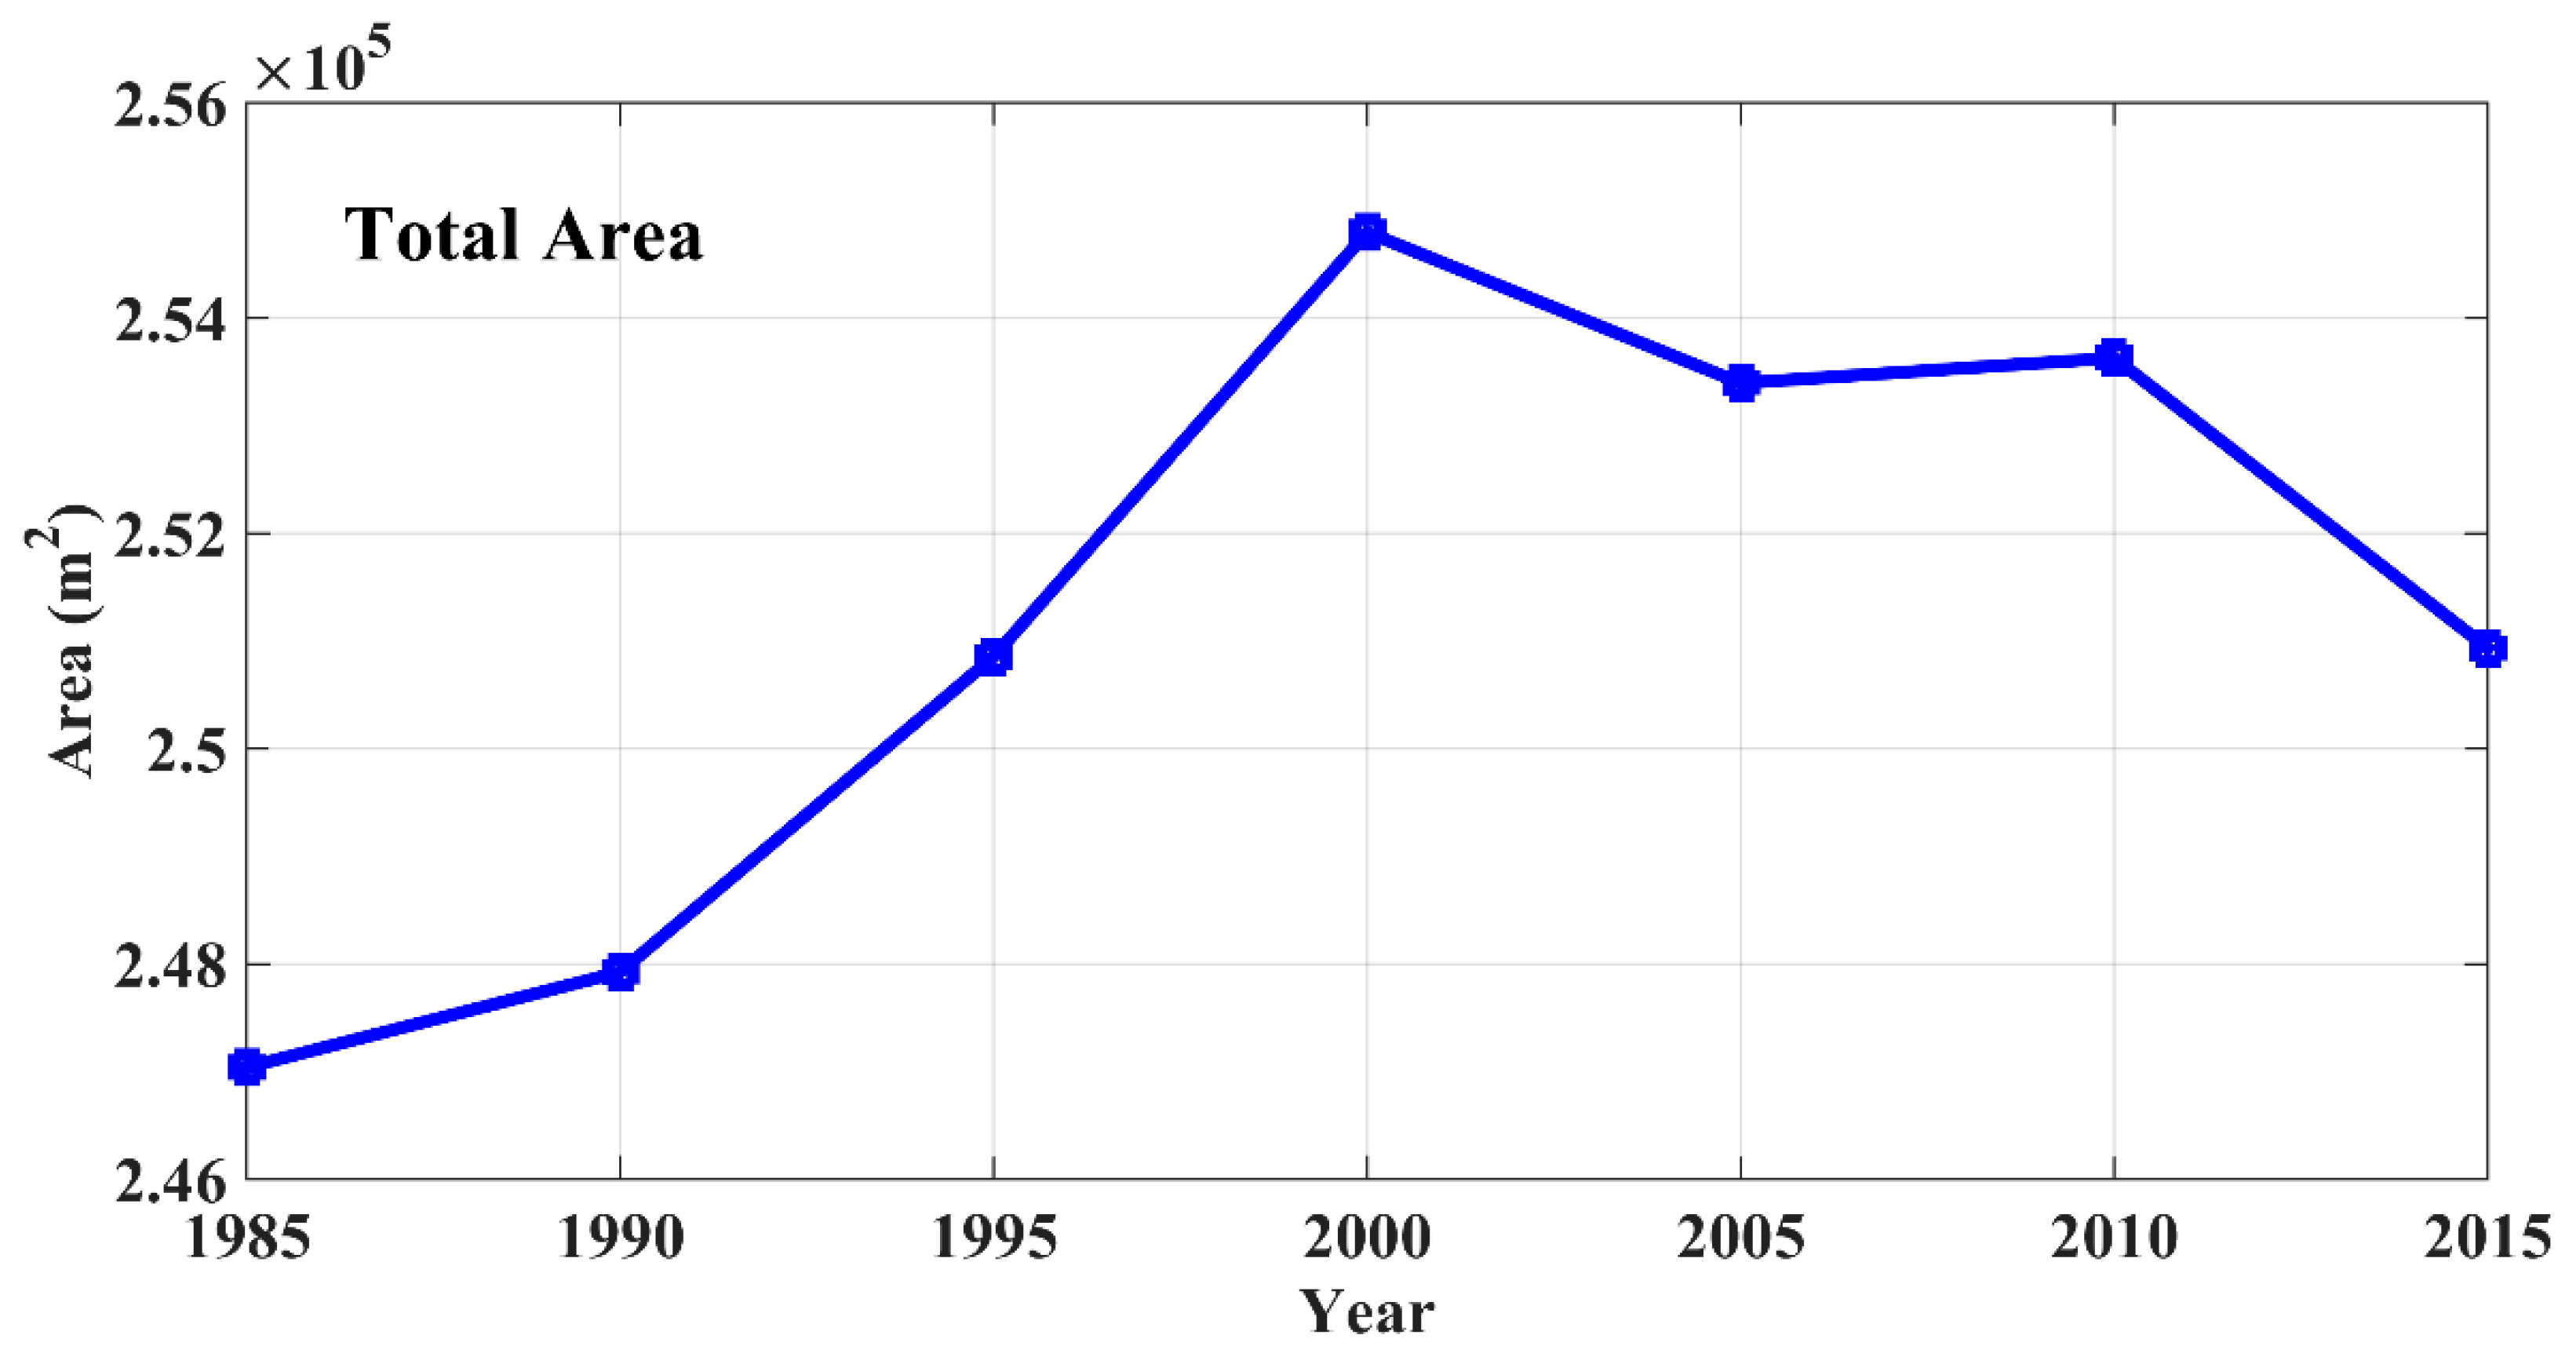
  • Between 1985 and 2015, the average annual total area of Yangzhong’s four islands was 251,224.46 m2. The total area first showed a growing trend and was followed by shrinking, but was found to be growing overall. Before 2000, the average annual growth rate was 517.08 m2; after 2000, the average annual reduction was 257.58 m2. Taipingzhou had the largest average area of 224,653.63 m2 and the fastest growth rate, reaching an average annual growth rate of 76.89 m2. The average area of Leigongdao was 4730.66 m2 with an average annual growth rate of 45.93 m2. Xishadao had the smallest area, with an average annual area of 2036.44 m2 and an average annual growth rate of 4.44 m2. The annual average area of Zhongxinsha was 19,803.73 m2, with the smallest growth rate of 2.49 m2.
  • By comparing the images, it was found that the four islands did not change much in shape over the 30 years. However, Leigongdao and Taipingzhou changed greatly in the local area. The northeastern part of Leigongdao and the northern end of Taipingzhou clearly showed new land formation, but the former showed slight erosion in 2005. The other two islands, Xishadao and Zhongxinsha, had almost no change in shape.
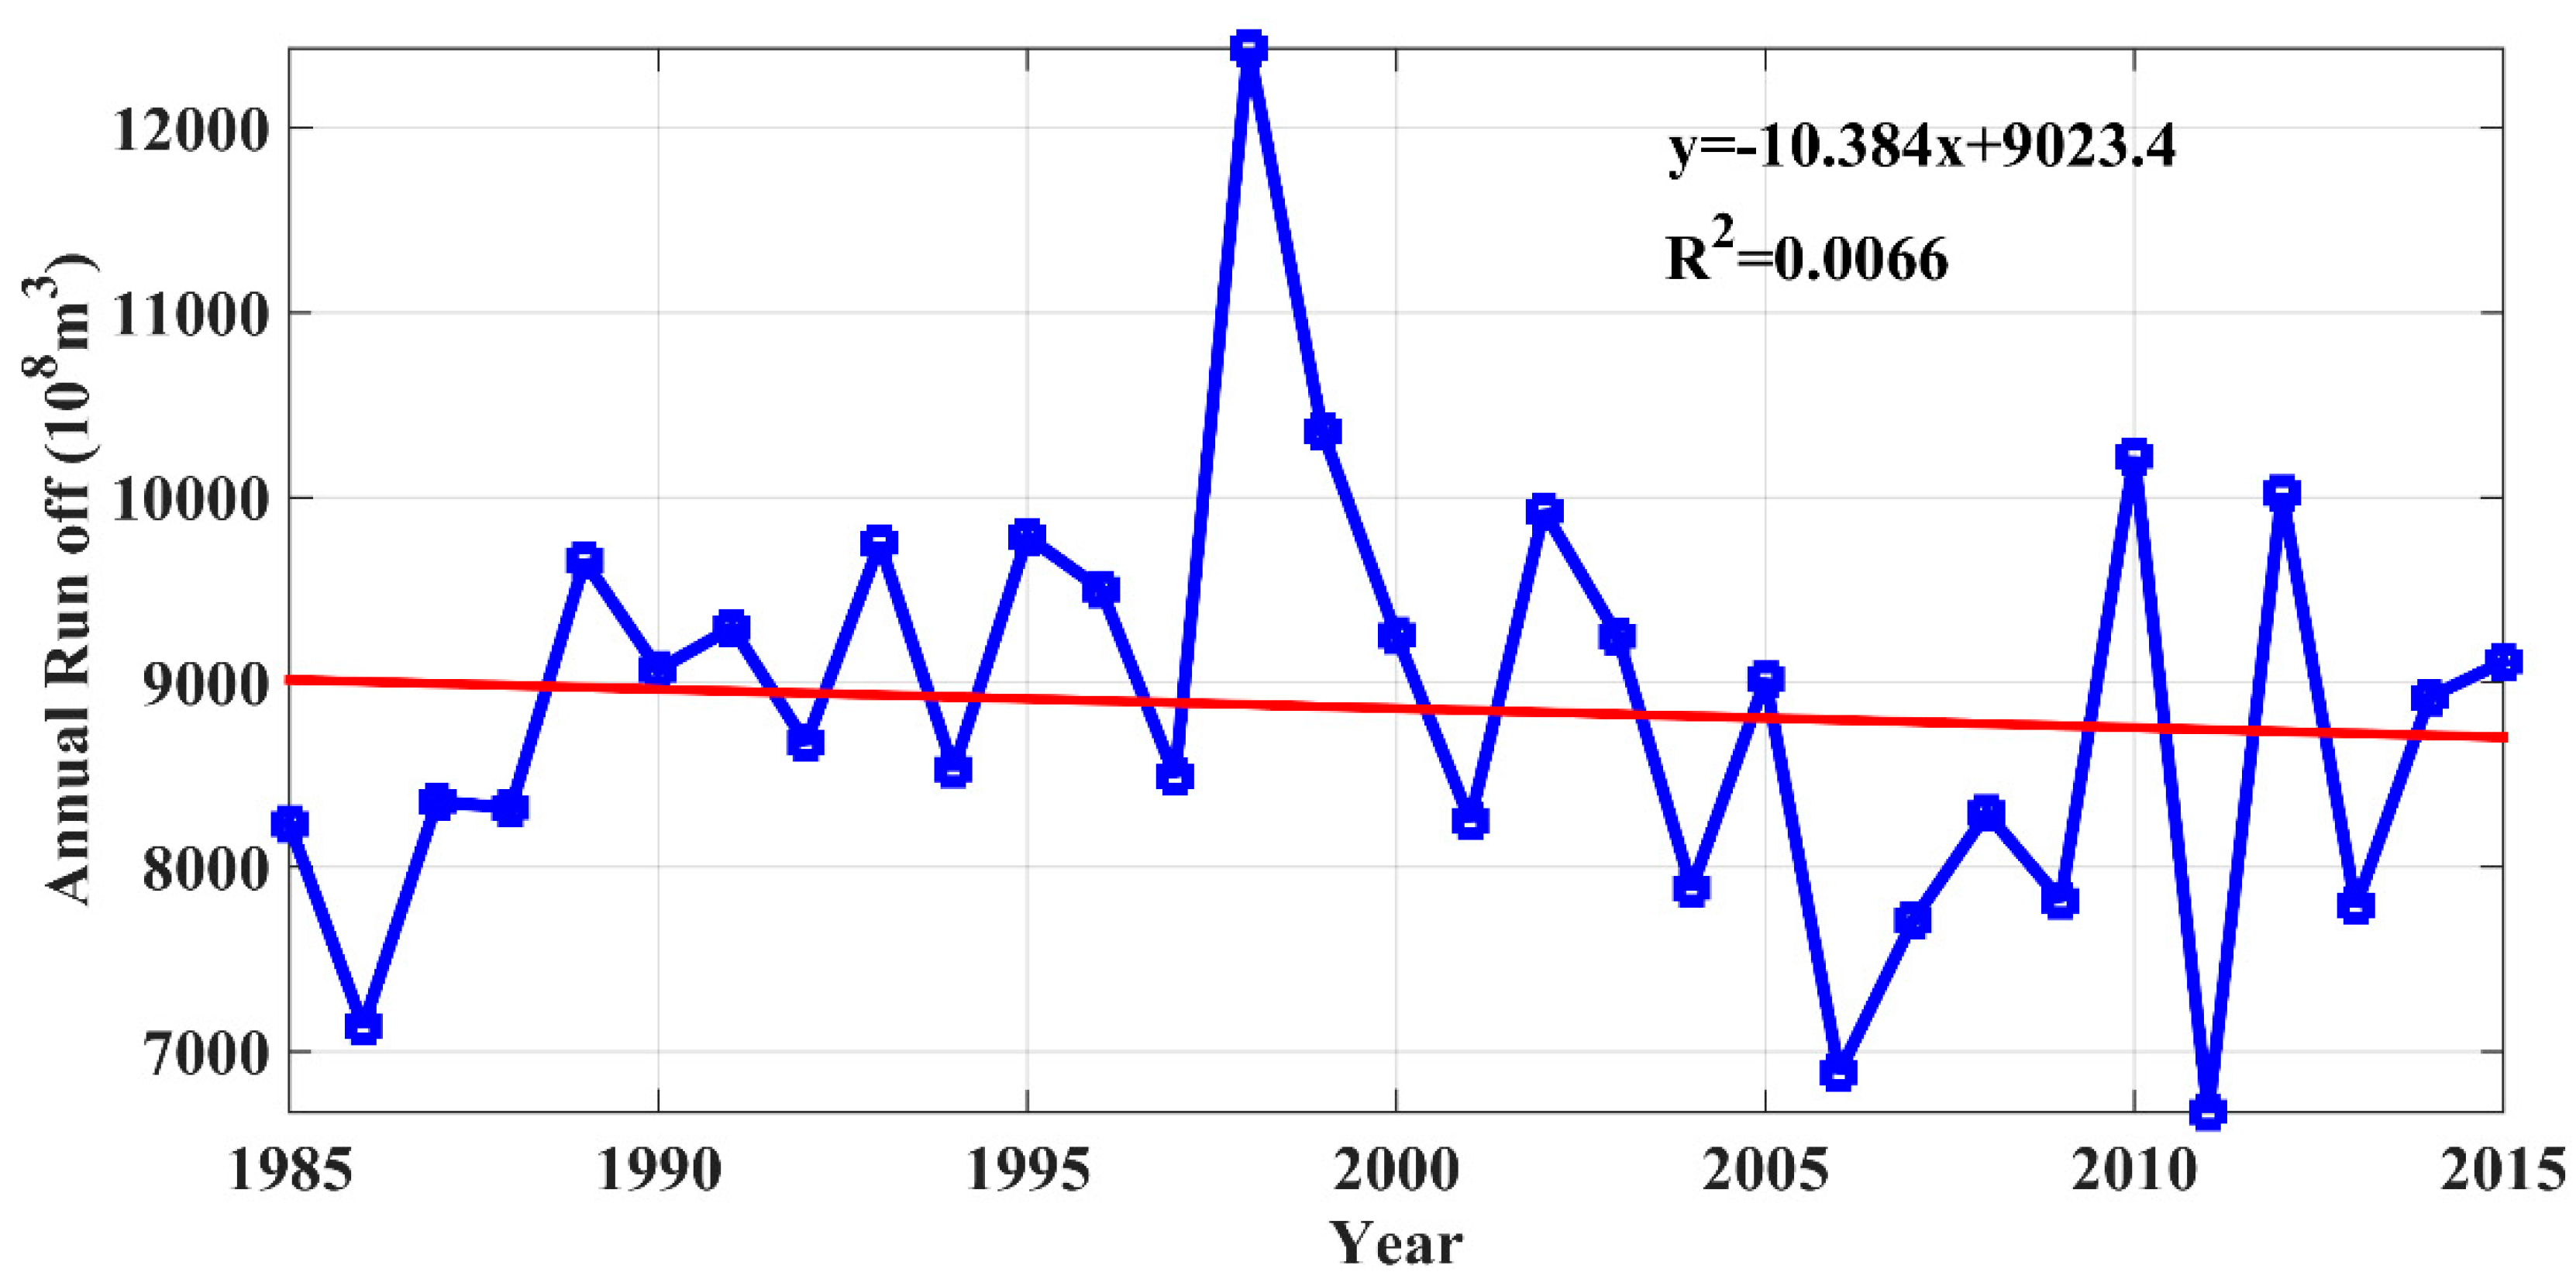
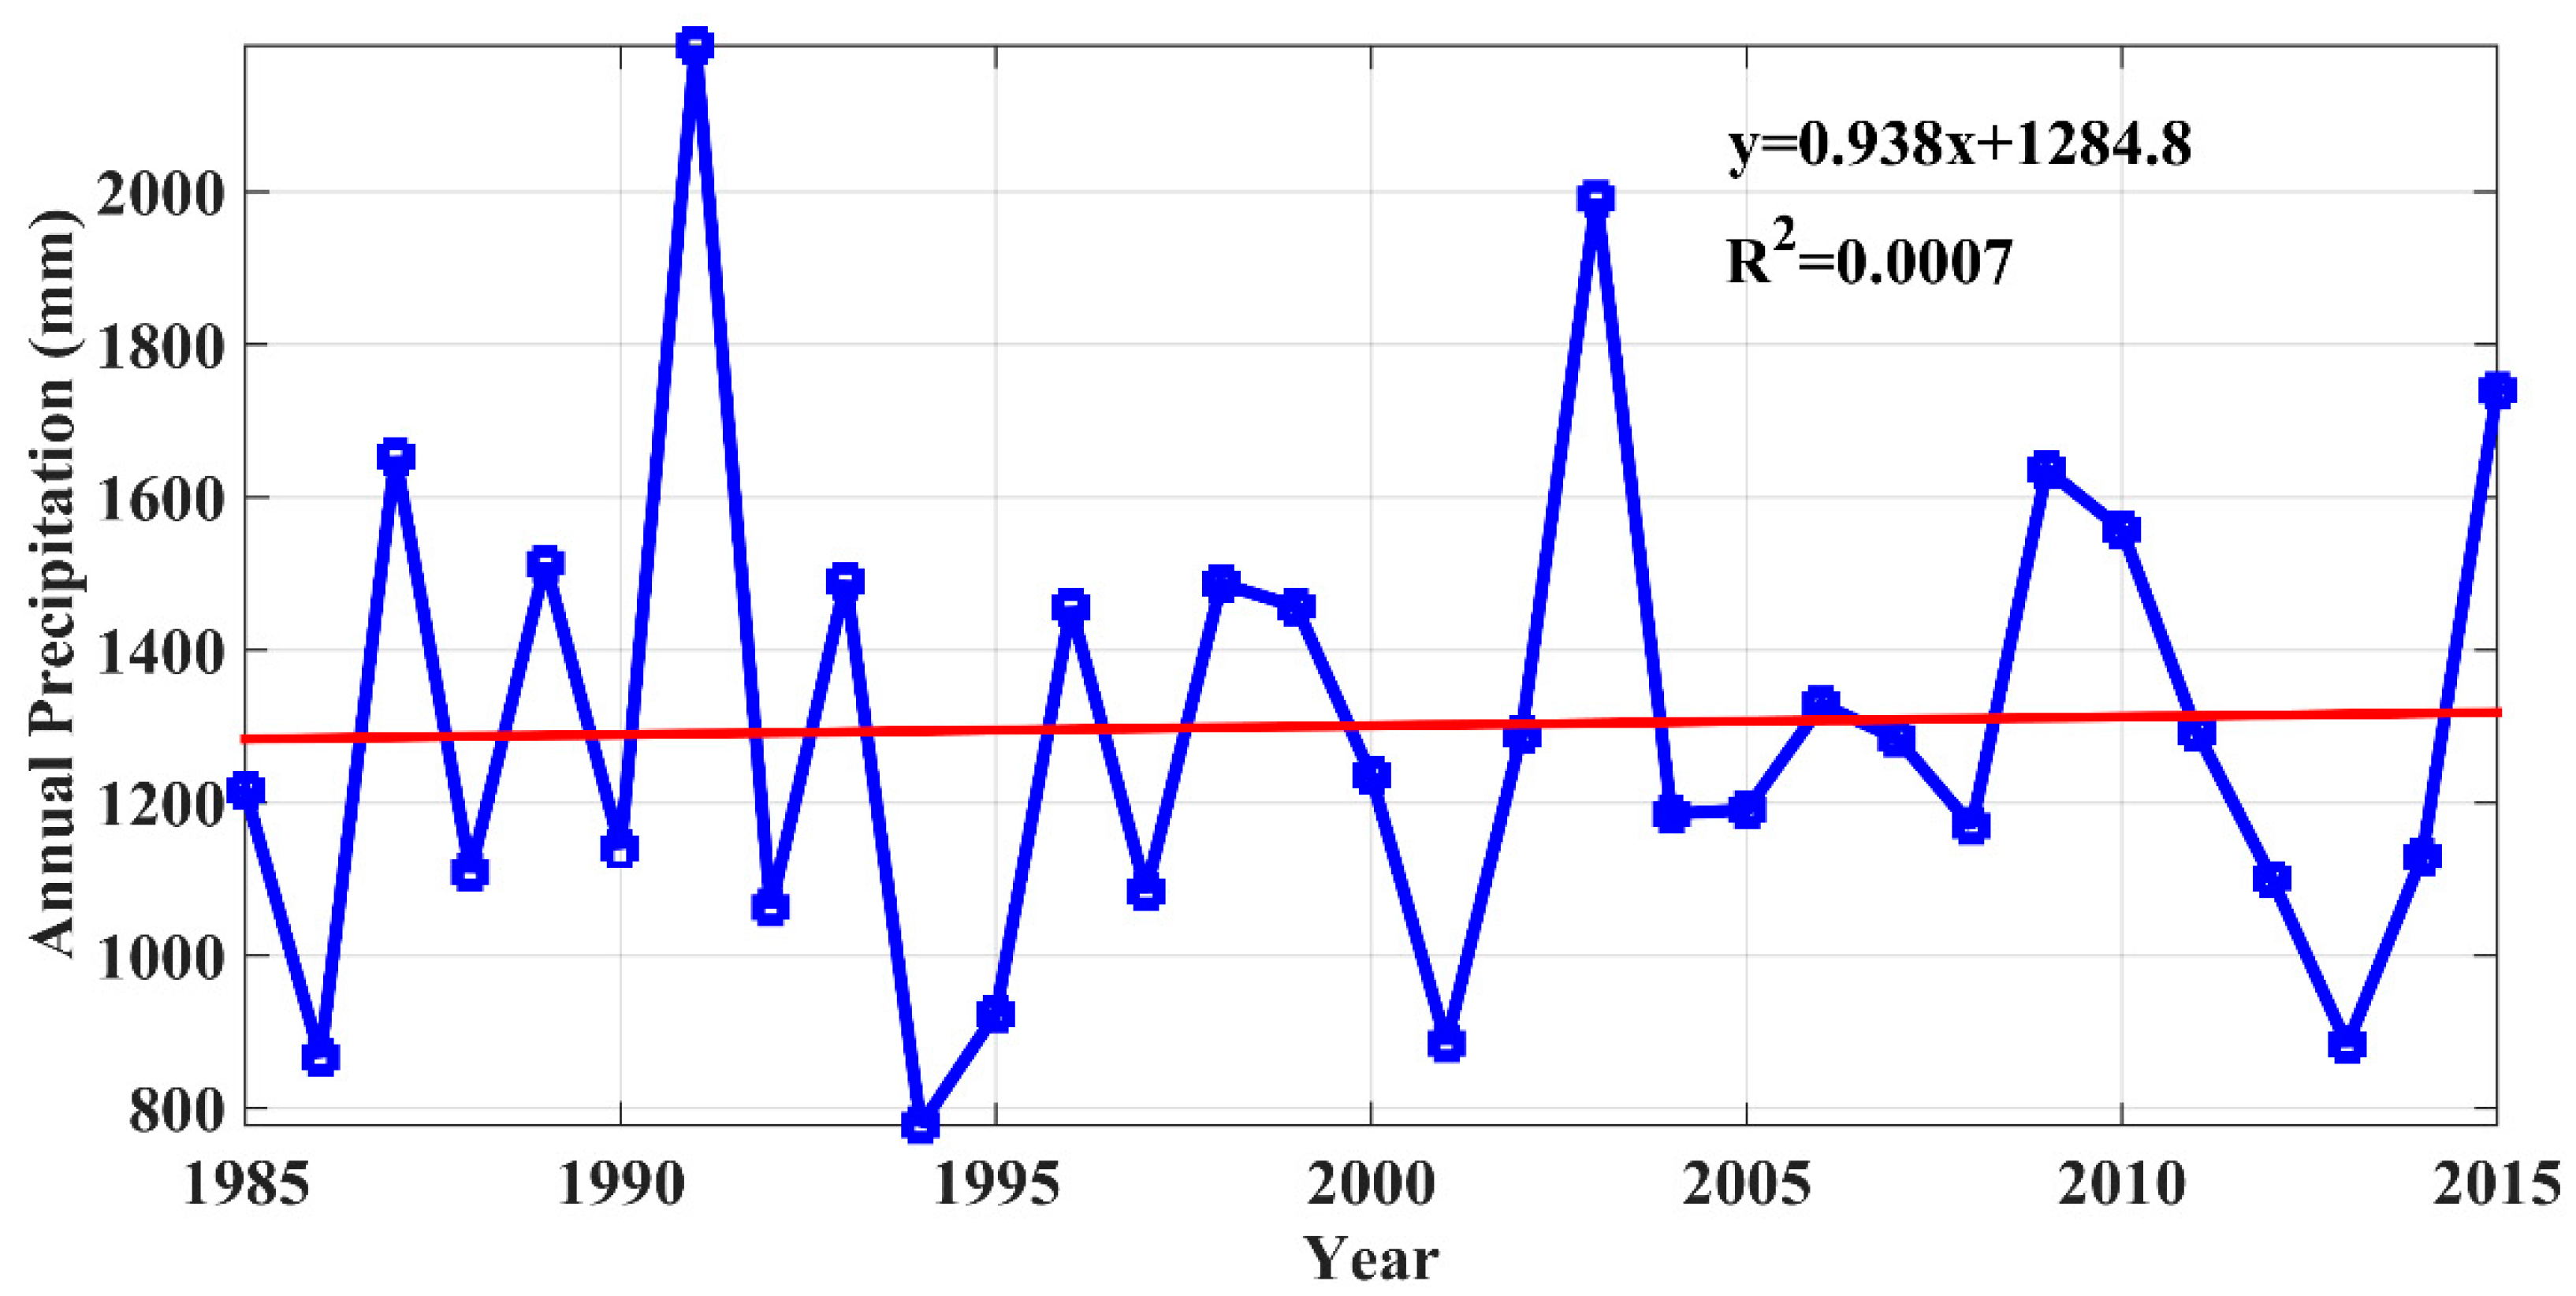
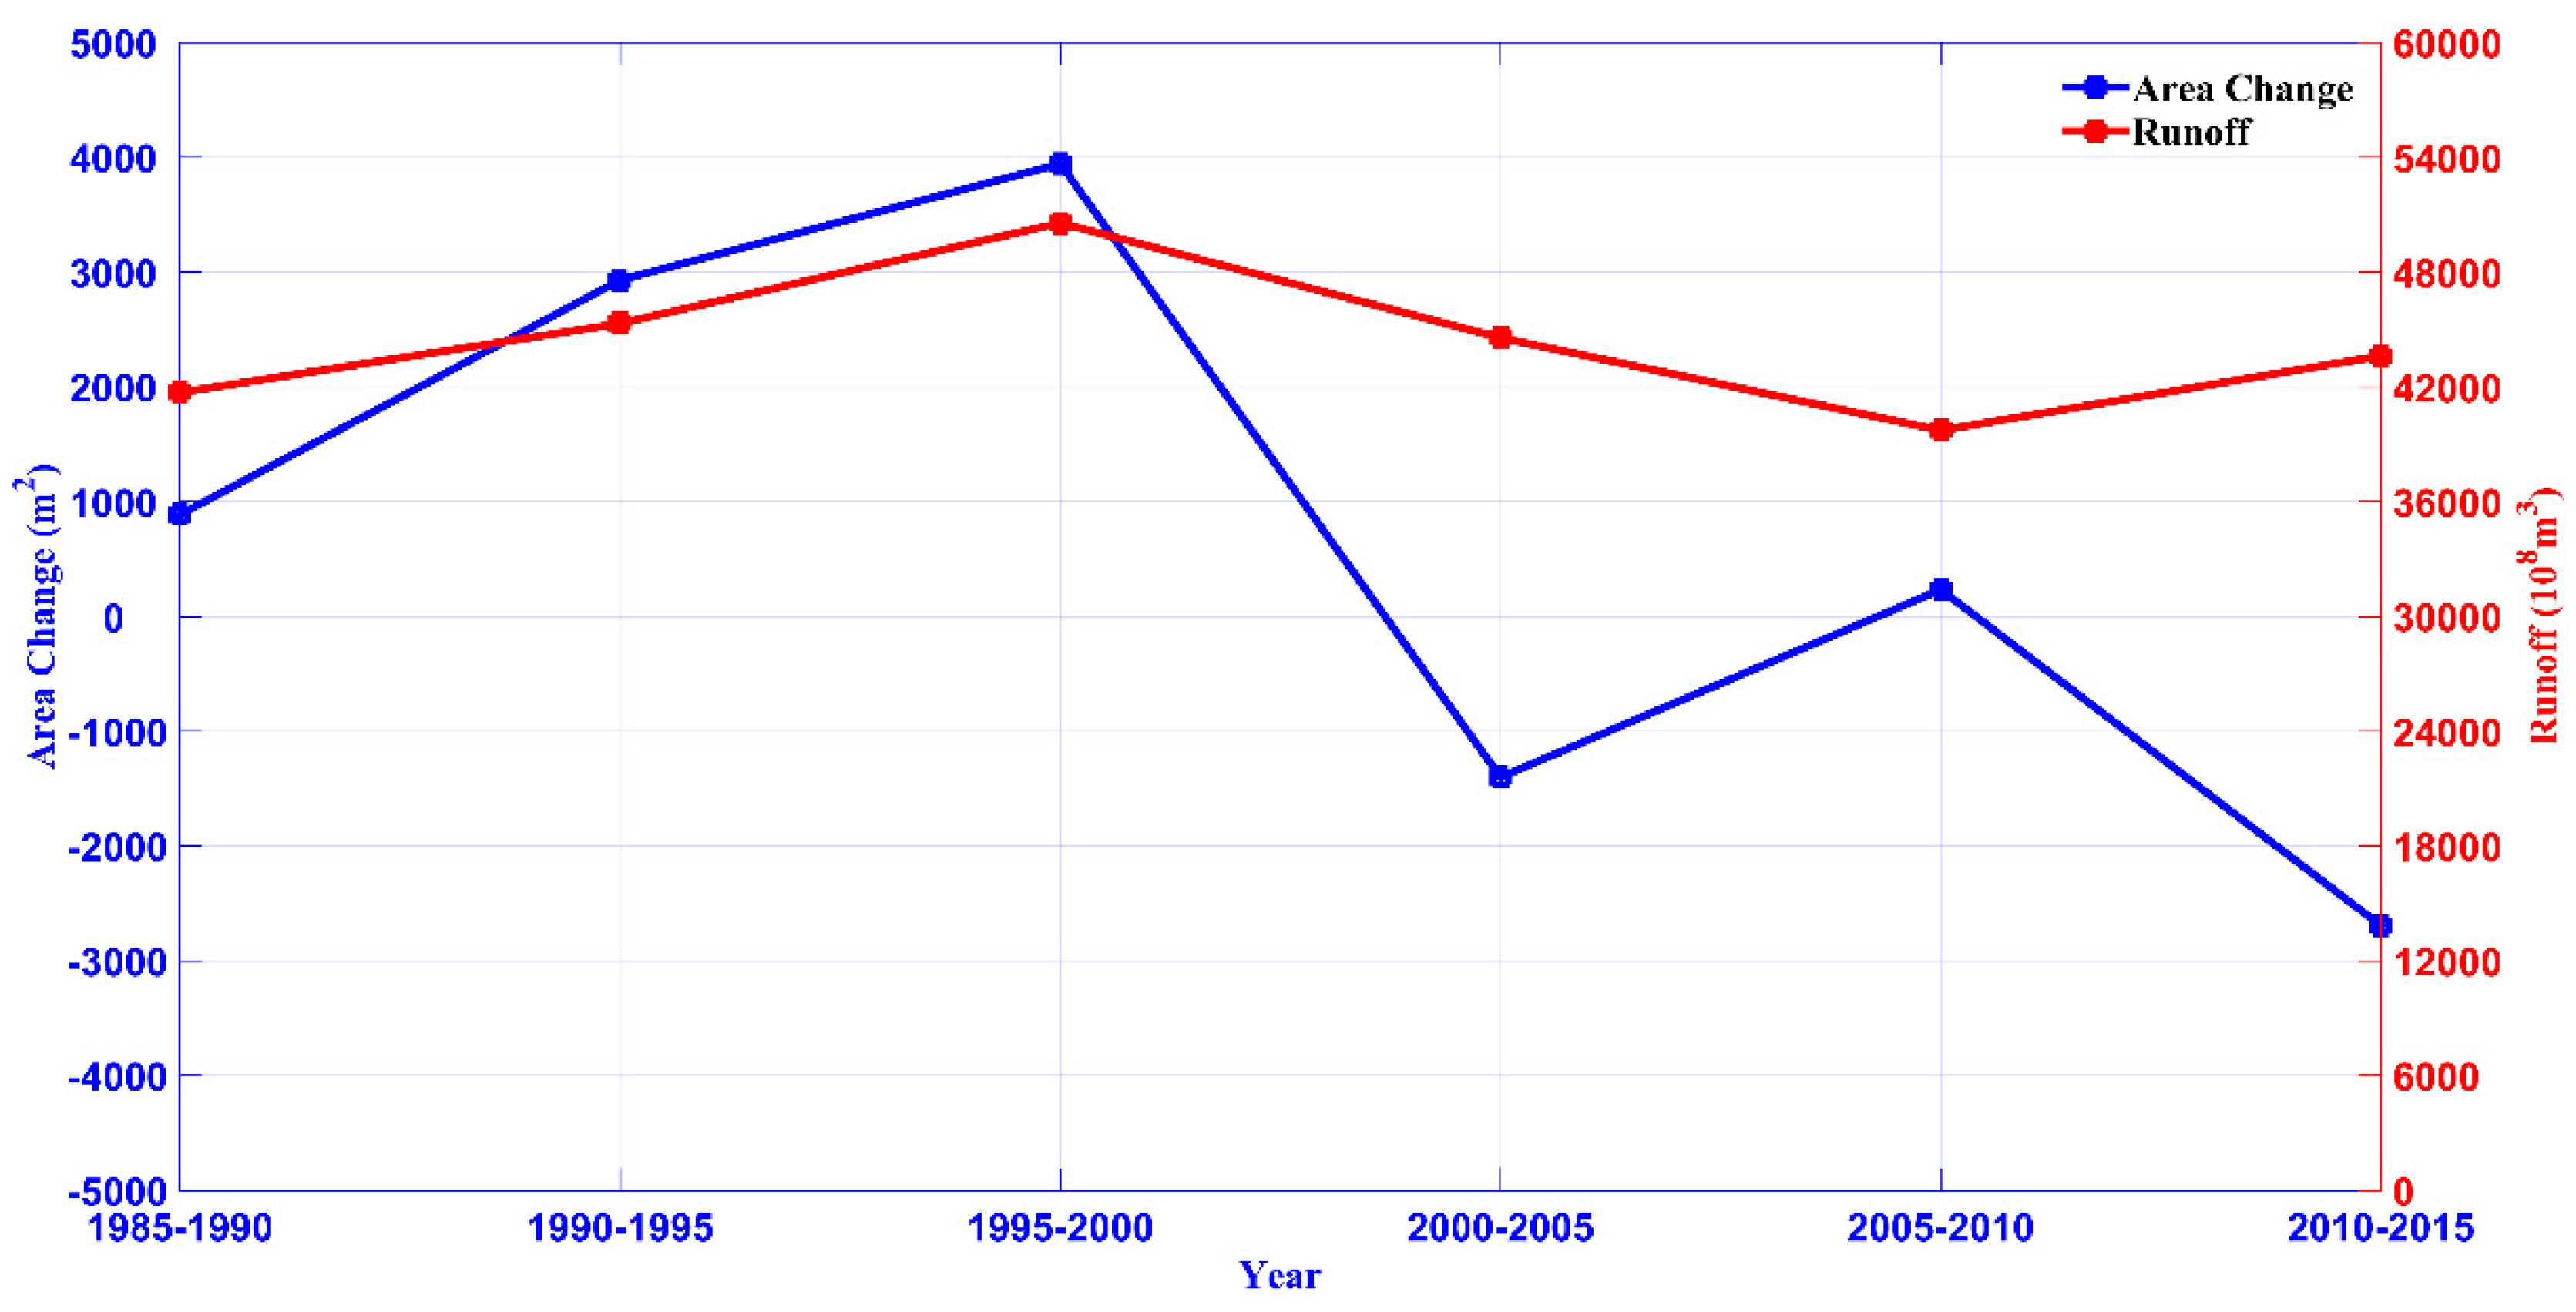
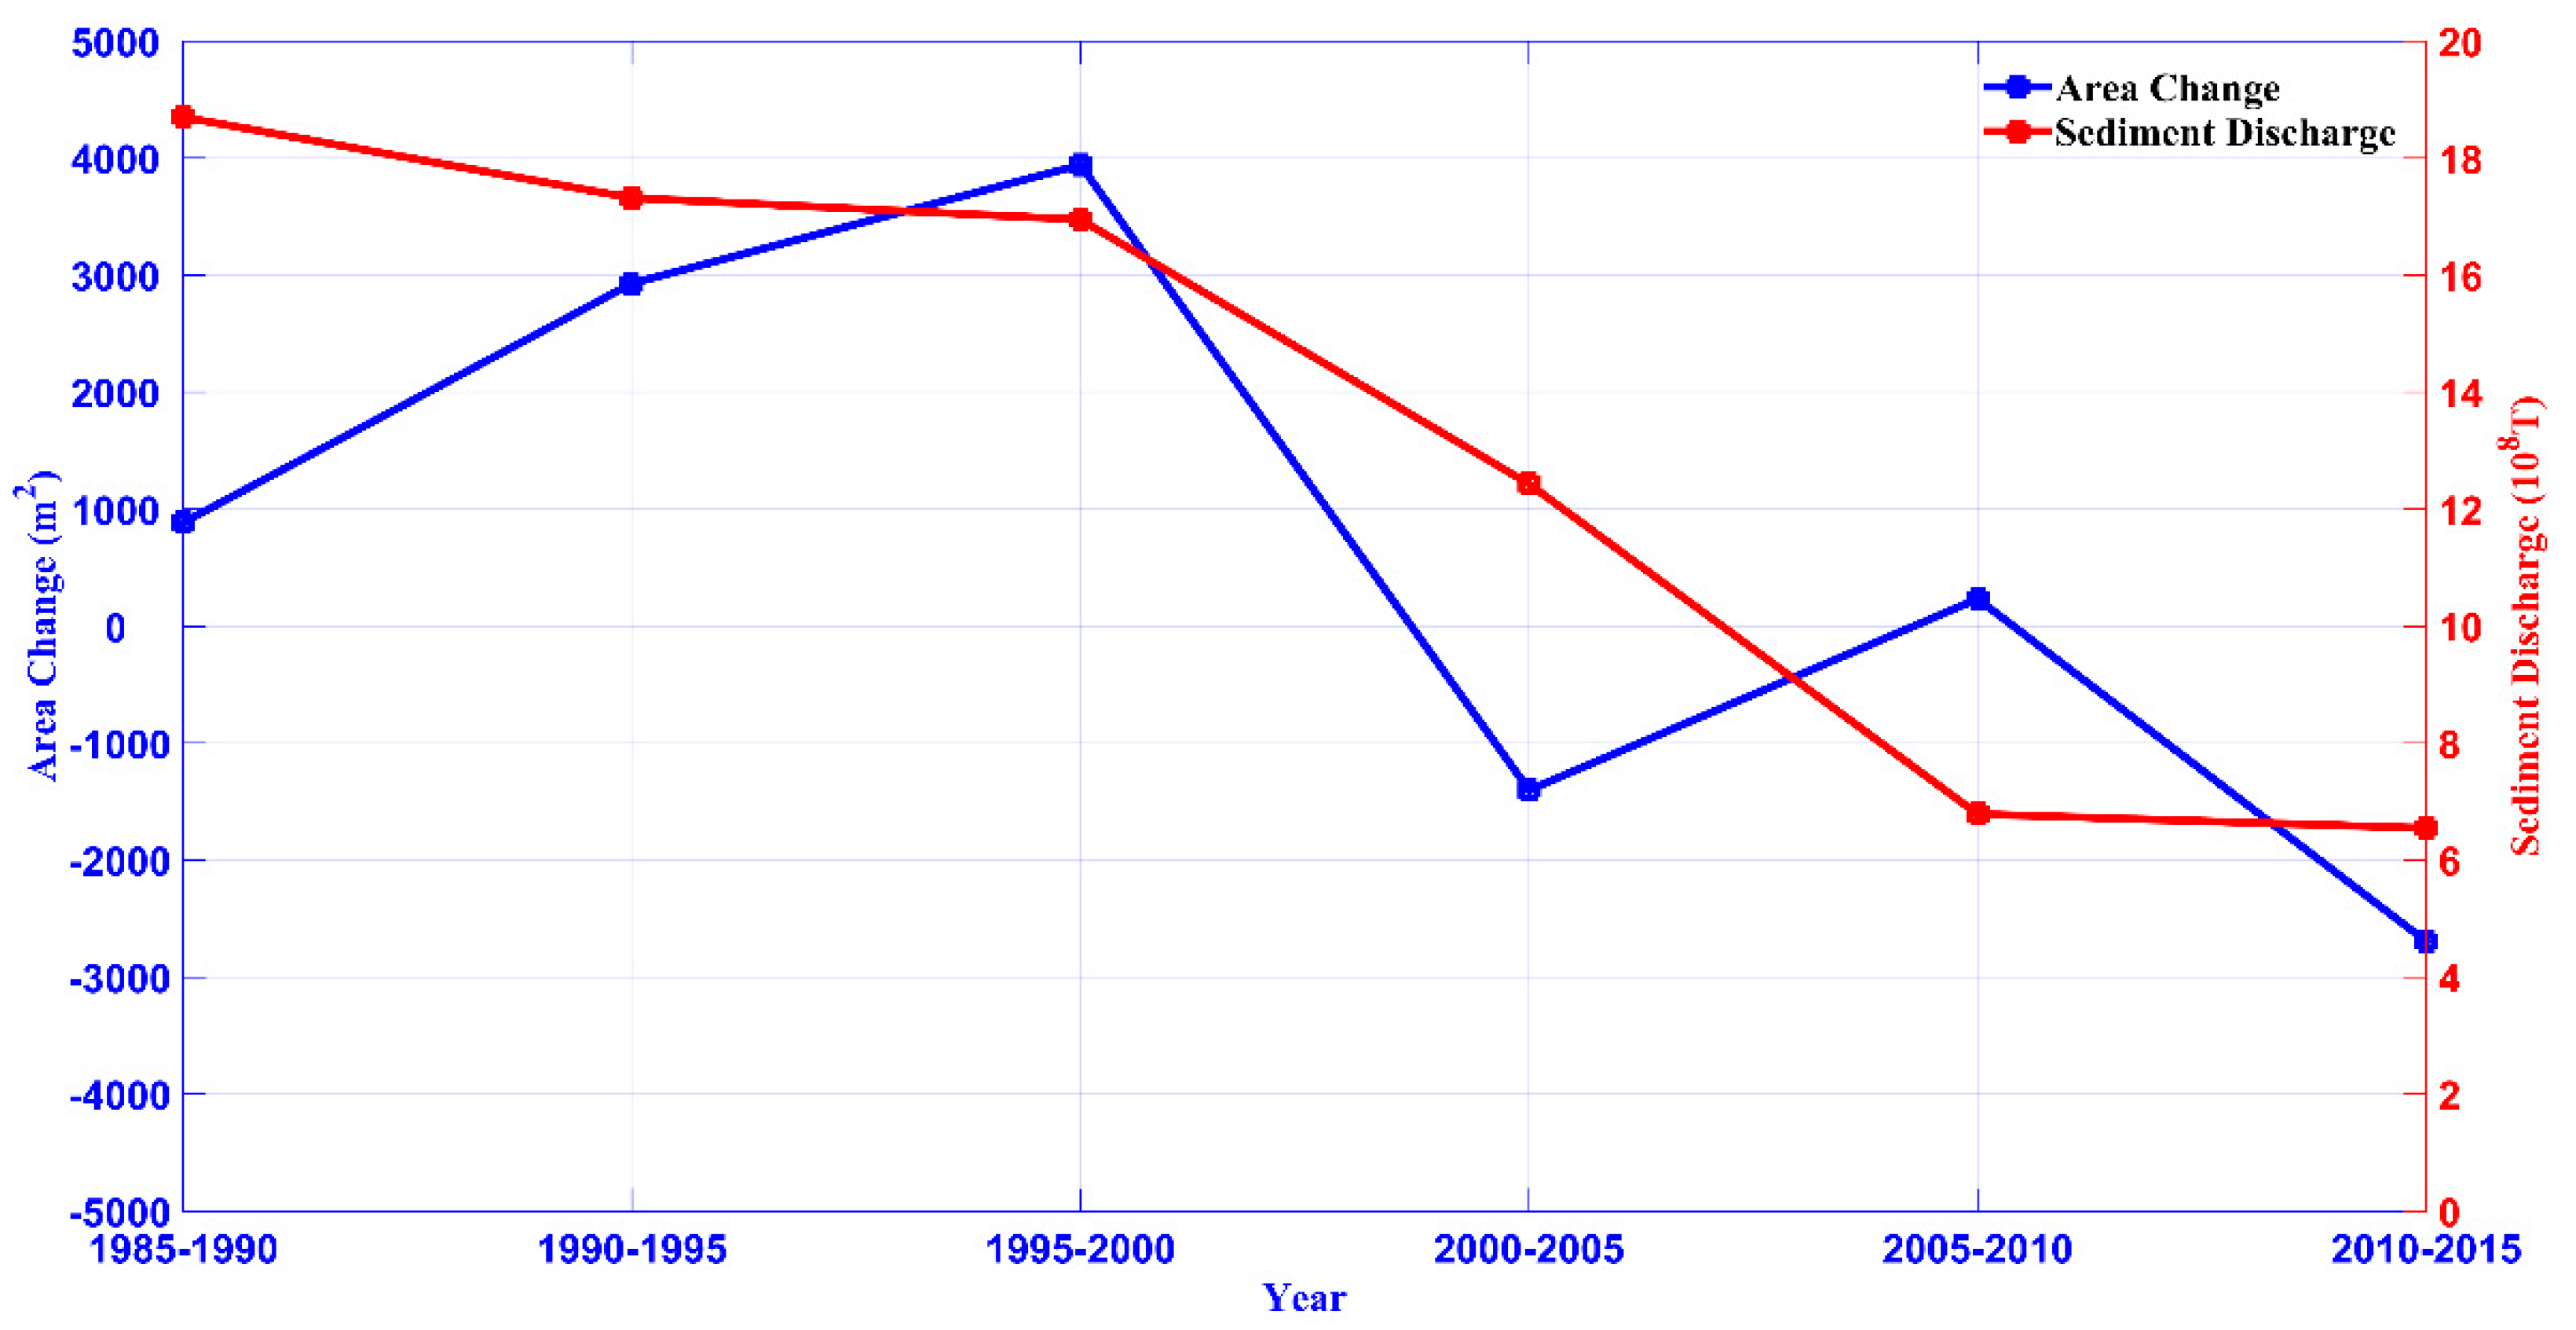
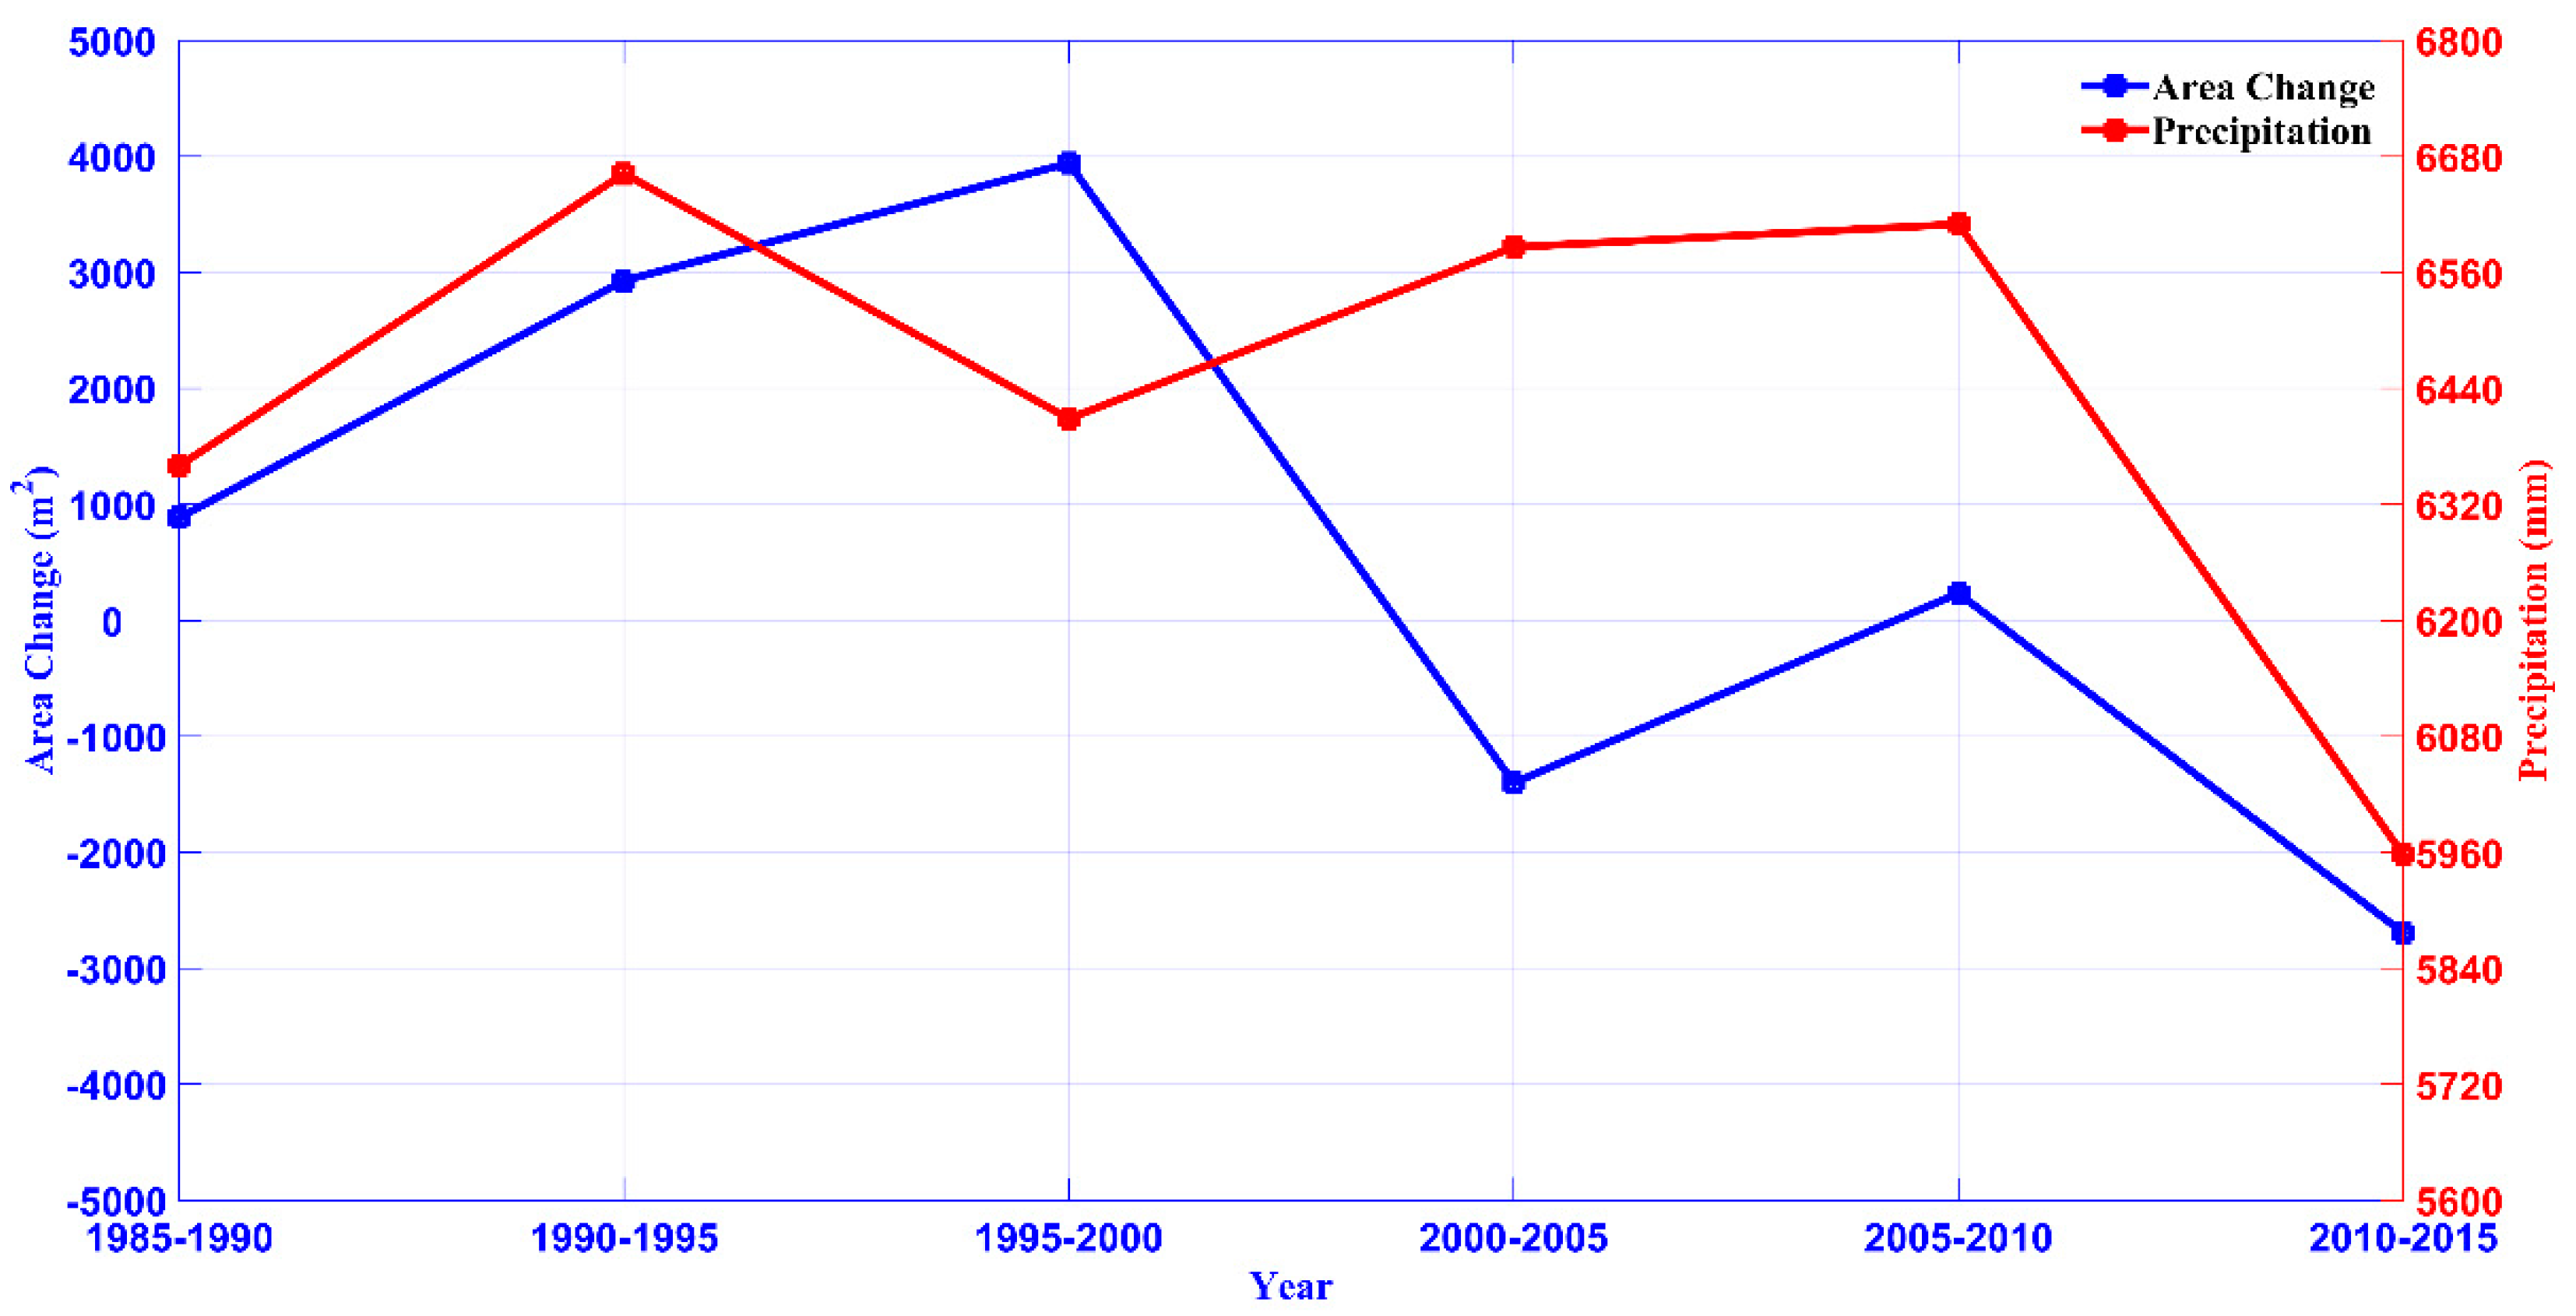
  • Correlation analysis showed that the area variation of the island was proportional to the cumulative annual runoff, annual sediment discharge, and annual precipitation. Their correlation coefficients were 0.56, 0.73, and 0.50, respectively, which were moderately correlated. Within a certain range, the change of area increased with an increase in runoff, sediment discharge, and precipitation, and decreased with their decrease. The correlation coefficient between sediment discharge and area change was the largest, indicating that sediment discharge is the most important natural factor affecting the evolution of islands.
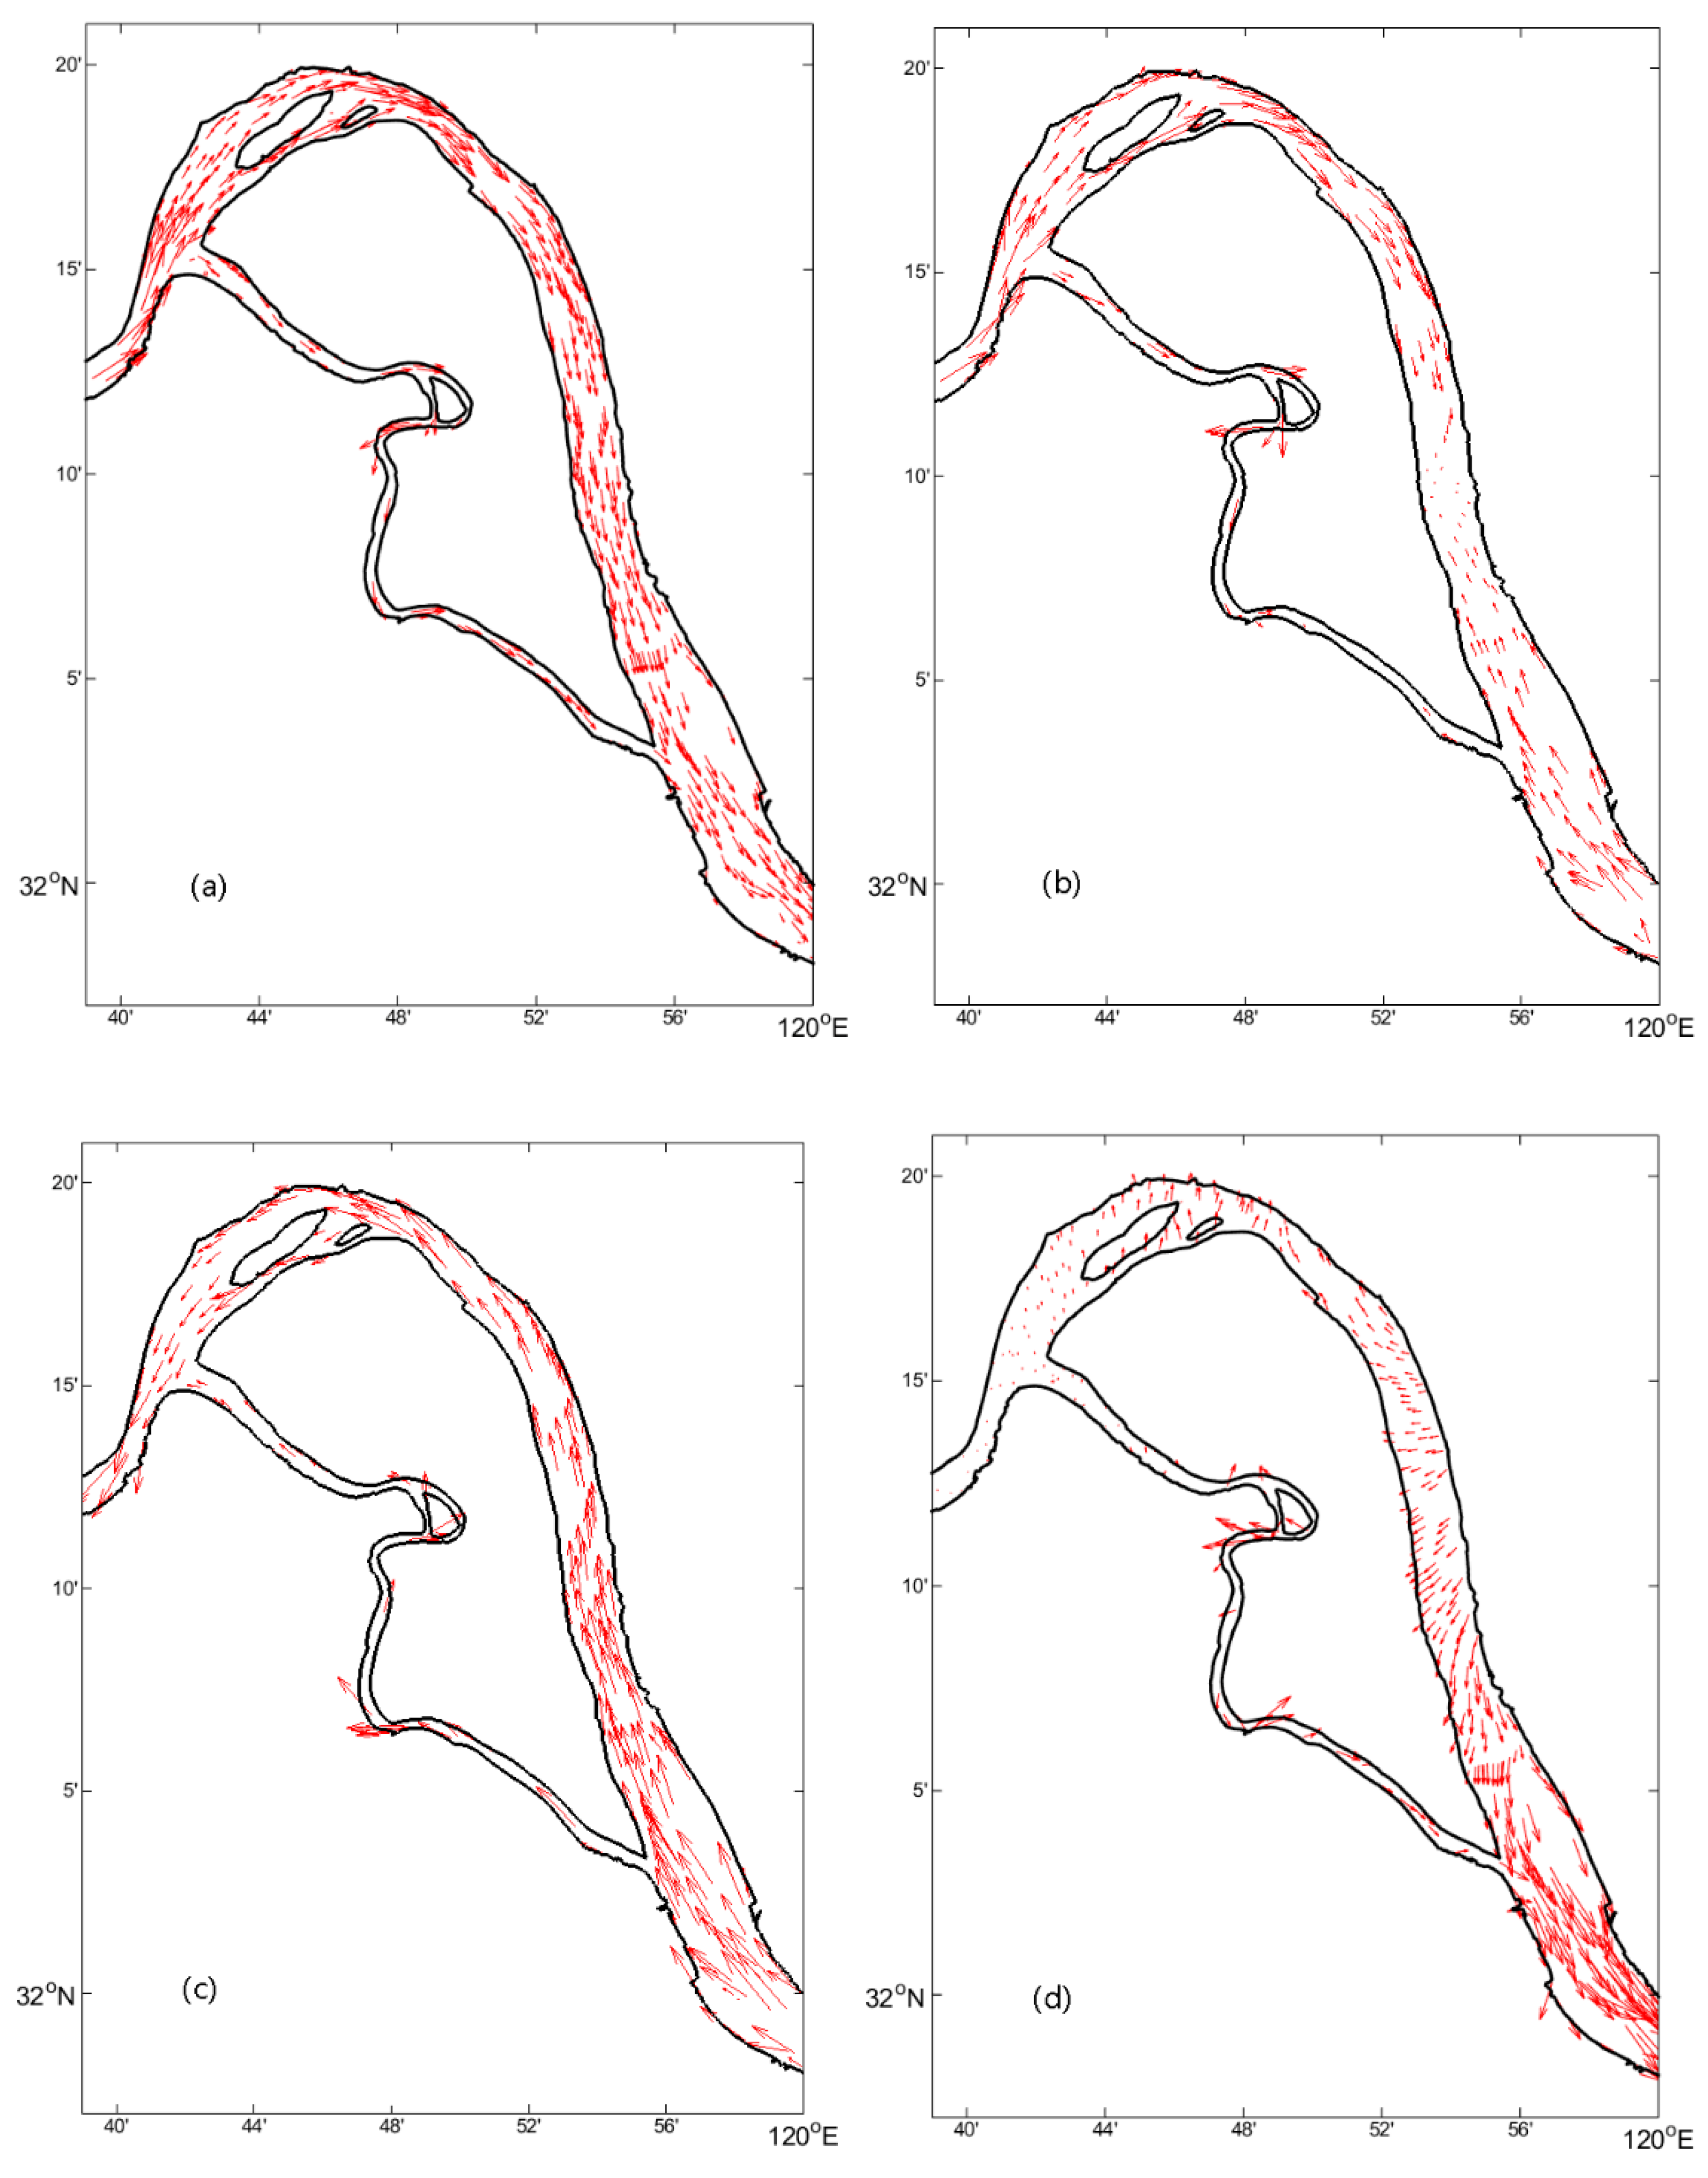
  • Through the numerical simulation of the flow field in the study area, it was found that the four islands of Yangzhong City were not only affected by the upstream runoff, but also by ocean tides. The current at the heads of Leigongdao and Taipingzhou Island was small, and flowed in the opposite direction to the island, which caused sediment deposition, and the erosion of the island body was also small. Effectively, the island developed, and the area increased. However, the current in the middle and end parts of Taipingzhou was strong and flowed towards the island, causing the erosion of these places to be more serious. Thus, the island did not show signs of development.

Author Contributions

H.S. did literature search, collected data, processed data and wrote the paper. C.D. analyzed the processing results and contributed in the revision of the paper. C.X., C.L. and Y.C. participated in data processing.

Funding

This research was funded by the National Key Research and Development Program of China, grant number 2017YFA0604100, 2017YFA0604101, 2017YFA0604104, 2016YFC0503602 and 2016YFB0201103; Postgraduate Research & Practice Innovation Program of Jiangsu Province, grant number KYCX18_1020; the National Natural Science Foundation of China, grant number 41476022 and 41490643; the Startup Foundation for Introducing Talent of Nanjing University of Information Science & Technology, grant number 2013r121, 2014r072 and 2017r024; the Program for Innovation Research and Entrepreneurship team in Jiangsu Province, grant number 2191061503801; the National Programme on Global Change and Air-Sea Interaction, grant number GASI-03-IPOVAI-05; the National Science Foundation, grant number OCE 06-23011; the Natural Science Foundation of Jiangsu Province, grant number BK20180803.

Acknowledgments

Authors would like to thank Lim Kam Sian Kenny T.C. for his constructive suggestions in this research.

Conflicts of Interest

The authors declare no conflict of interest.

References

  1. Carling, P.; Jansen, J.; Meshkova, L. Multichannel river: Their definition and classification. Earth Surf. Process. Landf. 2014, 39, 26–37. [Google Scholar] [CrossRef]
  2. Huang, H.Q.; Nanson, G.C. Why some alluvial rivers develop an anabranching pattern. Water Resour. Res. 2007, 43, W07441. [Google Scholar] [CrossRef]
  3. Promma, K.; Zheng, C.M.; Asnachinda, P. Groundwater and surface-water interactions in a confined alluvial aquifer between two rivers: Effects of groundwater flow dynamics on high iron anomaly. Hydrogeol. J. 2007, 15, 495–513. [Google Scholar] [CrossRef]
  4. Wang, Z.; He, Y.; Li, Y. Sediment budget of the Yangtze River. Water Resour. Res. 2007, 43, 1–10. [Google Scholar] [CrossRef]
  5. Wang, Z.; Li, H.; Cai, X. Remotely Sensed Analysis of Channel Bar Morphodynamics in the Middle Yangtze River in Response to a Major Monsoon Flood in 2002. Remote Sens. 2018, 10, 1165. [Google Scholar] [CrossRef]
  6. Li, L.; Xia, H.; Li, Z.; Zhang, Z. Temporal-Spatial Evolution Analysis of Lake Size-Distribution in the Middle and Lower Yangtze River Basin Using Landsat Imagery Data. Remote Sens. 2015, 7, 10364–10384. [Google Scholar] [CrossRef] [Green Version]
  7. Ge, F.; Mao, K.; Jiang, Y.; Fan, Y.; Wang, Y.; Tan, X.; Li, J. Analysis on Characteristics and Causes of Temperature and Vegetation Changes in the Middle and Lower Reaches of the Yangtze River After the Three Gorges Dam Operation. Clim. Chang. Res. 2017, 13, 578–588. [Google Scholar]
  8. Chen, D.; Chen, Y.; Huang, Z. Evolution characteristics analysis of Heishazhou southern waterway of the lower Yangtze River. Hydro-Sci. Eng. 2015, 2, 84–90. [Google Scholar]
  9. Yang, C.; Cai, X.; Wang, X. Remote Sensing of Hydrological Changes in Tian-e-Zhou Oxbow Lake, an Ungauged Area of the Yangtze River Basin. Remote Sens. 2018, 10, 27. [Google Scholar] [CrossRef]
  10. Wella-Hewage, C.S.; Hewa, G.A.; Pezzaniti, D. Can water sensitive urban design systems help to preserve natural channel-forming flow regimes in an urbanised catchment? Water Sci. Technol. 2016, 73, 78–87. [Google Scholar] [CrossRef]
  11. Park, E.; Latrubesse, E.M. Modeling suspended sediment distribution patterns of the Amazon River using MODIS data. Remote Sens. Environ. 2014, 147, 232–242. [Google Scholar] [CrossRef]
  12. Calera, A.; Campos, I.; Osann, A.; D’Urso, G.; Menenti, M. Remote Sensing for CropWater Management: From ET Modelling to Services for the End Users. Sensors 2017, 17, 1197. [Google Scholar] [CrossRef] [PubMed]
  13. Giardino, C.; Bresciani, M.; Cazzaniga, I.; Schenk, K.; Rieger, P.; Braga, F.; Matta, E.; Brando, V.E. Evaluation of Multi-Resolution Satellite Sensors for Assessing Water Quality and Bottom Depth of Lake Garda. Sensors 2014, 14, 24116–24131. [Google Scholar] [CrossRef] [PubMed] [Green Version]
  14. Qiao, C.; Luo, J.C.; Sheng, Y.W.; Shen, Z.F.; Zhu, Z.W.; Ming, D.P. An adaptive water extraction method from remote sensing image based on NDWI. J. Indian Soc. Remote Sens. 2012, 40, 421–433. [Google Scholar] [CrossRef]
  15. Gao, C. Study on channel islands in Ma-wu-tong section of Yangtze River based on MSS/TM/ETM remote sensing image. Remote Sens. Technol. Appl. 2012, 27, 135–141. [Google Scholar]
  16. Gao, C.; Chen, S.; Yu, J. River islands’ change and impacting factors in the lower reaches of the Yangtze River based on remote sensing. Quat. Int. 2013, 304, 13–21. [Google Scholar] [CrossRef]
  17. Shi, H.; Gao, C.; Dong, C.; Xia, C.; Xu, G. Variation of River Islands around a Large City along the Yangtze River from Satellite Remote Sensing Images. Sensors 2017, 17, 2213. [Google Scholar] [CrossRef]
  18. Zhang, X.; Pan, D.; Chen, J.; Zhao, J.; Zhu, Q.; Huang, H. Evaluation of Coastline Changes under Human Intervention Using Multi-Temporal High-Resolution Images: A Case Study of the Zhoushan Islands, China. Remote Sens. 2014, 6, 9930–9950. [Google Scholar] [CrossRef] [Green Version]
  19. Li, Z.; Wang, Z.; Jia, Y.; Li, W. Evolution analysis of channel bars in the middle and lower Yangtze River before and after impoundment of Three Gorges Reservoir. Res. Environ. Yangtze Basin 2015, 24, 65–73. [Google Scholar]
  20. Devi, D.; Phukan, N.; Sarma, B. A Study of Erosional Depositional Activity and Land Use Mapping of Majuli River Island Using Landsat Data. In Hydrologic Modeling; Springer: Singapore, 2018; Volume 81, pp. 187–200. [Google Scholar]
  21. Mani, P.; Kumar, R.; Chatterjee, C. Erosion study of a part of Majuli River-Island using remote sensing data. J. Indian Soc. Remote Sens. 2003, 81, 187–200. [Google Scholar] [CrossRef]
  22. Kotoky, P.; Bezbaruah, D.; Baruah, J. Erosion activity on Majuli—The largest river island of the world. Curr. Sci. 2003, 84, 929–932. [Google Scholar]
  23. Sankhua, R.N.; Sharma, N.; Garg, P.K.; Pandey, A.D. Use of remote sensing and ANN in assessment of erosion activities in Majuli, the world’s largest river island. Int. J. Remote Sens. 2005, 26, 4445–4454. [Google Scholar] [CrossRef]
  24. Li, H.; Wang, P.; Su, W.; Wang, G.; Ren, S. Study on Influence of River Island on Distribution of Circulation in Curve and Branch Channel. In Informatics and Management Science II; Springer: London, UK, 2013; pp. 205–211. [Google Scholar]
  25. Picco, L.; Mao, L.; Rainato, R.; Lenzi, M.A. Medium-term fluvial island evolution in a disturbed gravel-bed river (Piave River, Northeastern Italian Alps). Geogr. Ann. Ser. A Phys. Geogr. 2014, 96, 83–97. [Google Scholar] [CrossRef]
  26. Huang, S.; Liao, Q.; Hua, M.; Wu, X.; Bi, K.; Yan, C.; Chen, B.; Zhang, B. Survey of heavy metal pollution and assessment of agricultural soil in Yangzhong district, Jiangsu Province, China. Chemosphere 2007, 67, 2148–2155. [Google Scholar] [CrossRef] [PubMed]
  27. Jiangsu Province Water Resources Department (JPWRD). Jiangsu Province Water Resources Bulletin; Jiangsu Province Water Resources Department: Nanjing, China, 2006–2015.
  28. Ministry of Water Resources (MWR). China River Sediment Bulletin; Ministry of Water Resources: Beijing, China, 2000–2015.
  29. Changjiang Water Resources Commission (CWRC). Changjiang Sediment Bulletin; Changjiang Water Resources Commission of the Ministry of Water Resources: Wuhan, China, 2000–2015. [Google Scholar]
  30. Chen, C.; Liu, H.; Beardsley, R.C. An Unstructured Grid, Finite-Volume, Three-Dimensional, Primitive Equations Ocean Model: Application to Coastal Ocean and Estuaries. J. Atmos. Ocean. Technol. 2003, 20, 159–186. [Google Scholar] [CrossRef]
  31. Chen, C.; Huang, H.; Beardsley, R.C.; Liu, H.; Xu, Q.; Cowles, G.W. A finite volume numerical approach for coastal ocean circulation studies: Comparisons with finite difference models. J. Geophys. Res. Oceans 2007, 112, 83–87. [Google Scholar] [CrossRef]
  32. Song, Z.; Mao, L. Salt water encroachment at the Yangtze River Estuary. Water Resour. Prot. 2002, 3, 27–30. [Google Scholar]
  33. Lin, C.; Gao, X. Effect of water conservancy project on the changes of runoff and sediment in Dongting Lake. J. Lake Sci. 1994, 6, 33–39. [Google Scholar] [Green Version]
Figure 1. (a) Location of Yangzhong City in China. (b) Map of the study area by the Landsat 5 Thematic Mapper (TM) acquired on 1 March 2000.
Remotesensing 10 02046 g001
Figure 2. Selection of the threshold value, which is the demarcation between water and land. (a) The fourth band of a TM image acquired on 11 January 1985. (b) A random island boundary from the fourth band image. (c) Reading the threshold values after magnifying the boundary.
Remotesensing 10 02046 g002
Figure 3. Validation of the threshold value in the image of 1985. The values between 15 and 24 represent water.
Remotesensing 10 02046 g003
Figure 4. Image processed by the binarization model from a Landsat 5 TM image of 11 January 1985.
Remotesensing 10 02046 g004
Figure 5. Model mesh produced by SMS (Surface Water Modeling System).
Remotesensing 10 02046 g005
Figure 6. Extraction results of river islands in Yangzhong City from the Landsat TM and Enhanced Thematic Mapper+ (ETM+) in (a) 1985, (b) 1990, (c) 1995, (d) 2000, (e) 2005, (f) 2010, and (g) 2015.
Remotesensing 10 02046 g006aRemotesensing 10 02046 g006b
Figure 7. Change of each river island area during 1985–2015. The blue bars are the areas, and the red lines are polynomial fitting trend lines.
Remotesensing 10 02046 g007
Figure 8. Variation of the four river islands’ total area during 1985–2015.
Remotesensing 10 02046 g008
Figure 9. Fluctuation of annual runoff measured by the Datong hydrological station. The blue line is the annual runoff, and the red line is a linear fitting trend line.
Remotesensing 10 02046 g009
Figure 10. Fluctuation of annual sediment discharge measured by the Datong hydrological station. The blue line is the annual sediment discharge, and the red line is a linear fitting trend line.
Remotesensing 10 02046 g010
Figure 11. Fluctuation of annual precipitation measured by the Nanjing reference climatological station. The blue line is the annual precipitation, and the red line is a linear fitting trend line.
Remotesensing 10 02046 g011
Figure 12. Relationship between the total area change and accumulated annual runoff.
Remotesensing 10 02046 g012
Figure 13. Relationship between the total area change and accumulated annual sediment discharge.
Remotesensing 10 02046 g013
Figure 14. Relationship between the total area change and accumulated annual precipitation.
Remotesensing 10 02046 g014
Figure 15. Flow field in the Yangzhong section of Yangtze River. (a) The average surface flow field from 1 to 15 January 2015. (b) The surface flow field at 13 o’clock on 1 January 2015. (c) The surface flow field at 15 o’clock on 1 January 2015. (d) The average surface flow field from 0 to 10 o’clock on 1 January 2015.
Remotesensing 10 02046 g015
Table 1. Details about the remote sensing images over the study area.
DateSatellite/SensorPath/RowCenter Latitude (°W)Center Longitude (°E)Resolution (m)
11 January 1985Landsat5/TM119/3831.74873120.4014530
26 February 1990Landsat5/TM119/3831.77380120.2626130
24 February 1995Landsat5/TM119/3831.75787120.3479530
1 March 2000Landsat7/ETM+119/3831.74300120.3557030
19 February 2005Landsat5/TM119/3831.75269120.3770330
8 January 2010Landsat7/ETM+119/3831.73645120.3647830
5 December 2014Landsat7/ETM+119/3831.73690120.3987430
Table 2. Hydrological station information.
Station NameStation NumberLatitude (°W)Longitude (°E)Location
Datong60,31530.77117.62Guichi District, Chizhou City, Anhui Province
Jiujiang60,29029.72115.97Xunyang District, Jiujiang City, Jiangxi Province
Table 3. Nanjing reference climatological station information.
Station NameNetwork: IDLatitude (degree)Longitude (degree)Elevation (m)
NANJING, CHGHCND: CHM0005823831.56W118.54E15
Table 4. The threshold values in each image.
Year1985199019952000200520102015
Satellite/SensorLandsat5/TMLandsat5/TMLandsat5/TMLandsat7/ETM+Landsat5/TMLandsat7/ETM+Landsat7/ETM+
Threshold Value25253025254040
Table 5. River island area variations during different periods.
Year1990–19851995–19902000–19952005–20002010–20052015–2010
Δ A ( m 2 ) 884.72929.53942.0−1401.3233.1−2695.5

