Article

4D Monitoring of Active Sinkholes with a Terrestrial Laser Scanner (TLS): A Case Study in the Evaporite Karst of the Ebro Valley, NE Spain

by
Alfonso Benito-Calvo
1,
Francisco Gutiérrez
2,*,
Adrián Martínez-Fernández
3,
Domingo Carbonel
2,
Theodoros Karampaglidis
1,
Gloria Desir
2,
Jorge Sevil
2,
Jesús Guerrero
2,
Ivan Fabregat
2 and
Ángel García-Arnay
2
1
CENIEH, Paseo Sierra de Atapuerca 3, 09002 Burgos, Spain
2
Department of Earth Sciences, University of Zaragoza, 50009 Zaragoza, Spain
3
Department of Geography, University of Valladolid, 47011 Valladolid, Spain
*
Author to whom correspondence should be addressed.
Submission received: 7 March 2018 / Revised: 26 March 2018 / Accepted: 4 April 2018 / Published: 7 April 2018
(This article belongs to the Special Issue Remote Sensing of Land Subsidence)

Abstract

:
This work explores, for the first time, the application of a Terrestrial Laser Scanner (TLS) and a comparison of point clouds in the 4D monitoring of active sinkholes. The approach is tested in three highly-active sinkholes related to the dissolution of salt-bearing evaporites overlain by unconsolidated alluvium. The sinkholes are located in urbanized areas and have caused severe damage to critical infrastructure (flood-control dike, a major highway). The 3D displacement models derived from the comparison of point clouds with exceptionally high spatial resolution allow complex spatial and temporal subsidence patterns within one of the sinkholes to be resolved. Detected changes in the subsidence activity (e.g., sinkhole expansion, translation of the maximum subsidence zone, development of incipient secondary collapses) are related to potential controlling factors such as floods, water table changes or remedial measures. In contrast, with detailed mapping and high-precision leveling, the displacement models, covering a relatively short time span of around 6 months, do not capture the subtle subsidence (<0.6–1 cm) that affects the marginal zones of the sinkholes, precluding precise mapping of the edges of the subsidence areas. However, the performance of TLS can be adversely affected by some methodological limitations and local conditions: (1) limited accuracy in large investigation areas that require the acquisition of a high number of scans, increasing the registration error; (2) surface changes unrelated to sinkhole activity (e.g., vegetation, loose material); (3) traffic-related vibrations and wind blast that affect the stability of the scanner.

Graphical Abstract

1. Introduction

Bibliometric data show that investigations dealing with sinkholes have increased dramatically over the last two decades, concordant with a rapid rise in sinkhole-related damage on a global scale. This recent sinkhole risk escalation is largely related to (1) the increase in sinkhole occurrence in many areas, commonly due to human activities that contribute to triggers or accelerate the processes involved in sinkhole development (i.e., dissolution and subsidence); and (2) the development of sinkhole-prone areas without preventive planning [1,2]. However, the scientific literature dealing with sinkhole monitoring is very limited, especially when compared with other land subsidence and ground instability phenomena, such as aquifer consolidation-caused groundwater withdrawal [3] or landslides [4]. Evidence suggests there is need to explore and develop approaches aimed at monitoring sinkhole-related subsidence, which tends to be very localised and may have variable behaviour, ranging from long-sustained gradual settlement to instantaneous catastrophic collapse. The latter may result in the loss of human life. For instance, a total of 39 fatalities have been reported in the Far West Rand of South Africa related to catastrophic sinkholes, mainly induced by dewatering for gold mining [5]. Subsidence monitoring at specific problematic sinkholes may be critical for properly managing associated risk. Accurate and timely data regarding the spatial and temporal subsidence patterns within those sinkholes may be used as the basis to (1) anticipate collapses and evacuate people at risk; (2) predict future damage scenarios; (3) design remedial measures; and (4) assess the performance of already applied engineering treatments. Subsidence monitoring in sinkhole-prone areas may also allow the implementation of early warning systems through detection, with sufficient anticipation of precursory slow subsidence preceding sudden collapse as well as other signs of instability, like fissures or scarplets, indicative of the development of an incipient sinkhole. This latter, challenging task has been one of the main objectives underlying a significant proportion of the sinkhole monitoring investigations carried out over the last decade, frequently using recently developed technology.
Subsurface methods, such as Time Domain Reflectometry (TDR), Brillouin Optical Time Domain Reflectometry (BOTDR), borehole extensometers, and nanoseismic monitoring provide data on deformation processes occurring at some depth beneath the surface and generally require expensive and intrusive installations (i.e., excavation of trenches, boreholes). Nanoseismic monitoring may allow approximate location of significant concealed collapses within relatively small investigation areas. Typically, geophones need to be installed in boreholes to reduce the noise, e.g., [6]. Borehole extensometers provide valuable data on the vertical distribution of subsidence at specific points but are scarcely used in sinkhole investigation [7]. The performance of TDR and BOTDR for sinkhole monitoring has been barely explored. These novel techniques may provide subsidence measurements along long lines (e.g., communication infrastructure, dikes) but may be adversely affected by temperature changes, vibrations, and processes non-related to sinkhole activity, e.g., [8,9].
Airborne and satellite-sensed data are increasingly used for detecting and measuring sinkhole-related subsidence, especially in salt–karst terrains characterized by high rates of sinkhole occurrence and subsidence. The performance of these methods are adversely affected by the presence of vegetation. Differential Interferometric Synthetic Aperture Radar (DInSAR) is a very powerful technique that allows the analysis of very large areas with sufficient spatial and temporal resolution to capture precursory subsidence related to small collapse sinkholes e.g., [10,11]. However, the spatial coverage of the displacement data can be significantly reduced by coherence loss (e.g., vegetated areas) [12]. Airborne laser scanners can be used to measure sinkhole-related subsidence with a high spatial resolution and in large areas by comparing point clouds captured o different dates, but with relatively low vertical accuracy [13]. Close-range photogrammetry was applied in a sinkhole site with very rapid subsidence in the Dead Sea, Jordan, to produce 3D digital models of the ground surface (accuracy 10–15 cm) and derive deformation models from them [14]. A similar photogrammetric investigation was conducted in an active salt-mine sinkhole in Northern Ireland using data acquired with an Unmanned Aerial Vehicle (UAV) [15].
Ground-based methods are the preferred techniques for monitoring subsidence in specific sinkholes and spatially restricted areas. Ground-based InSAR was satisfactorily applied in an urban area in Italy for the early detection of collapse sinkholes [16]. Tiltmeters are rarely used for sinkhole monitoring, since subsidence magnitude, rather than tilting, is the most useful parameter [17]. Differential Global Positioning Systems provide increasingly accurate measurements of vertical displacement at specific points [18]. High-precision leveling using digital levels and the electronic reading of bar-coded staffs is the most accurate method for measuring differential subsidence along specific lines [18,19]. Terrestrial laser scanners (TLS) have been extensively used to characterize ground instability processes, such as landslides, with high spatial resolution, e.g., [20]. However, this technique has never been applied in the monitoring of specific sinkholes. Ref [21] generated a 3D model of a sinkhole, >300 m across, in Daisetta, Texas with TLS data, but they did not provide information regarding surface changes from the comparison of point clouds. To the best of our knowledge, this paper explores and assesses, for the first time, the application of TLS to sinkhole monitoring. The technique is applied to three highly-active and damaging sinkholes related to dissolution of salt-bearing evaporites in the Ebro Valley, NE Spain. The Alcalá sinkhole affects a flood-control dike next to a village, creating a high-risk situation. The other two sinkholes, located at the same site, have caused continuous subsidence, resulting in damage to a major highway and a private business. High-precision levelling data is available from two of the investigated sinkholes [19], allowing direct comparison of displacement measurements.

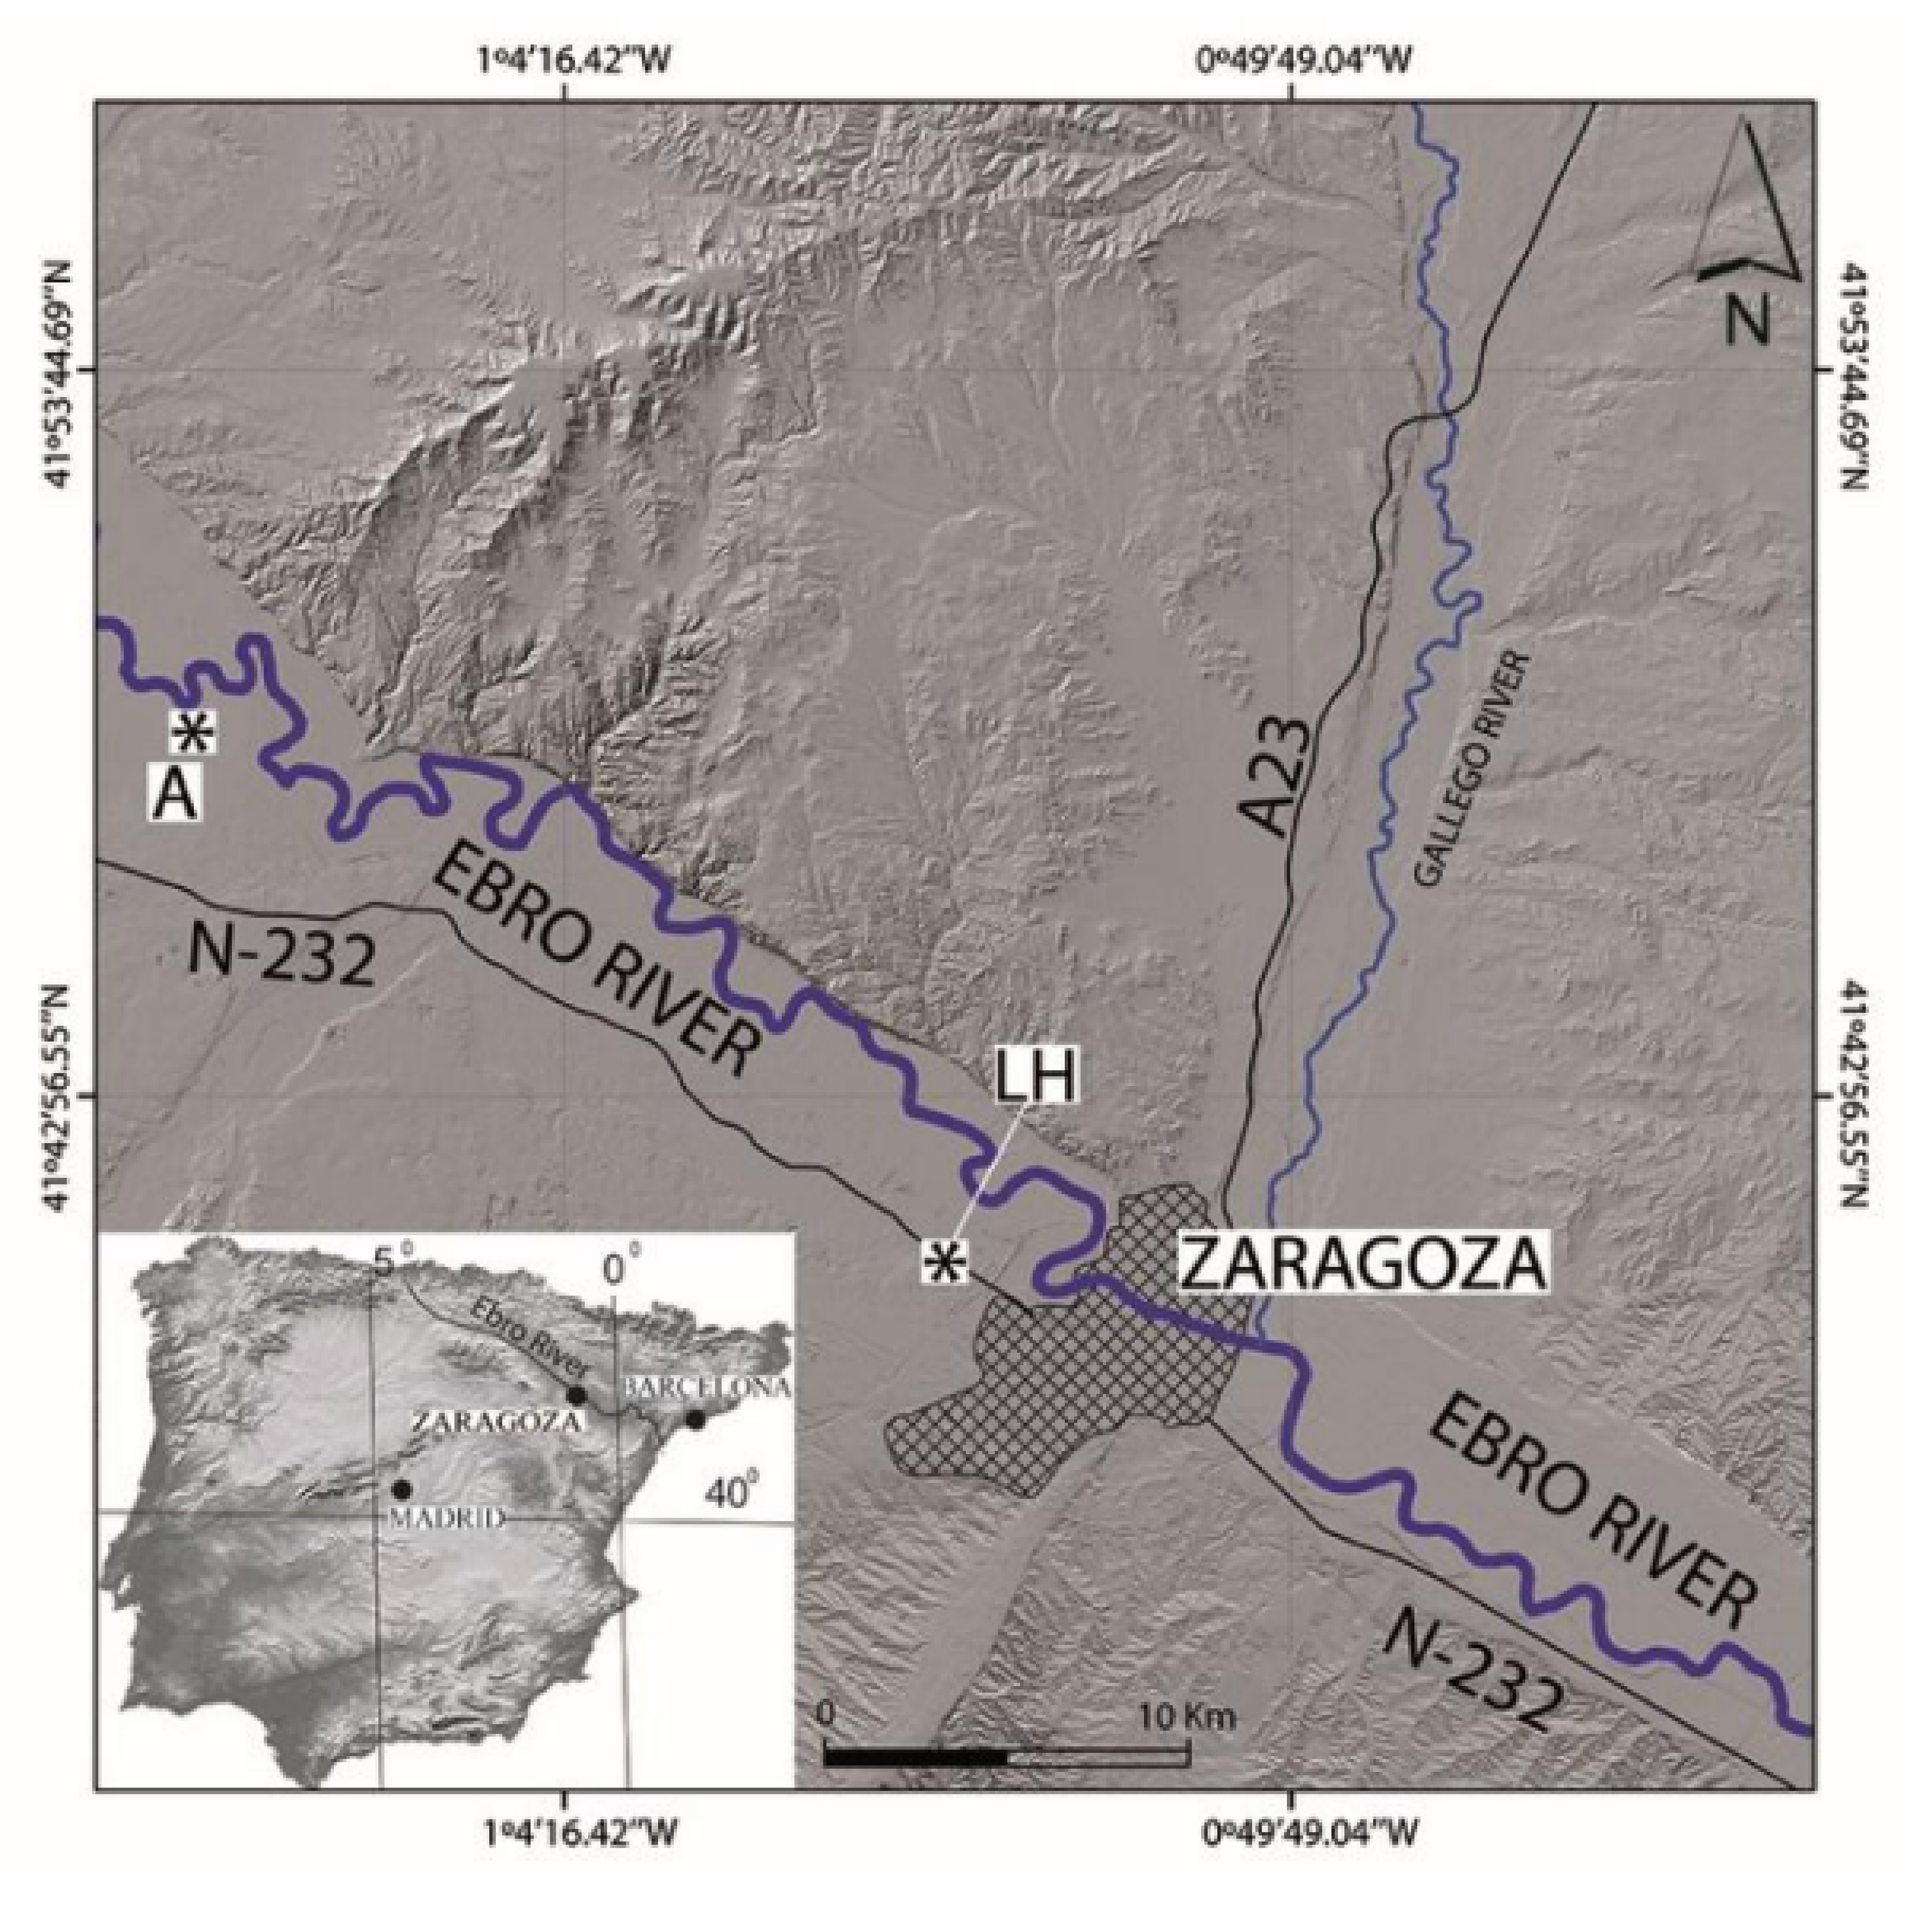
2. Geological and Geomorphological Setting

The investigated sinkholes are located in the middle reach of the Ebro River valley within the central sector of the Ebro Cenozoic basin, which is the Southern foreland basin of the Pyrenean Alpine orogen (Figure 1). The bedrock consists of sub-horizontally lying evaporites of late Oligocene-Miocene Zaragoza Formation, deposited in an extensive, high-salinity playa-lake system [22]. This formation, more than 850 m in thickness, consists of anhydrite, halite and glauberite in the sub-surface and secondary gypsum in the exposure [23,24]. Ref [25], based on deep borehole data, differentiated two members of the Zaragoza Formation whose boundary is situated at 350–400 m below the bottom of the Ebro Valley. The upper member, up to 600 m thick, consists of a basal unit, 140 m thick, dominated by marls and clays, and a thick evaporitic succession whose upper part crops out at the surface. Due to boreholes drilled along a 50 km long stretch of the Ebro Valley, this upper evaporitic sequence has been subdivided into four lithostratigraphic units, which are, in ascending order [23,24] (1) a marl and anhydrite basal unit; (2) a halite unit; (3) a glauberite–halite unit; and (4) an anhydrite unit. The Alcalá sinkhole (221 m a.s.l.) and the Logroño highway sinkholes (205 m a.s.l.), due to their elevation, could be directly underlain by the lower part of the anhydrite unit or the upper part of the glauberite–halite unit. In La Loteta Reservoir, located 10 km west of the Alcalá sinkhole, the top of the glauberite–halite unit has been identified at 188–196 m a.s.l. [23,26]. In Santa Inés, 9 km east of the Alcalá sinkhole and 17 km northwest of the Logroño highway sinkholes, the boundary between the anhydrite and glauberite–halite units lies at approximately 150 m a.s.l. [24]. These data indicate that the evaporitic bedrock at the sinkhole sites includes high-solubility salts close to the surface. This is a critical factor that controls dissolution and subsidence rates, e.g., [19]. For comparison, the equilibrium solubilities of gypsum (CaSO4·2H2O), glauberite (Na2[CaSO4]2), and halite (NaCl) in distilled water are 2.4 g/L, 118 g/L, and 360 g/L, respectively [27,28].
The Ebro Valley, in the reach where it is excavated into the Zaragoza Formation, shows marked asymmetrical geometry, with a prominent and linear gypsum escarpment on the NE margin, and a stepped sequence of mantled pediments and terraces on the opposite side [29] (Figure 1). The Ebro River terrace deposits are dominated by channel–gravel facies and locally reach anomalously high thicknesses (>50 m) related to the development of synsedimentary dissolution-induced basins, e.g., [30]. They also show abundant brittle and ductile gravitational deformation structures, including paleo-sinkholes, induced by the karstification of salt-bearing bedrock, e.g., [30,31,32]. The meandering Ebro River flows along a broad floodplain which has a belt of abandoned channels that record significant historical changes along the river path (i.e., migration, cut-off, avulsion) [33,34,35,36]. The Alcalá sinkhole is located 20 km NW of Zaragoza city, on the floodplain and next to the river channel. The Logroño highway sinkholes, in the outskirts of Zaragoza city, lie on the lowermost terrace of the Ebro River [37,38].

3. Investigated Sinkholes

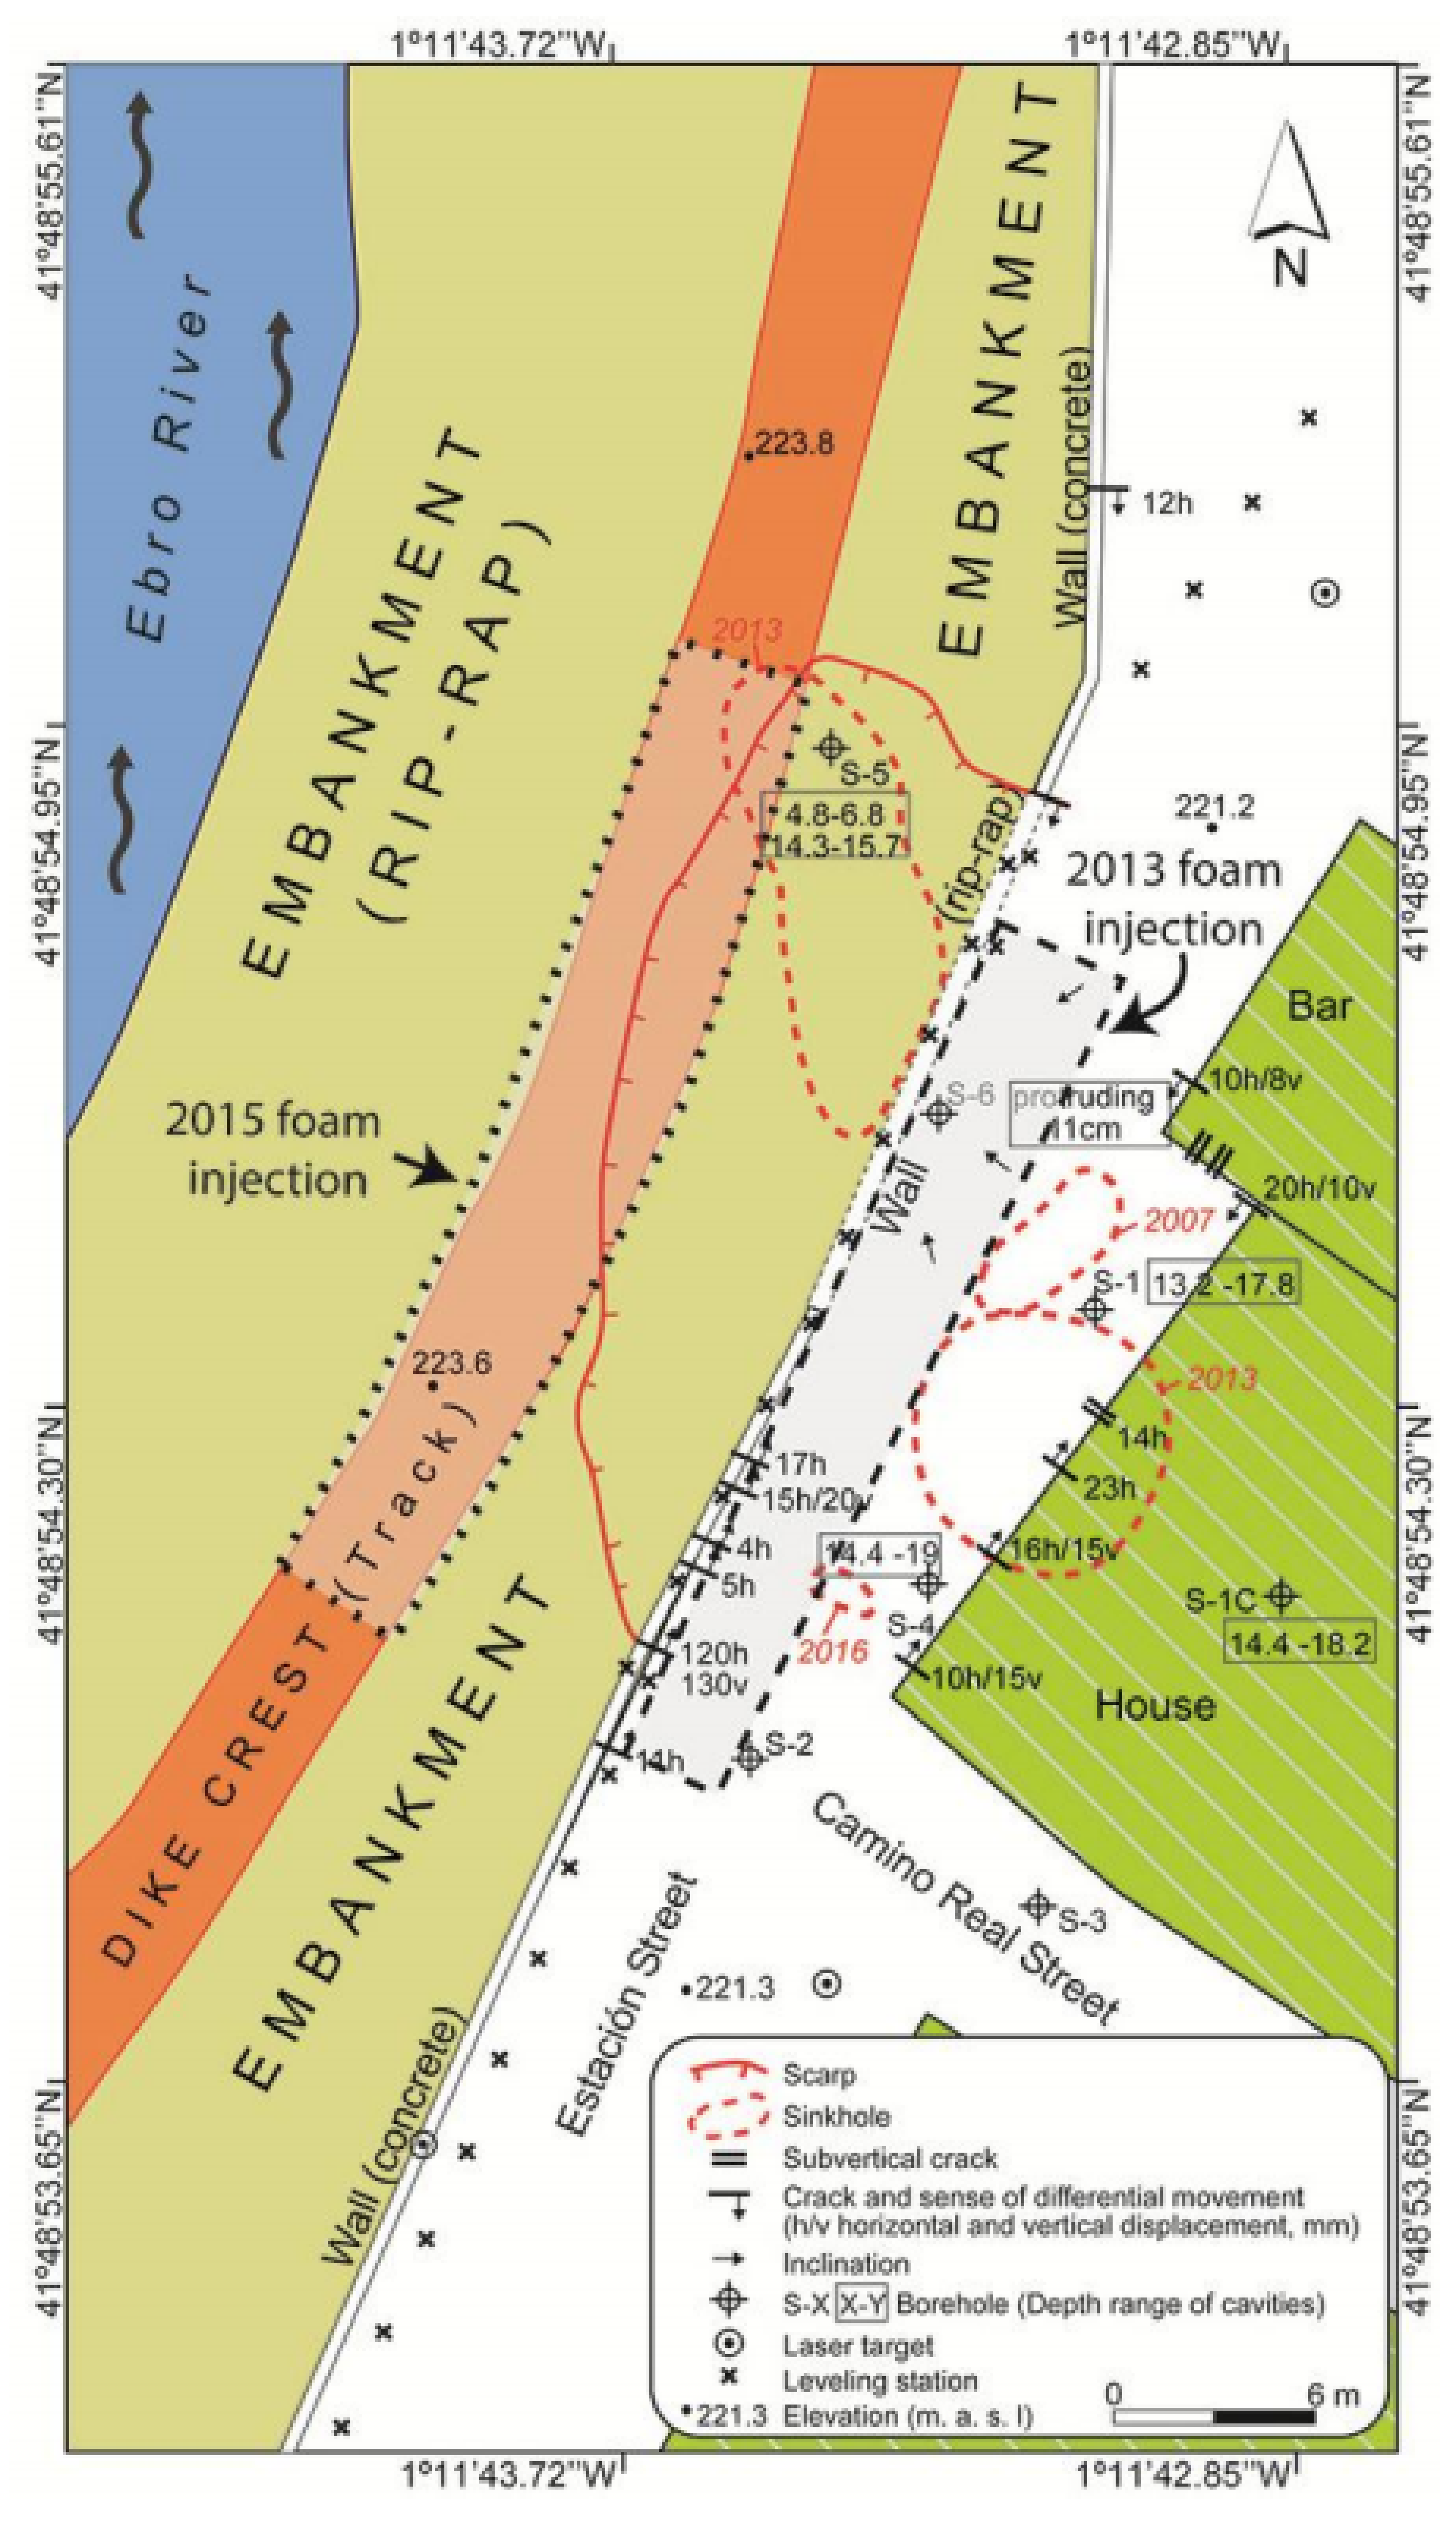
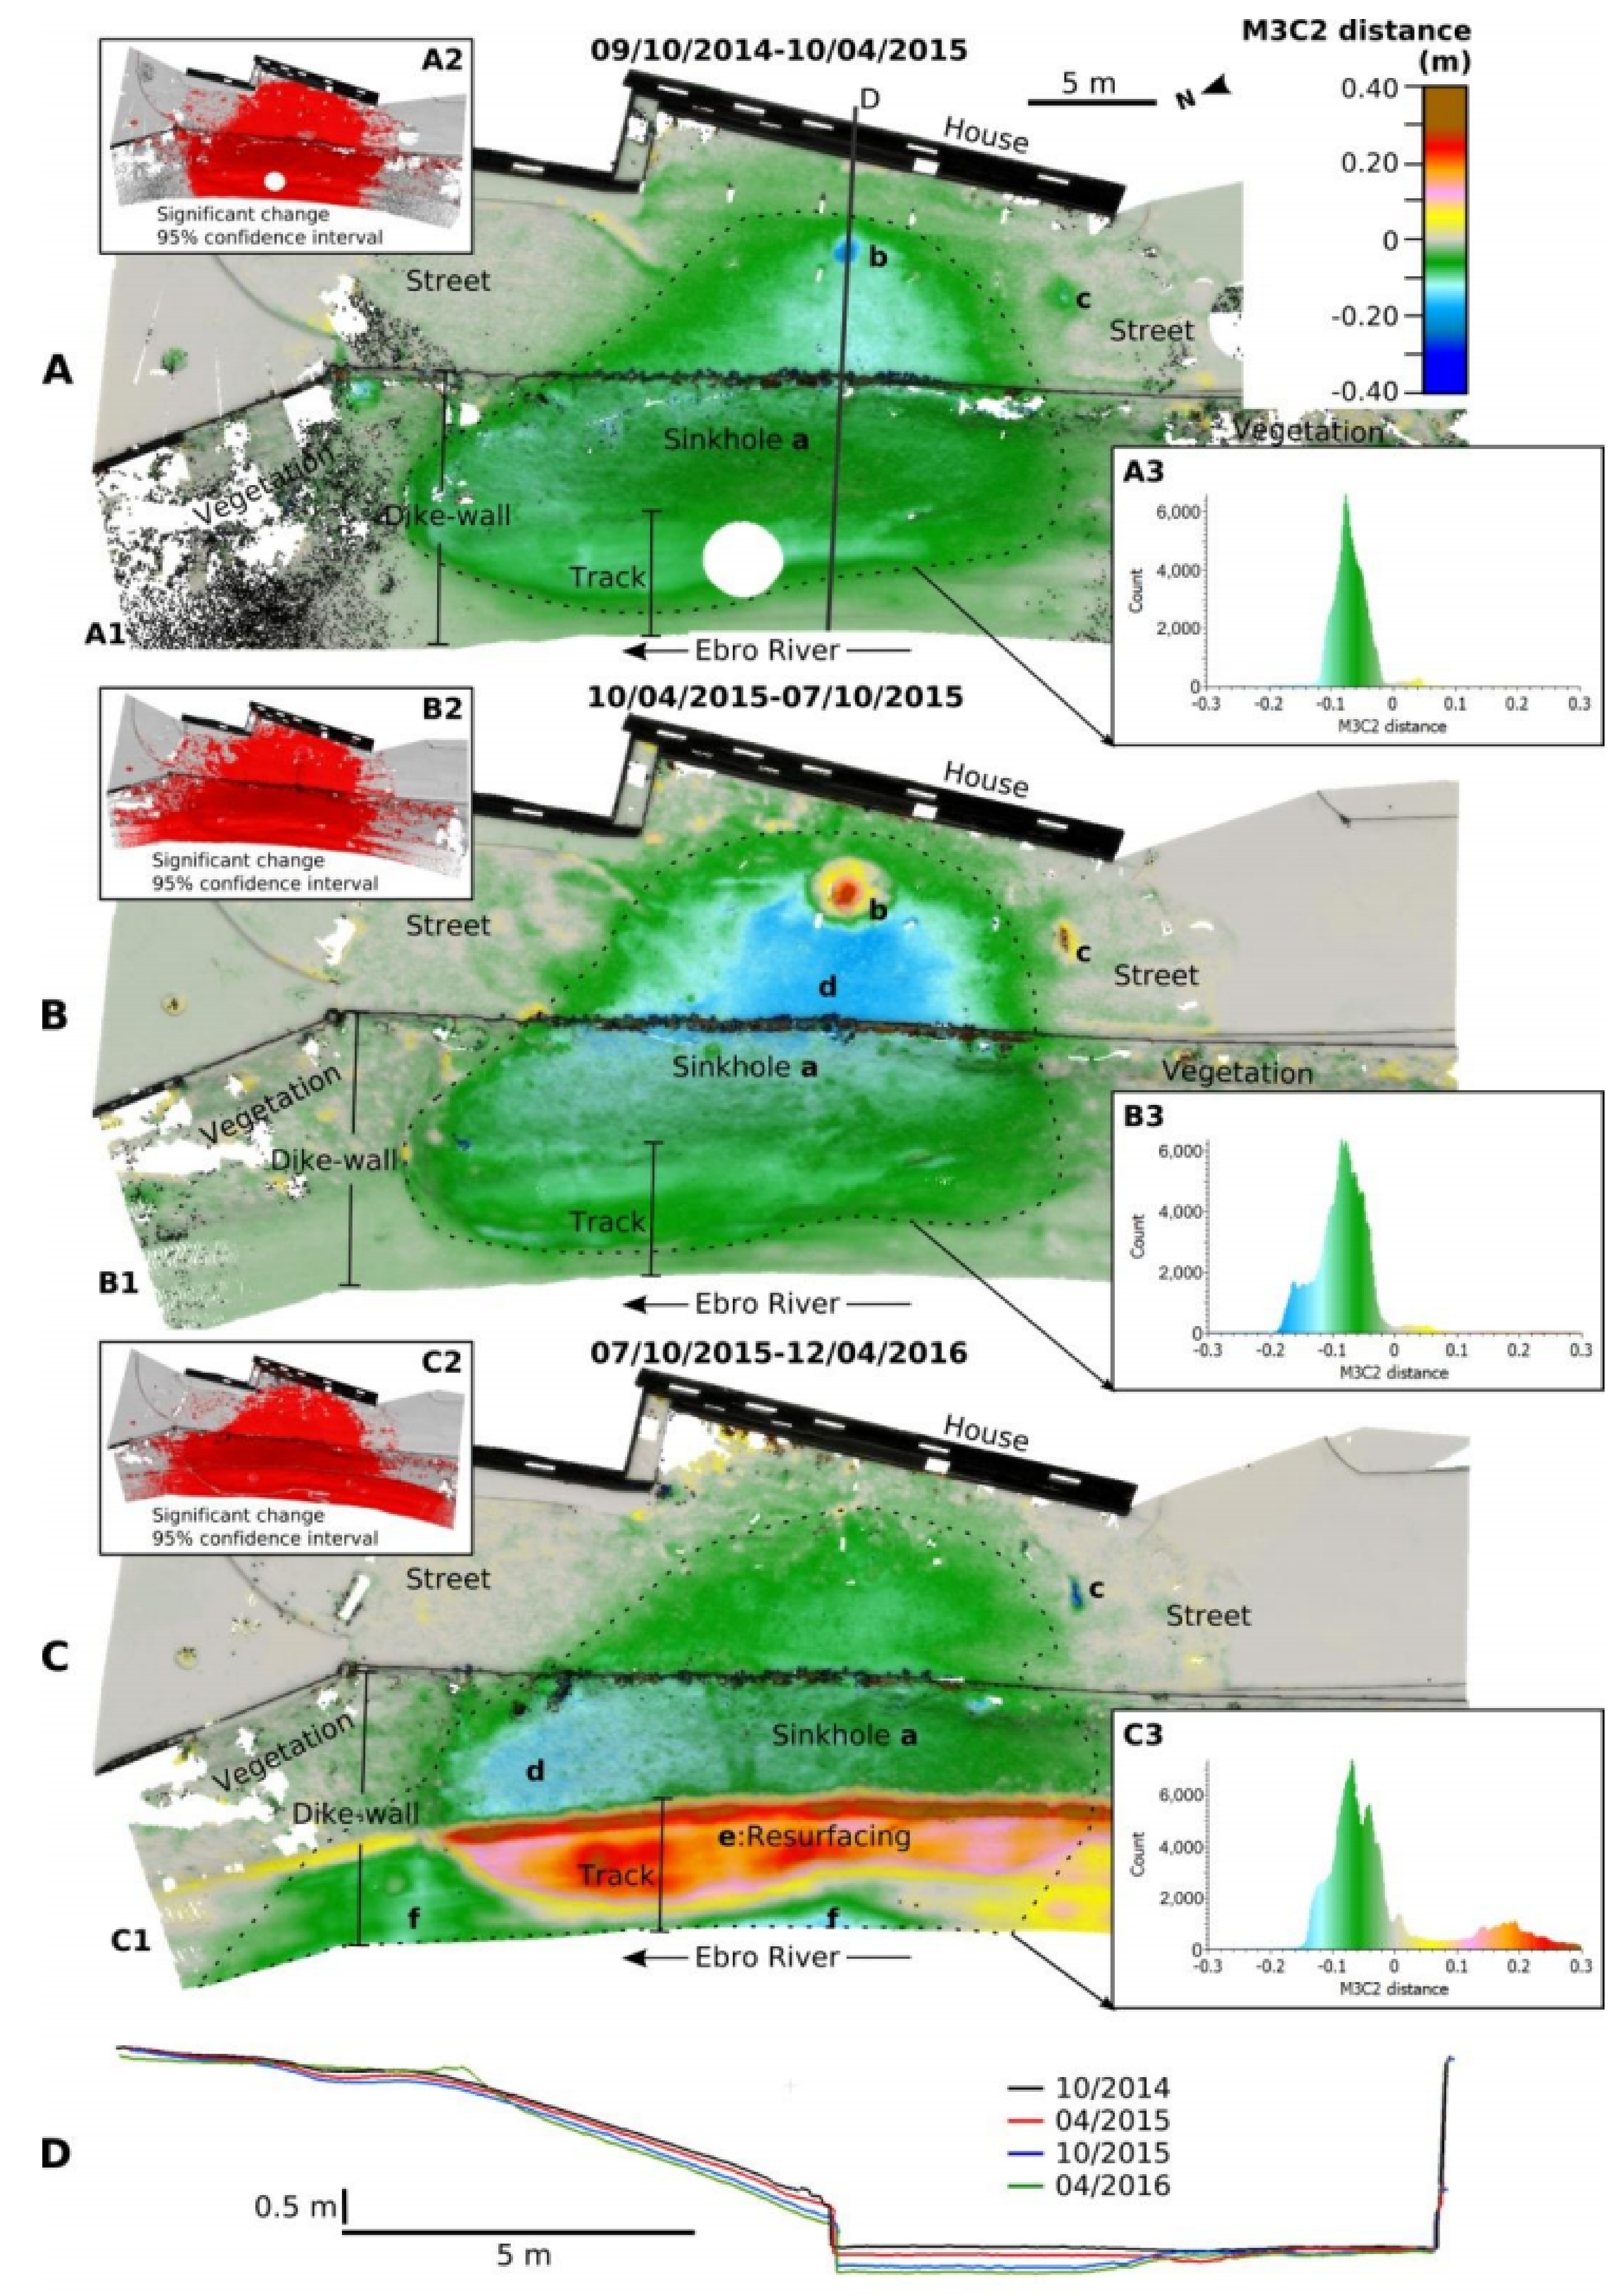
3.1. Alcalá Sinkhole

At the present time, the village of Alcalá is located just next to the outer side of a meander of the Ebro River (Figure 1, Figure 2 and Figure 3). However, a comparison of aerial photographs from different dates reveals that in 1927, the river channel used to be located at a distance of 540 m from the village and that it moved to its present position sometime before 1957 [36]. In order to prevent the lateral migration of the Ebro River towards the village, six transverse jetties, 30 m long, were built on the river bed during 1962–1964. The village was also protected by the construction of a dike in 1982. It was built with loose aggregate, covered by rip-rap, on the channel-facing side and with a wall of concrete and rip-rap on the flank facing the village. The embankment is 2.3–2.6 m high above the adjacent ground in the village, and its 4–5 m wide crest is used as a track (Figure 2).
Subsidence damage is common in this sinkhole-prone area. In fact, the renown Spanish novel, Don Quixote, written by Miguel de Cervantes between 1605 and 1615, describes an accident in the area of Alcalá in which a person is swallowed by a sinkhole. In the 1970s, a house in the village of Alcalá was severely damaged by a sinkhole. In the early 1980s, a sinkhole formed around 50 m south of the investigated subsidence area and in the same street. The distribution of subsidence damage and geophysical anomalies suggest higher karstification in the area associated with the river channel [19,39,40].
The investigated sinkhole is located on the Western edge of Alcalá village, affecting the flood-control dike, the adjacent street (Estación Street) and two buildings: a bar and a house (Figure 2 and Figure 3). In June 2007, a collapse sinkhole, 8 m across and 15 m deep, occurred in the street in front of the house. Since that event, the site has suffered from continuous subsidence as well as multiple collapse events (see their distribution in Figure 2) leading to a number of geotechnical investigations. A total of seven boreholes, 25–44 m deep, have been drilled in the site (Figure 2), indicating the following stratigraphy in descending order: (1) An unconsolidated cover around 6–7 m thick, comprising an anthropogenic deposit up to 4.6 m thick, underlain by fluvial deposits; (2) a karstic residue consisting of 20 m of dark grey clays and marls with residual gypsum particles that grade downwards into the unaltered evaporitic bedrock; and (3) the Tertiary evaporitic bedrock, including gypsum, halite and glauberite beds [39]. The vertical distribution of water- and alluvium-filled cavities encountered in the boreholes is indicated in Figure 2. Borehole data reveal the presence of significant cavities beneath the investigated sinkhole and the surrounding zone, mostly concentrated at depths between 13 and 19 m, probably controlled by a salt unit (i.e., halite and/or glauberite). The water table at this site, located next to the river channel and underlain by pervious alluvium and cavernous bedrock, is controlled by the water level of the river. Elevation changes in the water table between low-discharge periods and floods may reach more than 5 m, and the sinkhole may eventually be affected by groundwater flooding. The spatial–temporal variations in the distribution and rate of subsidence in the sinkhole area may have been affected by the occurrence of collapse sinkholes—partial remediation measures carried out before and during the monitoring period—as well as by floods in the adjacent Ebro River. The main actions and events are listed chronologically below, together with the scans. The distribution of collapse events and remediation measures is shown in Figure 2:
  • June 2007: An elongated collapse sinkhole, 8 m long and 15 m deep, formed in the street, in front of the house. Anthropogenic infill and reactivation occurred in July 2007.
  • November 2013: A collapse sinkhole, 9 m across and 4 m deep, occurred on the Eastern flank of the dike.
  • November–December 2013: Shallow compaction grouting less than 8 m deep with polyurethane foam occurred along a 92 m2 portion of the street at the foot of the dike and beneath the foundation of the house and the SW corner of the bar. Asphalt pavement was replaced by loose aggregate.
  • December 2013: A new collapse sinkhole formed at the front of the house (labelled as b in Figure 3B).
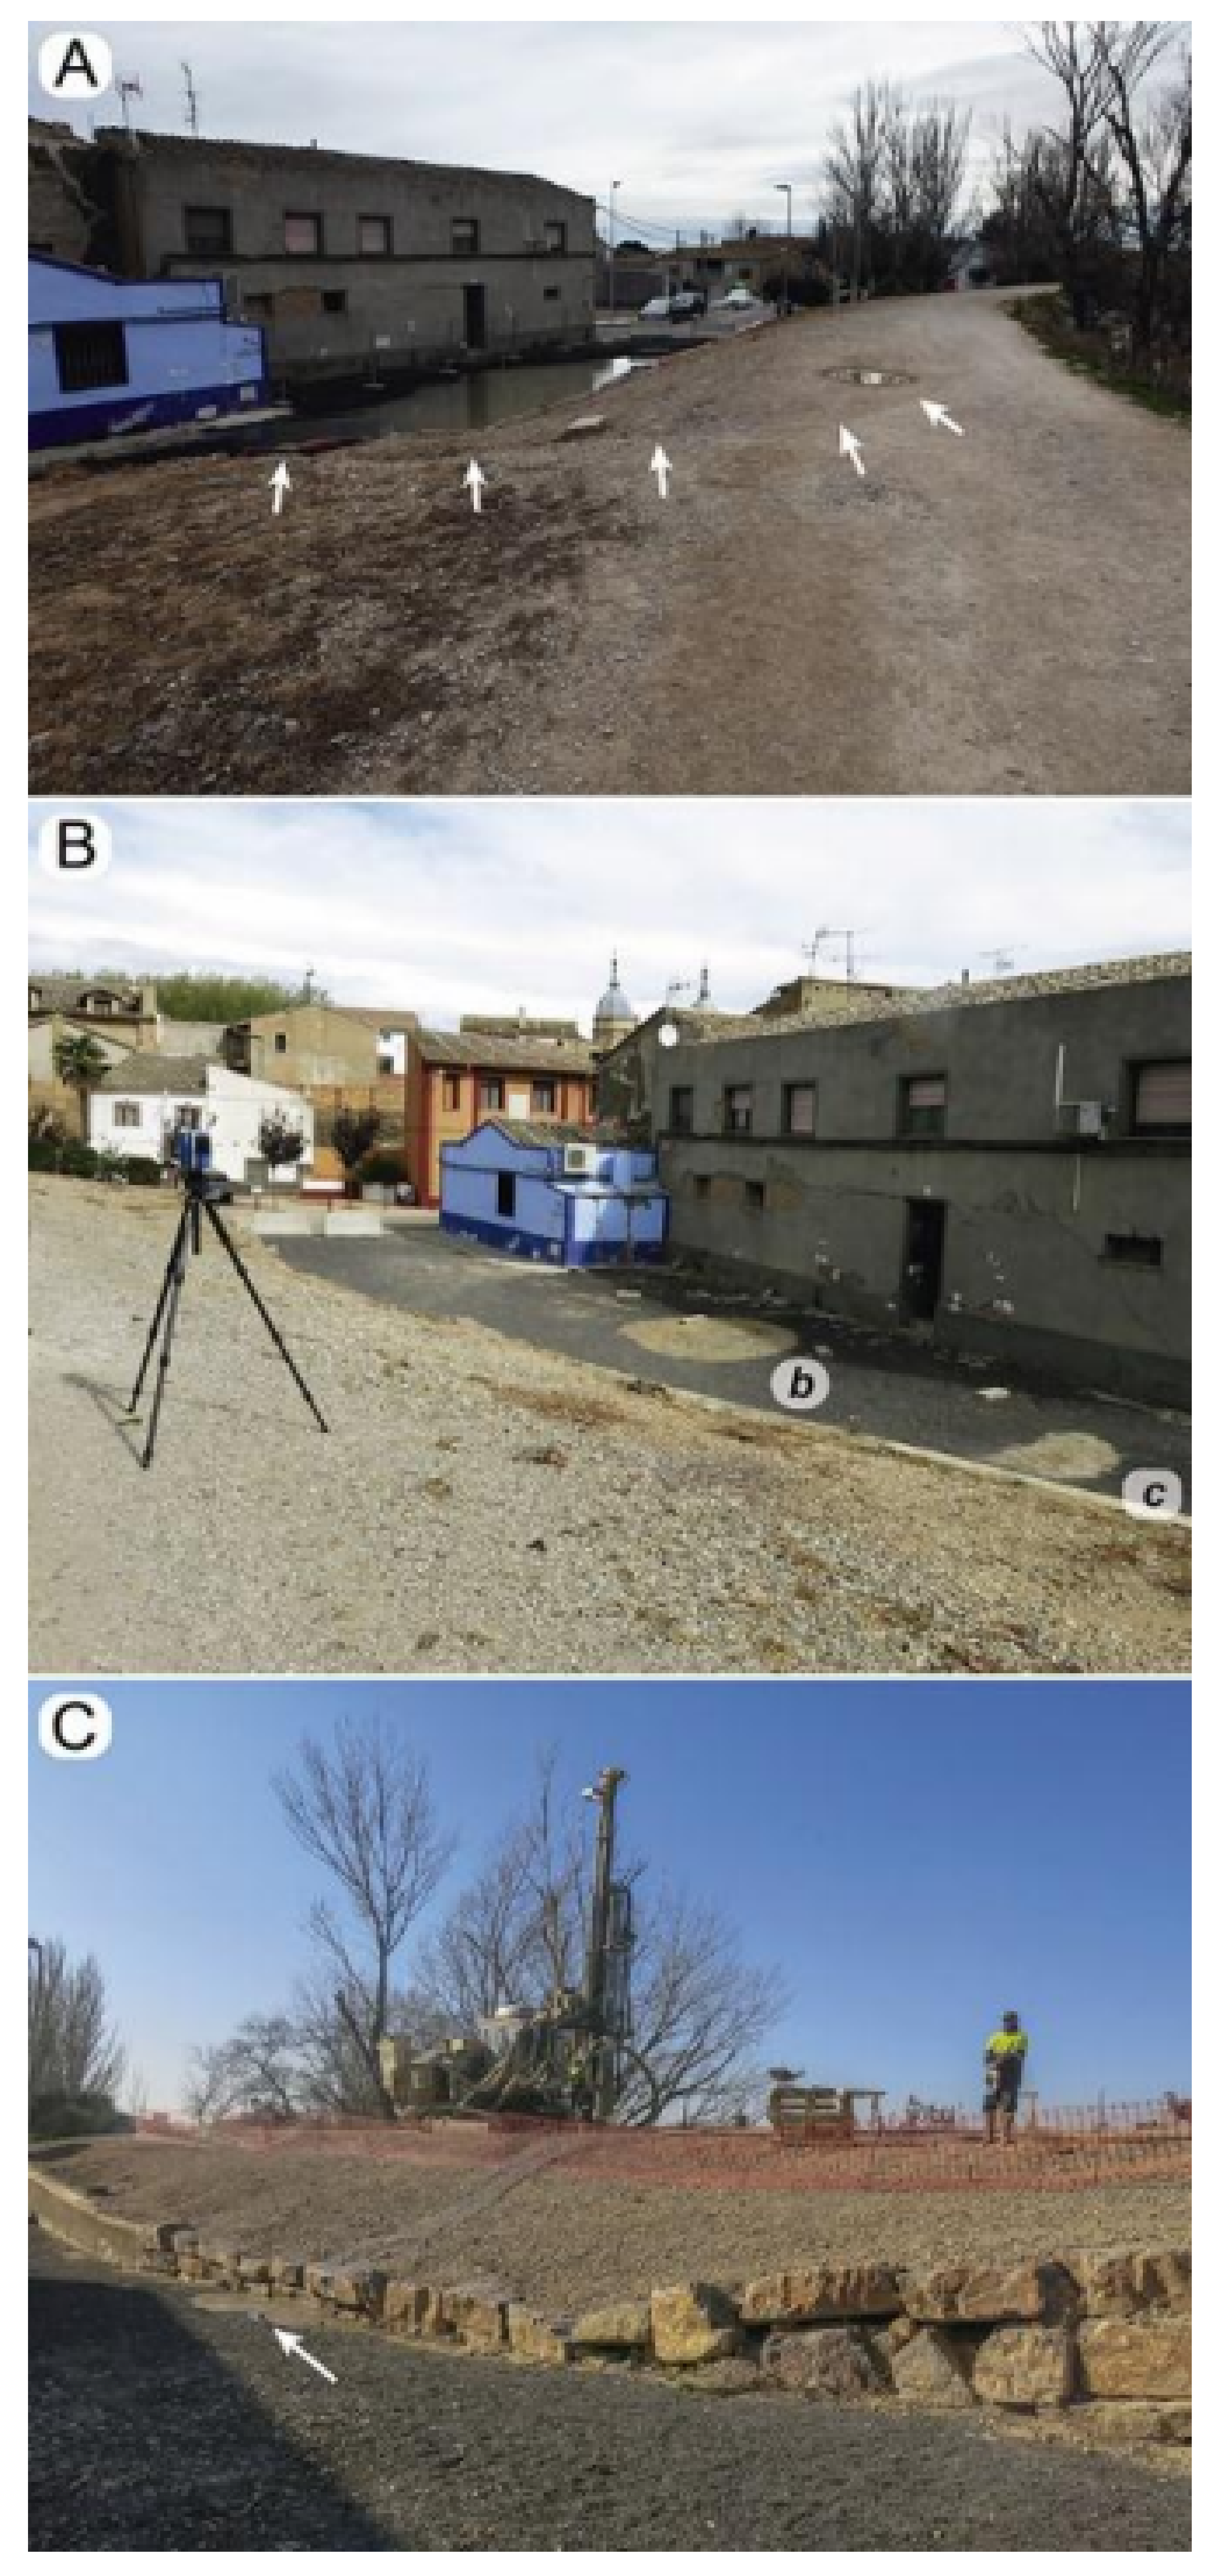
  • February–April 2015: The Ebro River flooded with a return period of less than 10 years. The water stage of the river was well above the street level. The river water flowed under pressure beneath and through the dike causing internal erosion and flooding of the sinkhole (Figure 3A). Scans were carried out in October 2014 and in April and October 2015.
  • November–December 2015: A new grouting program with polyurethane foam took place along a 30 m long section of the dike through drillholes 5–15 m deep (Figure 3C).
  • February–April 2016: An ordinary flood in the Ebro River occurred, but the maximum water level was above the elevation of the street. The last scan was conducted in April 2016.
The deformation features that developed on the ground surface and in human-built structures were mapped on March 2016, mainly to gain insight into the extent of the subsidence area (Figure 2). This map of surface deformation and structural damage indicates an elongated subsidence depression around 40 m long with an apparent N–S orientation. The area is affected by continuous sagging and embraces the multiple nested collapse sinkholes that have occurred since 2007. On the Western side, there was a conspicuous arcuate fissure-scarp, 10–20 cm high, affecting the crest and Eastern shoulder of the dike (Figure 3A). This surface rupture connected with the largest cracks that developed on the wall of the dike, showing horizontal and vertical separations higher than 10 cm. The wall also showed cracks related to its tilt towards the sinkhole center, 9.2 m and 3.2 m north and south of the main fissures, respectively. This suggests that the subsidence area along the dike comprises an inner sector, 28 m long, affected by more rapid subsidence, and an outer aureole with slow inward tilting. Surface evidence of deformation does not allow for identification of the edge of the subsidence area along its Eastern side due to the lack of adequate markers and the impossibility of accessing the house. The topographically lowest portion of the subsidence zone is located at the foot of the rip-rap wall around borehole S-6. The casing of the borehole protrudes 11 cm above the ground surface, providing a rough measure of the amount of subsidence between 7 July 2015 (borehole installation) and 11 March 2016 (measurement) (Figure 2 and Figure 3C).

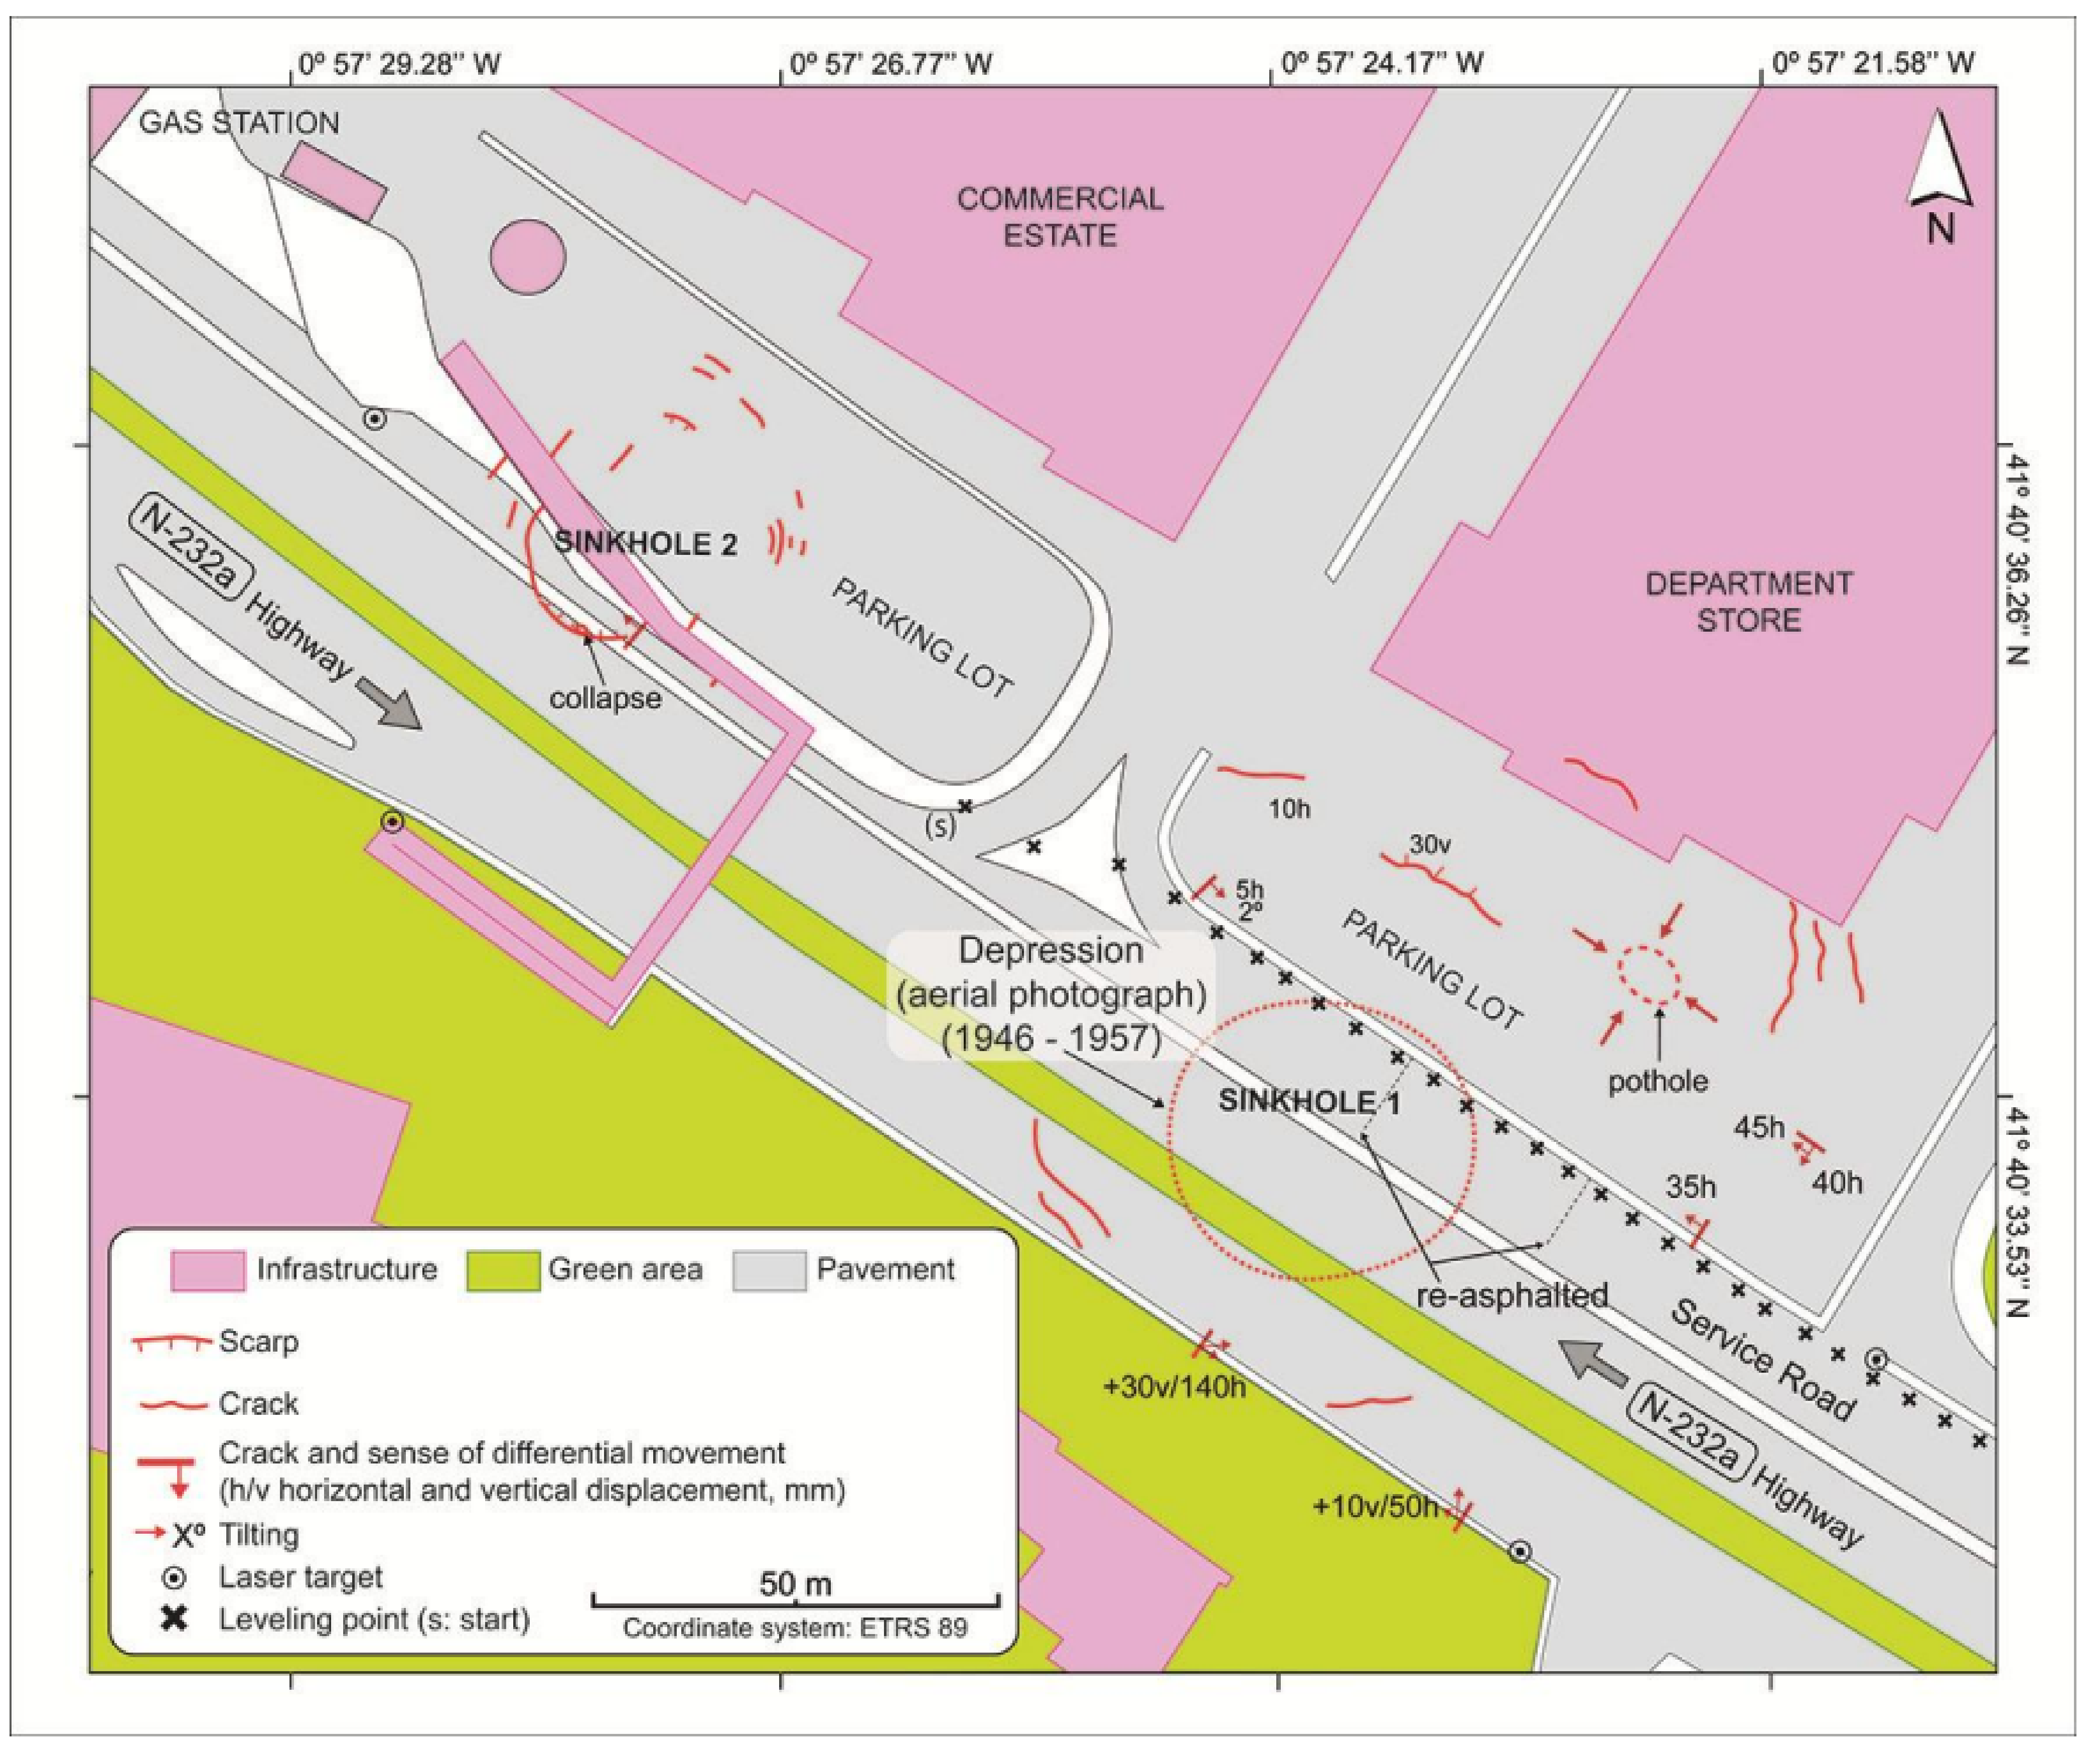
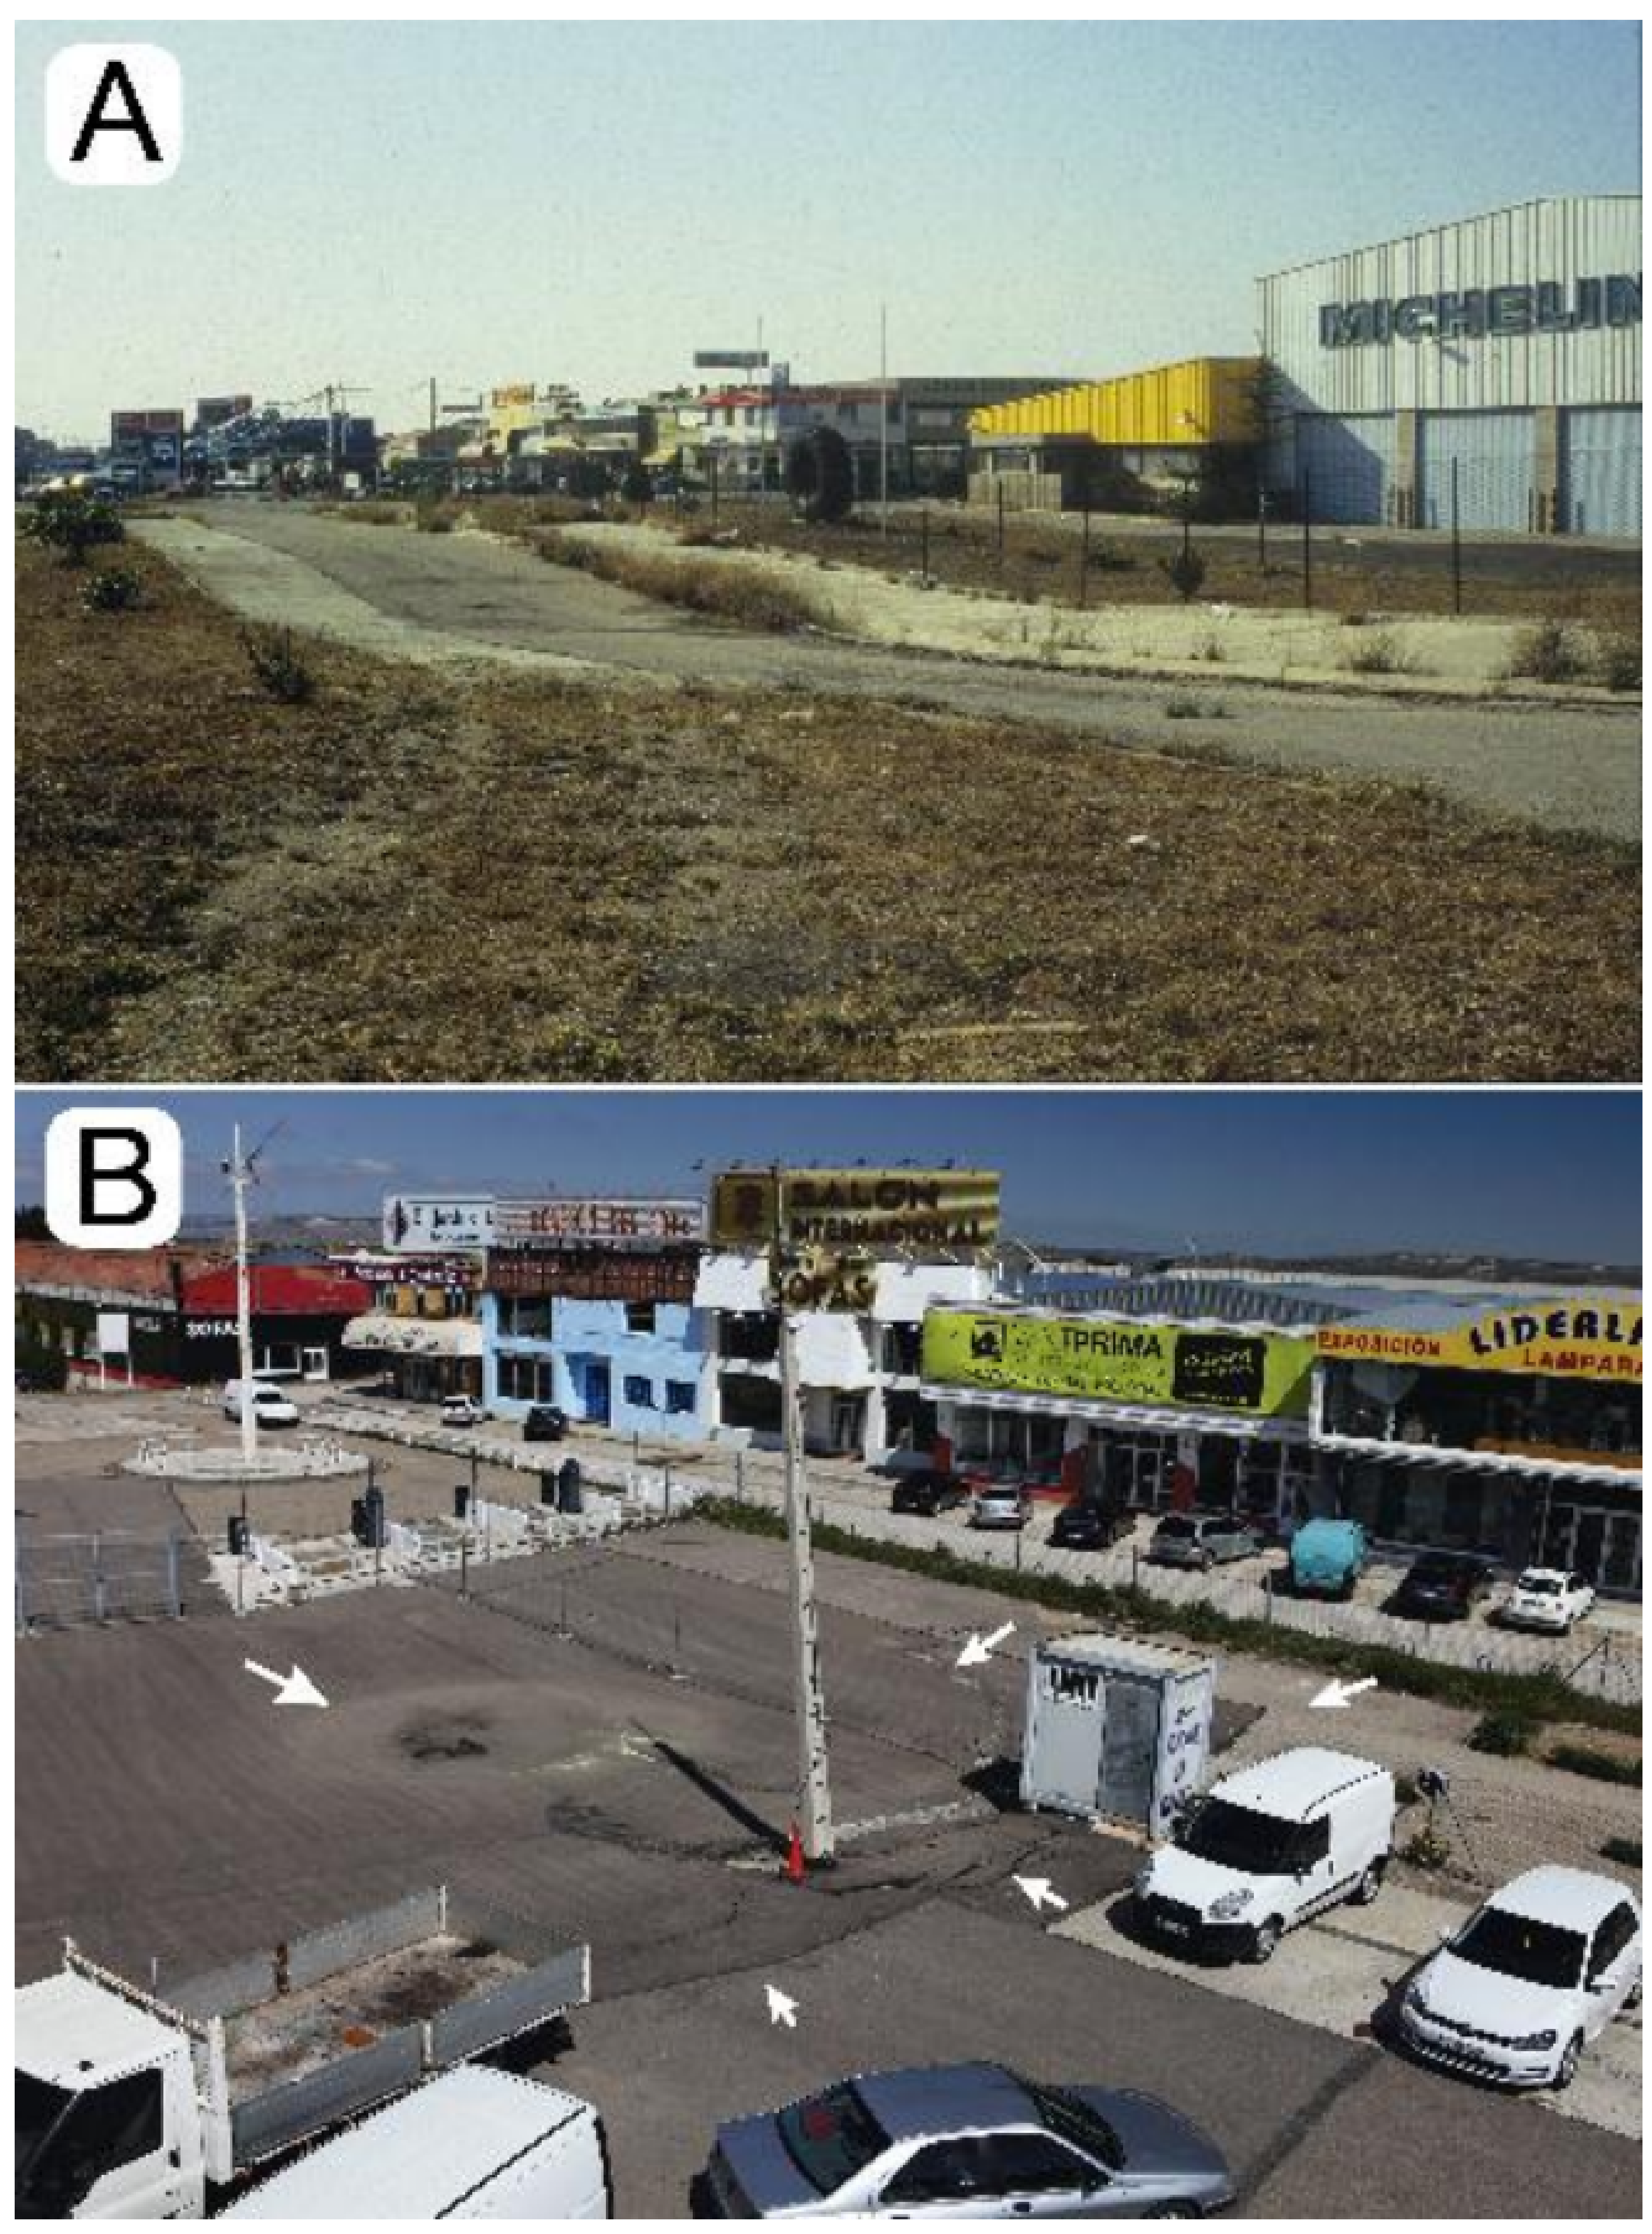
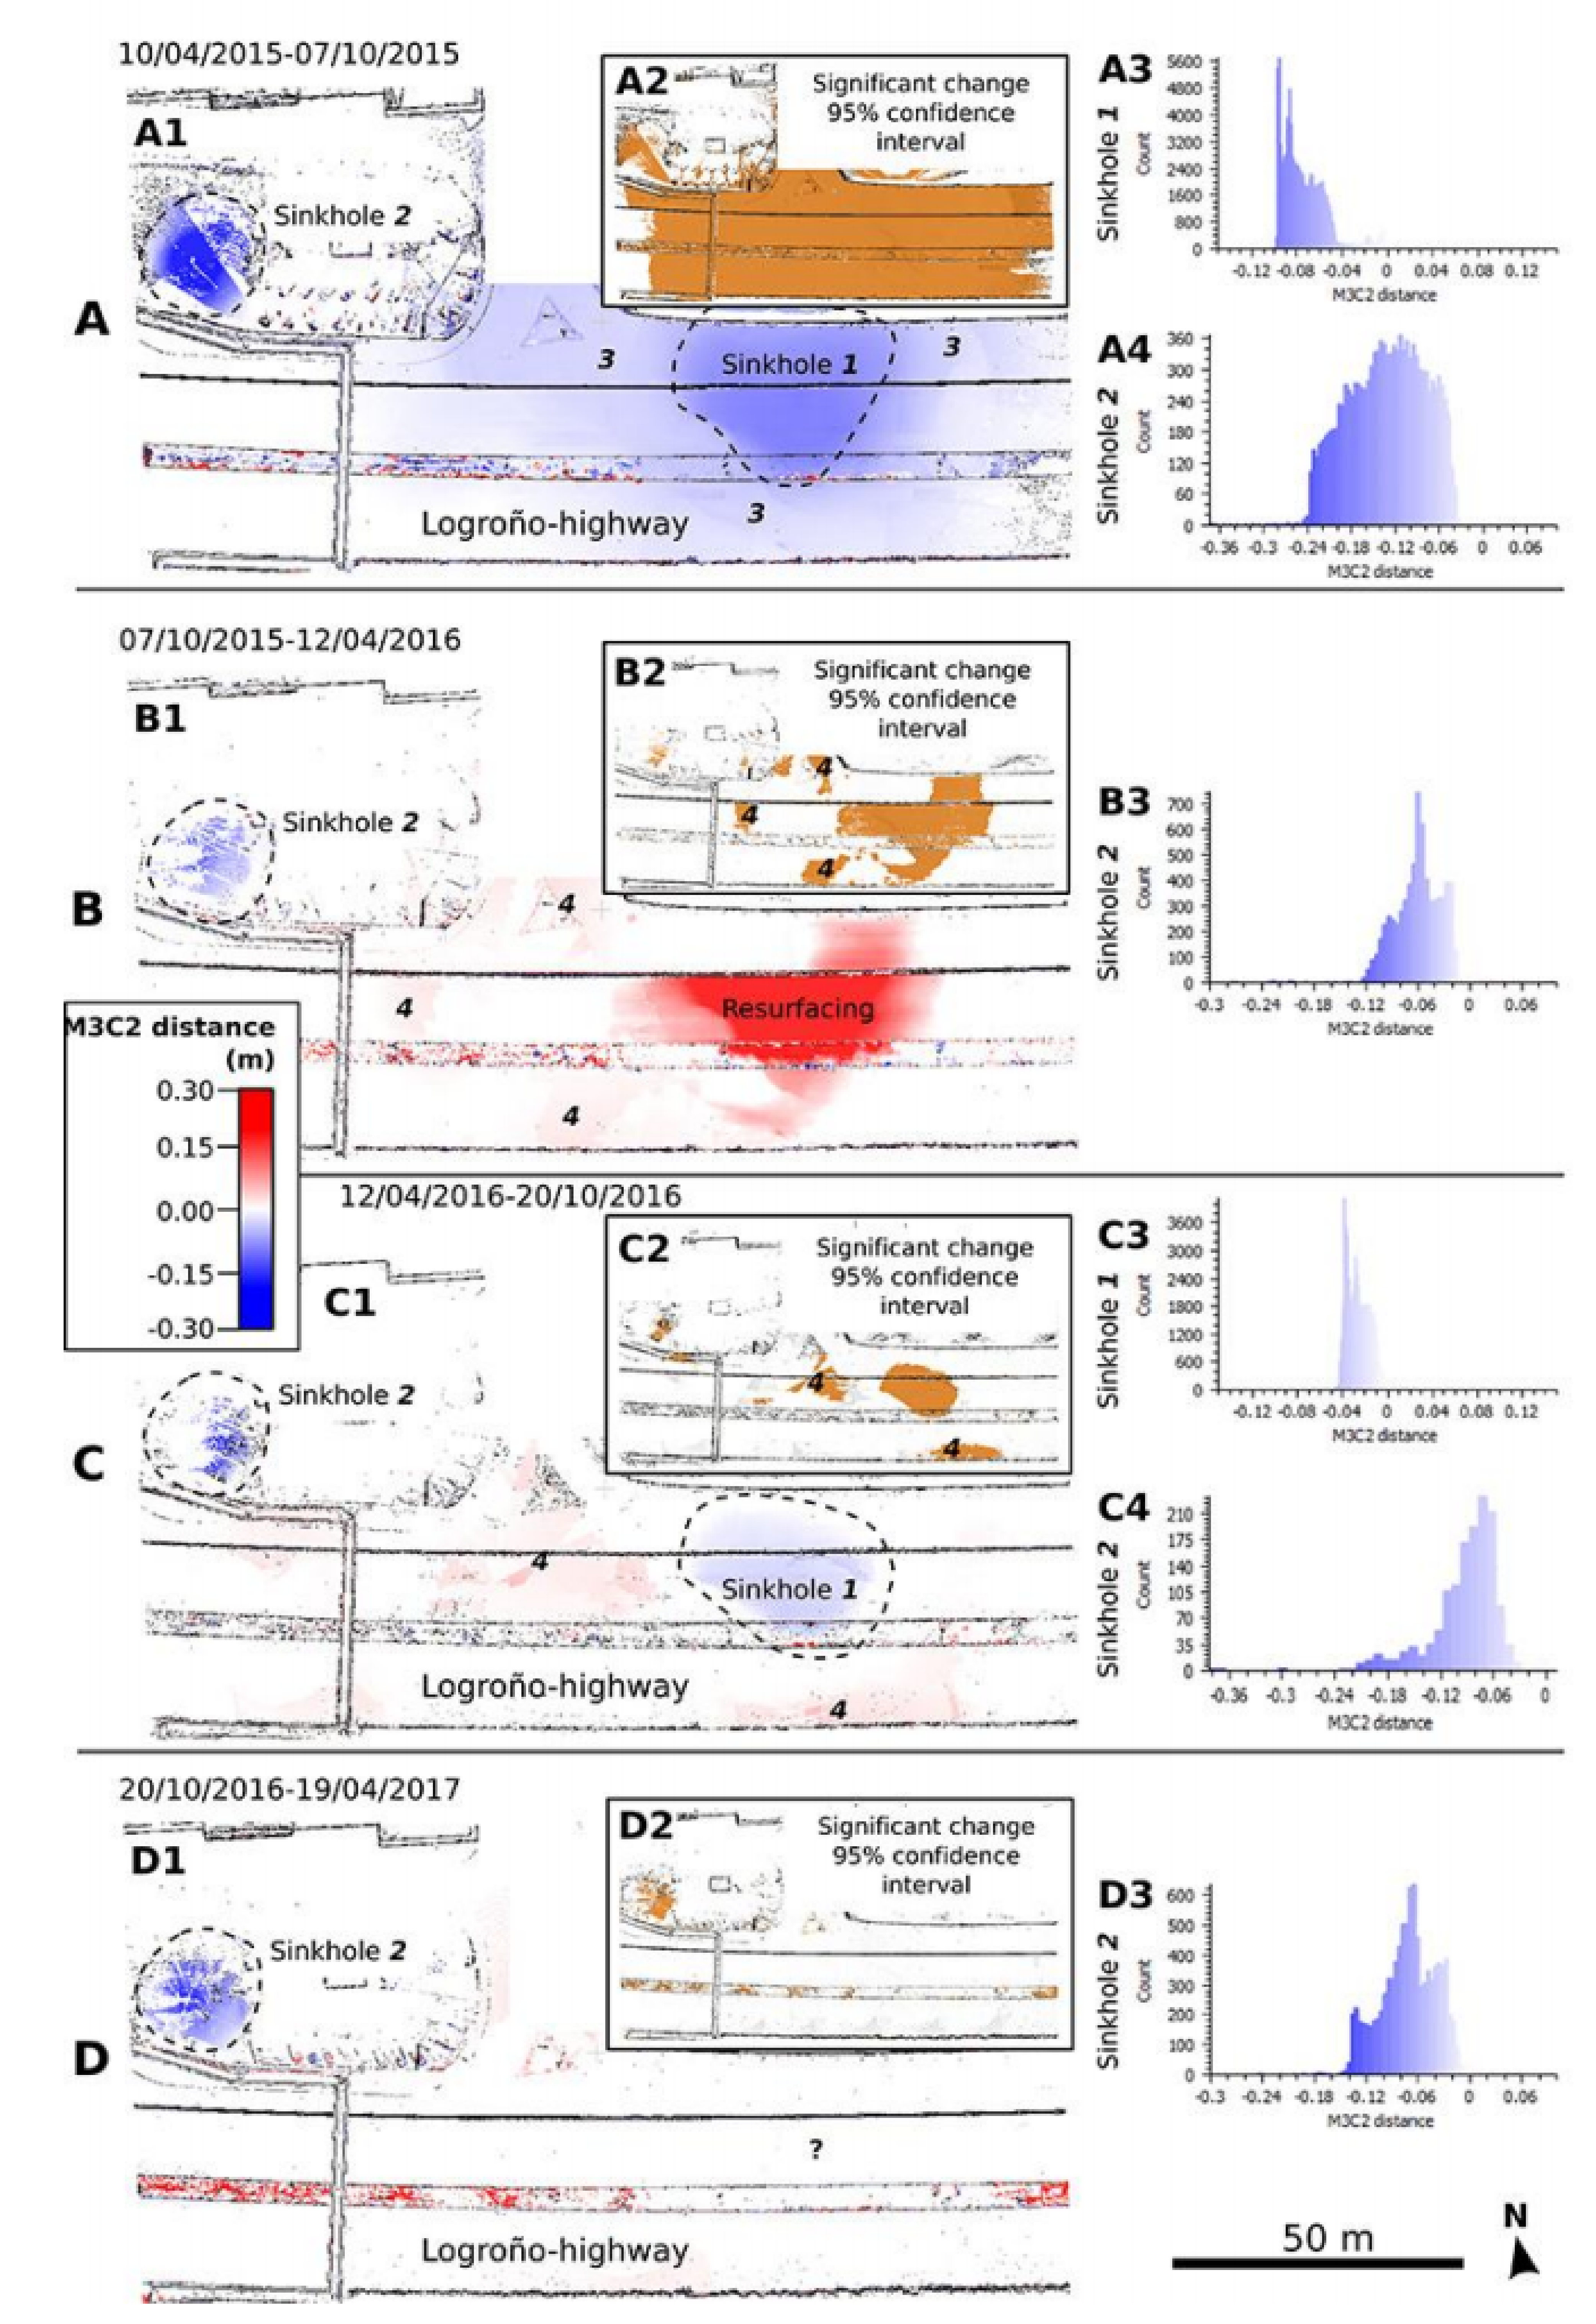
3.2. Logroño Highway Sinkholes

This site, located in the lowermost terrace of the Ebro River, includes two damaging sinkholes, here referred to as sinkholes 1 and 2 (Figure 4). Sinkhole 1 is a sub-circular buried sinkhole, around 110 m in diameter, that affects (1) both carriageways of the Logroño highway (N-232a); (2) the service road and a department store to the NE; and (3) a concrete wall on the SW flank of the highway [37,38]. The central and deeper part of the sinkhole can be recognised in grey-scale aerial photographs from 1945–1946 and 1957 as a sub-circular depression approximately 40 m across. Historical imagery reveal that this depression was filled sometime between 1957 and 1969. In the 1970s, a factory was built on the NE sector of the sinkhole, which was demolished in the late 1990s. At that time, the service road used to show a conspicuous sag related to rapid subsidence and poor maintenance (Figure 5A). The currently existing department store was built in 2001 (Figure 4). Nowadays, the Logroño highway and its service road are subject to re-asphalting works every one or two years. A map of this sinkhole depicting the distribution of surface deformation features was produced in April 2016 (Figure 4). This map is rather limited due to frequent repair works but provides information on the minimum extent of the active subsidence area. Subsidence on the SW sector of the sinkhole was expressed as fresh arcuate cracks in the recent pavement of the highway, plus sagging and inward toppling in the concrete wall located along the edge of the highway. On the NE sector, a number of cracks with an overall arcuate geometry affect concrete walls, paved surfaces and the floor of the department store.
Sinkhole 2 is located on the NE side of the Logroño highway, beneath and next to the ramp of a pedestrian bridge built across the highway (Figure 4 and Figure 5B). Historical imagery from Google Earth indicate that this sinkhole has been active since 2001 and has been repaired at least three times between that date and 2011. In September 2011, the sinkhole experienced a significant reactivation, damaging the service road up to the NE edge of the highway, a large diameter water-supply pipe and a portion of the parking of a car shop. The overall distribution of the fissures, scarps and small collapses mapped on November 2011 are depicted in Figure 4. These show a sub-circular depression with an approximate diameter of 40 m, with an inner sector around 27 m across, defined by more conspicuous ruptures which is affected by more rapid subsidence. After that event, the service pipe was rebuilt above the ground in order to detect any potential damage or leakage. The portion of the car shop affected by active subsidence was re-asphalted and fenced, showing rapidly evolving sagging subsidence and concentric fissures and scarps (Figure 5B). Several geotechnical boreholes drilled within or next to this sinkhole indicate the following stratigraphic succession, in descending order: (1) anthropogenic fill 3.5–4 m thick; (2) fluvial gravels 12–15.1 m thick; (3) karstic residue 19.7–35.4 m thick, consisting of grey marls with residual gypsum; and (4) fresh evaporitic bedrock at ≥25 m depth. The water table depth at this site typically varies between 5 and 9 m, with the highest levels recorded by the end of the summer season, since the recharge of the alluvial aquifer is mainly related to irrigation.

4. Materials and Methods

A map of the sinkhole sites was produced in the field using 1:1000 scale, gridded orthoimages and metric tape. These maps, described above, show surface evidence of deformation on the ground and on human-built structures and indicate, where possible, the amount and sense of deformation. Moreover, in order to gain information on the previous geomorphic expression and evolution of the buried Logroño highway sinkholes, the following data were uploaded in a Geographical Information System (GIS): (1) orthorectified aerial photographs from different dates; (2) detailed topographic maps of the Zaragoza municipality, produced in 1963–1969, with contour intervals of 1 m; and (3) recent orthoimages. Particularly useful were the aerial photographs from 1957 (1:30,000 in approximate scale) taken before the infill of sinkhole 1 at the Logroño highway site.
The 4D monitoring and analysis of the subsidence associated with the active sinkholes has been carried out through the following work phases:
  • Point clouds in each sinkhole were acquired with a Faro Focus X330 terrestrial laser scanner (TLS), with a range of 0.6–330 m, a ranging error of ±2 mm, and horizontal and vertical angular steps of 0.009°. Several 3D scans were performed at each site, with an approximate periodicity of 6 months. Data collected on the Alcalá and Logroño-highway sinkholes cover a time span of 551 days (9 October 2014–12 April 2016; 4 scans) and 740 days (10 April 2015–19 April 2017; 5 scans), respectively. The 3D scans were registered by applying the cloud-to-cloud method (Scene software). The Logroño highway site was scanned at night time to reduce the adverse effects of traffic. The resulting point clouds for each sinkhole and date had a spatial resolution of ≥1 cm.
  • Common referencing of the point clouds was done using the installed reference stations. Four fixed black and white (B/W) targets were placed out of the subsidence areas, distributed on opposite sides and at different elevations. The local coordinates of the targets used to reference successive models were extracted from the first 3D scanning.
  • Undesired points that could complicate the identification of the deformation zones (e.g., moving objects, vegetation) were manually removed.
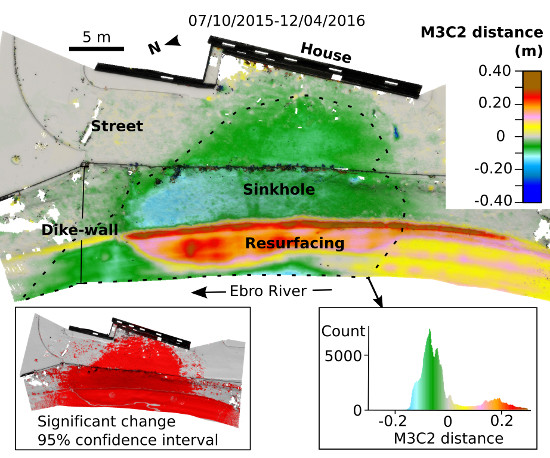
  • A comparison between the referenced point clouds acquired at different dates was carried out in order to identify surface changes and quantify them. These surface changes included ground subsidence and human alterations, such as re-pavement or accumulation of fill material. Surface changes were assessed by measuring the distances between successive 3D point clouds. Initially, simple cloud-to-cloud comparison (C2C) and cloud-to-cloud comparison with local modelling (C2Clm) were used to obtain the first picture of the surface alterations [41]. Subsequently, signed and robust distances between successive point clouds were computed using the M3C2 algorithm, developed by [42]. The M3C2 algorithm provides accurate measurements on several scales [43] with a simpler workflow than that of the comparison of 3D data generating surface meshes or Digital Elevation Models (DEM) [42]. This algorithm firstly estimates the normal value of the 3D point-cloud surface at a scale consistent with the local surface roughness. Secondly, it measures the mean surface change along the normal direction with explicit calculation of a local confidence interval (95%), determined by surface roughness, position uncertainty and registration error. The M32C algorithm was applied in standard mode, using diameter values for the normal calculation and the projection of points of 10 cm in the Alcalá sinkhole and 20 cm in the Logroño highway sinkholes.

5. Results

5.1. Alcalá Sinkhole

In the Alcalá sinkhole, four 3D surveys were conducted on October 2014, April 2015, October 2015 and April 2016, covering a time span of 551 days (Table 1). In each survey, we carried out 15–21 scans of medium resolution (7–12 mm at a 10 m scanning distance) to cover an area of 1304 m2. The resulting 3D point clouds displayed errors of 2–3 mm from the registration process and 1–2 mm from the referencing process using the B/W targets. The comparison of 3D point clouds allowed the accurate measurement of the deformation with a high spatial resolution (ca. 1 cm) in the portion of the sinkhole affected by greater subsidence.
The time lapse covered by the first comparison (October 2014 and April 2015) included the February–April 2015 Ebro River flood, during which water flowed through the dike, and the sinkhole was flooded by the water-table rise. The displacement model reveals an elongated subsidence area with a major axis of 26 m located on the Western sector along the dike, and a minor axis of 18 m on the Southern zone (sinkhole a in Figure 6A1). This subsidence area, which affects the dike and the street, and is embraced within the distribution of surface changes with a 95% confidence interval (Figure 6A2), can be considered the minimum extent of the zone affected by ground settlement. Surface displacement within this subsidence area shows a unimodal distribution with a main peak at −7.5 cm (−14.9 cm/year), and a maximum value of −25 cm (−49.8 cm/year) (Figure 6A3). The maximum subsidence was measured in a nested collapse sinkhole located in the street in front of the house (b in Figure 6A1). Changes were also detected outside the main subsidence area. To the south, there is a meter-sized collapse sinkhole with a maximum displacement of −18 cm (c in Figure 6A1). Around the main subsidence area, the model captured displacements of up to −1 cm at points, with a scattered pattern. The changes could be attributed to subsidence, but also to other changes unrelated to sinkhole activity, such as the movement of loose gravel in the street or the vegetation located on the dike. Nonetheless, the overall distribution of these displacements, forming an aureole around the most active subsidence area, strongly suggests that they form part of the active sinkhole.
During the period from April 2015–October 2015, following the February–April flood and the associated water-table drop, the main subsidence area (sinkhole a) kept a similar shape (Figure 6B1). However, there was a clear acceleration of subsidence between sinkhole b and the outer wall of the dike (area labelled d in Figure 6B1). In this period, the frequency of the subsidence values recorded in the main subsidence area shows a bimodal histogram (Figure 6B3), defined by a main peak at −8.4 cm (−17 cm/year), higher than the previous one, and a secondary peak at −16 cm (−32.4 cm/year) corresponding to the area labelled as d. Maximum subsidence values reached as much as −20 cm (−40.5 cm/year) near collapse sinkhole b. Before October 2015, collapse sinkholes b and c were filled with aggregates, so that they displayed positive values in the model (Figure 3B).
In the last period analysed (October 2015–April 2016), which included the shallow polyurethane grouting program carried out along the dike, the subsidence area (sinkhole a) expanded significantly to the west and north, mainly in the dike (areas labelled as f in Figure 6C1). Additionally, the area affected by the greatest subsidence translated completely from the street to the dike (area labelled d in Figure 6C1). The frequency of the displacement values of the 3D model in the main subsidence area showed a polymodal distribution with peaks at −4.3 cm (−8.3 cm/year), −6.8 cm (−13.2 cm/year) and −12.2 cm (23.7 cm/year) (Figure 6C3). The maximum subsidence occurred in the dike (area d in Figure 6C1), affecting the outer shoulder, and probably also the track on the dike crest. However, this latter zone showed apparent upward displacement due to the accumulation of a man-made fill in the subsidence zone, developed at the foot of an arcuate scarp (area e in Figure 6C1 and Figure 3A). The nested collapse sinkhole b seems to have been inactive during this period. In contrast, collapse sinkhole c was reactivated after the previous fillings. The elongated geometry of this sinkhole, with an orientation parallel to the edge of the main subsidence zone, suggests that it may be related to ravelling of surficial deposits through an extensional fissure developed in the marginal zone of the main sinkhole.
A 3D comparison of the point clouds also allowed the detection of deformation affecting vertical structures, such as the house located to the east. The deformation of the house façade progressively increased from October 2014 to April 2016. In the last comparison (October 2015–April 2016), more than half of the façade was affected by movements ranging from −0.6 to −5 cm. In fact, the house had to be demolished in July 2016.

5.2. Logroño Highway Sinkholes

The 3D TLS survey of this site covered an area of 17,160 m2. The site was scanned on five dates, covering a time span of 740 days: April 2015, October 2015, April 2016, October 2016, April 2017 (Table 1). Point clouds were created from 40–45 overlapping scans with medium resolution (7–12 mm at 10 m scanning distance). The mean errors associated with the registration and referencing were 2–3 mm and 3–14 mm, respectively (Table 1).
The comparison between the 3D point clouds from April 2015 and October 2015 revealed two active sinkholes (Figure 7A1). Sinkhole 1, mainly affecting the Logroño highway, showed a high inner subsidence area, characterised by a complex polymodal displacement distribution between −4 and −10 cm (−8.1 and −20.2 cm/year) (Figure 7A3), with the highest mode at −9 cm (−18.1 cm/year). This inner high-subsidence sector of sinkhole 1 is surrounded by an ill-defined aureole (labelled as 3 in Figure 7A1) with a mean subsidence of −4 cm (−8.1 cm/year). Sinkhole 2, located in a non-accessible fenced plot, north of the highway, could not be scanned completely. Nonetheless, it showed the greatest subsidence (Figure 7A4), mainly ranging between −2 and −25 cm (−4 and −50.4 cm/year), with the main mode at −12 cm (−24.2 cm/year). Subsidence in both sinkholes was measured with a 95% level of confidence, although the data do not allow precise mapping of the sinkhole edges (Figure 7A2).
Between October 2015 and April 2016, the central sector of sinkhole 1 was filled and re-paved, displaying positive distance values in the comparison model (Figure 7B1). Sinkhole 2 showed subsidence activity, but with a lower rate and different pattern than in the previous period. Subsidence values showed a trimodal distribution, ranging between −2 and −13 cm (−3.9 and −25.2 cm/year), with the main mode at −6 cm (−11.6 cm/year) (Figure 7B3). This comparison also showed other significant positive distance changes with scattered distribution (labelled 4 in Figure 7B1,B2), which can be ascribed to scanning errors, discussed in the next section.
The subsequent comparison (April 2016–October 2016) also showed positive distance changes attributable to scanning errors (labelled 4 in Figure 7C1,C2). Nonetheless, the model captured negative changes related to subsidence in both sinkholes. Subsidence in sinkhole 2 ranged between −2 and −24 cm (−3.8 and −45.9 cm/year) (Figure 7C1), with a main mode of −7 cm (−13.4 cm/year) (Figure 7C3). Subsidence values in sinkhole 1, with the highest mode at −4 cm (−7.6 cm/year) (Figure 7C4) were lower than those measured during the first period.
Perhaps surprisingly, the M3C2 displacement model of the period from October 2016–April 2017 did not capture subsidence activity in sinkhole 1 (Figure 7D1). Although the model showed values of −1 to −1.6 cm (−1.9 to 3 cm/year) for this sinkhole, the high referencing error involved in this comparison model (Table 1) did not allow the detection of significant changes with a 95% confidence interval (Figure 7D2). Conversely, the rapid subsidence in sinkhole 2 allowed the measurement of negative, vertical displacement, displaying a similar trimodal distribution to that observed during the period October 2015–April 2016 Figure 7D3), concentrated between −1 and −13 cm (−1.9 to −24.7 cm/year), with the main mode at −7 cm (−13.3 cm/year).

6. Discussion

The comparison of 3D point clouds acquired by TLS over a rather limited time period (551–740 days) has provided valuable data regarding subsidence and its spatial–temporal changes in three damaging sinkholes. The activity of these sinkholes is related to rapid dissolution of salt-bearing evaporites overlain by poorly consolidated Quaternary alluvium (mantled karst) and is affected by various natural (floods, water table change, nested collapses) and anthropogenic (remedial measures) factors. The obtained deformation models displayed much higher spatial resolution (ca. 1 cm) than the subsidence data published in any of the previous papers dealing with sinkhole monitoring. However, the accuracy of the ground deformation measurements was significantly lower than those obtained by high-precision leveling in the Alcalá sinkhole and in sinkhole 1 of the Logroño highway site, although with much lower spatial resolution [19].
In the Alcalá sinkhole, the two initial displacement models, spanning from October 2014 to October 2015, showed a rapid subsidence area, 26 m long, surrounded by an ill-defined outer zone, apparently affected by settlement and recorded by points with a scattered distribution (Figure 6). In contrast, high-precision leveling data acquired along the foot of the dike (see location in Figure 2) and during a similar period (February–July 2015), indicate that subsidence affects at least a 36 m long section of the survey line [19]. Moreover, the detailed map showing the surface evidence of deformation suggests that the sinkhole’s length may reach 40 m (Figure 2). These data indicate that the deformation models generated with the TLS data capture the inner sector of the sinkhole affected by rapid subsidence but not the marginal zone with slower settlement. This limitation could be attributed to the following factors: (1) the restricted time span of the comparison periods, i.e., the amount of subsidence in the marginal sector of the sinkhole is close to, or lower than, the accuracy of the method; and (2) a significant part of the area is covered by unstable material (e.g., loose aggregate in the street) (Figure 3B). Regarding the latter, data from flat rigid surfaces, such as the façade of the house located to the east of the sinkhole, allowed us to decrease the surface change detection threshold at 6 mm with a 95% confidence interval.
The 3D high spatial resolution of the TLS data allowed the monitoring of relevant changes in the spatial distribution of the subsidence as well as the rates of change. Overall, the main modes observed in the subsidence distribution indicate an increase in the main subsidence rates from −14 cm/year to −17 cm/year during the period from October 2014–October 2015, and a reduction from −17 cm/year to −13 cm/year during the period from October 2015–April 2016. These temporal changes may be attributed to several natural and anthropogenic factors, as explained below. During the period from April–October 2015, there was an acceleration in subsidence in the Northern sector of the sinkhole, affecting the Northern shoulder of the dike and the adjacent street (Figure 6B). Here, subsidence rates increased from −14 cm/year during October 2014–April 2015, to dominant values of around −32 cm/year during April–October 2015. The subsidence rate increase was also accompanied by an enlargement of the area affected by more rapid deformation, including a large portion of the street and the Eastern margin of the dike wall. This local subsidence acceleration, which occurred after the recession of the February–April 2015 Ebro River flood, can be collectively attributed to: (1) weakening of the ground and dike due to internal erosion caused by the subsurface flow of pressurized water during the peak of the flood; (2) buoyancy loss, associated with the water-table drop (this is probably the most important factor); and (3) increased load due to high water content in the soil within the vadose zone after the flood recession. A significant increase in the subsidence rate following the February–April flood has been also measured by high-precision leveling, with a rise in the maximum subsidence rate from −15.8 cm/year to −22.3 cm/year between April and May 2015 [19]. However, these data were restricted to the leveling line and the portion of the sinkhole affected by subsidence acceleration could not be constrained. During the period from October 2015–April 2016, including the polyurethane grouting in the dike (November–December 2015), the area of maximum subsidence translated towards the dike, especially in the sector affected by a collapse sinkhole in November 2013 (Figure 2 and Figure 6C). Here, the main subsidence rates increased from −16 to −23 cm/year. Moreover, the area affected by significant settlement in the dike expanded by around 10 m to the north and an unknown distance towards the river. Additionally, deformation features in the house increased in each comparison until it had to be demolished in July 2016. These data illustrate the ability of the method to accurately monitor spatial–temporal changes in subsidence within a sinkhole as well as the effects of subsidence on horizontal and vertical man-made structures. They also reveal the adverse effects of the shallow compaction grouting program, carried out above the main cavities recognized in boreholes.
Active subsidence was measured in both sinkholes of the Logroño highway site, but the performance of the method was not as good as in the Alcalá sinkhole due to several limitations. Regarding sinkhole 1, the April–October 2015 deformation model showed an inner sector, 44 m across, affected by rapid subsidence (−8 to −20 cm/year), surrounded by a poorly defined outer zone with subsidence rates <8 cm/year (Figure 7A). This deformation model does not allow the boundaries of the subsidence area to be mapped confidently. High-precision leveling data acquired along the Northern side of the highway during March 2015–September 2016 (see location in Figure 4) indicate that settlement persistently affected a 105 m long section of the line, with mean and maximum subsidence rates of −2.4 to −3.8 cm/year and −5.0 to −7.6 cm/year, respectively [19]. The October 2015–April 2016 point-cloud comparison roughly captured an apparent positive displacement related to re-asphalting in the most active sector of the sinkhole (Figure 7B). The April–October 2016 deformation model recorded subsidence in the central sector of the sinkholes, but with lower rates than in the period from April–October 2015 and in a more restricted area (Figure 7C). In the period from October 2016–April 2017, no statistically significant subsidence was detected in sinkhole 1 (Figure 7D). Conversely, leveling data indicated stationary subsidence at a rather constant rate [19]. The contrasting subsidence measurements may be related to limitations of the TLS method as well as adverse local conditions: (1) The comparison models spanning from October 2016 to April 2017 showed anomalous areas affected by apparent displacement, interpreted as scanning errors related to heavy vehicle traffic, despite the scanning being carried out at night time. The vibrations and wind blast produced by trucks and busses affected the stability of the scanner, altering portions of the scans. (2) The large scanning area (17,160 m2), the high number of scans (40–45) and the lack of transversal structures in the highway contributed to a reduction in the precision of the cloud-to-cloud 3D alignment, increasing the registration and referencing errors and consequently, reducing the statistical significance of the changes detected by the M3C2 algorithm. The referencing errors in the Logroño highway site reached values as high as 14 mm, whereas in referencing errors in the Alcalá sinkhole were always ≤2 mm. (Table 1). Nevertheless, errors in large areas can be reduced by increasing the number of reference targets and the scan resolution. (3) The subsidence measurements essentially showed a polymodal distribution, whereas the M3C2 algorithm calculated the confidence interval assuming Gaussian statistics [42]. This may introduce some bias in the estimation of the confidence interval, despite the fact that this statistical method is more adequate for natural landforms than other approaches such as bootstrapping [42].
The aforementioned limitations had a lesser impact on sinkhole 2, which was very active during the whole monitoring period. Cartographic data indicate that this sinkhole has a diameter of around 40 m. However, the displacement models only captured significant subsidence in a central area, 20 m across. The comparison between the different displacement models suggested a temporal pattern in the subsidence (Figure 7). In the two October–April periods of 2016 and 2017, which included the rainy season, the subsidence values showed a similar trimodal distribution, with subsidence rates concentrated between −2 cm/year and −26 cm/year (Figure 7B,D). During these two periods, the main subsidence peaks were very similar (−12 and −14 cm/year), whereas the maximum subsidence peak was higher in 2017 (−27.2 cm/year) than in 2016 (−18.4 cm/year). Subsidence displayed a different distribution and higher values in the April–October periods, including the irrigation season, with rates concentrated between −4 cm/year and −46 cm/year (Figure 7A,C). The apparent higher subsidence activity in the April–October periods could be related to higher dissolution during the summer season with higher groundwater recharge by irrigation, e.g., [44], but could also be related to different scanned areas. In the period from April 2016–October 2016, the spatial coverage of the scans was significantly larger than in the period from April 2017–October 2017. A sinkhole-specific monitoring, covering a larger time span, is necessary to shed light on the issue. It was not possible to improve the scanning coverage since sinkhole 2 is located in a fenced parking area.
The high spatial resolution of the deformation models offers an unprecedented opportunity to explore the distribution pattern of the subsidence within specific sinkholes. Ideally, in a perfect piston-like collapse sinkhole (down-dropping cylindrical block), all the subsidence values would be equal, producing a single-bar histogram. A sagging sinkhole with radial symmetry and higher subsidence in the center (bowl-shaped depression produced by downward bending) yields a histogram with the shape of a right triangle, with a peak around 0. The highest frequency values correspond to the points located towards the sinkhole edge, since the area of concentric bands increases away from the center. This triangular pattern is roughly observed in sinkhole 2 for the period from April–October 2016 (Figure 7C4). However, a number of histograms tend to show a complex polymodal distribution. This suggests complex, differential subsidence within specific sinkholes, with one or several high subsidence portions that may have an eccentric distribution (e.g., Figure 6B). On the other hand, the histograms presented in Figure 6 and Figure 7, with values within the 95% confidence interval, should be considered to be incomplete, since they do not include the low subsidence that operates in the outer zone of the sinkholes, which may cover a larger area than the central sector (e.g., Figure 7A3). In fact, in most cases there is a gap between the right edge of the histogram and the 0 displacement value.

7. Conclusions

TLS surveying and point cloud comparison is a suitable technique for the 4D monitoring of specific active sinkholes characterized by rapid subsidence. However, the application of this time-consuming technique with relatively complex processing may not be practical in large areas that require a high number of scans. The deformation models generated by comparing 3D point clouds with utmost spatial resolution allow complex spatial and temporal subsidence patterns within specific hazardous sinkholes, such as sinkhole expansion, local subsidence acceleration or the formation of secondary collapse sinkholes, to be resolved. The spatially-dense displacement data can be highly useful for analyzing and managing multiple relevant issues related to the subsidence risk associated with specific sinkholes: (1) influence of natural (e.g., floods, water-table change) and anthropogenic factors (e.g., water pumping, irrigation) on sinkhole activity; (2) early detection of precursory subsidence preceding the formation of catastrophic collapse; and (3) appraisal of the performance of remedial measures.
TLS has lower accuracy than other methods such as high-precision leveling. The displacement models produced by the comparison of point clouds may not capture the slow subsidence that typically occurs in the marginal zone of sinkholes. Consequently, this technique may have some limitations for precisely mapping the boundaries of the areas affected by active subsidence.
The performance of TSL may be adversely affected by a number of factors related to the limitations of the method and the local conditions, as follows: (1) The quality of the data tends to decrease with the size of the investigated area. A larger number of overlapping scans per site contribute to an increase of the registration error and a reduction in the accuracy of the displacement data. Nonetheless, this drawback can be reduced by increasing the number of reference targets; (2) Surface alterations unrelated to sinkhole activity, such as the presence of mobile loose soil, vegetation, anthropogenic filling and resurfacing; (3) Limited access constraining the distribution of the scanning points; (4) Vibrations and wind blasts affecting the stability of the scanner; and (5) Moving objects such as traffic that produce undesired returns.
It is advisable to apply TLS for sinkhole monitoring with other complementary geodetic techniques such as high-precision leveling. TLS offers extremely high spatial resolution data in the areas of the sinkhole affected by more rapid subsidence, whereas high-precision leveling provides highly accurate displacement measurements in the slow-moving marginal zones of the sinkholes.

Acknowledgments

We would like to thank to the City Hall of the village of Alcalá and Demarcación de Carreteras de Aragón for providing permissions and logistic support during the measurement campaigns. We are also grateful to CTA and ENSAYA geotechnical companies for providing borehole data. The research has been funded by the Spanish national projects CGL2013-40867-P, CGL2017-85045-P (Ministerio de Economía, Industria y Competitividad). IF has pre-doctoral fellowship associated with project CGL2013-40867-P.

Author Contributions

All the authors participated in editing and reviewing the manuscript. A.B.-C. was the main responsible for the acquisition and processing of the TLS data. F.G. participated in the acquisition of data, production of maps and wrote the manuscript together with A.B.-C., A.M.-F., D.C., T.K., G.D., J.S., J.G., I.F. and A.G.-A. contributed significantly collecting, processing and interpreting the data.

Conflicts of Interest

The authors declare no conflict of interest.

References

  1. Gutiérrez, F.; Parise, M.; De Waele, J.; Jourde, H. A review on natural and human-induced geohazards and impacts in karst. Earth Sci. Rev. 2014, 138, 61–88. [Google Scholar] [CrossRef]
  2. Gutiérrez, F. Sinkhole hazards. In Oxford Research Encyclopedia of Natural Hazard Science; Oxford University Press: Oxford, UK, 2016; pp. 1–92. ISBN 9780199389407. [Google Scholar]
  3. Galloway, D.L.; Burbey, T.J. Review: Regional land subsidence accompanying groundwater extraction. Hydrogeol. J. 2011, 19, 1459–1486. [Google Scholar] [CrossRef]
  4. Chae, B.G.; Park, H.J.; Catani, F.; Simoni, A.; Berti, M. Landslide prediction, monitoring and early warning: A concise review of state of the art. Geosci. J. 2017, 21, 1033–1070. [Google Scholar] [CrossRef]
  5. Heath, G.; Constantinou, S. Sinkholes and land use regulation in South Africa. In Engineering Geology for Society and Territory; Lollino, G., Manconi, A., Guzzetti, F., Culshaw, M., Bobrowsky, P., Luino, F., Eds.; Springer: Dordrecht, The Netherlands, 2015; pp. 503–506. ISBN 978-3-319-09047-4. [Google Scholar]
  6. Abelson, M.; Aksinenko, T.; Kurzon, I.; Pinsky, V.; Baer, G.; Nof, R.; Yechieli, Y. Nanoseismicity forecasts sinkhole collapse in the Dead Sea coast years in advance. Geology 2018, 46, 83–86. [Google Scholar] [CrossRef]
  7. Zini, L.; Calligaris, C.; Forte, E.; Petronio, L.; Zavagno, E.; Boccali, C.; Cucchi, F. A multidisciplinary approach in sinkhole analysis: The Quinis village case study (NE-Italy). Eng. Geol. 2015, 197, 132–144. [Google Scholar] [CrossRef]
  8. O’Connor, K.M.; Trainum, M. Monitoring the threat of sinkhole formation under a portion of US 18 in Cerro Gordo County, Iowa using TDR measurements. In NCKRI Symposium 5, Proceedings of the 14th Multidisciplinary Conference on Sinkholes and the Engineering and Environmental Impacts of Karst; Doctor, D.H., Land, L., Stephenson, J.B., Eds.; National Cave and Karst Research Institute: Carlsbad, NM, USA, 2015; pp. 569–577. [Google Scholar] [CrossRef]
  9. Linker, R.; Klar, A. Detection of sinkhole formation by strain profile measurements using BOTDR: Simulation study. J. Eng. Mech. 2015, 143. [Google Scholar] [CrossRef]
  10. Theron, A. Detection of sinkhole precursors through SAR Interferometry: Radar and geological considerations. IEEE Geosci. Remote Sens. Lett. 2017, 14, 871–875. [Google Scholar] [CrossRef]
  11. Baer, G.; Magen, Y.; Nof, R.N.; Raz, E.; Lyakhovsky, V.; Shalev, E. InSAR measurements and viscoelstic modelling of sinkhole precursory subsidence: Implication for sinkhole formation, early warning and sediment properties. J. Geophys. Res. 2018, in press. [Google Scholar] [CrossRef]
  12. Galve, J.P.; Castañeda, C.; Gutiérrez, F.; Herrera, G. Assessing sinkhole activity in the Ebro Valley mantled evaporite karst using advanced DInSAR. Geomorphology 2015, 229, 30–44. [Google Scholar] [CrossRef]
  13. Filin, S.; Baruch, A.; Avni, Y.; Marco, S. Sinkhole characterization in the Dead Sea using airborne laser scanning. Nat. Hazards 2011, 58, 1135–1154. [Google Scholar] [CrossRef]
  14. Al-Halbouni, D.; Holohan, E.P.; Saberi, L.; Alrshdan, H.; Sawarieh, A.; Closson, D.; Walter, T.R.; Dahm, T. Sinkholes, subsidence and subrosion on the eastern shore of the Dead Sea as revealed by close-range photogrammetry survey. Geomorphology 2017, 285, 305–324. [Google Scholar] [CrossRef]
  15. Cigna, F.; Banks, V.J.; Donald, A.W.; Donohue, S.; Graham, C.; Hughes, D.; McKinley, J.M.; Parker, K. Mapping ground instability in areas of geotechnical infrastructure using satellite InSAR and Small UAV surveying: A case study in Northern Ireland. Geosciences 2017, 7, 51. [Google Scholar] [CrossRef]
  16. Intrieri, E.; Gigli, G.; Nocentini, M.; Lombardi, L.; Mugnai, F.; Fidolini, F.; Casagli, N. Sinkhole monitoring and early warning: An experimental and successful GB-InSAR application. Geomorphology 2015, 241, 304–314. [Google Scholar] [CrossRef]
  17. Sandia National Laboratory. September 2016 Bayou Choctaw Subsidence Report. Available online: http://prod.sandia.gov/techlib/access-control.cgi/2017/175688r.pdf (accessed on 7 March 2018).
  18. Kersten, T.; Kobe, M.; Gabriel, G.; Timmen, L.; Schön, S.; Vogel, D. Geodetic monitoring of subrosion-induced subsidence processes in urban areas. J. Appl. Geodesy 2017, 11, 21–29. [Google Scholar] [CrossRef]
  19. Desir, G.; Gutiérrez, F.; Merino, J.; Carbonel, D.; Benito-Calvo, A.; Guerrero, J.; Fabregat, I. Rapid subsidence in damaging sinkholes: Measurement by high-precision leveling and the role of salt dissolution. Geomorphology 2018, 303, 393–409. [Google Scholar] [CrossRef]
  20. Jaboyedoff, M.; Oppikofer, T.; Abellán, A.; Derron, M.H.; Loye, A.; Metzger, R.; Pedrazzini, A. Use of LIDAR in landslide investigations: A review. Nat. Hazards 2012, 61, 5–28. [Google Scholar] [CrossRef]
  21. Aiken, C.L.V.; Oldow, J.S.; Alfarhan, M.; White, L.S.; Ahmed, T. Monitoring growth of the Daisetta, Texas sinkhole with terrestrial laser scanning, close range digital photography, and GPS. In Proceedings of the South-Central Section—43rd Annual Meeting, Dallas, TX, USA, 16–17 March 2009; Geological Society of America Abstracts with Programs; Volume 41, p. 34. [Google Scholar]
  22. Ortí, F.; Salvany, J.M. Continental evaporitic sedimentation in the Ebro Basin during the Miocene. In Sedimentary Deposition in Rift and Foreland Basins in France and Spain; Busson, G., Schreiber, B.C., Eds.; Columbia University Press: New York, NY, USA, 1997; pp. 420–429. ISBN 978-0231067867. [Google Scholar]
  23. Salvany, J.M.; García-Veigas, J.; Ortí, F. Glauberite-halite association of the Zaragoza Gypsum Formation (Lower Miocene, Ebro Basin, NE Spain). Sedimentology 2007, 54, 443–467. [Google Scholar] [CrossRef]
  24. Salvany, J.M. Geología del yacimiento glauberítico de Montes de Torrero; Universidad de Zaragoza: Zaragoza, Spain, 2009; 80p, ISBN 9788492521838. [Google Scholar]
  25. Torrescusa, S.; Klimowitz, J. Contribución al conocimiento de las evaporitas Miocenas (Formación Zaragoza) de la Cuenca del Ebro. In Formaciones evaporíticas de la Cuenca del Ebro y cadenas periféricas y de la zona de Levante; Ortí, F., Salvany, J.M., Eds.; ENRESA-GPG: Barcelona, Spain, 1990; pp. 120–122. [Google Scholar]
  26. Gutiérrez, F.; Mozafari, M.; Carbonel, D.; Gómez, R.; Raeisi, E. Leakage problems in dams built on evaporites. The case of La Loteta Dam (NE Spain), a reservoir in a large karstic depression generated by interstratal salt dissolution. Eng. Geol. 2015, 185, 139–154. [Google Scholar] [CrossRef]
  27. Langer, H.; Offermann, H. On the solubility of sodium chloride in water. J. Cryst. Growth 1982, 60, 389–392. [Google Scholar] [CrossRef]
  28. Ford, D.C.; Williams, P. Karst Hydrogeology and Geomorphology; Wiley: Chichester, UK, 2007; 576p, ISBN 9780470849965. [Google Scholar]
  29. Guerrero, J.; Gutiérrez, F. Gypsum scarps and asymmetric fluvial valleys in evaporitic terrains. The role of river migration, landslides, karstification and lithology (Ebro River, NE Spain). Geomorphology 2017, 297, 137–152. [Google Scholar] [CrossRef]
  30. Guerrero, J.; Gutiérrez, F.; Galve, J.P. Large depressions, thickened terraces and gravitational deformation in the Ebro River valley (Zaragoza area, NE Spain). Evidence of glauberite and halite interstratal karstification. Geomorphology 2013, 196, 162–176. [Google Scholar] [CrossRef]
  31. Gutiérrez, F.; Guerrero, J.; Lucha, P. A genetic classification of sinkholes illustrated from evaporite paleokarst exposures in Spain. Environ. Geol. 2008, 53, 993–1006. [Google Scholar] [CrossRef]
  32. Guerrero, J.; Gutiérrez, F.; Lucha, P. Paleosubsidence and active subsidence due to evaporite dissolution in the Zaragoza city area (Huerva River valley, NE Spain). Processes, spatial distribution and protection measures for linear infrastructures. Eng. Geol. 2004, 72, 309–329. [Google Scholar] [CrossRef]
  33. Regato, P. Contribución al estudio de la flora y la vegetación del “Galacho de La Alfranca” en relación con la evolución del sistema fluvial; Naturaleza en Aragón; Diputacion General de Aragón (DGA): Zaragoza, Spain, 1988. [Google Scholar]
  34. Ollero, A. Dinámica reciente del cauce del Ebro en la Reserva Natural de los Galachos (Zaragoza). Cuaternario y Geomorfología 1995, 9, 85–93. [Google Scholar]
  35. Gutiérrez, F.; Galve, J.P.; Guerrero, J.; Lucha, P.; Cendrero, A.; Remondo, J.; Bonachea, J.; Gutiérrez, M.; Sánchez, J.A. Typology, spatial distribution and detrimental effects of the sinkholes developed in the alluvial evaporite karst of the Ebro River valley downstream Zaragoza city. Earth Surf. Process. Landf. 2007, 32, 912–928. [Google Scholar] [CrossRef]
  36. Benito-Calvo, A.; Gutiérrez, F.; Carbonel, D.; Desir, G.; Guerrero, J.; Magri, O.; Karampaglidis, T.; Fabregat, I. Measuring deformation related to active sinkholes with ground-based 3D laser scanner. A case study in the evaporite karst of the Ebro Valley, NE Spain. In Comprendiendo el relieve: Del pasado al futuro; Durán, J.J., Montes, M., Robador, A., Salazar, A., Eds.; XIV Reunión Nacional de Geomorfología: Málaga, Spain, 2016; pp. 599–606. [Google Scholar]
  37. Galve, J.P.; Gutiérrez, F.; Lucha, P.; Bonachea, J.; Cendrero, A.; Gimeno, M.J.; Gutiérrez, M.; Pardo, G.; Remondo, J.; Sánchez, J.A. Sinkholes in the salt-bearing evaporite karst of the Ebro River valley upstream of Zaragoza city (NE Spain). Geomorphological mapping and analysis as a basis for risk management. Geomorphology 2009, 108, 145–158. [Google Scholar] [CrossRef]
  38. Gutiérrez, F.; Galve, J.P.; Lucha, P.; Castañeda, C.; Bonachea, J.; Guerrero, J. Integrating geomorphological mapping, trenching, InSAR and GPR for the identification and characterization of sinkholes in the mantled evaporite karst of the Ebro Valley (NE Spain). Geomorphology 2011, 134, 144–156. [Google Scholar] [CrossRef] [Green Version]
  39. Quiles, E. Estudio del subsuelo. Alcalá de Ebro (Zaragoza). Ministerio de Medio Ambiente. Confederación Hidrográfica del Ebro. Unpublished report. 2007. [Google Scholar]
  40. Pueyo-Anchuela, O.; Casas-Sainz, A.M.; Soriano, M.A.; Pocoví-Juan, A.; Ipas-Llorens, J.F.; Ansón-López, D. Integrated geophysical and building damages study of karst effects in the urban área of Alcalá de Ebro, Spain. Z. Geomorphol. 2010, 54, 221–236. [Google Scholar] [CrossRef]
  41. CloudCompare. 3D Point Cloud and Mesh Processing Software Open Source Project. 2017. Available online: http://www.cloudcompare.org/ (accessed on 7 March 2018).
  42. Lague, D.; Brodu, N.; Leroux, J. Accurate 3D comparison of complex topography with terrestrial laser scanner: Application to the Rangitikei canyon (N-Z). ISPRS J. Photogramm. Remote Sens. 2013, 82, 10–26. [Google Scholar] [CrossRef]
  43. Benito-Calvo, A.; Arroyo, A.; Sanchéz-Romero, L.; Pante, M.; De La Torre, I. Quantifying 3D micro-surface changes on experimental stones used to break bones and their implications to the analysis of Early Stone Age pounding tools. Archaeometry 2017. [Google Scholar] [CrossRef]
  44. Acero, P.; Auqué, L.; Galve, J.P.; Gutiérrez, F.; Carbonel, D.; Gimeno, M.J.; Yechieli, Y.; Asta, M.P.; Gómez, J.B. Evaluation of geochemical and hydrogeological processes by geochemical modelling in an area affected by evaporite karstification. J. Hydrol. 2015, 529, 1874–1889. [Google Scholar] [CrossRef]
Figure 1. Geographical distribution of the investigated sinkholes (A: Alcalá; LH: Logroño highway) within the middle reach of the Ebro River valley, NE Spain.
Remotesensing 10 00571 g001
Figure 2. Detailed map of the Alcalá sinkhole produced in March 2016 showing the approximate locations of collapse events and remediation measures (compaction grouting with polyurethane foam), surface deformation features, positions of targets, leveling points and boreholes (numbers in parenthesis indicate the depth range of cavities).
Remotesensing 10 00571 g002
Figure 3. Images of the Alcalá sinkhole site taken at different dates. (A) Photograph taken on 2 March 2015, during the February–April Ebro River flood. The water stage in the river (right) is well above ground surface in the village, and water from the river flowed under pressure through and beneath the dike, flooding the sinkhole (left). The arrows point to an arcuate scarp-fissure developed in the dike. Note the cracking in the buildings. (B) Photograph taken on 5 October 2015, showing small collapse sinkholes (b and c) filled with lighter deposits. Note the cracking in the buildings. A laser scanner is to the left of the image. (C) Photograph taken on 1 December 2015 during the injection of polyurethane resin. The dike is affected by conspicuous sagging subsidence. The arrow points to borehole S-6, whose case protrudes above the ground surface.
Remotesensing 10 00571 g003
Figure 4. Map of the Logroño highway sinkholes. Surface evidence of deformation in sinkhole 1 (sinkhole in highway) and in sinkhole 2 (sinkhole in parking lot) were mapped in April 2016 and November 2011, respectively.
Remotesensing 10 00571 g004
Figure 5. Images of the Logroño highway sinkholes. (A) Photograph taken on June 1996 at the NE sector of sinkhole 1 before the enlargement of the highway and the construction of the currently existing department store. Note the conspicuous sagging of the service road and the sidewalk. (B) Image of sinkhole 2 taken on April 2016 affecting a recently asphalted surface within a fenced area. The left arrow points to the deeper part of sinkhole and the arrows on the right mark the outermost cracks.
Remotesensing 10 00571 g005
Figure 6. 4D monitoring of surface changes in the Alcalá sinkhole carried out between October 2014 and April 2016. (A) Changes from 09/10/2014 to 10/04/2015 (183 days). (B) Changes from 10/04/2015 to 07/10/2015 (180 days). (C) Changes from 07/10/2015 to 12/04/2016 (188 days). Surface-change frequency histograms are shown on the right of the displacement models. (D) Relative displacements along line D, depicted in image A.
Remotesensing 10 00571 g006
Figure 7. 4D monitoring of surface changes in the Logroño highway sinkhole, carried out between April 2015 and April 2017. (A) Changes from 10/04/2015 to 07/10/2015 (180 days). (B) Changes from 07/10/2015 to 12/04/2016 (188 days). (C) Changes from 12/04/2016 to 20/10/2016 (191 days). (D) Changes from 20/10/2016 to 19/04/2017 (181 days). Surface-change frequency histograms are shown on the right of the displacement models.
Remotesensing 10 00571 g007
Table 1. Point cloud errors. Cloud-to-cloud registration (C-C); target tension referencing (TT).
Mean Error
Point Cloud Date AlcaláLogroño Highway
mm
9 October 2014C-C0.003
TTreference cloud
10 April 2015C-C0.0020.002
TT0.002reference cloud
7 October 2015C-C0.0020.002
TT0.0020.003
12 April 2016C-C0.0020.005
TT0.0010.011
20 October 2016C-C 0.004
TT 0.010
19 April 2017C-C 0.003
TT 0.014

