Experimental Study of the Thermal Infrared Emissivity Variation of Loaded Rock and Its Significance
by
 ,
,
Jianwei Huang
1,2 ,
,
Shanjun Liu
1,2,*,
Xiang Gao
1,2,
Zhengcang Yang
1,2,
Qiang Ni
1,2 and
Lixin Wu
3 1
Key Laboratory of Ministry of Education on Safe Mining of Deep Metal Mines, Northeastern University, Shenyang 110819, China
2
School of Resources and Civil Engineering, Northeastern University, Shenyang 110819, China
3
School of Geosciences and Info-physics, Central South University, Changsha 410008, China
*
Author to whom correspondence should be addressed.
Remote Sens. 2018, 10(6), 818; https://0-doi-org.brum.beds.ac.uk/10.3390/rs10060818
Submission received: 22 April 2018
/
Revised: 13 May 2018
/
Accepted: 22 May 2018
/
Published: 24 May 2018
(This article belongs to the Special Issue Remote Sensing of Tectonic Deformation)
Abstract
:Previous studies have shown that thermal infrared radiation (TIR) changes with stress for loaded rocks. TIR changes were mainly attributed to temperature change without considering the change in surface emissivity. And it remains unclear whether there was a change in emissivity during the rock loading process. Therefore, based on the spectral radiance observations in this paper, an experimental study involving the emissivity variation in the 8.0–13.0 μm range for elastic loaded quartz sandstone under outdoor conditions was conducted. The experiments yield the following results. First, a variation in the stress condition led to the emissivity change in addition to the temperature change. The spectral radiance change was the combined result of the temperature changes and emissivity changes. Second, the emissivity changes linearly with the stress change, and the amplitude is relatively large in the 8.0–10.0 μm range. The waveband features of emissivity variation are the main factor leading to the waveband features of stress-induced radiance change. Third, the explanations for the changes in temperature and emissivity during loading process are analyzed. And the significance and difficulty for further satellite remote sensing purpose is discussed. The experimental results provide an experimental foundation for crustal stress field monitoring.

1. Introduction
Earthquakes are one of the most unexpected and most serious natural disasters. In recent years, frequently occurring disastrous earthquakes, including the Wenchuan Earthquake (M 8.0, 2008), Chile earthquake (M 8.8, 2010), and Nepal earthquake (M 8.1, 2015), have killed thousands of people and caused massive losses. However, the monitoring and prediction of earthquakes remains a global problem.
In 1988, Gorny et al. [1] used satellite technology to observe short-lived thermal infrared radiation (TIR) anomalies before a strong earthquake in Central Asia. The scientific community has since reported a large number of TIR anomalies occurring before many medium-to-large (M > 5.5) earthquakes all over the world, and this phenomenon has been repeatedly verified all over the world during the past two decades [2,3,4,5,6,7,8,9,10,11,12]. And some explanations for the TIR anomalies were proposed, such as rising fluids that could lead to the emanation of warm gases [1], the “local greenhouse” effect caused by the diffuse CO2 [2,3,7], rising well-water levels and changing moisture contents in the soil [13], latent heat due to condensation of water on air ions formed as the result of radon emanation [14,15], the TIR change caused by the stress change [6,16], and charge generation and propagation in igneous rock with “P-holes” [9,10,17]. The tectonically-adjusted area obtained from a temperature field via a satellite thermal infrared image is largely accordant with that of the co-seismic deformation [18]. The use of thermal infrared remote sensing for monitoring pre-earthquake anomalies at a broadly spatial and continuous temporal scale has become a popular topic in seismic monitoring research.
To explore the internal mechanisms of the TIR anomalies caused by crustal stress changes before earthquakes, a series of experimental studies of TIR imaging observations of loaded rock were performed [16,19,20,21,22,23,24,25,26]. The results showed that different TIR changes appeared at different loading stages. The TIR intensity changed linearly with the stress change during the elastic deformation stage. In addition, precursor phenomena of TIR anomaly occurred before fracture. The stress condition and stability of loaded rock can be monitored by obtaining data on the changes in TIR via remote sensing (RS) technology. Therefore, the concept of remote sensing rock mechanics (RSRM) was put forward as an interface subject [27]. At a large scale, tectonic activity in the Earth’s crust can be detected via satellite RS. At a small scale, the instability process and the geo-structural features of rock engineering and bare rock masses can be evaluated [28,29], and the landslide risk can be assessed [30,31] using TIR observations.
Further, observational experiments focused on changes in the infrared spectral radiance for loaded rocks were performed as well. The radiant intensities of different types of rocks were observed in the laboratory loading condition. And the results showed that the radiant intensity of quartz syenite, fine-grained diorite, and quartz monzonite clearly changed with stress in the ranges of 8.3–10.1 μm, 10.3–12.2 μm, and 13.0–15.1 μm, respectively [32]. And at a relatively low loading rate, the temperature remained constant because of the thermal dissipation with the surrounding environment. And the spectral radiation change was attributed to the activation of the mechanical energy [33].
Freund [17] and some other scholars have performed a series of meaningful work on the TIR observation experiments for loaded rock and proposed the “P-hole” hypothesis. When the rock was in the stressed condition, the P-hole started to flow towards to the less-stressed region, the unstressed rock volume thus becomes positively charged relative to the stressed volume, making the system behave like a battery [34,35]. The results from the central pressurized infrared observation experiment of massive granite and anorthosite samples showed that the IR changes with stress with respect to the spectral components, and intensities were greater than the range of changes in the environmental temperature, leading to the infrared ‘hot-band’ (8.7, 9.7, 10.75, 11.36, and 7.7–10.0 μm) with sensitive intensity change [36]. The electron current can flow deep in the crust paralleling the stress-activated P-hole current and recombine on the rock surface [37,38]. And the further influx of positive holes led to fluctuations of the surface potential, indicative of impulsive field-ionization of positive airborne ions at the surface [39,40]. The studies on the L’Aquila earthquake showed that the TIR anomalies were the result of the accumulation of P-holes at topographic highs, where they undergo exothermal pairwise recombination to peroxy [9,10].
Liu et al. [41] performed a quantitative analysis of the relationship between the infrared spectral radiance and stress on quartz sandstone. The results revealed that the radiance has a higher correlation with stress and a larger increment in the response per unit stress in the 8.0–11.5 μm range. Therefore, this range may represent a stress-sensitive waveband for quartz sandstone. As the wavelength reststrahlen features (RF) of different mineral compositions are different [42,43,44], experiments focused on the relationship between the sensitive waveband and the different mineral components of loaded granite were performed. The results showed that the waveband sensitive to stress is 8.4–10.6 μm for feldspar-rich porphyritic granite and 8.2–11.7 μm for plagioclase-rich granite [45]. The sensitive waveband is related to the RF wave range on the emissivity spectrum of the minerals. Therefore, it can be confirmed that a variation in stress can lead to a change in infrared spectral radiance with stress-sensitive wavebands of loaded rocks.
According to Stefan-Boltzmann’s law, the TIR information is determined by both the surface emissivity and physical temperature. In previous TIR studies of loaded rocks, the emissivity was regarded as constant in the loading process, and thus the TIR change was attributed only to the change in physical temperature [19,20,21,25]. However, research on the surface emissivity change for loaded rocks is lacking. Therefore, the experiment focused on the emissivity change for horizontal loaded rock via thermal spectrum observation was performed. Because the outdoor condition is more beneficial for the target radiance variation observation with the relatively weak background radiation than that in the indoor condition [46]. And the outdoor condition is consistent with that of actual satellite-based observations [47]. It is more reasonable to perform the experiment in the outdoor condition for accurate radiance and emissivity variation acquisition. Both the temporal and spectral features of the emissivity change during the elastic stage were analyzed.
2. Materials and Methods
2.1. Theoretical Analysis
The spectral radiance reaching the Fourier transform infrared (FT-IR) spectrometer sensor is composed of various types of components. The received radiance can be defined by the following equation [48,49]:
where Ts is the temperature of the sample surface (K); λ is the wavelength (μm); H is the height of the instrument above the sample (m); θ is the zenith angle of the sensor with respect to the earth normal; θt is the zenith angle of the sensor with respect to the target normal; ε(θt,λ) is the spectral emissivity at the angle of θt in the static condition; Ldwr(λ) is the downwelling radiance field in the experimental condition (W·m−2·μm−1·sr−1) measured with an InfraGold standard reflecting plate; τ(H,θ,λ) is the to-sensor spectral atmospheric transmission through a path θ degrees off of the earth normal to an altitude of H; and Luwr(H,θ,λ) is the upwelling scattered and self-emitted atmospheric path radiance (W·m−2·μm−1·sr−1). Lbb(Ts,λ) is the spectral blackbody radiance at a target surface temperature of Ts (W·m−2·μm−1·sr−1), which can be calculated via Planck’s law:
where M(Ts,λ) is the radiant exitance (W·m−2·μm−1); λ and Ts are the same as in Equation (1); c is the speed of light in a vacuum (m·s−1); h is Planck’s constant, h = 6.6262 × 10⁻³⁴ (J·s); and k is the Boltzmann constant, k = 1.3806 × 10⁻²³ (J·K−1). The Lbb(Ts,λ) at temperature Ts can be calculated from the value of M(Ts,λ) divided by π.
Equation (1) shows that the self-emission cannot be measured directly due to atmospheric influences. The atmospheric effects can be minimized by taking measurements close to the target at a height of less than 1 m, i.e., Luwr(H,θ,λ) ≈ 0, τ(H,θ,λ) ≈ 1 [50]. The observation angles θ and θt and the height H can be regarded as constants during the loading process. Thus, Equation (1) reduces to the following:
At this point, Equation (3) shows that the static radiance reaching the sensor is mainly related to three factors: the initial target surface temperature, Ts; the static surface emissivity, ε(λ); and the downwelling radiance, Ldwr(λ). Therefore, the emissivity can be calculated by the following Equation (4):
For loaded rock, Ldwr(λ) can be regarded as constant during the relatively short loading period (which is less than 10 min). Hence, taking both the temperature change, ΔTs, and the emissivity change, Δε(λ), into consideration, the received radiance, L1(λ), can be defined as follows:
The radiance variation compared to the initial moment, ΔL1(λ), is expressed as follows:
Equation (6) shows that the radiance increment, ΔL1(λ), is composed of two parts. The former part is the radiance variation related only to the temperature change, ΔLT(λ); the latter part is the radiance variation related to both the emissivity and temperature changes, which is defined as ΔLε(λ). Thus, Equation (6) can be simplified to the following:
Solving for the variation features for Δε(λ), Equation (7) can be transformed as follows:
Hence, based on the results for ΔL(λ) and ΔLT(λ), the variation in emissivity can be calculated by Equation (8). Both the temperature and emissivity changes for elastic loaded sandstone were analysed in this paper.
2.2. Components of Experimental System
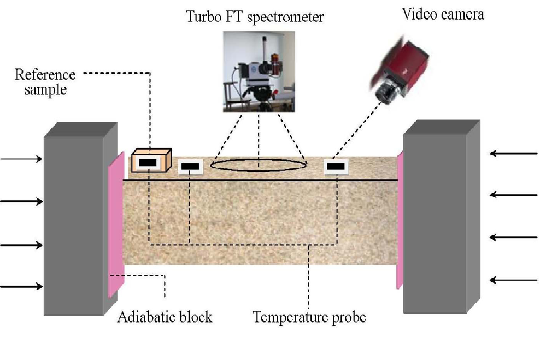
The experimental measuring system comprised a load-testing machine, an FT-IR spectrometer, a temperature-testing system, and a small video camera. The moveable load-testing machine featured a servo-controlled horizontal loading mode designed to allow the overhead observation of infrared radiation and to simulate an Earth observation system. The maximum testing force was 5000 kN, with the loading accuracy better than ±1%. The displacement measurement range was 0–650 mm, with a precision better than ±0.5% [47].
A Turbo FT portable FT-IR spectrometer designed by the Design & Prototypes Corporation, USA, was used to detect the spectral radiance of the sample surface during the loading process. The spectra were recorded over the range of 2.55–16.0 μm at a resolution of 4 cm−1 with an MCT standard detector in combination with an indium antimonide (InSb) detector. The spectral accuracy was ±2 cm−1, and the observation view angle was 2.4°. The magnitude accuracy of the measured radiance was 10−2. The maximum scan rate was 100 frames per second (fps).
A TWC-2A multichannel temperature meter including Pt1000 temperature probes was used to detect surface temperature changes during the loading process. Measuring such temperature changes is useful for better understanding the mechanism responsible for the radiance change. The measurement precision was ±0.3% rdg +1 °C in the range of 0 °C to 100 °C, and the resolution was 0.01 °C. The maximum scan rate was 2 fps.
To record the rock surface changes during the loading process, one small visible-light video camera with a 960 × 600 pixel resolution was positioned near the sample.
2.3. Calibration Procedure
Because the experiments were conducted under outdoor conditions, the measured radiance and temperature were influenced by the experimental system and the environment. The following procedures were adopted to reduce the influence of these factors:
2.3.1. Instrument Calibration
First, liquid nitrogen was used to cool the spectrometer detector to ensure that the internal temperature remained constant, and the refrigeration time was no less than 60 min. Then, the cold-warm blackbody calibration method was adopted to establish the response function between the detector output voltage and the received radiance of the blackbody for every target measured. Furthermore, to reduce the effects of instrument drift and the noise of the sensor, the temperatures of the warm and cold blackbodies were typically 5 °C above and below the sample temperature, respectively [48,49,50]. The radiance data in the 8.0–13.0 μm range (corresponding to the atmospheric window of TIR [51,52] and including the RF wave range in the 8.0–10.0 μm for the emissivity spectrum of quartz sandstone [53,54]) was selected for analysis. Additionally, a thermostat was used to calibrate the temperature meter, and the calibration precision was better than 0.1 °C.
2.3.2. Calibration for the Experimental Environment
To reduce the influence of reflection from surrounding structures, an outdoor experiment field was selected in a suburb of Changchun City, Jilin, China (125.4°E, 44.0°N). It is suitable for measuring the TIR at night time [28]. And to avoid sample surface temperature changes because of solar illumination and radiation during the daytime, the experiment was conducted at night from 18:00 to 21:00 in September. The ambient temperature was approximately 17 °C. To reduce the influence of clouds and water vapor, breezy weather with no visible cloud cover and an atmospheric relative humidity of less than 45% was chosen.
The electric motor and fuel tank of the load-testing machine can produce heat and result in errors in the measured temperature and radiance. To reduce heat conduction from the atmosphere and loading ends to the sample, these components were located at a distance of 2.6 m from the loaded sample, thereby ensuring that the heat dissipated via atmospheric convection. Additionally, two sheets of 1-mm-thick polytetrafluoroethylene (PTFE) pads were placed between both of the loading ends and the sample [47].
The temperature in the observation area cannot be measured by the probe directly. The radiance from the probe could affect the sample radiance. Therefore, the temperature both inside and outside the observation area were recorded for more than 10 min under static conditions. The maximum discrepancy between these two temperatures was less than 0.05 K, indicating that the temperature in the area can be represented by the temperature outside the area.
Additionally, the sample temperature can be recorded not only by the temperature probe but also based on the temperature emissivity separation (TES) algorithm according to the measured radiance data [55,56]. For sandstone, the temperature can be fitted automatically according to a known emissivity at a certain wavelength based on the TES algorithm. Because the emissivity of sandstone could change in the loading process, leading to a change in the temperature evaluation, it was more reasonable to record the temperature variation data via the Pt1000 probe. Before the loading experiments, both the measured temperature and the fitted temperature were recorded, and the absolute errors between the two temperatures were less than 0.05 K. In addition, a small piece of similar rock was placed near the sample as a reference sample to record the ambient temperature [57,58].
Then, the background radiation of the environment can be measured by the diffuse reflecting golden plate, with a known reflectivity of 0.97, placed in the same orientation and position as the target [48,49,50]. The static observations (more than 10 min) focusing on the background radiation variation were conducted to ensure that the background was stable during the loading period. The results showed that the standard deviation of the background radiation variation was less than 0.01 W·m−2·μm−1·sr−1, indicating that the background was stable and that the radiance variation data obtained during the loading period were reliable.
2.4. Experimental Method
Eight quartz sandstone samples were selected for the experiment. The main mineral composition of the sandstones was quartz. The crystal size was approximately 0.5–1.0 mm and the porosity was approximately 7.5%. All samples were cut into the shape of rectangular solids with dimensions of 10 × 10 × 20 cm. The top and bottom faces of each sample were parallel within an error of 0.1 mm. The samples were labeled “sy20-1” to “sy20-8”, where “sy” represents quartz sandstone. Because surface emissivity can be affected by the surface roughness [59], the observation surfaces of the samples were roughened to the same magnitude of roughness by abrasive wheel. Each sample was loaded to failure at a constant rate of 1.5 kN/s.
Figure 1a,b illustrates the outdoor experimental scene and the schematic diagram of the instrument arrangement on the loaded sample. The spectrometer was placed perpendicular to the sample at a distance of 80 cm. This distance produced a circular observation area with a diameter of 4.0 cm on the sample surface. The radiance data from the center of the sample surface was recorded. The temperature probes were attached to the rock surface outside the observation area with adhesive material to record temperature data during the loading process. The sampling rates of both the spectrometer and the temperature tester were set to 1 fps. The ambient temperatures of all samples are listed in Table 1. The results show that the temperature change was less than 0.10 °C, indicating that the environment was stable and heat conduction could be ignored.
Before the formal experiment, a period of static observation (more than 10 min) was conducted to ensure that all instruments were working stably and consistently.
3. Results
3.1. Variation in Strain and Stress
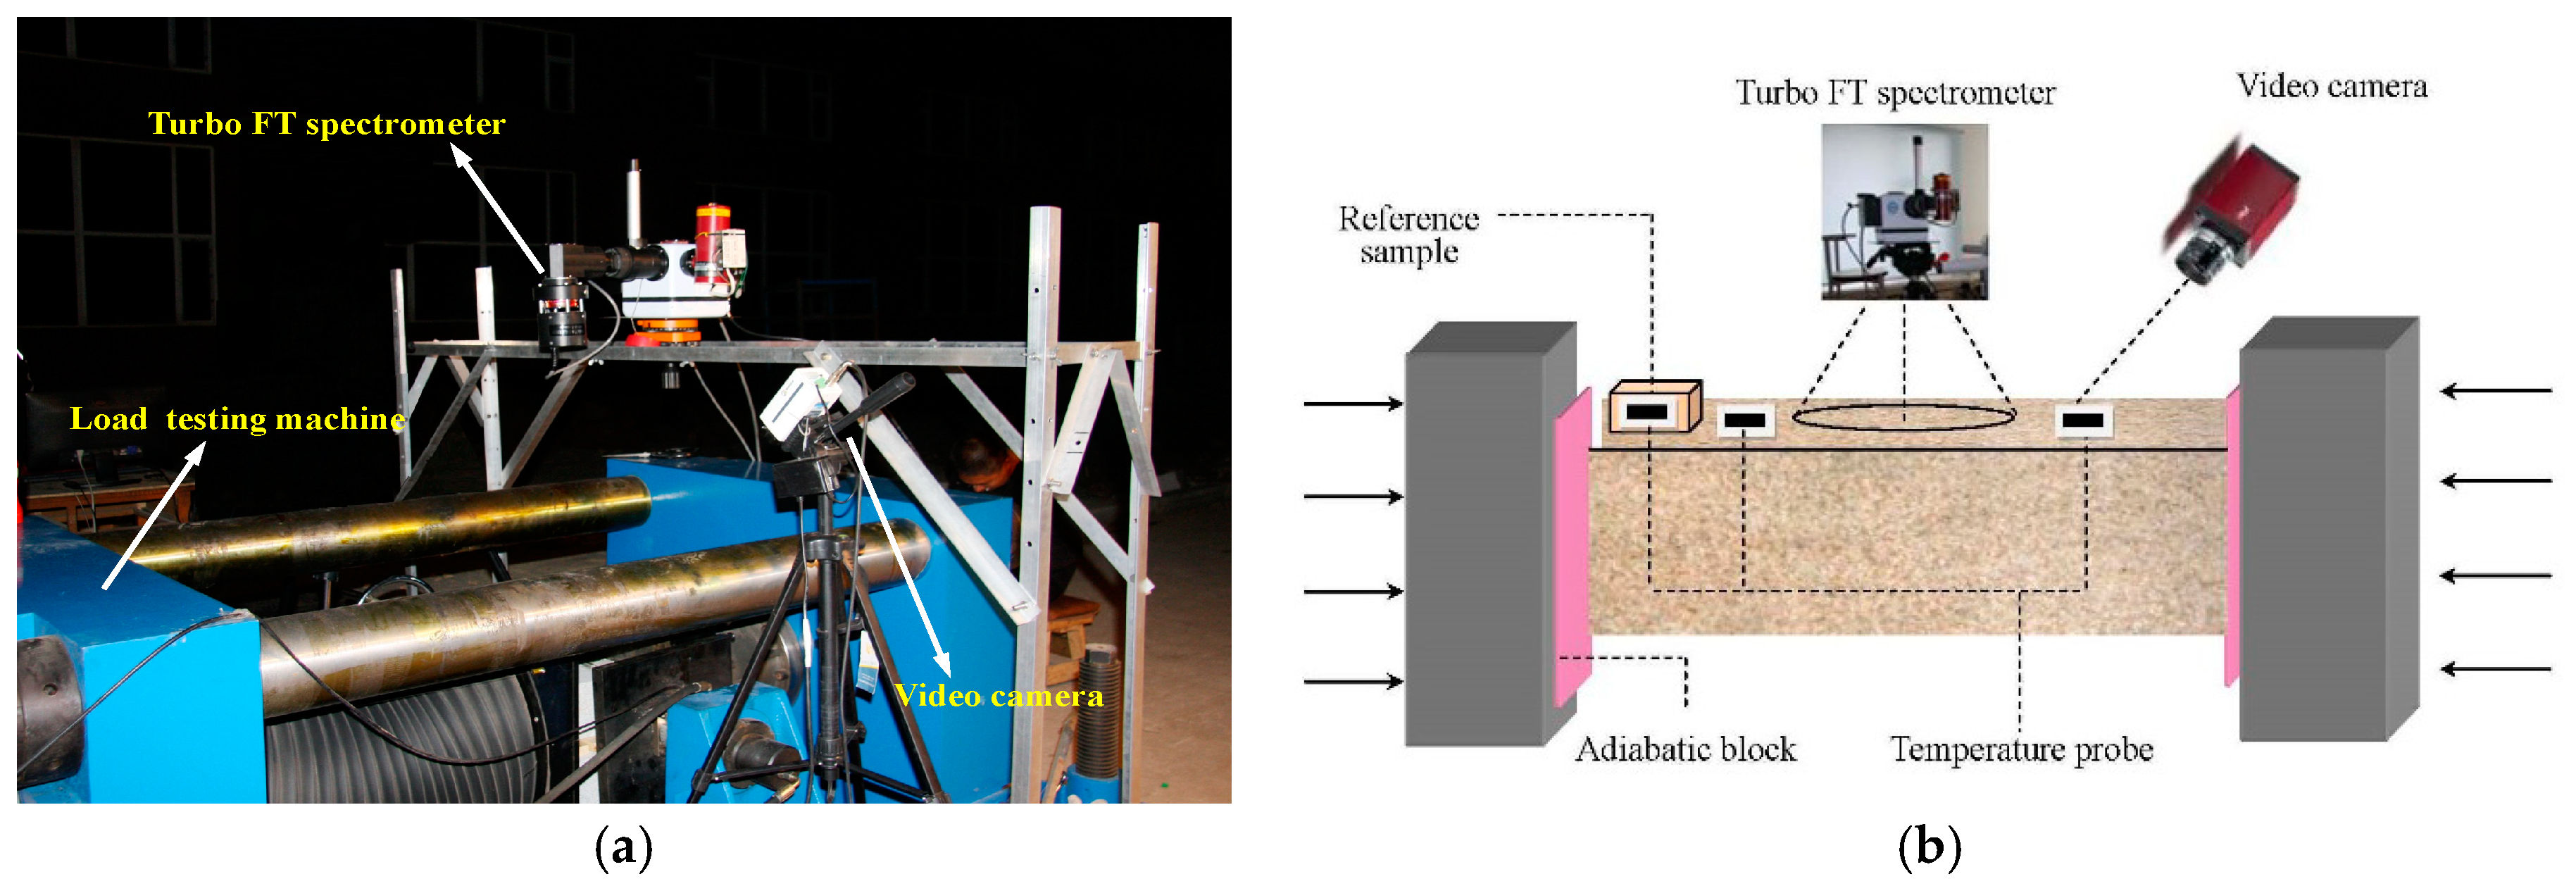
The experimental results showed that all the stress–strain curves were basically similar. A typical sample, sy20-3, is selected as an example to describe the stress-strain process, and the stress-strain curve is plotted in Figure 2a. The entire loading process can be divided into three stages. During the initial loading stage I, the curve bent downwards slightly and the stress slowly increased. The porosity of the specimen decreased because of the compressed initial hole and crack. During the elastic deformation stage II, the stress increased proportionately with the strain. The rock specimen can be regarded as an elastomer. With the increase of the stress, the surface fractures occurred during the fracture generation and development stage III, and the rock failed at 458 s. No obvious plastic stage was observed before fracture due to the relatively high degree of brittleness of sandstone.
3.2. Variation in Temperature
In this experiment, both the sample temperature and ambient temperature during the loading process were measured, and these two curves are plotted in Figure 2b. Previous studies have shown that a change in stress can lead to a change in surface temperature for loaded rock with an increment of 0.1–0.2 K [20,21]. The sample temperature increases as the stress increases in stages I and II. The increment was approximately 0.3 K during stage II, including an increase of 0.08 K in the ambient temperature. During stage III, the temperature decreased because of the appearance of fractures on the sample surface. According to Equation (6), the sample temperature change related to both the stress change and ambient temperature can synthetically result in the measured radiance change.
Based on the stress–strain curve and the temperature variation curve, the radiance variation result during stage II for all specimens were selected to analyze.
3.3. Variation in Radiance
3.3.1. Measured Radiance Variation
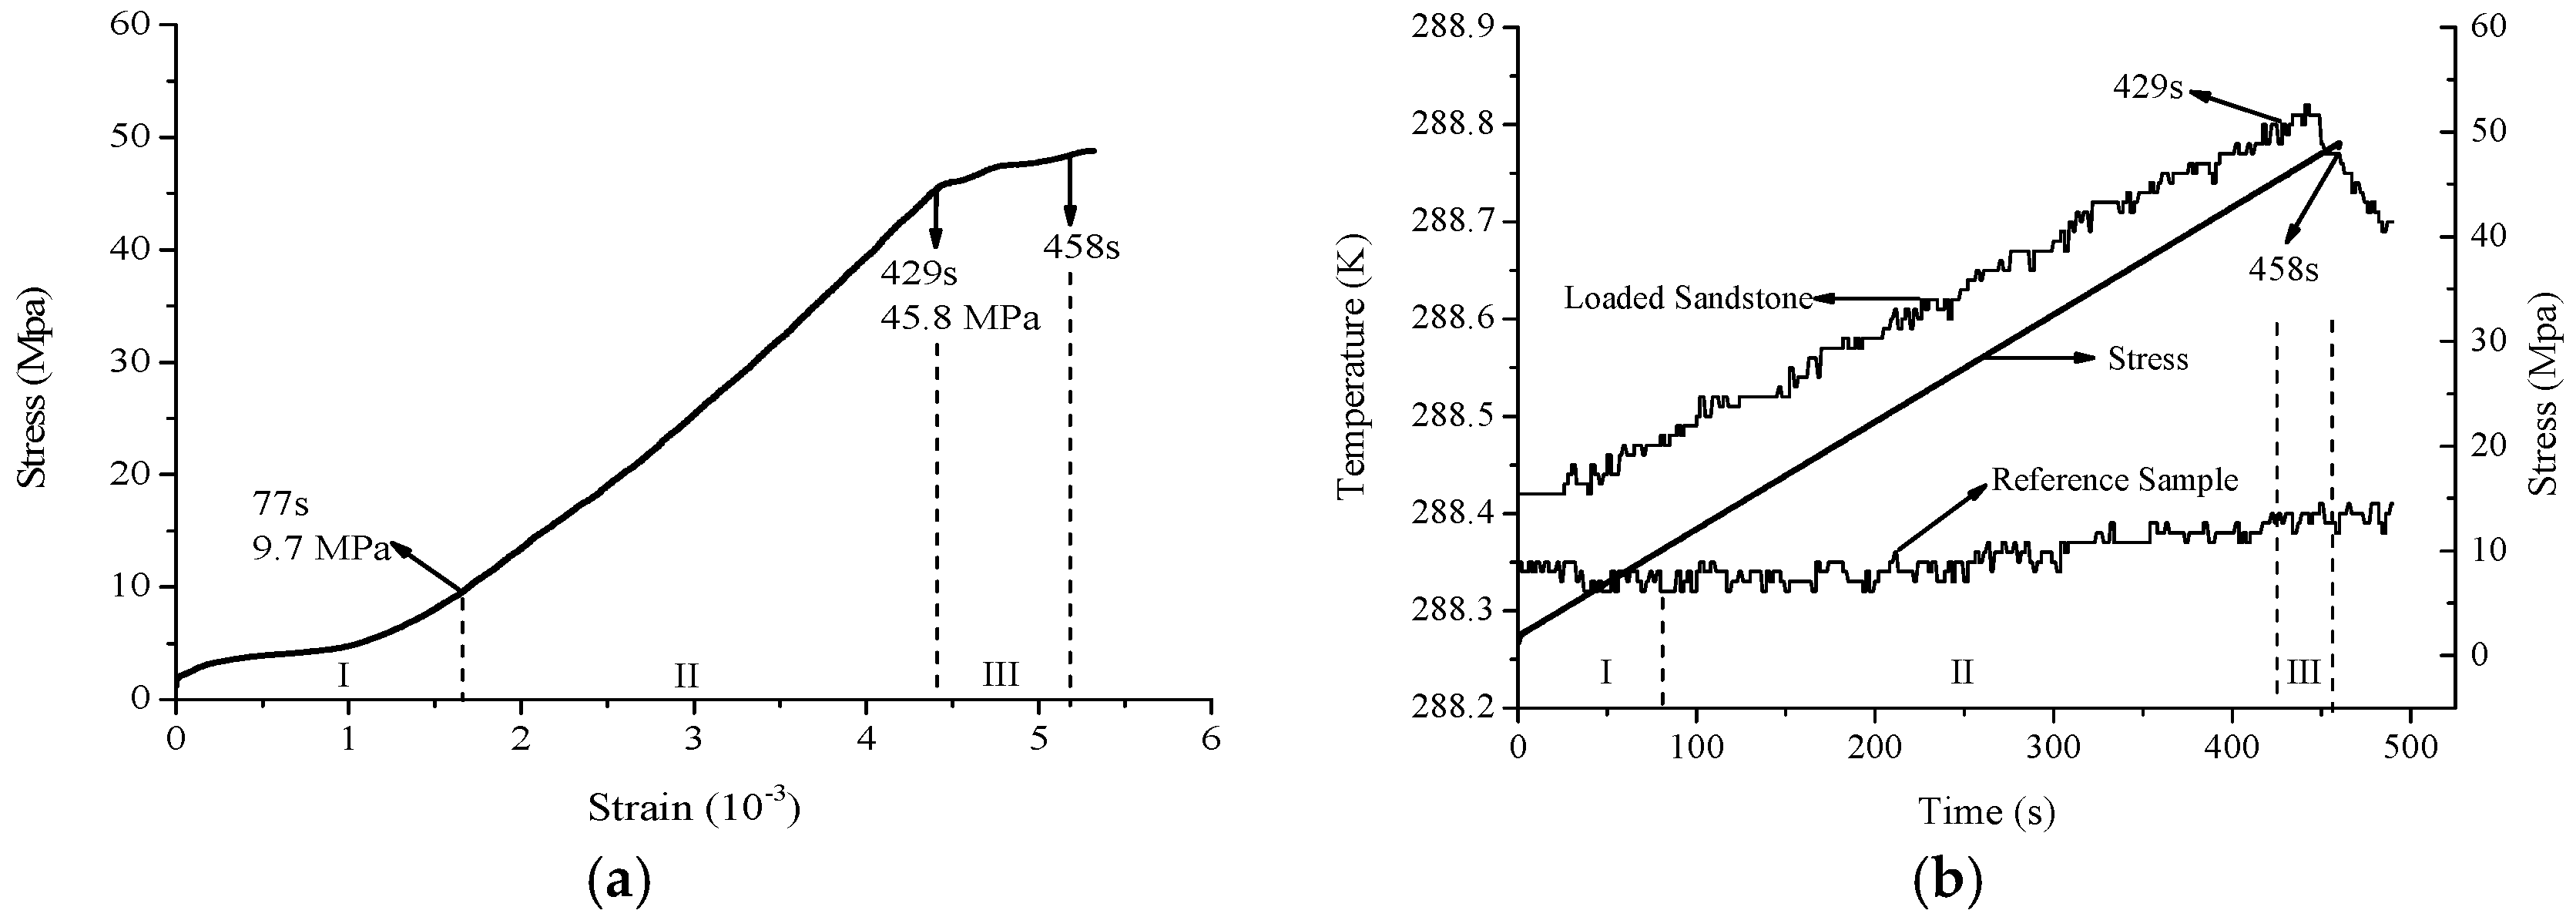
First, the L0(λ) of sy20-3 in the observation area (the red area in Figure 3a) was recorded by the spectrometer directly before the formal loading experiment. According to the measured L0(λ), Ts and Ldwr(λ), the static emissivity can be calculated by Equation (4).
The pre-load spectral radiance curve is plotted as the upper black curve in Figure 3b. The absorption valleys in the range of 8.0–10.0 μm correspond to the RF waveband of the ε(λ) for quartz sandstone (plotted as the thin curve in Figure 3b). A relatively lower emissivity in the RF waveband can result in a stronger reflected influence from instrumental noise and water vapor, leading to the fluctuant L0(λ) curve [50,51]. To reduce the impact of noise and extract the radiance increment more accurately, a wavelet de-noising method was performed, and the sym5 wavelet basis function was selected [47,60]. The standard deviation between the original and de-noised radiance was less than 0.005 W·m−2·μm−1·sr−1, indicating that the de-noised radiance could be used for further analysis.
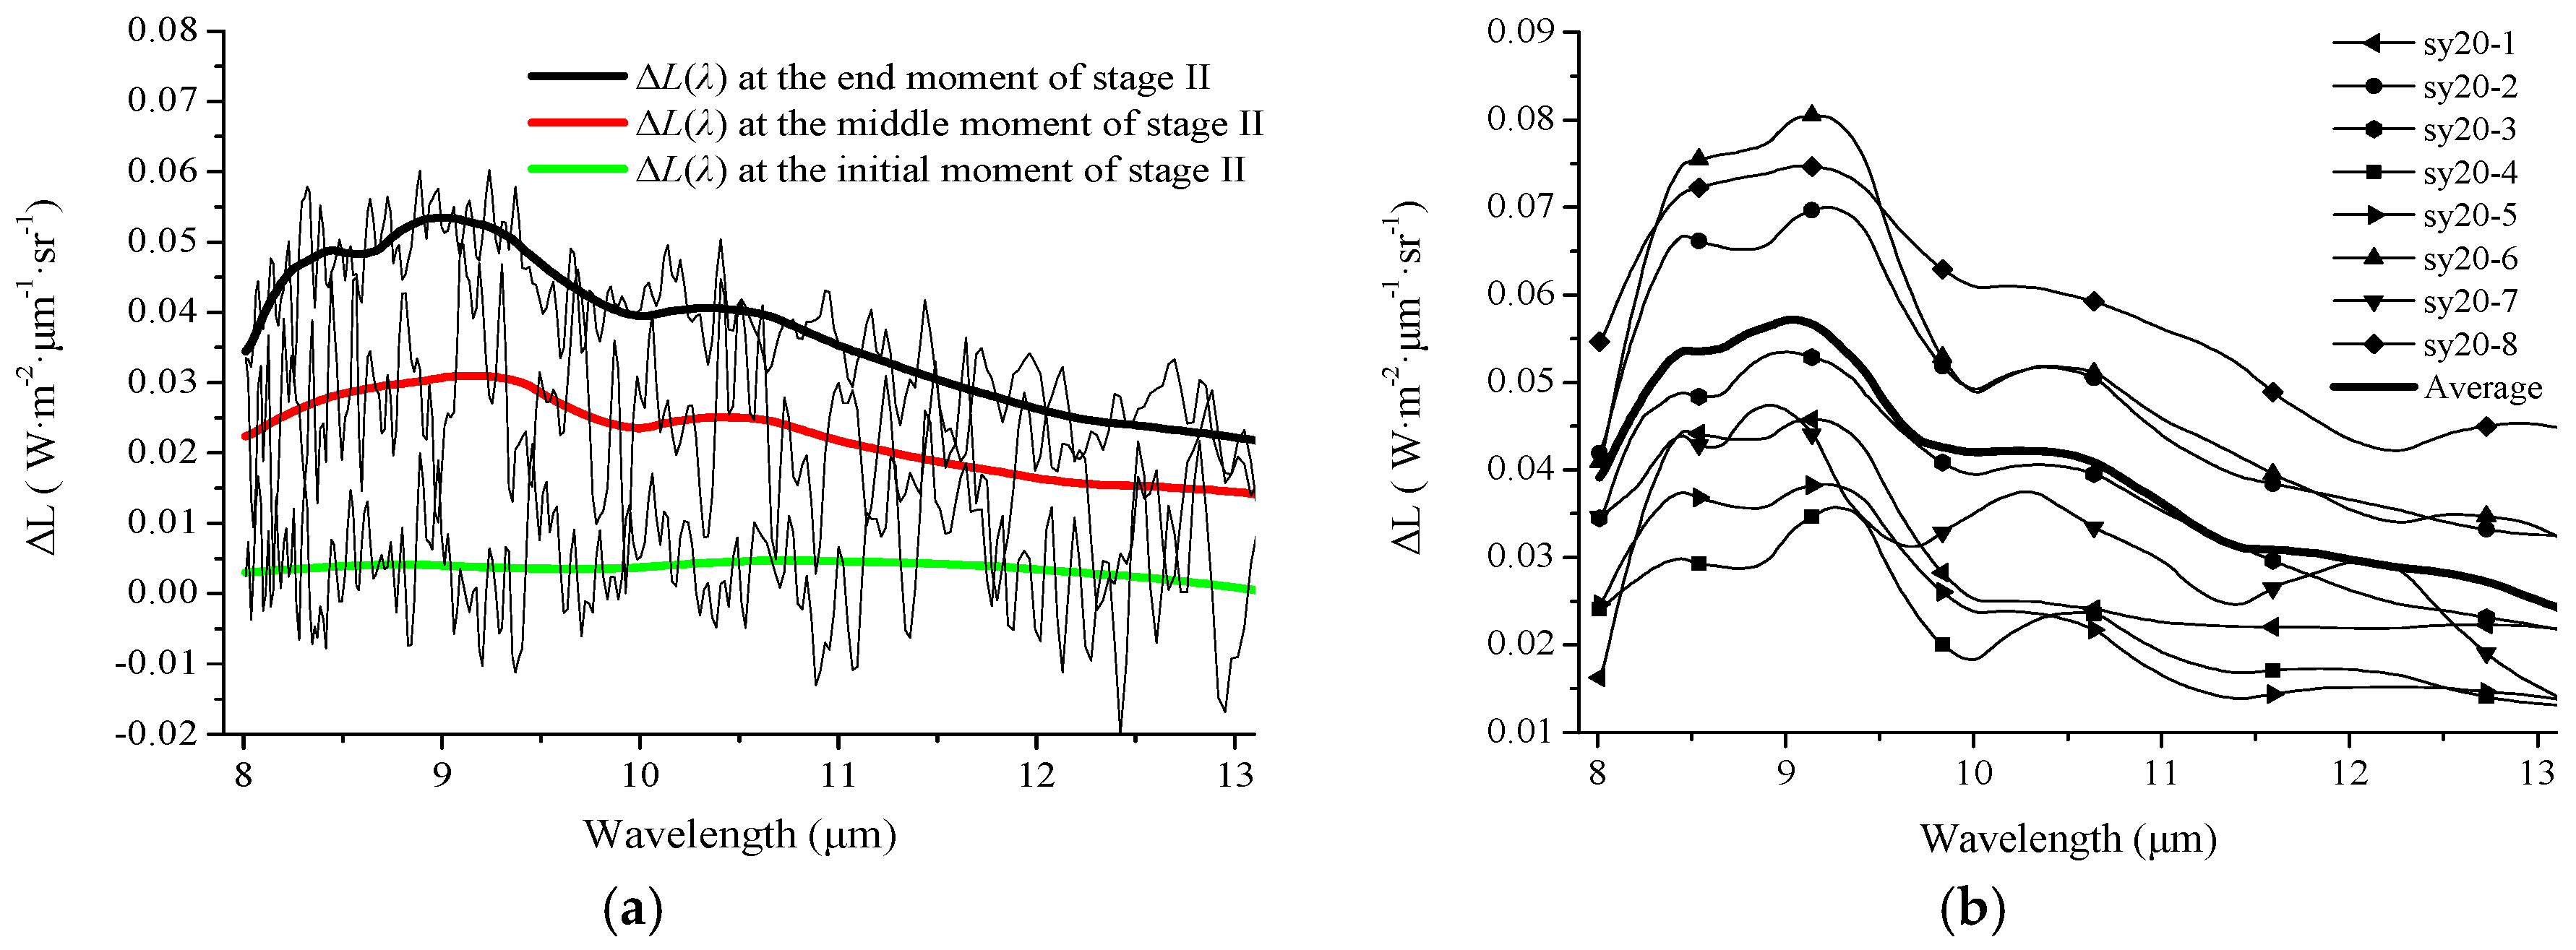
According to the strain result (with the value about 5 × 10⁻³), it can be calculated that the displacement of the loaded specimen was about 1 mm in stage II. The slight change was difficult to be observed by the photo, but led to the changes in radiance. The radiance at the initial moment of stage II of sy20-3 was selected as the reference, and the radiance increment curves at different moments of stage II were calculated and plotted in Figure 4a. The original curves were fluctuant due to the noise, and thus the wavelength features were submerged. After the wavelet de-noising analysis, the radiance increments presented smooth curves with wavelength features (see the thick curves in Figure 4a). With the development of the stress level, the radiance increased, and the values of the increment were different at different wavelength. The overall trend of the radiance increment was upward in the 8.0–9.0 μm range and downward in the 9.0–13.0 μm range at the end of the elastic stage, reaching the maximum value of 0.053 W·m−2·μm−1·sr−1 at 9.0 μm. The amplitude of the radiance increment was relatively large in the RF waveband.
Repeated results for all eight samples during stage II are plotted in Figure 4b. The amplitudes and local trends of these eight curves were discrete, but the overall trends are similar. To quantitatively assess the similarity of these curves, the similarity coefficients between the eight curves and the average curve of these curves were calculated. Then, a significance test was performed. The results listed in Table 2 show that the similarity coefficients satisfied the highly significant testing with a threshold of t0.005(6) = 0.87, and the maximum value can be 0.95. Therefore, the average radiance increment curve (see the thick black curve in Figure 4b) can be used to analyze the radiance variation features of sandstone samples during the elastic stage. Figure 4b illustrates that stress change can lead to radiance variation throughout the entire wavelength range, with different amplitudes at different wavelengths. In addition, the local peak in the 8.0–10.0 μm range indicates that the radiance in the RF waveband of sandstone was more sensitive to stress.
3.3.2. Calculated Results of ΔLT(λ)
The results in Section 3.2 and Section 3.3.1 showed that both the surface temperature and the radiance increased during the loading process. Without considering the emissivity change, the radiance change related to the temperature change, defined as ΔLT(λ), is analyzed as follows.
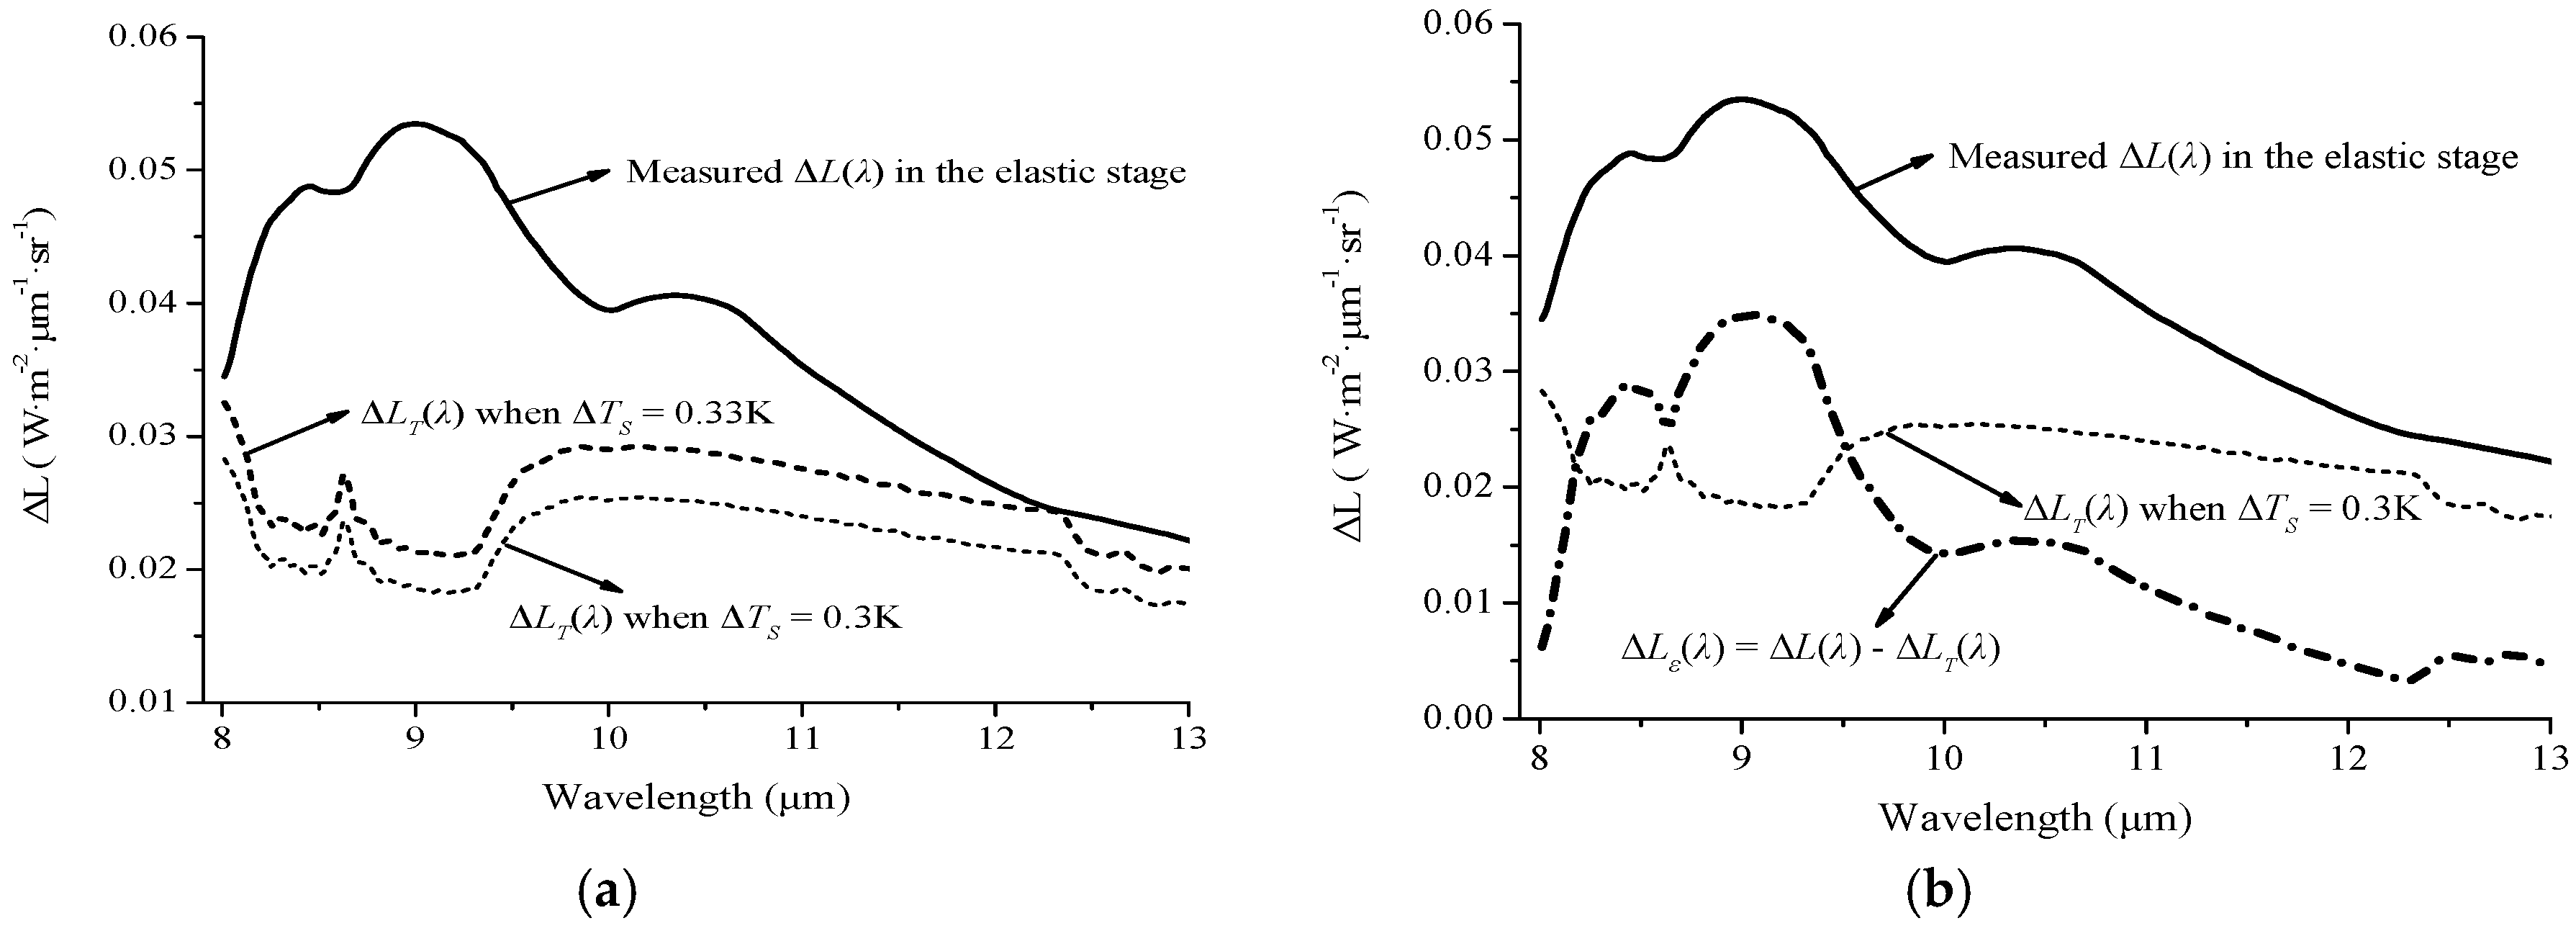
According to Equation (6), ΔLT(λ) can be calculated based on ε(λ), the initial surface temperature Ts, and the temperature variation ΔTs. ΔTs can be adjusted step-by-step to obtain a result for ΔLT(λ) (see the dashed curves in Figure 5a) that closely matches the measured radiance increment curve, ΔL(λ) (see the solid curve in Figure 5a). The ΔLT(λ) curves with different values of ΔTs indicated that slight temperature changes can lead to changes in the amplitude of radiance but have little effect on the wavelength features. There was an intersection point between these two curves at 12.3 μm with the maximum fitting results of ΔLT(λ), where ΔTs = 0.33 K. Figure 5a illustrates the following: (1) The ΔL(λ) curve was higher than the ΔLT(λ) curve for the entire wavelength range, and the differences between these two curves are different at different wavelengths; (2) the trends of these two curves in the 8.0–10.0 μm range were opposite; the ΔL(λ) curve forms an ‘M’ shape, whereas the ΔLT(λ) curve formed a ‘W’ shape; and (3) the decreasing rates were different in the range of 10.0–13.0 μm.
The calculated ΔLT(λ) results according only to the temperature change were not consistent with ΔL(λ) in terms of the amplitude, shape, increasing rate, and waveband feature. Therefore, the assumption of constant emissivity is invalid. Both the surface emissivity and the temperature are expected to change during the loading process.
3.4. Variation in ε(λ)
3.4.1. Waveband Features of Δε(λ)
Equation (7) showed that the measured radiance variation is composed of ΔLT(λ) and ΔLε(λ) and that ΔLT(λ) cannot completely match the variation features of ΔL(λ). Therefore, the ΔLε(λ) of sy20-3 was calculated and plotted as the dot-dashed line in Figure 5b. (1) There were different positive amplitudes of ΔLε(λ) throughout the 8.0–13.0 μm range with a trend similar to that of ΔL(λ); (2) the value of ΔLε(λ) was greater than that of ΔLT(λ) in the 8.2–9.5 μm range but less than that of ΔLT(λ) in other wavelength ranges. As ΔLε(λ) is related to both the temperature variation and emissivity variation, it is necessary to analyze the variation trend of Δε(λ) during the loading process.
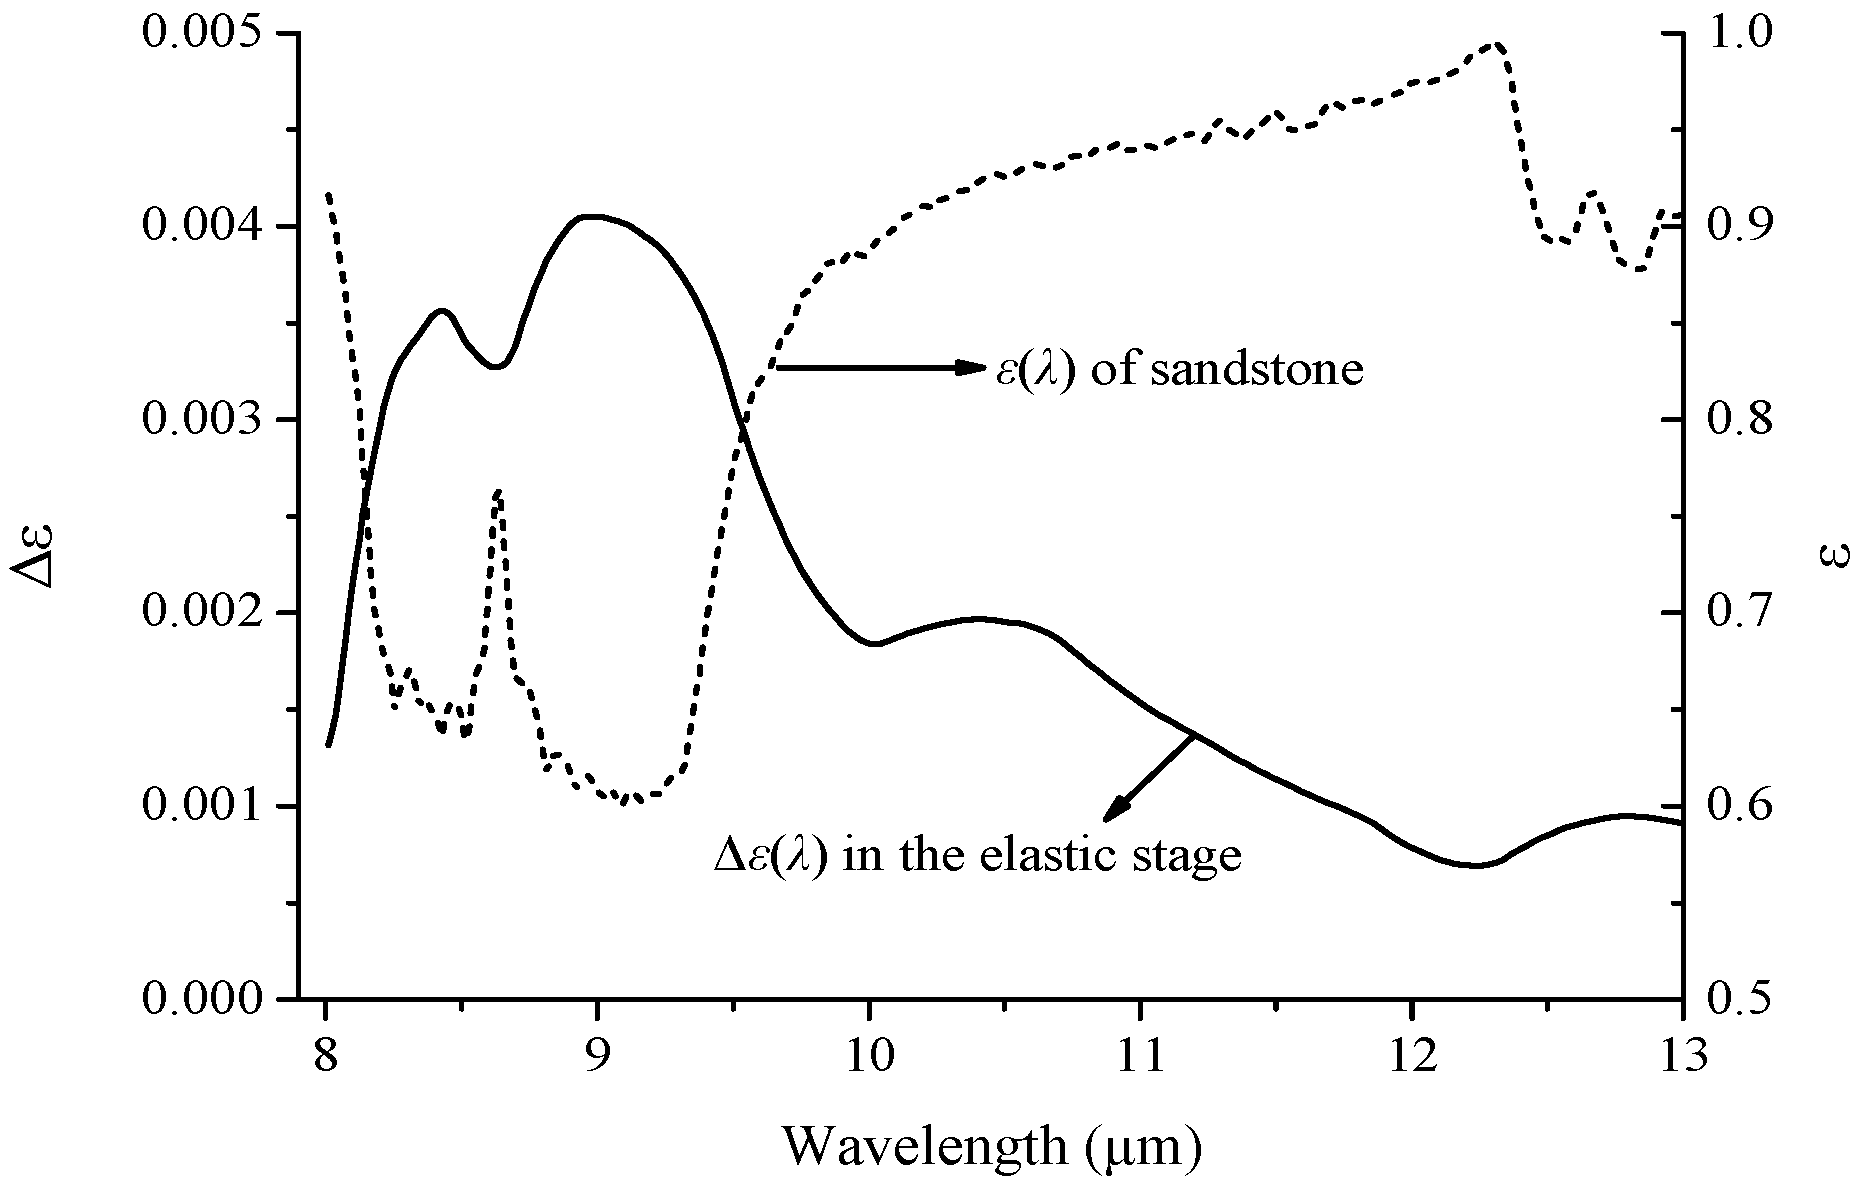
The emissivity variations of all eight samples and the average value were calculated by Equation (8). The average emissivity variation curve, Δε(λ), which represents the emissivity change for sandstone during the elastic stage, is plotted in Figure 6 (see the solid curve). Compared to the ε(λ) curve (see the dashed curve), the following conclusions were reached:
- (1)
- The value of Δε(λ) was positive, and the amplitude varied with wavelength for the entire wavelength range. The curve reaches a local peak in the range of 8.0–10.0 μm and a global maximum with a value of 4.2 × 10⁻³ at 9.0 μm.
- (2)
- The trends of these two curves were opposite, and the local peaks on the Δε(λ) curve corresponded to local valleys on the ε(λ) curve.
- (3)
- The amplitude range of Δε(λ) was approximately 7 × 10⁻⁴–4.2 × 10⁻³ in the 8.0–13.0 μm range, and the average value is 2.3 × 10⁻³. Combined with the compressive strain data during the elastic stage, the strain value of sy20-3 was 0.28%, and the average strain of the eight samples was 0.26%. The magnitude of the strain change was consistent with that of Δε(λ).
The magnitude of the emissivity change, 10−3, was much lower than that of the temperature change, 10−1. Thus, the radiance change caused by the slight emissivity change cannot be neglected. It is unreasonable to invert the stress condition only according to the temperature change.
3.4.2. Correlation Analysis between Δε(λ) and Stress
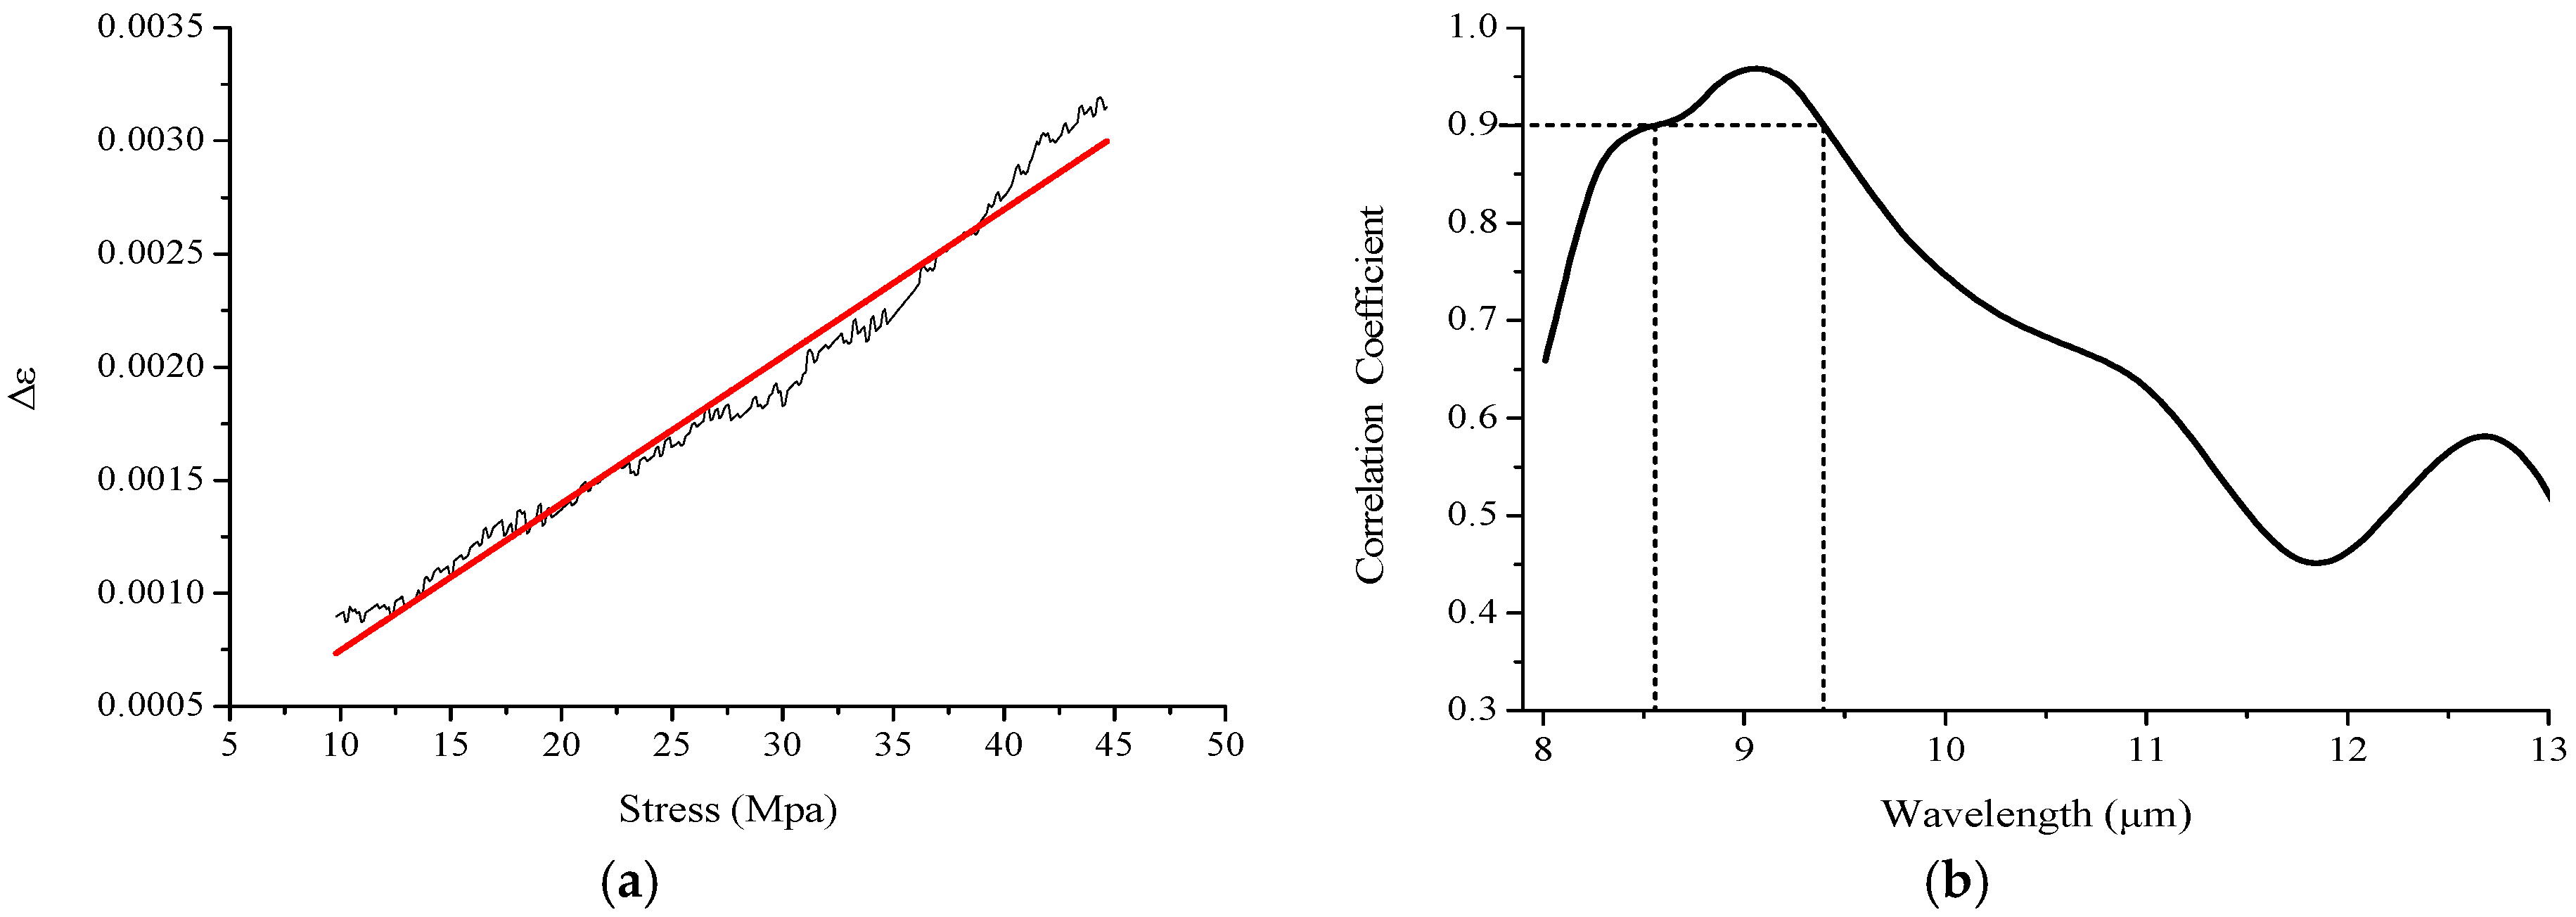
Figure 2b and Figure 4a illustrate the evaluation of both the temperature and radiance changes as a function of stress. Thus, it can be inferred that there was a correlation between Δε and the stress change (Δσ) as well. According to Figure 5a, the Δε(9.0) (the emissivity variation at 9.0 μm) of sy20-3 was calculated by Equation (8). The original Δε(9.0) curve (see the black curve in Figure 7a) increased as the Δσ increased linearly with fluctuations. The linear fitting result is plotted as the red line in Figure 7a, and the correlation coefficient was 0.97.
Then, the correlation analysis between Δε and Δσ was expanded to the entire wavelength range. The average correlation coefficient curve for all eight samples, r(λ), is plotted in Figure 7b. The trend of r(λ) was similar to that of Δε(λ), and the value of r(λ) is greater than 0.7 in the range of 8.1–10.3 μm and greater than 0.9 in the range of 8.6–9.4 μm, with a maximum value of 0.96 at 9.0 μm.
Therefore, it can be confirmed that the emissivity change in the RF wavelength range was more sensitive to the stress change with larger amplitude and higher linear correlations, thereby leading to the sensitive waveband of radiance change during the loading process.
4. Discussion
4.1. Explanation of the Temperature and Emissivity Changes during the Elastic stage
4.1.1. Factors Causing Temperature Change
Based on previous studies, 6 factors can cause temperature changes during the rock loading process: the thermoelastic effect [25,45,47,61], f1(t); porous gas release and escape behavior, f2(t); fracturing behavior of the rock, f3(t); friction heating, f4(t); heat transfer, f5(t); and environmental radiation, f6(t), where t is time [20,21]. Therefore, the temperature change, ΔTs, can be expressed by the following:
ΔTs = f1(t) + f2(t) + f3(t) + f4(t) + f5(t) + f6(t)
As this study focused on the temperature change in the elastic stage and the experimental condition was relatively stable during the loading process, the measured temperature change is mainly related to the stress change, f1(t).
In fact, temperature is defined as the intensity of a large number of molecular thermal irregular movements at the micro scale, which represents the disordered kinetic energy of the molecules constituting the body [62,63]. Therefore, the temperature change caused by stress change can be explained as follows. (1) The distribution of the molecules changes from static disordered motion to an ordered condition in the loading condition, thereby leading to a decrease in the entropy of the molecular motion system; (2) the internal friction between molecules can lead to conversion from kinetic energy to thermal energy. Thus, the stress change can lead to a change in physical temperature.
4.1.2. Factors Causing Emissivity Change
The emissivity in TIR is influenced by two types of factors [64,65,66]. (1) The basic wavelength feature of emissivity is mainly determined by the fundamental vibrational frequency of the molecules of the mineral components [42,43,44]. Thus, the spectral features of the emissivity curves differ for different types of rocks and minerals. For quartz sandstone, the absorption valley (reststrahlen features) in the 8.0–10.0 μm range of emissivity was caused by the stretching and bending motions in the silicon-oxygen (Si-O) anions [53,54]. The change in the micro factor can be expressed as f7(t). (2) The local wavelength feature of emissivity is also affected by factors such as surface roughness and morphology, particle size, and observation condition [59,64,65,66]. The change in the macro factor can be expressed as f8(t). Thus, the change in emissivity in the loading process can be expressed as follows:
Δε(λ) = f7(t) + f8(t).
As there were no obvious changes in surface roughness and morphology during the elastic stage, f8(t) can be ignored. For f7(t), it has been found that stress change can lead to changes in internal structure and the dielectric constant, resulting in a change in emissivity of microwave radiation [47]. For TIR emissivity, the absorption strength of emissivity is determined by the magnitude of the instantaneous dipole moment of the molecules in the mineral at the micro scale [67]. The instantaneous dipole moment is defined as the product of the quantity of electric charges and the distance between the center of positive and negative charges in a molecule. A greater magnitude of the instantaneous dipole moment variation can lead to larger absorption strength. When the rock is in the compressed loading condition, the change in the interaction force condition can lead to a decrease in the distance between inner molecules and the lattice bond (see the strain result in Figure 2a), and a change in transition probability. The stress change can activate the TIR radiance from the rock surface. And the excess mechanical energy deposited during p-hole recombination into the newly born O.-O. bonds. Additionally, the energy of this transition for O3Si/OO\SiO3 in amorphous SiO2 is determined by high-level quantum mechanical properties, resulting in a change in radiation [36,37,38,39,68]. The changes in the absorption strength and transition probability of the molecule result in the change in emissivity at a macro scale.
It should be noted that, the position of the Christiansen feature (CF) of andesine anorthosite changed linearly from 8.13 μm (1230 cm−1) to 8.33 μm (1200 cm−1) with increasing pressure of 50 Gpa [54]. It can be inferred that the stress change of 40 Mpa in our experiment can lead to the shift of 3 × 10⁻² cm−1. It is difficult to find the position shift with the wavenumber resolution of 4 cm−1.
In summary, in the loading condition, a change in molecular thermal motions can lead to a change in temperature, thus resulting in a change in radiance intensity. In addition, the change in emissivity can lead to a change in spectral features. The combination of temperature changes and emissivity changes resulted in the radiance variation for loaded rock. The spectral effect of Δε(λ) was the main factor leading to the sensitive waveband of the radiance variation curve for loaded rock.
4.2. Significance of the Experimental Results
This study demonstrated a linear change in surface emissivity with stress in the rock loading process, in addition to the temperature change observed in previous studies. Compared to the conventional non-contact thermoelastic stress analysis (TSA) method based on the temperature change in the stable experimental condition [61,62,63], the stress-induced emissivity variation generates a robust signal from the complex temperature change and variable environment.
Figure 5b and Figure 6 illustrate that there are waveband features of the Δε(λ) caused by stress change. The radiance in the RF waveband was mainly attributed to the emissivity change. By contrast, the radiance change at the other wavelength (such as 12.3 μm) was mainly related to the temperature change, and its influence on the emissivity change can be ignored. Therefore, it was possible to extract the emissivity variation information according the different waveband features. The experimental studies showed that the stimulated infrared emission from loaded rock could be used as the stress assessing indicator with the “hot-band” features [36,37,38]. Furthermore, based on the relationship between the emissivity variation and stress, a new stress-detection method could be established independent of changes in the ambient temperature for loaded rocks in the experimental condition.
4.3. The Difficulty
However, it remains difficult for extending the experimental results to the wider scale for satellite RS purposes. The following aspects should be considered:
- (1)
- The emissivity change caused by the stress belonged to a weak signal with a magnitude of 10−3 in the elastic stage of rock, which was difficult to be detected based on the radiance and emissivity resolution of the satellite sensor presently. Although some sophisticated algorithms have been developed for extracting the weak TIR anomalies from a relatively strong background [69,70,71,72,73], it remains difficult to obtain the accurate emissivity variation caused by crustal stress.
- (2)
- In the experimental condition, the distance between the spectrometer and the specimen was in the level of meters. However, for satellite observations, the orbit height is about several hundred kilometers. The influence of the atmosphere effect is inevitable and the components of the received radiance are more complex.
- (3)
- In the experimental condition, the observation area was relatively small. There is only one type of rock in the area, and the component of the target is homogeneous. Meanwhile, the stress condition was single. In comparison, because of the spatial resolution for satellite observation, the mixed pixels contain the multiple types of rocks, and the distribution of the crustal stress condition is complex and not uniform. It is difficult to establish the relationship between complex stress condition and emissivity.
Therefore, extending the experimental results to a wider scale for crustal stress detecting from satellite RS observations remains challenging.
5. Conclusions
According to the previous studies on the thermal infrared radiance observations for loaded rock [17,35,36,41,45], this study described here focused on changes in emissivity for elastic loaded quartz sandstone under outdoor conditions and reached the following conclusions:
- (1)
- Both temperature and emissivity changed under the loading conditions. The radiance change caused by the slight emissivity change should be considered in addition to the radiance change caused by temperature change during the loading process.
- (2)
- There were certain waveband features for the emissivity variation, leading to the sensitive waveband of radiance change. The amplitude of the emissivity variations was relatively large in the 8.0–10.0 μm (RF) range and reached a maximum at 9.0 μm.
- (3)
- An obvious linear correlation existed between the emissivity change and the stress change in the 8.6–9.4 μm range. The magnitude of the emissivity change was consistent with that of the strain change during the elastic stage.
The experimental results provide an experimental foundation for crustal stress field monitoring. Although crustal stress field monitoring via RS remains difficult and challenging, this work is still worthy of exploration.
Author Contributions
All of the authors contribute extensively to the present paper. S.L. and L.W. conceived and designed the experiments; J.H., Q.N. and Z.Y. helped performed the experiments; S.L., J.H. and X.G. processed and analyzed the data; J.H. wrote the original draft; S.L. and J.H. revised the manuscript extensively.
Acknowledgments
The authors thank W. Wadsworth for his assistance with the spectrometric analysis and K. Zhao, Northeast Institute of Geography and Agro-ecology, Chinese Academy of Sciences, for his help with the experimental design. This work was supported by the National Natural Science Foundation of China under grant 41771404.
Conflicts of Interest
The authors declare no conflicts of interest.
References
- Gorny, V.I.; Sal’Man, A.G.; Tronin, A.A.; Shilin, B.V. Outgoing infrared radiation of the earth as an indicator of seismic activity. Proc. Acad. Sci. USSR 1988, 301, 67–69. [Google Scholar]
- Qiang, Z.J.; Xu, X.D.; Ning, C.G. Abnormal infrared thermal of satellite-forewarning of earthquakes. Chin. Sci. Bull. 1990, 35, 1324–1327. (In Chinese) [Google Scholar]
- Tronin, A.A.; Molchanov, O.A.; Biagi, P.F. Thermal anomalies and well observations in Kamchatka. Int. J. Remote Sens. 2004, 25, 2649–2655. [Google Scholar] [CrossRef]
- Ouzounov, D.; Bryant, N.; Logan, T.; Pulinets, S.; Taylor, P. Satellite thermal IR phenomena associated with some of the major earthquakes in 1999–2003. Phys. Chem. Earth 2006, 31, 154–163. [Google Scholar] [CrossRef]
- Ouzounov, D.; Liu, D.F.; Kang, C.L.; Cervone, G.; Kafatos, M.; Taylor, P. Outgoing long wave radiation variability from IR satellite data prior to major earthquakes. Tectonophysics 2007, 431, 211–220. [Google Scholar] [CrossRef]
- Wu, L.X.; Liu, S.J. Remote Sensing Rock Mechanics and Earthquake Thermal Infrared Anomalies; InTech: Vukovar, Croatia, 2009; pp. 709–741. [Google Scholar]
- Tronin, A.A. Satellite remote sensing in seismology. A review. Remote Sens. 2010, 2, 124–150. [Google Scholar] [CrossRef]
- Wu, L.X.; Qin, K.; Liu, S.J. GEOSS-based thermal parameters analysis for earthquake anomaly recognition. Proc. IEEE. 2012, 100, 2891–2907. [Google Scholar] [CrossRef]
- Piroddi, L.; Ranieri, G. Night Thermal Gradient: A New Potential Tool for Earthquake Precursors Studies. An Application to the Seismic Area of L’Aquila (Central Italy). IEEE J. Sel. Top. Appl. Earth Obs. Remote Sens. 2012, 5, 307–312. [Google Scholar] [CrossRef]
- Piroddi, L.; Ranieri, G.; Freund, F.T.; Trogu, A. Geology, tectonics and topography underlined by L’Aquila earthquake TIR precursors. Geophys. J. Int. 2014, 197, 1532–1536. [Google Scholar] [CrossRef]
- Eleftheriou, A.; Filizzola, C.; Genzano, N.; Lacava, T.; Lisi, M.; Paciello, R.; Pergola, N.; Vallianatos, F.; Tramutoli, V. Long-term RST analysis of anomalous TIR sequences in relation with earthquakes occurred in Greece in the period 2004–2013. Pure Appl. Geophys. 2016, 173, 285–303. [Google Scholar] [CrossRef]
- Bhardwaj, A.; Singh, S.; Sam, L.; Bhardwaj, A.; Martín-Torres, F.J.; Singh, A.; Kumar, R. MODIS-based estimates of strong snow surface temperature anomaly related to high altitude earthquakes of 2015. Remote Sens. Environ. 2017, 188, 1–8. [Google Scholar] [CrossRef]
- Chadha, R.K.; Pandey, A.P.; Kuempel, H.J. Search for earthquake precursors in well water levels in a localized seismically active area of reservoir triggered earthquakes in India. Geophys. Res. Lett. 2003, 30. [Google Scholar] [CrossRef]
- Pulinets, S.A.; Ouzounov, D.; Ciraolo, L.; Singh, R.; Cervone, G.; Leyva, A.; Dunajecka, M.; Karelin, A.V.; Boyarchuk, K.A.; Kotsarenko, A. Thermal, atmospheric and ionospheric anomalies around the time of the colima M7.8 earthquake of 21 January 2003. Ann. Geophys. 2006, 24, 835–849. [Google Scholar] [CrossRef]
- Pulinets, S.A. Physical mechanism of the vertical electric field generation over active tectonic faults. Adv. Space Res. 2009, 44, 767–773. [Google Scholar] [CrossRef]
- Geng, N.G.; Cui, C.Y.; Deng, M.D. Remote sensing detection in rock fracture experiment and the beginning of remote sensing rock mechanics. Acta Seismol. Sin. 1992, 14, 645–652. (In Chinese) [Google Scholar]
- Freund, F. Charge generation and propagation in igneous rocks. J. Geodyn. 2002, 33, 543–570. [Google Scholar] [CrossRef]
- Chen, S.Y.; Ma, J.; Liu, P.X.; Liu, L.Q.; Hu, X.Y.; Ren, Y.Q. Exploring the current tectonic activity with satellite remote sensing thermal information a case of the Wenchuan earthquake. Seismol. Geol. 2014, 36, 775–793. [Google Scholar] [CrossRef]
- Luong, M.P. Nondestructive damage evaluation of reinforced concrete structure using infrared thermography. Proc SPIE Int. Soc. Opt. Eng. 2000, 98–107. [Google Scholar] [CrossRef]
- Wu, L.X.; Liu, S.J.; Wu, Y.H.; Wang, C.Y. Precursors for rock fracturing and failure-part I: IRR image abnormalities. Int. J. Rock Mech. Min. Sci. 2006, 43, 473–482. [Google Scholar] [CrossRef]
- Wu, L.X.; Liu, S.J.; Wu, Y.H.; Wang, C.Y. Precursors for rock fracturing and failure-part II: IRRT-curve abnormalities. Int. J. Rock Mech. Min. Sci. 2006, 43, 483–493. [Google Scholar] [CrossRef]
- Ma, J.; Ma, S.P.; Liu, P.X.; Liu, L.Q. Thermal field indicators for identifying active fault and its instability from laboratory experiments. Seismol. Geol. 2008, 30, 363–382. (In Chinese) [Google Scholar]
- Wang, C.L.; Lu, Z.J.; Liu, L.; Chuai, X.S.; Lu, H. Predicting points of the infrared precursor for limestone failure under uniaxial compression. Int. J. Rock Mech. Min. Sci. 2016, 88, 34–43. [Google Scholar] [CrossRef]
- Sun, X.M.; Xu, H.C.; He, M.C.; Zhang, F. Experimental investigation of the occurrence of rockburst in a rock specimen through infrared thermography and acoustic emission. Int. J. Rock Mech. Min. Sci. 2017, 93, 250–259. [Google Scholar] [CrossRef]
- Yang, X.Q.; Lin, W.R.; Tadai, O.; Zeng, X.; Yu, C.H.; Ye, H.C.; Li, H.B.; Wang, H. Experimental and numerical investigation of the temperature response to stress changes of rocks. J. Geophys. Res. Solid Earth 2017, 122, 5101–5117. [Google Scholar] [CrossRef]
- Salami, Y.; Dano, C.; Hicher, P.Y. Infrared thermography of rock fracture. Géotech. Lett. 2017, 7, 36–40. [Google Scholar] [CrossRef]
- Wu, L.X.; Cui, C.Y.; Geng, N.G.; Wang, J.Z. Remote sensing rock mechanics (RSRM) and associated experimental studies. Int. J. Rock Mech. Min. Sci. 2000, 37, 879–888. [Google Scholar] [CrossRef]
- Pappalardo, G.; Perriello, Z.S.; Cubito, A.; Calcaterra, D. InfraRed Thermography proposed for the estimation of the Cooling Rate Index in the remote survey of rock masses. Int. J. Rock Mech. Min. Sci. 2016, 83, 182–196. [Google Scholar] [CrossRef]
- Pappalardo, G.; Mineo, S.; Calcaterra, D. Geomechanical analysis of unstable rock wedges by means of geostructural and infrared thermography surveys. Italian J. Eng. Geol. Environ. 2017, 1, 93–101. [Google Scholar] [CrossRef]
- Frodella, W.; Gigli, G.; Morelli, S.; Lombardi, L.; Casagli, N. Landslide mapping and characterization through Infrared Thermography (IRT): Suggestions for a methodological approach from some case studies. Remote Sens. 2017, 9, 1281. [Google Scholar] [CrossRef]
- Morello, R. Potentialities and limitations of thermography to assess landslide risk. Meas. J. Int. Meas. Confed. 2018, 116, 658–668. [Google Scholar] [CrossRef]
- Cui, C.Y.; Deng, M.D.; Geng, N.G. Rock spectral radiation signatures under different pressures. Sci. Bull. 1993, 38, 1377–1382. (In Chinese) [Google Scholar]
- Yin, J.Y.; Fang, Z.F.; Qian, J.D.; Deng, M.D.; Geng, N.G.; Hao, J.S.; Wang, Z.; Ji, Q.Q. Research on the application of infrared remote sensing in earthquake prediction and its physical mechanism. Earthq. Res China 2000, 16, 140–148. (In Chinese) [Google Scholar]
- Freund, F.T. On the electrical conductivity structure of the stable continental crust. J. Geodyn. 2003, 35, 353–388. [Google Scholar] [CrossRef]
- Freund, F.T. Rocks that crackle and sparkle and glow: Strange pre-earthquake phenomena. J. Sci. Explor. 2003, 17, 37–71. [Google Scholar]
- Freund, F.T.; Takeuchi, A.; Lau, B.W.S.; Al-Manaseer, A.; Fu, C.C.; Bryant, N.A.; Ouzounov, D. Stimulated infrared emission from rocks: Assessing a stress indicator. eEarth 2007, 2, 7–16. [Google Scholar] [CrossRef]
- Freund, F.T.; Kulahci, I.G.; Cyr, G.; Ling, J.; Winnick, M.; Tregloan-Reed, J.; Freund, M.M. Air ionization at rock surfaces and pre-earthquake signals. J. Atmos. Sol. Terr. Phys. 2009, 71, 1824–1834. [Google Scholar] [CrossRef]
- Freund, F.T. Pre-earthquake signals: Underlying physical processes. J. Asian Earth Sci. 2011, 41, 383–400. [Google Scholar] [CrossRef]
- Freund, F.T.; Freund, M.M. Paradox of Peroxy Defects and Positive Holes in RocksPart I: Effect of Temperature. J. Asian Earth Sci. 2015, 114, 373–383. [Google Scholar] [CrossRef]
- Scoville, J.; Freund, F.T.; Bobrovskiy, V. Stress-Activated Infrared Emission from Rock Surfaces in the Thermal Infrared (TIR) Window. In Proceedings of the AGU Fall Meeting, San Francisco, CA, USA, 12–16 December 2016. [Google Scholar]
- Liu, S.J.; Wu, L.X.; Feng, Z.; Xu, Z.Y. Thermal infrared spectral variation and sensitive waveband of quartzy sandstone under pressure. Spectrosc. Spectr. Anal. 2012, 32, 78–82. [Google Scholar] [CrossRef]
- Lyon, R.J.P. Analysis of rocks by spectral infrared emission (8 to 25 microns). Econ Geol. 1965, 60, 715–736. [Google Scholar] [CrossRef]
- Ruff, S.W.; Christensen, P.R.; Barbera, P.W.; Anderson, D.L. Quantitative thermal emission spectroscopy of minerals: A laboratory technique for measurement and calibration. J. Geophys. Res. 1997, 102, 14899–14913. [Google Scholar] [CrossRef]
- Christensen, P.R.; Bandfield, J.L.; Hamilton, V.E.; Howard, D.A.; Lane, M.D.; Piatek, J.L.; Ruff, S.W.; Stefanov, W.L. A thermal emission spectral library of rock-forming minerals. J. Geophys. Res. 2000, 105, 9735–9739. [Google Scholar] [CrossRef]
- Xu, Z.Y.; Liu, S.J.; Wu, L.X.; Feng, Z. Stress-related thermal infrared spectral variation and sensitive waveband of granite. J. Infrared Millim. Waves 2013, 32, 44–49. [Google Scholar] [CrossRef]
- Huang, J.W.; Liu, S.J.; Xu, Z.Y.; Ma, C.Y.; Wu, L.X. Experimental study on the influence of the radiation background on the variation in thermal infrared radiance of loaded rock. Spectrosc. Spectr. Anal. 2018, 38, 4222–4225. [Google Scholar] [CrossRef]
- Liu, S.J.; Xu, Z.Y.; Wei, J.L.; Huang, J.W.; Wu, L.X. Experimental Study on Microwave Radiation from Deforming and Fracturing Rock under Loading Outdoor. IEEE Trans. Geosci. Remote Sens. 2016, 54, 5578–5587. [Google Scholar] [CrossRef]
- Hook, S.J.; Kahle, A.B. The micro Fourier transform interferometer (μFTIR)—A new field spectrometer for acquisition of infrared data of natural surfaces. Remote Sens. Environ. 1996, 56, 172–181. [Google Scholar] [CrossRef]
- Rubio, E.; Caselles, V.; Coll, C.; Valour, E.; Sospedra, F. Thermal-infrared emissivities of natural surfaces: Improvements on the experimental set-up and new measurements. Int. J. Remote Sens. 2003, 24, 5379–5390. [Google Scholar] [CrossRef]
- Salvaggio, C.; Miller, C.J. Methodologies and protocols for the collection of midwave and longwave infrared emissivity spectral using a portable field spectrometer. Proc. SPIE Int. Soc. Opt. Eng. 2001, 4381, 539–548. [Google Scholar] [CrossRef]
- Salisbury, J.W.; D’Aria, D.M. Emissivity of terrestrial materials in the 8–14 μm atmospheric window. Remote Sens. Environ. 1992, 42, 83–106. [Google Scholar] [CrossRef]
- Song, L.S.; Zhao, Z.Z.; Xu, J.B.; Liu, S.M.; Peng, K.J.; Zhao, K. Improvements in land surface temperature retrieval based on atmospheric water vapour content and atmospheric temperature. Int. J. Remote Sens. 2014, 35, 4881–4904. [Google Scholar] [CrossRef]
- Saikia, B.J.; Parthasarathy, G.; Sarmah, N.C. Fourier transform infrared spectroscopic estimation of crystallinity in SiO2, based rocks. Bull. Mater. Sci. 2008, 31, 775–779. [Google Scholar] [CrossRef]
- Johnson, J.R. Thermal infrared spectra of experimentally shocked andesine anorthosite. Icarus 2012, 221, 359–364. [Google Scholar] [CrossRef]
- Feng, J.; Rivard, B.; Rogge, D.; Sánchez-Azofeifa, A. The longwave infrared (3–14 μm) spectral properties of rock encrusting lichens based on laboratory spectra and airborne SEBASS imagery. Remote Sens. Environ. 2013, 131, 173–181. [Google Scholar] [CrossRef]
- Gillespie, A. Land Surface Emissivity. In Encyclopedia of Remote Sensing; Njoku, E.G., Ed.; Springer: New York, NY, USA, 2014; pp. 303–311. ISBN 978-0-387-36698-2. [Google Scholar]
- Ma, L.Q.; Sun, H.; Zhang, Y.; Zhou, T.; Li, K.; Guo, J.S. Characteristics of Infrared Radiation of Coal Specimens under Uniaxial Loading. Rock Mech. Rock Eng. 2016, 49, 1567–1572. [Google Scholar] [CrossRef]
- Sun, H.; Ma, L.Q.; Adeleke, N.; Zhang, Y. Background Thermal Noise Correction Methodology for Average Infrared Radiation Temperature of Coal under Uniaxial Loading. Infrared Phys. Technol. 2017, 81, 157–165. [Google Scholar] [CrossRef]
- Bandfield, J.L. Effects of surface roughness and graybody emissivity on Martian thermal infrared spectra. Icarus 2009, 202, 414–428. [Google Scholar] [CrossRef]
- Wang, J.X.; Tang, X.B. Wavelet denoise method applied in load spectrum analysis of engineering vehicles. Adv. Mater. Res. 2010, 108–111, 1320–1325. [Google Scholar] [CrossRef]
- Thomson, W. On dynamical theory of heat. Philos. Mag. 1852, 4, 424–434. [Google Scholar] [CrossRef]
- Wong, A.K.; Sparrow, J.G.; Dunn, S.A. On the revised theory of the thermoelastic effect. J. Phys. Chem. Solids 1988, 49, 395–400. [Google Scholar] [CrossRef]
- Garinei, A.; Marsili, R. Thermoelastic Stress Analysis of the contact between a flat plate and a cylinder. Measurement 2014, 52, 102–110. [Google Scholar] [CrossRef]
- Osterloo, M.M.; Hamilton, V.E.; Anderson, F.S. A laboratory study of the effects of roughness on the thermal infrared spectra of rock surfaces. Icarus 2012, 220, 404–426. [Google Scholar] [CrossRef]
- Li, T.Z.; Liu, S.J. A Study on the Effects of Roughness on Thermal Infrared Spectral Unmixing of Rock. Spectrosc. Spectr. Anal. 2017, 37, 3051–3057. [Google Scholar] [CrossRef]
- Korb, A.R.; Salisbury, J.W.; D’Aria, D.M. Thermal-infrared remote sensing and Kirchhoff’s law. 2. Field measurements. J. Geophys. Res. 1999, 104, 15339–15350. [Google Scholar] [CrossRef]
- Ricci, D.; Pacchioni, G.; Szymanski, M.A.; Shluger, A.L.; Stoneham, A.M. Modeling disorder in amorphous silica with embedded clusters: The peroxy bridge defect center. Phys Rev B. 2001, 64, 224104–224108. [Google Scholar] [CrossRef]
- Freund, F.; Ouillon, G.; Scoville, J.; Sornette, D. Earthquake precursors in the light of peroxy defects theory: Critical review of systematic observations. arXiv, 2017; arXiv:1711.01780. [Google Scholar]
- Song, D.M.; Zang, L.; Shan, X.J.; Yuan, Y.; Cui, J.Y.; Shao, H.M.; Shen, C.; Shi, H.T. A study on the algorithm for extracting earthquake thermal infrared anomalies based on the yearly trend of LST. Seismol. Geol. 2016, 38, 680–695. [Google Scholar] [CrossRef]
- Tramutoli, V.; Aliano, C.; Corrado, R.; Filizzola, C.; Genzano, N.; Lisi, M.; Martinelli, G.; Pergola, N. On the possible origin of thermal infrared radiation (TIR) anomalies in earthquake-prone areas observed using robust satellite techniques (RST). Chem. Geol. 2013, 339, 157–168. [Google Scholar] [CrossRef]
- Ma, Y.T.; Liu, S.J.; Wu, L.X.; Xu, Z.Y. Two-step method to extract seismic microwave radiation anomaly: Case study of Ms 8.0 Wenchuan earthquake. Earthq. Sci. 2011, 24, 577–582. [Google Scholar] [CrossRef]
- Guo, X.; Zhang, Y.S.; Wei, C.X.; Zhong, M.J.; Zhang, X. Medium wave infrared brightness anomalies of Wenchuan 8.0 and Zhongba 6.8 earthquakes. Acta Geosci. Sin. 2014, 35, 338–344. [Google Scholar] [CrossRef]
- Lu, X.; Meng, Q.Y.; Gu, X.F.; Zhang, X.D.; Xie, T.; Geng, F. Thermal infrared anomalies associated with multi-year earthquakes in the Tibet region based on China’s FY-2E satellite data. Adv. Space Res. 2016, 58, 989–1001. [Google Scholar] [CrossRef]
Figure 1.
Experimental scene: (a) The photo of experimental system under outdoor conditions; (b) the schematic diagram of experimental system.
Figure 1.
Experimental scene: (a) The photo of experimental system under outdoor conditions; (b) the schematic diagram of experimental system.

Figure 2.
Measured stress–strain and temperature results of sy20-3: (a) Stress-strain curve; (b) the temperature curves of loaded and reference sample during the entire loading process and the stress–time curve.
Figure 2.
Measured stress–strain and temperature results of sy20-3: (a) Stress-strain curve; (b) the temperature curves of loaded and reference sample during the entire loading process and the stress–time curve.

Figure 3.
The measured result of sy20-3: (a) A photo of the loaded sample with the arrangement of the probes on the sample surface; (b) pre-load spectral radiance and static emissivity curve in the entire wavelength range.
Figure 3.
The measured result of sy20-3: (a) A photo of the loaded sample with the arrangement of the probes on the sample surface; (b) pre-load spectral radiance and static emissivity curve in the entire wavelength range.

Figure 4.
Spectral radiance increment curves: (a) The ΔL(λ) curves at different moments of stage II in the entire wavelength range; (b) the spectral radiance increment curves and the average radiance curve of all the sandstone samples during stage II.
Figure 4.
Spectral radiance increment curves: (a) The ΔL(λ) curves at different moments of stage II in the entire wavelength range; (b) the spectral radiance increment curves and the average radiance curve of all the sandstone samples during stage II.

Figure 5.
The measured ΔL(λ) curve and the calculated results of ΔLT(λ) and ΔLε(λ) curves of sy20-3: (a) The ΔLT(λ) with different ΔTs; (b) the comparison result of ΔLT(λ) and ΔLε(λ) at the end of elastic stage.
Figure 5.
The measured ΔL(λ) curve and the calculated results of ΔLT(λ) and ΔLε(λ) curves of sy20-3: (a) The ΔLT(λ) with different ΔTs; (b) the comparison result of ΔLT(λ) and ΔLε(λ) at the end of elastic stage.

Figure 6.
Emissivity variation curve at the end of elastic stage and the static emissivity curve of sandstone in the 8.0–13.0 μm range.
Figure 6.
Emissivity variation curve at the end of elastic stage and the static emissivity curve of sandstone in the 8.0–13.0 μm range.

Figure 7.
The correlation analysis results between emissivity variation and stress: (a) The emissivity variation change with stress at 9.0 μm for sy20-3; (b) the average r(λ) for the entire wave range.
Figure 7.
The correlation analysis results between emissivity variation and stress: (a) The emissivity variation change with stress at 9.0 μm for sy20-3; (b) the average r(λ) for the entire wave range.


Table 1.
Environmental temperature of all samples during the loading process.
| Sample No. | Fluctuant Range (°C) |
|---|---|
| sy20-1 | 17.41–17.46 |
| sy20-2 | 15.36–15.21 |
| sy20-3 | 15.20–15.28 |
| sy20-4 | 17.61–17.68 |
| sy20-5 | 18.41–18.48 |
| sy20-6 | 17.41–17.32 |
| sy20-7 | 17.20–17.28 |
| sy20-8 | 17.13–17.03 |
Table 2.
Similarity coefficients of the eight radiance increment curves and the average curve.
| Sample No. | Similarity Coefficient |
|---|---|
| sy20-1 | 0.89 |
| sy20-2 | 0.95 |
| sy20-3 | 0.95 |
| sy20-4 | 0.93 |
| sy20-5 | 0.94 |
| sy20-6 | 0.95 |
| sy20-7 | 0.87 |
| sy20-8 | 0.94 |
© 2018 by the authors. Licensee MDPI, Basel, Switzerland. This article is an open access article distributed under the terms and conditions of the Creative Commons Attribution (CC BY) license (http://creativecommons.org/licenses/by/4.0/).
Share and Cite
MDPI and ACS Style
Huang, J.; Liu, S.; Gao, X.; Yang, Z.; Ni, Q.; Wu, L. Experimental Study of the Thermal Infrared Emissivity Variation of Loaded Rock and Its Significance. Remote Sens. 2018, 10, 818. https://0-doi-org.brum.beds.ac.uk/10.3390/rs10060818
AMA Style
Huang J, Liu S, Gao X, Yang Z, Ni Q, Wu L. Experimental Study of the Thermal Infrared Emissivity Variation of Loaded Rock and Its Significance. Remote Sensing. 2018; 10(6):818. https://0-doi-org.brum.beds.ac.uk/10.3390/rs10060818
Chicago/Turabian StyleHuang, Jianwei, Shanjun Liu, Xiang Gao, Zhengcang Yang, Qiang Ni, and Lixin Wu. 2018. "Experimental Study of the Thermal Infrared Emissivity Variation of Loaded Rock and Its Significance" Remote Sensing 10, no. 6: 818. https://0-doi-org.brum.beds.ac.uk/10.3390/rs10060818
Note that from the first issue of 2016, this journal uses article numbers instead of page numbers. See further details here.