BeiDou Code Pseudorange Precision Estimation and Time Correlation Analysis from Trimble Net-R9 and ComNav 708 Receivers


1
School of Resources and Environmental Engineering, Anhui University, Hefei 230601, Anhui, China
2
Mining Environmental Restoration and Wetland Ecological Security Collaborative Innovation Center, Hefei 230601, Anhui, China
3
School of Remote Sensing and Geomatics Engineering, Nanjing University of Information Science and Technology, Nanjing 210044, China
4
Shanghai Astronomical Observatory, Chinese Academy of Science, Shanghai 200030, China
5
School of Geodesy and Geomatics, Wuhan University, Wuhan 430079, China
*
Author to whom correspondence should be addressed.
Remote Sens. 2018, 10(7), 1083; https://0-doi-org.brum.beds.ac.uk/10.3390/rs10071083
Submission received: 12 June 2018
/
Revised: 30 June 2018
/
Accepted: 5 July 2018
/
Published: 7 July 2018
Abstract
:Stochastic models describe the observation precisions and their correlations with each other and play an important role in reliable global navigation satellite system ambiguity resolution and precise positioning. However, the characteristics of BeiDou Navigation Satellite System (BDS) observations are still not clear at present. In general, the stochastic model used for BDS is based on empirical models from global positioning system (GPS) knowledge in most cases. In this paper, the zero-baseline dual-frequency GPS and BDS data with different sampling intervals are used to evaluate the precision and time correlation of the BDS code pseudorange observations. The results show that the precisions of BDS and GPS code measurements are almost of the same magnitude. However, the standard deviations of BDS measurements are larger than those of GPS measurements. Inclined geostationary orbit observations suffer from periodic error, which has been confirmed to be unaffected by multipath error in this paper. Traditional elevation-dependent models cannot work well for precise positioning for either GPS or BDS because the elevation dependencies of the two carrier frequencies’ pseudorange observations are not the same. Moreover, BDS observations have a significant time correlation, especially for geostationary orbit satellites. The time correlation coefficients are maintained at ~0.63–0.75 for different receiver types. Consequently, the BDS positioning residuals are significantly larger than those of GPS even if the observations have similar precision.
1. Introduction
At end of April 2018, a total of 31 BeiDou satellites including 7 geostationary orbit (GEO), 8 inclined geosynchronous orbit (IGSO), and 18 medium-altitude Earth orbit (MEO) satellites have been launched with transmitting signals on three frequencies: B1 (1561.098 MHz), B2 (1207.14 MHz), and B3 (1268.52 MHz), respectively. However, it is worth mentioning that only 13 operational BeiDou satellites are presently available (5 GEO + 5 IGSO + 3 MEO) for public use. The constellation is unique when compared to the global positioning system (GPS) system, which consists of only MEO satellites. Moreover, it is the first constellation in which all satellites provide code and phase ranging signals on up to three frequencies [1]. The BeiDou system has gained plentiful and substantial achievements in recent years [2,3,4,5,6,7,8,9]. However, the empirical stochastic model used for the GPS system was directly applied to BeiDou, and this model fails to take into account the differences among BeiDou GEO, IGSO, and MEO satellites [10].
As is well known, global navigation satellite system (GNSS) data processing uses a wide-sense stationary stochastic process model that includes (1) the expectation of random variables in a random process as a constant that does not change with time and (2) the variables at different times in a random process as functions of time. In addition, the covariance of a variable is only related to the time interval. In most cases, elevation-dependent models [11,12] have been widely used in positioning and navigation. Reliable ambiguity resolution and precise positioning can be achieved only by using a suitable stochastic model [13]. In addition, the choice of stochastic model is very important for reliability [10,14,15,16]. To improve the stochastic model, signal-to-noise ratio (SNR) models [13,17], time correlation and cross-correlation [18,19,20], and variance component estimation (VCE) [10,21] were studied to improve the accuracy and reliability of positioning. However, in all these models, it was assumed that the precisions of different satellites and observations at different frequencies were equal [22], which is not realistic.
In the BeiDou Navigation Satellite System (BDS), the GEO satellites orbit at an altitude of 35,786 km and are located at 58.75°E, 80°E, 110.5°E, 140°E, and 160°E, respectively. The IGSO satellites orbit at an altitude of 35,786 km and at an inclination of the orbital planes of 55° with reference to the equatorial plane. In this case, for GEO satellites, their elevation angles are almost the same during an observation period; and for IGSO satellites, the elevation angles change much more slowly than those of MEO satellites. In addition, these satellite distribution characteristics make the observation strong in terms of time correlation. If the time correlation is significant, then the ambiguity and coordinates estimation with different time intervals exhibit considerable differences [18]. Jonkman (1998) showed that the influence of time correlation on ambiguity resolution could be significant [23]. Moreover, Tang et al. (2014) pointed out that the code chipping rate on B3 was a factor of 10 greater than those on B1 and B2 [1], which means that the variance of observations at different frequencies is not equal. Wanninger and Beer (2015) and Guo et al. (2016) confirmed that the code variations depend on orbit type, frequency, and elevation [24,25]. For this reason, Li et al. (2017) and Cao et al. (2018) proposed an improved elevation model, in which BeiDou pseudorange variance was artificially increased [26,27]. However, the observation precision of different types of BDS satellite was still based on experience, while its own characteristics were ignored. Therefore, using direct borrowed knowledge from the GPS stochastic model is arbitrary and unreasonable.
To obtain the real characteristics of different types and different frequencies of observations, in this study, single-difference, autocorrelation function, and multipath equation methods are used to analyze the zero-baseline data. The materials and methods are given in Section 2, including the methods of precision estimation and time correlation calculation. Section 3 presents some experiments to analyze the measurement characteristics of different types and different frequencies. Finally, a discussion and conclusions associated with the experimental results and analysis are summarized in Section 4 and Section 5, respectively.
2. Materials and Methods
2.1. Single-Difference Observation Model and Pseudorange Precision Estimation
Though the BeiDou system can provide triple-frequency observations, only dual-frequency signals (B1/B2) can be obtained for most BDS users. The phase and pseudorange observation for a dual-frequency signal can be described as [9,28,29]
where the superscript s and subscript r indicate the satellite and receiver number, respectively, the symbols and are the carrier frequencies of B1 and B2 signals, and are the code and phase observations on frequency i (i = 1, 2, i ≠ j), is the geometric distance between receiver and satellite, c is the speed of light in vacuum, is the receiver clock error, is the satellite clock error, T is the tropospheric delay, I1 is the first-order ionospheric delay on frequency B1, is the wavelength of frequency Bi, Ni is the integer ambiguity, is the receiver code hardware delay (bias) originating in the receiver, is the satellite code hardware delay (bias) originating in the satellite transmitter, is the receiver phase hardware delay (bias), is the satellite phase hardware delay (bias), is the code multipath and code noise, and specifies the phase multipath and phase noise of frequency Bi.
To eliminate or weaken the effects of ionospheric and tropospheric delays, a single-difference combination is used between receivers in this paper. Here the zero-baseline is selected to assess the real precision of code observations [18]. According to Equation (1), the single-difference (SD) observation equations for dual-frequency code observations can be written as
where “” indicates the SD operator; for zero-baseline the geometric vector is zero, and for ionospheric and tropospheric effects, the satellite clock error and satellite code bias are eliminated. Assuming m satellites are simultaneously tracked, the SD observation Equation (2) can be rewritten as
where is the column vector of SD observables, is the coefficient matrix, is the SD observation noise vector, and the superscript si indicates the ith tracked satellite. The other type of SD observation equations for one epoch can be analogously derived.
2.2. Precision Estimation for Observation Types
To evaluate the precision of the BDS code measurement accurately, two receivers of the same type are used. Then the precision of the zero-difference (ZD) code observation can be written as [30]
with being the residual vector of code measurements.
For a single satellite, we assumed that the variance is constant within the scope of a certain elevation angle. The precision of the ZD observation of the jth satellite can be expressed as
where is the residual of the SD measurement of the jth satellite and n is the number of the epoch at a certain elevation angle region. It should be noted that the BeiDou system has three types of satellite. In other words, the variances may have different characteristics for GEO, IGSO, and MEO satellites because of the different observation times, geometric structures, and orbit repeat periods of the different orbit types. Hence the characteristics of different satellites should be considered individually. Therefore, the corresponding stochastic model of the ZD code observation with respect to Equations (4) and (5) can be given as
where is the variance operator and is the jth satellite standard deviation of the code observation at frequency i.
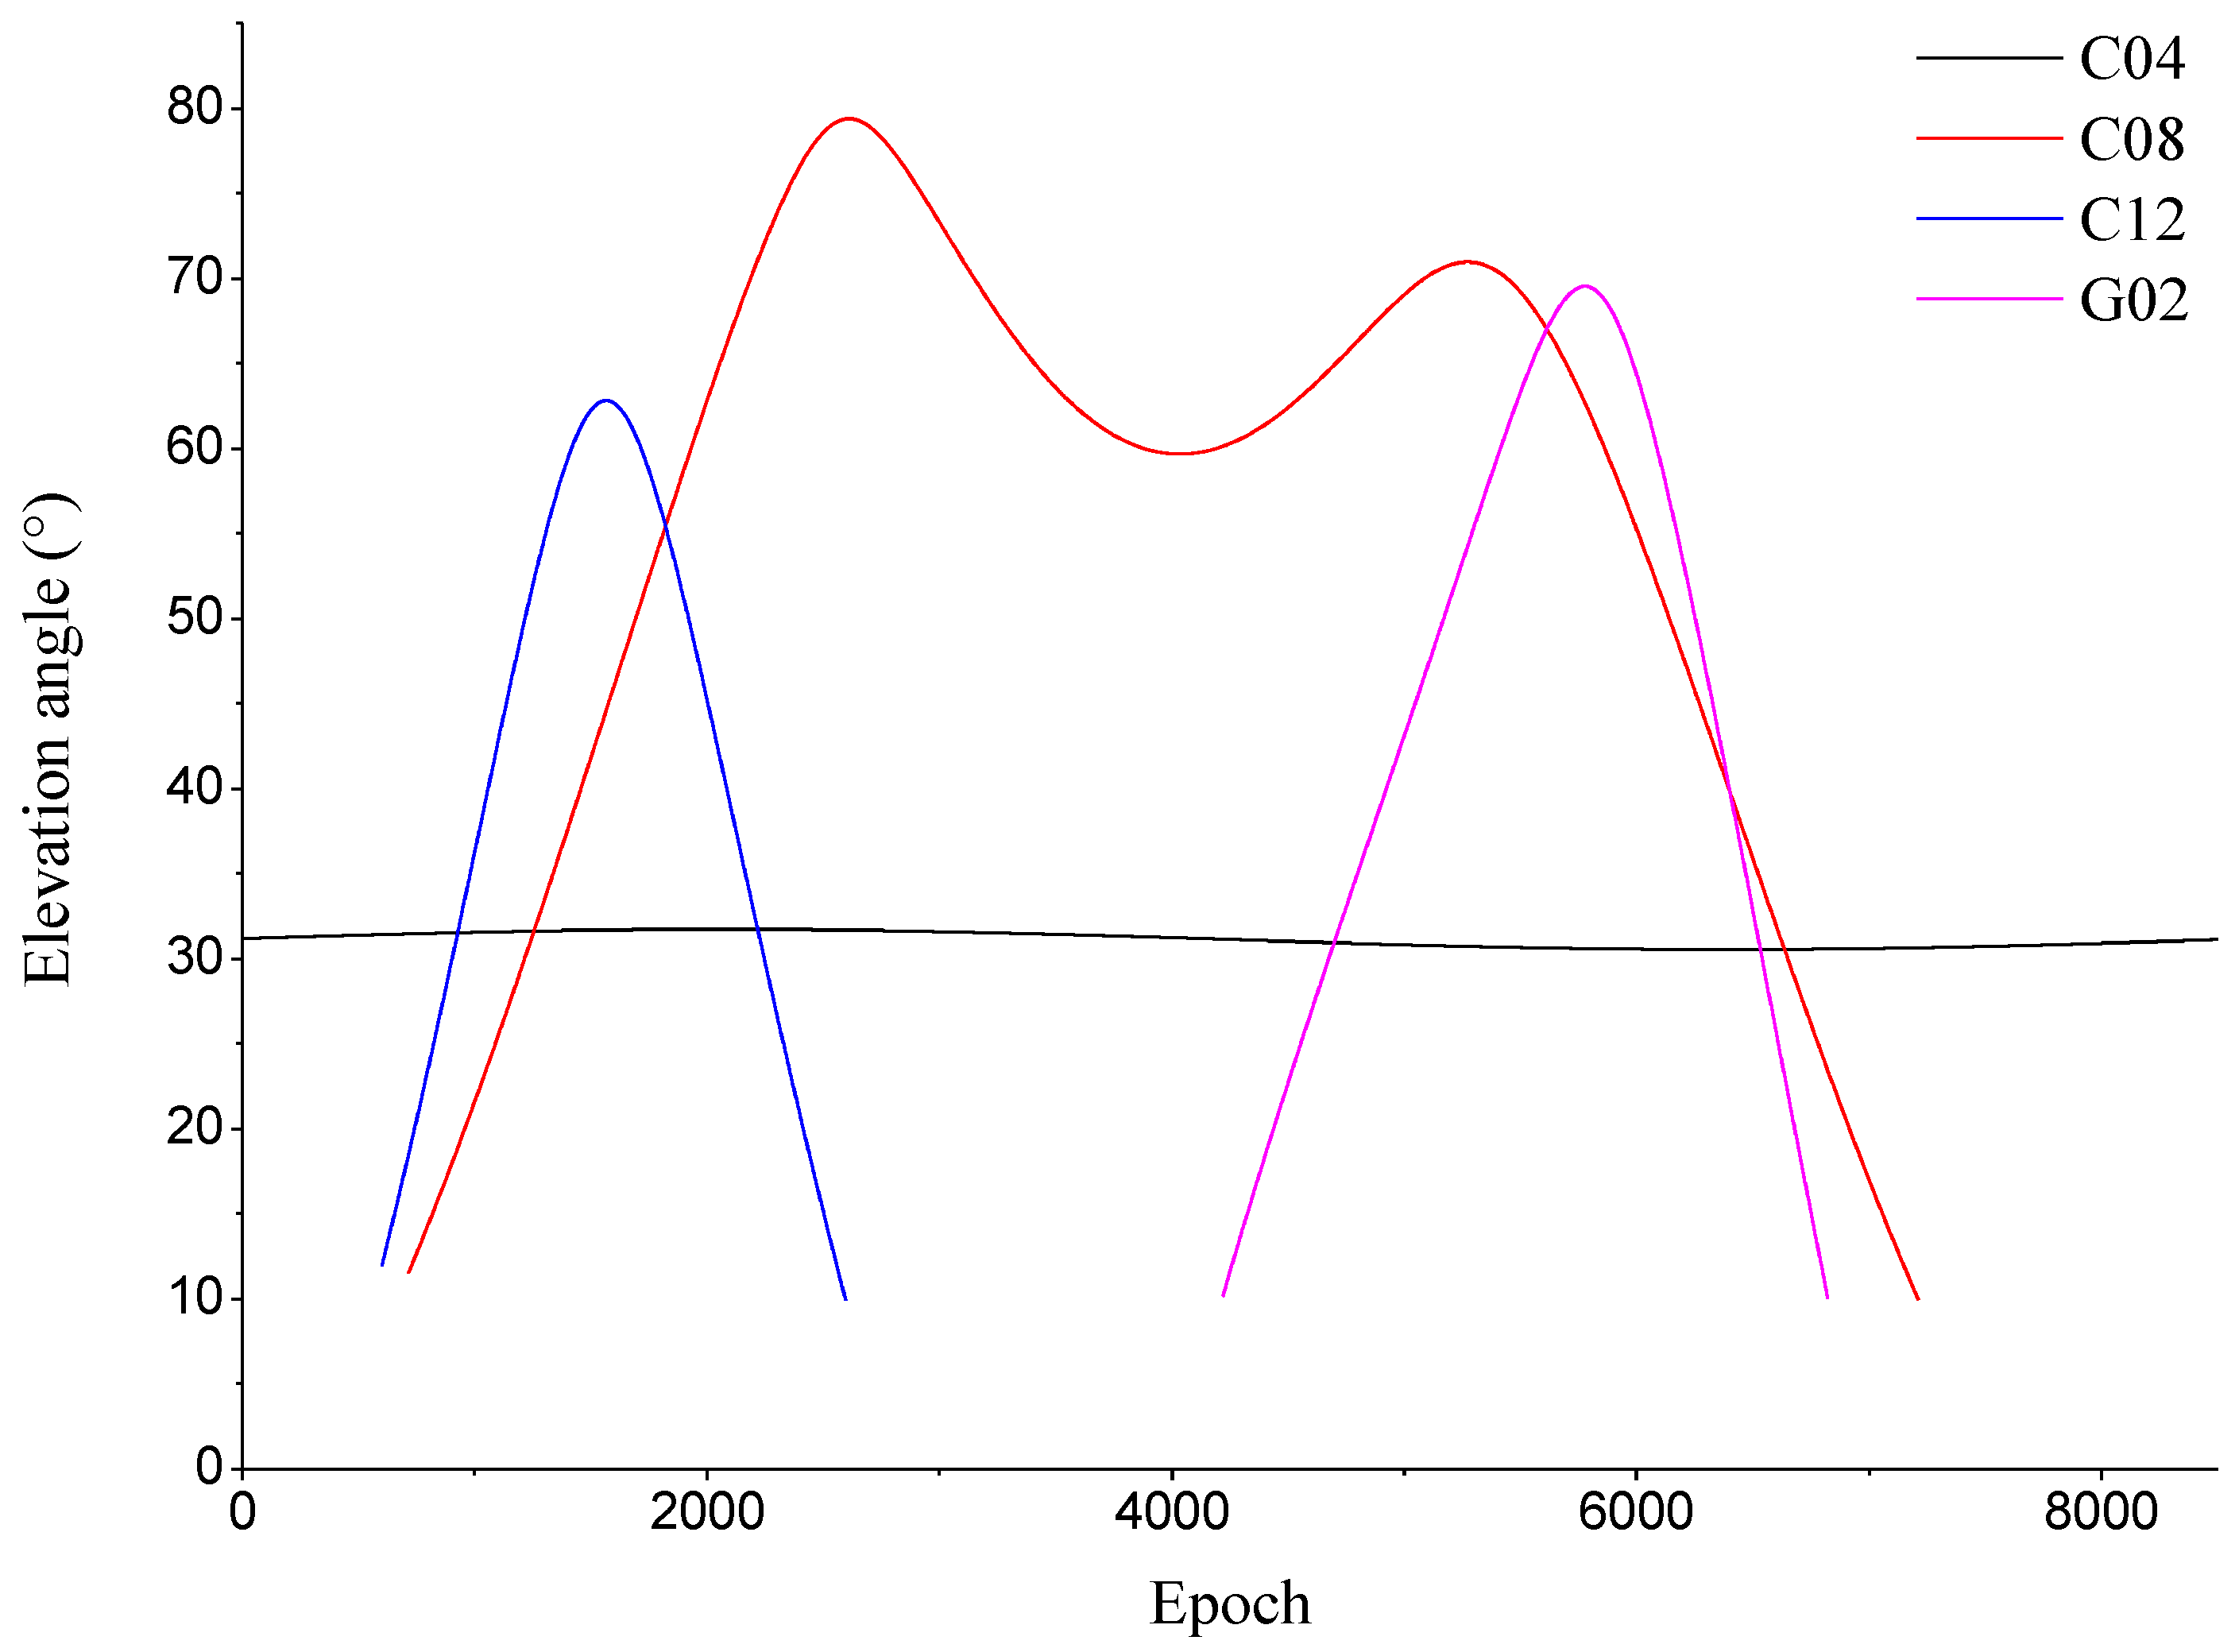
As mentioned before, the speed of GEO and IGSO satellites is significantly less than that of MEO. Figure 1 shows the elevation angle change in a single day, where C04 is a GEO satellite, C08 is an IGSO satellite, C12 is an MEO satellite, and G02 is a GPS satellite with pseudo random noise (PRN) number of 2. As shown in Figure 1, the change in the MEO elevation angle is similar to that of the GPS satellite because they are both MEO satellites. The rate of change in the IGSO satellite elevation angle is much slower than that of the MEO satellite. Moreover, the changes in the elevation angle of the GEO satellite in particular are even smaller. In addition to Equation (6), the time correlation must be considered in the BDS stochastic model.
2.3. Time Correlation Estimation
In the adjustment, the covariance matrix of observations will contribute to the update of the parameters. This matrix includes not just variances but also a relation between all observations, namely, the covariance. In this paper, the correlation between measurements from different satellites, the correlation between observations of different types, and the correlation between different frequencies are ignored. The covariance matrix for the observation series of one satellite with n epochs can be described as [30]
where (k, l = 1, 2, …, n) are the ZD code observation time correlation coefficients between the kth and lth epochs; is the jth satellite standard deviation of the code observation at frequency i; t = 1, 2, …, n is the number of the epoch; and is the identity matrix with dimension of m. The sample autocorrelation function is used to calculate the coefficient, which is defined as [18,30]
where , , is the residual vector at the tth epoch, and ri and ri+τ are the redundancies of the SD observation vector at the ith epoch and the (i + τ)th epoch, respectively, and they are satisfied with ri = ri+τ = m − 1.
3. Results and Analysis
3.1. Pseudorange Precision and Variation
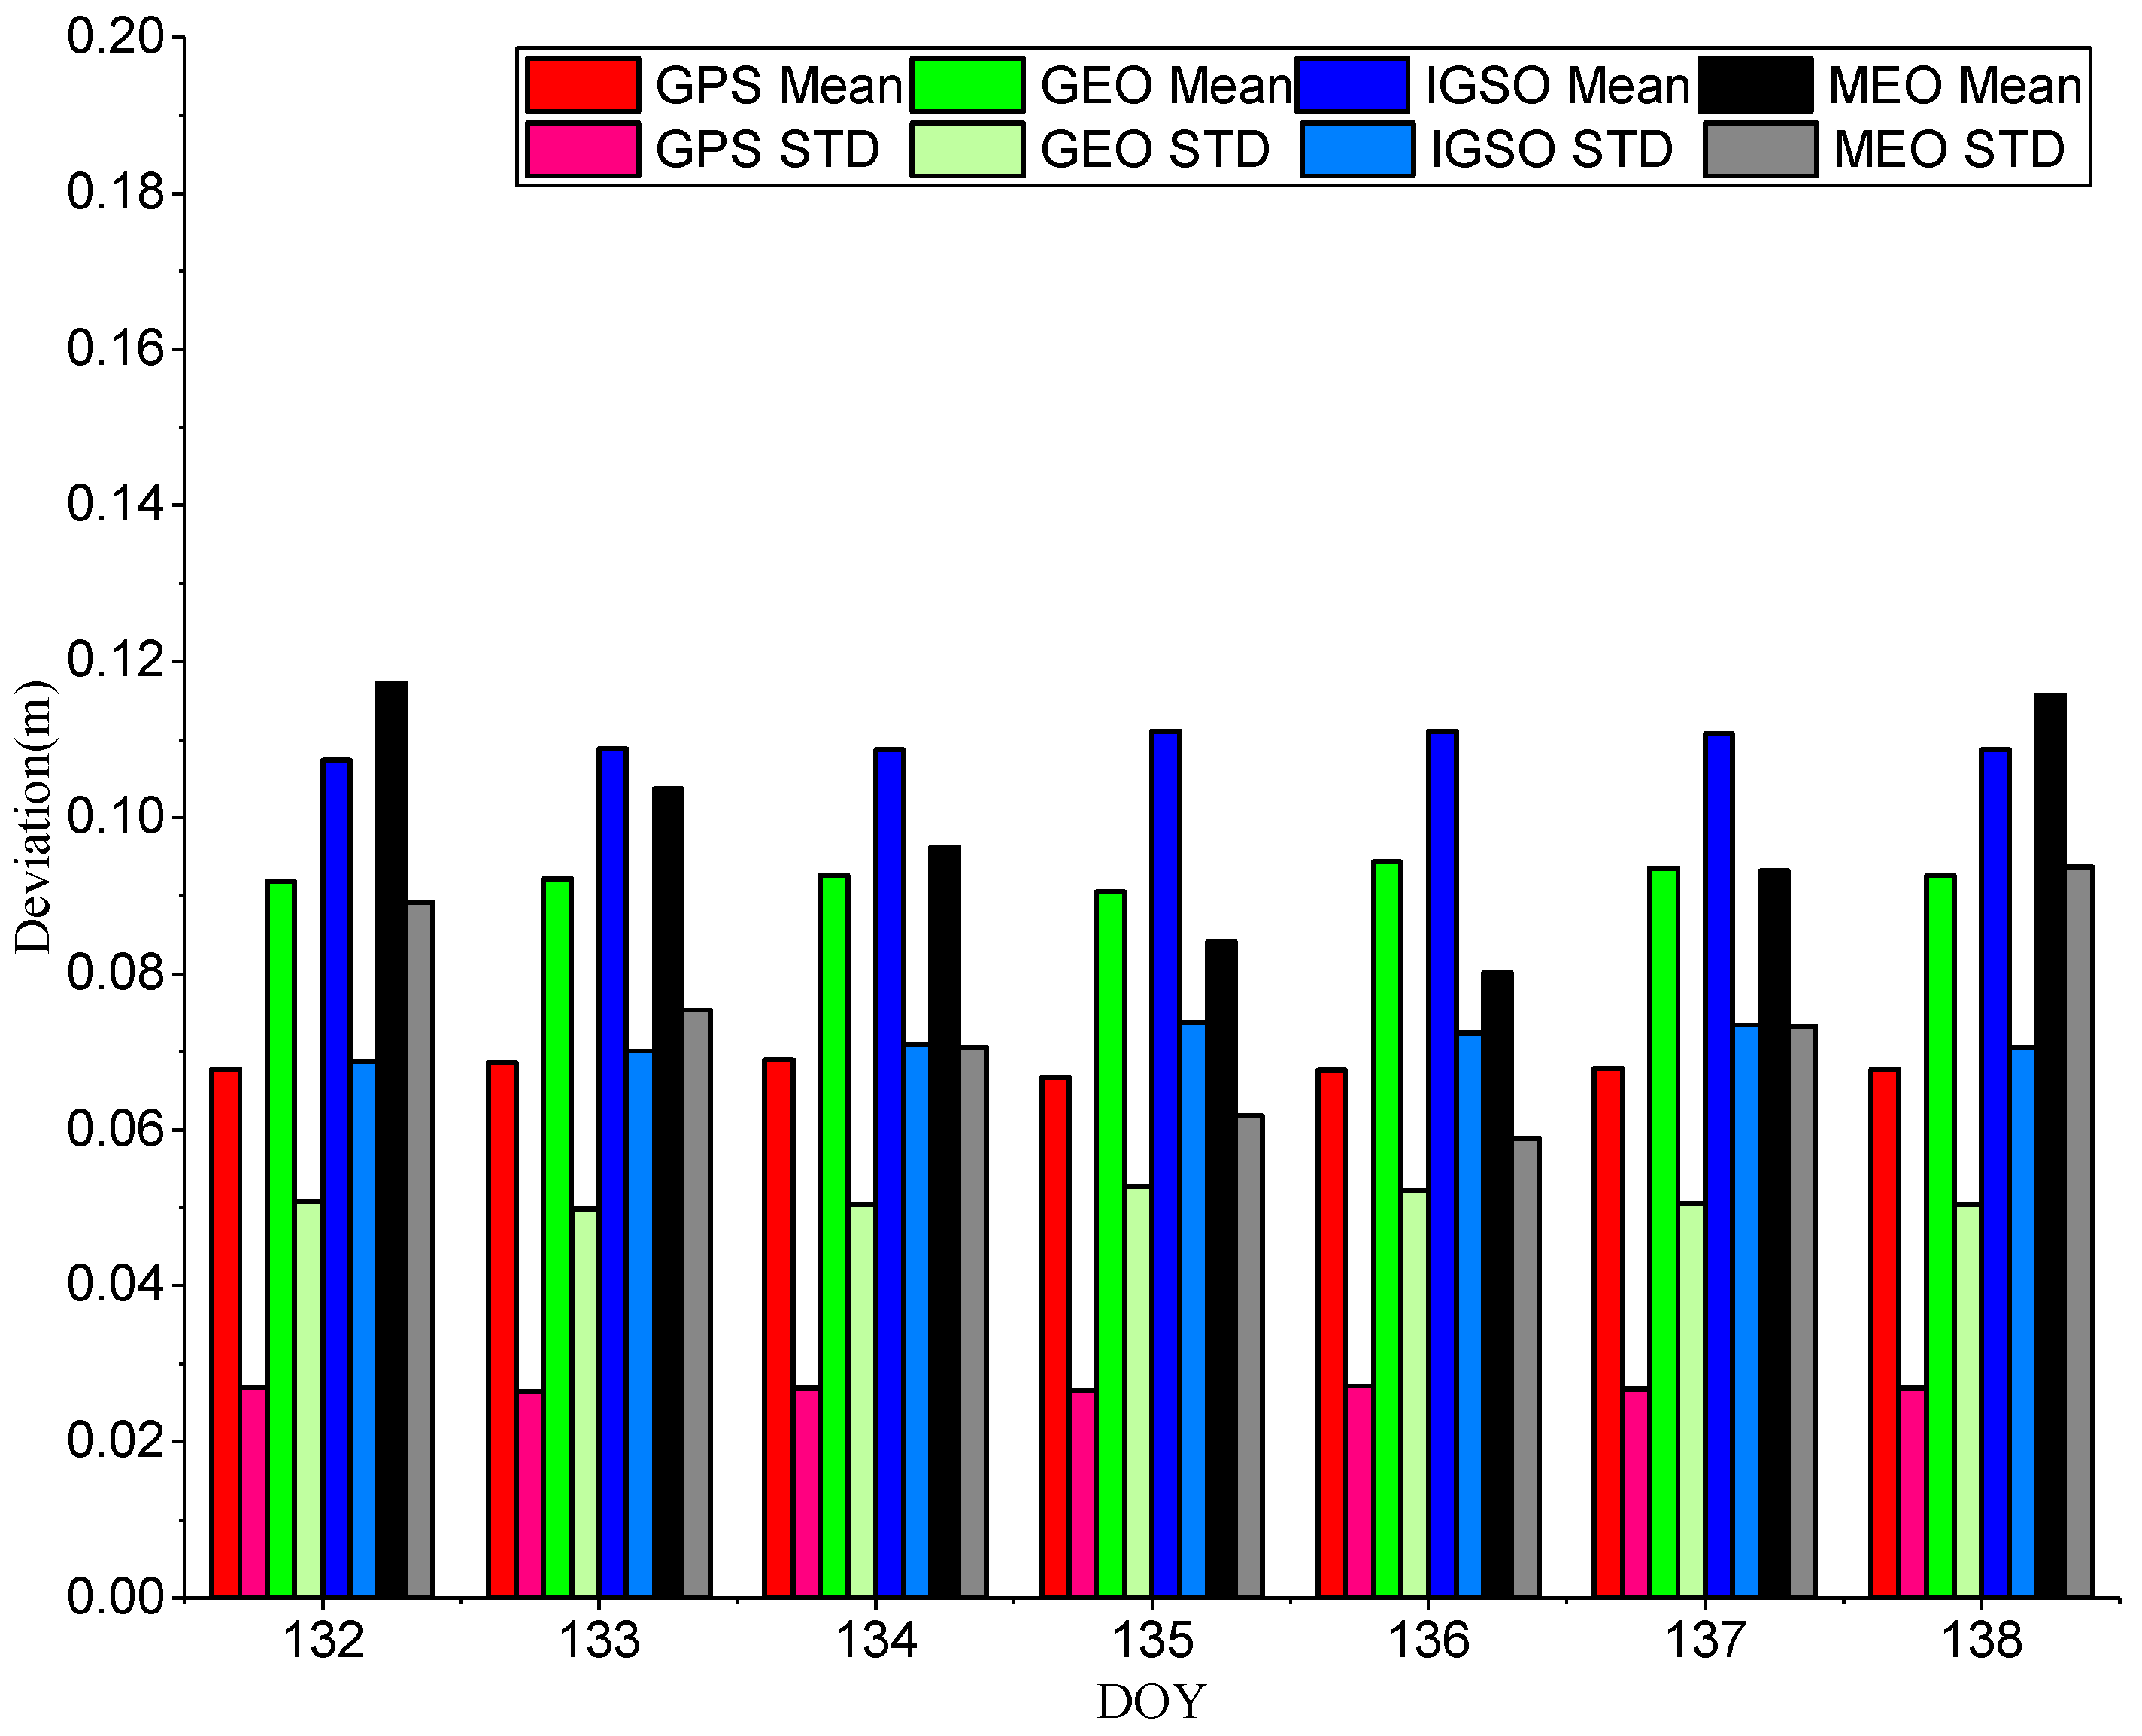
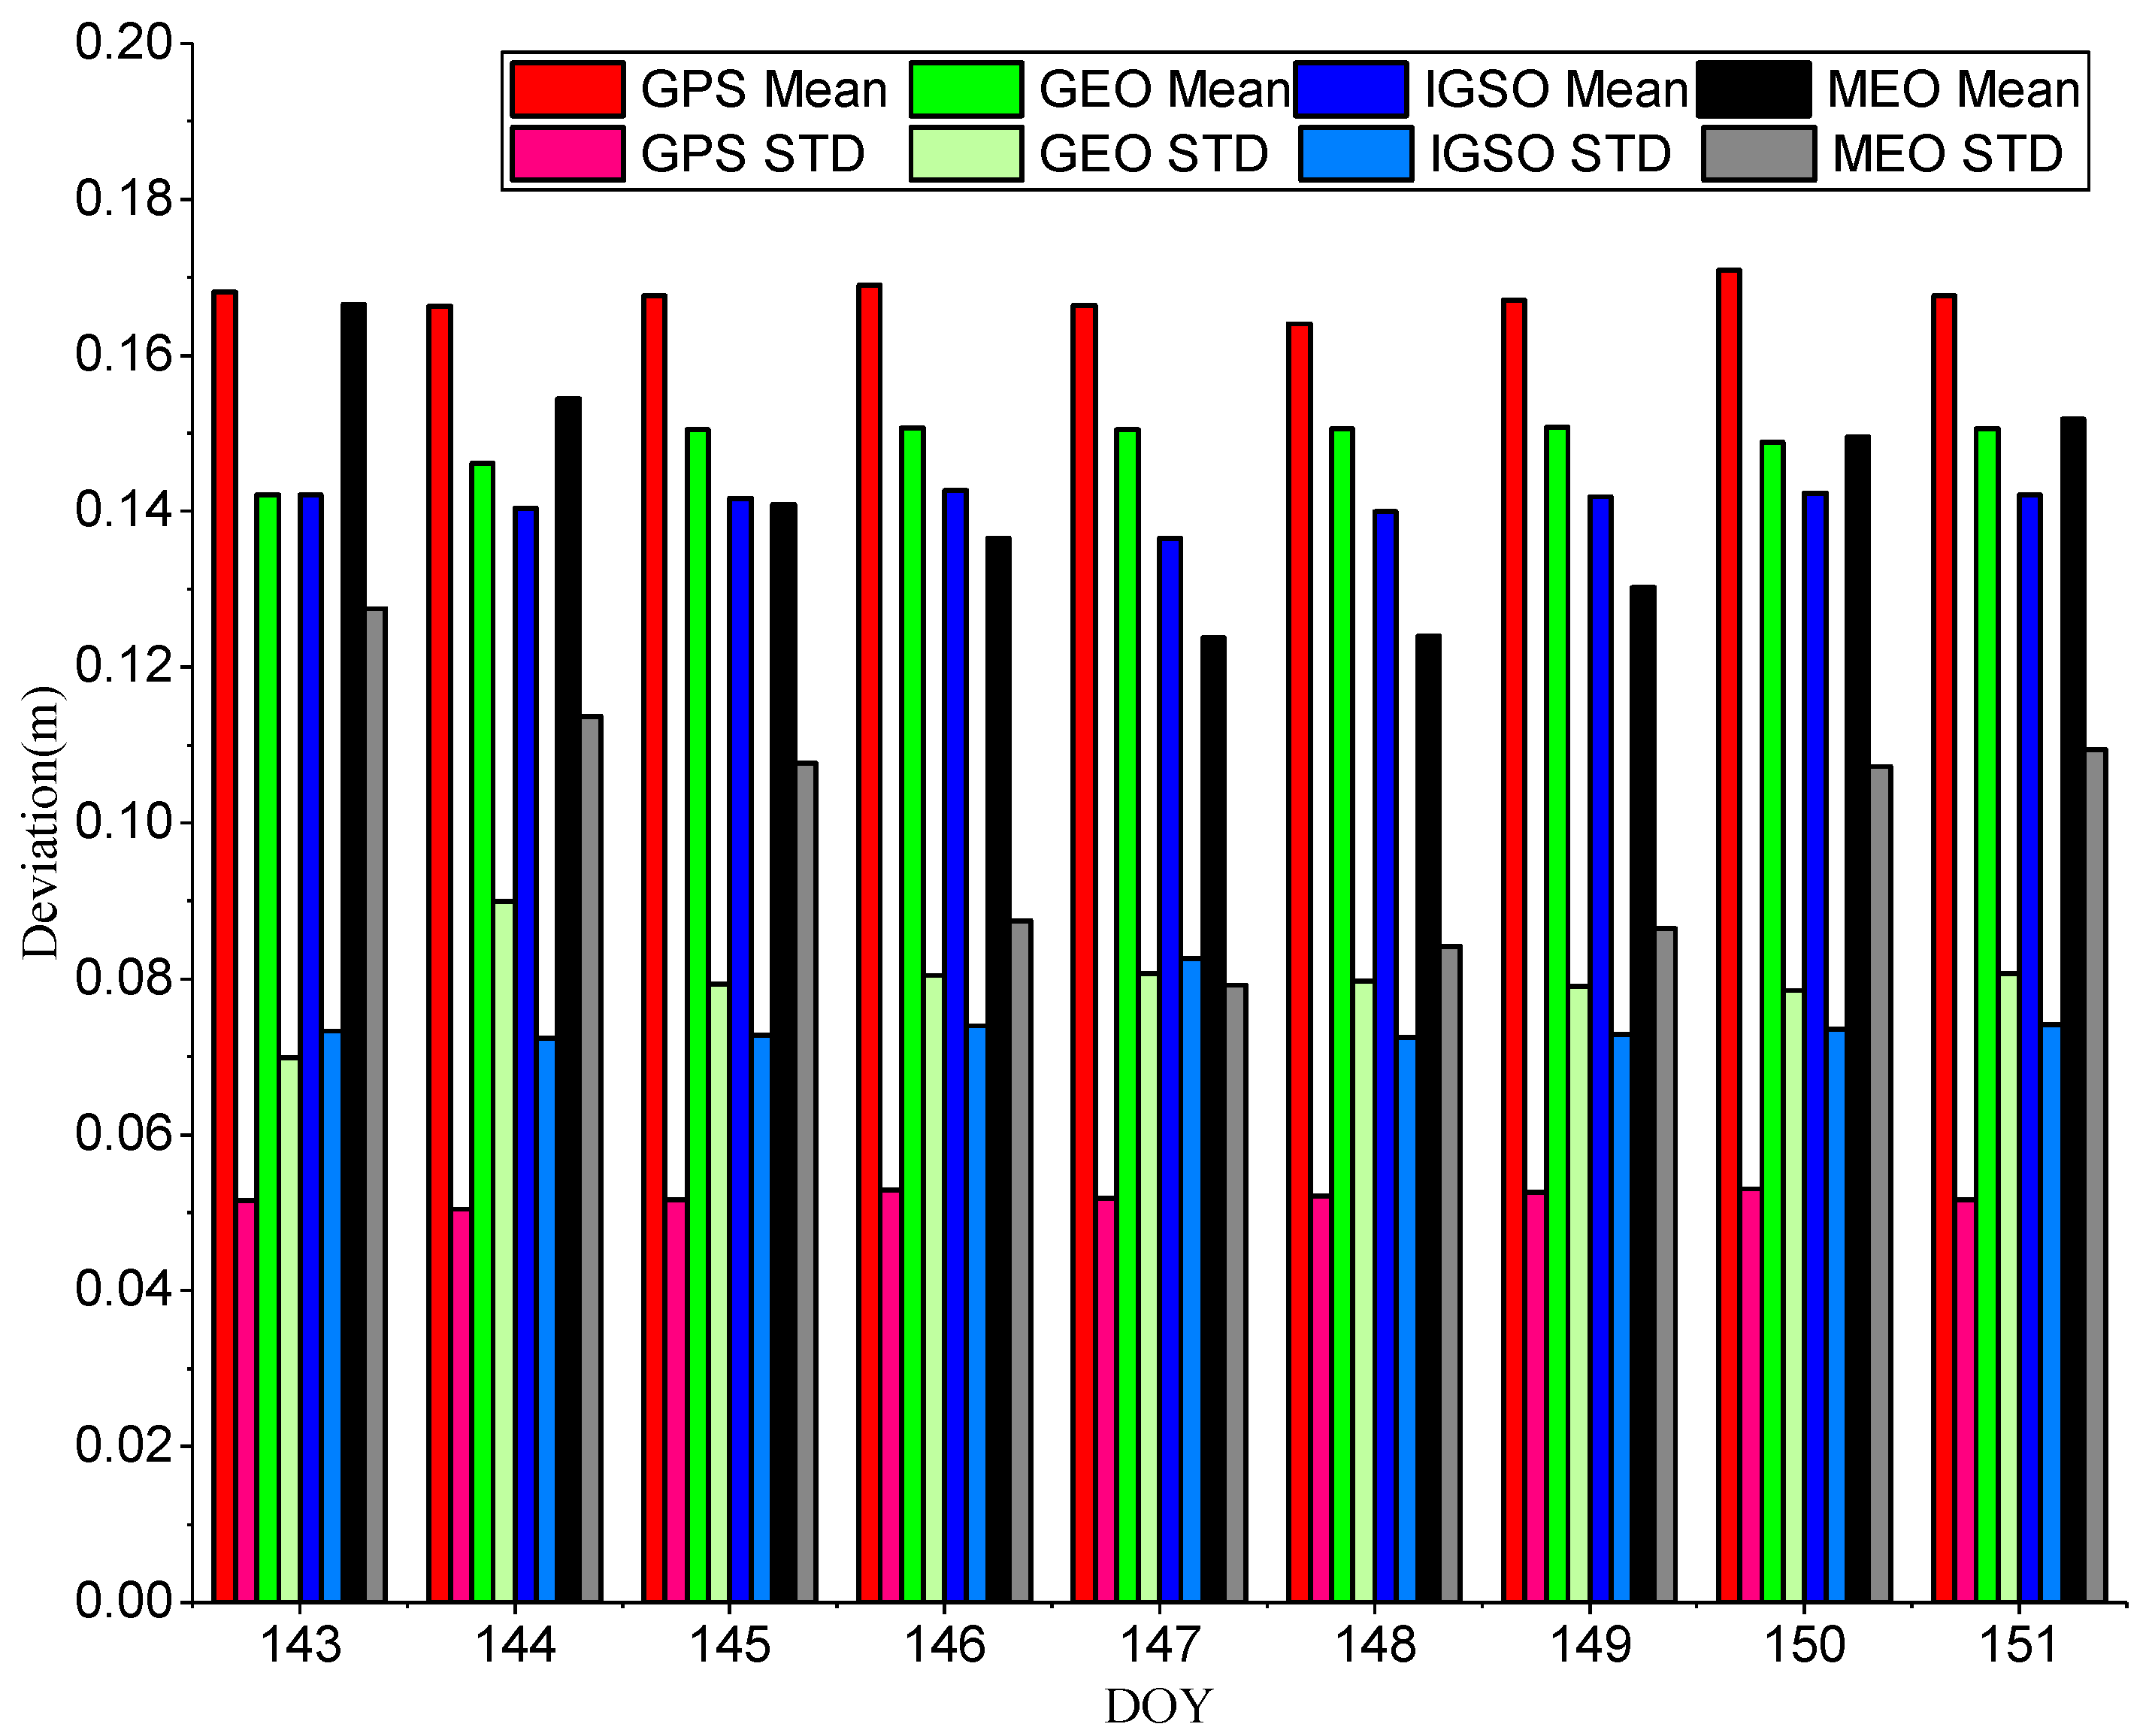
By using the zero-baseline configuration, the residuals reflect only the receiver’s internal noise; common error sources such as atmospheric errors (from the ionosphere and troposphere), satellite-dependent errors (satellite position and clock bias), and multipath error are absent. GPS and BDS measurements with a sampling interval of 10 s are used to analyze the characteristics of different types of observations. The receiver devices we used are two Trimble Net-R9 receivers and two ComNav 708 receivers. To make the results more reliable, the firmware version of the two receivers that make up the zero-baseline was also the same. The receivers are connected to one Trimble GNSS-Ti choke ring antenna (IGS-ANTEX antenna code TRM59900.00), which is located on a pillar on the roof of the School of Resources and Environmental Engineering building, Anhui University (AHU), using an SHX signal splitter. The site names were designated AHU1 and AHU2, respectively. The datasets in this study were collected by Trimble NET-R9 receivers from day of the year (DOY) 143 to 151 in 2016 and by ComNav 708 receivers from DOY 132 to 138 in 2018. The C/A and B1 code pseudorange precision series calculated epoch by epoch according to Equation (4) between BDS and GPS satellites are given in Figure 2 and Figure 3.
Because of the differing measurement of noise properties of the two types of receiver, there is a certain difference in the mean deviation for different receiver types. Table 1 lists the statistical results of the precision series of different types of satellite observations. For the ComNav receiver, the mean deviation for different types of satellite observations are 0.07~0.11 m, and the standard deviation are 0.03~0.08 m. For the Trimble receiver, the mean deviations for different types of satellite observations are 0.14~0.17 m, and the standard deviations are 0.05 m~0.10 m. The precision of the ComNav receiver is higher than that of the Trimble. However, the precision of BDS and GPS code measurements for the same receiver type is almost at the same level. Because only three MEO satellites can be used and we set the cutoff elevation angle at 10°, only one or no satellites can be seen for a long time in a single day. Therefore, the precision of MEO satellites is much higher than that of GEO, IGSO, and GPS satellites. For BDS satellites, the GEO satellite seems to have the best precision, but its standard deviation (STD) is significantly higher than that of the GPS satellite.
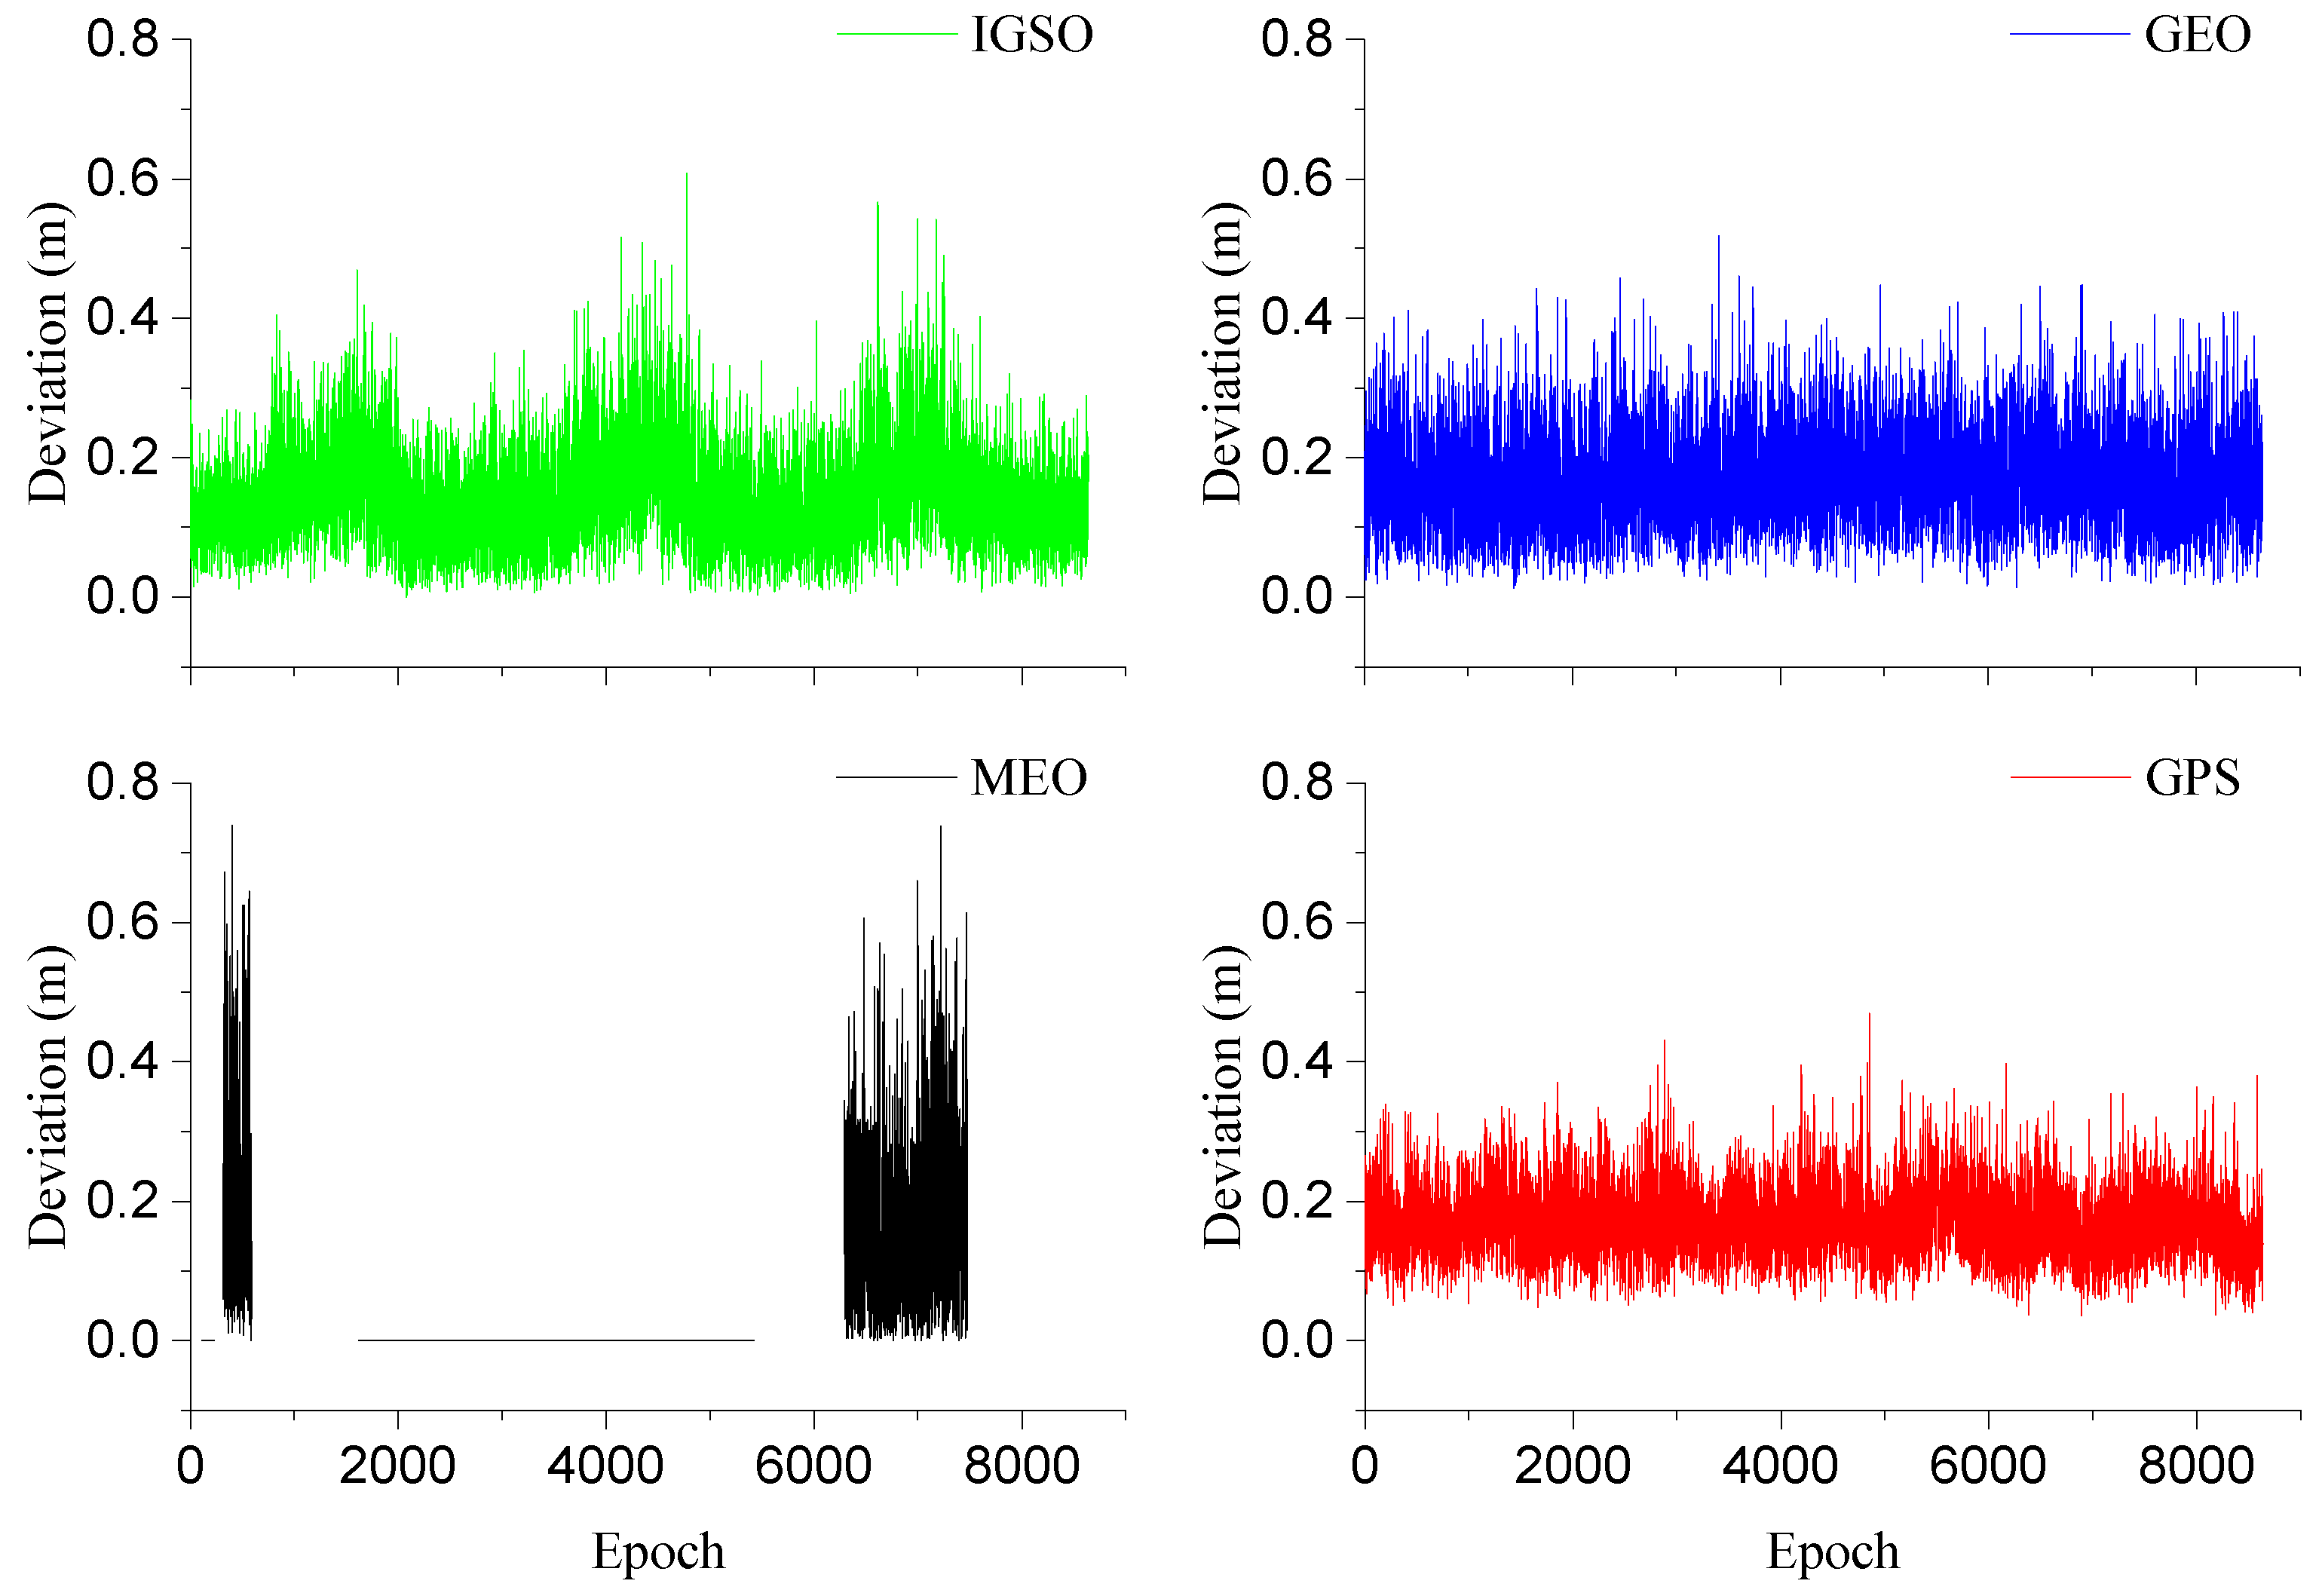
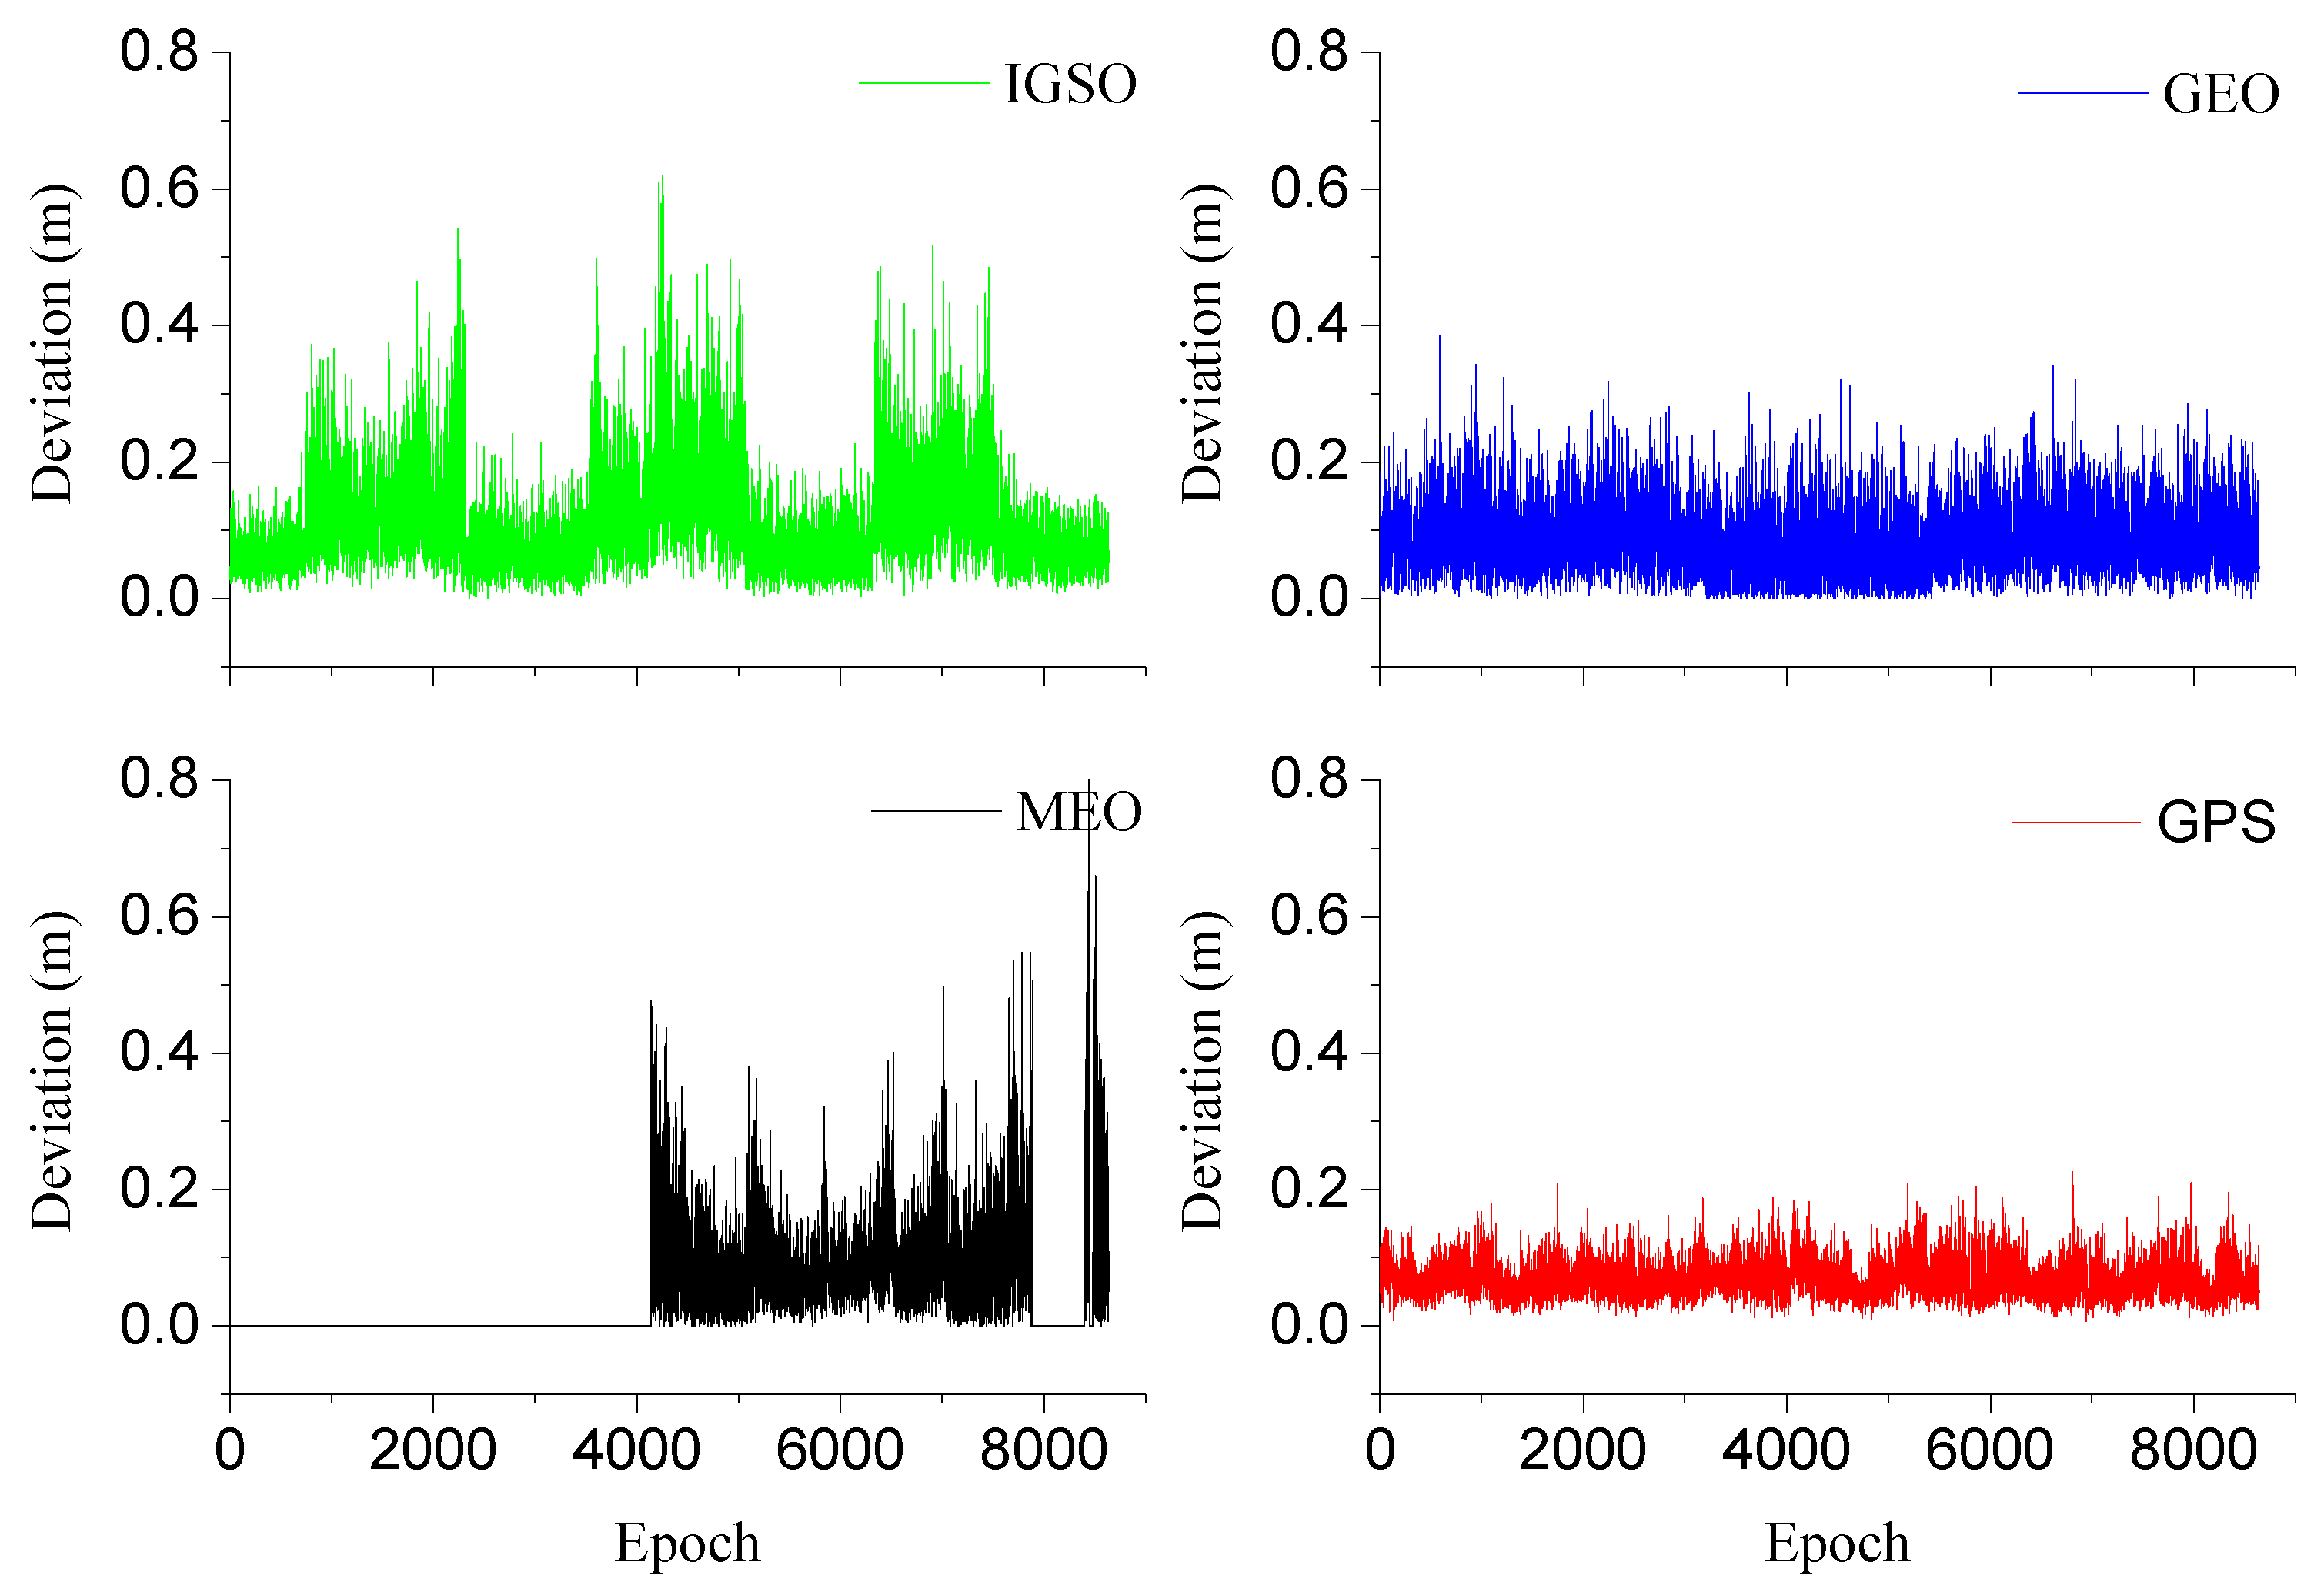
The GPS P2 code pseudorange precisions for Trimble and ComNav are 0.1545 and 0.1027 m, respectively. The precision is nearly the same or lower than that of the C/A code. This may be why the decoded P code has a lower precision than its theoretical value found by employing the Z tracking technique. In addition, we can also find that the daily precisions of the measurements have strong repeatability. Moreover, the time correlation of observations have the same characteristics. Therefore, we selected DOY 143 for Trimble and 132 for ComNav as an example, as shown in Figure 4 and Figure 5, which gives a single-day precision series.
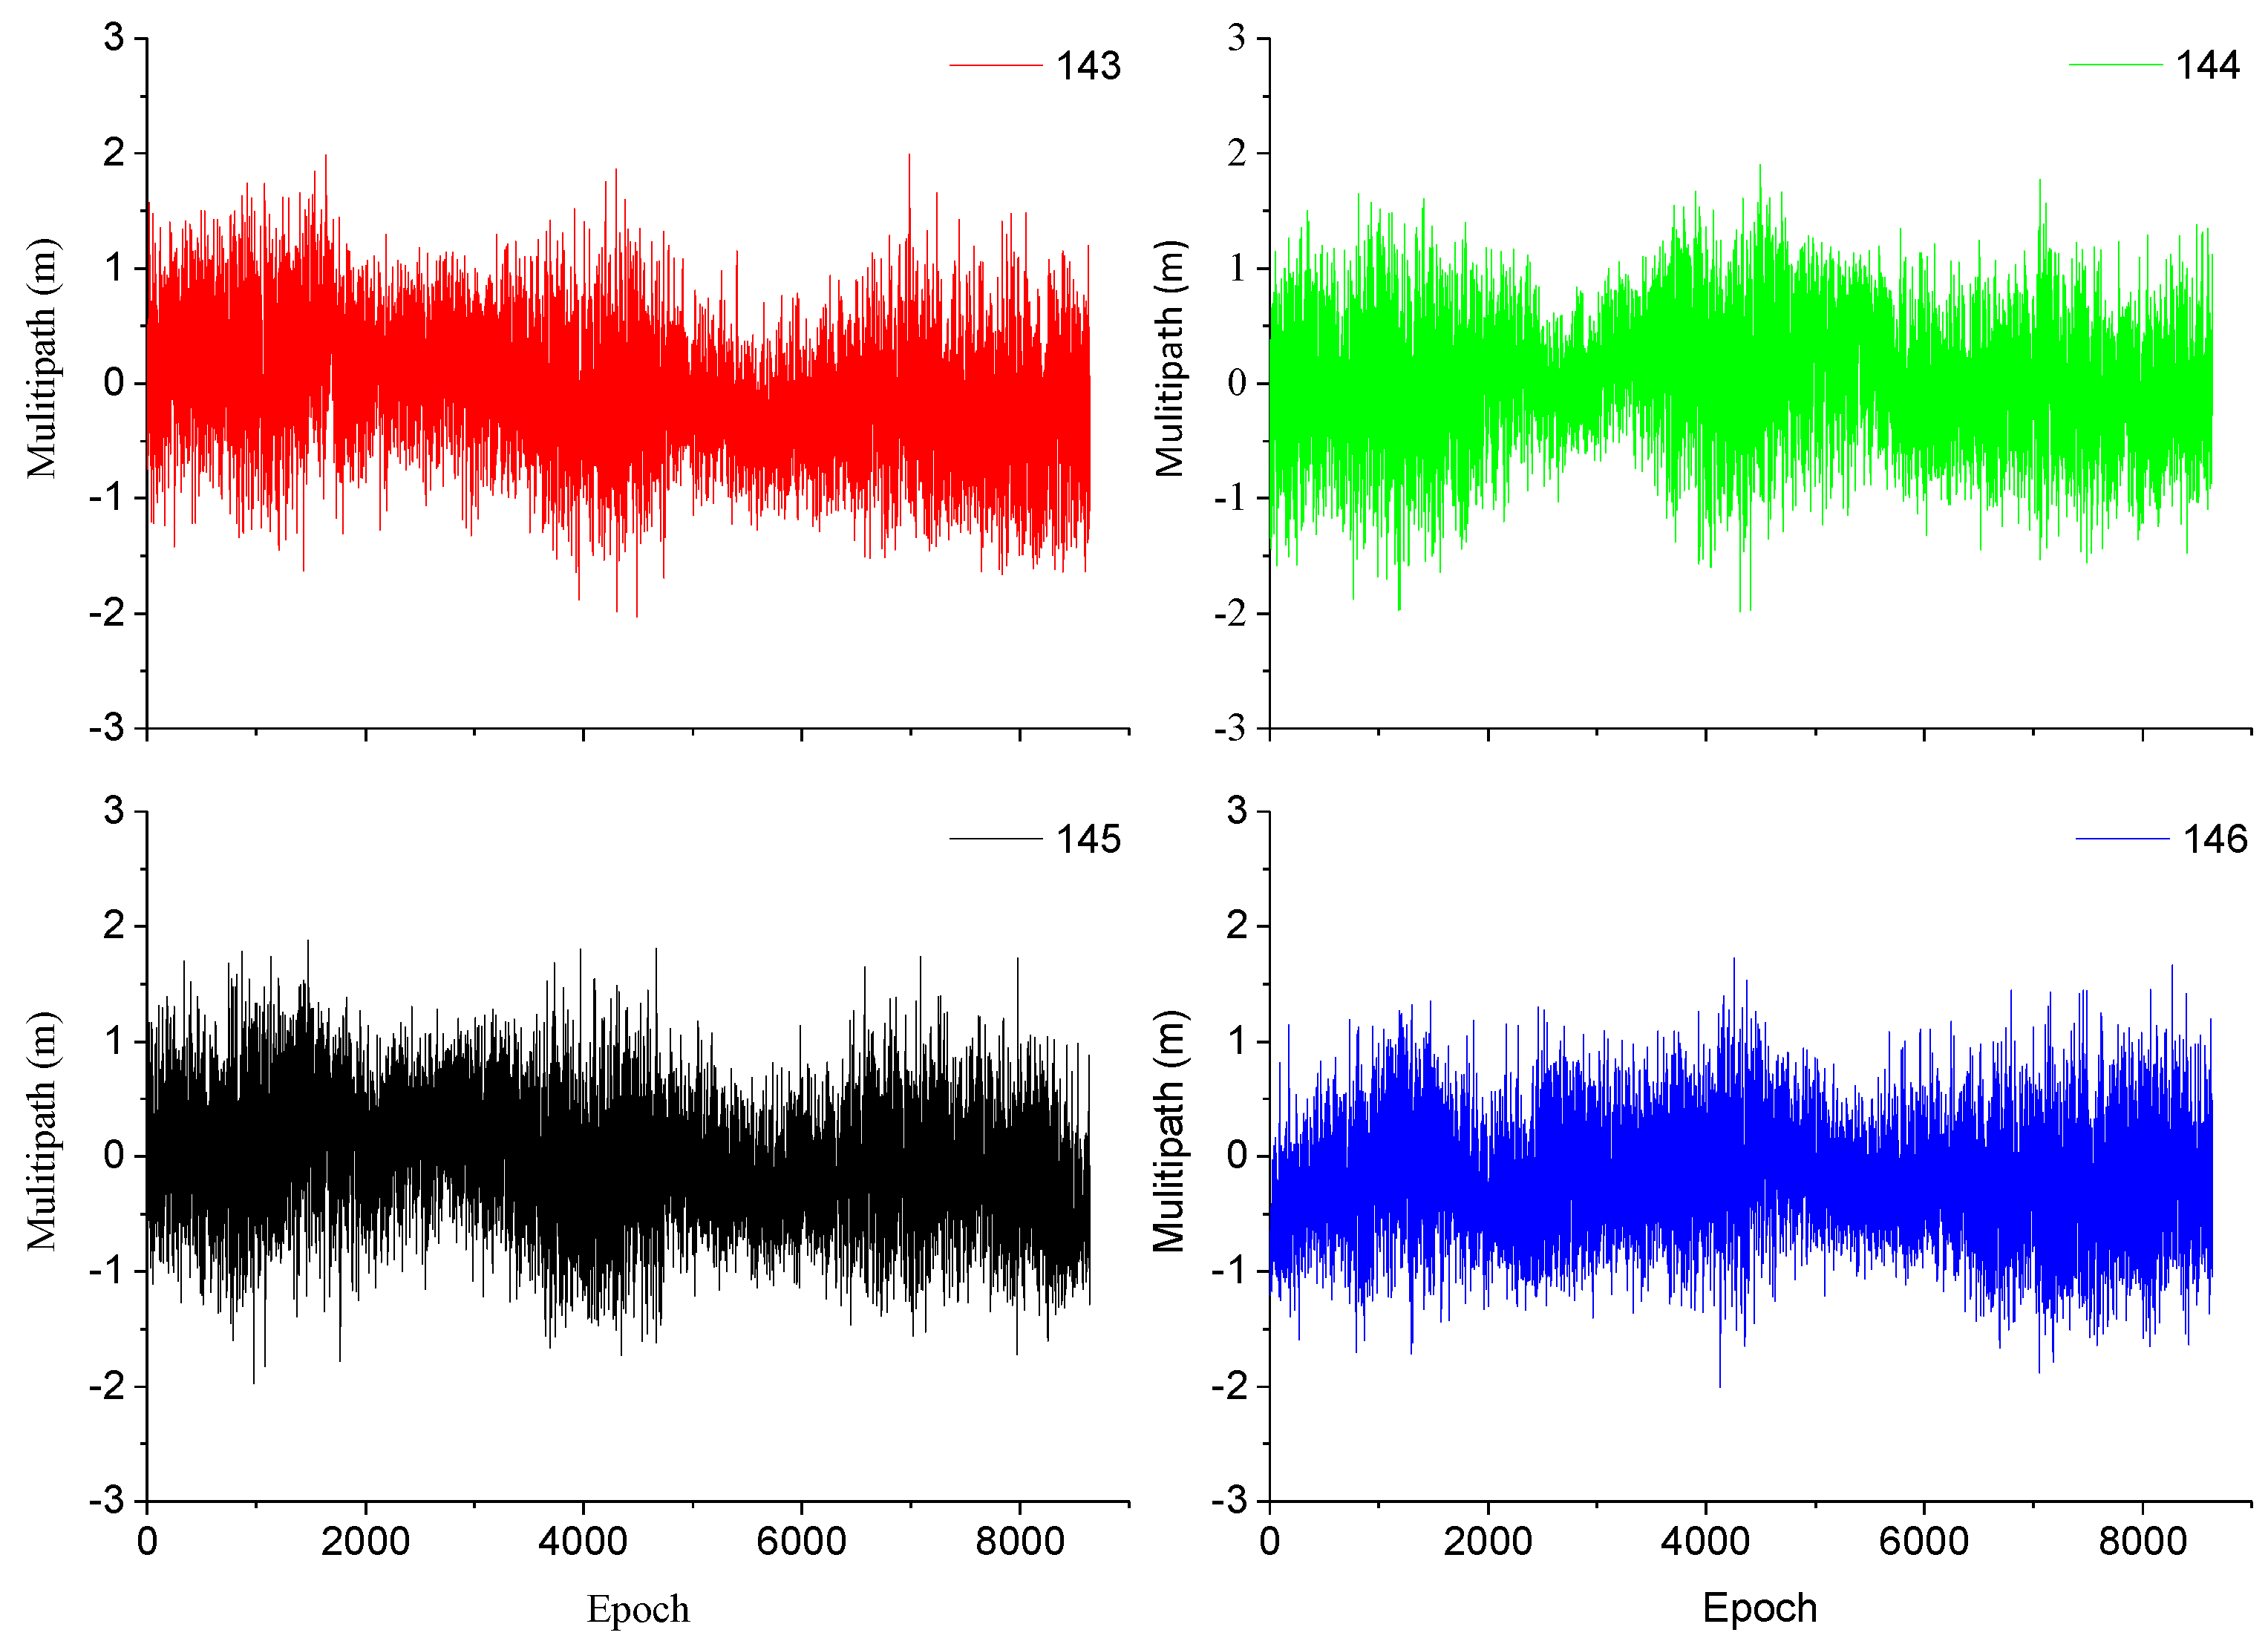
Meanwhile, as shown in Figure 4 and Figure 5, it is obvious that the deviation of the IGSO signal exhibits a significant periodicity. To verify whether this periodicity is due to multipath (MP) errors, the multipath combination of code range and carrier phase observables, which is often used to assess the multipath and code noise level of a receiver [6], is used for analysis. The multipath combination can be written as [25,31]
where is the carrier phase observable and the meaning of other symbols is the same as mentioned in the previous equations.
As shown in Figure 6, the multipath errors, which are calculated using Equation (9), are not constant over time. The multipath error can reach >2 m even though the mean value is near zero. The multipath series typically show a sinusoidal behavior that strongly depends on the conditions of the user antenna.
When comparing Figure 4 and Figure 6, we can find that both the precision series and multipath error show some periodic characteristics. However, the precision deviation is not >0.8 m and the STD is 0.0516 m, while the maximum value of the multipath is >2 m and the STD is ~0.58 m, which is significantly different from the results in Figure 1 and Figure 2. In addition, the trends of the two precision and multipath series seem to be completely different. The results for the ComNav receivers have similar properties and will not be described here. We therefore conclude that the periodicity characteristics of the precision deviations is not affected by the multipath. Its periodicity may come from systematic error of satellites, which needs to be further studied in the future.
3.2. Time Correlation and Its Characteristics
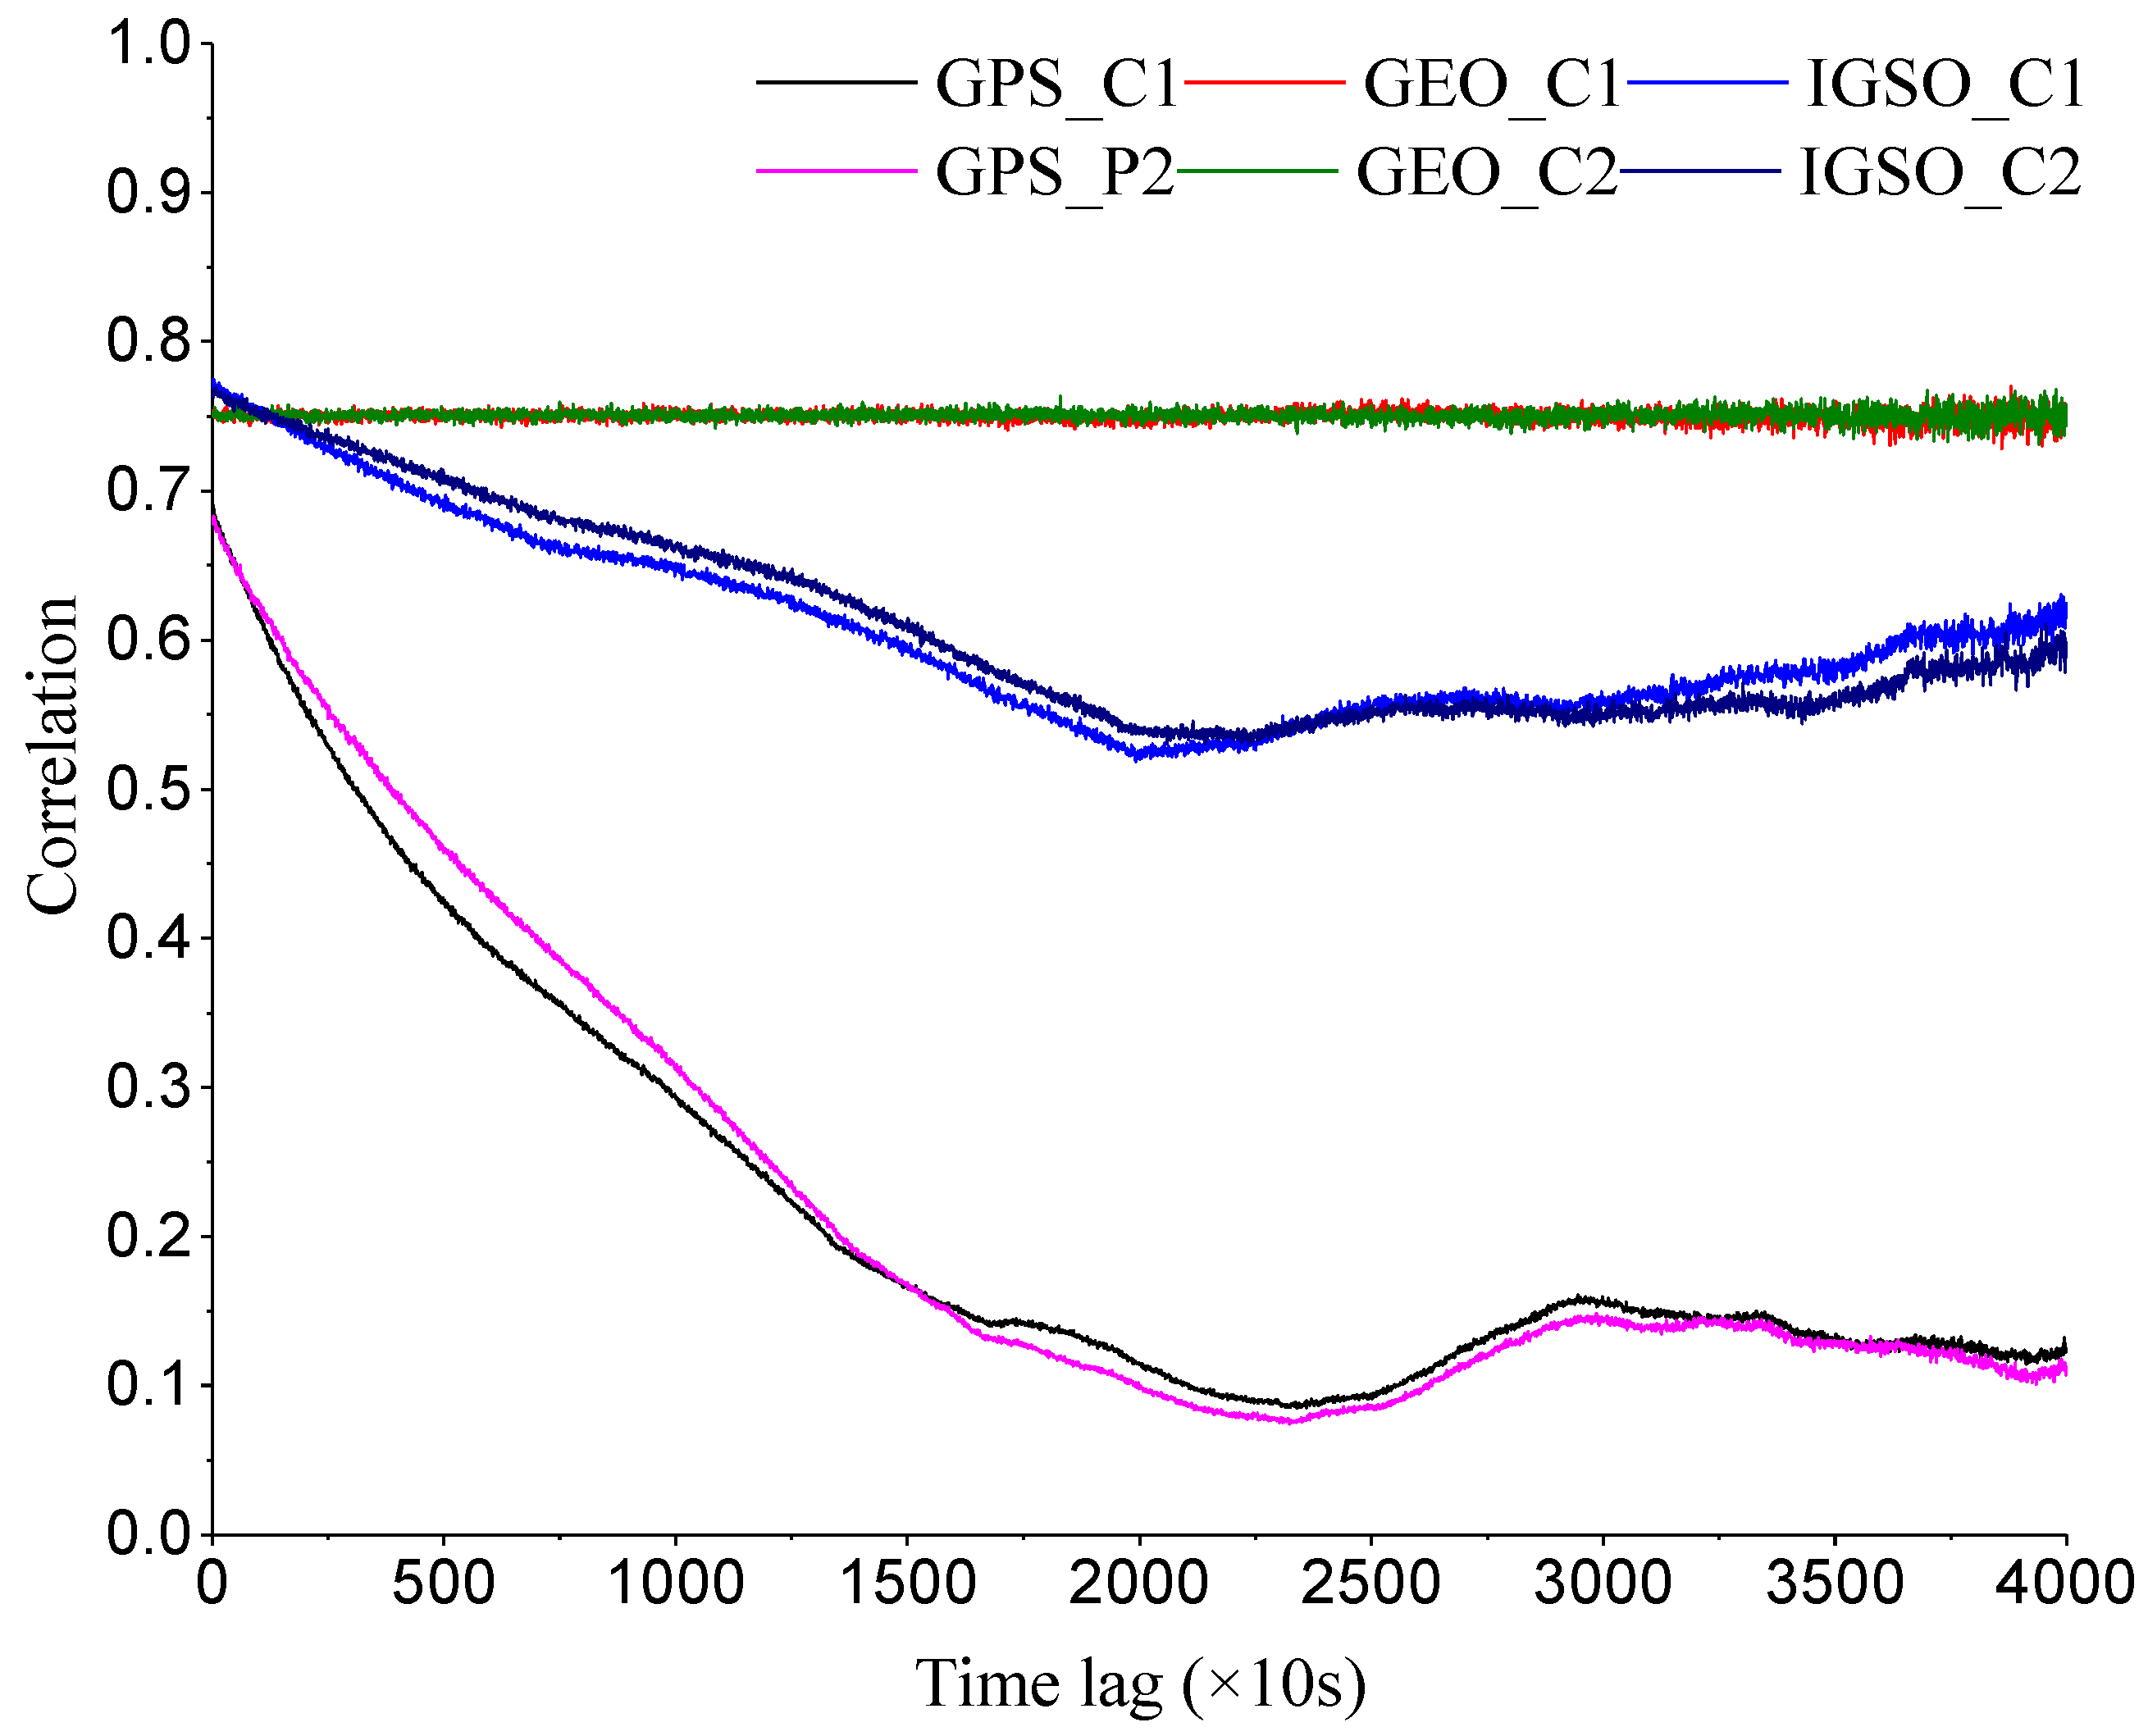
If the time series is stationary, the autocorrelation function depends only on the time lag. Figure 5 shows the time correlation coefficients of GPS C/A and P2 code measurement and the BDS B1 and B2 code measurements collected by the Trimble receiver. As shown in Figure 7, the time correlations for both frequencies of the same satellite are nearly the same. The correlation coefficients of GPS C/A and P2 code measurements decrease slowly with increasing time, whereas the IGSO satellite presented the strongest correlation in the first few epochs owing to the figure eight shape of its orbit, with its maximum correlation coefficient reaching 0.77 and the minimum also exceeding 0.52. Moreover, as shown in Figure 1, the elevation angle is maintained at a high level and changed slowly, so the correlation of the observation decreases with time in the first half and then gradually increases. For the GEO satellite, both the B1 and the B2 code measurements have shown a strong time correlation and are maintained at ~0.75. It should be noted that, owing to the small number of MEO satellite observations, the time correlation cannot be calculated according to Equation (8).
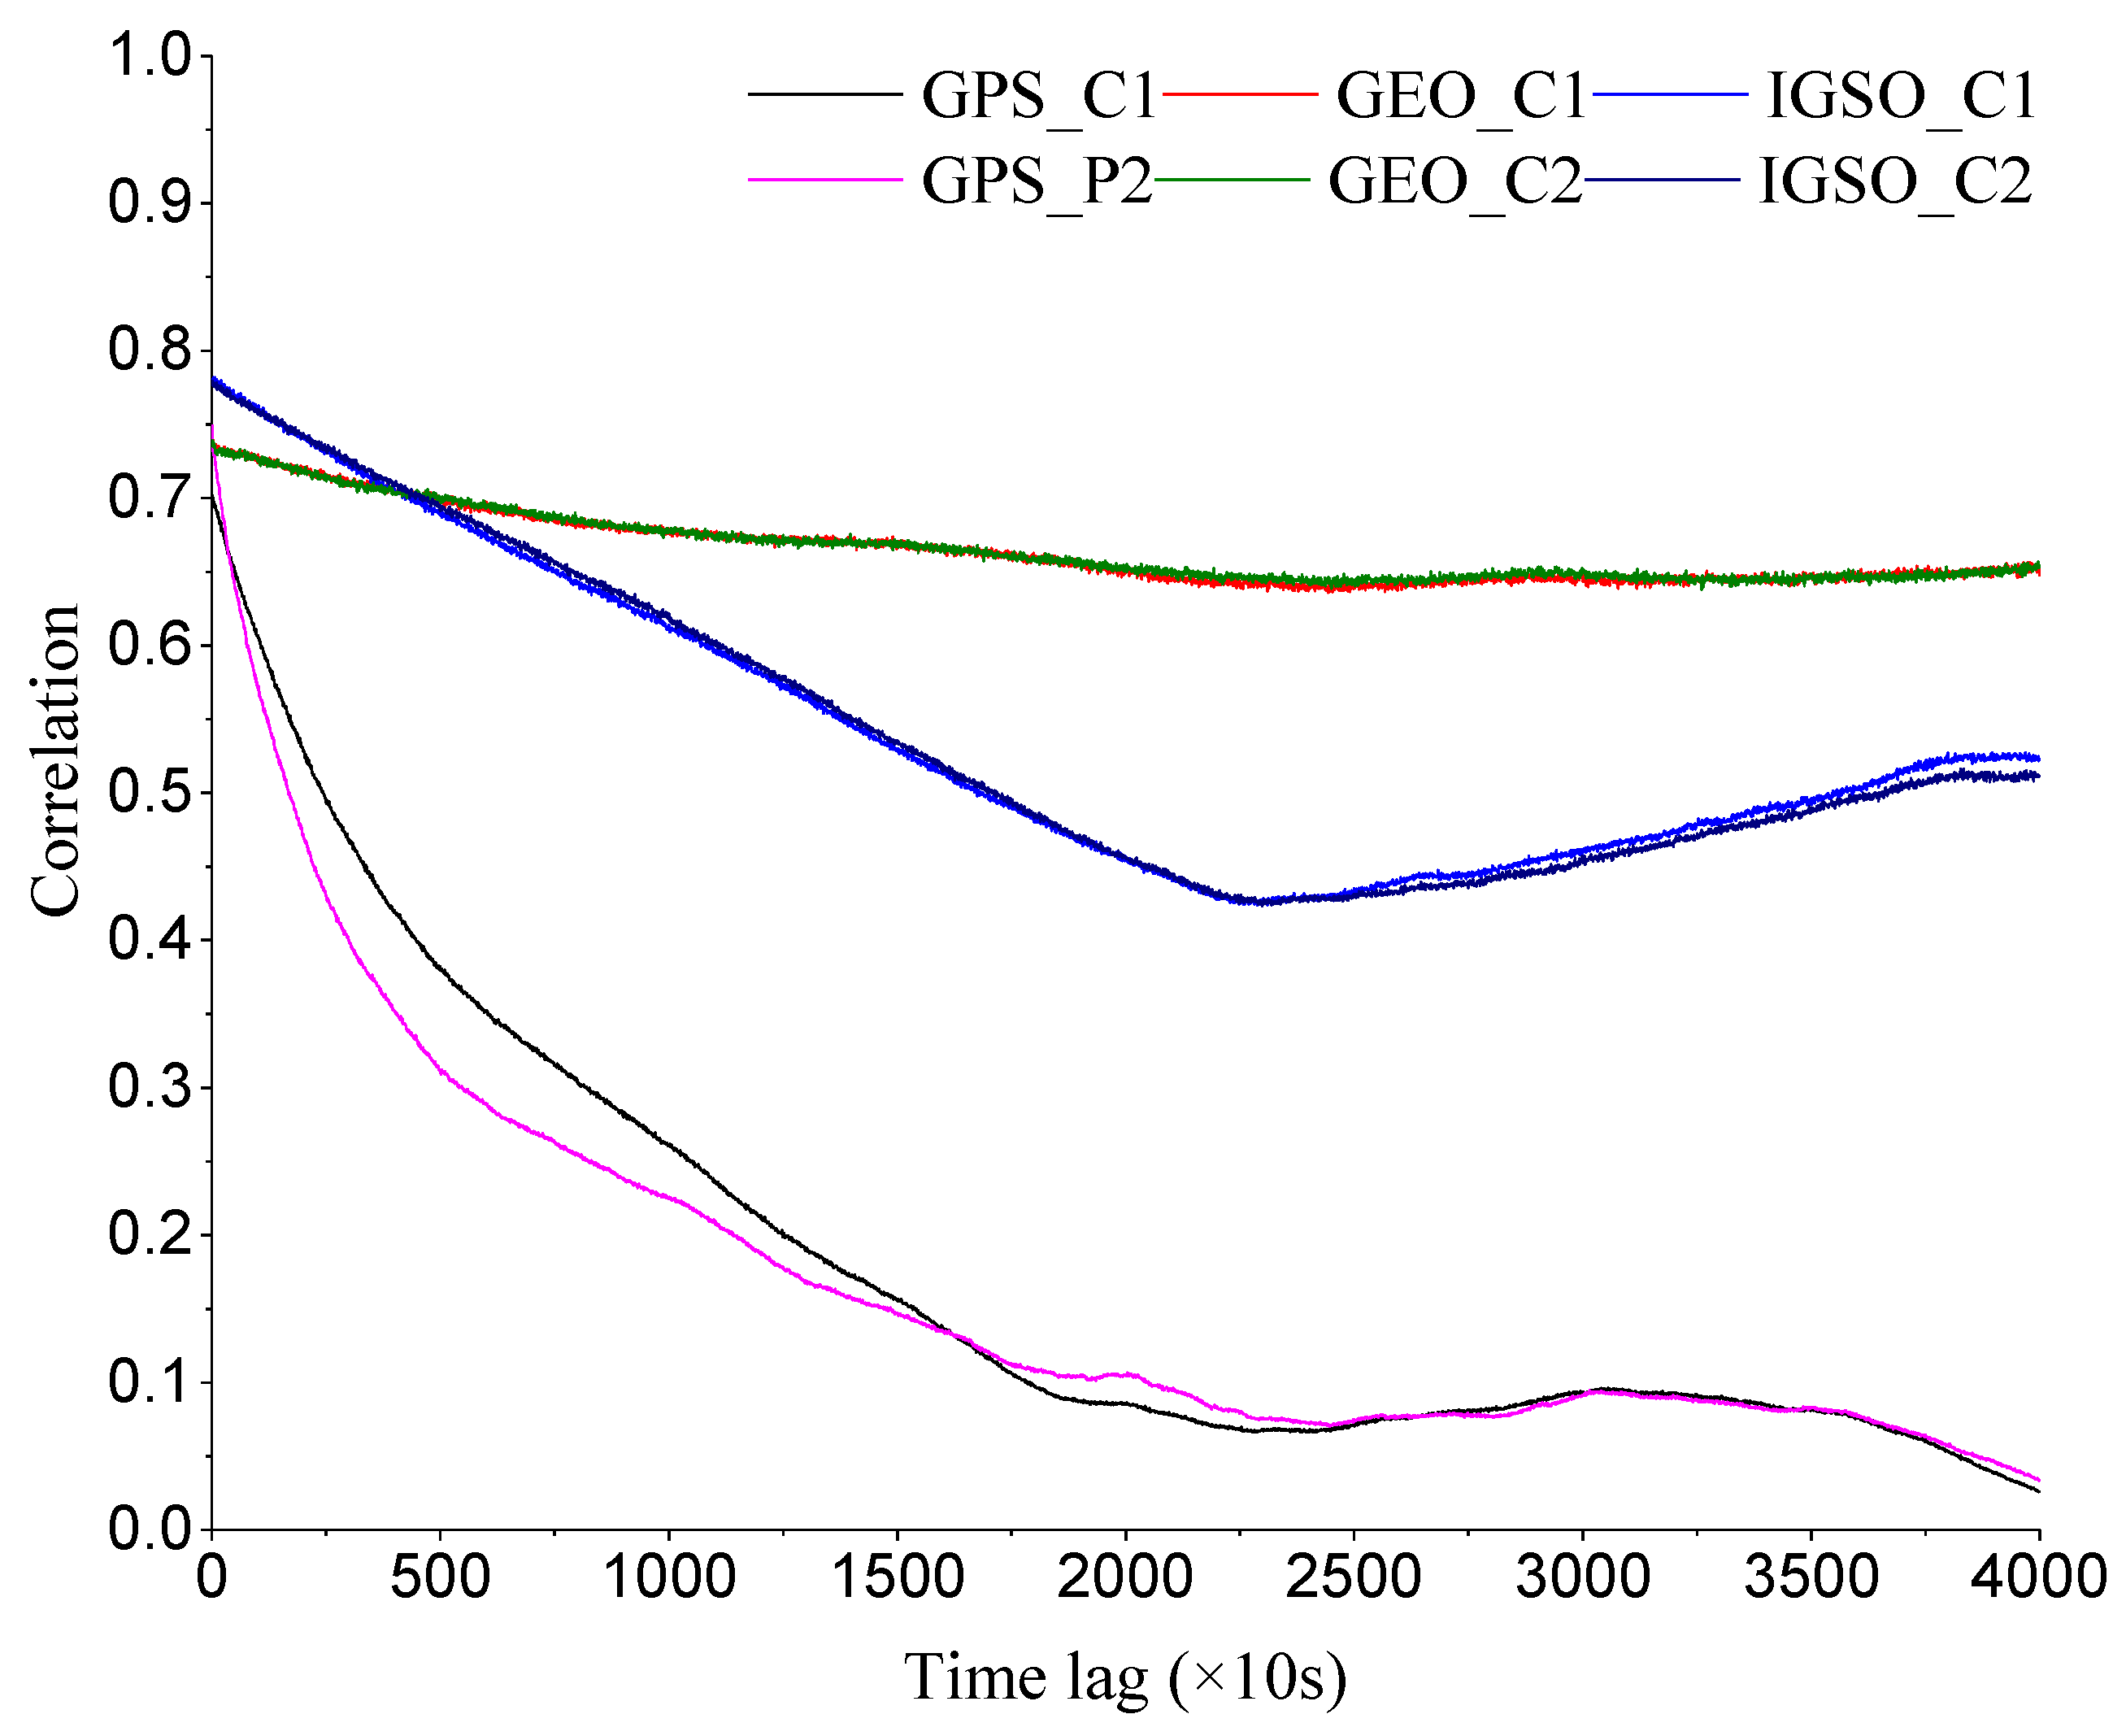
The time correlation of different pseudorange measurements collected by the ComNav receiver is shown in Figure 8.
Comparing Figure 7 and Figure 8, we can find that the two types of receiver used in this paper show similar behavior. Although the time correlation of the GEO satellite has slightly decreased with time lag increasing, the correlation coefficient is still >0.63. Then we can conclude that, because of the differences in radial and tangential velocities of different types of satellites in their orbital planes, the time correlations of their corresponding observations are quite different. Therefore, the influence of the time correlations of different types of satellites should be considered in BeiDou precision positioning.
3.3. Relationship between the Elevation Angle and Precision
In the traditional stochastic model, it is generally considered that the satellite’s elevation angle is an important factor affecting the precision of the observations. In this section, we will verify the relationship between the elevation angle and the precision of the observations. The lowest elevation angle for all satellites is 10°, which is the cutoff elevation, and the highest elevation angle is 87.8°. For BDS, the highest elevation angle for IGSO and MEO satellites is 82.1° and 82.2°, respectively, whereas the elevation angles of GEO satellites are nearly constant at 46°, 35°, 51°, 31°, and 17°, respectively.
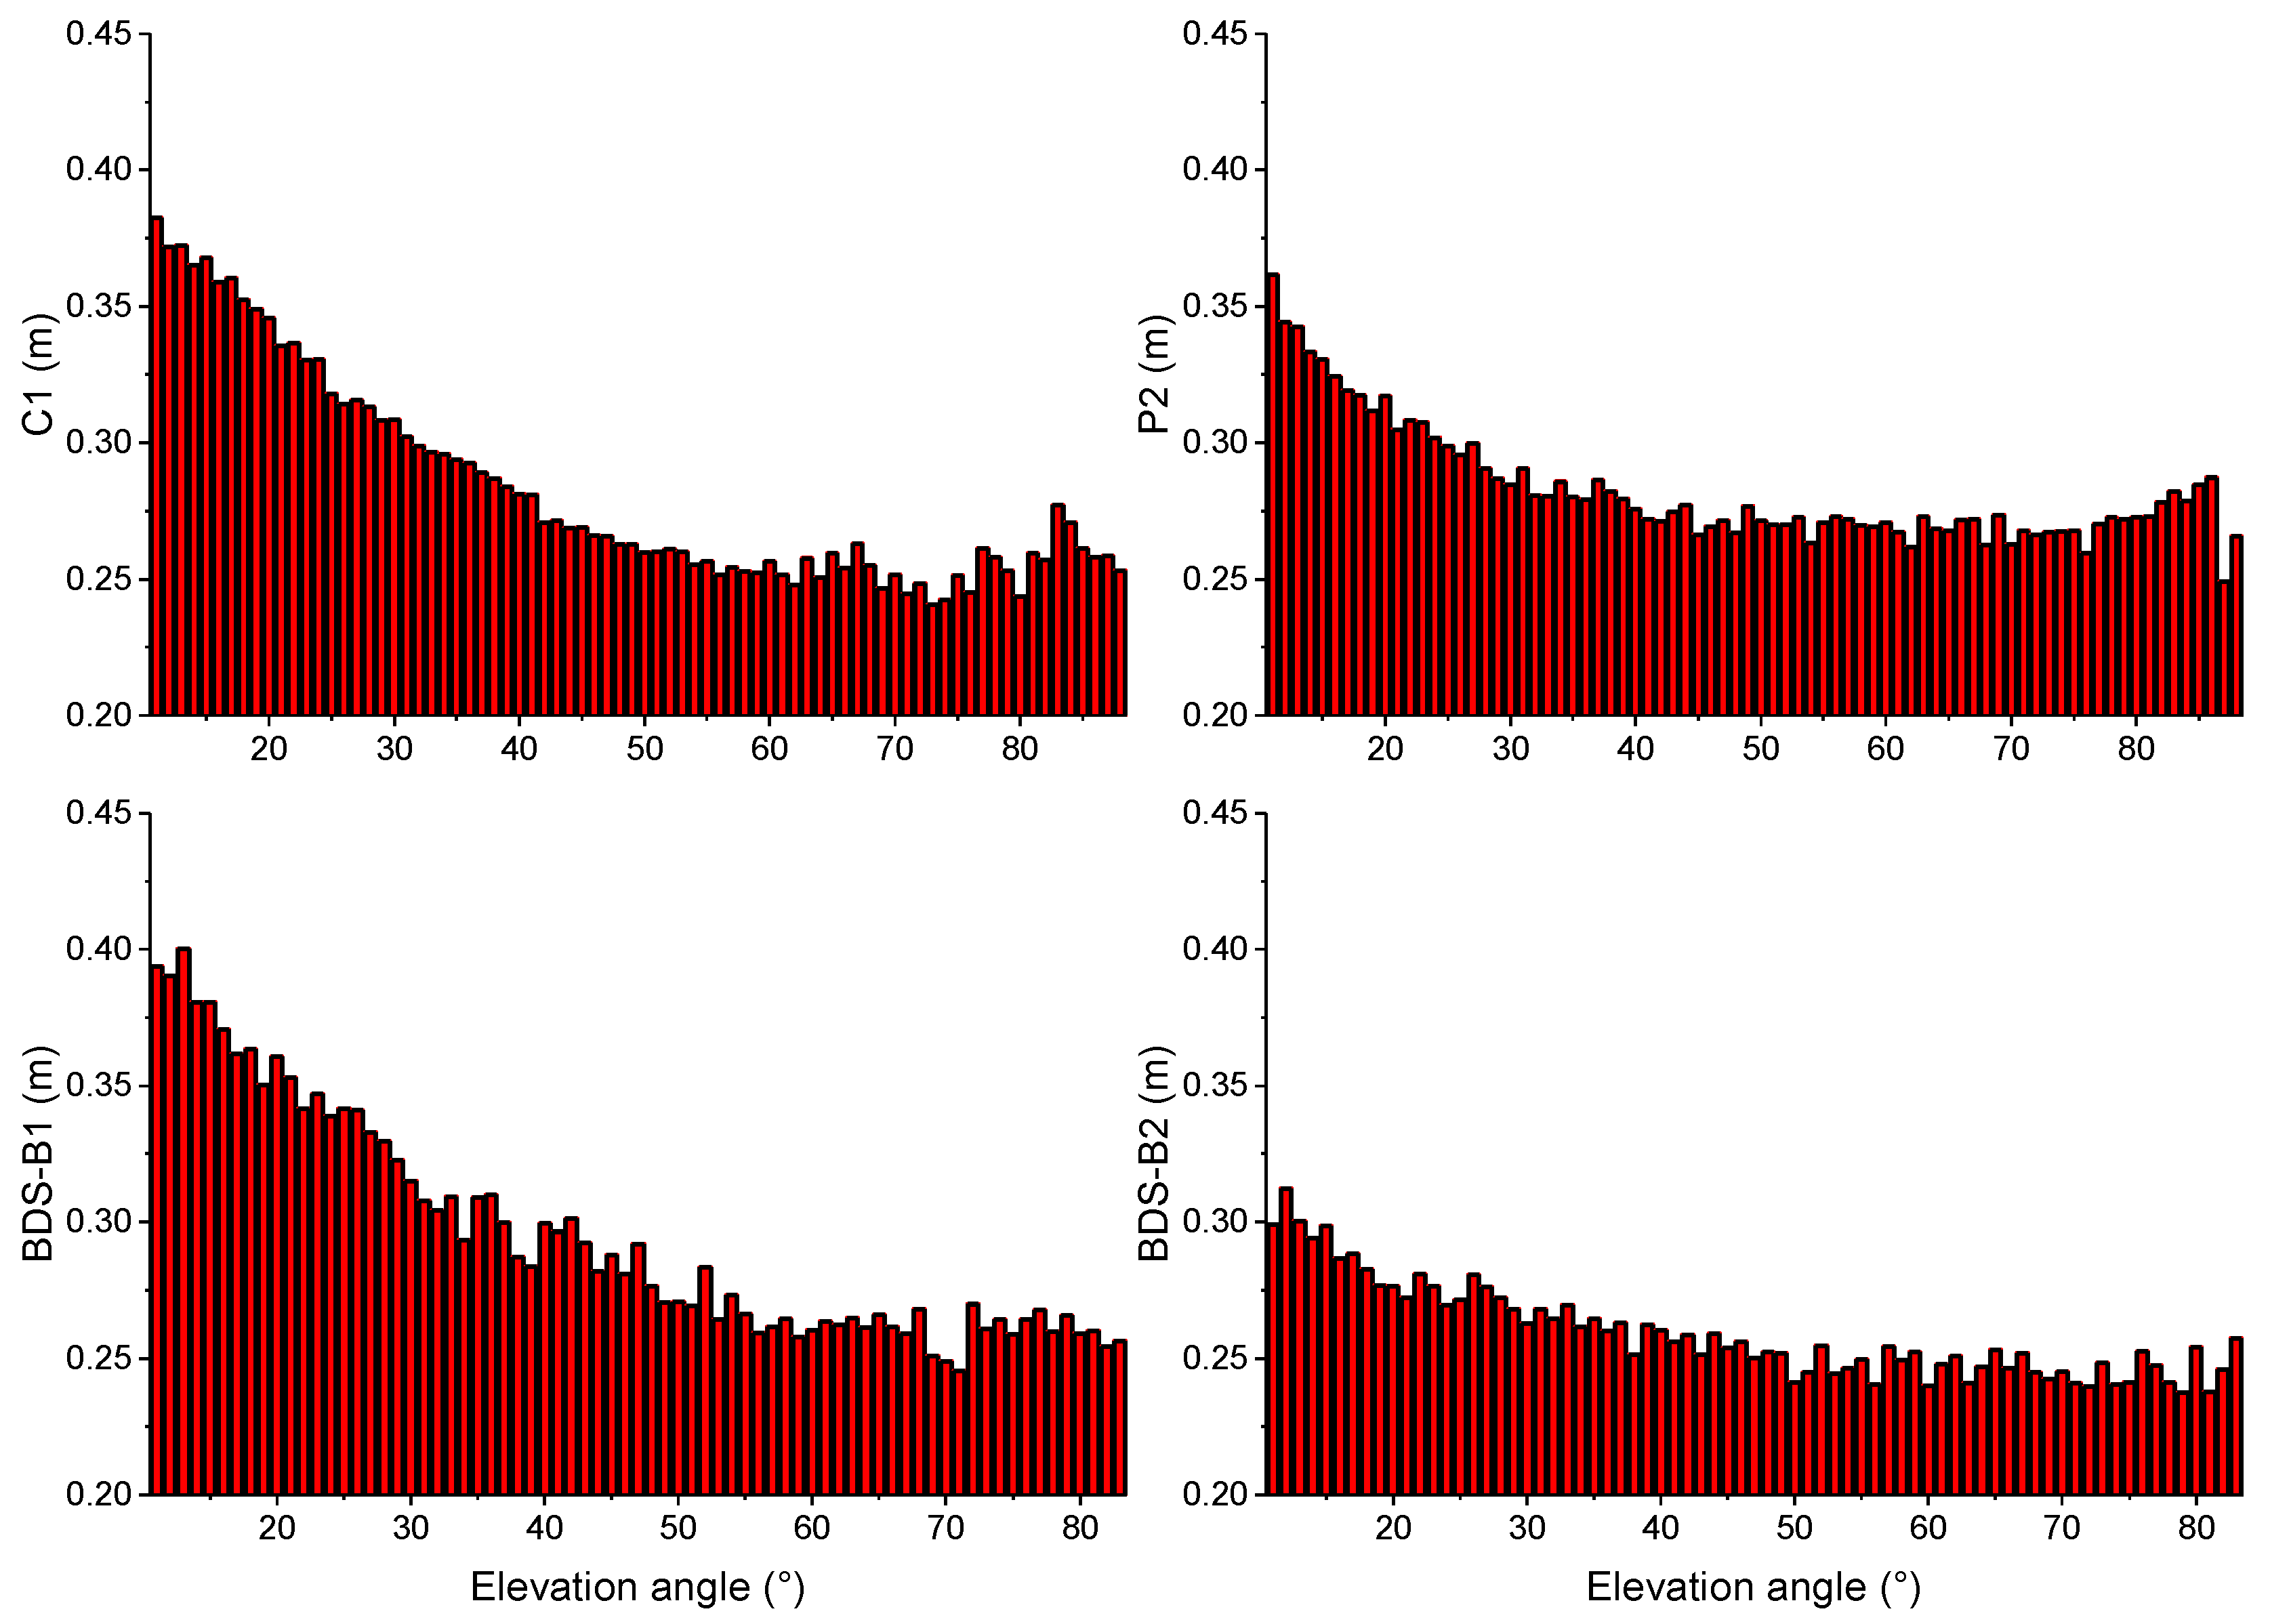
To accurately determine the relationship between the precision of observations and the change of elevation angle, the satellite elevation angle is divided into 1° intervals. Referring to Figure 9, one can see that the GPS C/A code and BDS B1 code observations show a strong elevation dependence, and the precision decreases as the elevation angle increases. However, although the P2 and B2 code measurements have a certain relationship to elevation angle, the performance is not obvious. For P2 observations, the highest precision is ~60° and, for B2 observations, the precision is almost constant for satellite elevation angles >40°. Therefore, we can conclude that the elevation dependence is related to the type of observation. In particular, the precision of B2 code observations seems to be independent of satellite’s elevation angle. In BDS dual-frequency precise positioning, the precision characteristics of different types of observations should be considered.
3.4. Relationship between the Time Correlation and Positioning Accuracy
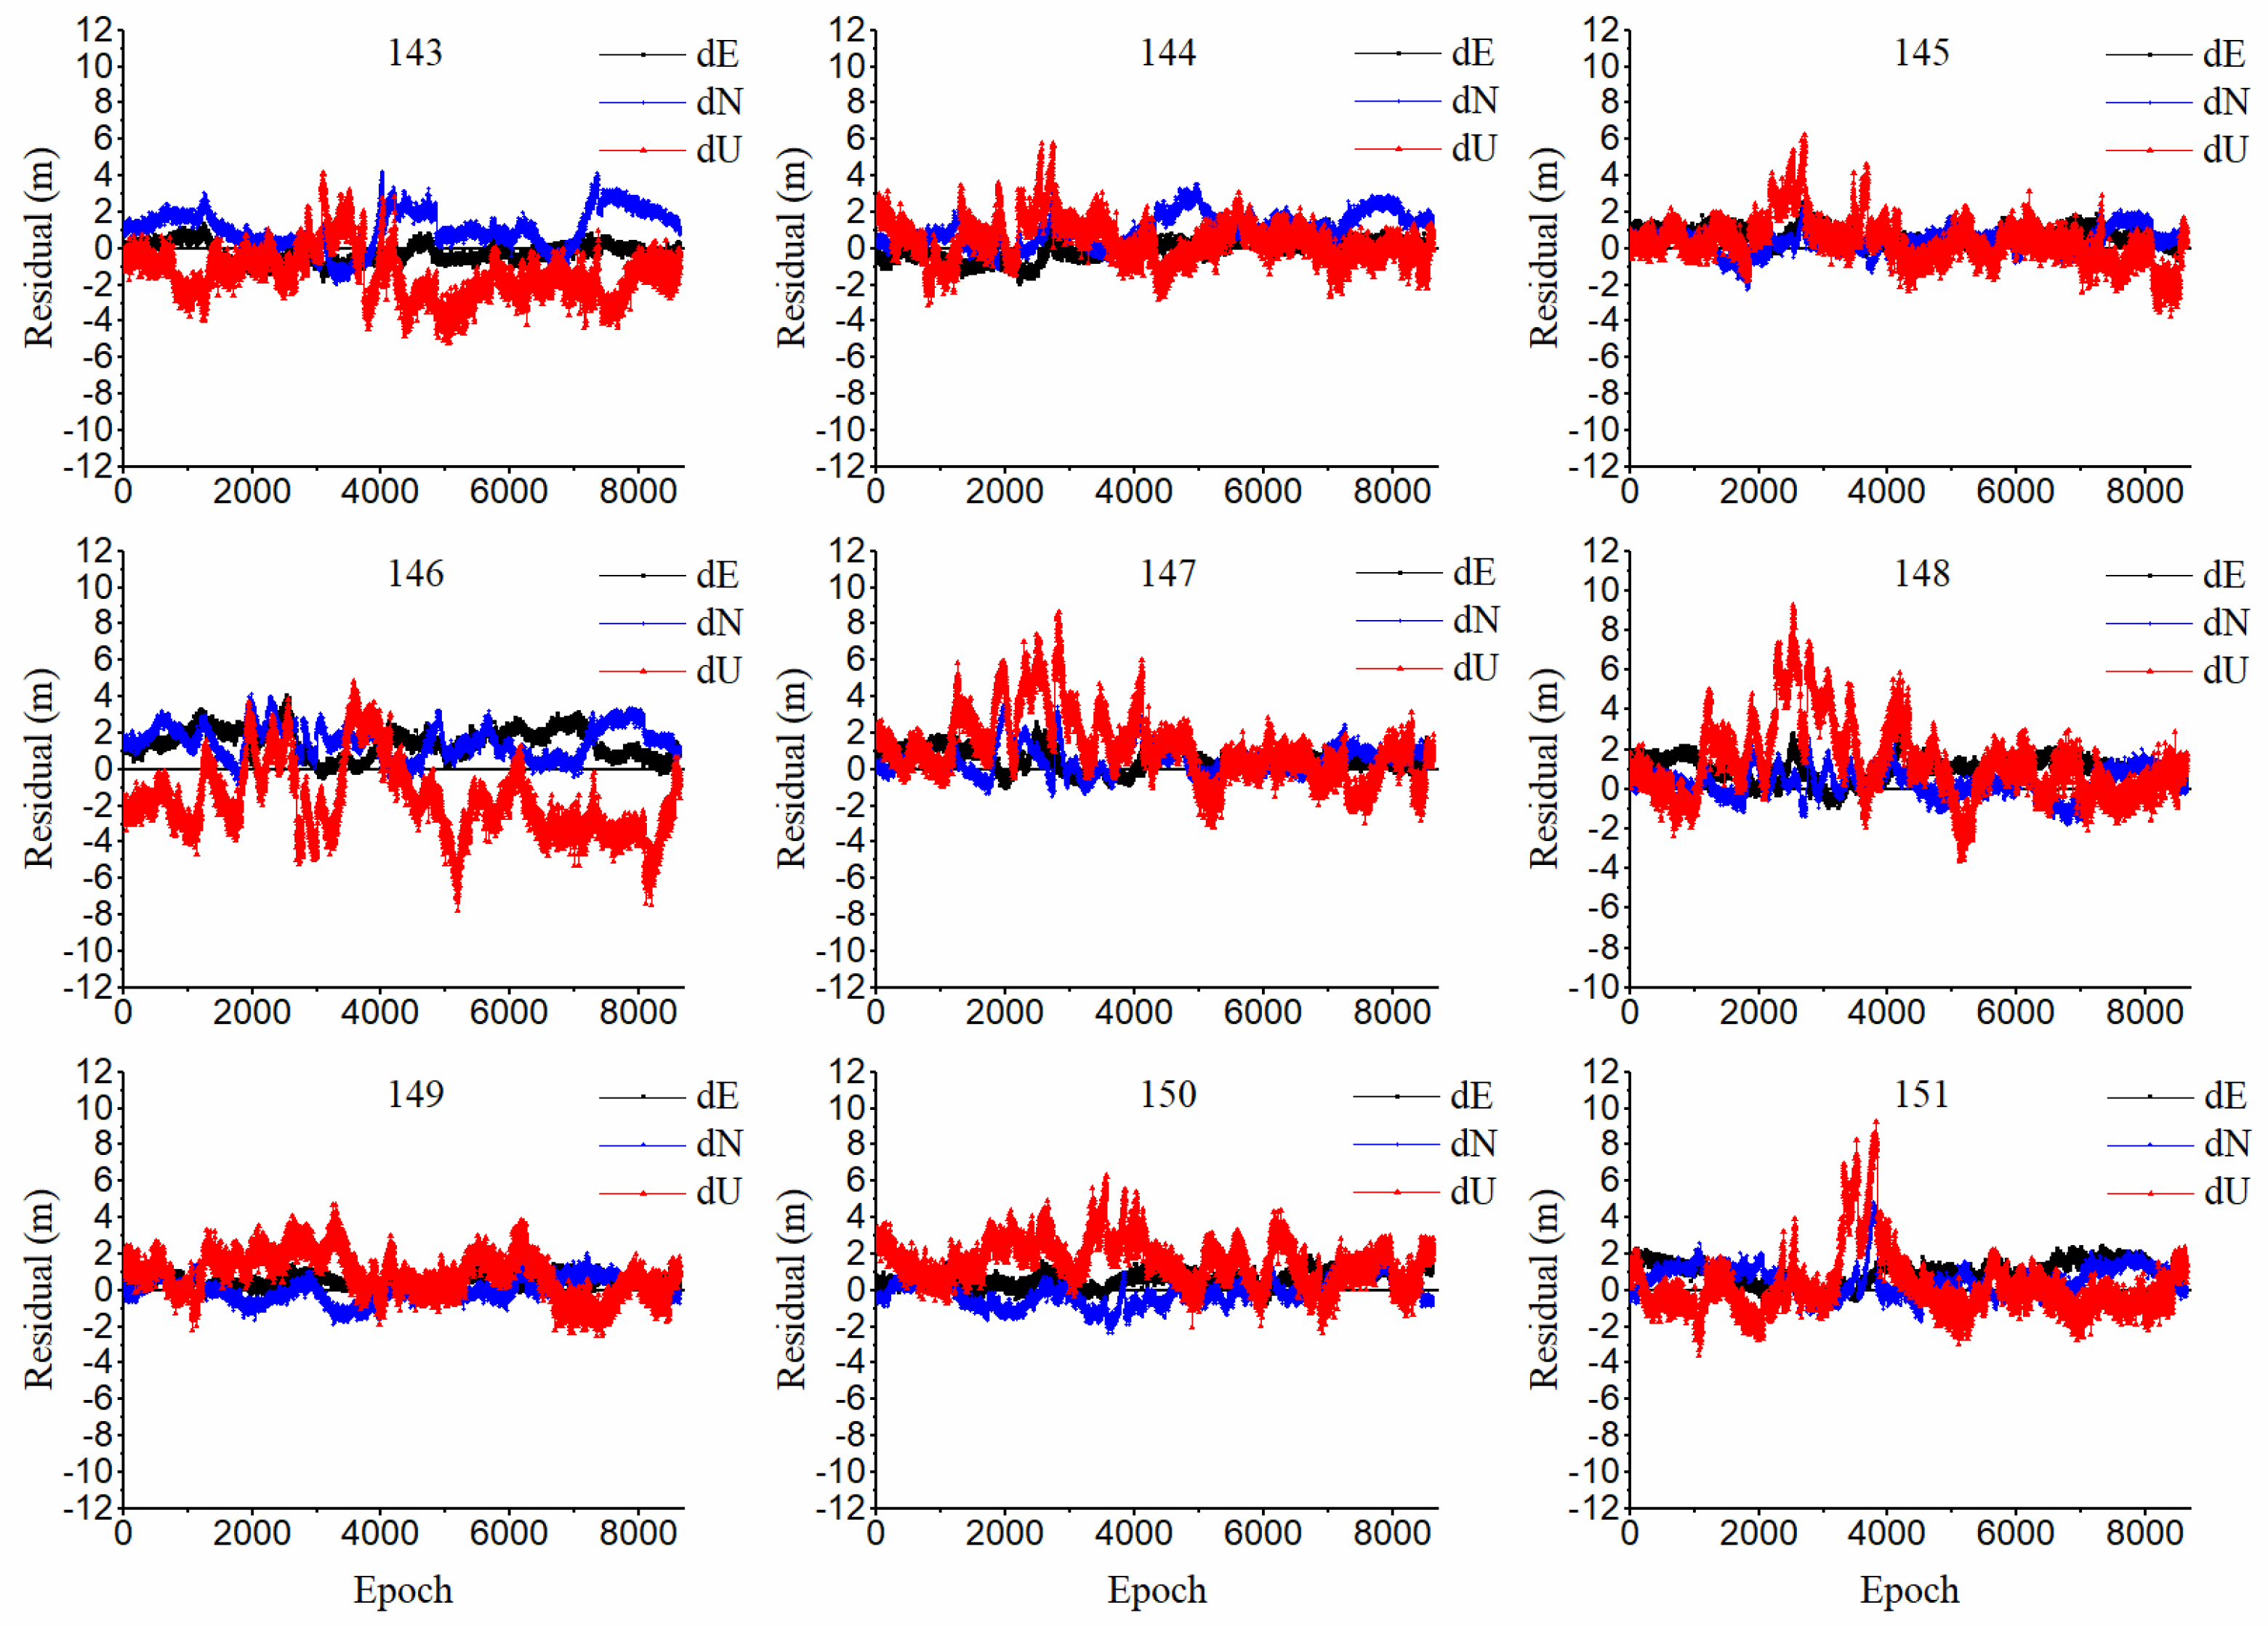
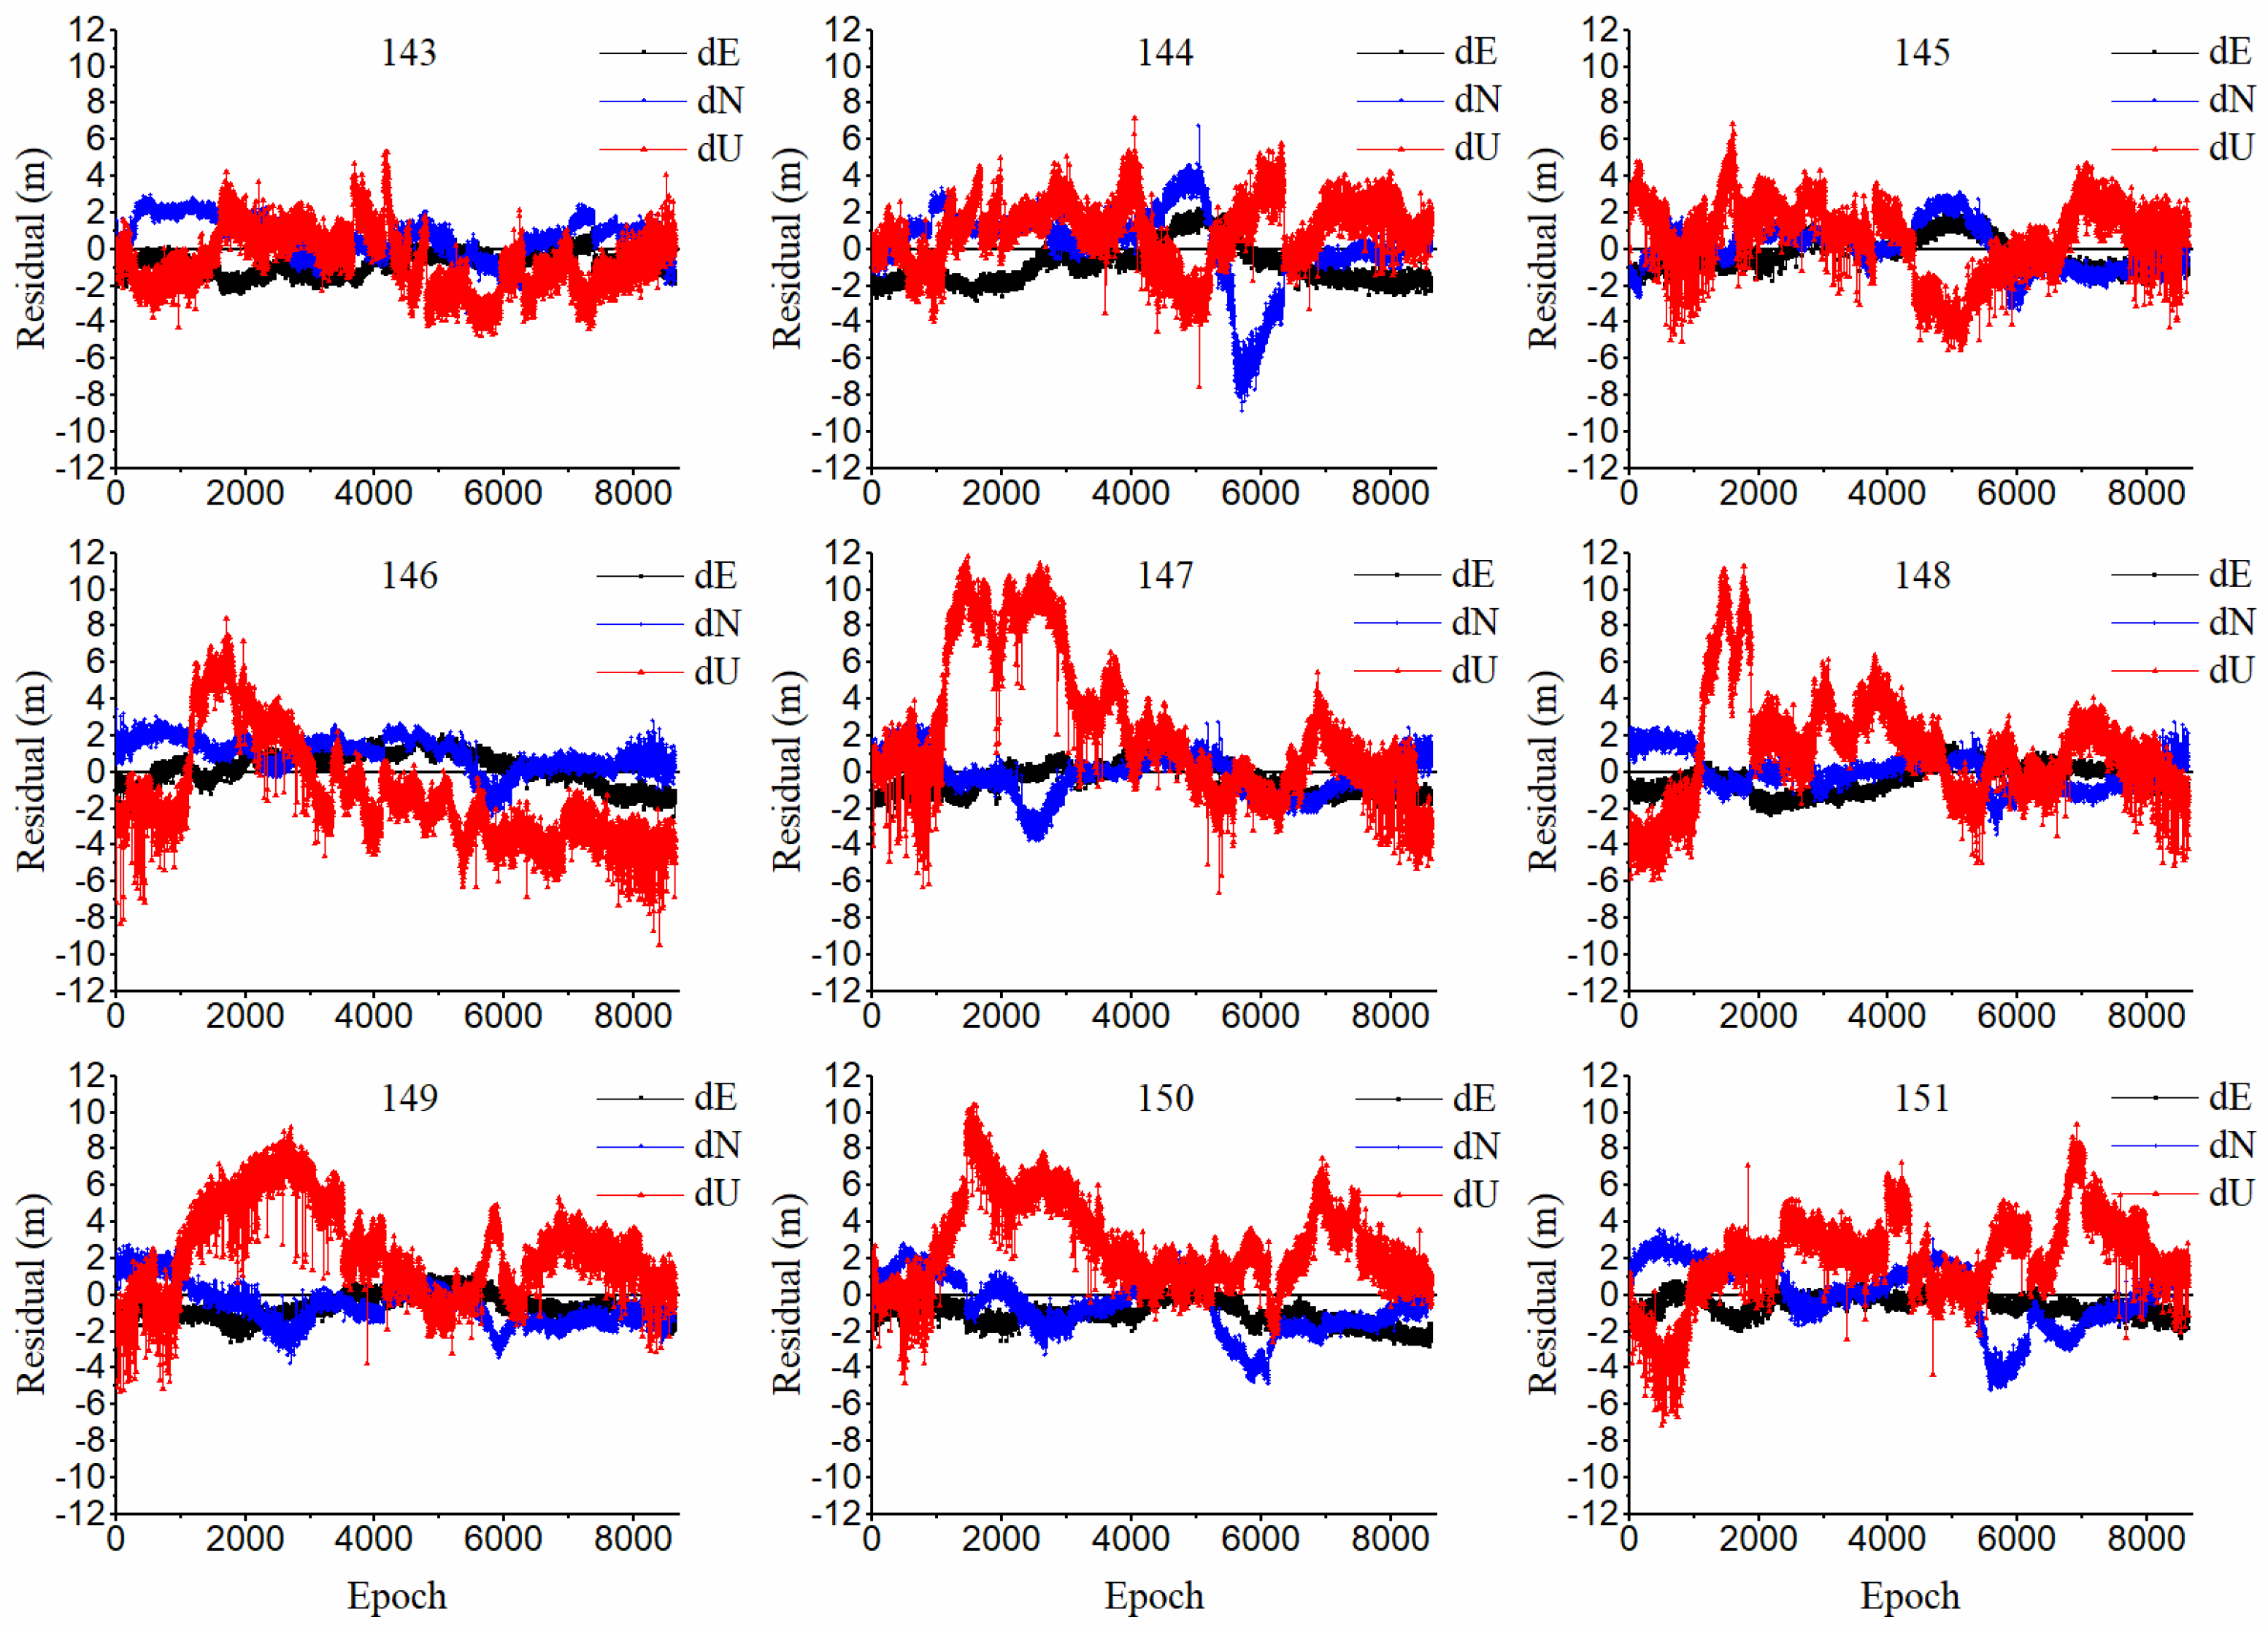
Because the most popular stochastic model is the elevation-dependent model, for the stochastic properties of code measurements, we examined the residuals from a least-squares adjustment (Figure 10 and Figure 11). According to the previous analysis, the precision of BDS and GPS code measurements is almost at the same level and, as shown in Figure 9, the B1 and C1 code observations show a strong elevation dependence. Therefore, we used the traditional elevation-dependent model to analyze the influence of time correlation on positioning accuracy. It should be noted that the residual sequences in Figure 10 and Figure 11 are all calculated using B1and C1 code observations. The traditional elevation-dependent model can be expressed as
where is the variance of the observation, , and E is the elevation angle. According to Table 1, we set m.
The E, N, and U residuals from DOY 143 to 151, 2016, are calculated by single-point positioning (SPP). The reference coordinates are calculated using precise point positioning (PPP). Table 2 gives the 9-day daily positioning residual statistics calculated by SPP for GPS and BDS single systems. Compared to the time-series results, the positioning accuracy of BDS is lower than that of GPS, especially in the N and U directions. As is known, owing to various types of errors, the SPP positioning accuracy is ~3–5 m in three dimensions, while the GPS positioning accuracy is ~2.3 m and that of BDS is ~3.5 m. The SPP experimental results show that, even though the BDS and GPS pseudorange measurement precisions are almost at the same level but subject to the influence of time correlation, the BDS positioning accuracy is still relatively lower when compared to that of GPS.
4. Discussion
A stochastic model describes the observation precisions and their correlations with each other [12,32]. The established stochastic model should consider the precision and the formulation of the time correlation of the observations [33]. However, the widely used stochastic models usually ignore the fact that different types of pseudorange observations have different precision [12]. In addition, because BDS consists of three types of satellite orbits, the time correlation among their pseudorange observations and its influence on the positioning performance are not clear. In this contribution, the characteristics of different types of pseudorange observations of BDS and GPS, including observation precision, time correlation, and the influence on the positioning results, are analyzed. Experimental results show that the precision of different types of observations is not the same and the GEO and IGSO satellites suffer from significant time correlation, which means that an accurate stochastic model should be established.
Even though the results in this article have contributed to revealing the characteristics of BDS pseudorange observations, several associated aspects still require further studies. In future research, more types of receivers should be used to test whether the characteristics of the pseudorange observations are related to the brand of receiver. Nonetheless, the results of this paper should help in establishing the correct stochastic models.
5. Conclusions
The characteristics of satellite signals and their time correlation are crucial for establishing the correct stochastic model, which plays an important role in GNSS precise positioning. In this paper, 16-day zero-baseline data, collected by Trimble Net-R9 and ComNav 708, are used to analyze the signal characteristics and time correlation of the BDS compared with GPS. For code measurements, Figure 1 and Figure 2 show that the precision of BDS is almost at the same level as that of GPS for both types of receiver. However, because only three MEO satellites are operating normally for BDS, the deviation of MEO satellites is much higher than that of GEO, IGSO, and GPS satellites. For BDS satellites, the GEO satellite seems to have the best precision, but its standard deviation is significantly higher than that of GPS satellites. The IGSO signal has obvious periodic characteristics. Analysis of the multipath shows that there are significant differences in magnitude and trend. The periodic characteristics of IGSO satellites should not be affected by the multipath error. The GPS C/A code and BDS B1 code observations have a strong elevation dependence. However, although the P2 and B2 code observations have a certain relationship with the elevation angles, the performance is not obvious. In other words, the elevation-dependent model is not the most suitable for dual-frequency precise positioning.
Through the analysis of the correlation coefficient of the pseudorange measurements using the autocorrelation function, it can be seen that the observations of MEO and IGSO satellites are more affected by the time correlation. Especially for GEO satellites, the correlation coefficients for the Trimble receiver are maintained at ~0.75 and the correlation coefficients of the ComNav receiver are still >0.63 despite a slight reduction. The observed values of GEO satellites are strongly correlated. The SPP results show that even if the BDS and GPS observations have similar precision, the BDS positioning residuals are still higher than those of GPS.
Author Contributions
H.H. and R.K. conceived and designed the experiments; H.H. performed the experiments, analyzed the data, and wrote the paper; S.J. reviewed and modified the paper; R.K. collected the data; X.Y. assisted in the prepared work and validation work. All authors provided feedback on the text to significantly improve the quality of the manuscript.
Funding
The work is supported by the National Natural Science Foundation of China (Grant No. 41704036), the University Natural Science Research Project of Anhui Province (Grant No. KJ2016A019), and a project funded by the NASG Key Laboratory of Land Environment and Disaster Monitoring (No. LEDM2014B02).
Acknowledgments
The authors gratefully acknowledge IGS Multi-GNSS Experiment (MGEX) for providing GNSS products. The authors would like to thank the reviewers for their valuable comments and suggestions.
Conflicts of Interest
The authors declare no conflict of interest.
References
- Tang, W.; Deng, C.; Shi, C.; Liu, J. Triple-frequency carrier ambiguity resolution for BeiDou navigation satellite system. GPS Solut. 2014, 18, 335–344. [Google Scholar] [CrossRef]
- Teunissen, P.; Joosten, P.; Tiberius, C. A comparison of TCAR, CIR and LAMBDA GNSS ambiguity resolution. In Proceeding of the 15th International Technical Meeting of the Satellite Division of the Institute of Navigation (ION GPS-2002), Portland, OR, USA, 24–27 September 2002; pp. 2799–2808. [Google Scholar]
- Gao, G.X.; Chen, A.; Lo, S.; De Lorenzo, D.; Walter, T.; Enge, P. Compass-M1 broadcast codes in E2, E5b, and E6 frequency bands. IEEE J. Sel. Top. Signal Process. 2009, 3, 599–612. [Google Scholar] [CrossRef]
- Liu, J.; Geng, T.; Zhao, Q. Enhancing precise orbit determination of compass with inter-satellite observations. Surv. Rev. 2011, 43, 333–342. [Google Scholar] [CrossRef]
- Hauschild, A.; Montenbruck, O.; Sleewaegen, J.M.; Huisman, L.; Teunissen, P.J.G. Characterization of Compass M-1 signals. GPS Solut. 2012, 16, 117–126. [Google Scholar] [CrossRef]
- Shi, C.; Zhao, Q.L.; Hu, Z.G.; Liu, J.N. Precise relative positioning using real tracking data from COMPASS GEO and IGSO satellites. GPS Solut. 2013, 17, 103–119. [Google Scholar] [CrossRef]
- Verhagen, S.; Teunissen, P.J.G. Ambiguity resolution performance with GPS and BeiDou for LEO formation flying. Adv. Space Res. 2014, 54, 830–839. [Google Scholar] [CrossRef]
- Li, X.; Ge, M.; Dai, X.; Ren, X.; Fritsche, M.; Wickert, J.; Schuh, H. Accuracy and reliability of multi-GNSS real-time precise positioning: GPS, GLONASS, BeiDou, and Galileo. J. Geodesy 2015, 89, 607–635. [Google Scholar] [CrossRef] [Green Version]
- Lou, Y.D.; Gong, X.P.; Gu, S.F.; Zheng, F.; Feng, Y.M. Assessment of code bias variations of BDS triple-frequency signals and their impacts on ambiguity resolution for long baselines. GPS Solut. 2017, 21, 177–186. [Google Scholar] [CrossRef]
- Li, B. Stochastic modeling of triple-frequency BeiDou signals: Estimation, assessment and impact analysis. J. Geodesy 2016, 90, 593–610. [Google Scholar] [CrossRef]
- Eueler, H.-J.; Goad, C.C. On Optimal Filter of GPS dual frequency observations without using orbit information. Bull. Géodésique 1991, 65, 130–143. [Google Scholar] [CrossRef]
- Li, B.; Lou, L.; Shen, Y. GNSS elevation-dependent stochastic modeling and its impacts on the statistic testing. J. Surv. Eng. 2015, 142. [Google Scholar] [CrossRef]
- Brunner, F.K.; Hartinger, H.; Troyer, L. GPS signal diffraction modelling: The stochastic SIGMA-δ model. J. Geodesy 1999, 73, 259–267. [Google Scholar] [CrossRef]
- Han, S. Quality-control issues relating to instantaneous ambiguity resolution for real-time GPS kinematic positioning. J. Geodesy 1997, 71, 351–361. [Google Scholar] [CrossRef]
- Li, B.; Zhang, L.; Verhagen, S. Impacts of BeiDou stochastic model on reliability: Overall test, w-test and minimal detectable bias. GPS Solut. 2017, 21, 1095–1112. [Google Scholar] [CrossRef]
- Yang, L.; Li, B.F.; Li, H.J.; Rizos, C.; Shen, Y.Z. The influence of improper stochastic modeling of Beidou pseudoranges on system reliability. Adv. Space Res. 2017, 60, 2680–2690. [Google Scholar] [CrossRef]
- Satirapod, C.; Wang, J. Comparing the Quality Indicators of GPS Carrier Phase Observations. Geomat. Res. Australas. 2001, 73, 75–92. [Google Scholar]
- Bona, P. Precision, cross correlation, and time correlation of GPS phase and code observations. GPS Solut. 2000, 4, 3–13. [Google Scholar] [CrossRef]
- Tiberius, C.; Kenselaar, F. Variance component estimation and precise GPS positioning: Case study. J. Surv. Eng. 2003, 129, 11–18. [Google Scholar] [CrossRef]
- Foucras, M.; Leclère, J.; Botteron, C.; Julien, O.; Macabiau, C.; Farine, P.-A.; Ekambi, B. Study on the cross-correlation of GNSS signals and typical approximations. GPS Solut. 2017, 21, 293–306. [Google Scholar] [CrossRef]
- Teunissen, P.J.G.; Amiri-Simkooei, A.R. Least-squares variance component estimation. J. Geodesy 2008, 82, 65–82. [Google Scholar] [CrossRef]
- Guo, F.; Zhang, X.; Wang, J.; Ren, X. Modeling and assessment of triple-frequency BDS precise point positioning. J. Geodesy 2016, 90, 1223–1235. [Google Scholar] [CrossRef]
- Jonkman, N.F. Integer GPS-Ambiguity Estimation without the Receiver-Satellite Geometry; TU Delft: Delft, The Netherlands, 1998. [Google Scholar]
- Wanninger, L.; Beer, S. BeiDou satellite-induced code pseudorange variations: Diagnosis and therapy. GPS Solut. 2015, 19, 639–648. [Google Scholar] [CrossRef]
- Guo, F.; Li, X.; Liu, W. Mitigating BeiDou Satellite-Induced Code Bias: Taking into Account the Stochastic Model of Corrections. Sensors 2016, 16, 909. [Google Scholar] [CrossRef] [PubMed]
- Pan, L.; Xiaohong, Z.; Fei, G. Ambiguity resolved precise point positioning with GPS and BeiDou. J. Geodesy 2017, 91, 25–40. [Google Scholar] [CrossRef]
- Cao, X.; Zhang, S.; Kuang, K.; Liu, T.; Gao, K. The impact of eclipsing GNSS satellites on the precise point positioning. Remote Sens. 2018, 10, 94. [Google Scholar] [CrossRef]
- Teunissen, P.J.G.; Montenbruck, O. Springer Handbook of Global Navigation Satellite Systems; Springer: Cham, Switzerland, 2017. [Google Scholar]
- Teunissen, P.J.G. On the sensitivity of the location, size and shape of the GPS ambiguity search space to certain changes in the stochastic model. J. Geodesy 1997, 71, 541–551. [Google Scholar] [CrossRef]
- Li, B.; Shen, Y.; Xu, P. Assessment of stochastic models for GPS measurements with different types of receivers. Chin. Sci. Bull. 2008, 53, 3219–3225. [Google Scholar] [CrossRef]
- Wang, G.; de Jong, K.; Zhao, Q.; Hu, Z.; Guo, J. Multipath analysis of code measurements for BeiDou geostationary satellites. GPS Solut. 2015, 19, 129–139. [Google Scholar] [CrossRef]
- Wang, J.; Satirapod, C.; Rizos, C. Stochastic assessment of GPS carrier phase measurements for precise static relative positioning. J. Geodesy 2002, 76, 95–104. [Google Scholar] [CrossRef]
- Amiri-Simkooei, A.R.; Teunissen, P.J.G.; Tiberius, C. Application of least-squares variance component estimation to GPS observables. J. Surv. Eng. 2009, 135, 149–160. [Google Scholar] [CrossRef]
Figure 1.
Elevation angle change in a single day.

Figure 2.
ComNav statistical results of the C/A and B1 code precision of different types of observations. GPS = global positioning system; GEO = geostationary orbit; IGSO = inclined geosynchronous orbit; MEO = medium-altitude Earth orbit; STD = standard deviation; DOY = day of the year.
Figure 2.
ComNav statistical results of the C/A and B1 code precision of different types of observations. GPS = global positioning system; GEO = geostationary orbit; IGSO = inclined geosynchronous orbit; MEO = medium-altitude Earth orbit; STD = standard deviation; DOY = day of the year.

Figure 3.
Trimble statistical results of the C/A and B1 code precision of different types of observations.
Figure 3.
Trimble statistical results of the C/A and B1 code precision of different types of observations.

Figure 4.
Trimble C/A code measurement precision deviations for GPS, BeiDou GEO, IGSO, and MEO satellites.
Figure 4.
Trimble C/A code measurement precision deviations for GPS, BeiDou GEO, IGSO, and MEO satellites.

Figure 5.
ComNav C/A code measurement precision deviations for GPS, BeiDou GEO, IGSO, and MEO satellites.
Figure 5.
ComNav C/A code measurement precision deviations for GPS, BeiDou GEO, IGSO, and MEO satellites.

Figure 6.
Four-day multipath series of IGSO observations with the Trimble receiver.

Figure 7.
Trimble code measurement time correlations for GPS, and BeiDou GEO and IGSO satellites with a sampling interval of 10 s.
Figure 7.
Trimble code measurement time correlations for GPS, and BeiDou GEO and IGSO satellites with a sampling interval of 10 s.

Figure 8.
ComNav code measurement time correlations for GPS, and BeiDou GEO and IGSO satellites with a sampling interval of 10 s.
Figure 8.
ComNav code measurement time correlations for GPS, and BeiDou GEO and IGSO satellites with a sampling interval of 10 s.

Figure 9.
Relationship between precision and elevation angle of GPS and BeiDou Navigation Satellite System (BDS) code measurements.
Figure 9.
Relationship between precision and elevation angle of GPS and BeiDou Navigation Satellite System (BDS) code measurements.

Figure 10.
Positioning residuals of single-point positioning (SPP) with GPS code measurements.

Figure 11.
Positioning residuals of SPP with BDS code measurements.


Table 1.
Statistical results of the C/A and B1 code precision of different types of satellite observations (m). GPS = global positioning system; GEO = geostationary orbit; IGSO = inclined geosynchronous orbit; MEO = medium-altitude Earth orbit; STD = standard deviation.
Table 1.
Statistical results of the C/A and B1 code precision of different types of satellite observations (m). GPS = global positioning system; GEO = geostationary orbit; IGSO = inclined geosynchronous orbit; MEO = medium-altitude Earth orbit; STD = standard deviation.
| Receiver | Deviation | GPS | GEO | IGSO | MEO |
|---|---|---|---|---|---|
| ComNav 708 | mean | 0.07 | 0.09 | 0.11 | 0.10 |
| STD | 0.03 | 0.05 | 0.07 | 0.08 | |
| Trimble Net-R9 | mean | 0.17 | 0.15 | 0.14 | 0.15 |
| STD | 0.05 | 0.08 | 0.07 | 0.10 |
Table 2.
Position residuals of single-point positioning (SPP) with GPS and BeiDou Navigation Satellite System (BDS) (m). DOY = day of the year. RMSE = Root Mean Square in the East direction. RMSN = Root Mean Square in the North direction. RMSU = Root Mean Square in the Up direction.
Table 2.
Position residuals of single-point positioning (SPP) with GPS and BeiDou Navigation Satellite System (BDS) (m). DOY = day of the year. RMSE = Root Mean Square in the East direction. RMSN = Root Mean Square in the North direction. RMSU = Root Mean Square in the Up direction.
| DOY | GPS | BDS | ||||
|---|---|---|---|---|---|---|
| RMSE | RMSN | RMSU | RMSE | RMSN | RMSU | |
| 143 | 0.567 | 1.498 | 1.982 | 1.022 | 1.199 | 1.760 |
| 144 | 0.589 | 1.316 | 1.242 | 1.385 | 2.107 | 1.996 |
| 145 | 0.829 | 0.746 | 1.292 | 0.867 | 1.193 | 2.132 |
| 146 | 1.652 | 1.749 | 2.681 | 0.917 | 1.301 | 3.193 |
| 147 | 0.758 | 0.934 | 2.174 | 0.859 | 1.135 | 4.514 |
| 148 | 1.165 | 0.737 | 2.302 | 0.869 | 0.923 | 3.095 |
| 149 | 0.573 | 0.616 | 1.474 | 0.889 | 1.250 | 3.442 |
| 150 | 0.688 | 0.749 | 1.985 | 1.265 | 1.594 | 3.552 |
| 151 | 1.143 | 0.988 | 1.712 | 0.700 | 1.785 | 3.001 |
© 2018 by the authors. Licensee MDPI, Basel, Switzerland. This article is an open access article distributed under the terms and conditions of the Creative Commons Attribution (CC BY) license (http://creativecommons.org/licenses/by/4.0/).
Share and Cite
MDPI and ACS Style
Hu, H.; Jin, S.; Kang, R.; Cao, X. BeiDou Code Pseudorange Precision Estimation and Time Correlation Analysis from Trimble Net-R9 and ComNav 708 Receivers. Remote Sens. 2018, 10, 1083. https://0-doi-org.brum.beds.ac.uk/10.3390/rs10071083
AMA Style
Hu H, Jin S, Kang R, Cao X. BeiDou Code Pseudorange Precision Estimation and Time Correlation Analysis from Trimble Net-R9 and ComNav 708 Receivers. Remote Sensing. 2018; 10(7):1083. https://0-doi-org.brum.beds.ac.uk/10.3390/rs10071083
Chicago/Turabian StyleHu, Hong, Shuanggen Jin, Ruihong Kang, and Xinyun Cao. 2018. "BeiDou Code Pseudorange Precision Estimation and Time Correlation Analysis from Trimble Net-R9 and ComNav 708 Receivers" Remote Sensing 10, no. 7: 1083. https://0-doi-org.brum.beds.ac.uk/10.3390/rs10071083
Note that from the first issue of 2016, this journal uses article numbers instead of page numbers. See further details here.