Satellite Data to Improve the Knowledge of Geohazards in World Heritage Sites
by
 , , , and
Laura Pastonchi
1,*, 
Anna Barra
2,
Oriol Monserrat
2,
Guido Luzi
2,
Lorenzo Solari
1 and
Veronica Tofani
1 1
Department of Earth Sciences, University of Firenze, Via G. La Pira 4, 50121 Firenze, Italy
2
Centre Tecnològic de Telecomunicacions de Catalunya (CTTC/CERCA), Geomatics Division, 08860 Castelldefels, Spain
*
Author to whom correspondence should be addressed.
Remote Sens. 2018, 10(7), 992; https://0-doi-org.brum.beds.ac.uk/10.3390/rs10070992
Submission received: 11 May 2018
/
Revised: 15 June 2018
/
Accepted: 20 June 2018
/
Published: 22 June 2018
(This article belongs to the Special Issue Synthetic Aperture Radar (SAR) Technology Advance and for Cultural Heritage Applications)
Abstract
:According to the United Nations Educational, Scientific and Cultural Organization (UNESCO) agency, the World Heritage Sites (WHS) inscribed in the World Heritage List (WHL) must be safeguarded with an adequate protection system, in order to guarantee their integrity and authenticity. Currently, many UNESCO sites are threatened by geohazards, but the safeguard of these sites does not seem to be wide-ranging. Looking at the standard list of factors affecting the Outstanding Universal Value (OUV) of WHS, which has been adopted by the World Heritage Committee in 2008, it seems that only “sudden geological events” are considered as factors that undermine the protection of the properties. Furthermore, it is well known that slow-kinematic phenomena can also threaten cultural and natural heritage. This study proposes a satellite InSAR-based procedure to identify and monitor the temporal and spatial evolution of ground deformation related to slow-kinematic geohazards (slow-moving landslides and ground-subsidence). This procedure, applied in this work on the Tuscany Region (Italy), simplify the InSAR products interpretation, making them easily exploitable by the local WHS managers for long-term geohazards monitoring and conservation strategies. These activities, thanks to the main characteristics of the recent Sentinel-1 data (short revisit time, free availability without any restrictions and worldwide coverage), can be defined for each UNESCO site of the world.
1. Introduction
Nowadays, ensuring the safeguard of natural and cultural sites is increasingly difficult, due to not only anthropic actions but also natural events [1]. These calamities also affect some of the 1073 UNESCO natural, cultural, and mixed properties (update of January 2018), which have been registered since 1978 on the WHL. These priceless and irreplaceable sites, because of their exceptional characteristics, can be considered to be of “Outstanding Universal Value (OUV)” [2].
The scientific community has cross-compared these proprieties with different geological databases to provide a statistical estimation of UNESCO WHS affected by geological risks. A recent study [3] shows that ~60% of the WHL sites are exposed to at least one geological hazard and that the most frequent ones are earthquakes and landslides. In Europe, 16% of the WH properties belong to the high seismic hazard category, 12% and 14% have very high and high landslide susceptibility, respectively and at least 7% of them have high volcanic hazard [4]. At the national scale, 45% of the Italian UNESCO sites are affected by landslides [4], whereas subsidence and landslides are the geohazards that mainly threaten the stability of United Kingdom World Heritage Sites (18.6% and 11.5% of the total susceptible land, respectively [5]).
Even though it is widely recognized that WHS are threatened by geological factors, the level of attention placed on geohazards appears to be poor [3], especially if compared with the other potential threatening factors, such as wars, uncontrolled urban development, or arson [6].
This unawareness can be found within the Periodic Reporting that the State Parties submit every six years to the World Heritage Committee, in order to provide “up-dated information about the World Heritage properties to record the changing circumstances and state of conservation of the properties” [7]. Particularly, within the II Cycle of UNESCO reports (2008–2015), where a standard list of factors affecting the OUV of the World Heritage proprieties is present [8], only some “sudden ecological and geological events” are included: volcanic eruption, earthquake, tsunami/tidal wave, avalanche/landslide, erosion and siltation/deposition, and wildfire. Unfortunately, not only these geological factors can threaten cultural and natural heritage, but also slow-kinematic phenomena, such as slow-moving landslides (as defined by [9]) and ground-subsidence [6,10,11,12].
In this context, a greater knowledge of the potential impact of such phenomena could be increased with the geoinformation obtained through the space-borne InSAR (Interferometric Synthetic Aperture Radar) techniques [13], which can be an important supporting tool for WHS condition assessment.
In the last decade, Persistent Scatterer Interferometry (PSI; [14,15]), turned out to be a powerful tool to identify and monitor slow-kinematic geological factors [16,17,18,19,20,21,22,23,24]. PS are mainly stable elements on the ground, e.g., rocks, buildings or roads; for this reason, the PSI analysis is optimal in urban centers. Recently, new significant improvements in remote investigations are guaranteed by the SqueeSAR technique [25]. This technique jointly detects PS, and DS (Distributed Scatterers), which are principally pastures, debris areas, or uncultivated fields. Thus, the SqueeSAR technique allows excellent ground deformation monitoring, not only in strongly anthropized areas, but also in non-urban areas, where the number of PS is limited [26,27]. PSInSAR and SqueeSAR techniques have also been exploited for conservation strategies in cultural and natural heritage, mainly for their non-invasiveness in the investigated assets [28,29]. The launch in 2014 of the Sentinel-1 constellation has drastically increased the possible applications of PSI for mapping and monitoring geohazards. These new generation satellites acquire on the same area with a 6-day revisiting time and their images are freely available with worldwide coverage. All these characteristics, in addition to a regular acquisition plan, are fundamental to designing long-term geohazard monitoring strategies [30,31,32]. An excellent procedure based on Sentinel-1 data has been recently proposed in Ref. [33], which allows identifying the most critical ground deformation, named Active Deformation Areas (ADA), in the investigated area.
The aim of this work is to exploit the wide area coverage capability of PSI data to fill the current gaps in the UNESCO sites safeguarding system. In this framework, we propose a simple and repeatable procedure to identify and monitor ground deformation related to different types of geohazards (slow-moving landslides and ground-subsidence), within the boundaries of UNESCO sites. This product can be easily exploited by the local stakeholders of each UNESCO site as a guide to managing the huge amount of satellite data (currently absent for cultural heritage applications, see [13]), and thus identify, in a fast and simple way, the main ground movements. Furthermore, it can be useful, through the integration with additional data (e.g., geohazard inventories, ground truth information, etc.) and on-site investigations, to update the UNESCO reports for each WHS, inserting, if present, the slow-kinematic phenomena that are not currently included in the list of factors affecting the UNESCO sites. To illustrate the proposed procedure, 7 UNESCO proprieties of Tuscany Region (Italy), have been chosen as test sites. Envisat (2003–2010) and Sentinel-1 (2014–2017) datasets, processed with different PSI techniques, have been analyzed.
2. Procedure for the Identification and Updating of Slow-Kinematic Ground Deformation in UNESCO Sites
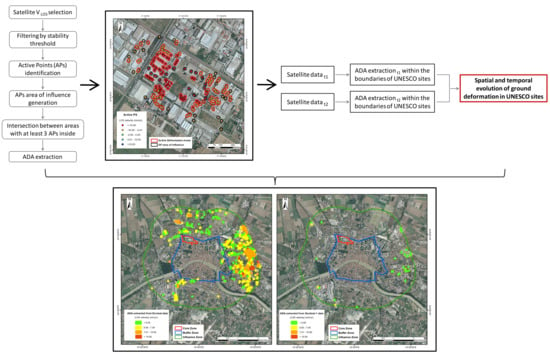
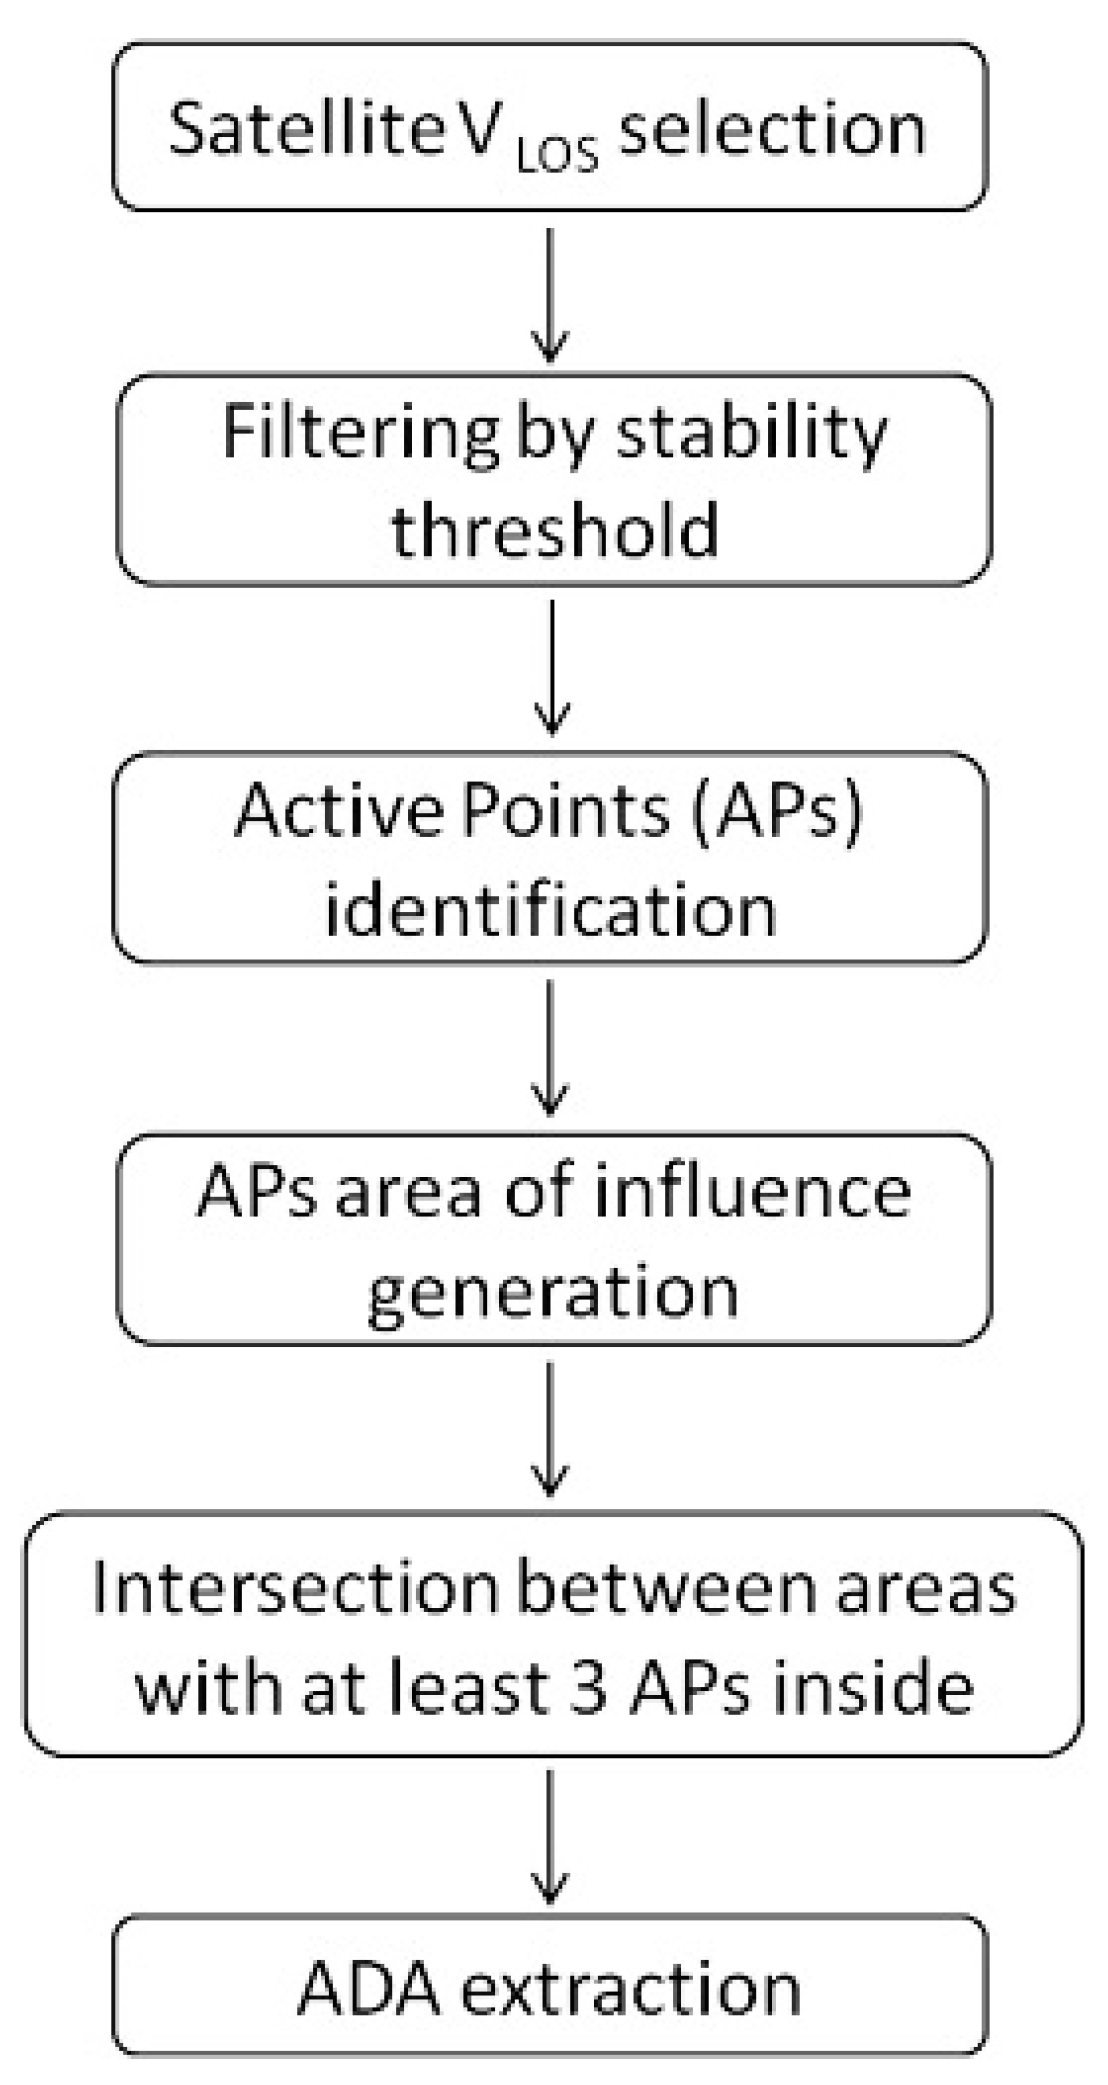
The identification of moving areas is based on a simple, fast, and repeatable procedure proposed by Ref. [33], here adapted for the specific aims of this work: Figure 1 shows a scheme of this approach. This methodology allows identifying ADA, which are defined as areas of intense ground motion that could be due to potential geohazards (slow-moving landslides and ground-subsidence). The huge amount of data contained in the satellite datasets (millions of PS), is managed on a Geographic Information System (GIS) platform through the following steps. First, all the PS velocity measurements acquired along the satellite line of sight (VLOS) are filtered, with a threshold value that is twice the standard deviation (2σ) of all the velocity measurements. At this stage, “active” points (|VLOS|> 2σ), are distinguished from those in which a movement has not been detected (|VLOS|≤ 2σ). Subsequently, for each “active” point (AP), a circular area of influence is defined on the basis of the size of the ground resolution cell of the SAR images. Among all the buffered APs, only those intersecting each other and forming a polygon with at least 3 APs inside are considered an ADA (Figure 2). This choice was made to perform a local scale analysis on a regional dataset (downscale process). This allowed identifying even small active deformation that may compromise the conservation of the UNESCO proprieties. Finally, to obtain the magnitude of each ADA, the average of the APs velocities (in absolute value) included in the ADA are calculated.
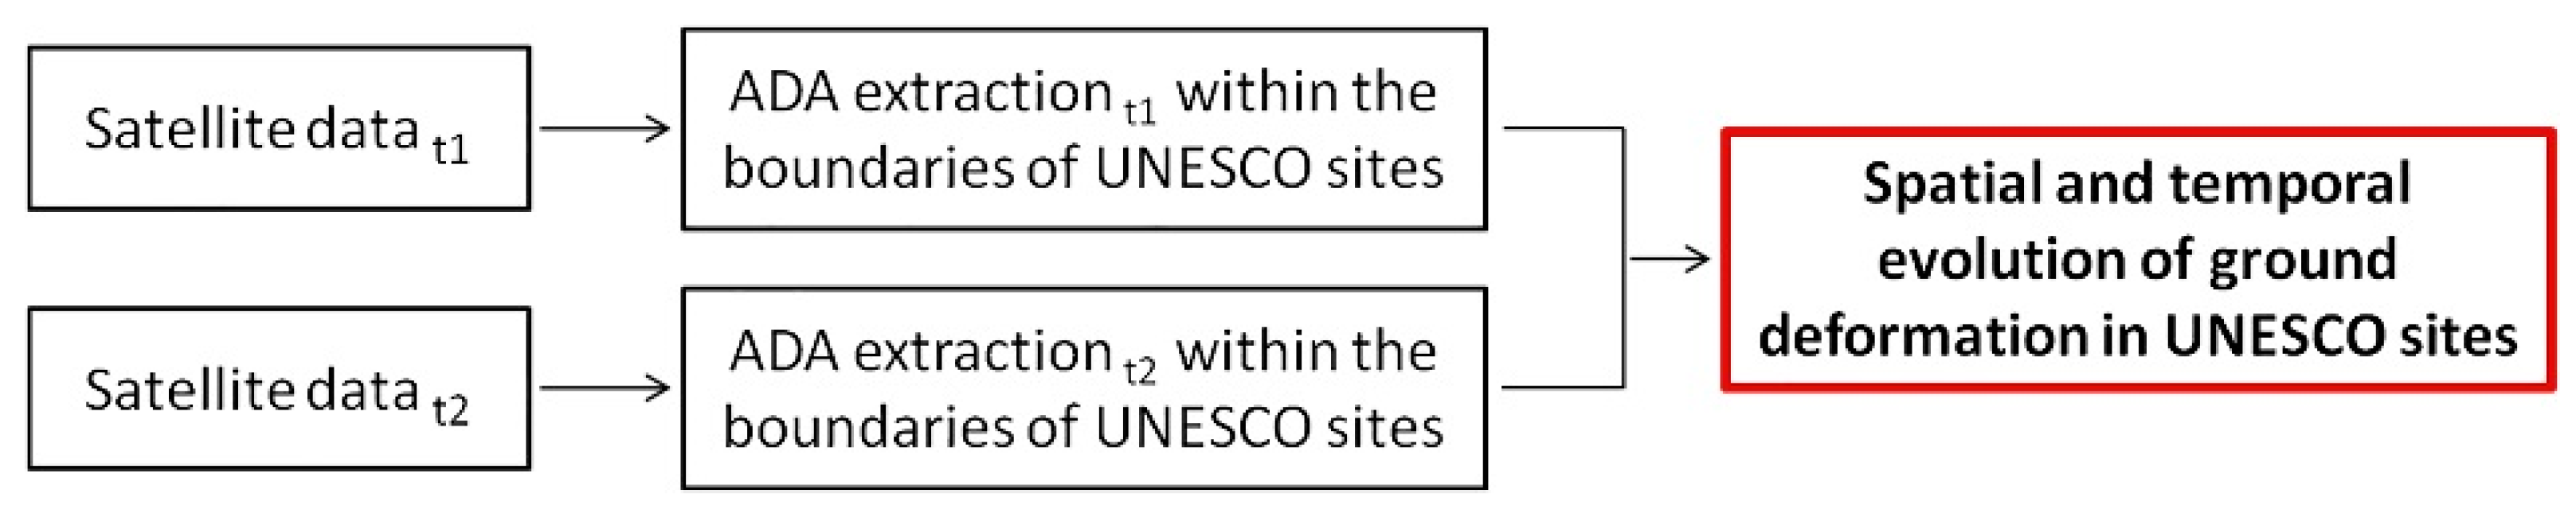
Comparing the characteristics of ADA extracted from two satellite datasets acquired at different times within the UNESCO sites boundaries, it is possible to identify the evolution of the most critical and reliable ground deformation over time. In Figure 3, a scheme of the applied procedure is shown. This product could be used by the local institutions responsible for each WHS as a tool to update the periodic reports and perform an assessment of the active geohazards (slow-moving landslides and ground-subsidence) identified.
The proposed procedure can be applied to any satellite SAR data; however, it provides the best performances with Sentinel-1 regional datasets.
3. An Overview of the UNESCO Sites in Tuscany
At the beginning of 2018, Italy, with a total of 53 proprieties, is the nation with the highest number of sites inscribed in the WHL [34].
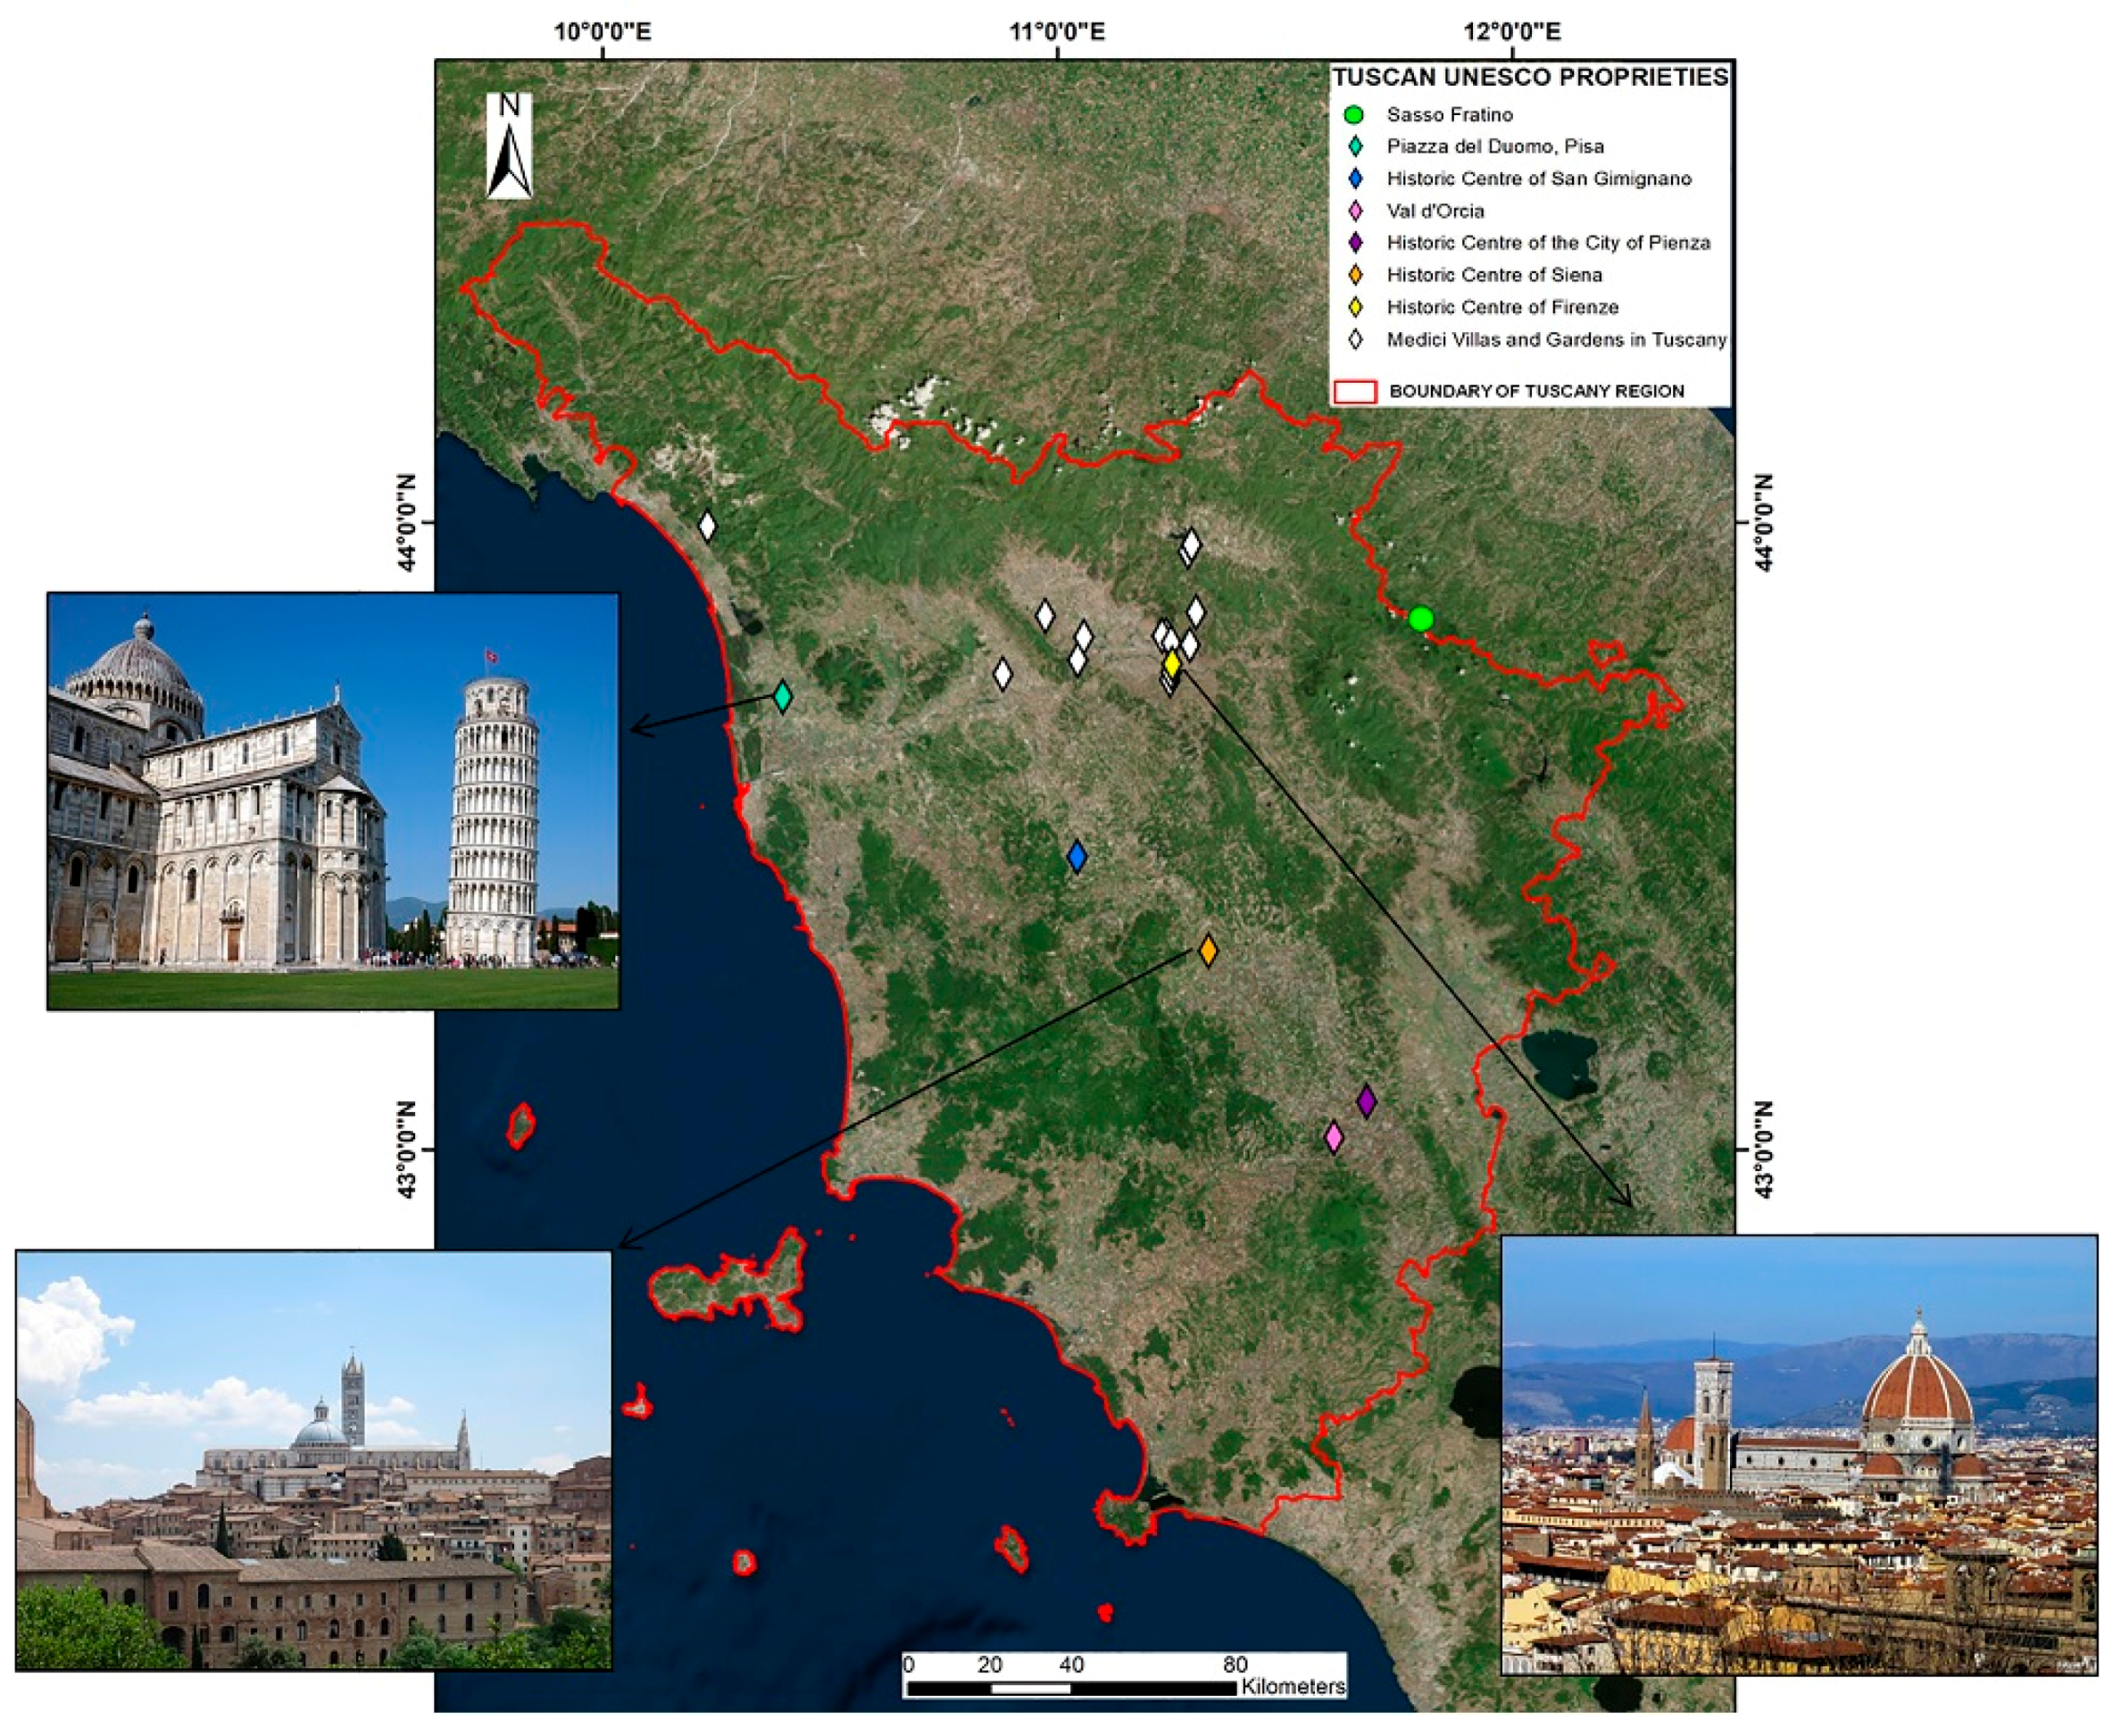
Eight of these 53 proprieties, both cultural and natural sites, are located in the Tuscany Region and they have been inscribed in the WHL in different years (Table 1), on the basis of different criteria assumed in Ref. [35].
The UNESCO cultural heritage sites in Tuscany are the Historic Center of Florence; Piazza del Duomo, Pisa; the Historic Center of San Gimignano; the Historic Center of Siena; the Historic Center of Pienza; Medici Villas and Gardens in Tuscany (14 proprieties), and Val d’Orcia. The natural site is The Sasso Fratino Nature Reserve, that is part of The Ancient and Primeval Beech Forests of the Carpathians and Other Regions of Europe (transboundary property of UNESCO). Due to its almost complete extension in Emilia Romagna Region, it is not among the sites investigated here. A map indicating the location of these sites is shown in Figure 4.
The 20 aforementioned cultural sites (14 Medicean proprieties plus the other six sites) are the symbol of the flourishing economic, cultural, and social development that has involved the Tuscan territory over several centuries of history. Each property has a specific boundary formally called Core Zone, and another boundary called Buffer Zone. A Buffer Zone is an area surrounding the Core Zone, where only activities compatible with the conservation objectives of UNESCO proprieties can take place. In other words, a Buffer Zone plays a fundamental role in guaranteeing the Outstanding Universal Value of a Core Zone [36]. As shown in Table 1, only the Historic Centers of San Gimignano and Pienza, are not currently provided with a Buffer Zone.
In order to understand the degree of knowledge of geological risks in each of the aforementioned UNESCO sites, we analyze the most updated cycle of UNESCO reports (II Cycle—2008/2015). Within these reports, a “Factors Summary Table” that threaten the World Heritage proprieties is shown. At this table, some “sudden ecological or geological events” are listed. We found that at the Historic Centers of Siena and San Gimignano, at the Medicean proprieties, and at the Piazza del Duomo (Pisa), the earthquake is the most recognized geohazard, and it is indicated as negative and potential. Only at the San Gimignano UNESCO site, has landslide also been identified as a current and negative geohazard (Table 2). At the Historic Center of San Gimignano and at the Medici Villas and Gardens, the origin of the threats is both inside and outside the proprieties; at the Historic Center of Siena, it is inside the Core Zone while in Piazza del Duomo it is outside. Only for the current and negative factors does the UNESCO agency provides an assessment. Therefore, for the landside factor that affects the Historical Center of San Gimignano, the following parameters have been analyzed: spatial and temporal scale, impact, management response, and trend. It is important to underline that no further information is provided in this table, e.g., the method sused to identify the factors or more details about their assessment.
4. Data Collection
4.1. UNESCO Boundaries
Each World Heritage Site is characterized by a Core and a Buffer Zone, available at the UNESCO website [37]. These boundaries have been digitized in a Geographic Information System (GIS) platform in order to integrate them with the ADA.
The Historic Centers of San Gimignano and Pienza, unlike the other sites, are not currently provided with a Buffer Zone (see Table 1). By virtue of the fact that a Buffer Zone is necessary to guarantee the integrity of the Core Zone, new Buffer Zones for these two sites have been identified.
The project for the Buffer Zone of the Historic Center of Florence, proposed by Ref. [38] (approved by UNESCO on July 2015), has been taken as an example to define the new Buffer Zones. It is important to underline that this work has been done in a qualitative way, collecting all the necessary material in digital format, without carrying out on-site investigations. As indicated by Ref. [38], in order to demarcate a Buffer Zone, it is necessary to analyze both the anthropic and natural system, as they are components potentially capable of altering the identity of a place, or, in the case of a UNESCO site, changing its Outstanding Universal Value. In this study, we have collected information and databases regarding: use and land cover; infrastructures; hydrography and morphology; Sites of Regional Interest (Siti di Interesse Regionale—SIR); Protected Areas and Digital Terrain Models (DTM). Through the intersection of all thisinformation in a GIS environment, considering that the new Buffer Zones must have a manageable and realistic dimension, i.e., with borders unambiguously recognizable on digital cartography [36], two possible Buffer Zones for the Historic Center of Pienza and San Gimignano have been identified (4.569 ha and 5.800 ha, respectively).
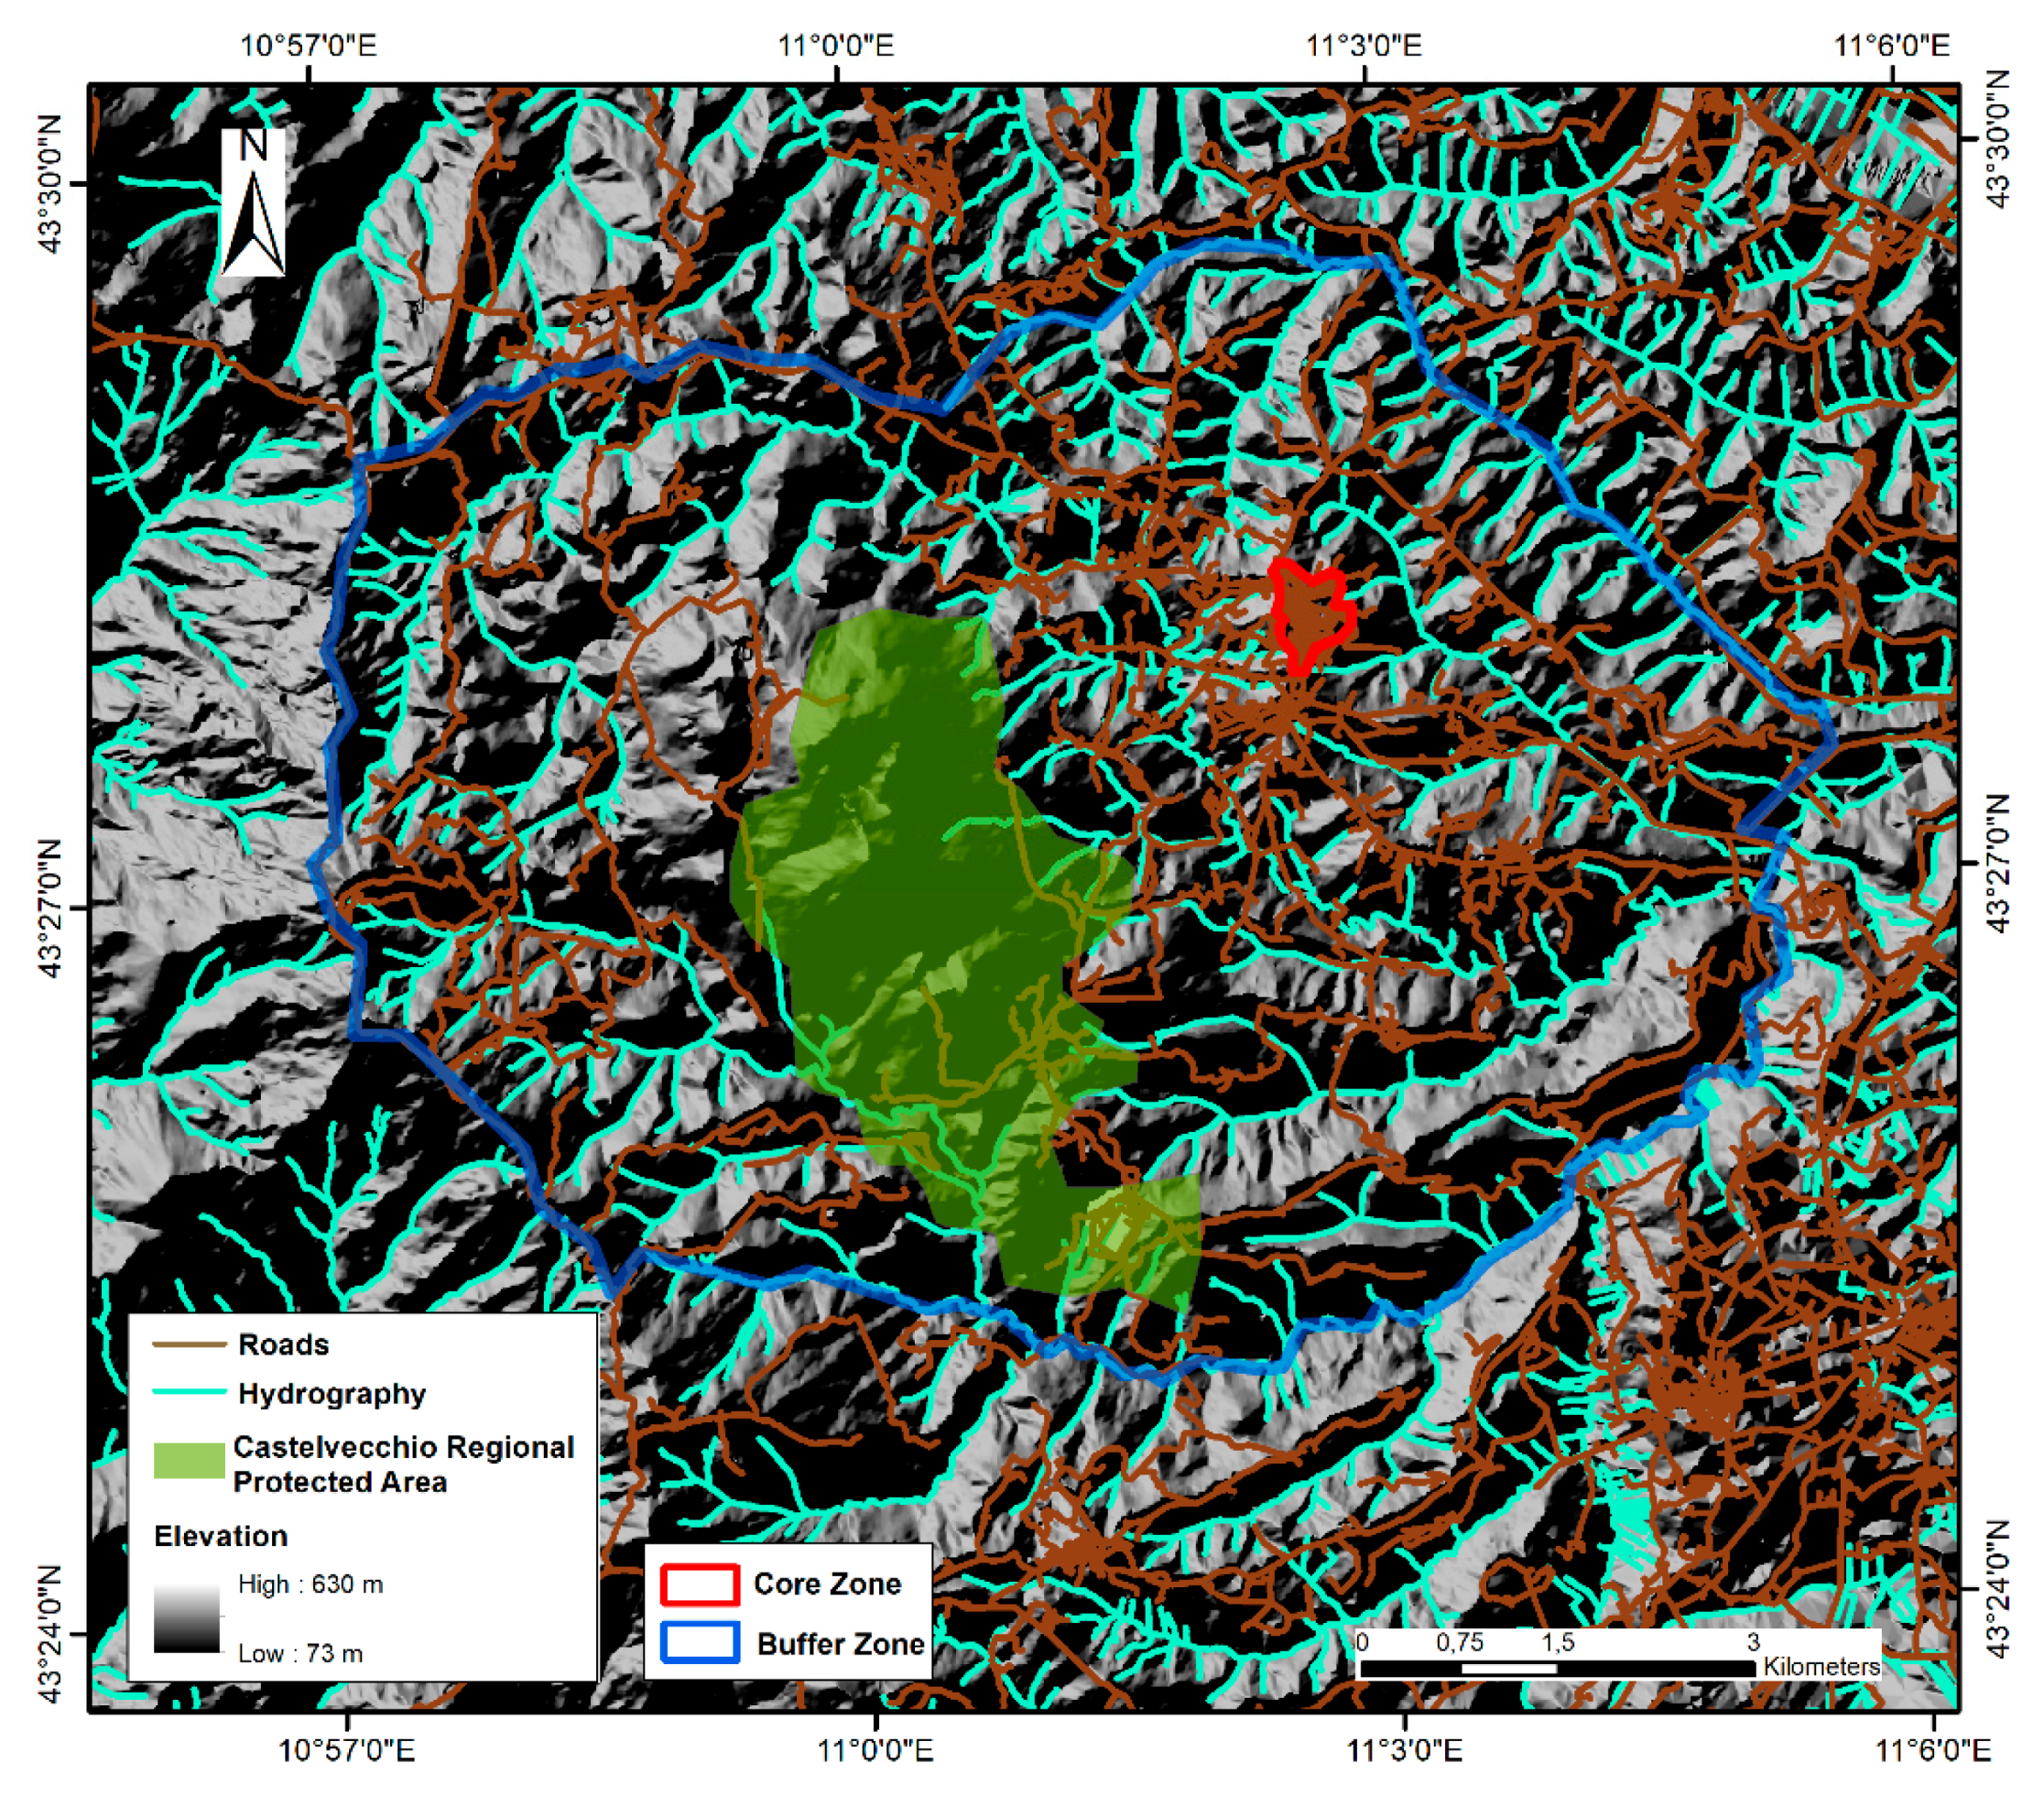
According to Ref. [38], between the natural and anthropic elements analyzed for the identification of the new Buffer Zone of the Historic Center of San Gimignano, the Castelvecchio Regional Protected Area stands out for its importance and, being very close to the San Gimignano Core Zone, has been included in its new Buffer Zone (see Figure 5).
4.2. The Influence Zones: New Boundaries
For a more reliable protection of the UNESCO sites, we analyze also the territory outside the Buffer Zones through the creation of new areas: the Influence Zones. This innovative idea arises from the awareness that a territory is no longer a static reality, but the continuous evolution of the environment by the hand of man and nature makes it a dynamic and more vulnerable system. Within such a dynamic reality, it is necessary to extend the monitoring of geological risks also to the territory immediately close to the Buffer Zones. The safeguard of this territory plays a fundamental role in guaranteeing the Outstanding Universal Value of the UNESCO sites. The new Influence Zones have been therefore created according to the following criteria. For the Medici Villas and Gardens, that have smaller Buffer Zones with respect to the other cultural sites (See Table 1), the Influence Zones surround the Buffer Zones within a 500 m range, whereas for the other proprieties, a distance of 1 km has been used.
4.3. Satellite Datasets
In this study, the proposed procedure has been applied over the entire Tuscany Region by using as input-data two PSI-derived velocity maps. The original datasets are C-band SAR datasets, acquired by the satellites Envisat and Sentinel-1 covering a total period of 10 years (Table 3). These datasets have been chosen in order to obtain a monitored period similar to the one chosen by UNESCO to update its reports (every six years). Envisat data have been processed in the framework of the PST-A Project (Piano Straordinario di Telerilevamento), thanks to the combined efforts of the private companies Telespazio and Tre-Europa. This project aimed at covering the entire national territory with interferometric products; the goal was achieved by combining PSP (Persistent Scatterer Pairs) and PSInSAR (Permanent Scatterers Interferometry) algorithms [40]. The reliability of these interferometric datasets has successfully been proven by other authors in other Italian case studies (e.g., [41,42]). Sentinel-1 data have been recently analyzed with the SqueeSAR algorithm [25], in the framework of a regional project aimed at frequently updating the knowledge of active ground motions over Tuscany by means of interferometric products [43]. Both datasets have been processed in ascending and descending orbits (see Table 3 for details), guaranteeing a better “radar interpretation” of the obtained results [44].
5. Results
5.1. The First Step of Active Deformation Areas (ADA) Extraction
Table S1 reports some basic information regarding the PSI datasets within each Tuscan UNESCO heritage site, in terms of mean and maximum velocity, and the number of Active Points (APs). These points have been identified as explained in Section 2 (Figure 1). The obtained results are clearly influenced by the type and dimension of the UNESCO contour analyzed. In fact, the Villas of Il Trebbio, Cafaggiolo and Careggi, and the Seravezza Palace do not register PS for some datasets within the contour of their Core Zone. It’s important to underline that the maximum velocity value is sometimes less representative of an active motion, i.e., being included or not into an ADA, because it can be related to deformation outliers, not triggered by a geohazard. The most important parameter shown in Table S1 is the number of APs; it is a proxy for apriori knowledge of the potential presence of ADA. In fact, if the number of APs is high, especially within small contours, it is more probable that the moving points will be grouped in one or more ADA. The variation of this number can be an index of a temporal variation of a certain phenomenon; for example, a strong reduction or increment of APs have been found within the Buffer and Transition Zones of the Historic Centers of Pisa and Florence, and in all the three zones of the Val d’Orcia UNESCO heritage site.
5.2. Active Deformation Areas (ADA) Extracted within the Boundaries of UNESCO Tuscan Sites
The extraction of ADA has been performed on each boundary (Core, Buffer, and Influence Zones) of every UNESCO heritage site. Thus, the PS datasets considered are the ones reported in Table S1.
Inside the Core, Buffer, and Influence Zones of each property, we have collected the following information regarding the ADA (Table 4): number of ADA (N°); maximum velocity (|vmax|), minimum velocity (|vmin|), and the percentage of the areal coverage of ADA (%). Each result, shown in Table 4, includes the values of ADA extracted both in ascending and descending orbit for each of the two datasets.
As shown in Table 4, ADA have been extracted only in some of the 20 UNESCO Tuscan sites, and some differences both among the three boundaries and between the two satellite acquisitions are present. However, it is important to underline that the lack of ADA does not univocally mean the absence of movement, but it could be due to satellite information unavailability [33].
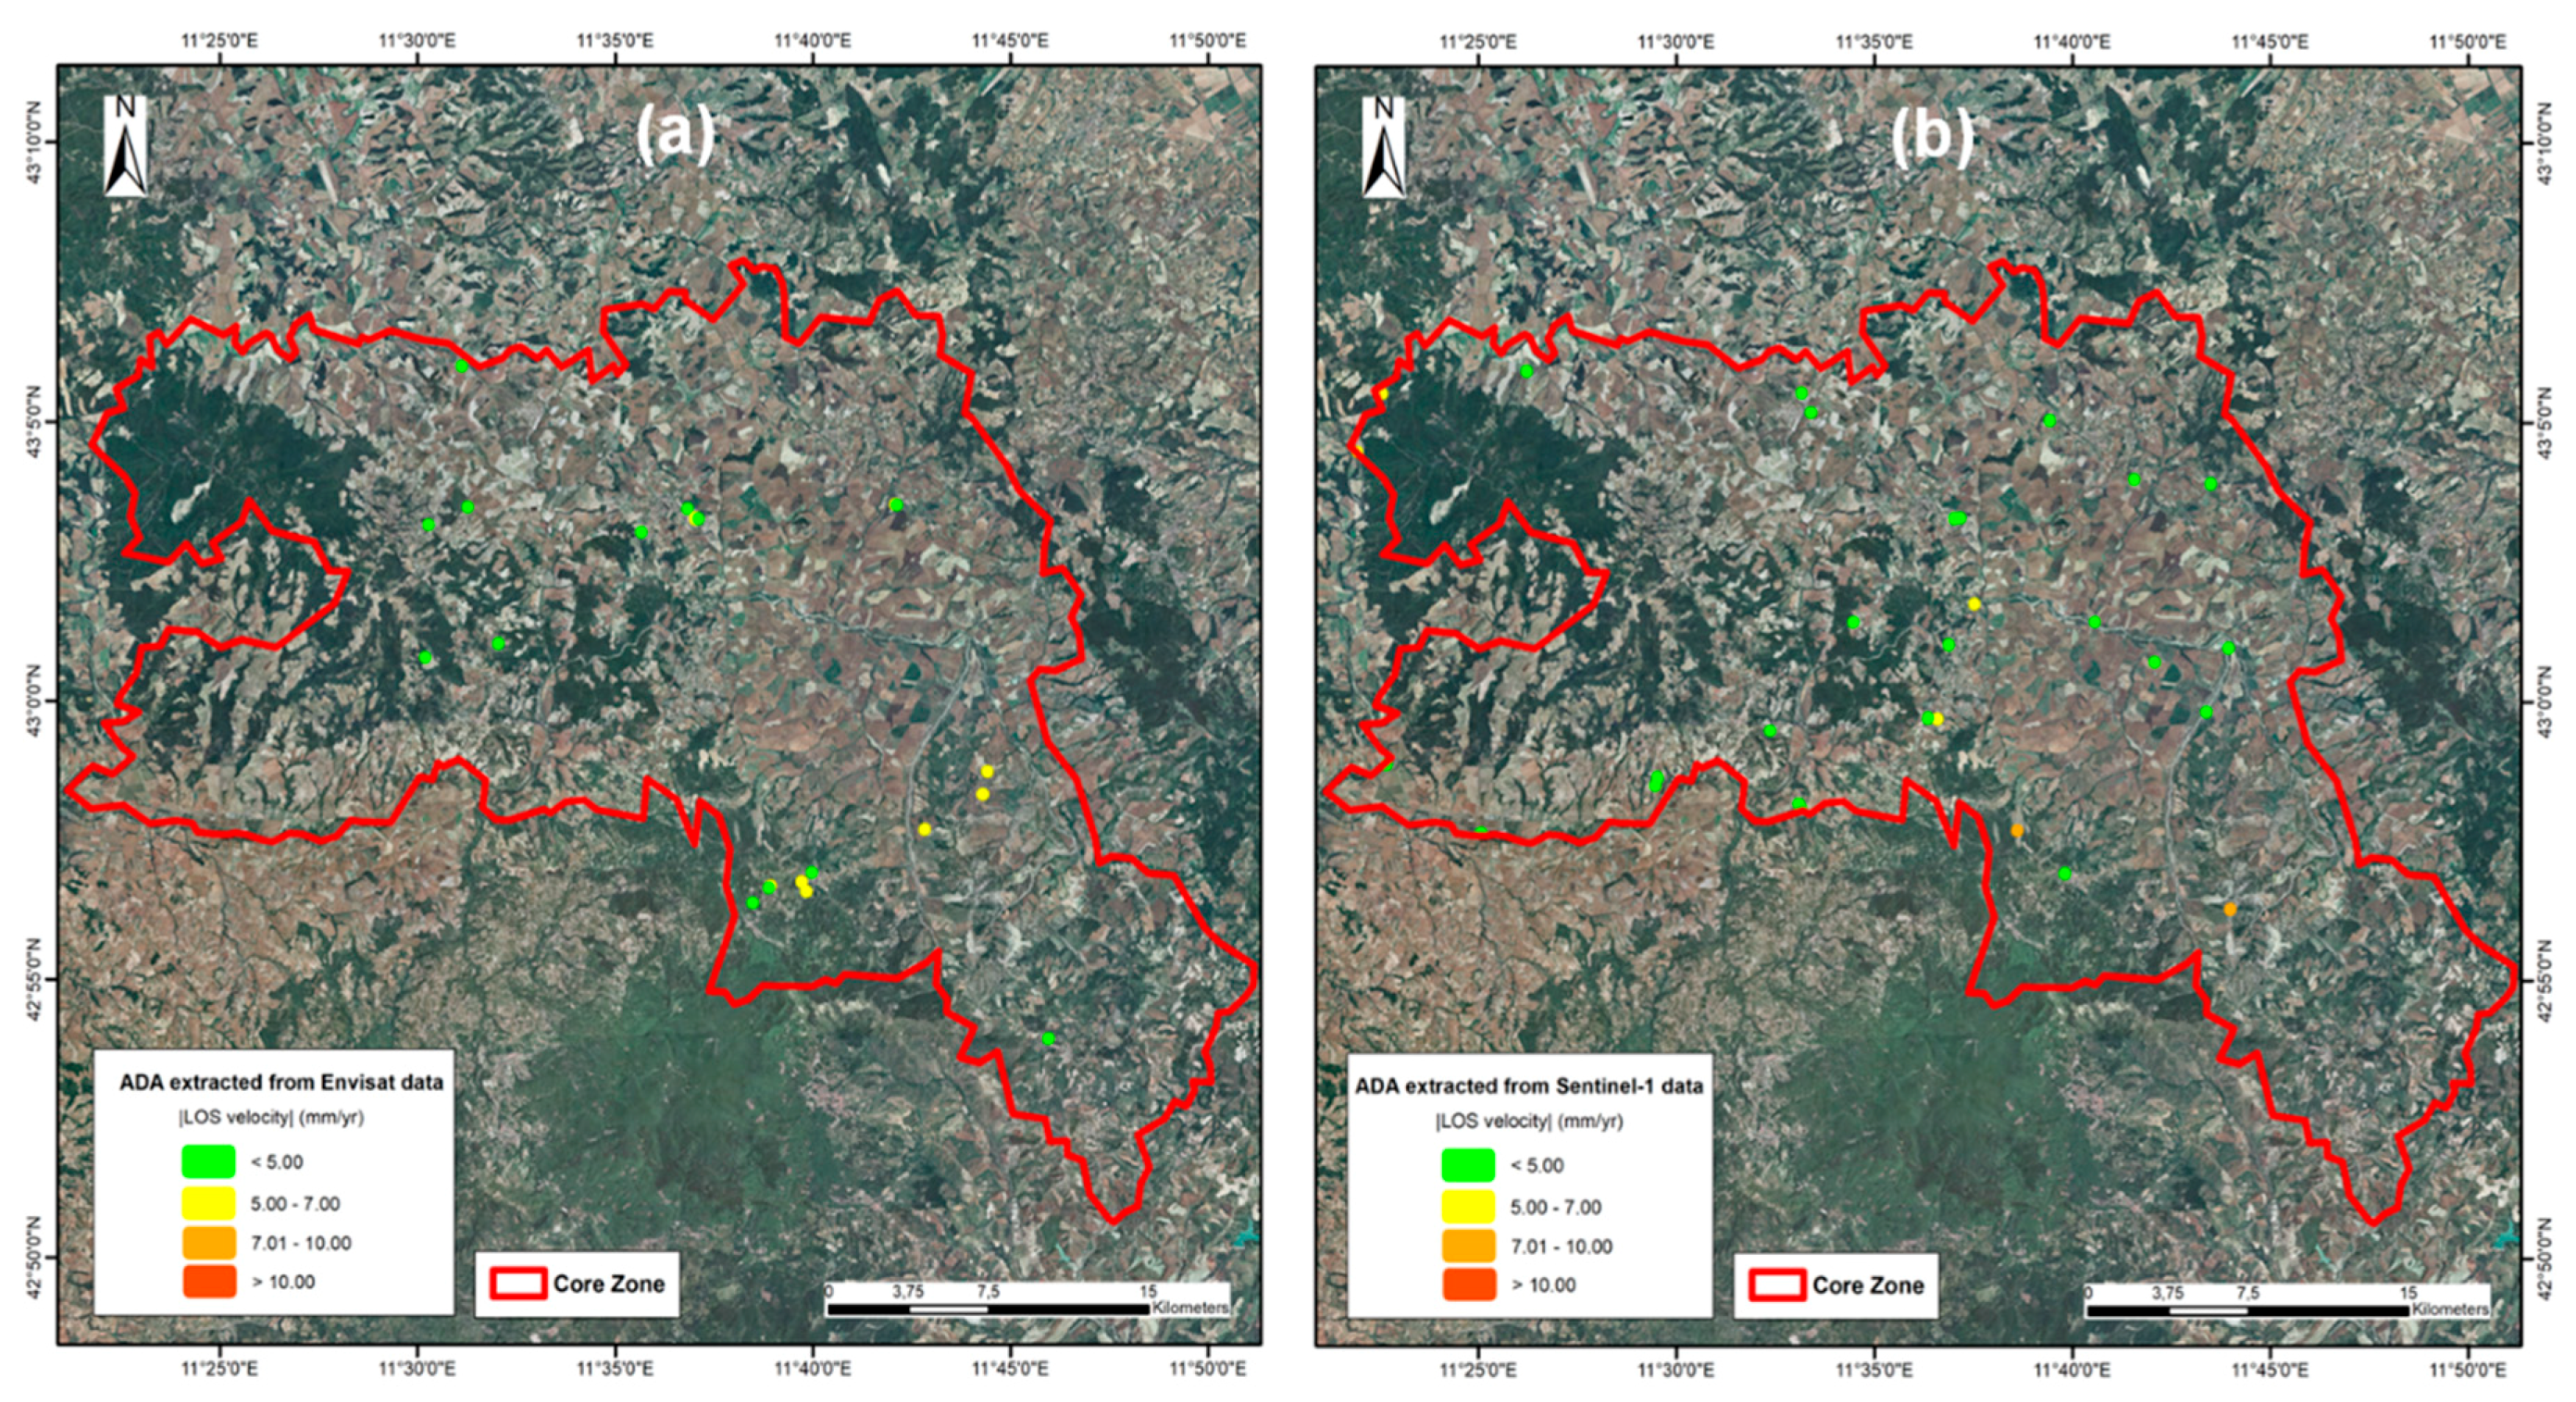
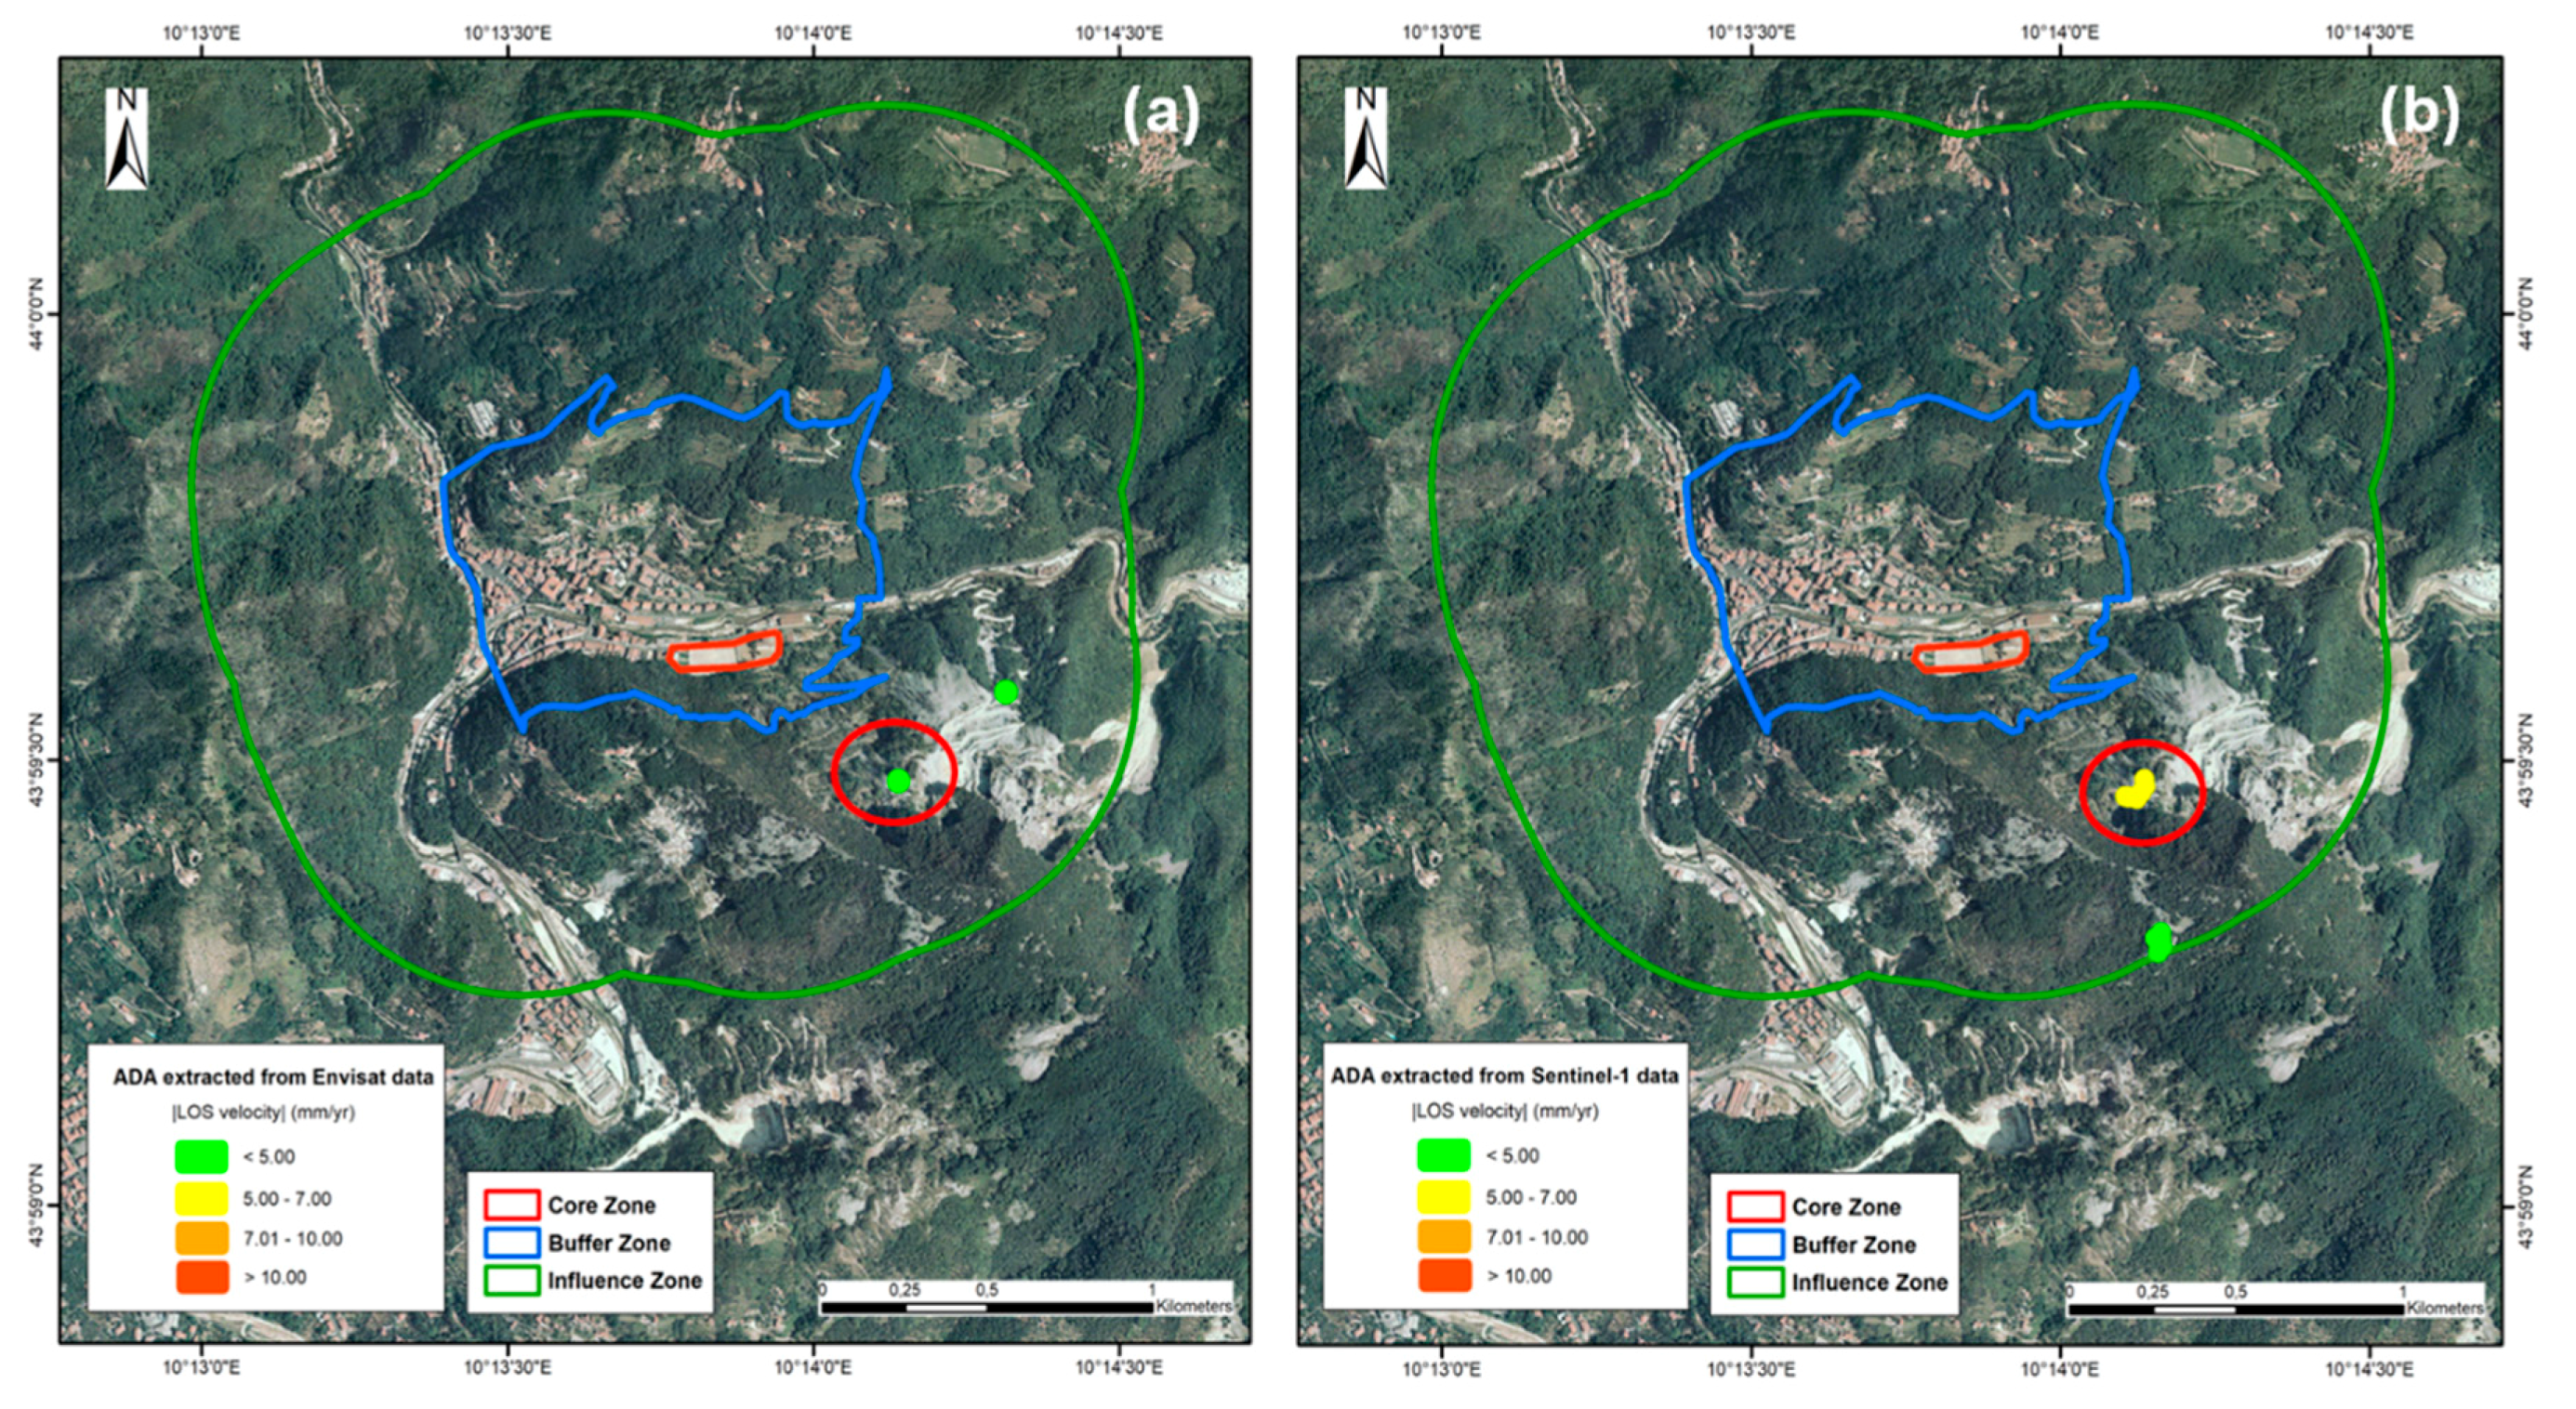
The only Core Zone with ADA is located in Val d’Orcia (Figure 6 and Table 4): 21 ADA have been identified through Envisat data, with |vmax| = 7.0 mm/year, and |vmin| = 4.1 mm/year, while 30 ADA have been extracted from Sentinel-1 dataset, with a slight increase in the maximum velocity (|vmax| = 9.0 mm/year).
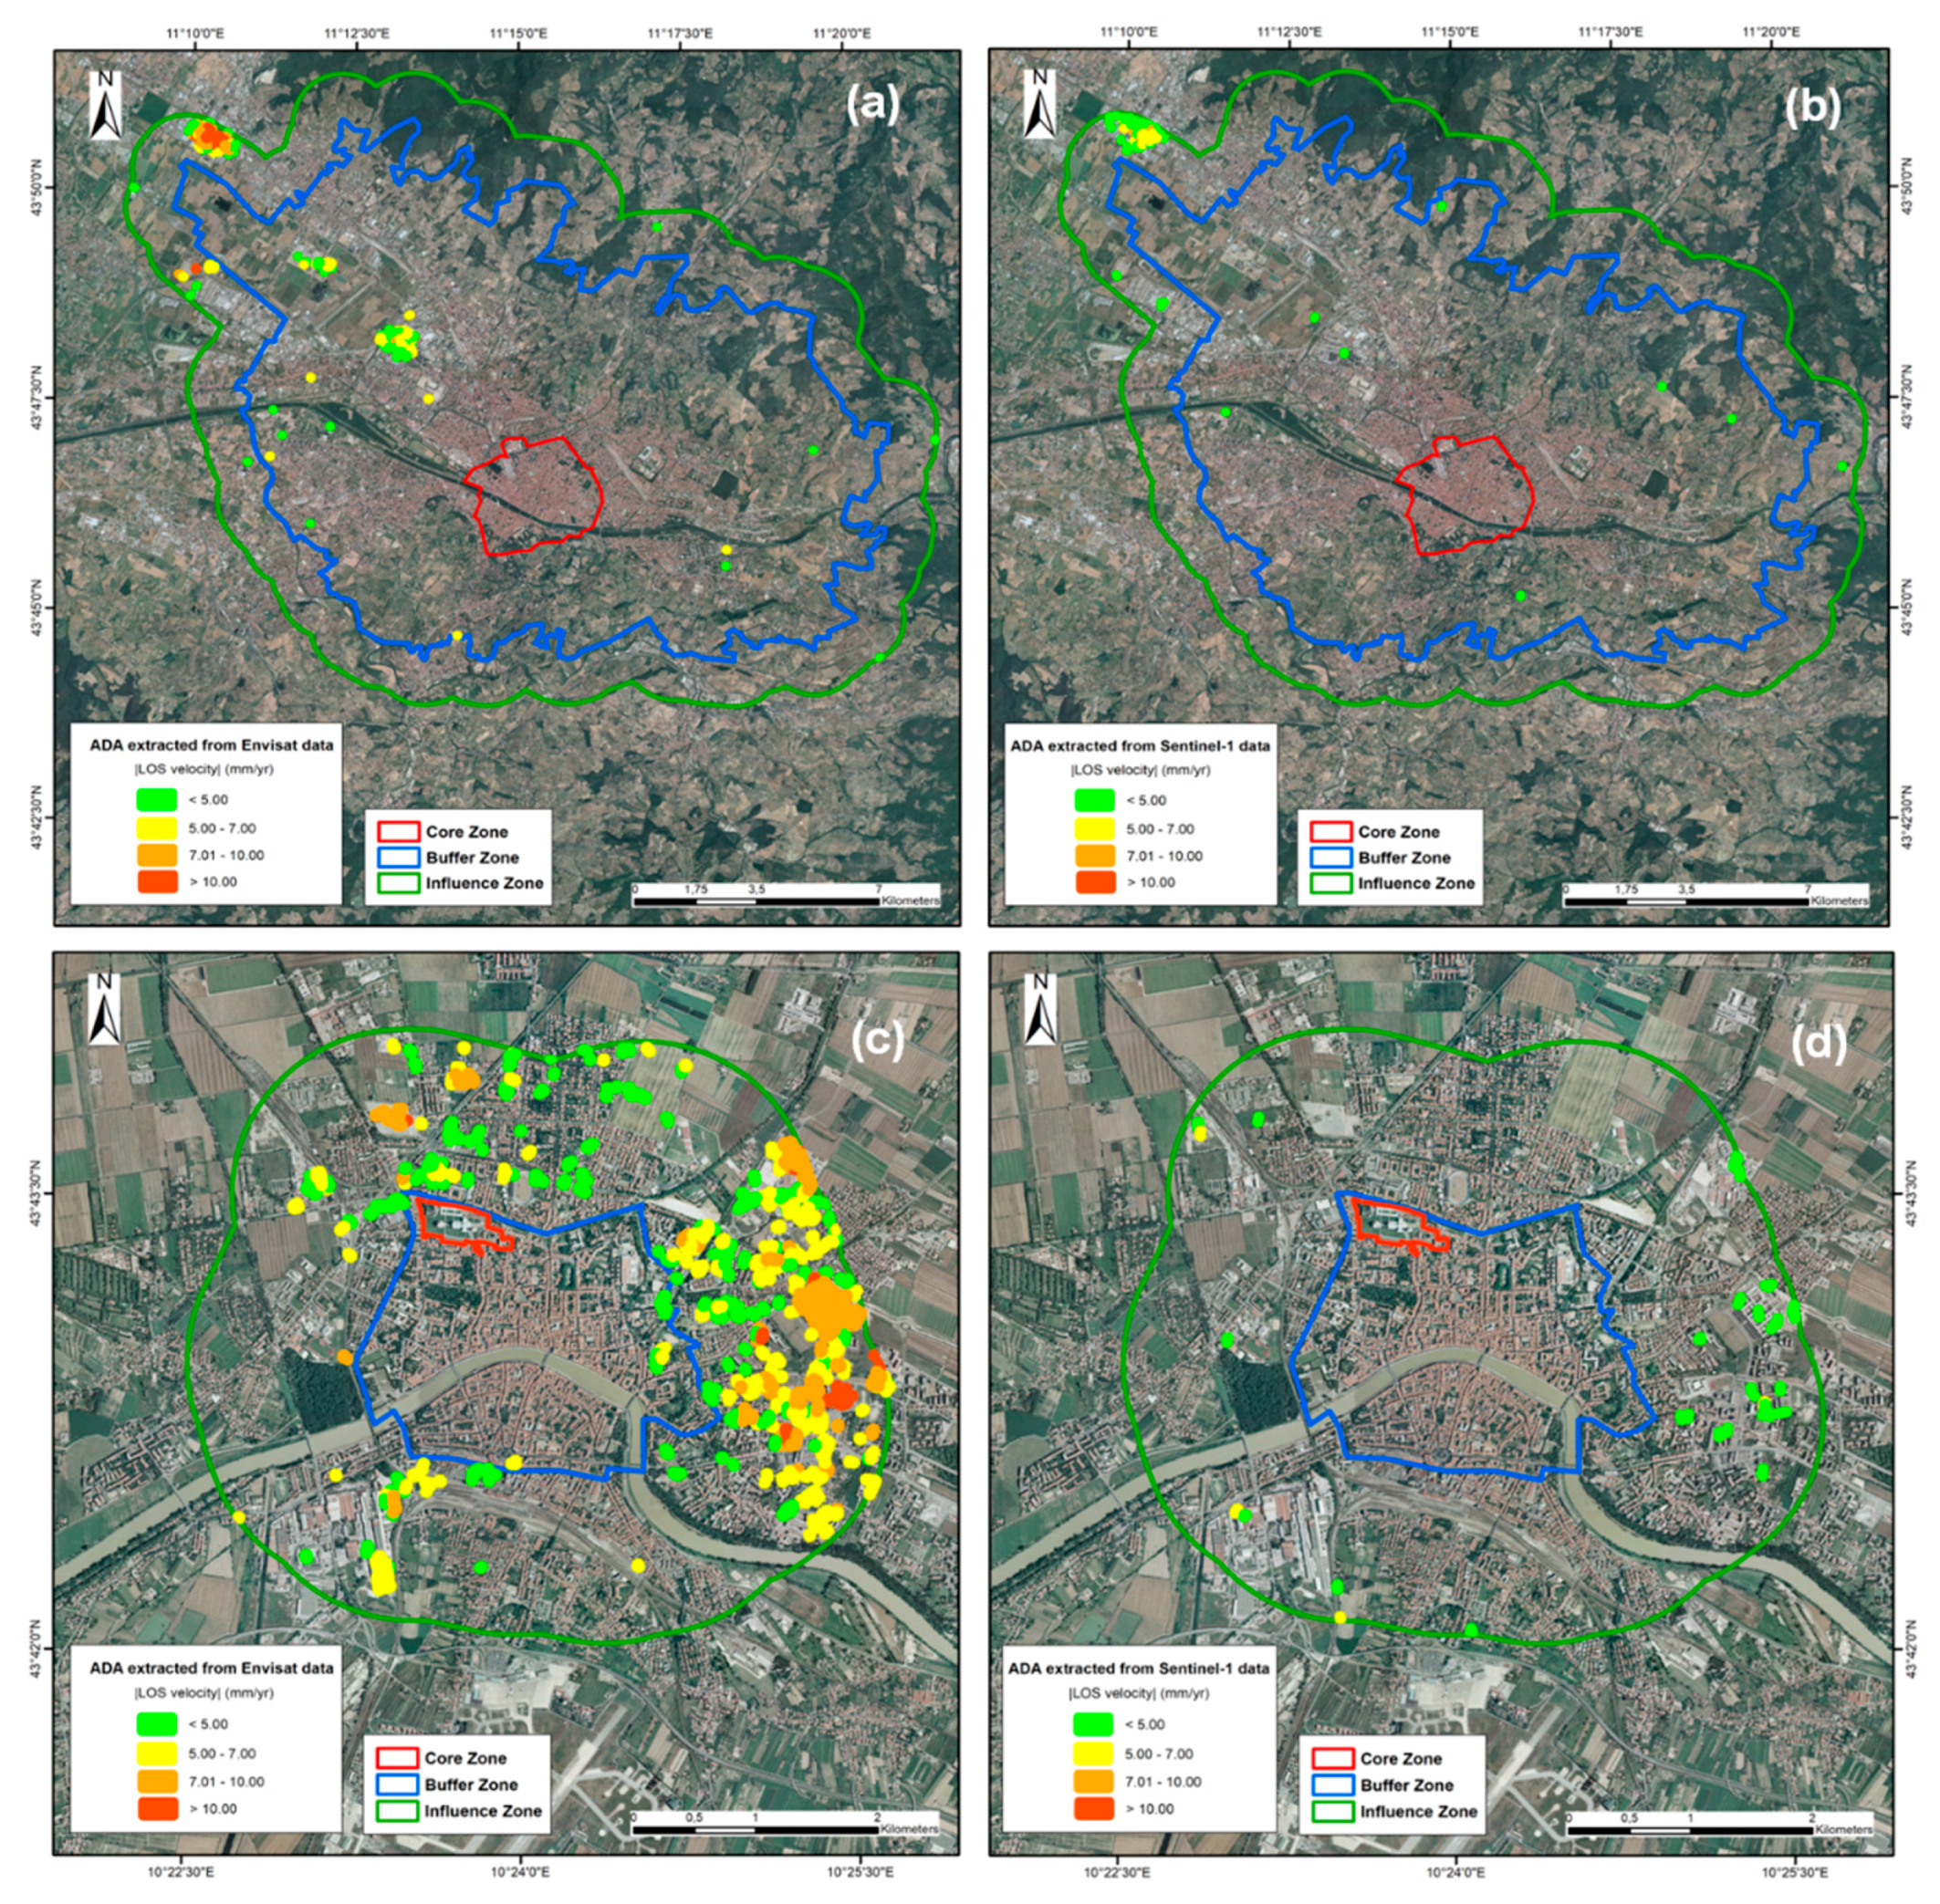
Few ADA have been identified in both satellite acquisitions in the Buffer Zone of Val d’Orcia (with similar velocity values), while in the Influence Zone, 2 ADA have been extracted through the newest dataset (Table 4). The greatest number of ADA has been identified through the Envisat dataset in the Buffer and Influence Zones of the Historic Center of Florence, with 82 ADA and 96 ADA respectively, and in the Influence Zone of Piazza del Duomo, where 411 ADA, with the highest percentage of the areal coverage detected (7%), have been extracted (Figure 7 and Table 4). In the Florence area, a decrease in the number of ADA (Buffer: 7 ADA; Influence: 56 ADA), and in all the other detected values, has been identified over time (the maximum velocity in the Influence Zone is halved). For the Pisa area, considering Sentinel-1 dataset, no ADA have been detected in the Buffer Zone, while in the Influence Zone, an evident decrease in the number of ADA (from 411 to 34) and in the |vmax| value (from 19.8 mm/year to 6.1 mm/year) can be observed (Figure 7 and Table 4).
Among all the ADA, we have also identified those which have been detected in both datasets, even though some small variations in their position could have occurred over time. Thus, we have found that in the Core Zone of Val d’Orcia, in the Buffer Zone of the Historic Center of Florence, and in the Influence Zone of Seravezza Palace (Figure 8), Historic Center of Florence and Piazza del Duomo, an intersection between ADA is present (Table 5).
These movements probably can be attributed to the same phenomenon that lasts over time. It is worth noting also that the ADA that do not intersect each other are considered reliable ADA, connected to different geohazards or different behavior of the same phenomenon in different periods.
6. Discussion
The main feature of this work is to propose a new procedure for identifying, within the boundaries of the UNESCO sites, the temporal and spatial evolution over time of ADA (Active Deformation Areas) that could be due to slow-kinematic geohazards (slow-moving landslides or ground-subsidence in this case study). The proposed methodology, which has shown potential at both regional and detailed scale in other test sites [24,33], has been specifically adapted for the aims of this work, allowing us to derive multitemporal ground deformation measurements for single UNESCO sites starting from PSI regional datasets. Although the procedure results are influenced by intrinsic limitations of the space-born InSAR techniques, e.g., slope aspect with respect to the acquisition geometry and land cover, the proposed workflow allows analyzing, in a fast and frequently updatable way, the huge amount of satellite data of a PSI dataset. The UNESCO sites are sometimes characterized by thousands of PS points (for example the Core Zone of the Historical Center of Florence contains around 5000 PS points), thus, the proposed methodology decreases the time needed to perform single point analysis over wide areas (for example the Core Zone of the Val d’Orcia covers 61,000 ha) that is a strongly time-demanding activity that cannot be frequentlyrepeated.
The illustrated procedure can be applied to any satellite SAR data but, in this case, in order to build up two different monitored periods similar to the one chosen by UNESCO to update its reports (every six years), we chose to perform the analysis on C-band data, i.e., Envisat (spanning from 2003 to 2010) and Sentinel-1 data (spanning from 2014 and 2018); these latter are the technical evolution of Envisat data. In this way, it was possible to create two different stacks of moving areas, although refereed to two sensors. This operative choice is related to (i) the short acquisition period of Sentinel-1, (ii) the need to create a long-time monitoring period to evaluate possible variation in the spatial distribution of the ADA and in the velocities recorded (as illustrated by the Pisa case study), (iii) the similar characteristics between the two satellites selected, considering that the Sentinel-1 constellation is intended to work in continuity with ESA’s (European Space Agency) Envisat [45].
Although the use of two different imaging geometries can lead to misinterpretation of the LOS velocities obtained, we consider that, for a preliminary estimation of the ground motions affecting a UNESCO site, the use of both orbits’ data asabsolute values is the best operative choice for an expeditious evaluation of ground deformation. In flat areas, where subsidence is the main geohazard (such as Florence and Pisa), differences due to the geometry of acquisition are negligible.
Therefore, this work wants to be a procedure proposal, aimed at showing preliminary results on a regional test case.
The procedure is aimed at creating a priority list of possible hazardous areas within the three different contours of each UNESCO sites. This information can be delivered to the authorities in order to verify on site the effects of the recorded motions. It has to be stressed that the interferometric products have a great cost-benefit ratio with respect to classical ground measurements such as GPS (Global Positioning Network) networks [46], especially when considering regional scale applications.
The obtained results have shown a general decrease in the number of ADA between Envisat and Sentinel-1 datasets, but in some cases, as at the Val d’Orcia site, an increase in the number of ADA has been identified. The general reduction of ADA is usually connected to a lowering of PS velocities. This mainly depends on the fact that Sentinel-1 data have a lower standard deviation and time series stability, thanks to the high redundancy of data given by the 6-day revisiting time. On the other hand, the evolution of a geological phenomenon can be the cause of both the reduction and the increase of ADA in the investigated sites.
For example, the reduction of ADA from Envisat to Sentinel-1 datasets within the Buffer and Influence Zones of the Historic Center of Florence and Piazza del Duomo, Pisa (Figure 7 and Table 4), could be related to a general slowdown of well-known subsidence phenomena, as reported by Ref. [47] and [21] for the suburban area of Florence and by Ref. [48] for the northeastern portion of Pisa city. The slowdown in these sites is related to the time-dependency of an ongoing consolidation process affecting building built in the last decade [47,48]. In the peripheral and suburban districts of the Florentine metropolitan area, the oscillations of ground-subsidence are also due to the seasonal demand for groundwater from local aquifers [47].
The increase in the number of ADA identified in the hilly landscape of the Val d’Orcia UNESCO site through the Sentinel-1 dataset (Figure 6 and Table 4) is related to (i) a higher density of points in partially vegetated areas because of the type of processing (SqueeSAR) and the temporal repeatability of the sensor and (ii) the evolution, triggered by intense rainfalls, of the typical badlands landscape of the Val d’Orcia, including slope denudation and landslide phenomena [49].
Finally, the two ADA cataloguedin the Influence Zone of the Seravezza Palace (Figure 8 and Table 4), may be due to landslides triggered by an intense and prolonged mining activity carried out within this area [50].
Ground validation in the chosen test sites is out of the scope of this manuscript, aimed at showing how to derive active motion areas within the perimeter and outside the UNESCO Tuscan heritage sites and at illustrating the preliminary results obtained.
These results show that only one Core Zone of Tuscany (Val d’Orcia) is affected by some Active Deformation Areas (ADA), whereas the greatest number of ADA has been extracted within the Influence Zones. This indicates how fundamental the investigations in these newly created zones are, which should be included in the UNESCO management system in order to guarantee better site conservation.
In addition to the aforementioned results, by comparing the past deformations with the current ones, it has been possible to identify the areas in which the movements persist in time and in the same place. These areas could be attributed to the same phenomenon (slow-moving landslides or ground-subsidence for Tuscany Region) that lasts over time. Focusing on these phenomena would avoid damages that could, in the long-term, compromise the integrity of UNESCO sites.
7. Conclusions
The proposed procedure allows mapping and monitoring of the temporal and spatial evolution of slow-kinematic phenomena (slow-moving landslides and ground-subsidence) affecting UNESCO sites, considered as Core, Buffer, and Influence Zones, the latter defined for the first time by the authors for the aims of this research. The greatest number of ADA being extracted within the Influence Zones highlights the importance of these boundaries in the preservation of the Outstanding Universal Value of UNESCO sites over times. These areas should be taken into consideration within the UNESCO management system, because a territory is a continuously changing reality, in which it is necessary to extend the monitoring not only to “sudden geological events” but also to slow-moving geohazards. Monitoring these type of phenomena, that currently are not included within the periodical UNESCO reports, can be useful to better define management and protection strategies. In addition, PSI data analyzed by means of this type of procedure, represent a useful tool to assess new slow-moving negative factors that could be added in the periodic UNESCO reports.
Our methodology is intended to be a practical example of a procedure aimed at selecting, from large interferometric datasets, moving areas, knowing a priori the limitations of the PSI technique. It is designed to operate in a fast and simple way at a regional scale, in order to be quickly and easily responded to by the potential stakeholders. The methodology has been applied for the first time in the test area of the Tuscany Region, where several UNECO heritage sites are present; the results obtained are preliminary but represent useful information to plan potential on-site action. In the future, integrating the obtained results with additional data (e.g., geohazard inventories, ground truth information, etc.) and on-site investigations, it will be possible to characterize the nature of the deformation areas in detail.
Thanks to the free availability, the regularity of acquisition, and the worldwide coverage of the Sentinel-1 data, similar procedures could be exploited by decision makers for improving the “geohazard knowledge” of each World Heritage Site.
Supplementary Materials
The following are available online at https://0-www-mdpi-com.brum.beds.ac.uk/2072-4292/10/7/992/s1, Table S1: Mean, max velocities and number of APs for each UNESCO heritage site in Tuscany. The velocity fields units are mm/year in absolute value. nd = no data. For the UNESCO sites numeration see Table 1.
Author Contributions
Conceptualization, L.P.; Data curation, A.B., O.M. and G.L.; Formal analysis, L.P. and L.S.; Methodology, A.B. and O.M.; Supervision, V.T.; Writing—original draft, L.P.
Funding
This research received no external funding.
Acknowledgments
The authors want to thank the Editors and two anonymous reviewers for their suggestions that increased the quality of the paper.
Conflicts of Interest
The authors declare no conflict of interest.
References
- Galland, P.; Lisitzin, K.; Oudaille-Diethardt, A.; Young, C. World Heritage in Europe Today; United Nations Educational, Scientific and Cultural Organization: Paris, France, 2016; Volume 123, ISBN 978-92-3-100143-7. [Google Scholar]
- UNESCO. Operational Guidelines for the Implementation of the World Heritage Convention; UNESCO, World Heritage Center: Paris, France, 2017; Available online: http://whc.unesco.org/en/guidelines/ (accessed on 10 January 2018).
- Pavlova, I.; Makarigakis, A.; Depret, T.; Jomelli, V. Global overview of the geological hazard exposure and disaster risk awareness at world heritage sites. J. Cult. Heritage 2017, 28, 151–157. [Google Scholar] [CrossRef]
- Spizzichino, D.; Leoni, G.; Comerci, V.; Brustia, E.; Guerrieri, L.; Dessi, B.; Trigila, A.; Iadanza, C. PROTHEGO Deliverable D.01.01: UNESCO Cultural Heritage Vs Natural hazards at European Scale, Version 1.0. JPICH Heritage Plus PROTHEGO Project, Open Report. 2016, p. 30. Available online: http://www.prothego.eu/ (accessed on 21 February 2018).
- Cigna, F.; Tapete, D.; Lee, K. Geological hazards in the UNESCO World Heritage sites of the UK: From the global to the local scale perspective. Earth-Sci. Rev. 2018, 176, 166–194. [Google Scholar] [CrossRef]
- Canuti, P.; Margottini, C.; Fanti, R.; Bromhead, E.N. Cultural Heritage and Landslides: Research for Risk Prevention and Conservation. In Landslides—Disaster Risk Reduction; Sassa, K., Canuti, P., Eds.; Springer: Berlin/Heidelberg, Germany, 2009; pp. 401–433. [Google Scholar] [CrossRef]
- Periodic Reporting. Available online: http://whc.unesco.org/en/periodicreporting/ (accessed on 10 December 2018).
- List of Factors Affecting the Properties. Available online: http://whc.unesco.org/en/factors/ (accessed on 10 December 2018).
- Cruden, D.M.; Varnes, D.J. Landslide Types and Processes. In Landslides: Investigation and Mitigation, Special Report 247-Transportation Research Board, National Research Council; Turner, A.K., Schuster, R.L., Eds.; National Academy Press: Washington, DC, USA, 1996; pp. 36–75. [Google Scholar]
- Cigna, F.; Osmanoğlu, B.; Cabral-Cano, E.; Dixon, T.H.; Ávila-Olivera, J.A.; Garduño-Monroy, V.H.; DeMets, C.; Wdowinski, S. Monitoring land subsidence and its induced geological hazard with Synthetic Aperture Radar Interferometry: A case study in Morelia, Mexico. Remote Sens. Environ. 2012, 117, 146–161. [Google Scholar] [CrossRef]
- Vlcko, J. Extremely slow slope movements influencing the stability of Spis Castle, UNESCO site. Landslides 2004, 1, 67–71. [Google Scholar] [CrossRef]
- Alfarè, L.; Donnici, S.; Marini, M.; Moscatelli, M.; Tosi, L.; Vallone, R. The Impact of Land Subsidence on Preservation of Cultural Heritage Sites: The Case Study of Aquileia (Venetian-Friulian Coastland, North-Eastern Italy). In Engineering Geology for Society and Territory; Springer: Cham, Switzerland, 2014; Volume 4, pp. 179–182. [Google Scholar]
- Tapete, D.; Cigna, F. InSAR data for geohazard assessment in UNESCO World Heritage sites: State-of-the-art and perspectives in the Copernicus era. Int. J. App. Earth Obs. Geoinf. 2017, 63, 24–32. [Google Scholar] [CrossRef]
- Ferretti, A.; Prati, C.; Rocca, F. Permanent Scatterers in SAR interferometry. IEEE Trans. Geosci. Remote Sens. 2001, 39, 8–20. [Google Scholar] [CrossRef]
- Crosetto, M.; Monserrat, O.; Cuevas-González, M.; Devanthéry, N.; Crippa, B. Persistent scatterer interferometry: A review. ISPRS J. Photogramm. Remote Sens. 2016, 115, 78–89. [Google Scholar] [CrossRef]
- Ciampalini, A.; Raspini, F.; Frodella, W.; Bardi, F.; Bianchini, S.; Moretti, S. The effectiveness of high-resolution LiDAR data combined with PSInSAR data in landslide study. Landslides 2016, 13, 399–410. [Google Scholar] [CrossRef]
- Lu, P.; Casagli, N.; Catani, F.; Tofani, V. Persistent Scatterers Interferometry Hotspot and Cluster Analysis (PSI-HCA) for detection of extremely slow-moving landslides. Int. J. Remote Sens. 2012, 33, 466–489. [Google Scholar] [CrossRef]
- Tofani, V.; Raspini, F.; Catani, F.; Casagli, N. Persistent Scatterer Interferometry (PSI) technique for landslide characterization and monitoring. Remote Sens. 2013, 5, 1045–1065. [Google Scholar] [CrossRef]
- Bonforte, A.; Guglielmino, F.; Coltelli, M.; Ferretti, A.; Puglisi, G. Structural assessment of Mount Etna volcano from permanent scatterers analysis. Geochem. Geophys. Geosyst. 2011, 12, 1–19. [Google Scholar] [CrossRef]
- Nolesini, T.; Frodella, W.; Bianchini, S.; Casagli, N. Detecting slope and urban potential unstable areas by means of multi-platform remote sensing techniques: The volterra (Italy) case study. Remote Sens. 2016, 8, 746. [Google Scholar] [CrossRef]
- Rosi, A.; Tofani, V.; Agostini, A.; Tanteri, L.; Tacconi Stefanelli, C.; Catani, F.; Casagli, N. Subsidence mapping at regional scale using persistent scatters interferometry (PSI): The case of Tuscany region (Italy). Int. J. App. Earth Obs. Geoinf. 2016, 52, 328–337. [Google Scholar] [CrossRef]
- Raspini, F.; Bardi, F.; Bianchini, S.; Ciampalini, A.; Del Ventisette, C.; Farina, P.; Ferrigno, F.; Solari, L.; Casagli, N. The contribution of satellite SAR-derived displacement measurements in landslide risk management practices. Nat. Hazards 2016, 86, 327–351. [Google Scholar] [CrossRef] [Green Version]
- Rosi, A.; Tofani, V.; Tanteri, L.; TacconiStefanelli, C.; Agostini, A.; Catani, F.; Casagli, N. The new landslide inventory of Tuscany (Italy) updated with PS-InSAR: Geomorphological features and landslide distribution. Landslides 2018, 15, 5–19. [Google Scholar] [CrossRef]
- Solari, L.; Barra, A.; Herrera, G.; Bianchini, S.; Monserrat, O.; Béjar-Pizarro, M.; Crosetto, M.; Sarro, R.; Moretti, S. Fast detection of ground motions on vulnerable elements using Sentinel-1 InSAR data. Geomat. Nat. Hazards Risk 2018, 9, 152–174. [Google Scholar] [CrossRef]
- Ferretti, A.; Fumagalli, A.; Novali, F.; Prati, C.; Rocca, F.; Rucci, A. A new algorithm for processing interferometric data-stacks: SqueeSAR. IEEE Trans. Geosci. Remote Sens. 2011, 49, 3460–3470. [Google Scholar] [CrossRef]
- Bianchini, S.; Pratesi, F.; Nolesini, T.; Casagli, N. Building deformation assessment by means of Persistent Scatterer Interferometry analysis on a Landslide-affected area: The Volterra (Italy) case study. Remote Sens. 2015, 7, 4678–4701. [Google Scholar] [CrossRef]
- Tang, P.; Chen, F.; Zhu, X.; Zhou, W. Monitoring cultural heritage sites with advanced multi-temporal InSAR technique: The case study of the Summer Palace. Remote Sens. 2016, 8, 432. [Google Scholar] [CrossRef]
- Tapete, D.; Fanti, R.; Cecchi, R.; Petrangeli, P.; Casagli, N. Satellite radar interferometry for monitoring and early-stage warning of structural instability in archaeological sites. J. Geophys. Eng. 2012, 9, 10–25. [Google Scholar] [CrossRef]
- Tapete, D.; Cigna, F. Rapid mapping and deformation analysis over cultural heritage and rural sites based on Persistent Scatterer Interferometry. Int. J. Geophys. 2012, 2012, 618609. [Google Scholar] [CrossRef]
- Barra, A.; Monserrat, O.; Mazzanti, P.; Esposito, C.; Crosetto, M.; Scarascia Mugnozza, G. First insights on the potential of Sentinel-1 for landslides detection. Geomat. Nat. Hazards Risk 2016, 7, 1874–1883. [Google Scholar] [CrossRef]
- Crosetto, M.; Monserrat, O.; Devanthéry, N.; Cuevas-González, M.; Barra, A.; Crippa, B. Persistent Scatterer Interferometry using Sentinel-1 data. In Proceedings of the International Archives of the Photogrammetry, Remote Sensing and Spatial Information Sciences, 2016 XXIII ISPRS Congress, Prague, Czech Republic, 12–19 July 2016; Volume XLI-B7. [Google Scholar]
- Devanthéry, N.; Crosetto, M.; Cuevas-González, M.; Monserrat, O.; Barra, A.; Crippa, B. Deformation monitoring using Persistent Scatterer Interferometry and Sentinel-1 SAR data. Procedia Comput. Sci. 2016, 100, 1121–1126. [Google Scholar] [CrossRef]
- Barra, A.; Solari, L.; Bejar-Pizarro, M.; Monserrat, O.; Bianchini, S.; Herrera, G.; Crosetto, M.; Sarro, R.; Gonzalez-Alonso, E.; Mateos, R.M.; et al. A methodology to detect and update Active Deformation Areas based on Sentinel-1 SAR images. Remote Sens. 2017, 9, 1002. [Google Scholar] [CrossRef]
- World Heritage List Statistics. Available online: http://whc.unesco.org/en/list/stat (accessed on 18 January 2018).
- The Criteria for Selection. Available online: https://whc.unesco.org/en/criteria/ (accessed on 2 February 2018).
- Martin, O.; Piatti, G. World Heritage and Buffer Zones. In Proceedings of the International Expert Meeting on World Heritage and Buffer Zones, Davos, Switzerland, 11–14 March 2008; UNESCO World Heritage Center: Paris, France, 2009. Available online: http://whc.unesco.org/en/series/25/ (accessed on 29 January 2018).
- World Heritage List. Available online: http://whc.unesco.org/en/list (accessed on 20 January 2018).
- Capitanio, C.; Bini, M.; Francini, C. The Safeguarding Area for the Historic Center of Florence, UNESCO Site; DIDA Dipartimento di ArchitetturaUniversitàdegliStudi di Firenze: Firenze, Italy, 2017; ISBN 978889608032. [Google Scholar]
- Regional Cartography of Tuscany. Available online: http://www502.regione.toscana.it/geoscopio/cartoteca.html (accessed on 22 February 2018).
- Costantini, M.; Ferretti, A.; Minati, F.; Falco, S.; Trillo, F.; Colombo, D.; Novali, F.; Malvarosa, F.; Mammone, C.; Vecchioli, F.; et al. Analysis of surface deformations over the whole Italian territory by interferometric processing of ERS, Envisat and COSMO-SkyMed radar data. Remote Sens. Environ. 2017, 202, 250–275. [Google Scholar] [CrossRef]
- Peduto, D.; Cascini, L.; Arena, L.; Ferlisi, S.; Fornaro, G.; Reale, D. A general framework and related procedures for multiscale analyses of DInSAR data in subsiding urban areas. ISPRS J. Photogramm. Remote Sens. 2015, 105, 186–210. [Google Scholar] [CrossRef]
- Pratesi, F.; Tapete, D.; Terenzi, G.; Del Ventisette, C.; Moretti, S. Rating health and stability of engineering structures via classification indexes of InSAR Persistent Scatterers. Int. J. App. Earth Obs. Geoinf. 2015, 40, 81–90. [Google Scholar] [CrossRef] [Green Version]
- Raspini, F.; Bianchini, S.; Ciampalini, A.; Del Soldato, M.; Solari, L.; Novali, F.; Del Conte, S.; Rucci, A.; Ferretti, A.; Casagli, N. Continuous, semi-automatic monitoring of ground deformation using Sentinel-1 satellites. Sci. Rep. 2018, 8, 7253. [Google Scholar] [CrossRef] [PubMed]
- Farina, P.; Casagli, N.; Ferretti, A. Radar-interpretation of InSAR measurements for landslide investigations in civil protection practices. In Proceedings of the First North American Landslide Conference, Vail, CO, USA, 3–8 June 2007; pp. 272–283. [Google Scholar]
- Showstack, R. Sentinel satellites initiate new era in earth observation. Eos Trans. Am. Geophys. Union 2014, 95, 239–240. [Google Scholar] [CrossRef]
- Tomás, R.; Romero, R.; Mulas, J.; Marturià, J.J.; Mallorquí, J.J.; Lopez-Sanchez, J.M.; Herrera, G.; Gutiérrez, F.; González, P.J.; Fernández, J.; et al. Radar interferometry techniques for the study of ground subsidence phenomena: A review of practical issues through cases in Spain. Environ. Earth Sci. 2014, 71, 163–181. [Google Scholar] [CrossRef] [Green Version]
- Pratesi, F.; Tapete, D.; Del Ventisette, C.; Moretti, S. Mapping interactions between geology, subsurface resource exploitation and urban development in transforming cities using InSAR Persistent Scatterers: Two decades of change in Florence, Italy. Appl. Geogr. 2016, 77, 20–37. [Google Scholar] [CrossRef]
- Solari, L.; Ciampalini, A.; Raspini, F.; Bianchini, S.; Zinno, I.; Bonano, M.; Manunta, M.; Moretti, S.; Casagli, N. Combined use of C-and X-Band SAR data for subsidence monitoring in an urban area. Geosciences 2017, 7, 21. [Google Scholar] [CrossRef]
- Della Seta, M.; Del Monte, M.; Fredi, P.; Palmieri, E.L. Space–time variability of denudation rates at the catchment and hillslope scales on the Tyrrhenian side of Central Italy. Geomorphology 2009, 107, 161–177. [Google Scholar] [CrossRef]
- Baroni, C.; Bruschi, G.; Criscuolo, A.; Ribolini, A. Il rischio geomorfologico indotto dall’attivita estrattiva nei bacini marmiferi apuani (AlpiApuane, Toscana). Attidella Societa Toscana di Scienze Naturali Residente in Pisa Memorie Serie Aprocessi Verbali 2001, 107, 87–96. (In Italian) [Google Scholar]
Figure 1.
Flowchart of the methodology. Modified from Ref. [33].
Figure 1.
Flowchart of the methodology. Modified from Ref. [33].

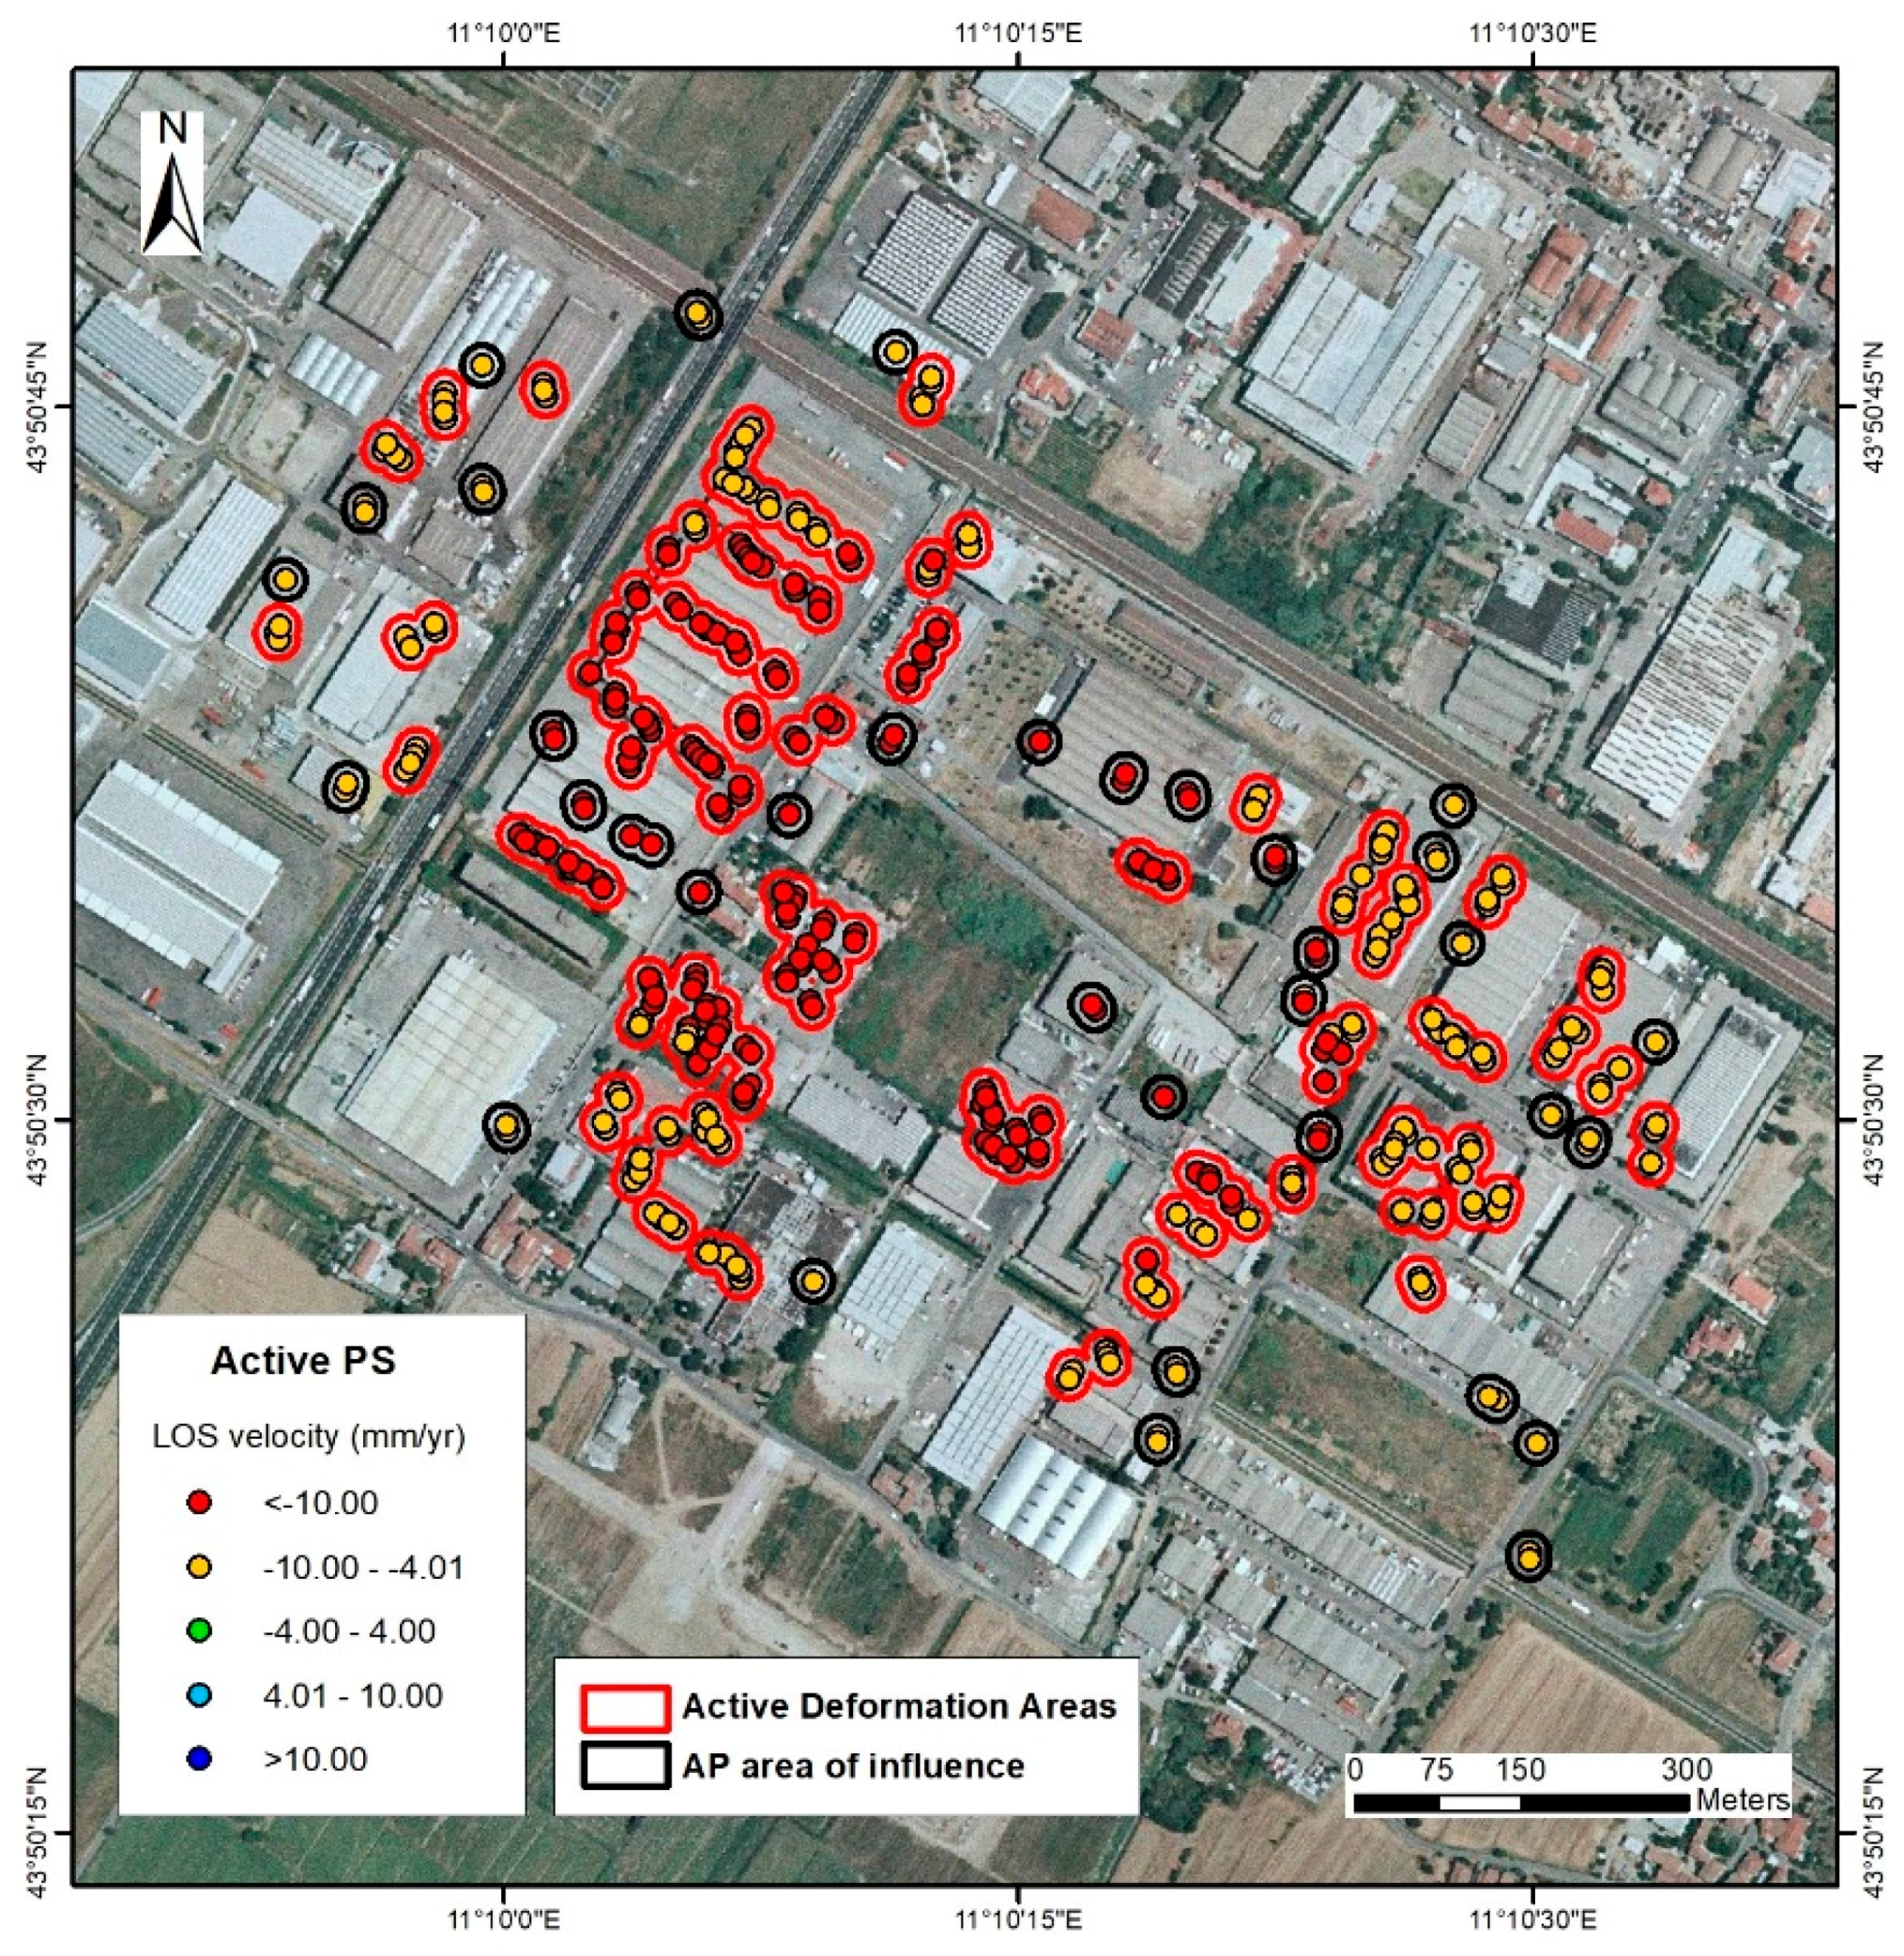
Figure 2.
ADA extraction from the Active Points (APs) of Envisat dataset (ascending orbit), in the urban area of Florence. In this map, only the active PS are visualized.
Figure 2.
ADA extraction from the Active Points (APs) of Envisat dataset (ascending orbit), in the urban area of Florence. In this map, only the active PS are visualized.

Figure 3.
Procedure for the identification and updating of the most critical ground deformation within the UNESCO sites boundaries (t1 = time1; t2 = time2).
Figure 3.
Procedure for the identification and updating of the most critical ground deformation within the UNESCO sites boundaries (t1 = time1; t2 = time2).

Figure 4.
Location of the UNESCO Tuscan sites. Some Medici Villas and Gardens, due to their proximity, are not visible at this scale. Photos source: Luca Aless—Wikimedia Commons.
Figure 4.
Location of the UNESCO Tuscan sites. Some Medici Villas and Gardens, due to their proximity, are not visible at this scale. Photos source: Luca Aless—Wikimedia Commons.

Figure 5.
Buffer Zone for the Historic Center of San Gimignano, identified in a qualitative way, taking into account the following elements: Digital Terrain Model (DTM) in shaded relief, Roads, Hydrography, and Protected Areas (downloaded from Ref. [39]).
Figure 5.
Buffer Zone for the Historic Center of San Gimignano, identified in a qualitative way, taking into account the following elements: Digital Terrain Model (DTM) in shaded relief, Roads, Hydrography, and Protected Areas (downloaded from Ref. [39]).

Figure 6.
LOS velocities (absolute value) of ADA extracted in the Core Zone of Val d’Orcia, from (a) Envisat data, and (b) Sentinel-1 data, both in ascending and descending orbit.
Figure 6.
LOS velocities (absolute value) of ADA extracted in the Core Zone of Val d’Orcia, from (a) Envisat data, and (b) Sentinel-1 data, both in ascending and descending orbit.

Figure 7.
LOS velocities (absolute value) of ADA extracted from Envisat and Sentinel-1 datasets, both in ascending and descending orbit, within the Core, Buffer, and Influence Zones of (a,b) Historic Center of Florence, and (c,d) Piazza del Duomo, Pisa.
Figure 7.
LOS velocities (absolute value) of ADA extracted from Envisat and Sentinel-1 datasets, both in ascending and descending orbit, within the Core, Buffer, and Influence Zones of (a,b) Historic Center of Florence, and (c,d) Piazza del Duomo, Pisa.

Figure 8.
LOS velocities (absolute value) of ADA extracted in the Influence Zone of Seravezza Palace, from (a) Envisat data, and (b) Sentinel-1 data, both in ascending and descending orbit. The red circle highlights the ADA that, over the years, has remained in the same place (despite some little variations in their area).


Table 1.
Main featuresof the UNESCO Tuscan sites and their boundaries (Core zone and Buffer zone). The inscription criteria shown in this table can be consulted in Ref. [35].
Table 1.
Main featuresof the UNESCO Tuscan sites and their boundaries (Core zone and Buffer zone). The inscription criteria shown in this table can be consulted in Ref. [35].
| UNESCO TUSCAN SITES | COORDINATES (Latitude/Longitude) | INSCRIPTION YEAR | INSCRIPTION CRITERIA | TYPE OF PROPERTY | BOUNDARIES (ha) | |||
|---|---|---|---|---|---|---|---|---|
| CULTURAL | NATURAL | MIXED | CORE ZONE | BUFFER ZONE | ||||
| 1. Historic Center of Florence | 43.773/11.256 | 1982 | (i)(ii)(iii)(iv)(vi) | X | 505 | 10,480 | ||
| 2. Historic Center of Siena | 43.319/11.332 | 1995 | (i)(ii)(iv) | X | 170 | 9907 | ||
| 3. Medici Villas and Gardens in Tuscany | ||||||||
| 3.1-Cafaggiolo Villa | 43.965/11.295 | 2013 | (ii)(iv)(vi) | X | 2.35 | 649.56 | ||
| 3.2-Il Trebbio Villa | 43.953/11.287 | 2013 | (ii)(iv)(vi) | X | 16 | 650.31 | ||
| 3.3-Careggi Villa | 43.809/11.249 | 2013 | (ii)(iv)(vi) | X | 3.6 | 55.71 | ||
| 3.4-Medici of Fiesole Villa | 43.806/11.289 | 2013 | (ii)(iv)(vi) | X | 2.11 | 44.88 | ||
| 3.5-Castello Villa | 43.819/11.228 | 2013 | (ii)(iv)(vi) | X | 8.33 | 289.31 | ||
| 3.6-Poggio a Caiano Villa | 43.818/11.056 | 2013 | (ii)(iv)(vi) | X | 9.31 | 135.63 | ||
| 3.7-La Petraia Villa | 43.819/11.237 | 2013 | (ii)(iv)(vi) | X | 21.31 | 276.33 | ||
| 3.8-Boboli Garden | 43.762/11.248 | 2013 | (ii)(iv)(vi) | X | 40 | 132 | ||
| 3.9-Cerreto Guidi Villa | 43.759/10.879 | 2013 | (ii)(iv)(vi) | X | 0.76 | 4.12 | ||
| 3.10-Seravezza Palace | 43.994/10.232 | 2013 | (ii)(iv)(vi) | X | 1.01 | 50.14 | ||
| 3.11-Pratolino Garden | 43.858/11.304 | 2013 | (ii)(iv)(vi) | X | 26.53 | 210.35 | ||
| 3.12-La Magia Villa | 43.852/10.973 | 2013 | (ii)(iv)(vi) | X | 2.1 | 103.65 | ||
| 3.13-Artimino Villa | 43.782/11.044 | 2013 | (ii)(iv)(vi) | X | 1.04 | 701.66 | ||
| 3.14-Poggio Imperiale Villa | 43.749/11.248 | 2013 | (ii)(iv)(vi) | X | 5.35 | 235.43 | ||
| 4. Historic Center of San Gimignano | 43.468/11.042 | 1990 | (i)(iii)(iv) | X | 13.88 | / | ||
| 5. Piazza del Duomo, Pisa | 43.723/10.396 | 1987 | (i)(ii)(iv)(vi) | X | 8.87 | 254 | ||
| 6. Historic Center of the City of Pienza | 43.077/11.679 | 1996 | (i)(ii)(iv) | X | 4.41 | / | ||
| 7. Val d’Orcia | 43.067/11.55 | 2004 | (iv)(vi) | X | 61,187.961 | 5660.077 | ||
| 8. SassoFratino | 43.844/11.803 | 2017 | (ix) | X | 781.43 | 6936.64 | ||
Table 2.
Sudden geological events listed in the UNESCO reports (II Cycle) of the Tuscan sites. A factors assessment is performed only for the current and negative ones. For the UNESCO sites numeration see Table 1. NEG = Negative; CURR = Current; POT = Potential; INS = Inside; OUT = Outside.
Table 2.
Sudden geological events listed in the UNESCO reports (II Cycle) of the Tuscan sites. A factors assessment is performed only for the current and negative ones. For the UNESCO sites numeration see Table 1. NEG = Negative; CURR = Current; POT = Potential; INS = Inside; OUT = Outside.
| UNESCO SITE | FACTORS SUMMARY TABLE | ASSESSMENT OF CURRENT NEGATIVE FACTORS | |||||||||
|---|---|---|---|---|---|---|---|---|---|---|---|
| SUDDEN GEOLOGICAL EVENTS | IMPACT | ORIGIN | SPATIAL SCALE | TEMPORAL SCALE | IMPACT | MANAGMENT RESPONSE | TREND | ||||
| NEG | CUR | POT | INS | OUT | |||||||
| 2 | Earthquake | X | X | X | |||||||
| 3 | Earthquake | X | X | X | X | ||||||
| 4 | Earthquake | X | X | X | X | ||||||
| Landslide | X | X | X | X | Restricted | Intermittent or sporadic | Significant | High capacity | Static | ||
| 5 | Earthquake | X | X | X | |||||||
Table 3.
Time period, spatial resolution cell of the SAR datasets used to extrapolate PS, and standard deviation of all the velocity measurements for each satellite datasets.
Table 3.
Time period, spatial resolution cell of the SAR datasets used to extrapolate PS, and standard deviation of all the velocity measurements for each satellite datasets.
| Dataset | Satellite | Orbit | Time Period | Spatial Resolution (m) | Standard Deviation (mm/Year) |
|---|---|---|---|---|---|
| 1 | Sentinel-1 | Ascending | 2014–2017 | 14 × 4 | 1.6 |
| 2 | Sentinel-1 | Descending | 2014–2017 | 14 × 4 | 1.5 |
| 3 | Envisat | Ascending | 2003–2010 | 20 × 20 | 2.0 |
| 4 | Envisat | Descending | 2003–2010 | 20 × 20 | 2.2 |
Table 4.
Main attributes of ADA extracted from Envisat and Sentinel-1 datasets, within the boundaries of the UNESCO Tuscan sites. N° = number of ADA; |vmax| = maximum velocity (mm/year); |vmin| = minimum velocity (mm/year); % = percentage of the areal coverage of ADA; NEGL = negligible (% < 0.1). All the velocities are in absolute value. For the UNESCO sites numeration see Table 1.
| UNESCO Site | ADA Extracted from Envisat Data | ADA Extracted from SENTINEL-1 Data | ||||||||||||||||||||||
|---|---|---|---|---|---|---|---|---|---|---|---|---|---|---|---|---|---|---|---|---|---|---|---|---|
| Core Zone | Buffer Zone | Influence Zone | Core Zone | Buffer Zone | Influence Zone | |||||||||||||||||||
| N° | |Vmax| | |Vmin| | % | N° | |Vmax| | |Vmin| | % | N° | |Vmax| | |Vmin| | % | N° | |Vmax| | |Vmin| | % | N° | |Vmax| | |Vmin| | % | N° | |Vmax| | |Vmin| | % | |
| 1 | 82 | 8.4 | 4.1 | 0.2 | 96 | 16.8 | 4.0 | 0.3 | 7 | 4.3 | 3.2 | NEGL | 56 | 8.3 | 3.1 | 0.1 | ||||||||
| 2 | 11 | 6.3 | 4.5 | NEGL | 15 | 6.6 | 4.2 | NEGL | 2 | 4.7 | 3.8 | NEGL | 1 | 3.7 | 3.7 | NEGL | ||||||||
| 3.9 | 1 | 5.1 | 5.1 | 0.1 | ||||||||||||||||||||
| 3.10 | 2 | 4.1 | 4.1 | NEGL | 2 | 5.1 | 4.7 | 0.1 | ||||||||||||||||
| 3.11 | 1 | 5.6 | 5.6 | NEGL | ||||||||||||||||||||
| 3.12 | 1 | 3.2 | 3.2 | NEGL | ||||||||||||||||||||
| 3.14 | 1 | 5.1 | 5.1 | NEGL | ||||||||||||||||||||
| 4 | 6 | 6.2 | 5.4 | 0.1 | ||||||||||||||||||||
| 5 | 8 | 5.9 | 4.2 | 0.5 | 411 | 19.8 | 4.0 | 7.0 | 34 | 6.1 | 3.0 | 0.3 | ||||||||||||
| 6 | 2 | 5.2 | 4.3 | NEGL | 2 | 4.2 | 4.1 | NEGL | 1 | 3.9 | 3.9 | NEGL | ||||||||||||
| 7 | 21 | 7.0 | 4.1 | NEGL | 2 | 5.6 | 4.8 | NEGL | 30 | 9.0 | 3.1 | NEGL | 6 | 4.9 | 3.2 | NEGL | 2 | 6.8 | 6.2 | NEGL | ||||
Table 5.
Number of ADA that have been detected in both datasets.
| UNESCO Site | Intersections between ADA | ||
|---|---|---|---|
| Core Zone | Buffer Zone | Transitional Zone | |
| Historic Center of Florence | 1 | 68 | |
| Seravezza Palace | 1 | ||
| Piazza del Duomo, Pisa | 69 | ||
| Val d’Orcia | 2 | ||
© 2018 by the authors. Licensee MDPI, Basel, Switzerland. This article is an open access article distributed under the terms and conditions of the Creative Commons Attribution (CC BY) license (http://creativecommons.org/licenses/by/4.0/).
Share and Cite
MDPI and ACS Style
Pastonchi, L.; Barra, A.; Monserrat, O.; Luzi, G.; Solari, L.; Tofani, V. Satellite Data to Improve the Knowledge of Geohazards in World Heritage Sites. Remote Sens. 2018, 10, 992. https://0-doi-org.brum.beds.ac.uk/10.3390/rs10070992
AMA Style
Pastonchi L, Barra A, Monserrat O, Luzi G, Solari L, Tofani V. Satellite Data to Improve the Knowledge of Geohazards in World Heritage Sites. Remote Sensing. 2018; 10(7):992. https://0-doi-org.brum.beds.ac.uk/10.3390/rs10070992
Chicago/Turabian StylePastonchi, Laura, Anna Barra, Oriol Monserrat, Guido Luzi, Lorenzo Solari, and Veronica Tofani. 2018. "Satellite Data to Improve the Knowledge of Geohazards in World Heritage Sites" Remote Sensing 10, no. 7: 992. https://0-doi-org.brum.beds.ac.uk/10.3390/rs10070992
Note that from the first issue of 2016, this journal uses article numbers instead of page numbers. See further details here.