Article

Assessing Performance of the RSTVOLC Multi-Temporal Algorithm in Detecting Subtle Hot Spots at Oldoinyo Lengai (Tanzania, Africa) for Comparison with MODLEN

1
National Research Council, Institute of Methodologies for Environmental Analysis, C. da S. Loja, 85050 Tito Scalo (Pz), Italy
2
Department of Geography, Vrije Universiteit Brussel, Pleinlaan 2, B-1050 Brussel, Belgium
3
School of Engineering, University of Basilicata, Via dell’Ateneo Lucano, 10, 85100 Potenza, Italy
*
Author to whom correspondence should be addressed.
Submission received: 11 June 2018 / Revised: 13 July 2018 / Accepted: 23 July 2018 / Published: 25 July 2018
(This article belongs to the Section Remote Sensing in Geology, Geomorphology and Hydrology)

Abstract

:
The identification of subtle thermal anomalies (i.e., of low-temperature and/or spatial extent) at volcanoes by satellite is of great interest for scientists, especially because minor changes in surface temperature might reveal an unrest phase or impending activity. A good test case for assessing the sensitivity level of satellite-based methods is to study the thermal activity of Oldoinyo Lengai (OL) (Africa, Tanzania), which is the only volcano on Earth emitting natrocarbonatite lavas at a lower temperature (i.e., in the range 500–600 °C) than usual magmatic surfaces. In this work, we assess the potential of the RSTVOLC multi-temporal algorithm in detecting subtle hot spots at OL for comparison with MODLEN: A thermal anomaly detection method tailored to OL local conditions, by using Moderate Resolution Imaging Spectroradiometer (MODIS) data. Our results investigating the eruptive events of 2000–2008 using RSTVOLC reveal the occurrence of several undocumented thermal activities of OL, and may successfully integrate MODLEN observations. In spite of some known limitations strongly affecting the identification of volcanic thermal anomalies from space (e.g., cloud cover; occurrence of short-lived events), this work demonstrates that RSTVOLC may provide a very important contribution for monitoring the OL, identifying subtle hot spots showing values of the radiant flux even around 1 MW.

Graphical Abstract

1. Introduction

For many decades, thermal remote sensing techniques have been used to monitor active volcanoes [1,2,3,4,5,6,7,8,9,10,11,12]. In remote and inaccessible regions, where in situ instruments are often lacking, satellite observations may represent the only source of available information (e.g., [7,13,14]).
The synoptic view of satellite systems along with the frequent observations enable active volcanoes monitoring both in developing countries, where economic resources are generally insufficient to install ground-based surveillance systems [9], as well as in areas well monitored by geophysical devices (e.g., Reference [15]). Among the space-based sensors, suited to monitor active volcanoes, several studies have been performed using the AVHRR (Advanced Very High Resolution Radiometer), aboard NOAA (National Oceanic and Atmospheric Administration) and METOP (Meteorological Operational Satellites) satellites (e.g., [16,17,18,19,20]). MODIS (Moderate Resolution Imaging Spectroradiometer), aboard NASA (National Aeronautics and Space Administration) Earth Science satellite missions Terra and Aqua., due to its spectral features, and to a good trade-off between temporal (4 passages per day) and spatial (1 km) resolution, has further extended detection capabilities of active lava flows, enabling also their quantitative characterization (e.g., [20,21,22,23,24,25,26]). MODIS offers in fact some spectral channels in the MIR (Medium InfraRed) band sensitive to hot surfaces, with the channel 21 (3.929–3.989 μm) having a better dynamic range than the other space-based IR sensors (it saturates at nearly 500 K in comparison with ~330–340 K of traditional MIR systems).
Among the satellite-based algorithms developed to detect volcanic hot spots using MODIS data, MODVOLC [20] (operating since 2000 at NASA Distributed Active Archive Center (DAAC)) performs the near-real time monitoring of active volcanoes at a global scale, e.g., References [20,21,22,23]. MIROVA (Middle Infrared Observation of Volcanic Activity) has been operational since 2013, providing information about thermal anomalies and Volcanic Radiative Power (VRP), at several volcanoes within 1 to 4 h of each satellite overpass [25,26]. RSTVOLC is a multi-temporal method that was tested with success in different geographic areas [27,28], revealing the occurrence of possible thermal precursory signals of some explosive eruptions, e.g., Reference [24].
In this work, we investigate the thermal activity of Oldoinyo Lengai (Africa-Gregory Rift Valley; see Figure 1) from space. This remote volcano is the only volcano on Earth emitting natrocarbonatite lava that shows a very low level of viscosity (10−1 to 102 Pa s [29]), and a relatively low temperature (ranging from 495–590 °C), compared to other types of lavas [30,31]. The eruption rates at Oldoinyo Lengai (OL) are extremely low; therefore, lava covers only a few tens of m2 compared to several hectares or km2 at other active volcanoes. Due to the limited area and temperature of active lava flows, the OL thermal activity is generally difficult to investigate by satellite. A specific adaption of MODVOLC, named MODLEN, has been designed, tailored and tested with good results for better identifying subtle hot spots at OL [30,31,32,33]. This is not routinely monitored by ground-based systems, as is similar with other African volcanoes [34].
Here we analyze the OL eruptive activity between 2000–2008, through using RSTVOLC, assessing the performance of this largely accepted method for comparison with MODLEN, which may be considered as the benchmark for this volcanic area.
During the selected period, the OL showed different eruption styles. Moreover, many field observations were available for validation (because of changes in the landscape and crater morphology, the access to summit crater has become more difficult after 2008). Bulletins of the Global Volcanism Program (GVP) and other independent field reports, made available by Frederick Belton on his website [35], are used here to validate thermal anomalies identified by satellite. In addition, a manual inspection of infrared MODIS records [36] is performed, and available high spatial resolution infrared satellite data are also used for assessing results.
The work focuses on the identification of subtle thermal anomalies (i.e., those of low temperature and/or small size). This is of a great interest for understanding volcanic processes (e.g., small explosive eruptions) as well as for other remote sensing applications (e.g., small fires characterization [36]).

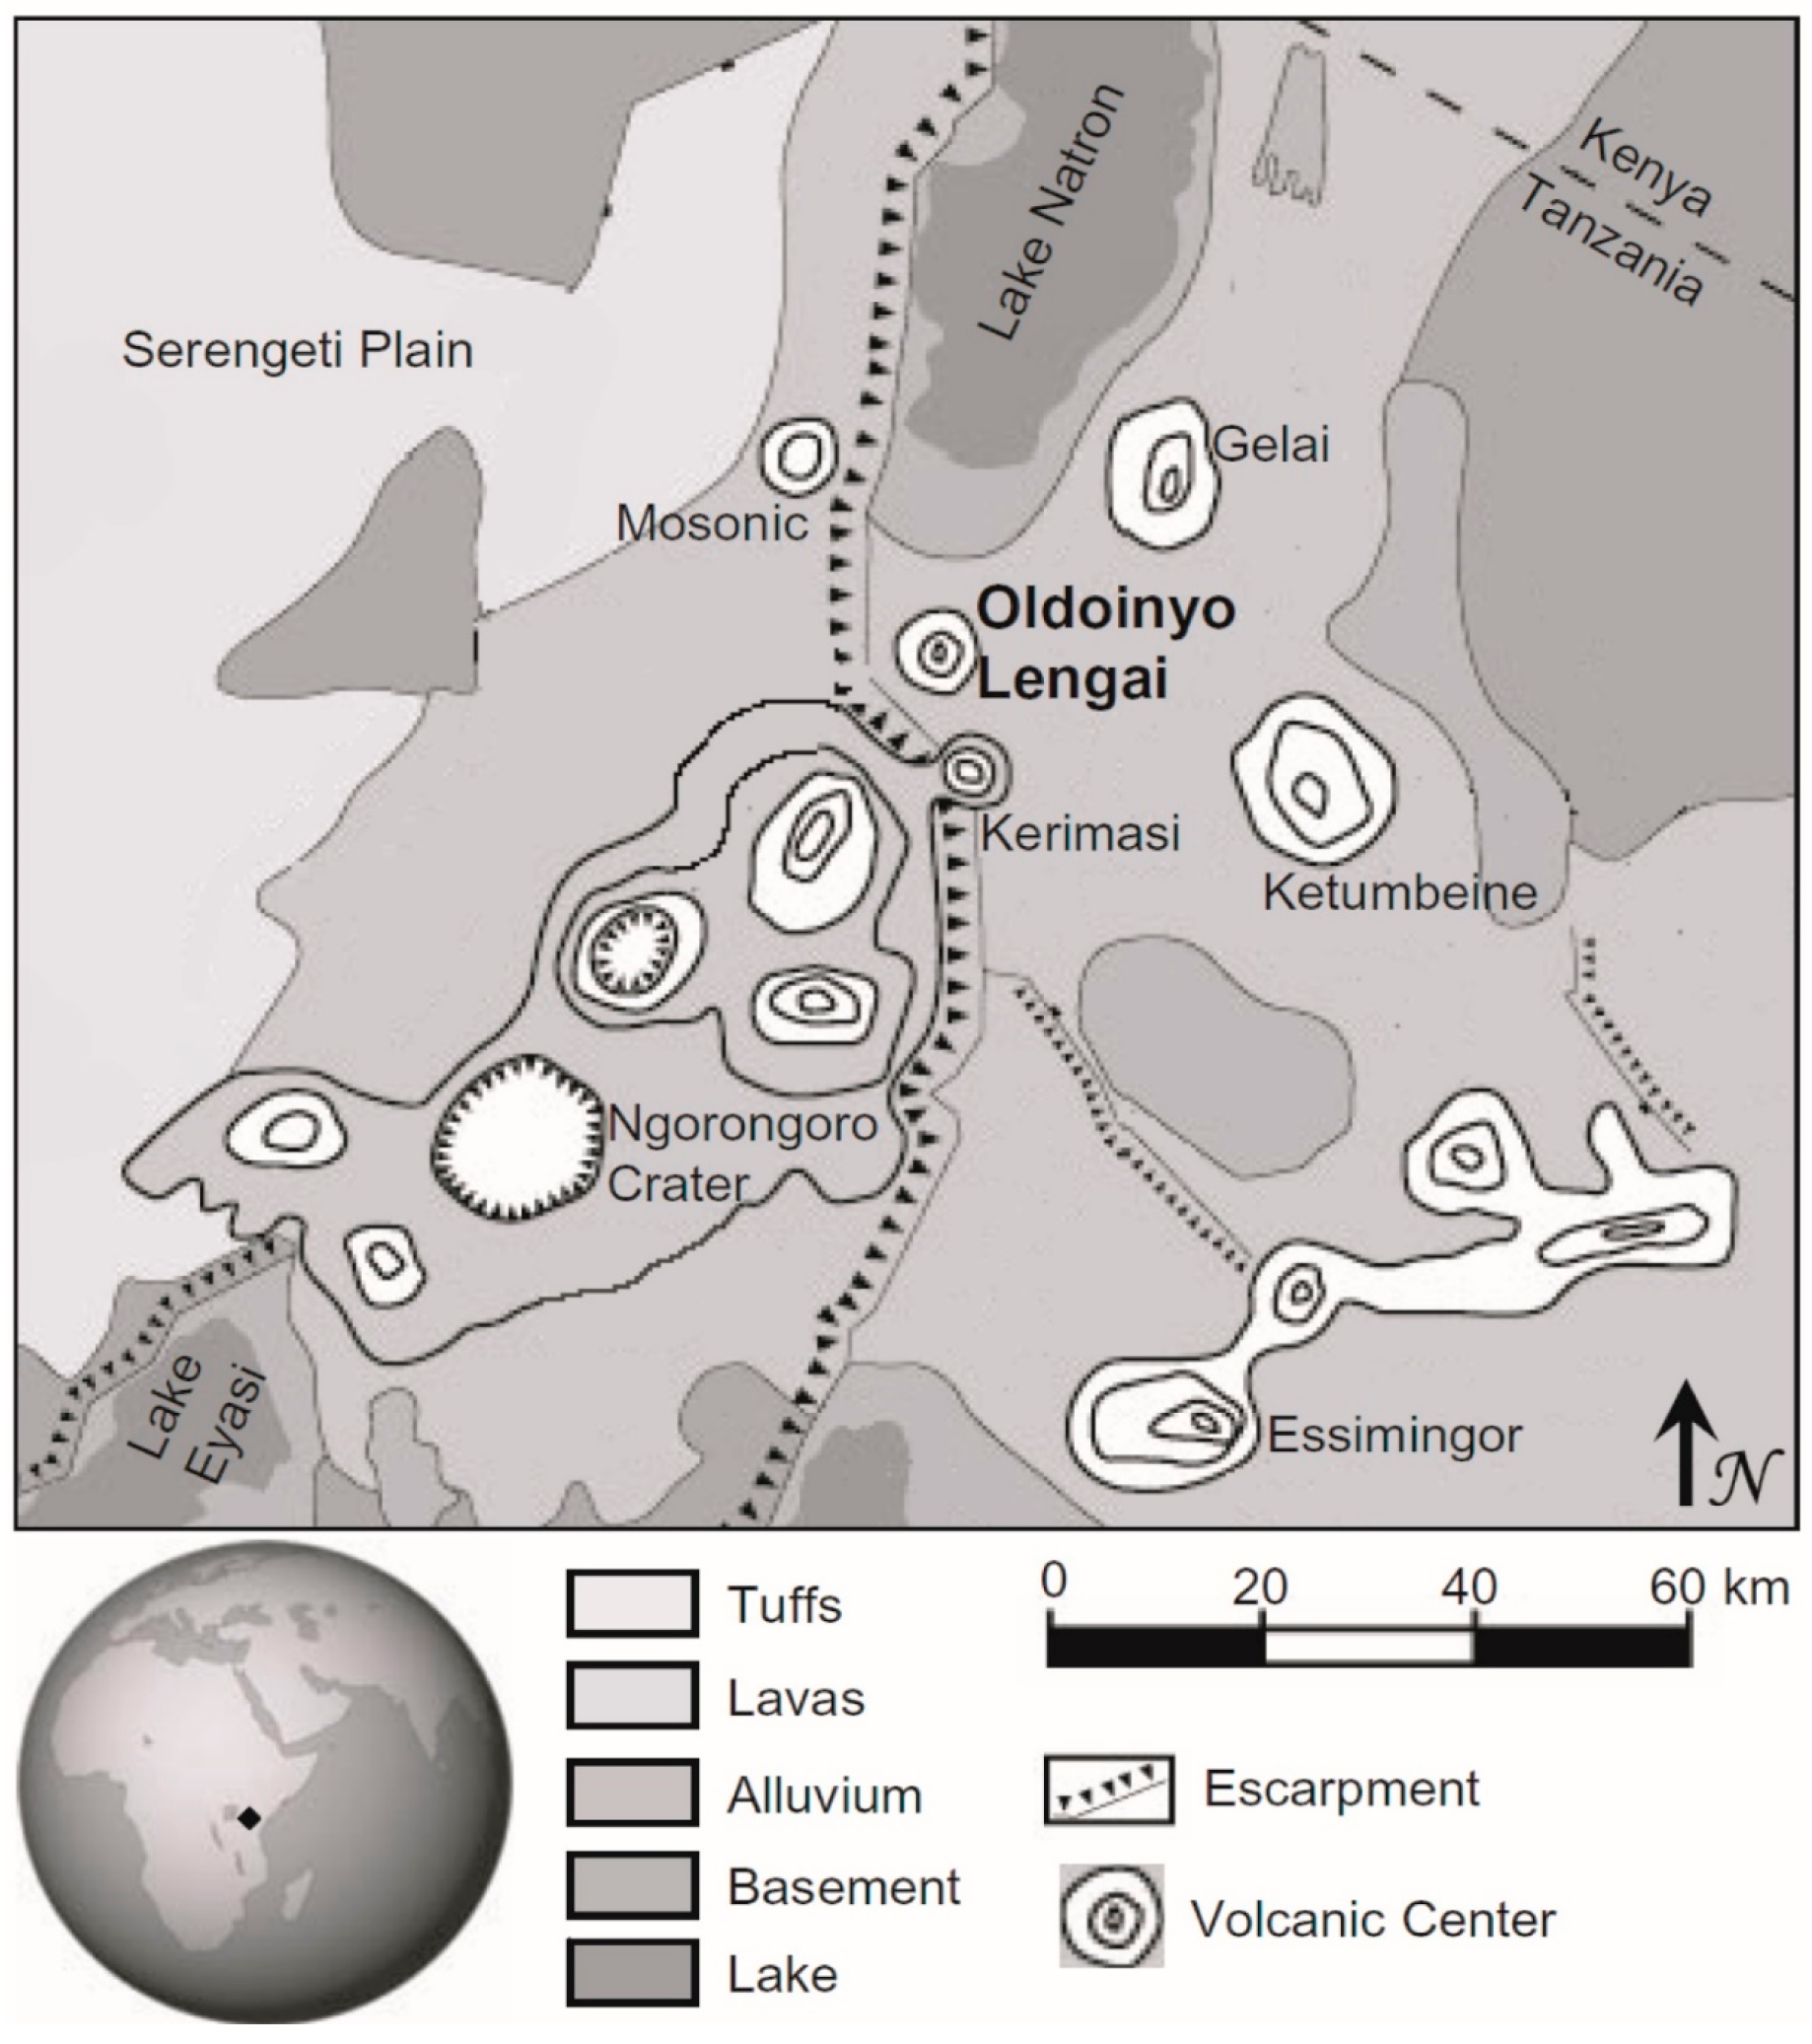
2. Oldoinyo Lengai Eruptive Activity

Two types of eruptive activity associated with contrasted magma composition characterize OL. In 1917, 1940–1941, 1967, and more recently in 2007–2008, vulcanian to sub-plinian explosive eruptions occurred over weeks to months, generating ash plumes as high as 11 km spreading ash over the entire region [30,32,37,38,39]. These eruptions are associated with nephenelite magma compositions [39]. Explosive eruptions are generally followed by quiescent periods. Renewal of eruptive activity is characterized by the effusion of low viscosity natrocarbonatite lava flows gradually filling up the crater created by the explosive eruption, and overflowing on the volcano flanks. This was observed before the 1917 and 1966 eruptions and from January 1983 onwards, until the 2007–2008 eruption events. Evidence of lava effusion was observed again by late 2008, after the end of the explosive eruption. Our analysis focuses specifically on the phase of natrocarbonatite effusion from 2000 to 2008. From 2000 to 2004, the crater was filled with lava which spilled over three points on the crater rim descending hundreds of meters down the outer flanks [40,41]. Eruptive activity was fed from several hornitos, scattered across the 400 m wide platform filling the crater. In July 2004, eruptions became more explosive producing small ash clouds [42,43,44]. During late March and early April 2006, a vigorous effusive eruption occurred. A lava flow with exceptionally large volume (9 × 10⁵ m3; [31]) was emitted in two phases and was emplaced along the western flank, reaching a length of 3 km (see [31]). After approximately one year of quiescence, a new lava emission occurred in July and August 2007, from several vents opening within the crater. This effusive activity was slightly more intense than that observed over the last 25 years [32,37,39]. On 4 September 2007, intense explosive activity started with repetitive emission of ash plumes, varying from several hundred meters to 11 km elevation [32,37]. This episodic explosive activity culminated in February–March 2008, with the generation of small pyroclastic density currents along the flank of the volcano and the formation of a 200 m deep pit crater. The analysis of ash samples from 2007–2008 indicated that the eruptive activity produced a hybrid magma generated by the interaction between natrocarbonatite and nephelinite [39,45].

3. Satellite Methods

As before mentioned, the aim of this paper is to assess the RSTVOLC potential in detecting subtle hot spots at OL using as a reference MODLEN, which was specifically developed for monitoring this African volcano. Although other MODIS-based methods (e.g., MIROVA) could be analyzed for assessing differences in detecting volcanic thermal anomalies at Lengai during the period of interest, an inter-comparison among several hot spot detection methods it out of the scope of this paper. In the following paragraphs, the rationale of MODLEN and RSTVOLC algorithms is then described.

3.1. MODLEN

MODLEN is an adaptation of the global MODVOLC algorithm, developed by Wright and Pilger [21], to monitor volcanic hot spots globally. The algorithm is based on the derivation of the Normalized Thermal Index (NTI), which is defined as:
N T I ( x , y ) = L M I R ( x , y ) L T I R ( x , y ) L M I R ( x , y ) + L T I R ( x , y )
in which LMIR(x,y) and LTIR(x,y) are the radiance values of MIR and TIR (Thermal Infrared) signals measured in the MODIS channel 22 (3.929–3.989 μm), or channel 21 when channel 22 is saturated, and 32 (11.770–12.270 μm), respectively, for a given pixel. MODVOLC works with a single threshold value for all volcanoes in the world: All pixels returning an NTI value above −0.80 are considered as hot spots [21]. This threshold, although guarantees a reliable identification of thermal anomalies at a global scale, was not found to be sensitive to OL eruptive activity [28]. To overcome this limitation, MODLEN introduces a regionally valid threshold, checking for all the pixels of the studied area, and if the NTI values are above −0.83, in this case automatically flagging the pixel as a hot spot. For pixels with an NTI value between −0.83 and −0.88, a spatial filter is applied to compare the NTI values of the studied pixel with the average of its eight surrounding neighbors ( N T I n e i g h ¯ ), according to:
Δ N T I ( x , y ) Δ x Δ y = N T I ( x , y ) N T I ¯ n e i g h N T I ¯ n e i g h
Because NTI values are negative, and a sub-pixel thermal anomaly will generate a higher-than-average NTI value. The spatial derivative will be negative for hot spots. Empirical analysis showed that anomalously hot pixels return values of the spatial filter lower than −0.02. MODLEN. Therefore, flags all pixels with a spatial derivative smaller than −0.02 and a NTI greater than −0.88 as hot spots. Since the MODLEN algorithm returns low NTI values for cloud-affected pixels, no cloud mask is applied. The use of this spatial derivative parameter turns the point operation of the MODVOLC algorithm into a contextual approach, where the presence of an anomaly at one pixel is evaluated taking into account the radiance measured at the surrounding pixels. Eventually, in order to facilitate the interpretation of detected hot spots, the MODLEN algorithm automatically computes the distance of any identified hot spot to OL crater. This disregards hot spots generated by bush fires (generally because of lava overflowing) at the base of the volcano. The NTI value of the pixel located closest to Oldoinyo Lengai active crater is also recorded for each analyzed scene, even if it is not flagged as a hot spot in order to assess the effect of cloud coverage (with typical NTI value lower than −0.92). Hot spots detected by MODLEN have been shown to generally match with eruptive activity, witnessed at OL [28]. When observations were available, they proved to be essential data to constrain the changes and variation in eruptive activity from 2000 to 2008 [31,32,46].

3.2. RSTVOLC

RSTVOLC is an optimized configuration of the RST (Robust Satellite Techniques) multi-temporal approach [47], which identifies perturbing events by: (i) Analyzing multiyear time series of cloud-free homogeneous (same calendar month, same channel/s, same acquisition time) satellite records; and (ii) searching for anomalies by means of a specific change detection step.
In more detail, RSTVOLC uses two local variation indices in combination to identify volcanic thermal anomalies [27]:
M I R ( x , y , t ) = B T M I R ( x , y , t ) μ M I R ( x , y ) σ M I R ( x , y )
M I R T I R ( x , y , t ) = Δ T ( x , y , t ) μ Δ T ( x , y ) σ M I R ( x , y )
In Equation (3), B T M I R ( x , y , t ) is the brightness temperature ( B T ), measured in the MODIS channel 22 at time t for each pixel ( x , y ) of the analysed satellite scene. While μ M I R ( x , y ) and M I R ( x , y ) , respectively, represent the temporal mean and the standard deviation. As for MODLEN, channel 21 is used in place of channel 22 when the latter is saturated.
The M I R ( x , y , t ) index is highly sensitive to hot magmatic surfaces [15,47,48,49,50], reaching the peak of their thermal emissions in the MIR band (around 3–5 μm). However, non-volcanological signal fluctuations, ascribable to weather/climatic factors, may still affect its performance [27].
To minimize those spurious effects, the M I R T I R ( x , y , t ) index, analyzing also the signal measured in the TIR band at around 11 μm wavelength (i.e., B T T I R ( x , y , t ) ), is used in combination with the previous one. The M I R T I R ( x , y , t ) index is described in Equation (4), where Δ Τ ( x , y , t ) = B T M I R ( x , y , t ) B T T I R ( x , y , t ) , while μ Δ T ( x , y ) and σ Δ T ( x , y ) stand for the relative temporal mean and standard deviation.
Along with previous studies, we have used the OCA (One Channel Algorithm [51]) method to filter out meteorological clouds, and the iterative 2σ-clipping filter to remove signal outliers possibly contaminating the time series, before generating the library of spectral reference fields (i.e., temporal mean and standard deviation images) [27,28]. OCA is an RST-based cloud-detection scheme that identifies cloudy radiances based on signal divergence from unperturbed “clear sky” conditions. In particular, only the TIR signal is analyzed in nighttime, which considers the different spectral behavior shown by those features in comparison with the cloud-free background. The MODIS channel 32 (11.770–12.270 μm) is usually used for this purpose. The OCA method performs well in different geographic areas and under different illumination conditions, in spite of some limitations widely discussed in previous works [52].

4. Data and Algorithm Implementation

MODIS is a sensor flying aboard the Terra (morning coverage) and Aqua satellites (afternoon coverage), providing data in 36 spectral channels. The infrared channels have a spatial resolution of 1 km at nadir view. Channels 21 and 22, which are centered in the MIR spectral region, and channels 31 (10.780–11.280 μm) or 32, located in the TIR, are commonly used to detect volcanic hot spots (e.g., [21]). Specifically, the channel 21 is generally used when the channel 22 saturates. In this work, to assess RSTVOLC performance at OL, we have processed nine years of nighttime MODIS records acquired from 2000 to 2008, provided by NASA (LAADS—Level 1 and Atmosphere Archive and Distribution System). Table 1 details the number of analyzed Aqua (2171) and Terra (2593) orbits (4764 images in total).
We have used MODIS data, as listed in Table 1, to generate the spectral reference fields (on a monthly temporal scale) required for the computation of RSTVOLC indices. Two different time slots (of 19:00 UTC ± 2 h for Terra and 01:00 UTC ± 2 h for Aqua) have been analyzed for this purpose. Thus, to implement RSTVOLC, running on re-projected Level 1b MODIS imagery (in LAT/LONG WGS 84 projection) with a 1 km resampled ground resolution cell, we have generated a library of 48 spectral reference fields (i.e., one temporal mean and one standard deviation image for each time slot and month of interest and for each sensor).

5. Results

5.1. Assessment of RSTVOLC and MODLEN Detections

To search for volcanic thermal anomalies at OL, the same RSTVOLC configuration (i.e., M I R ( x , y , t ) > 3   A N D   M I R T I R ( x , y , t ) > 3 ) used in previous studies [27,52] has been implemented here. By using this algorithm arrangement, RSTVOLC flagged 172 volcanic thermal anomalies in approximately 3.6% of analyzed satellite scenes, whereas according to MODLEN 165 thermal anomalies affected the same dataset. Table 2 details those results showing that both algorithms flagged a few thermal anomalies on MODIS acquired during 2000. In the following years, the number of hot spot detections significantly increased. In particular, MODLEN flagged a higher number of hot spots than RSTVOLC particularly during 2006 and 2008. According to RSTVOLC, eruptive events of 2002 and 2007 were more significant than that indicated by MODLEN.
Since the OL is not operationally monitored by in-situ instrumentations, a multi-step validation scheme has been used here for assessing the RSTVOLC potential in monitoring this remote volcano for comparison with MODLEN. In particular:
  • We looked for the temporal agreement between flagged hot spots and documented eruptive activities of OL (e.g., [40,41,42,43,44]). The GVP bulletins usually provide information about the OL based on visual observations performed by visitors, single researchers and/or scientific teams. Since this information is generally less detailed than that reported by Frederick Belton (who carried out several field observations at OL during the period of interest) on his website [35]. We used both independent sources to assess thermal anomalies flagged by satellite.
  • Field observations are infrequent and intermittent at OL. Therefore, it is realistic to suppose that a number of thermal activities occurring during the period of interest were unreported by both validation sources [30]. In order to take this limitation into account, and also considering the lava cooling process, we considered that thermal anomalies flagged within ±2 days from documented eruptions were associated to real (although undocumented) thermal activities of OL.
  • High spatial resolution satellite data provided by sensors as ASTER (Advanced Spaceborne Thermal Emission and Reflection Radiometer) and ALI (Advanced Land Imaging) can also be used for assessing the presence of volcanic hot spots at OL. The low temporal resolution of those data (e.g., 16 days for both above-mentioned sensors), which is further reduced in presence of clouds, did not allow us for a systematic validation analysis of the detected thermal anomalies. As an example, by analyzing ASTER data made available from AVA (Aster Volcano Archive; https://ava.jpl.nasa.gov/granule.php?f=20040805200215) of the JPL (Jet Propulsion Laboratory), we found that only 13 granules independently returned hot spots for the OL during the period of interest, confirming limitations mentioned above (see Table 3). Considering only the ASTER hot spots at an average distance less than 1 km from the OL summit, eight of them indicate the occurrence of volcanic activity and six were temporally coincident with thermal anomalies identified by MODLEN and/or RSTVOLC.
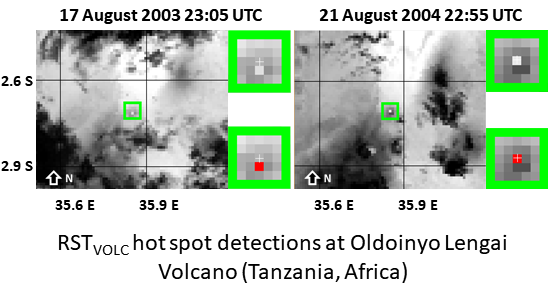
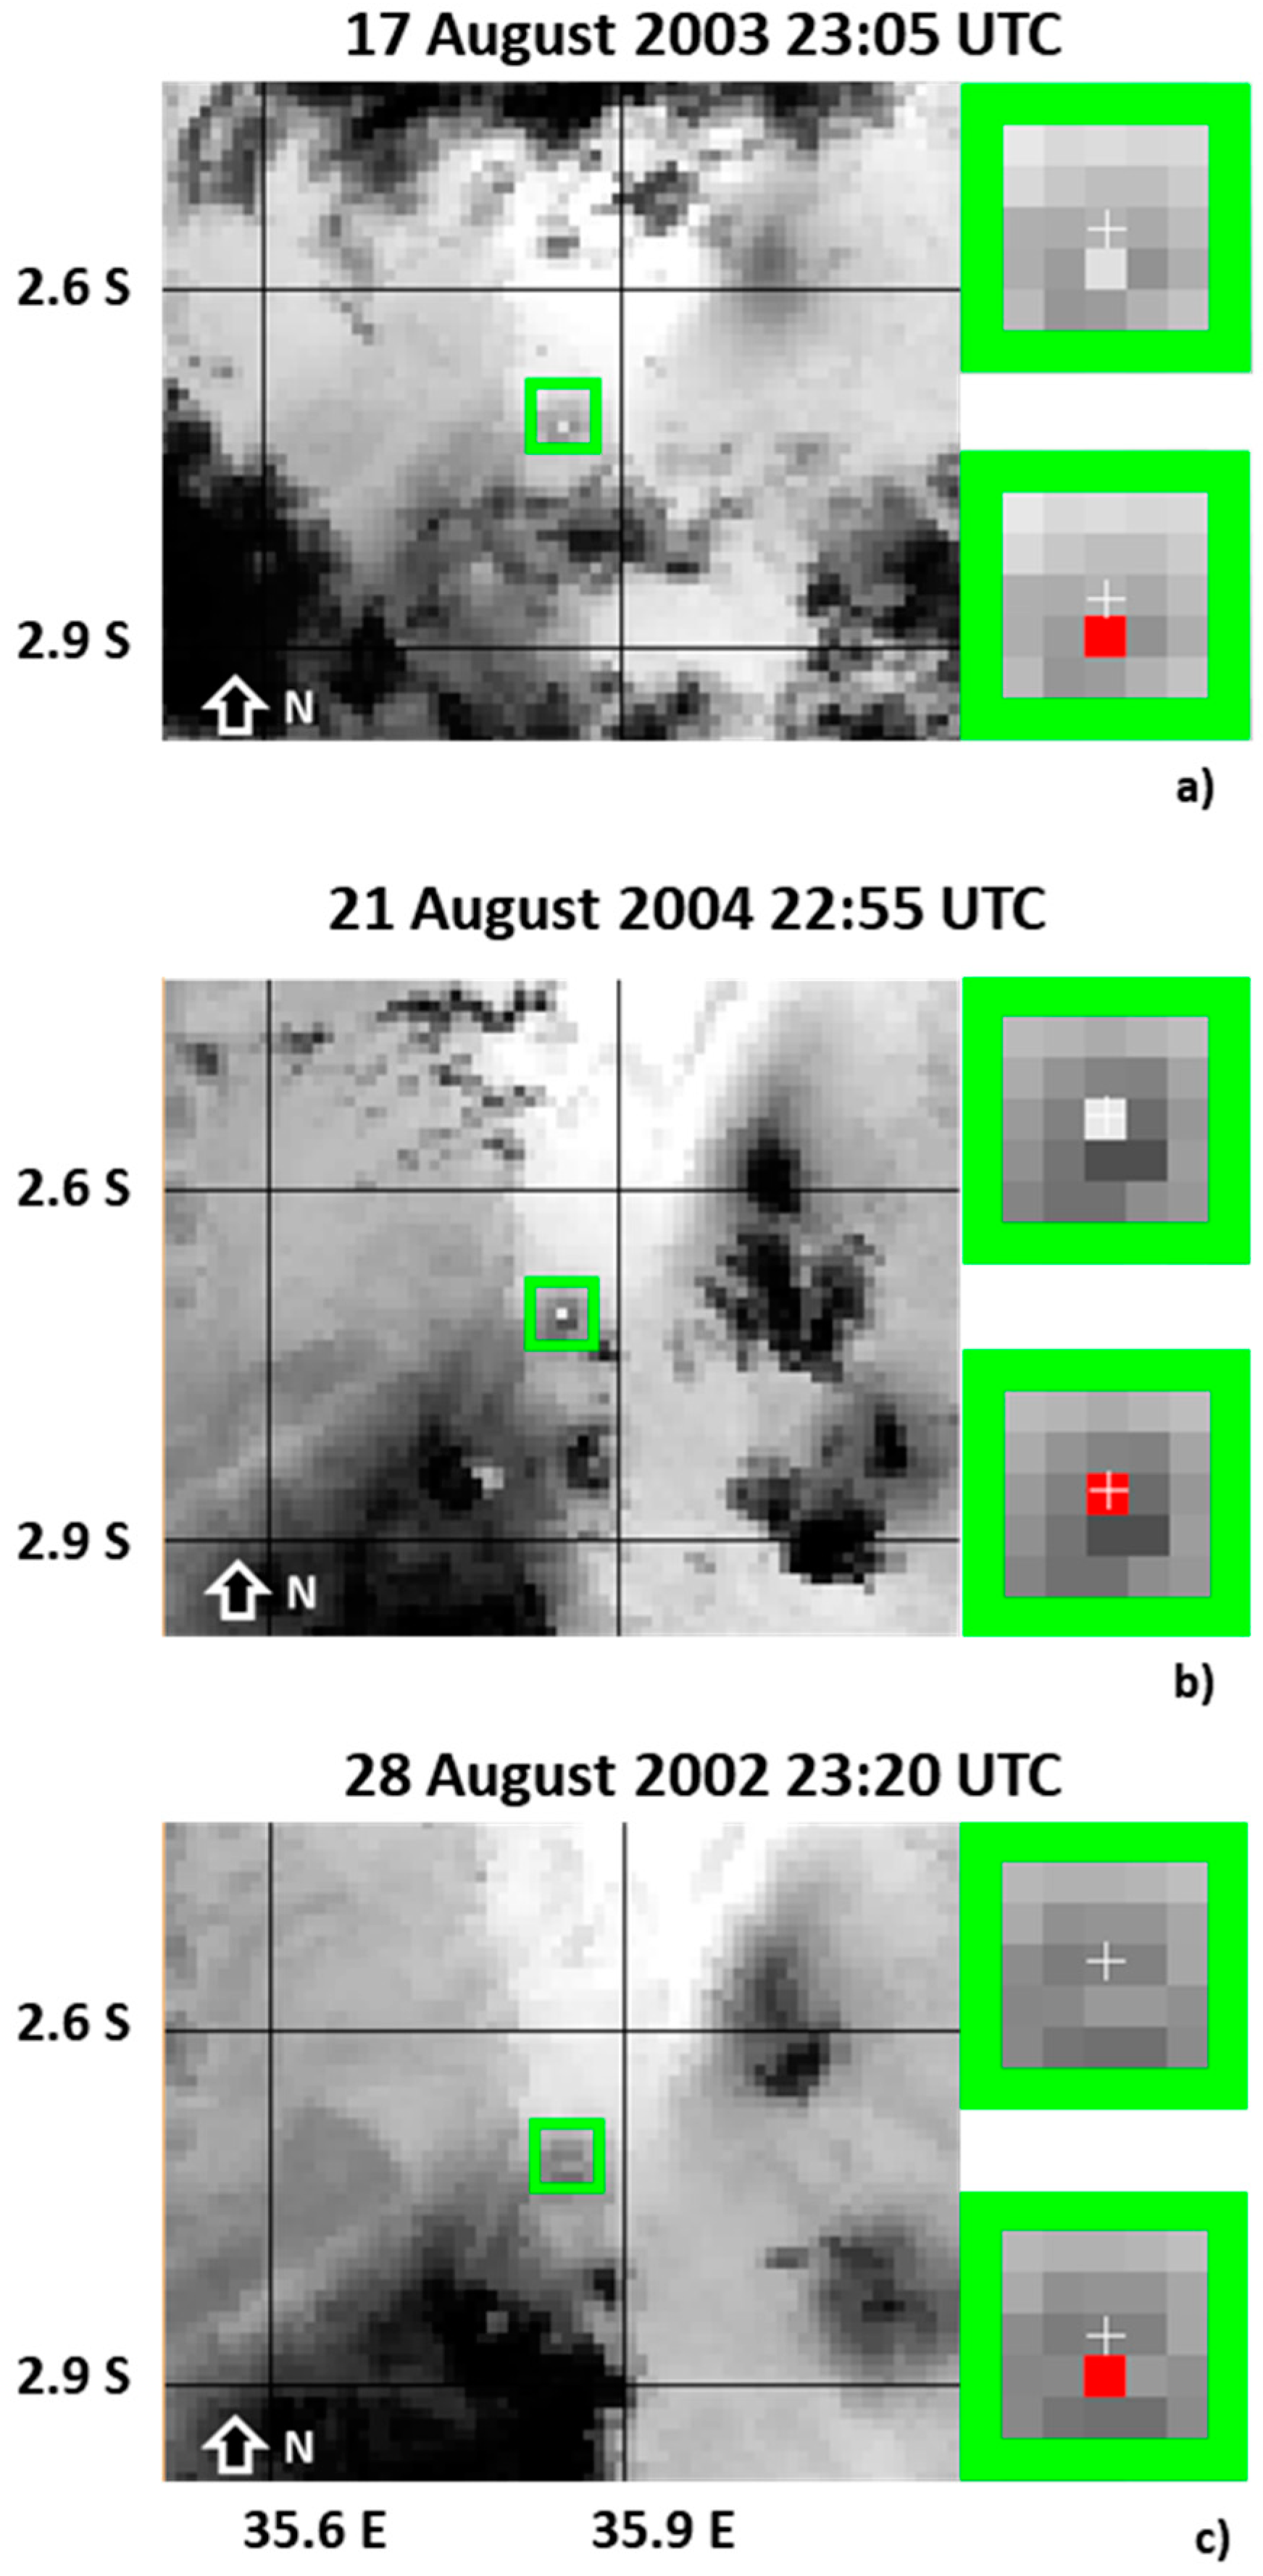
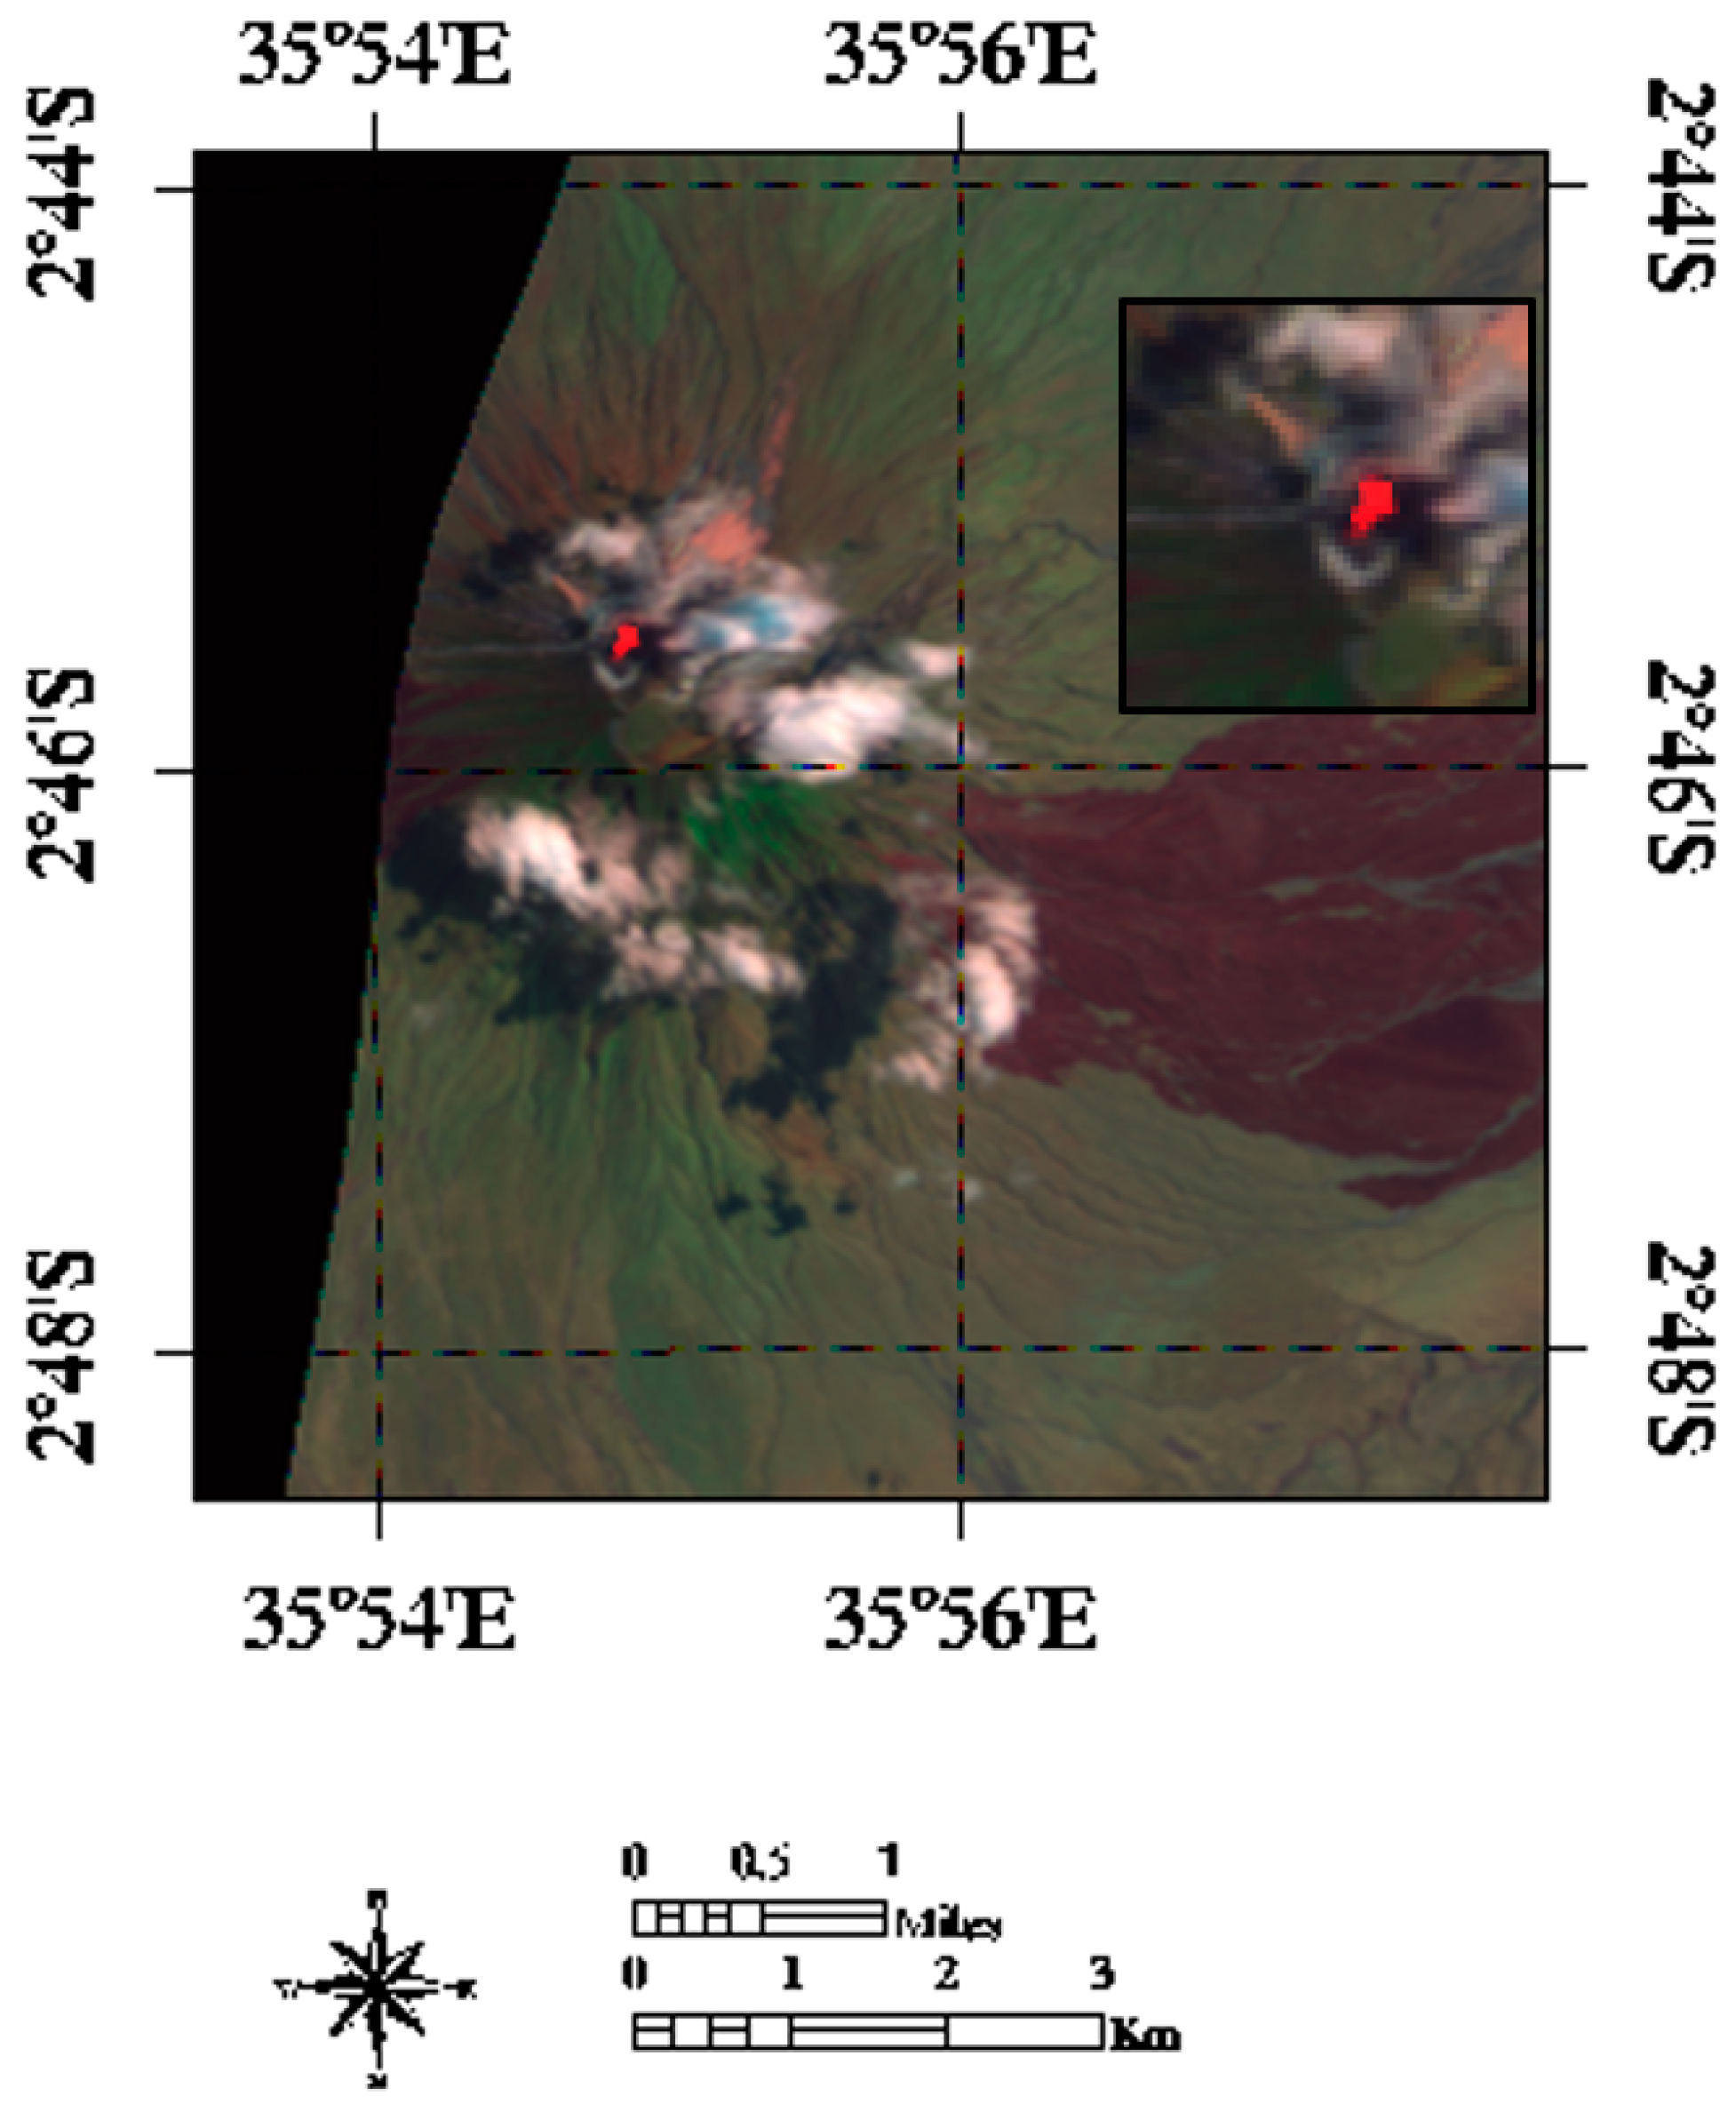
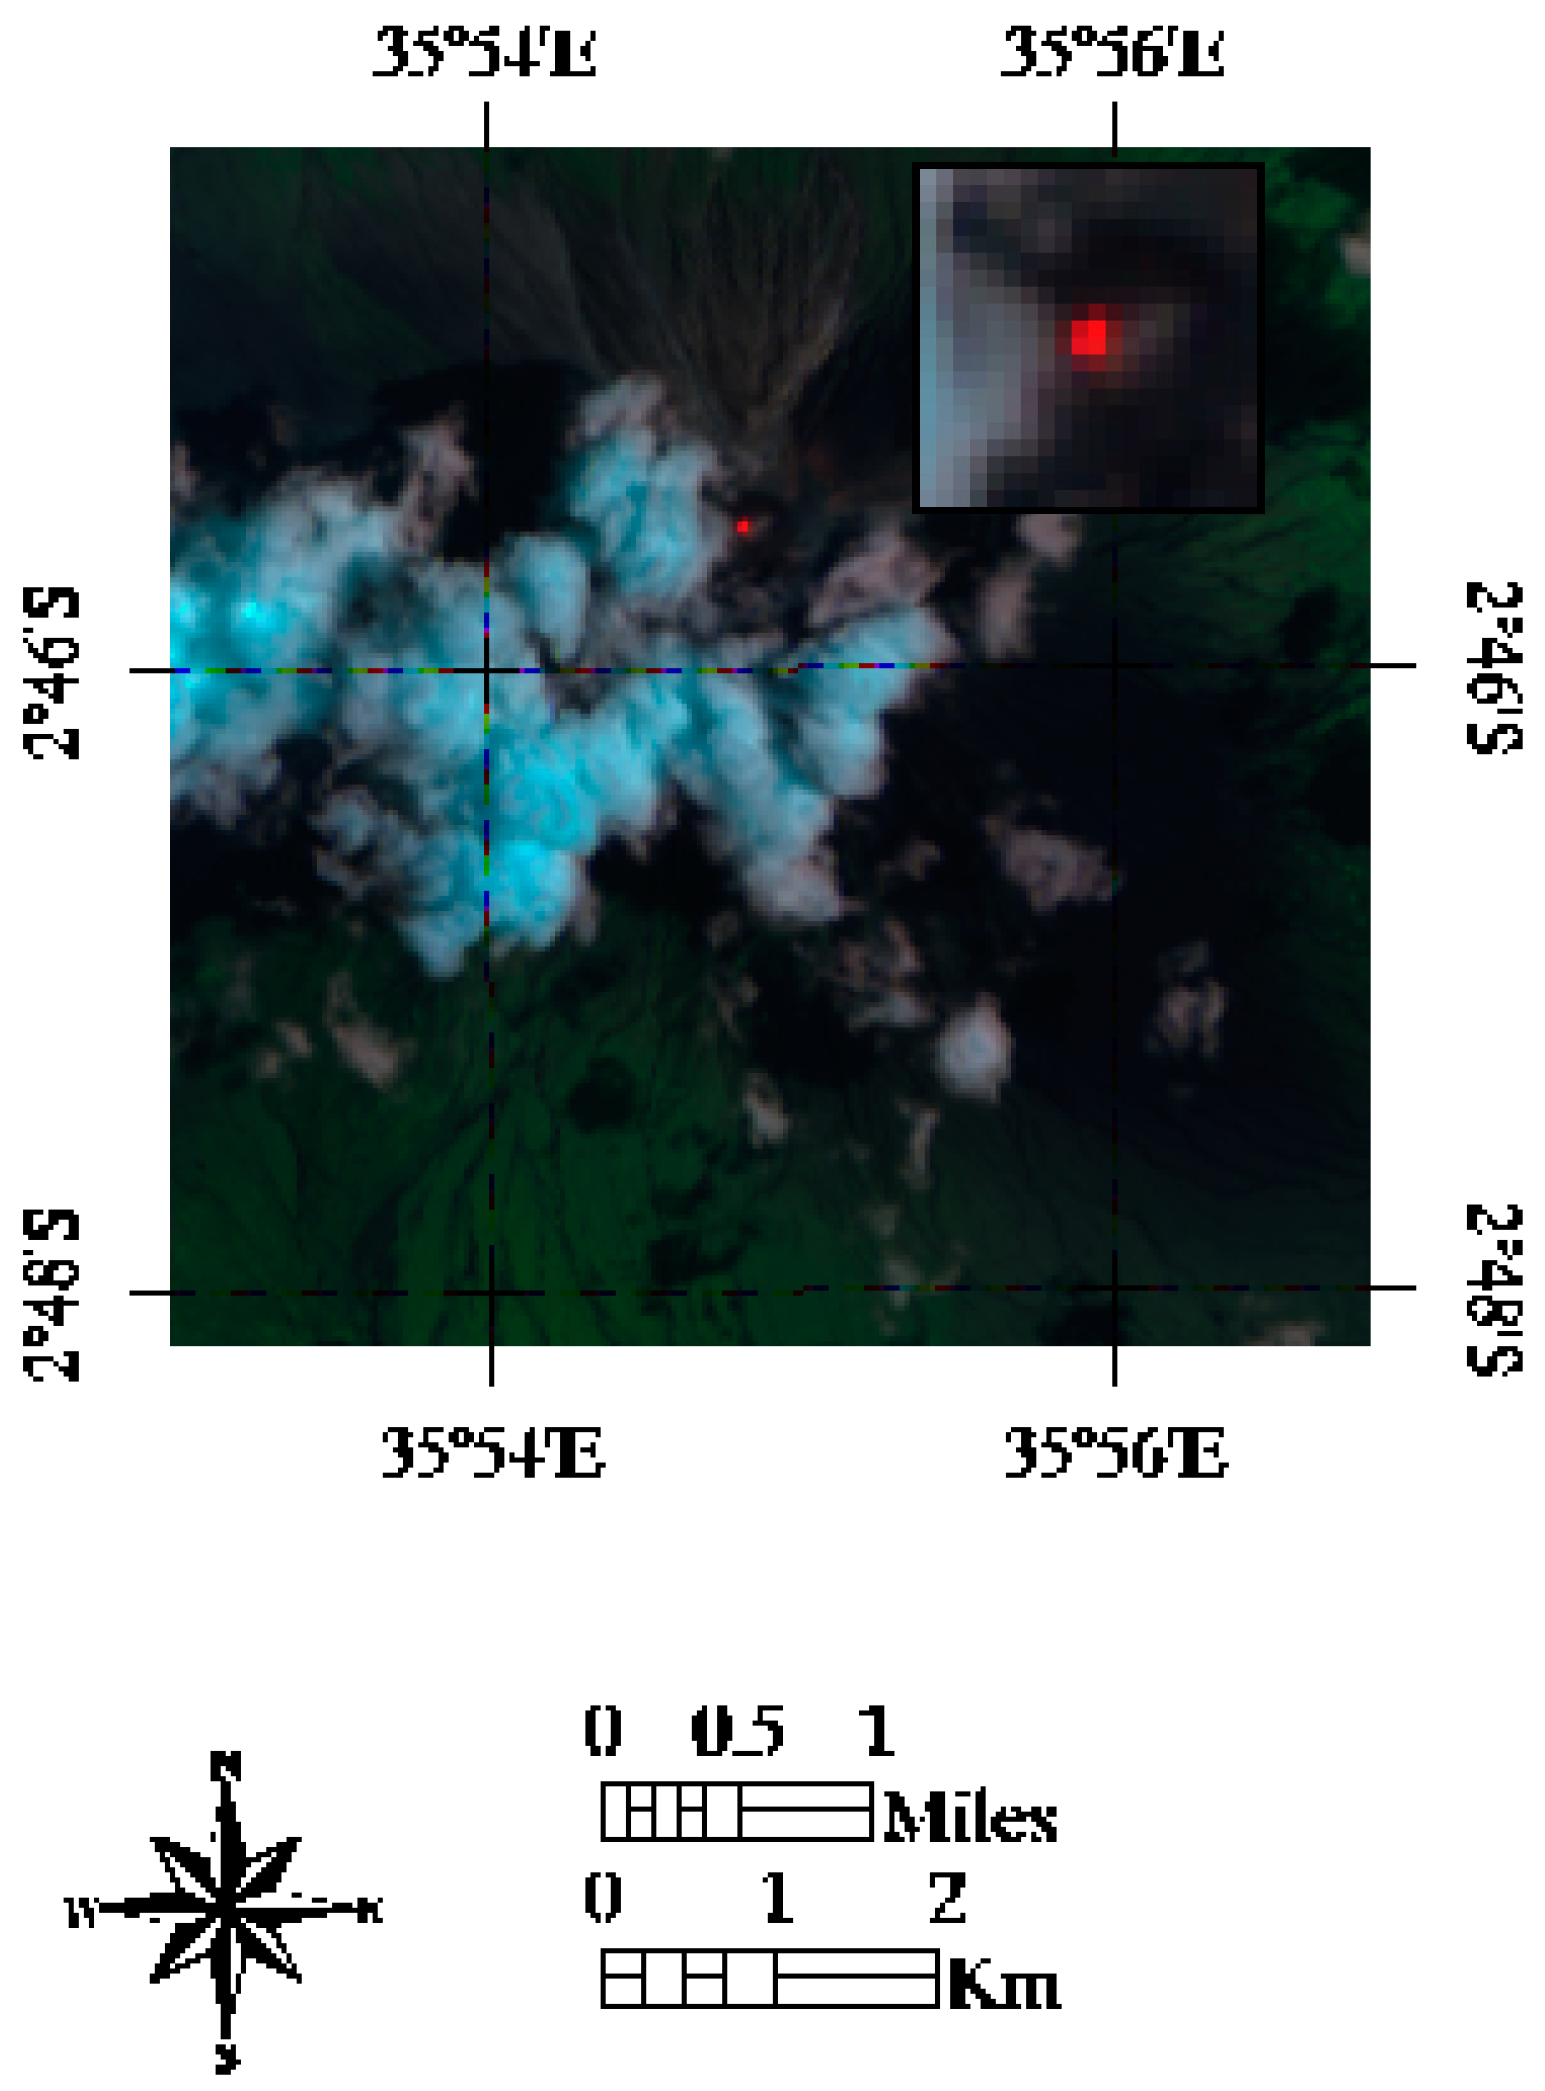
  • To assess if thermal anomalies that were not corroborated by the three above-mentioned validation steps represented artefacts or were rather associated to undocumented thermal activities of OL, we performed a manual inspection of infrared MODIS records, similar to previous independent studies [36]. This analysis, which was carried out by assessing the location and features (in terms of brightness temperature difference with the background) of detected hot spots, is similar to that independently performed in a previous literature study. This is where authors considered anomalous those pixels whose integrated temperature was elevated by 5 K above its neighbor (non-anomalous) ones [36,53]. In Figure 2, we show some examples of this investigation in reference to three different nighttime MODIS scenes of 2002–2004. In the figure, displaying the MIR channel in background, the green box indicates the OL volcanic area. The latter is magnified at the right side of each panel showing at the top the original B T M I R field (brightest pixels are the more radiant ones), and at the bottom the detected thermal anomalies (in red). The top panel (Figure 2a) displays the nighttime MODIS data of 17 August 2003 at 23:05 UTC revealing that one of OL crater pixels was more radiant than neighbor ones. In particular, the B T M I R value (292.19 K) of this image pixel, corresponding to that considered anomalous by both algorithms, was about 6.5 K above the background (i.e., the spatial mean calculated from the surrounding unperturbed pixels), confirming the occurrence of a thermal activity at OL. The mid panel (i.e., Figure 2b) shows another example of thermal anomaly which was correctly identified by satellite (on MODIS data of 21 August 2004 at 22:55 UTC). This hot spot, flagged only by RSTVOLC (MODLEN did not detect this feature because of the NTI value slightly lower than the used threshold), had the same characteristics of that reported in Figure 2a in terms of location and B T M I R difference with the background. Hence, it may be similarly ascribed to an undocumented thermal activity of OL. The bottom panel (i.e., Figure 2c) shows instead an example of false detection. Indeed, the B T M I R value (287.56 K) of the pixel flagged as anomalous by RSTVOLC (on MODIS data of 28 August at 23:20 UTC) was only about 2 K higher than background ( B T M I R = 285.5 K), revealing the generation of an artefact.
Table 4 summarizes results of the multi-step analysis described above indicating that 92.2% and 97.7%, respectively, of MODLEN and RSTVOLC detections were associated to real (i.e., both documented and undocumented) thermal activities of OL. It should be stressed that a correlation analysis between the two analyzed hot spot detection series led to an adjusted R 2 = 0.87 and to a p -value < 0.0001, revealing the similar behavior of MODLEN and RSTVOLC algorithms during the period of interest.
After evaluating performance of RSTVOLC in detecting volcanic hot spots for comparison with MODLEN (e.g., see false positive rates detailed in Table 4), we investigated differences in monitoring changes of thermal volcanic activity at OL. Figure 3 summarizes the results of this analysis, displaying the temporal trend of thermal anomaly spatial extent (in terms of hot spot pixel number) retrieved during the period of interest by matching the geographic coordinates of anomalous pixels, flagged by RSTVOLC on original Level 1b MODIS data used by MODLEN. As can be seen from the figure, according to both RSTVOLC (red bars) and MODLEN (grey bars) the most intense eruptive events of OL were those of March–April 2006 (when an unusually large effusive eruption of natrocarbonatite lava occurred) and July–September 2007 (when another significant eruptive event took place at the monitored volcano). It is worth noting that after the identification of an undocumented eruption on 20–21 June 2006, the two methods did not flag any thermal anomaly before June 2007, in agreement with the information provided by field reports [54].

5.2. Quantifying Thermal Emissions at OL

Figure 4 displays the temporal trend of the radiant flux ( Q r a d ) retrieved from RSTVOLC detections performed on MODIS data of July–early September 2007 (similar results are expected from MODLEN outputs). We estimated the radiant flux using the formulation reported in Reference [55] (amending that proposed by Kaufman et al. [56] to retrieve the rate of emitted energy of active fires):
1 n Q r a d = 4.34 × 10 19 × ( T h   8 T b   8 ) × A p i x   [ MW ]
In Equation (5), T h and T b respectively represent the MIR brightness temperatures of thermal anomaly and of background (the temporal mean value has been considered here); A p i x is the MODIS pixel area (1 km2 for the resampled MODIS data); and n is the number of hot spot pixels.
Figure 4 shows that the radiant flux ranged from 1.2 MW (on MODIS data of 4 July at 23:05 UTC, when a single hot spot pixel was detected by RSTVOLC) to about 775 MW (on MODIS data of 1 September at 19:50 UTC when both algorithms flagged the same number of anomalous pixels). In more detail, the radiant flux was lower than 50 MW during 1–7 July (when some thermal anomalies were identified also by MODVOLC [46]). During 23 July–20 August 2007, RSTVOLC detected volcanic hot spots in a more discontinuous way; the estimated radiant flux was mostly lower than 10 MW. According to field observations, an inner crater activity occurred during 22–23 July, small lava flows were emitted during 3–5 August and a mild-strombolian activity took place during 15–16 August, indirectly corroborating the low level of radiant flux in Figure 4. The latter also shows that the analyzed parameter increased in magnitude during 22–25 August because of a documented lava effusion, while it decreased in the following two days (when Q r a d was retrieved around 7 MW on MODIS data of 27 August at 22:25 UTC).
Afterwards (i.e., during 28–30 August), a new increase in the intensity of thermal emissions was recorded, indicating the possible occurrence of a lava overflow or the presence of an active lava lake within the crater, in agreement with that reported in a previous study [34]. The RGB product from EO1-ALI imagery of 29 August 2007, shown in Figure 5, further confirms this hypothesis.
Indeed, the false color composite image shows that some pixels appearing red, because of strong Short Wave InfraRed (SWIR) signal, affected the NE side of OL crater corroborating the occurrence of a lava overflow. Three days later, Q r a d once again increased reaching about 250 MW (comparable values of this parameter were retrieved on both Aqua and Terra-MODIS scenes), although the radiant flux reached its peak on 1 September, when the lava flowed down the volcano flanks [54]. Since the voluminous lava overflow triggered some bush fires [34], the maximum Q r a d value around 775 MW was presumably overestimated. Nonetheless, this value of the radiant flux appears not particularly high, especially if compared to estimates of same parameter performed in other volcanic areas in presence of active lava flows (e.g., [28]). Finally, Figure 4 shows that, after the above-mentioned lava effusion, intensity of volcanic thermal emissions significantly decreased, as indicated by the lower Q r a d value, around 82 MW, retrieved from MODIS data of 3 September at 19:35 UTC. This analysis demonstrates that quantitative information retrieved from satellite observations may be helpful in reconstructing the dynamics of eruptive events.

6. Discussion

Results shown in previous section demonstrate that RSTVOLC was capable of detecting both natrocarbonatite lava events and minor thermal activities of OL (leading also to values of radiant flux around 1–10 MW generally associated to weak strombolian eruptions; e.g., [57]) occurring during the period of interest. In detail, analyzing the field reports, including 227 days of low-moderate thermal activity (e.g., gas emissions, weak strombolian explosions; lava within the crater floor) and 21 days of high-level eruptions (e.g., lava effusions/fountains), RSTVOLC identified about 13.7% of documented eruptive days, performing slightly better than MODLEN whose percentage was around 12.9%.
It is worth mentioning that those percentages were achieved assessing results based on the multi-step validation analysis detailed in Section 5.1 and then considering as real also hot spots flagged within the temporal range of ±2 days from documented eruptions. It should be remarked that such a criterion takes into account the limit of field observations that are infrequent and intermittent at OL, possibly missing the start/end time of eruptive activity. This hypothesis has been confirmed here: For example, by the analysis of thermal anomalies shown in Table 3. Indeed, of the eight thermal anomalies independently revealed by ASTER data at OL, five occurred within the selected ±2 days from documented eruptions.
As a further demonstration of the consistency of this criterion, Figure 6 displays the EO1-ALI RGB product at 30 m spatial resolution of 10 March 2008, when both MODLEN and RSTVOLC flagged a thermal anomaly over the OL. The figure shows the presence of some highly radiant pixels in the SWIR band well located over the crater area (see red pixels), confirming that, one day before the occurrence of a documented eruptive activity (of 11 March 2008), a hot magmatic surface already affected the monitored volcanic area. It should be pointed out that the two algorithms provided comparable information about thermal anomalies occurring within the temporal range of ±2 days, which were in the order of about 28% for RSTVOLC and 24% for MODLEN, as a further demonstration of their similar performance.
Regarding the capability of both methods in monitoring changes of OL thermal activity also investigated in this study (see Figure 3), main differences between them are ascribable to their intrinsic features. As an example, MODLEN considered the July–August 2007 eruption as less intense than that indicated by RSTVOLC mainly because of the used spatial filter, favoring the identification of the brightest pixels in a scene within 2 km of Lengai summit area and then causing an underestimation of thermal features. On the other hand, RSTVOLC possibly overestimated some volcanic hot spots owing to bush fires developing along the volcano flanks (the algorithm does not include any spatial-length filter to remove those features unlike MODLEN) and/or because of pixel duplication effects occurring during data resampling.
Despite the differences mentioned above, the similar behavior of RSTVOLC and MODLEN in detecting volcanic hot spots, is also evident considering that both algorithms did not identify most documented eruptive activities of OL, because of common issues generally affecting the identification of thermal anomalies from space (about 13% of total days with documented eruptions were detected by satellite). In more detail:
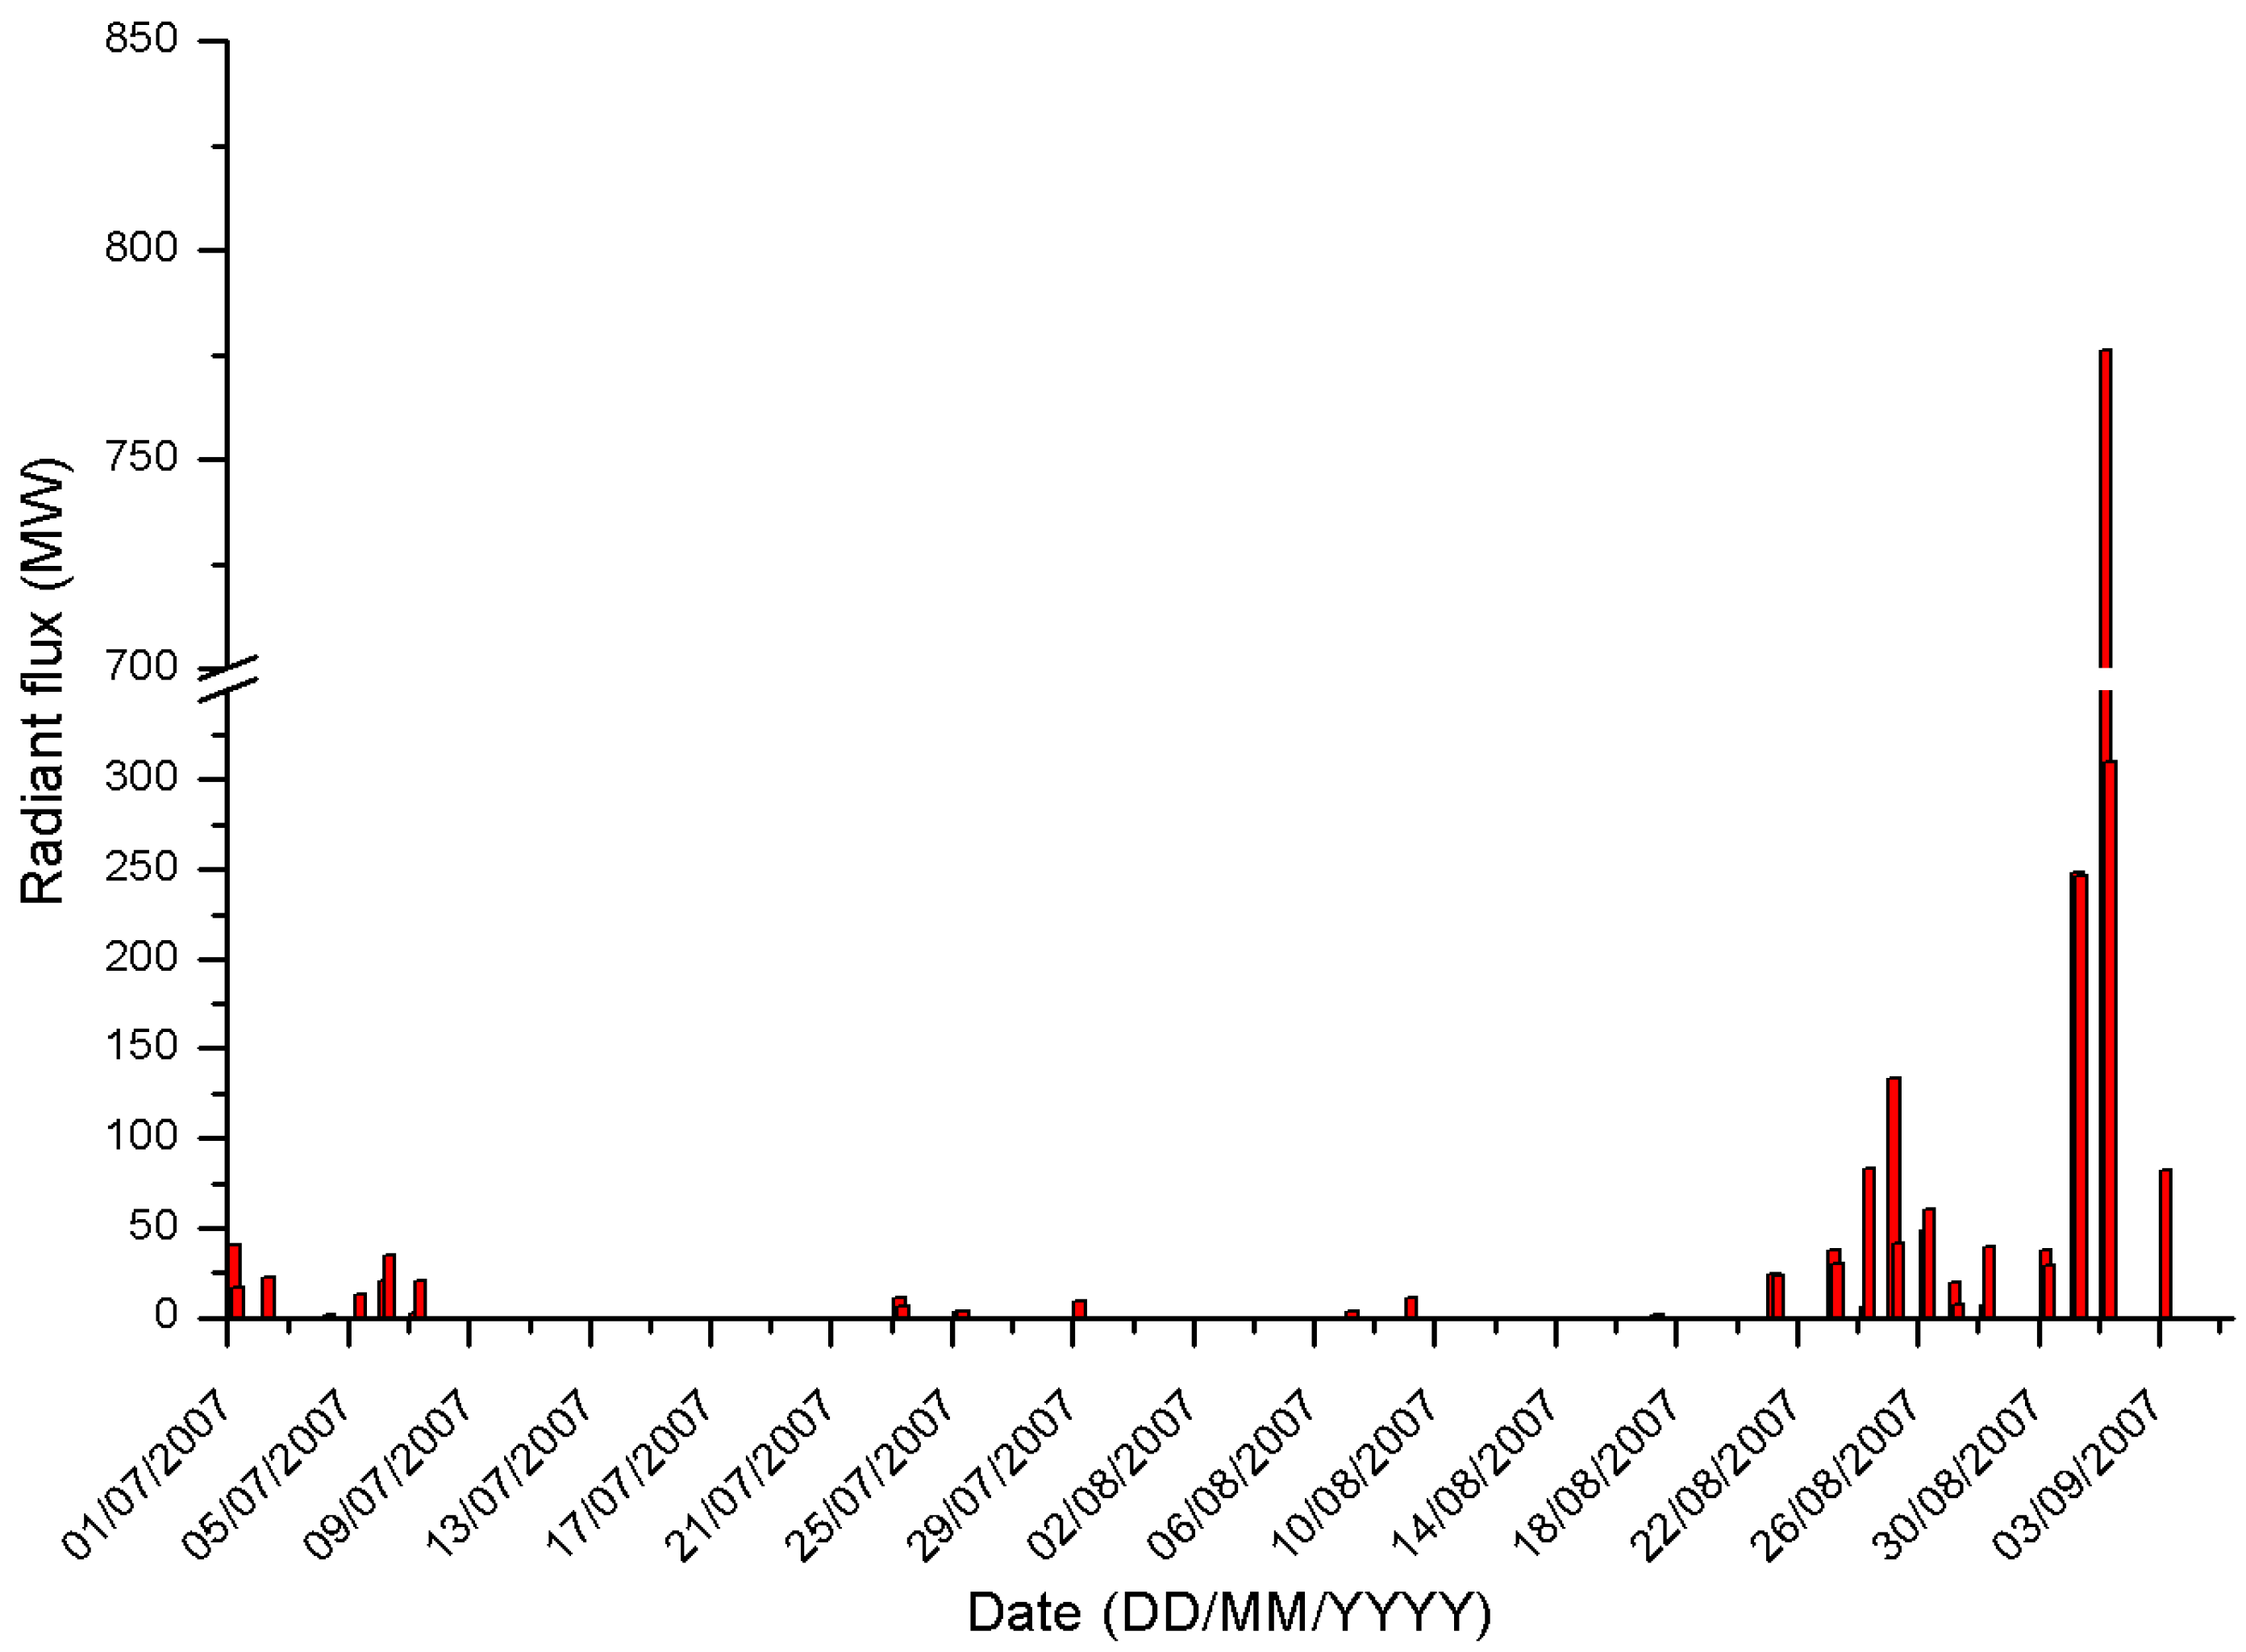
  • Clouds: About 36% of analyzed MODIS scenes were completely overcast over the OL summit area, as indicated by the OCA method. As an example, because of cloud coverage both RSTVOLC and MODLEN undetected the explosive eruption of 4 September 2007, which was presumably accompanied by a strong thermal activity in the crater and by lava flows to the west and northwest [32].
  • Short-lived eruptions (e.g., strombolian paroxysms; lava fountains): These events, common at OL [31], may be undetected from space due to timing of satellite overpasses [57]. In addition, in our case, we analyzed only nighttime scenes further reducing the probability of detecting short-lived events occurring in daylight conditions.
  • Satellite viewing geometry: Weak thermal activities (e.g., minor intra-crater eruptions) generating hot spots of low temperature and/or spatial extent are more difficult to identify from space when satellite data are acquired under unfavorable viewing conditions (i.e., high zenith angles) (e.g., [7]).
In spite of the aforementioned issues and even considering the intrinsic limitations of used methods (e.g., RSTVOLC was less effective than MODLEN in detecting hot spots during March–April because of residual cloudy pixels contaminating the spectral reference fields), this study shows that satellite systems are very important for the surveillance of OL. Indeed, the analysis of MODIS observations have revealed that several OL thermal activities were unreported by volcanological bulletins. Among the undocumented eruptive events, the identification of a phase of thermal unrest occurring during 22–24 September 2002 is particularly relevant. Indeed, the common thermal anomaly detection in that period strength the hypothesis that a short-term preparatory phase preceded the highly fluid pahoehoe lava from the lower northern slope of the monitored volcano or that the lava effusion took place before 26 September 2002, when it was observed on the ground [41].

7. Conclusions

The identification of subtle hot spots is an open challenge in different fields of applied remote sensing, such as volcano activity monitoring or fire detection.
In this paper, we have analyzed the thermal activity of Oldoinyo Lengai, which is an open system highly sensitive to external forcing (e.g., atmospheric pressure, earth tides [46]). Because this volcano is so unusual and so remote, it is particularly interesting to investigate by satellite.
Performance of the RSTVOLC multi-temporal algorithm in detecting natrocarbonatite lava events have been assessed by comparison with MODLEN, which may be considered as the benchmark for this remote volcano, analyzing nine years (i.e., 2000–2008) of nighttime MODIS scenes, corresponding to 4754 orbits (including both Terra and Aqua satellites).
As first, we found that RSTVOLC flagged 172 volcanic thermal anomalies in about 3.6% of analyzed satellite scenes, whereas according to MODLEN 165 thermal anomalies affected the same dataset (a good correlation coefficient R2 = 0.87 between the two methods was also found). Moreover, about 92.2% of MODLEN and 97.7% of RSTVOLC detections were ascribable to real thermal volcanic activities, leading to a very low false positive rate ranging from 2.3% (RSTVOLC) to 7.8% (MODLEN).
These results show that RSTVOLC, which was designed to perform in whatever geographic area, is capable of performing similarly to MODLEN, although it was not tailored to OL conditions. Indeed, it identified subtle hot spots characterized also by values of the radiant flux around 1 MW and provided information about an additional number of undocumented eruptive activities of OL effectively integrating MODLEN detection (e.g., 115 undocumented eruptive days were identified by combining their outputs).
Hence, despite factors as cloud coverage and time duration of eruptive events strongly affecting the satellite monitoring of OL, the operational usage of RSTVOLC could contribute to a better surveillance of this remote volcano even considering its easy implementation on multi-platform satellite system. RSTVOLC runs, in fact, also on geostationary satellite data [58], which are the most suited to detect short-lived eruptive events [59,60]. Furthermore, it is ready to be implemented on VIIRS (the Visible Infrared Imaging Radiometer Suite), providing information in MIR and TIR bands with a higher spatial resolution (i.e., 375 m) than MODIS, enabling a better subtle hot spot identification at Lengai.

Author Contributions

T.L., F.M. and M.K. wrote the majority of the paper; M.L. and T.L. generated the RSTVOLC outputs; M.K. provided the MODLEN products; N.P. and V.T. contributed in writing paper and interpreting results.

Funding

This research received no external funding.

Acknowledgments

We would like to thank the editors and the anonymous reviewers for their valuable suggestions. Their insightful comments helped us make a major improvement to this manuscript.

Conflicts of Interest

The authors declare no conflict of interest.

References

  1. Gawarecki, S.J.; Lyon, R.J.P.; Nordberg, W. Infrared spectral returns and imagery of the Earth from space and their application to geological problems. Sci. Technol. Ser. Am. Astron. Soc. 1965, 4, 13–33. [Google Scholar]
  2. Rothery, D.A.; Francis, P.W.; Wood, C.A. Volcano monitoring using short wavelength infrared data from satellites. J. Geophys. Res. Solid Earth 1998, 93, 7993–8008. [Google Scholar] [CrossRef]
  3. Glaze, L.; Francis, P.W.; Rothery, D.A. Measuring thermal budgets of active volcanoes by satellite remote sensing. Nature 1989, 338, 144–146. [Google Scholar] [CrossRef]
  4. Oppenheimer, C. Lava flow cooling estimated from Landsat Thematic Mapper infrared data: The Lonquimay eruption (Chile, 1989). J. Geophys. Res. Solid Earth 1991, 96, 21865–21878. [Google Scholar] [CrossRef]
  5. Vaughan, R.; Rothery, D. Volcano detection and monitoring using AVHRR data: The Krafla eruption, 1984. Remote Sens. 1995, 16, 1001–1020. [Google Scholar]
  6. Harris, A.J.L.; Swabey, S.E.J.; Higgins, J. Automated thresholding of active lavas using AVHRR data. Int. J. Remote Sens. 1995, 16, 3681–3686. [Google Scholar] [CrossRef]
  7. Dehn, J.; Dean, K.G.; Engle, K.; Izbekov, P. Thermal precursors in satellite images of the 1999 eruption of Shishaldin Volcano. Bull. Volcanol. 2002, 64, 525–534. [Google Scholar] [CrossRef]
  8. Wright, R.; Flynn, L.P. On the retrieval of lava-flow surface temperatures from infrared satellite data. Geology 2003, 31, 893–896. [Google Scholar] [CrossRef]
  9. Ernst, G.G.J.; Kervyn, M.; Teeuw, R.M. Advances in the remote sensing of volcanic activity and hazards, with special consideration for applications in developing countries. Int. J. Remote Sens. 2008, 29, 6687–6723. [Google Scholar] [CrossRef]
  10. Coppola, D.; Piscopo, D.; Staudacher, T.; Cigolini, C. Lava discharge rate and effusive pattern at Piton de la Fournaise from MODIS data. J. Volcanol. Geotherm. Res. 2009, 184, 174–192. [Google Scholar] [CrossRef]
  11. Worden, A.; Dehn, J.; Webley, P. Frequency based satellite monitoring of small scale explosive activity at remote North Pacific volcanoes. J. Volcanol. Geotherm. Res. 2014, 286, 1–14. [Google Scholar] [CrossRef]
  12. Miller, P.I.; Harris, A.J. Near-real-time service provision during effusive crises at Etna and Stromboli: Basis and implementation of satellite-based IR operations. Geol. Soc. Lond. Spec. Publ. 2016, 426, SP426-26. [Google Scholar] [CrossRef]
  13. Dean, K.; Servilla, M.; Roach, A.; Foster, B.; Engle, K. Satellite monitoring of remote volcanoes improves study efforts in Alaska. Eos Trans. Am. Geophys. Union 1998, 79, 413–423. [Google Scholar] [CrossRef]
  14. Webley, P.W.; Wooster, M.J.; Strauch, W.; Saballos, J.A.; Dill, K.; Stephenson, P.; Escobar Wolf, R.; Matias, O. Experiences from near-real-time satellite-based volcano monitoring in Central America: Case studies at Fuego, Guatemala. Int. J. Remote Sens. 2008, 29, 6621–6646. [Google Scholar] [CrossRef]
  15. Pergola, N.; Marchese, F.; Tramutoli, V. Automated detection of thermal features of active volcanoes by means of infrared AVHRR records. Remote Sens. Environ. 2004, 93, 311–327. [Google Scholar] [CrossRef]
  16. Higgins, J.; Harris, A. VAST: A program to locate and analyse volcanic thermal anomalies automatically from remotely sensed data. Comput. Geosci. 1997, 23, 627–645. [Google Scholar] [CrossRef]
  17. Marchese, F.; Pergola, N.; Telesca, L. Investigating the temporal fluctuations in satellite Advanced Very High Resolution Radiometer thermal signals measured in the volcanic area of Etna (Italy). Fluct. Noise Lett. 2006, 6, L305–L316. [Google Scholar] [CrossRef]
  18. Lovallo, M.; Marchese, F.; Pergola, N.; Telesca, L. Fisher information analysis of volcano-related advanced, very-high-resolution radiometer (AVHRR) thermal products time series. Phys. A Stat. Mech. Appl. 2007, 384, 529–534. [Google Scholar] [CrossRef]
  19. Lombardo, V. AVHotRR: Near-real time routine for volcano monitoring using IR satellite data. Geol. Soc. Lond. Spec. Publ. 2015, 426, SP426-18. [Google Scholar] [CrossRef]
  20. Wright, R.; Flynn, L.; Garbeil, H.; Harris, A.; Pilger, E. Automated volcanic eruption detection using MODIS. Remote Sens. Environ. 2002, 82, 135–155. [Google Scholar] [CrossRef] [Green Version]
  21. Wright, R.; Pilger, E. Radiant flux from Earth’s subaerially erupting volcanoes. Int. J. Remote Sens. 2008, 29, 6443–6466. [Google Scholar] [CrossRef]
  22. Wright, R.; Blackett, M.; Hill-Butler, C. Some observations regarding the thermal flux from Earth’s erupting volcanoes for the period of 2000 to 2014. Geophys. Res. Lett. 2015, 42, 282–289. [Google Scholar] [CrossRef]
  23. Ganci, G.; Vicari, A.; Cappello, A.; Del Negro, C. An emergent strategy for volcano hazard assessment: From thermal satellite monitoring to lava flow modeling. Remote Sens. Environ. 2012, 119, 197–207. [Google Scholar] [CrossRef]
  24. Marchese, F.; Lacava, T.; Pergola, N.; Hattori, K.; Miraglia, E.; Tramutoli, V. Inferring phases of thermal unrest at Mt. Asama (Japan) from infrared satellite observations. J. Volcanol. Geotherm. Res. 2012, 237, 10–18. [Google Scholar] [CrossRef]
  25. Coppola, D.; Laiolo, M.; Cigolini, C.; Delle Donne, D.; Ripepe, M. Enhanced volcanic hot-spot detection using MODIS IR data: Results from the MIROVA system. Geol. Soc. Lond. Spec. Publ. 2016, 426, 181–205. [Google Scholar] [CrossRef]
  26. Coppola, D.; Laiolo, M.; Lara, L.E.; Cigolini, C.; Orozco, G. The 2008 “silent” eruption of Nevados de Chillán (Chile) detected from space: Effusive rates and trends from the MIROVA system. J. Volcanol. Geotherm. Res. 2016. [Google Scholar] [CrossRef]
  27. Marchese, F.; Filizzola, C.; Genzano, N.; Mazzeo, G.; Pergola, N.; Tramutoli, V. Assessment and improvement of a Robust Satellite Technique (RST) for thermal monitoring of volcanoes. Remote Sens. Environ. 2011, 115, 1556–1563. [Google Scholar] [CrossRef]
  28. Pergola, N.; Coviello, I.; Filizzola, C.; Lacava, T.; Marchese, F.; Paciello, R.; Tramutoli, V. A review of RSTVOLC, an original algorithm for automatic detection and near-real-time monitoring of volcanic hotspots from space. Geol. Soc. Lond. Spec. Publ. 2015, 426, SP426-1. [Google Scholar] [CrossRef]
  29. Di Genova, D.; Cimarelli, C.; Hess, K.; Dingwell, D.B. An advanced rotational rheometer system for extremely fluid liquids up to 1273 K and applications to alkali carbonate melts. Am. Mineral. 2016, 101, 953–959. [Google Scholar] [CrossRef]
  30. Kervyn, M.; Ernst, G.G.J.; Harris, A.; Mbede, E.; Belton, F.; Jacobs, P. Thermal remote sensing of the low-intensity carbonatite volcanism of Oldoinyo Lengai, Tanzania. Int. J. Remote Sens. 2008, 29, 6467–6499. [Google Scholar] [CrossRef]
  31. Dawson, J.B.; Bowden, P.; Clark, G.C. Activity of the carbonatite volcano Oldoinyo Lengai. Geol. Rundsch. 1968, 57, 865–879. [Google Scholar] [CrossRef]
  32. Dawson, J.B.; Pinkerton, H.; Pyle, D.M.; Nyamweru, C. June 1993 eruption of Oldoinyo Lengai, Tanzania: Exceptionally viscous and large carbonatite lava flows and evidence for coexisting silicate and carbonate magmas. Geology 1994, 22, 799–802. [Google Scholar] [CrossRef]
  33. Kervyn, M.; Ernst, G.G.; Klaudius, J.; Keller, J.; Kervyn, F.; Mattsson, H.B.; Belton, F.; Mbede, E.; Jacobs, P. Voluminous lava flows at Oldoinyo Lengai in 2006: Chronology of events and insights into the shallow magmatic system. Bull. Volcanol. 2008, 70, 1069–1086. [Google Scholar] [CrossRef]
  34. Vaughan, R.G.; Kervyn, M.; Realmuto, V.; Abrams, M.; Hook, S.J. Satellite measurements of recent volcanic activity at Oldoinyo Lengai, Tanzania. J. Volcanol. Geotherm. Res. 2008, 173, 196–206. [Google Scholar] [CrossRef] [Green Version]
  35. Belton, F. Ol Doinyo Lengai, the Mountain of God. Available online: http://oldoinyolengai.pbworks.com/w/page/33191422/Ol%20Doinyo%20Lengai%2C%20The%20Mountain%20of%20God (accessed on 15 July 2018).
  36. Steffke, A.M.; Harris, A.J. A review of algorithms for detecting volcanic hot spots in satellite infrared data. Bull. Volcanol. 2011, 73, 1109–1137. [Google Scholar] [CrossRef]
  37. Kervyn, M.; Ernst, G.G.; Keller, J.; Vaughan, R.G.; Klaudius, J.; Pradal, E.; Belton, F.; Mattsson, H.B.; Mbede, E.; Jacobs, P. Fundamental changes in the activity of the natrocarbonatite volcano Oldoinyo Lengai, Tanzania. II. Eruptive behaviour during the 2007–2008 explosive eruptions. Bull. Volcanol. 2010, 72, 913–931. [Google Scholar] [CrossRef]
  38. De Schutter, A.; Kervyn, M.; Stadlin-Bosshard, S.; Songo, M.; Mattsson, H. Ash fall impact on vegetation: A remote sensing approach of the 2007-08 Oldoinyo Lengai eruption. J. Appl. Volcanol. 2015, 4, 15. [Google Scholar] [CrossRef]
  39. Keller, J.; Klaudius, J.; Kervyn, M.; Ernst, G.G.; Mattsson, H.B. Fundamental changes in the activity of the natrocarbonatite volcano Oldoinyo Lengai, Tanzania. Bull. Volcanol. 2010, 72, 893–912. [Google Scholar] [CrossRef]
  40. Global Volcanism Program. Report on Ol Doinyo Lengai (Tanzania). In Bulletin of the Global Volcanism Network; Wunderman, R., Ed.; Smithsonian Institution: Washington, DC, USA, 1998; Volume 23. [Google Scholar]
  41. Global Volcanism Program. Report on Ol Doinyo Lengai (Tanzania). In Bulletin of the Global Volcanism Network; Wunderman, R., Ed.; Smithsonian Institution: Washington, DC, USA, 2002; Volume 27. [Google Scholar]
  42. Global Volcanism Program. Report on Ol Doinyo Lengai (Tanzania). In Bulletin of the Global Volcanism Network; Venzke, E., Ed.; Smithsonian Institution: Washington, DC, USA, 2003; Volume 28. [Google Scholar]
  43. Global Volcanism Program. Report on Ol Doinyo Lengai (Tanzania). In Bulletin of the Global Volcanism Network; Venzke, E., Ed.; Smithsonian Institution: Washington, DC, USA, 2004; Volume 29. [Google Scholar]
  44. Global Volcanism Program. Report on Ol Doinyo Lengai (Tanzania). In Bulletin of the Global Volcanism Network; Wunderman, R., Ed.; Smithsonian Institution: Washington, DC, USA, 2005; Volume 30. [Google Scholar]
  45. Mitchell, R.H.; Dawson, J.B. The 24th September 2007 ash eruption of the carbonatite volcano Oldoinyo Lengai, Tanzania: Mineralogy of the ash and implications for formation of a new hybrid magma type. Mineral. Mag. 2007, 71, 483–492. [Google Scholar] [CrossRef]
  46. Van Manen, S.; Kervyn, M.; Blake, S.; Ernst, G.G.J. Apparent tidal influence on magmatic activity at Oldoinyo Lengai volcano, Tanzania, as observed in Moderate resolution Imaging Spectroradiometer (MODIS) data. J. Volcanol. Geotherm. Res. 2010, 189, 151–157. [Google Scholar] [CrossRef]
  47. Tramutoli, V. Robust satellite techniques (RST) for natural and environmental hazards monitoring and mitigation: Theory and applications. In Proceedings of the 2007 International Workshop on the Analysis of Multi-Temporal Remote Sensing Images, Leuven, Belgium, 18–20 July 2007. [Google Scholar]
  48. Di Bello, G.; Filizzola, C.; Lacava, T.; Marchese, F.; Pergola, N.; Pietrapertosa, C.; Piscitelli, S.; Scaffidi, I.; Tramutoli, V. Robust satellite technique for volanic and seismic hazard monitoring. Ann. Geophys. 2004, 47, 49–64. [Google Scholar]
  49. Pergola, N.; Marchese, F.; Tramutoli, V.; Filizzola, C.; Ciampa, M. Advanced satellite technique for volcanic activity monitoring and early warning. Ann. Geophys. 2008, 51, 287–301. [Google Scholar]
  50. Marchese, F.; Ciampa, M.; Filizzola, C.; Mazzeo, G.; Lacava, T.; Pergola, N.; Tramutoli, V. On the exportability of Robust Satellite Techniques (RST) for active volcanoes monitoring. Remote Sens. 2010, 2, 1575–1588. [Google Scholar] [CrossRef]
  51. Cuomo, V.; Filizzola, C.; Pergola, N.; Pietrapertosa, C.; Tramutoli, V. A self-sufficient approach for GERB cloudy radiance detection. Atmos. Res. 2004, 72, 39–56. [Google Scholar] [CrossRef]
  52. Lacava, T.; Marchese, F.; Arcomano, G.; Coviello, I.; Falconieri, A.; Faruolo, M.; Pergola, N.; Tramutoli, V. Thermal monitoring of Eyjafjöll volcano eruptions by means of infrared MODIS data. IEEE J. Select. Top. Appl. Earth Obs. Remote Sens. 2014, 7, 3393–3401. [Google Scholar] [CrossRef]
  53. Van Manen, S.M.; Dehn, J. Satellite remote sensing of thermal activity at Bezymianny and Kliuchevskoi from 1993 to 1998. Geology 2009, 37, 983–986. [Google Scholar] [CrossRef]
  54. Global Volcanism Program. Report on Ol Doinyo Lengai (Tanzania). In Bulletin of the Global Volcanism Network; Wunderman, R., Ed.; Smithsonian Institution: Washington, DC, USA, 2007; Volume 32. [Google Scholar]
  55. Giglio, L. MODIS Collection 5 Active Fire Product User’s Guide, Version 2.5; University of Maryland: College Park, MD, USA, 2013; 61p. [Google Scholar]
  56. Kaufman, Y.J.; Justice, C.O.; Flynn, L.P.; Kendall, J.D.; Prins, E.M.; Giglio, L.; Ward, D.E.; Menzel, W.P.; Setzer, A.W. Potential global fire monitoring from EOS-MODIS. J. Geophys. Res. 1998, 103, 32215–32238. [Google Scholar] [CrossRef] [Green Version]
  57. Worden, A.; Dehn, J.; Ripepe, M.; Delle Donne, D. Frequency based detection and monitoring of small scale explosive activity by comparing satellite and ground based infrared observations at Stromboli Volcano, Italy. J. Volcanol. Geotherm. Res. 2014, 283, 159–171. [Google Scholar] [CrossRef] [Green Version]
  58. Marchese, F.; Falconieri, A.; Pergola, N.; Tramutoli, V. A retrospective analysis of the Shinmoedake (Japan) eruption of 26–27 January 2011 by means of Japanese geostationary satellite data. J. Volcanol. Geotherm. Res. 2014, 269, 1–13. [Google Scholar] [CrossRef]
  59. Marchese, F.; Filizzola, C.; Mazzeo, G.; Paciello, R.; Pergola, N.; Tramutoli, V. Robust Satellite Techniques for thermal volcanic activity monitoring, early warning and possible prediction of new eruptive events. In Proceedings of the 2009 IEEE International Geoscience and Remote Sensing Symposium, Cape Town, South Africa, 12–17 July 2009; Volume 2. [Google Scholar]
  60. Ganci, G.; Harris, A.J.L.; Del Negro, C.; Guehenneux, Y.; Cappello, A.; Labazuy, P.; Calvari, S.; Gouhier, M. A year of lava fountaining at Etna: Volumes from SEVIRI. Geophys. Res. Lett. 2012, 39, L06305. [Google Scholar] [CrossRef]
Figure 1. Geographic map of the Oldoinyo Lengai (OL) volcanic area.
Remotesensing 10 01177 g001
Figure 2. Thermal anomalies (in red on bottom right side of each panel) flagged over OL (green box) on MODIS data in LAT/LONG WGS 84 projection. Hot spots as observed in the channel 22 (reported in background) are magnified on the top-right side of each map: (a) 17 August 2003 at 23:05 UTC; (b) 21 August 2004 at 22:55 UTC; (c) 28 August 2002 at 23:20 UTC.
Remotesensing 10 01177 g002
Figure 3. Number of hot spot pixels flagged by MODLEN (grey bars) and RSTVOLC (red bars) on single nighttime MODIS scenes of January 2000–December 2008.
Remotesensing 10 01177 g003
Figure 4. Volcanogenic radiant flux (Qrad) retrieved from thermal anomalies detected by RSTVOLC on infrared nighttime MODIS data of July–August 2007. Each bar in the histogram represents the integrated heat flux from all hotspots detected on one nighttime MODIS scene.
Remotesensing 10 01177 g004
Figure 5. RGB (Red = 2.08–2.35 μm; Green = 0.775–0.805 μm; Blue = 0.53–0.61 μm) product at 30 m spatial resolution from EO1-ALI map of 29 August 2007. On the top-right side of the map: The magnified OL crater with red pixels, indicating the presence of a lava flow.
Remotesensing 10 01177 g005
Figure 6. RGB (Red = 2.08–2.35 μm; Green = 0.775–0.805 μm; Blue = 0.53–0.61 μm) product at 30 m spatial resolution from EO1-ALI map of 10 March 2008. On the top-right side of the map: The magnified OL crater with red pixels, indicating the presence of a high temperature thermal source at OL.
Remotesensing 10 01177 g006
Table 1. Number of analyzed nighttime Aqua and Terra-MODIS (Moderate Resolution Imaging Spectroradiometer) images from 2000–2008.
MonthAqua-MODISTerra-MODIS
January164180
February149168
March159192
April150194
May161214
June160207
July224283
August222271
September220275
October190207
November182202
December190200
Total21712593
Table 2. Number of volcanic thermal anomalies flagged at OL by MODLEN and RSTVOLC (along with common detections) on nighttime MODIS data of 2000–2008.
YearRSTVOLCMODLENCommon Hot Spot Detections
2000332
20019118
2002241411
200313177
200418128
200513157
200610156
2007675536
2008152314
Total17216599
Table 3. ASTER images with hotspot detections for the 2000–2008 period as reported by AVA system (https://ava.jpl.nasa.gov/granule.php?f=20040805200215). For those with an average distance from summit less than 1 km other information are available.
ASTER Acquisition Date (DD/MM/YYYY HH:MM)Average Distance from OL Summit (km)MODIS Acquisition Date (DD/MM/YYYY HH:MM)MODLENRSTVOLC
15/10/2002 08:1028.46
08/03/2003 08:4131.58
19/03/2003 08:3332.86
05/08/2004 08:150.8805/08/2004 20:20YesYes
01/11/2005 08:0763.6
04/09/2007 08:130.6103/09/2007 19:35YesYes
22/09/2007 08:0132.24
17/10/2007 08:360.7917/10/2007 20:00YesYes
23/11/2007 08:430.7123/11/2007 20:20YesNo
25/11/2007 08:370.5225/11/2007 20:05YesYes
02/02/2008 08:140.6702/02/2008 20:25NoNo
29/02/2008 08:480.4829/02/2008 23:00YesYes
05/03/2008 08:030.5905/03/2008 20:25NoNo
Table 4. Percentages of confirmed/unconfirmed thermal anomalies flagged by MODLEN and RSTVOLC algorithms during 2000–2008.
Hot Spots Confirmed by Field Observations or Occurring within ±2 Days Documented EruptionsHot Spots Confirmed by Manual Inspection of MODIS DataFalse Positive Rate
MODLEN44.0%48.2%7.8%
RSTVOLC56.8%40.9%2.3%

